applying data mining techniques to identify malicious actors · applying data mining techniques to...
TRANSCRIPT
Applying Data Mining Techniques
to Identify Malicious Actors Techniques For Turning Data Into Action
Balaji Balakrishnan

Disclaimer:
Opinions expressed in this presentation
are my own.
I am speaking for myself, not for my
employer, anyone or anything else.
Agenda
Introduction
Threat hunting platform
Data mining techniques
Key takeaways
Conclusion
IntroductionMain () {
printf(“I’m Balaji, and I have more
than 16 years of experience working
in Information Technology and
Information Security(security
operations and incident response),
primarily in the financial services
domain);
}
Agenda
Introduction
Threat hunting platform
Data mining techniques
Key takeaways
Conclusion
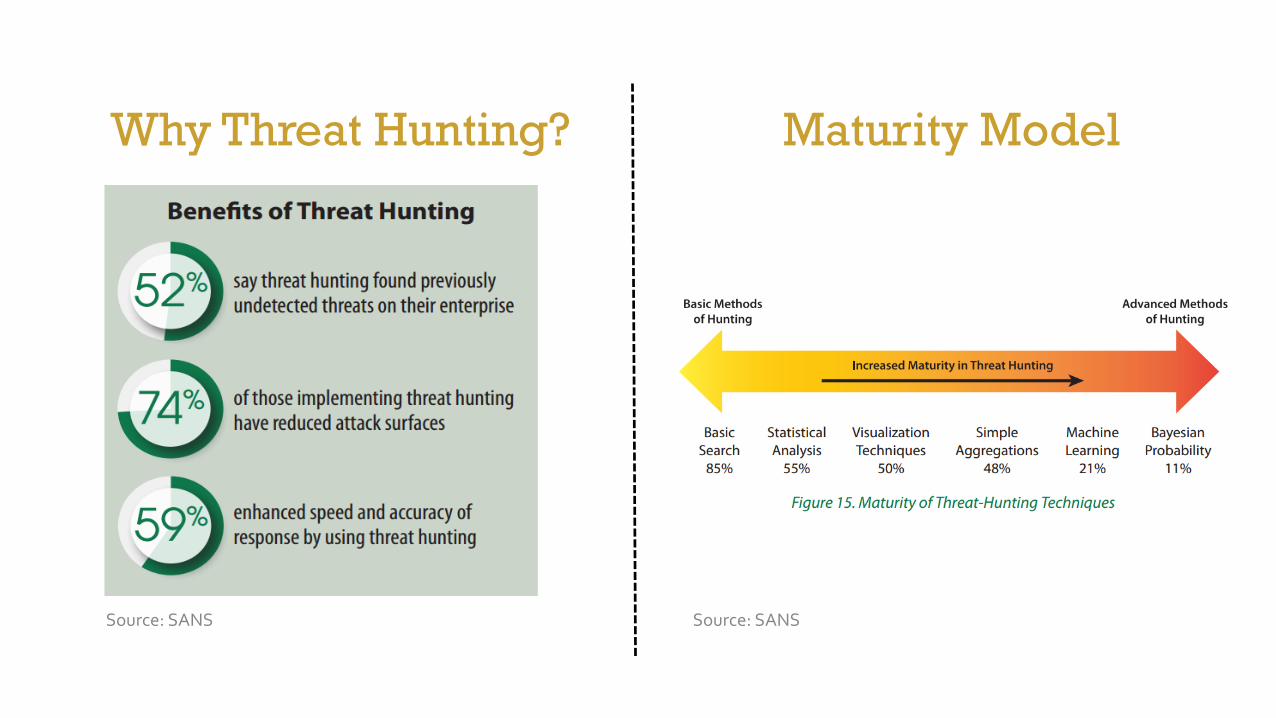
Why Threat Hunting? Maturity Model
Source: SANSSource: SANS
Threat Hunting Platform• Threat Hunting Platform (Big Data Analytics platform)
• SIEM+TIP+OSINT+Other data sources(context)
• Capabilities
• Basic search+Pivoting+Graph+Visualization – Context for SOC Analyst
• Create tools for SOC analysts for exploration, visualization, orchestration for real time contextual analysis
• Useful in IOC search, rule based and adversary TTP based pivoting
• Integration with Python/R scripting - Advanced analytics/ML for Security data analytics team
• Advanced analytics/machine learning algorithms
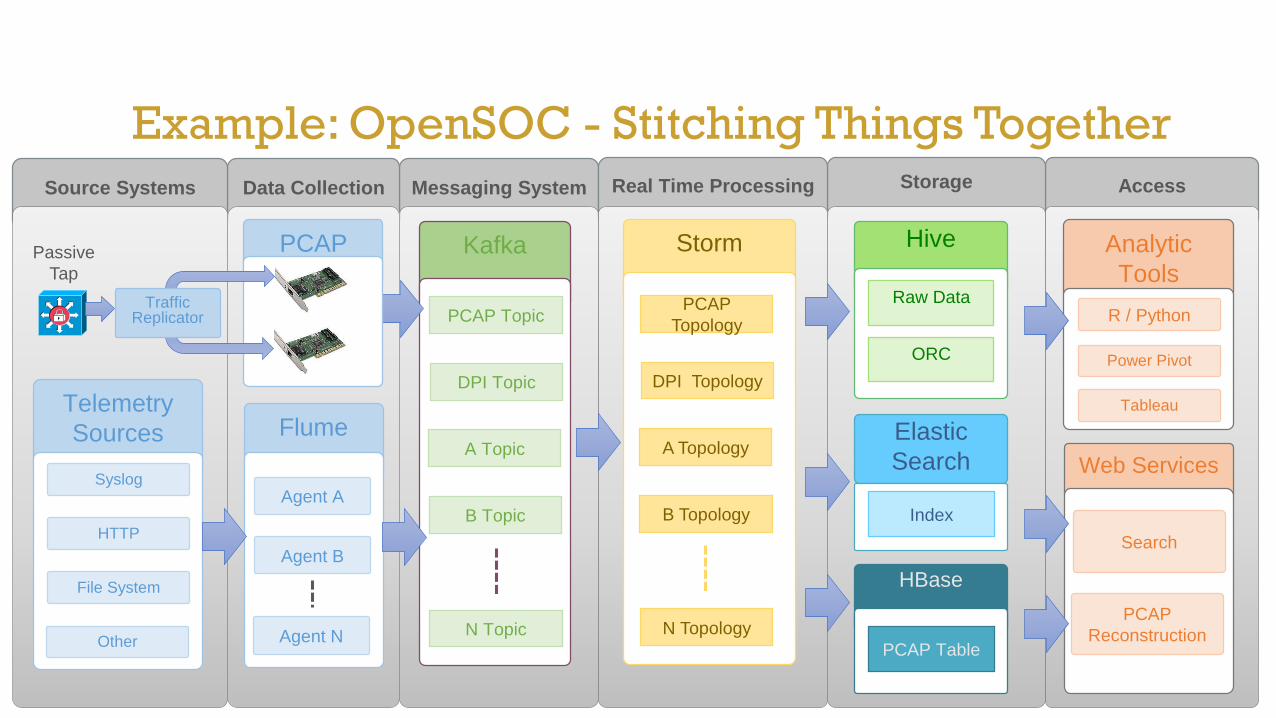
Example: OpenSOC - Stitching Things Together AccessMessaging SystemData CollectionSource Systems StorageReal Time Processing
StormKafka
B Topic
N Topic
Elastic
Search
Index
Web Services
Search
PCAP
Reconstruction
HBase
PCAP Table
Analytic
Tools
R / Python
Power Pivot
Tableau
Hive
Raw Data
ORC
Passive
Tap
PCAP Topic
DPI Topic
A Topic
Telemetry
Sources
Syslog
HTTP
File System
Other
Flume
Agent A
Agent B
Agent N
B Topology
N Topology
A Topology
PCAP
Traffic Replicator
PCAP
Topology
DPI Topology
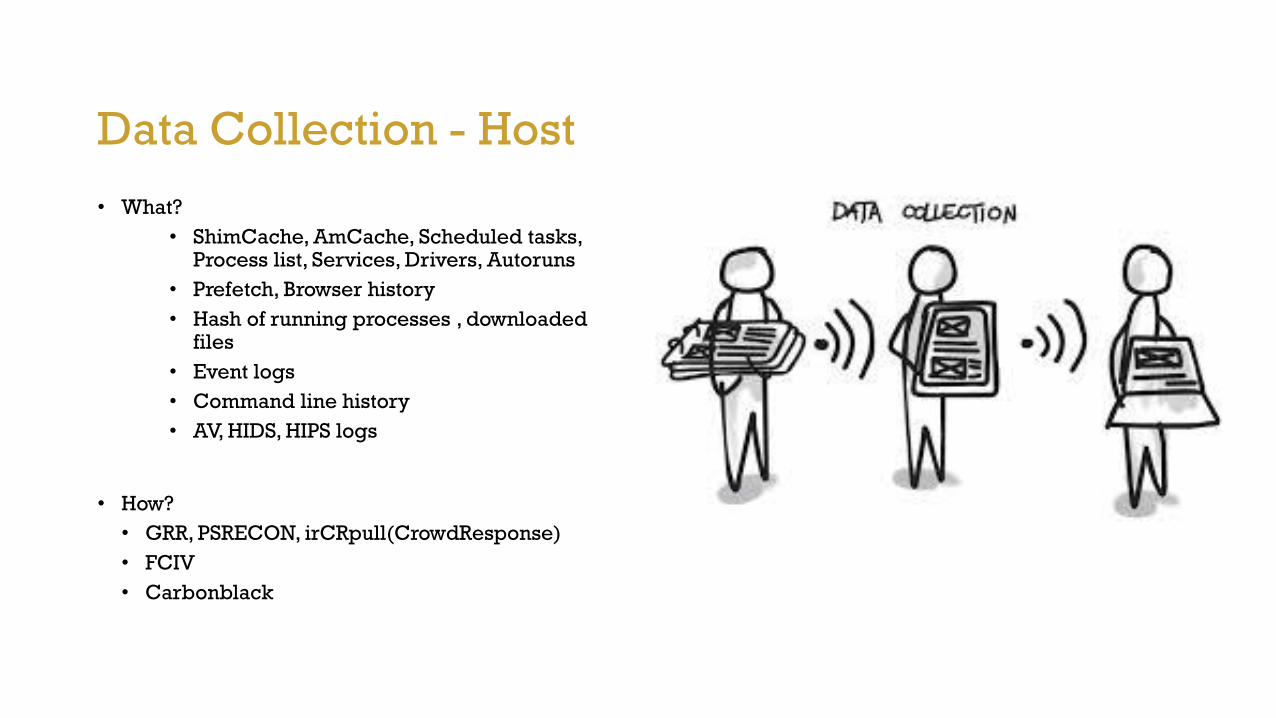
Data Collection - Host
• What?
• ShimCache, AmCache, Scheduled tasks, Process list, Services, Drivers, Autoruns
• Prefetch, Browser history
• Hash of running processes , downloaded files
• Event logs
• Command line history
• AV, HIDS, HIPS logs
• How?
• GRR, PSRECON, irCRpull(CrowdResponse)
• FCIV
• Carbonblack
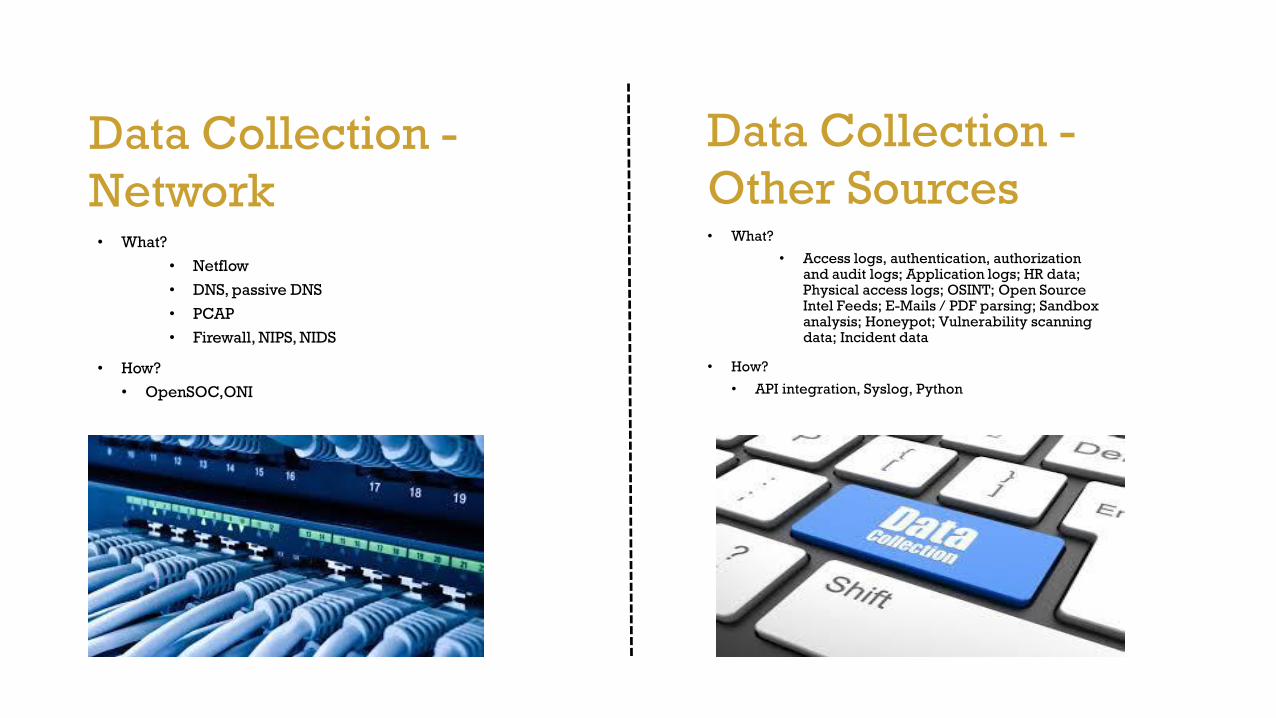
Data Collection -
Network• What?
• Netflow
• DNS, passive DNS
• PCAP
• Firewall, NIPS, NIDS
• How?
• OpenSOC,ONI
Data Collection -
Other Sources• What?
• Access logs, authentication, authorization and audit logs; Application logs; HR data; Physical access logs; OSINT; Open Source Intel Feeds; E-Mails / PDF parsing; Sandbox analysis; Honeypot; Vulnerability scanning data; Incident data
• How?
• API integration, Syslog, Python
Threat Hunting using Data Science (1 of 2)
• Threat Hunting Process
• Generate use cases
• Develop analytical techniques
• Move it to production for SOC analyst and other teams to use
• Continuous feedback and improvement of analytical techniques based on usage
• Triggers
• Cyber Intel Feeds – IOCs
• Threat actors TTPs
• Correlation alerts
• Security events
• Security Distributed Alerting
• Purple team exercises
• Post incident analysis
• Honeynet/Honeytoken
Threat Hunting using Data Science (2 of 2)• What are the enablers?
• Threat Hunting Platform examples
• OpenSOC, ELK, RITA, Hadoop, ONI, Splunk, Sqrrl
• Data Collection(host, network, application, contextual)
• Threat Intelligence Sharing Automation(STIX/TAXII)
• Cloud technologies rapidly evolving
• Big data analytics technologies rapidly evolving
• Key Takeaways
• Build Threat Hunting Platform integrating all data sources
• Create Threat Hunting process integrating all teams (SOC,TVM,admins etc)
Agenda
Introduction
Threat hunting platform
Data mining techniques
Key takeaways
Conclusion
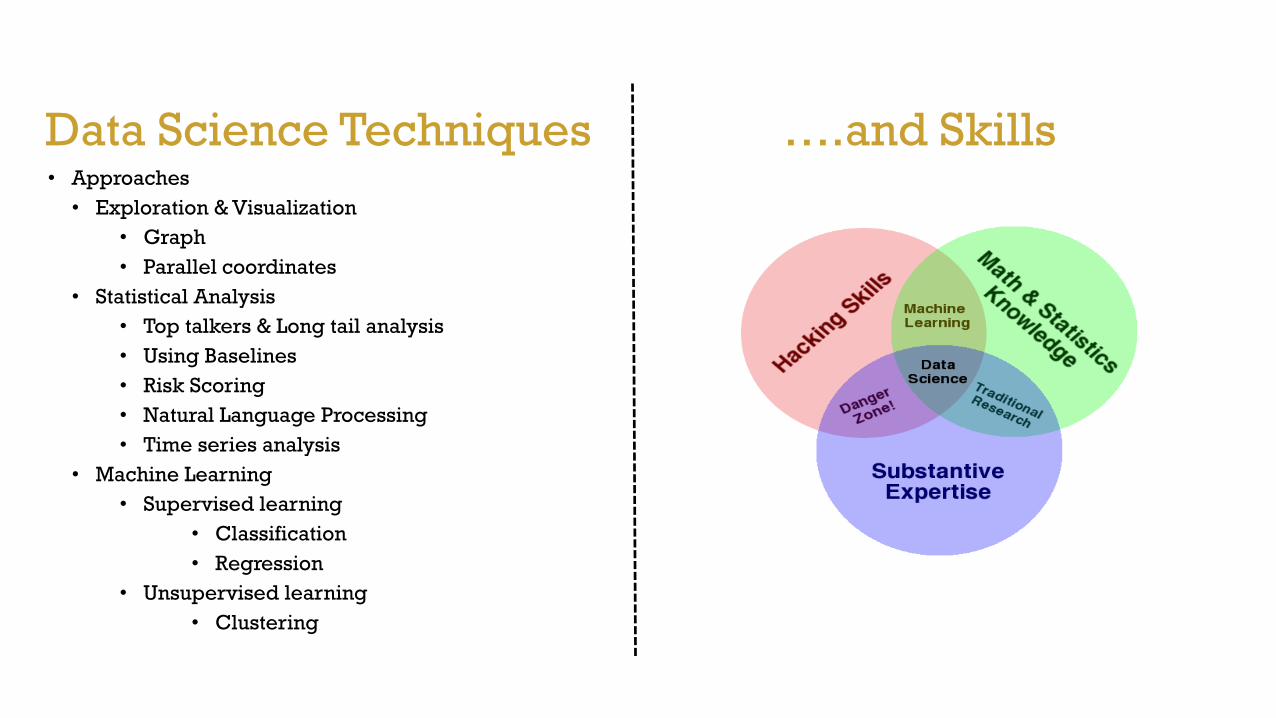
Data Science Techniques ….and Skills• Approaches
• Exploration & Visualization
• Graph
• Parallel coordinates
• Statistical Analysis
• Top talkers & Long tail analysis
• Using Baselines
• Risk Scoring
• Natural Language Processing
• Time series analysis
• Machine Learning
• Supervised learning
• Classification
• Regression
• Unsupervised learning
• Clustering
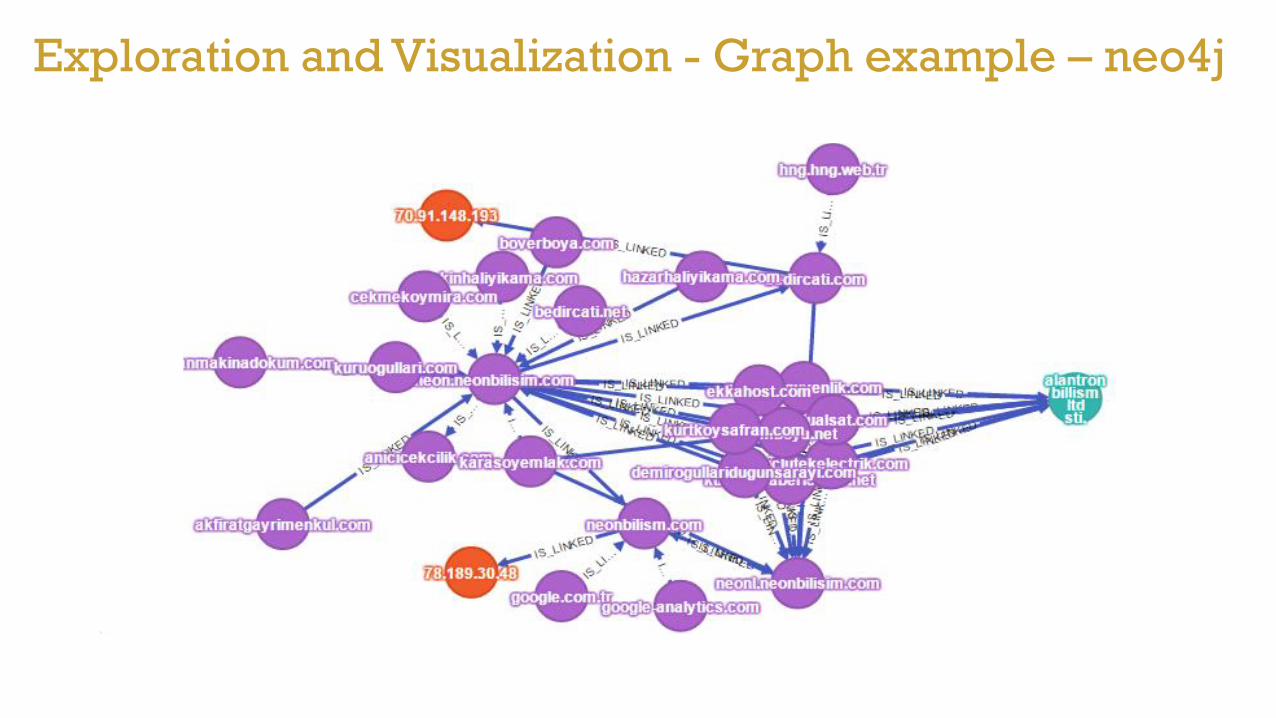
Exploration and Visualization - Graph example – neo4j
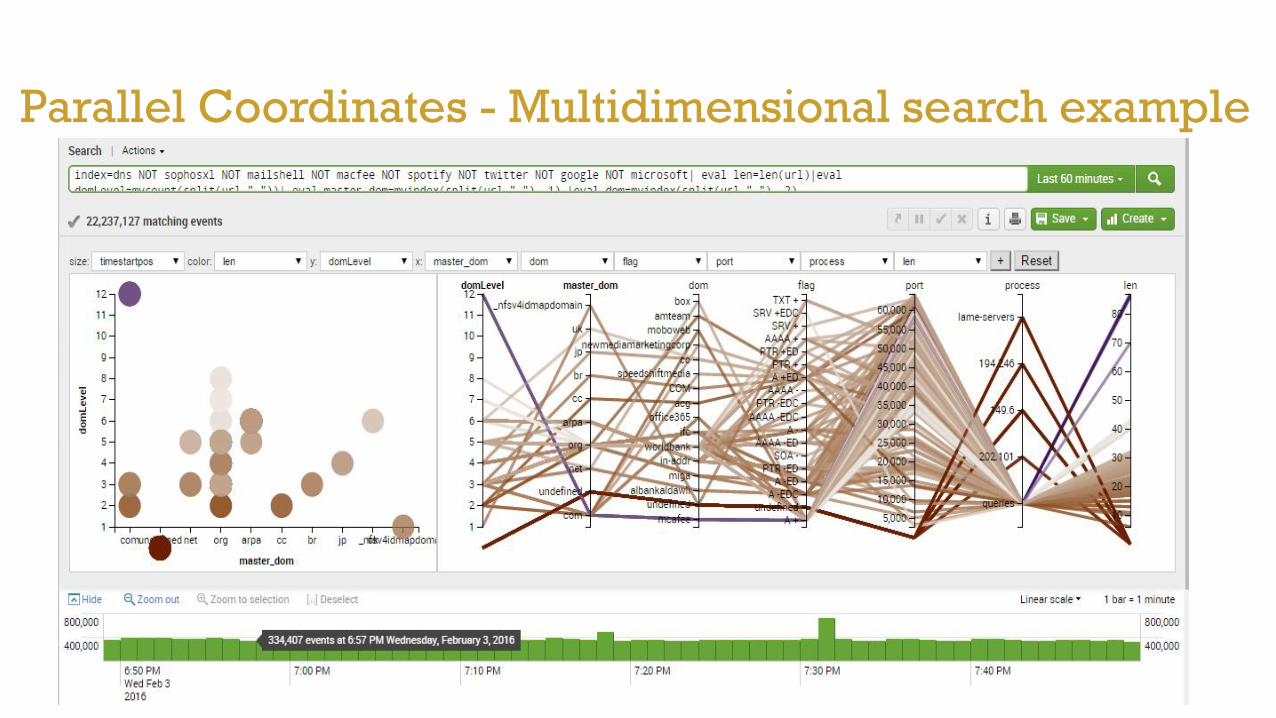
Parallel Coordinates - Multidimensional search example
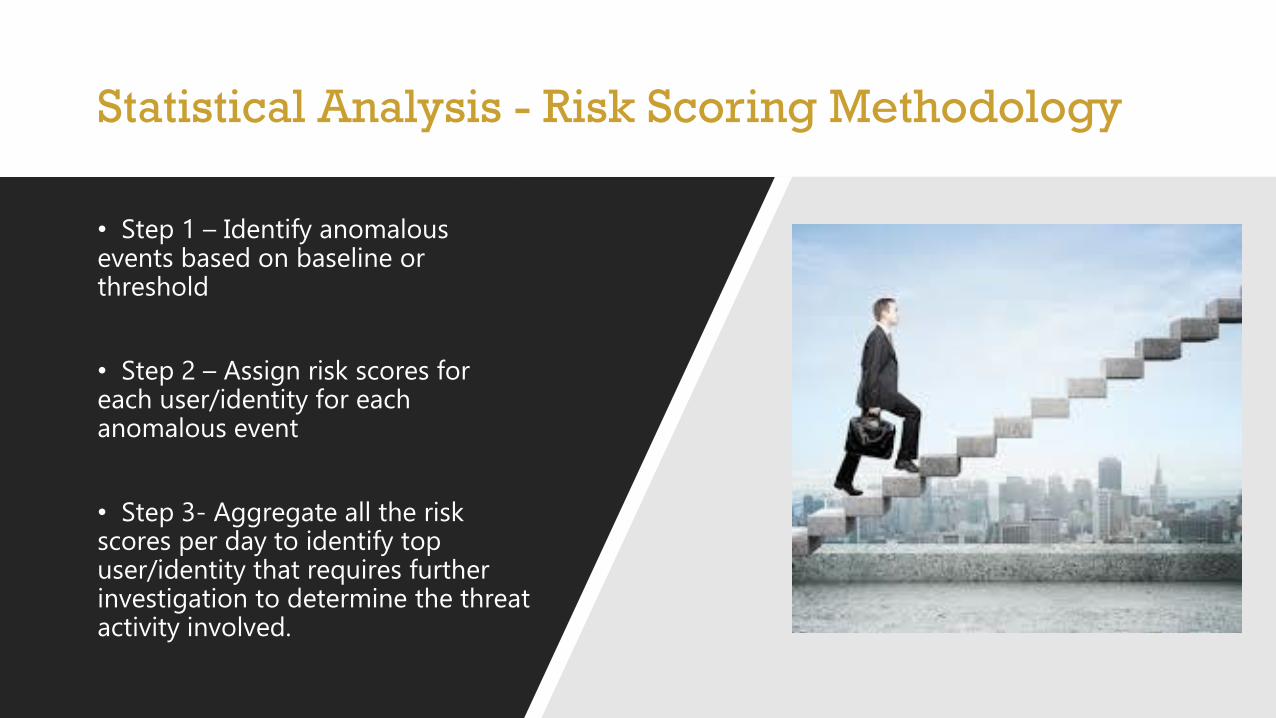
Statistical Analysis - Risk Scoring Methodology
• Step 1 – Identify anomalous events based on baseline or threshold
• Step 2 – Assign risk scores for each user/identity for each anomalous event
• Step 3- Aggregate all the risk scores per day to identify top user/identity that requires further investigation to determine the threat activity involved.
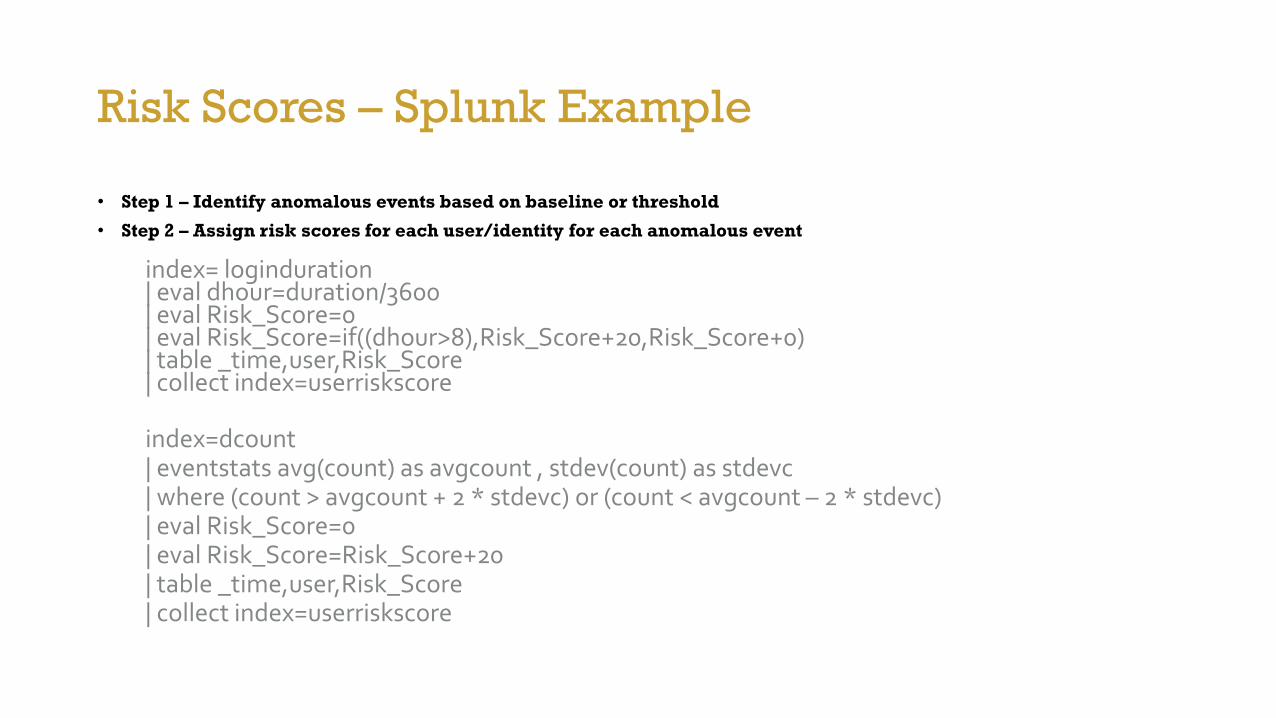
Risk Scores – Splunk Example
• Step 1 – Identify anomalous events based on baseline or threshold
• Step 2 – Assign risk scores for each user/identity for each anomalous event
index= loginduration| eval dhour=duration/3600| eval Risk_Score=0| eval Risk_Score=if((dhour>8),Risk_Score+20,Risk_Score+0)| table _time,user,Risk_Score| collect index=userriskscore
index=dcount| eventstats avg(count) as avgcount , stdev(count) as stdevc| where (count > avgcount + 2 * stdevc) or (count < avgcount – 2 * stdevc)| eval Risk_Score=0| eval Risk_Score=Risk_Score+20| table _time,user,Risk_Score| collect index=userriskscore
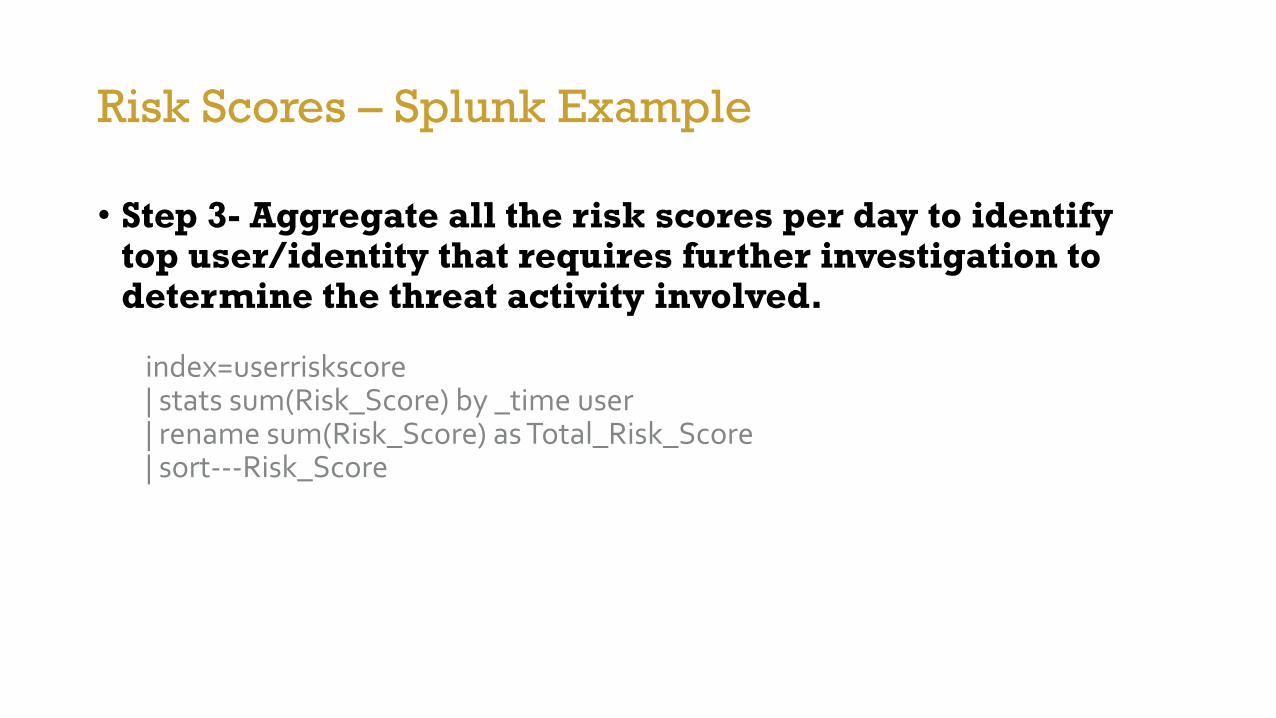
Risk Scores – Splunk Example
• Step 3- Aggregate all the risk scores per day to identify top user/identity that requires further investigation to determine the threat activity involved.
index=userriskscore| stats sum(Risk_Score) by _time user| rename sum(Risk_Score) as Total_Risk_Score| sort---Risk_Score
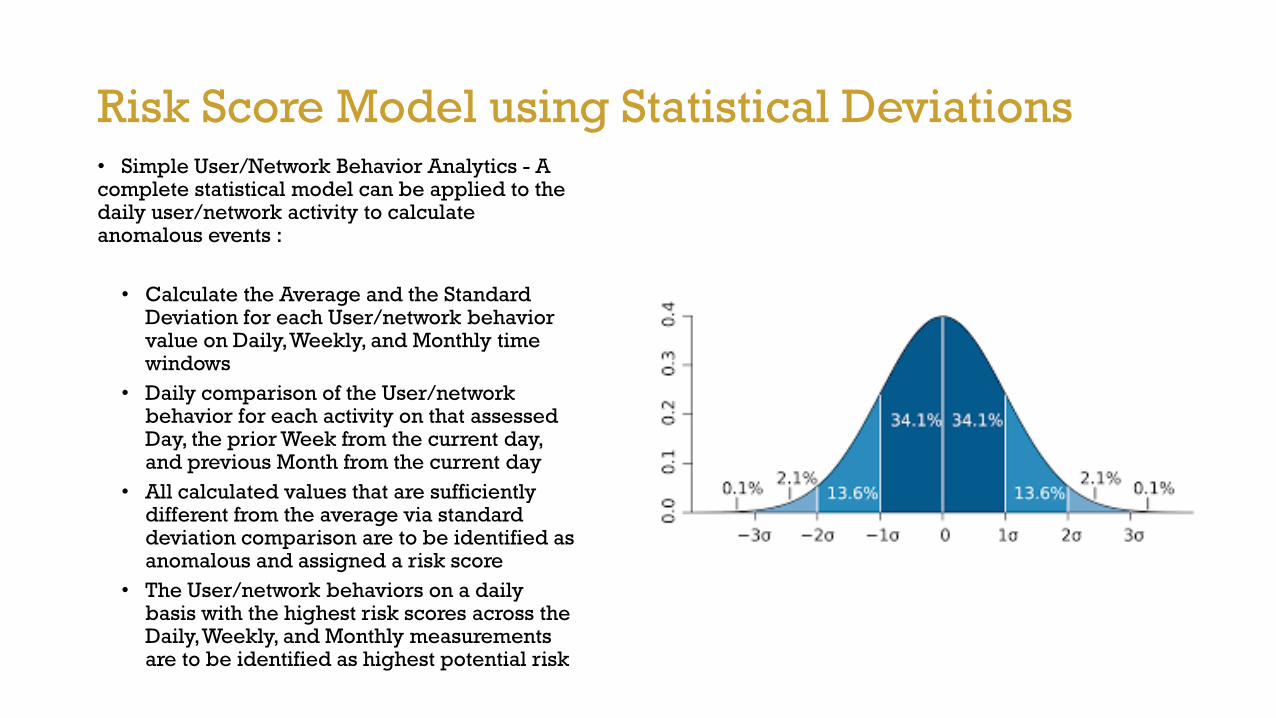
Risk Score Model using Statistical Deviations • Simple User/Network Behavior Analytics - A complete statistical model can be applied to the daily user/network activity to calculate anomalous events :
• Calculate the Average and the Standard Deviation for each User/network behavior value on Daily, Weekly, and Monthly time windows
• Daily comparison of the User/network behavior for each activity on that assessed Day, the prior Week from the current day, and previous Month from the current day
• All calculated values that are sufficiently different from the average via standard deviation comparison are to be identified as anomalous and assigned a risk score
• The User/network behaviors on a daily basis with the highest risk scores across the Daily, Weekly, and Monthly measurements are to be identified as highest potential risk
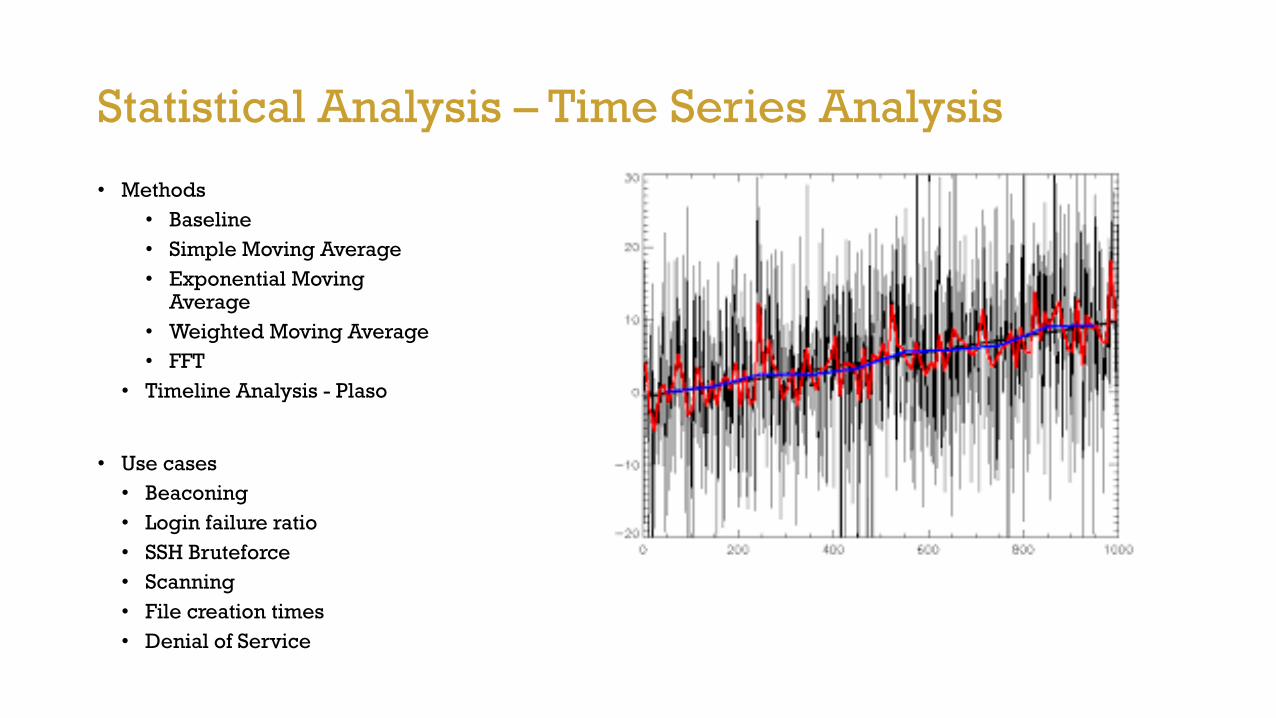
Statistical Analysis – Time Series Analysis
• Methods
• Baseline
• Simple Moving Average
• Exponential Moving Average
• Weighted Moving Average
• FFT
• Timeline Analysis - Plaso
• Use cases
• Beaconing
• Login failure ratio
• SSH Bruteforce
• Scanning
• File creation times
• Denial of Service
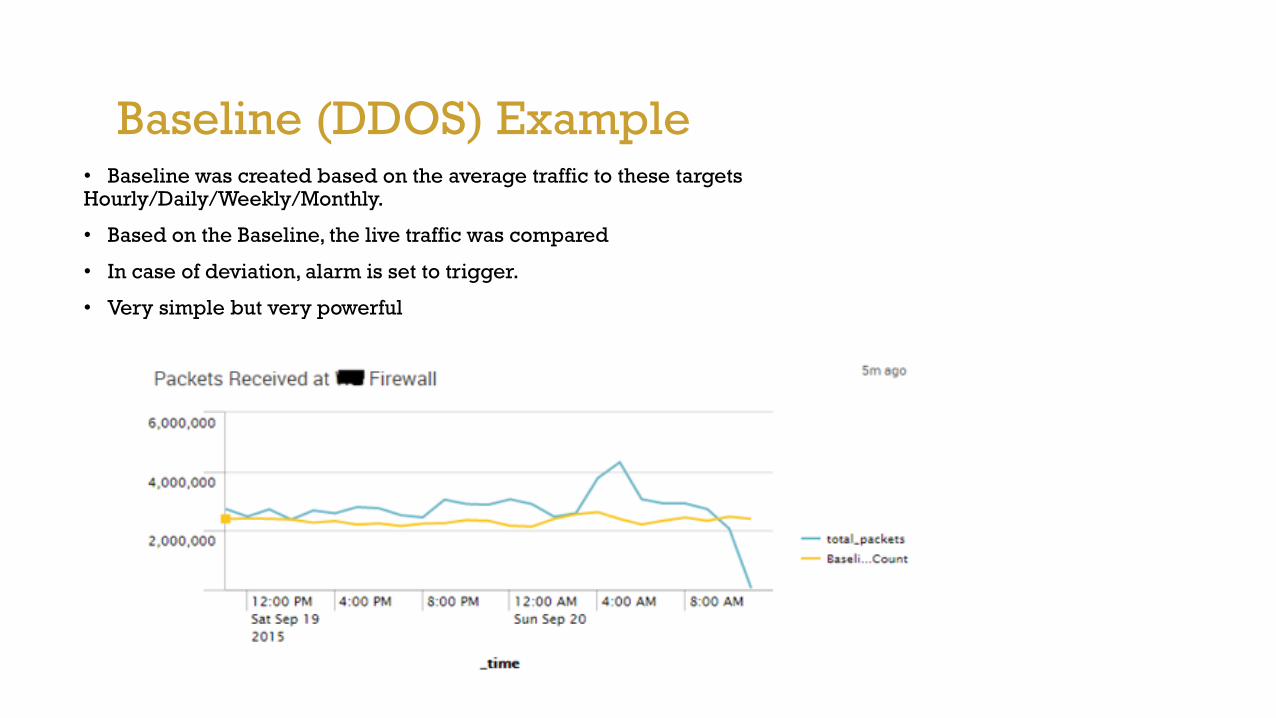
Baseline (DDOS) Example• Baseline was created based on the average traffic to these targets Hourly/Daily/Weekly/Monthly.
• Based on the Baseline, the live traffic was compared
• In case of deviation, alarm is set to trigger.
• Very simple but very powerful
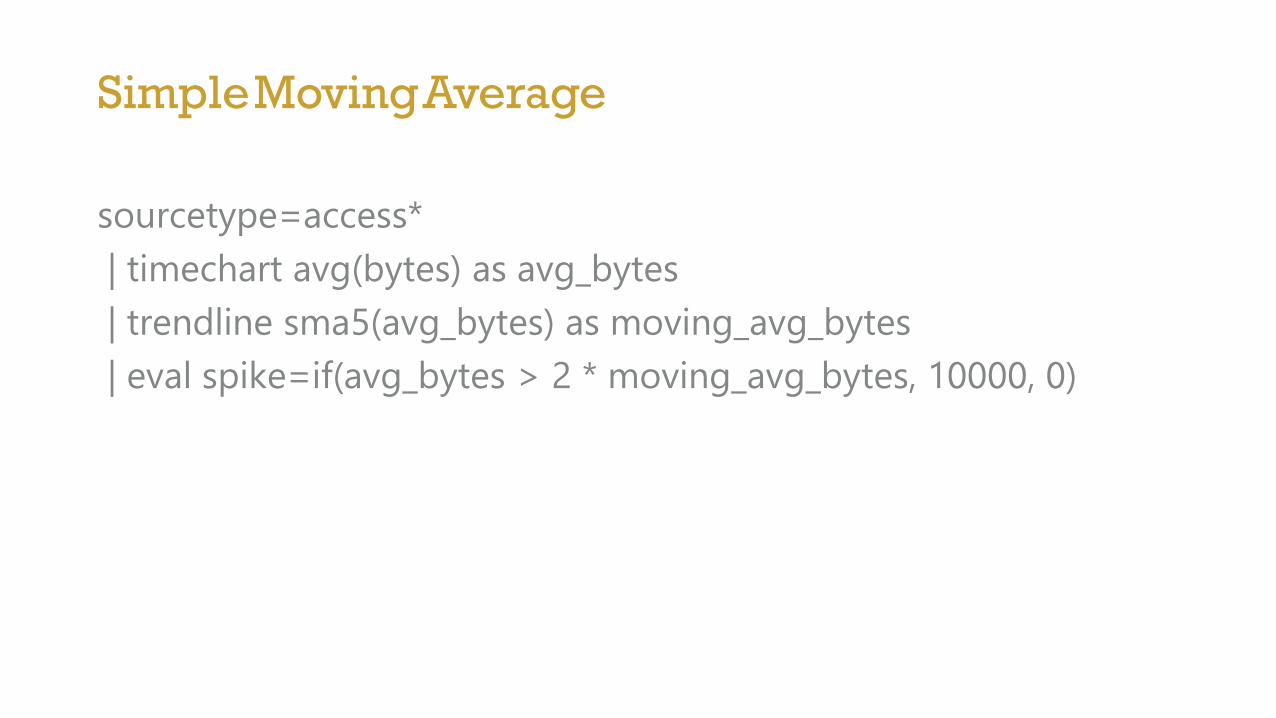
SimpleMovingAverage
sourcetype=access*
| timechart avg(bytes) as avg_bytes
| trendline sma5(avg_bytes) as moving_avg_bytes
| eval spike=if(avg_bytes > 2 * moving_avg_bytes, 10000, 0)
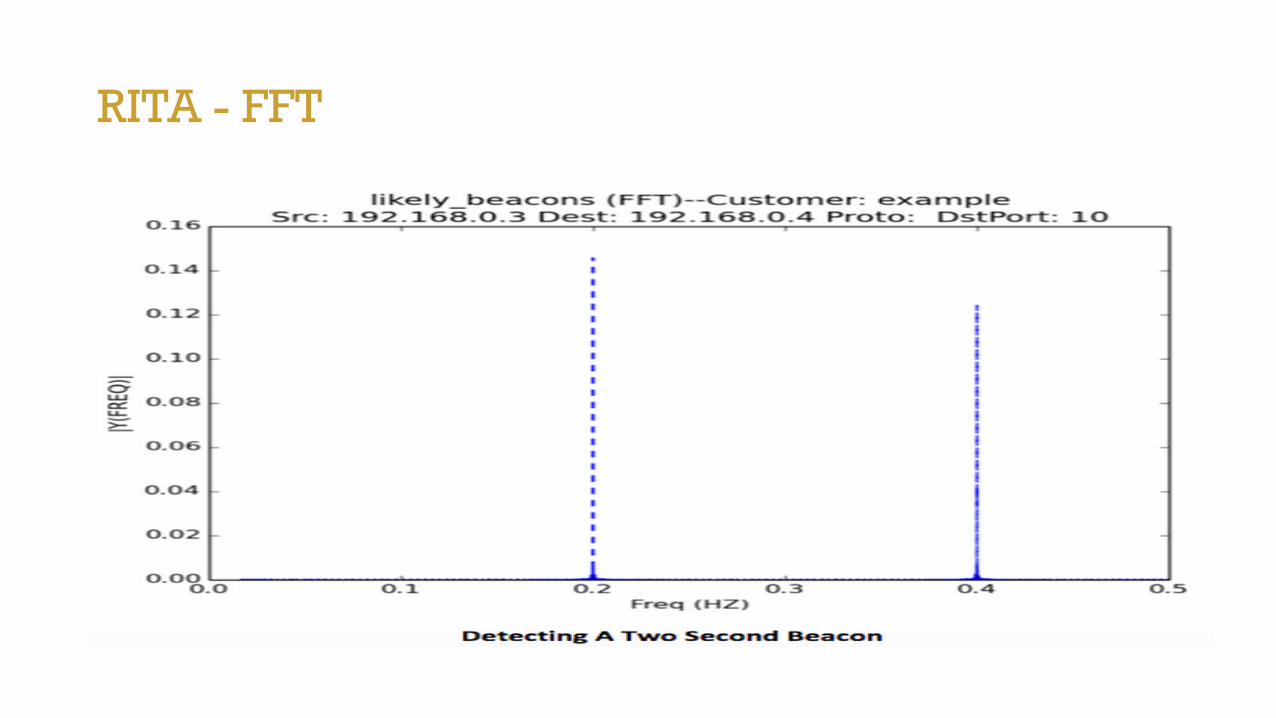
RITA - FFT
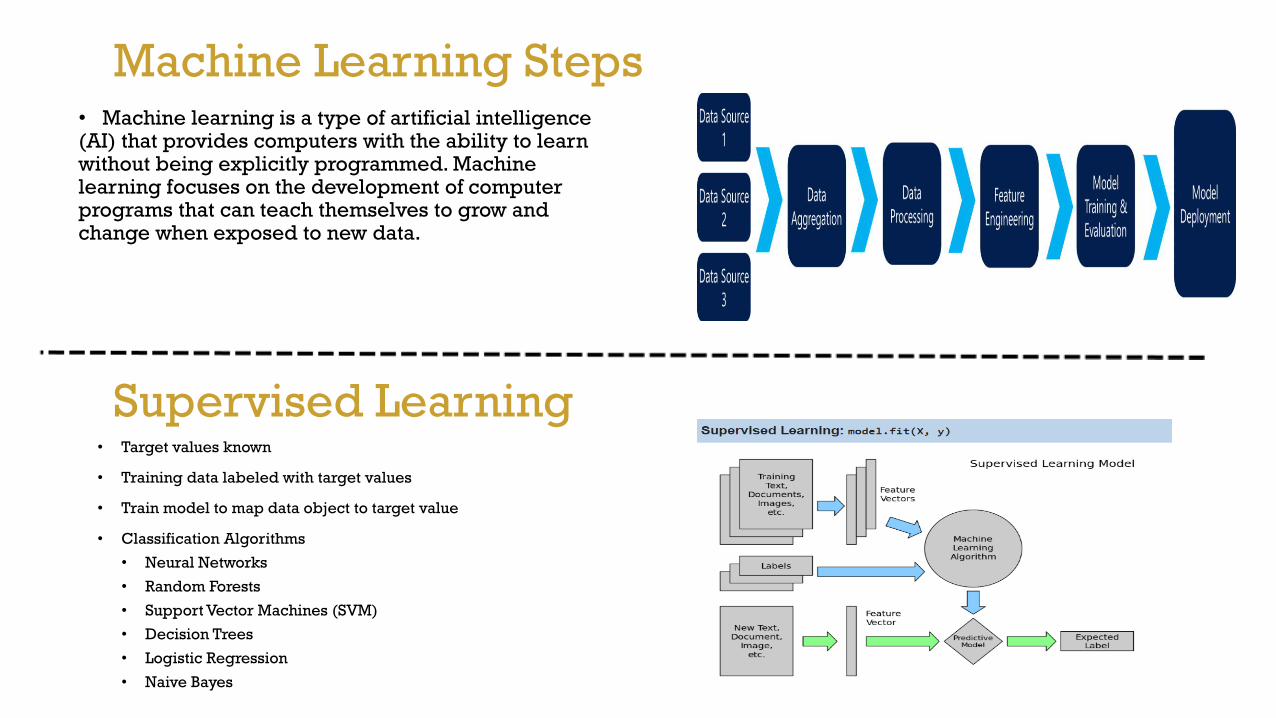
Machine Learning Steps
• Target values known
• Training data labeled with target values
• Train model to map data object to target value
• Classification Algorithms
• Neural Networks
• Random Forests
• Support Vector Machines (SVM)
• Decision Trees
• Logistic Regression
• Naive Bayes
Supervised Learning
• Machine learning is a type of artificial intelligence (AI) that provides computers with the ability to learn without being explicitly programmed. Machine learning focuses on the development of computer programs that can teach themselves to grow and change when exposed to new data.
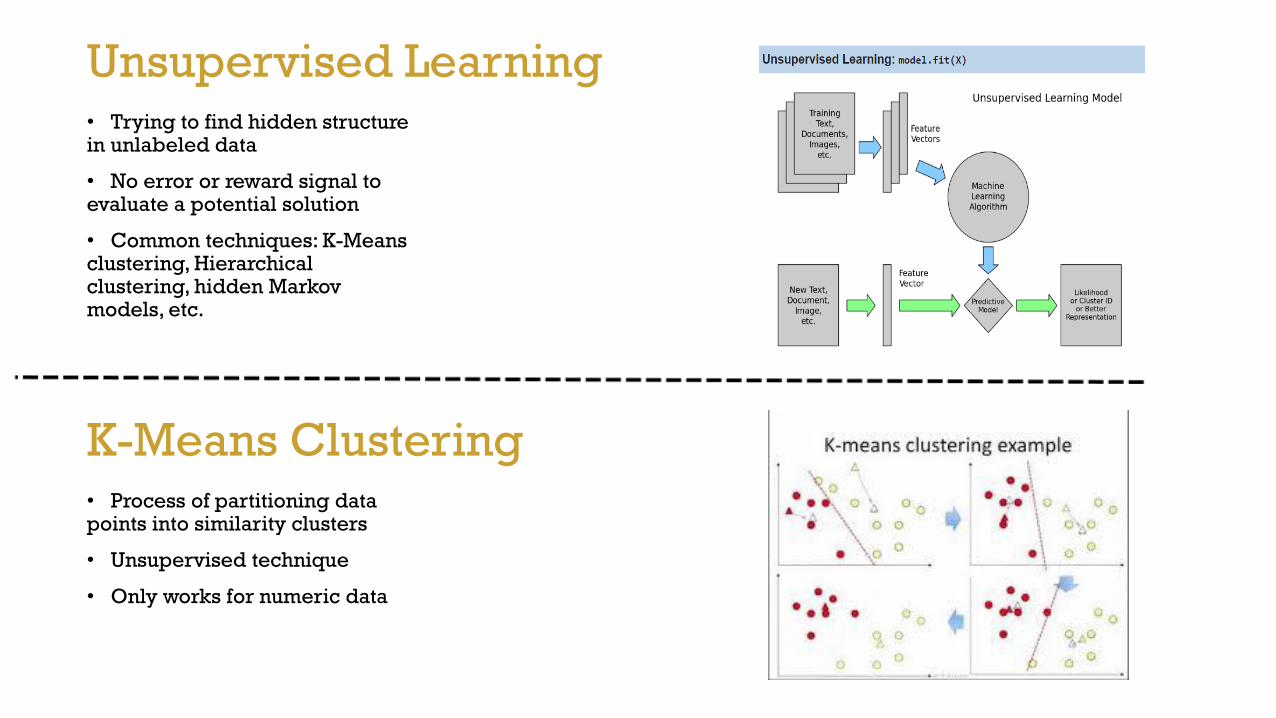
Unsupervised Learning• Trying to find hidden structure in unlabeled data
• No error or reward signal to evaluate a potential solution
• Common techniques: K-Means clustering, Hierarchical clustering, hidden Markov models, etc.
K-Means Clustering• Process of partitioning data points into similarity clusters
• Unsupervised technique
• Only works for numeric data
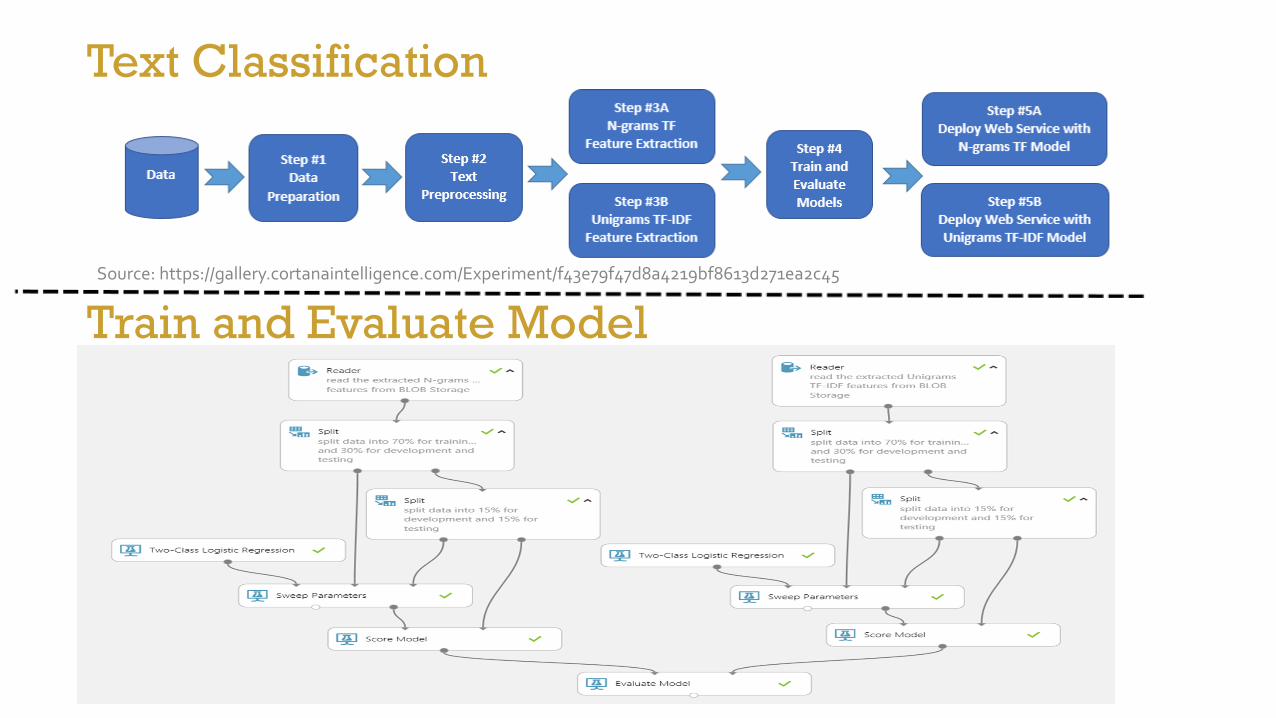
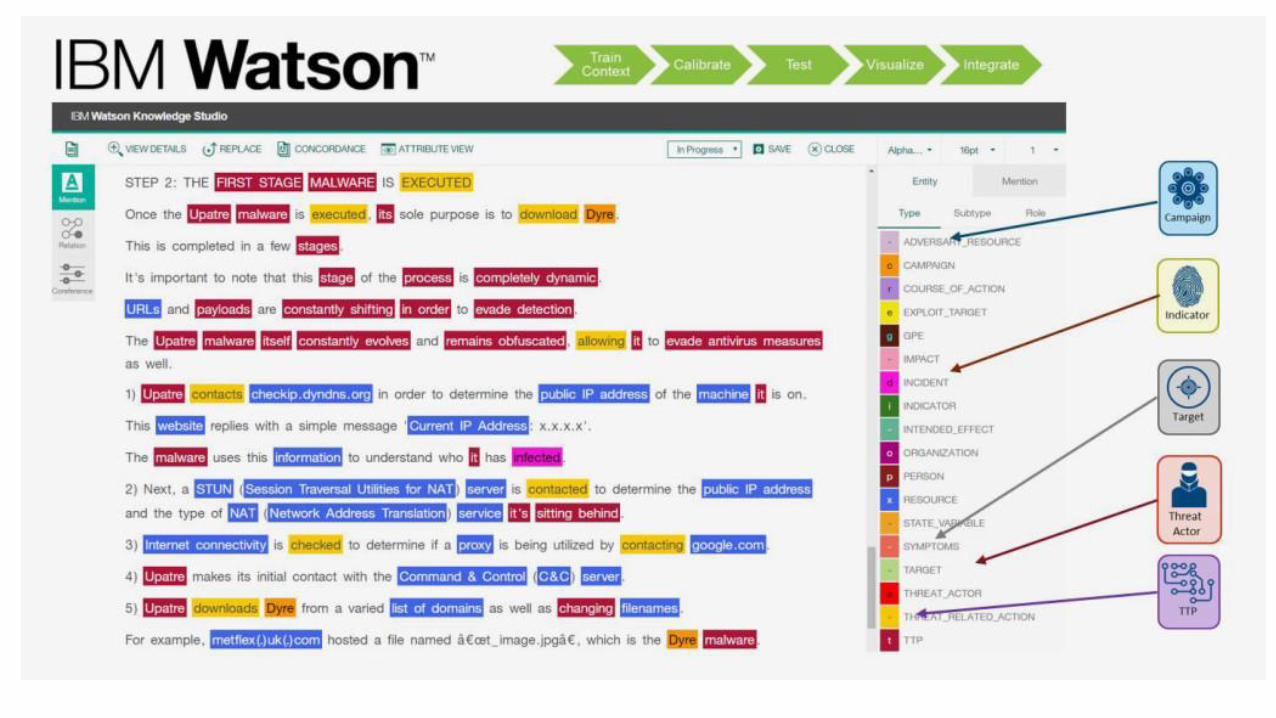
Text Classification
Train and Evaluate Model
Source: https://gallery.cortanaintelligence.com/Experiment/f43e79f47d8a4219bf8613d271ea2c45
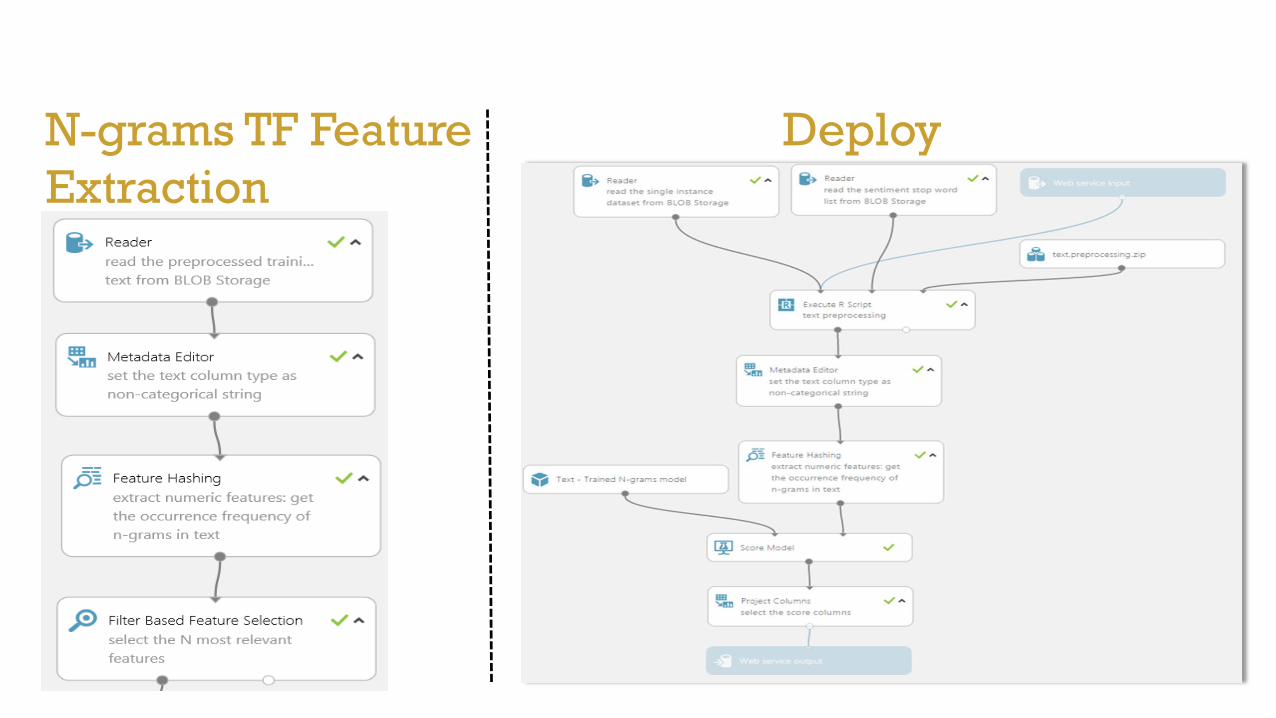
N-grams TF Feature
Extraction
Deploy
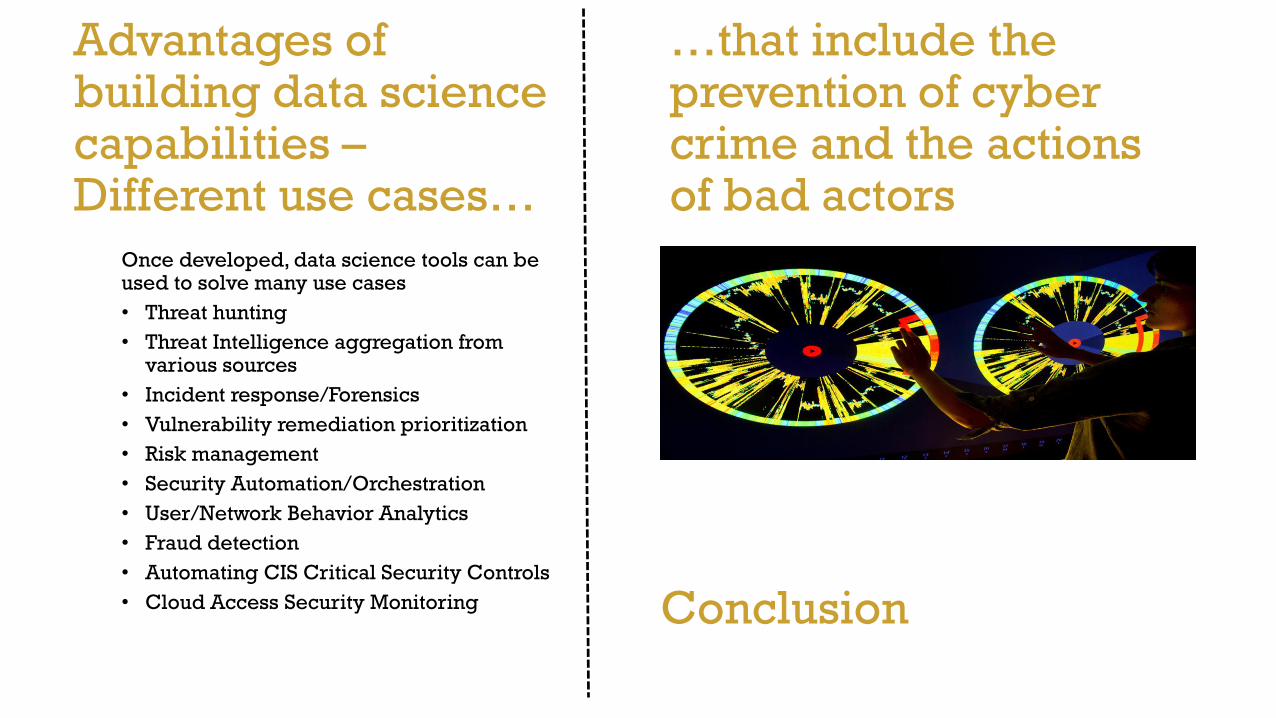
Advantages of building data science capabilities –Different use cases…
Once developed, data science tools can be used to solve many use cases
• Threat hunting
• Threat Intelligence aggregation from various sources
• Incident response/Forensics
• Vulnerability remediation prioritization
• Risk management
• Security Automation/Orchestration
• User/Network Behavior Analytics
• Fraud detection
• Automating CIS Critical Security Controls
• Cloud Access Security Monitoring
…that include the prevention of cyber crime and the actions of bad actors
Conclusion

Key Takeaways & Conclusion
• Need lot of patience, difficult to get immediate results
• Integration of the different components is challenge
• Quick wins
• Post Incident Analytics
• Purple team exercises
• Working sessions with SOC, TVM and operations/admins
• Long way to go, the journey forward seems exciting

Questions