application portfolio: buenaventura port expansion isabel agudelo esd.71 engineering systems...
TRANSCRIPT
Application Portfolio:Buenaventura Port
Expansion
Isabel Agudelo
ESD.71 Engineering Systems
Analysis for Design
December 2008
Agenda
1. Background2. Sources of uncertainty3. Port capacity drivers4. Fixed vs Flexible5. 2-Stage Decision Analysis
Cost structure Demand Strategies Decision Tree Results
6. Lattice Analysis Assumptions Lattice Fixed Lattice Flexible Results
7. Take aways

1. Background
South America

ColombiaColombia
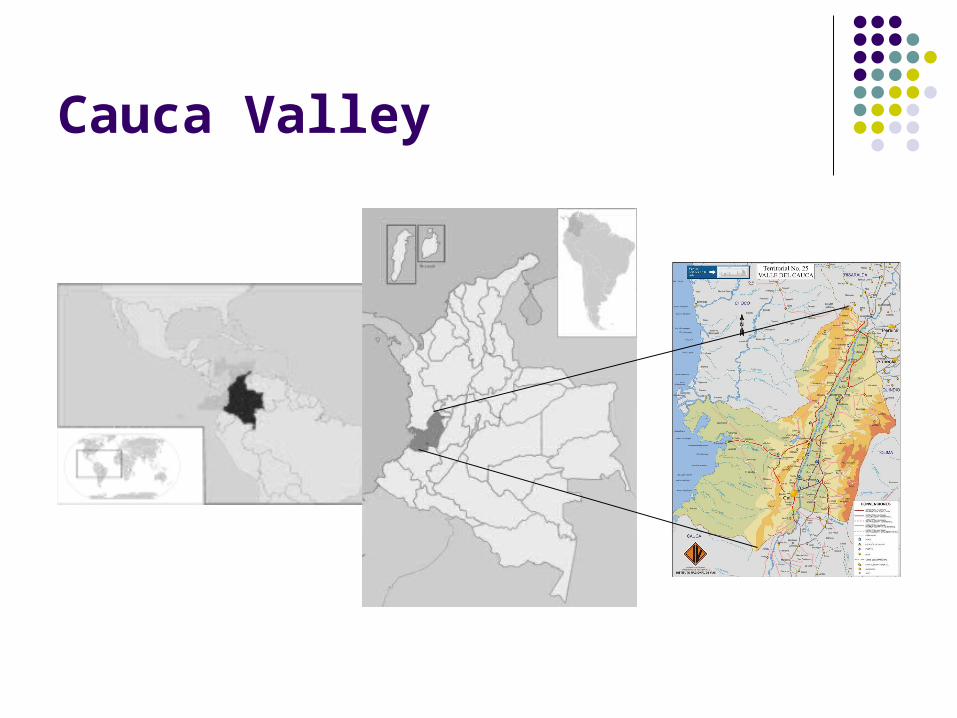
Cauca Valley
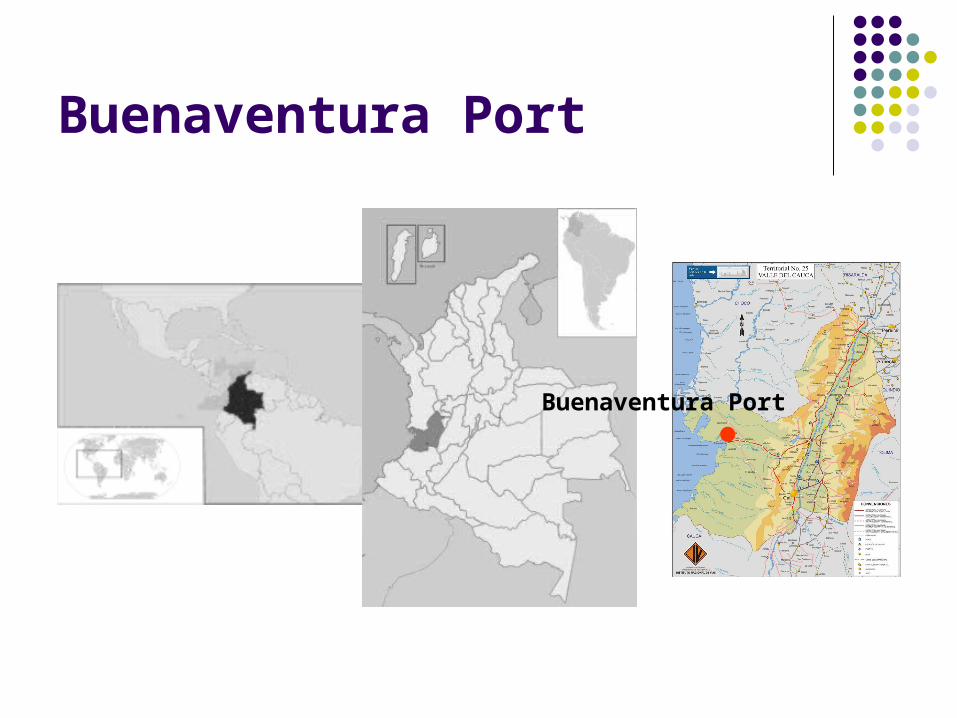
Buenaventura Port
Buenaventura Port
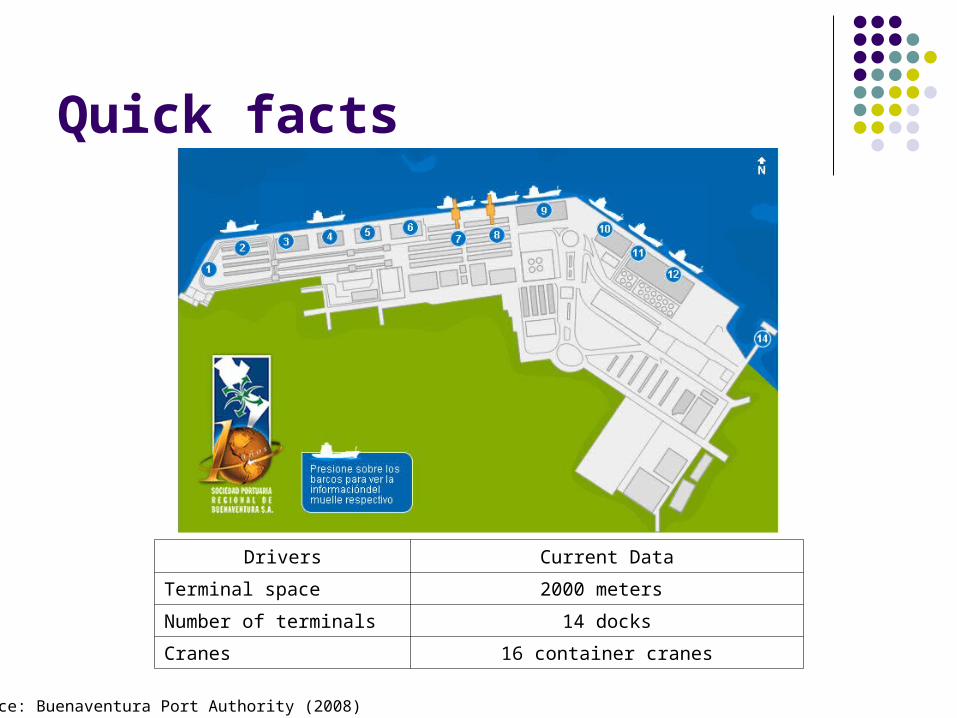
Quick facts
Drivers Current Data
Terminal space 2000 meters
Number of terminals 14 docks
Cranes 16 container cranes
Source: Buenaventura Port Authority (2008)

Motivation
Colombian economy is growing at 6% per year.
2005: Capacity utilization was 73.5%. Today passed 100%.
Avoid bottleneck for import & exports. Colombian government limited resources.

2. Sources of uncertainty
Economic: Growth of the world economy extended to
maritime transport. Concentration in Asia Pacific Politics
FTA (Free Trade Agreement) with US. Technology
Post Panamax ships Demand
Competition with the ports in the region.

3. Port capacity drivers
ContainerCranes
Source: Jackson (2005)

Source: ww.gettyImages.com
Container cranes

Container Types
TEU: Twenty-Foot Equivalent Unit FEU: Twenty-Foot Equivalent Unit

Fixed vs Flexible
Fixed system: Increase the capacity by buying 5 container cranes in year one.
Flexible system: In year one, buying 2 container cranes and buy another 3 containers cranes in year 5.
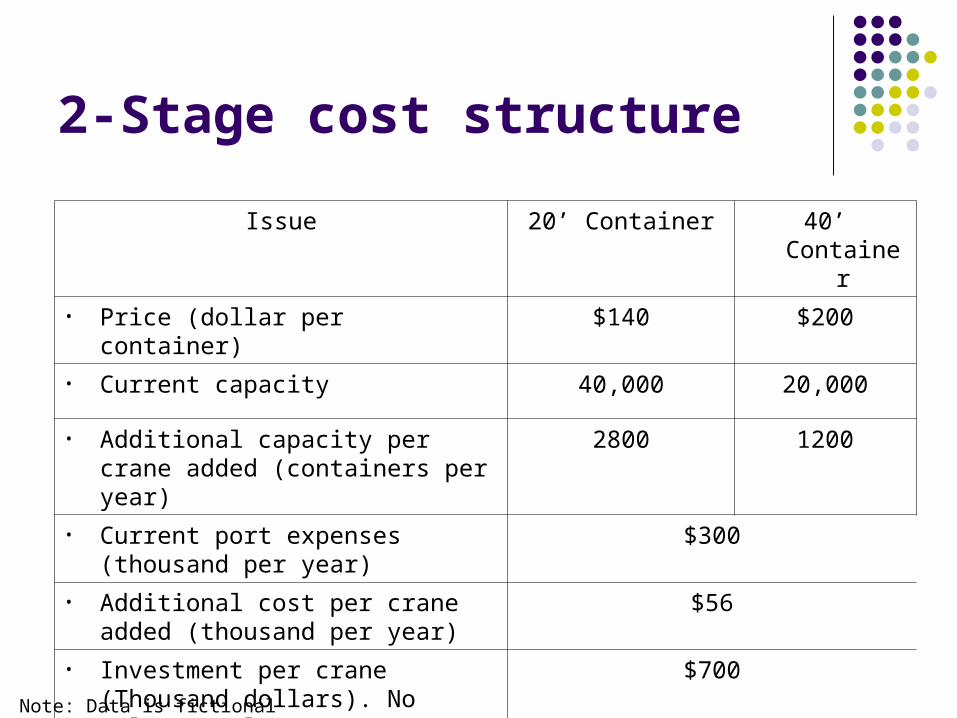
2-Stage cost structure
Issue 20’ Container 40’ Container
• Price (dollar per container) $140 $200
• Current capacity 40,000 20,000
• Additional capacity per crane added (containers per year)
2800 1200
• Current port expenses (thousand per year)
$300
• Additional cost per crane added (thousand per year)
$56
• Investment per crane (Thousand dollars). No salvage value.
$700
• Discount rate 5%
Note: Data is fictional
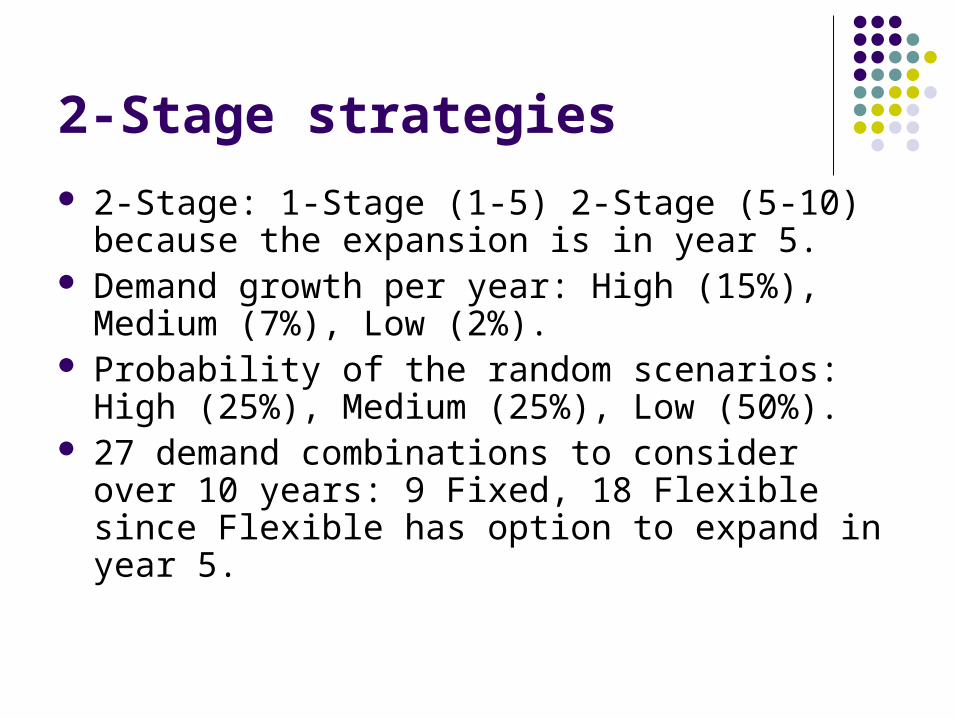
2-Stage strategies
2-Stage: 1-Stage (1-5) 2-Stage (5-10) because the expansion is in year 5.
Demand growth per year: High (15%), Medium (7%), Low (2%).
Probability of the random scenarios: High (25%), Medium (25%), Low (50%).
27 demand combinations to consider over 10 years: 9 Fixed, 18 Flexible since Flexible has option to expand in year 5.

First Decision Expected Value Chance Event Description Probability Expected Value D Second Decision Expected value Chance Event Description Probability Outcome
High Demand 25% 87.523,95$ High Demand 25% 85.293$ D Maintain 5 cranes 85.293$ C Medium Demand 25% 87.523,95$
Low Demand 50% 83.062,57$
High Demand 25% 85.230,15$ 82.513$ C Medium Demand 25% 82.999$ D Maintain 5 cranes 82.999$ C Medium Demand 25% 85.230,15$
Fixed Low Demand 50% 80.768,78$ Buy 5 cranes in year 1
High Demand 25% 82.783,55$ Low Demand 50% 80.879$ D Maintain 5 cranes 80.879$ C Medium Demand 25% 84.089,13$
83.048$ Decision Low Demand 50% 78.322,18$
High Demand 25% 84.237,35$ Not expand 83.964$ C Medium Demand 25% 84.237,35$
Low Demand 50% 83.689,68$ High Demand 25% 85.120$ D
High Demand 25% 85.384,28$ 3 more cranes 85.120$ C Medium Demand 25% 85.384,28$
Low Demand 50% 84.854,80$
High Demand 25% 83.712,54$ Not expand 83.439$ C Medium Demand 25% 83.712,54$
Low Demand 50% 83.164,87$ Flexible 1 83.048$ C Medium Demand 25% 83.439$ DBuy 2 cranes in year 1 High Demand 25% 84.329,99$
3 more cranes 83.429$ C Medium Demand 25% 84.329,99$ Low Demand 50% 82.528,15$
High Demand 25% 82.091,51$ Not expand 81.818$ C Medium Demand 25% 82.091,51$
Low Demand 50% 81.543,84$ Low Demand 50% 81.818$ D
High Demand 25% 82.708,96$ 3 more cranes 81.808$ C Medium Demand 25% 82.708,96$
Low Demand 50% 80.907,11$
STAGE 1 = 1- 5 years STAGE 2: 5 - 10 years
2-Stage Decision tree

2-Stage results Fixed: 82.5 M Flexible: 83 M The best strategy is the
acquisition of two cranes in year one and if demand increases to a high level expand to 3 cranes.
Value of flexibility has a value of 536,000 dollars. If the port gets a discount of this magnitude is good to buy five cranes in year 5.
CAPEX
t=0 Mean ENPV
Min ENPV
Max ENPV
Fixed Buy 5 cranes from year 0
3.5 million 82.513 80.879 85.293
Flexible Buy 2 cranes in year 1 and 3 additional cranes in year 5
3.04 million
83.048 81.818 85.120
Second Node VARG
-
0,10
0,20
0,30
0,40
0,50
0,60
0,70
0,80
0,90
1,00
80.000 81.000 82.000 83.000 84.000 85.000 86.000
NPV (thousand)C
um
mu
lati
ve
Pro
ba
bil
ity
Fixed
Flexible

Lattice Analysis Assumptions
Assumes demand increases exponentially year to year.
Simplifications: Only 20’ containers
demand Annual cost adjusted
34200
52.0)/(5,05,0
59.0/1
69.1
1
0234.0
5266.0
starttoValue
tvp
ud
u
yeart
v
t
year
year

Lattice Analysis: Fixed: 5 cranes in year 1
0 1 2 3 4 5 64.601.967 3.874.000 7.094.000 7.094.000 7.094.000 7.094.000 7.094.000
-858.088 4.321.967 7.094.000 7.094.000 7.094.000 7.094.0001.204.247 2.361.912 4.321.967 7.094.000 7.094.000
520.497 1.204.247 2.361.912 4.321.967116.654 520.497 1.204.247
-121.868 116.654-262.746
CASH FLOW FIXED LATTICE - 5 cranes in year 1
0 1 2 3 4 5 64601967 2022900 1934286 1010033 527412 275401 143807
-410017 2156734 2772760 1930482 1260058 789562274952 844774 1614369 2306089 1806267
56784 274411 702594 13426626081 70841 256754
-3036 9104-3127
CASH FLOW * PROBABILITY LATTICE
0 1 2 3 4 5 6 7 8 9 10E [Cash Flow] 4601967 1612883 4365971 4684350 4352755 4611946 4345029 4570941 4343107 4546524 4345332PV( E[Cash Flow]) 4601967 1536079 3960064 4046518 3581022 3613581 3242328 3248483 2939586 2930730 2667657ENPV over 10 years 36368014
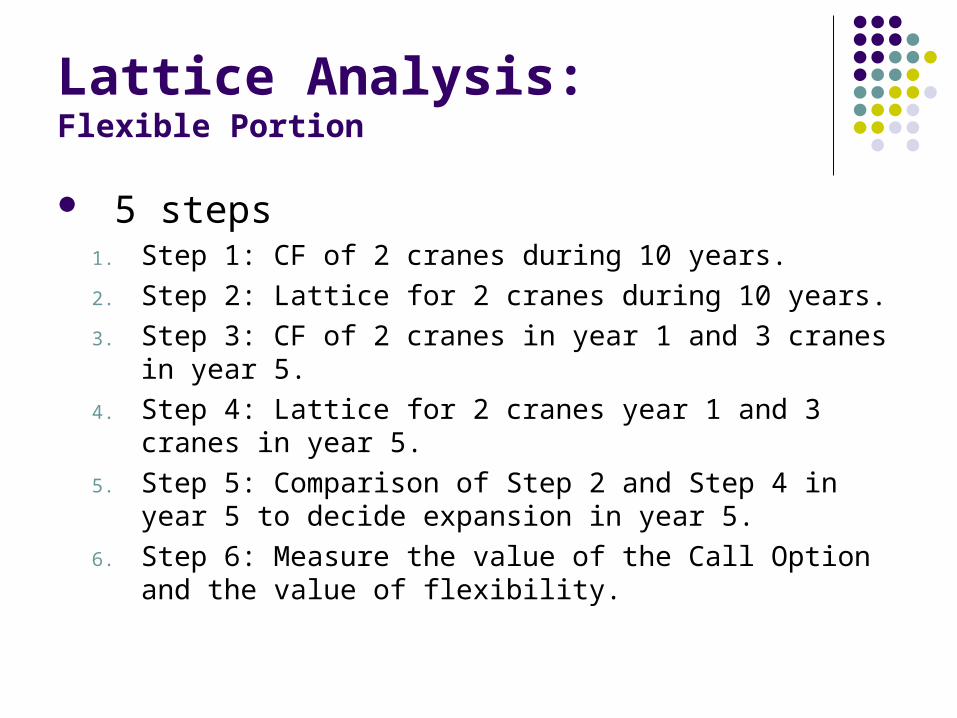
Lattice Analysis: Flexible Portion
5 steps1. Step 1: CF of 2 cranes during 10 years.
2. Step 2: Lattice for 2 cranes during 10 years.
3. Step 3: CF of 2 cranes in year 1 and 3 cranes in year 5.
4. Step 4: Lattice for 2 cranes year 1 and 3 cranes in year 5.
5. Step 5: Comparison of Step 2 and Step 4 in year 5 to decide expansion in year 5.
6. Step 6: Measure the value of the Call Option and the value of flexibility.

Lattice AnalysisValue of call option & Value of flexibility
ENPV - 2 cranes in year 1 35.395.321 ENPV - 2 in year 1 and 3 in year 5 36.764.076 Value of (call) option to expand 1.368.755
ENPV (fixed) - 5 cranes in year 1 36.368.014 ENPV (flexible) - 2 in year 1 and 3 in year 5 36.764.076 Value of flexibility 396.062
0 1 2 3 4 5WITH EXPAND OPTION in year 5 NO NO NO NO NO YESDynamic programming NO NO NO NO YESapproach NO NO NO YES(check next year) NO NO YES
NO NONO
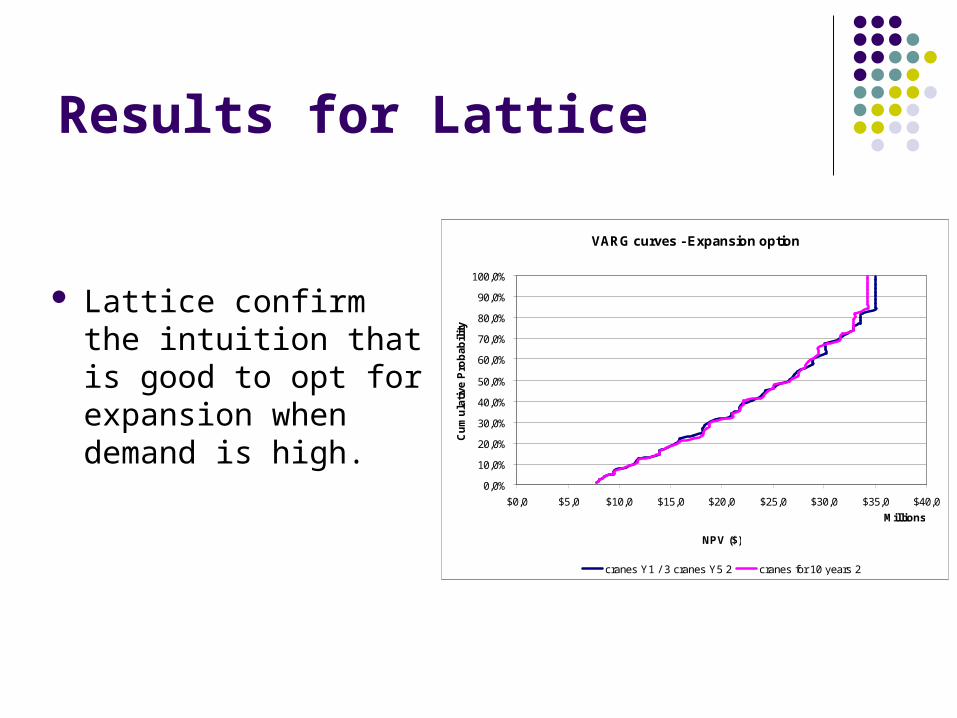
Results for Lattice
VARG curves - Expansion option
0,0%
10,0%
20,0%
30,0%
40,0%
50,0%
60,0%
70,0%
80,0%
90,0%
100,0%
$0,0 $5,0 $10,0 $15,0 $20,0 $25,0 $30,0 $35,0 $40,0
Millions
NPV ($)
Cu
mu
lati
ve P
rob
abil
ity
cranes Y1 / 3 cranes Y5 2 cranes for 10 years 2
Lattice confirm the intuition that is good to opt for expansion when demand is high.
Take away
In this case, Decision Analysis and Lattice are not comparable.
In both cases, flexibility also proved to add value to the process.
Decision analysis seems more adequate for situations with several sources of uncertainty like port expansion.

Questions?