application of sustainable agriculture metrics to canadian ... canadian crop sustainability... ·...
TRANSCRIPT
Final Report
Application of Sustainable Agriculture
Metrics to Canadian Field Crops 2015
Prepared For
Canadian Field Print Initiative
Prepared By
Serecon Inc.
March, 2016

March 3, 2016
Mr. Denis Tremorin
Director, Sustainability
Pulse Canada
1212-220 Portage Avenue
Winnipeg, Manitoba R3C 0A5
Dear Mr. Tremorin:
RE: APPLICATION OF SUSTAINABLE AGRICULTURE METRICS TO CANADIAN FIELD CROPS, 2015
OUR FILE #545411.1
We are pleased to provide you with the Final Report on the above-referenced project. We have enjoyed working with
you and value the input that you and the Canadian Field Print Initiative have provided over the past year.
This report outlines the approach taken to expanding the macro-level indicators to include Ontario, and updating
them to 2011. It also presents the resulting indicators based on our final runs of data for energy use and climate
impact.
This Final Report incorporates the changes discussed with the CFPI Funders Committee on May 28. We look forward
to your review of this Final Report, and will answer any questions that arise.
Please contact me by phone at 780-448-7494, or by email at [email protected].
Yours truly,
SERECON INC.
Robert E. Burden, MBA, AVA,P.Ag.
Edmonton Office
Enclosure
/da
A p p l i c a t i o n o f S u s t a i n a b l e A g r i c u l t u r e M e t r i c s
t o C a n a d i a n F i e l d C r o p s , 2 0 1 5
Table of Contents
ABSTRACT ........................................................................................................................................................................ i
1.0 INTRODUCTION ..................................................................................................................................................... 1
CONTEXT ........................................................................................................................................................................................................ 1 THE CANADIAN FIELD PRINT INITIATIVE ..................................................................................................................................................... 1 CFPI MACRO-LEVEL INDICATORS ............................................................................................................................................................... 3
2.0 DATA AND METHODS ........................................................................................................................................... 4
OVERVIEW OF DATA AND METHODS .......................................................................................................................................................... 4 CFPI Macro-Level Indicators - Principles .............................................................................................................................................. 4 Project Scope ................................................................................................................................................................................................... 4 CFPI Process to Update and Expand Macro-Level Indicators in 2015 ....................................................................................... 5 Indicator Formats........................................................................................................................................................................................... 5 Updated Methods for the 2015 CFPI Indicators – Overview ......................................................................................................... 6 LAND USE INDICATOR .................................................................................................................................................................................. 7 SOIL LOSS INDICATOR .................................................................................................................................................................................. 8 ENERGY USE INDICATOR............................................................................................................................................................................... 9 CLIMATE IMPACT INDICATOR .................................................................................................................................................................... 10 Data Limitations ......................................................................................................................................................................................... 12 Modelling Limitations ............................................................................................................................................................................... 13 SOIL ORGANIC CARBON CHANGE INDICATOR ........................................................................................................................................ 14
3.0 RESULTS................................................................................................................................................................. 16
SOIL LOSS INDICATOR ............................................................................................................................................................................... 16 Prairie Provinces ......................................................................................................................................................................................... 16 Ontario ........................................................................................................................................................................................................... 16 SOIL ORGANIC CARBON CHANGE ............................................................................................................................................................ 18 Prairie Provinces ......................................................................................................................................................................................... 18 Ontario ........................................................................................................................................................................................................... 18 ENERGY USE INDICATOR............................................................................................................................................................................ 21 CLIMATE IMPACT INDICATOR .................................................................................................................................................................... 22
DIFFERENCES BETWEEN THE PRAIRIE AND ONTARIO CONTEXTS RELEVANT TO CLIMATE IMPACT ..................................................... 22 SPRING WHEAT, PRAIRIE PROVINCES ...................................................................................................................................................... 25 Land Use Indicator ..................................................................................................................................................................................... 25 Energy Use Indicator.................................................................................................................................................................................. 26 Climate Impact Indicator ......................................................................................................................................................................... 27 Indicator Summary – Spring Wheat, Prairies ................................................................................................................................... 28 WINTER WHEAT, PRAIRIE PROVINCES ..................................................................................................................................................... 29 Land Use Indicator ..................................................................................................................................................................................... 29 Energy Use Indicator.................................................................................................................................................................................. 30 Climate Impact Indicator ......................................................................................................................................................................... 31 Indicator Summary – Winter Wheat, Prairies .................................................................................................................................. 32 WINTER WHEAT, ONTARIO ....................................................................................................................................................................... 33 Land Use Indicator ..................................................................................................................................................................................... 33 Energy Use Indicator.................................................................................................................................................................................. 34 Climate Impact Indicator ......................................................................................................................................................................... 35 Indicator Summary – Winter Wheat, Ontario ................................................................................................................................. 36 DURUM WHEAT, PRAIRIE PROVINCES ...................................................................................................................................................... 37 Land Use Indicator ..................................................................................................................................................................................... 37 Energy Use Indicator.................................................................................................................................................................................. 38
A p p l i c a t i o n o f S u s t a i n a b l e A g r i c u l t u r e M e t r i c s
t o C a n a d i a n F i e l d C r o p s , 2 0 1 5
Climate Impact Indicator ......................................................................................................................................................................... 39 Indicator Summary – Durum Wheat, Prairies ................................................................................................................................. 40 OATS, PRAIRIE PROVINCES ........................................................................................................................................................................ 41 Land Use Indicator ..................................................................................................................................................................................... 41 Energy Use Indicator.................................................................................................................................................................................. 42 Climate Impact Indicator ......................................................................................................................................................................... 43 Indicator Summary – Oats, Prairies ..................................................................................................................................................... 44
PEAS, PRAIRIE PROVINCES ......................................................................................................................................................................... 45 Land Use Indicator ..................................................................................................................................................................................... 45 Energy Use Indicator.................................................................................................................................................................................. 46 Climate Impact Indicator ......................................................................................................................................................................... 47 Indicator Summary – Peas, Prairies ..................................................................................................................................................... 48
FLAX, PRAIRIE PROVINCES ......................................................................................................................................................................... 49 Land Use Indicator ..................................................................................................................................................................................... 49 Energy Use Indicator.................................................................................................................................................................................. 50 Climate Impact Indicator ......................................................................................................................................................................... 51 Indicator Summary – Flax, Prairies ...................................................................................................................................................... 52
CANOLA, PRAIRIE PROVINCES ................................................................................................................................................................... 53 Land Use Indicator ..................................................................................................................................................................................... 53 Energy Use Indicator.................................................................................................................................................................................. 54 Climate Impact Indicator ......................................................................................................................................................................... 55 Indicator Summary – Canola, Prairies ................................................................................................................................................ 56
LENTILS, PRAIRIE PROVINCES .................................................................................................................................................................... 57 Land Use Indicator ..................................................................................................................................................................................... 57 Energy Use Indicator.................................................................................................................................................................................. 58 Climate Impact Indicator ......................................................................................................................................................................... 59 Indicator Summary – Lentils, Prairies ................................................................................................................................................. 60
SOYBEANS, MANITOBA.............................................................................................................................................................................. 61 Land Use Indicator ..................................................................................................................................................................................... 61 Energy Use Indicator.................................................................................................................................................................................. 62 Climate Impact Indicator ......................................................................................................................................................................... 63 Indicator Summary – Soybeans, Manitoba ....................................................................................................................................... 64
SOYBEANS, ONTARIO ................................................................................................................................................................................ 65 Land Use Indicator ..................................................................................................................................................................................... 65 Energy Use Indicator.................................................................................................................................................................................. 66 Climate Impact Indicator ......................................................................................................................................................................... 66 Indicator Summary – Soybeans, Ontario ........................................................................................................................................... 68
CORN, ONTARIO ........................................................................................................................................................................................ 69 Land Use Indicator ..................................................................................................................................................................................... 69 Energy Use Indicator.................................................................................................................................................................................. 70 Climate Impact Indicator ......................................................................................................................................................................... 71 Indicator Summary – Corn, Ontario .................................................................................................................................................... 72
4.0 SUMMARY ............................................................................................................................................................. 73
5.0 REFERENCES .......................................................................................................................................................... 75
APPENDIX
A p p l i c a t i o n o f S u s t a i n a b l e A g r i c u l t u r e M e t r i c s
t o C a n a d i a n F i e l d C r o p s , 2 0 1 5
List of Figures
Summary of Canadian Field Print Indicator Units (illustrating indicator dimensions) ............................................................... 6
Fertilizer Application Rates, Prairie Provinces ........................................................................................................................................... 13
Fertilizer Application Rates, Ontario .............................................................................................................................................................. 13
Figure 1: Soil Loss per Hectare, Prairies ....................................................................................................................................................... 16
Figure 2: Soil Loss per Hectare, Ontario ...................................................................................................................................................... 17
Figure 3: SOCC per Hectare of Agricultural Land, Prairies ................................................................................................................... 18
Figure 4: SOCC per Hectare of Agricultural Land, Ontario .................................................................................................................. 19
Figure 5: Spring Wheat, Prairies - Tonnes per Harvested Hectare ................................................................................................... 25
Figure 6: Spring Wheat, Prairies - Harvested Hectares per Tonne ................................................................................................... 25
Figure 7: Spring Wheat, Prairies - Energy Use per Harvested Hectare ........................................................................................... 26
Figure 8: Spring Wheat, Prairies - Energy Use per Tonne .................................................................................................................... 26
Figure 9: Spring Wheat, Prairies - Climate Impact per Harvested Hectare ................................................................................... 27
Figure 10: Spring Wheat, Prairies - Climate Impact per Tonne ......................................................................................................... 27
Figure 11: Spring Wheat, Prairies – All Indicators .................................................................................................................................... 28
Figure 12: Winter Wheat, Prairies - Tonnes per Harvested Hectare ................................................................................................ 29
Figure 13: Winter Wheat, Prairies - Harvested Hectares per Tonne ................................................................................................ 29
Figure 14: Winter Wheat, Prairies - Energy Use per Harvested Hectare ........................................................................................ 30
Figure 15: Winter Wheat, Prairies - Energy Use per Tonne ................................................................................................................. 30
Figure 16: Winter Wheat, Prairies - Climate Impact per Harvested Hectare ................................................................................ 31
Figure 17: Winter Wheat, Prairies - Climate Impact per Tonne ......................................................................................................... 31
Figure 18: Winter Wheat, Prairies – All Indicators ................................................................................................................................... 32
Figure 19: Winter Wheat, Ontario - Tonnes per Harvested Hectare ............................................................................................... 33
Figure 20: Winter Wheat, Ontario - Harvested Hectares per Tonne ............................................................................................... 33
Figure 21: Winter Wheat, Ontario – Energy Use per Harvested Hectare ....................................................................................... 34
Figure 22: Winter Wheat, Ontario – Energy Use per Tonne ................................................................................................................ 34
Figure 23: Winter Wheat, Ontario – Climate Impact per Harvested Hectare ............................................................................... 35
Figure 24: Winter Wheat, Ontario – Climate Impact per Tonne ........................................................................................................ 35
Figure 25: Winter Wheat, Ontario – All Indicators .................................................................................................................................. 36
Figure 26: Durum Wheat, Prairies - Tonnes per Harvested Hectare ................................................................................................ 37
Figure 27: Durum Wheat, Prairies - Harvested Hectares per Tonne ................................................................................................ 37
Figure 28: Durum Wheat, Prairies - Energy Use per Harvested Hectare........................................................................................ 38
Figure 29: Durum Wheat, Prairies - Energy Use per Tonne ................................................................................................................. 38
Figure 30: Durum Wheat, Prairies - Climate Impact per Harvested Hectare................................................................................ 39
Figure 31: Durum Wheat, Prairies - Climate Impact per Tonne ......................................................................................................... 39
Figure 32: Durum Wheat, Prairies – All Indicators ................................................................................................................................... 40
Figure 33: Oats, Prairies - Tonnes per Harvested Hectare ................................................................................................................... 41
Figure 34: Oats, Prairies - Harvested Hectares per Tonne ................................................................................................................... 41
Figure 35: Oats, Prairies - Energy Use per Harvested Hectare ........................................................................................................... 42
Figure 36: Oats, Prairies - Energy Use per Tonne .................................................................................................................................... 42
Figure 37: Oats, Prairies - Climate Impact per Harvested Hectare ................................................................................................... 43
Figure 38: Oats, Prairies - Climate Impact per Tonne ............................................................................................................................ 43
Figure 39: Oats, Prairies – All Indicators ...................................................................................................................................................... 44
Figure 40: Peas, Prairies - Tonnes per Harvested Hectare ................................................................................................................... 45
Figure 41: Peas, Prairies - Harvested Hectares per Tonne ................................................................................................................... 45
Figure 42: Peas, Prairies - Energy Use per Harvested Hectare ........................................................................................................... 46
Figure 43: Peas, Prairies - Energy Use per Tonne .................................................................................................................................... 46
Figure 44: Peas, Prairies - Climate Impact per Harvested Hectare ................................................................................................... 47
Figure 45: Peas, Prairies - Climate Impact per Tonne ............................................................................................................................ 47
Figure 46: Peas, Prairies – All Indicators ...................................................................................................................................................... 48
A p p l i c a t i o n o f S u s t a i n a b l e A g r i c u l t u r e M e t r i c s
t o C a n a d i a n F i e l d C r o p s , 2 0 1 5
Figure 47: Flax, Prairies - Tonnes per Harvested Hectare ..................................................................................................................... 49
Figure 48: Flax, Prairies - Harvested Hectares per Tonne ..................................................................................................................... 49
Figure 49: Flax, Prairies - Energy Use per Harvested Hectare............................................................................................................. 50
Figure 50: Flax, Prairies - Energy Use per Tonne ...................................................................................................................................... 50
Figure 51: Flax, Prairies - Climate Impact per Harvested Hectare ..................................................................................................... 51
Figure 52: Flax, Prairies - Climate Impact per Tonne .............................................................................................................................. 51
Figure 53: Flax, Prairies – All Indicators ........................................................................................................................................................ 52
Figure 54: Canola, Prairies - Tonnes per Harvested Hectare .............................................................................................................. 53
Figure 55: Canola, Prairies - Harvested Hectares per Tonne .............................................................................................................. 53
Figure 56: Canola, Prairies - Energy Use per Harvested Hectare ...................................................................................................... 54
Figure 57: Canola, Prairies - Energy Use per Tonne ............................................................................................................................... 54
Figure 58: Canola, Prairies - Climate Impact per Harvested Hectare .............................................................................................. 55
Figure 59: Canola, Prairies - Climate Impact per Tonne ....................................................................................................................... 55
Figure 60: Canola, Prairies – All Indicators .................................................................................................................................................. 56
Figure 61: Lentils, Prairies - Tonnes per Harvested Hectare................................................................................................................ 57
Figure 62: Lentils, Prairies - Harvested Hectares per Tonne ............................................................................................................... 57
Figure 63: Lentils, Prairies - Energy Use per Harvested Hectare ....................................................................................................... 58
Figure 64: Lentils, Prairies - Energy Use per Tonne ................................................................................................................................ 58
Figure 65: Lentils, Prairies - Climate Impact per Harvested Hectare ............................................................................................... 59
Figure 66: Lentils, Prairies - Climate Impact per Tonne ........................................................................................................................ 59
Figure 67: Lentils, Prairies – All Indicators ................................................................................................................................................... 60
Figure 68: Soybeans, Manitoba - Tonnes per Harvested Hectare .................................................................................................... 61
Figure 69: Soybeans, Manitoba - Harvested Hectares per Tonne .................................................................................................... 61
Figure 70: Soybeans, Manitoba - Energy Use per Harvested Hectare ............................................................................................ 62
Figure 71: Soybeans, Manitoba - Energy Use per Tonne ..................................................................................................................... 62
Figure 72: Soybeans, Manitoba - Climate Impact per Harvested Hectare .................................................................................... 63
Figure 73: Soybeans, Manitoba - Climate Impact per Tonne ............................................................................................................. 63
Figure 74: Soybeans, Manitoba – All Indicators ....................................................................................................................................... 64
Figure 75: Soybeans, Ontario - Tonnes per Harvested Hectare ........................................................................................................ 65
Figure 76: Soybeans, Ontario - Harvested Hectares per Tonne ........................................................................................................ 65
Figure 77: Soybeans, Ontario - Energy Use per Harvested Hectare ................................................................................................ 66
Figure 78: Soybeans, Ontario - Energy Use per Tonne ......................................................................................................................... 66
Figure 79: Soybeans, Ontario - Climate Impact per Harvested Hectare ........................................................................................ 67
Figure 80: Soybeans, Ontario - Climate Impact per Tonne ................................................................................................................. 67
Figure 81: Soybeans, Ontario – All Indicators ........................................................................................................................................... 68
Figure 82: Nitrous Oxide per Tonne (T CO2e/Tonne) – Lentils, Peas and Winter Wheat, Prairies ..................................... 23
Figure 83: Nitrous Oxide per Tonne (T CO2e/Tonne) – Soybeans and Winter Wheat, Ontario .......................................... 23
Figure 84: Corn, Ontario - Tonnes per Harvested Hectare .................................................................................................................. 69
Figure 85: Corn, Ontario - Harvested Hectares per Tonne .................................................................................................................. 69
Figure 86: Corn, Ontario - Energy Use per Harvested Hectare .......................................................................................................... 70
Figure 87: Corn, Ontario - Energy Use per Tonne ................................................................................................................................... 70
Figure 88: Corn, Ontario - Climate Impact per Harvested Hectare .................................................................................................. 71
Figure 89: Corn, Ontario - Climate Impact per Tonne ........................................................................................................................... 71
Figure 90: Corn, Ontario – All Indicators ..................................................................................................................................................... 72

A p p l i c a t i o n o f S u s t a i n a b l e A g r i c u l t u r e M e t r i c s
t o C a n a d i a n F i e l d C r o p s , 2 0 1 5
File #545411.1 P a g e | i
Abstract
This report presents environmental sustainability metrics for Canadian field crop production, developed under the
leadership of the Canadian Field Print Initiative (CFPI). The CFPI is working to develop metrics that will promote
understanding of the sustainability of Canadian crop production over the long term. The macro-level indicators
reported here complement the Canadian Field Print Calculator, which measures performance on the same
indicators at the field level.
It is recognized that geography differs widely from region to region across Canada, and consequently, comparison
of results between regions is of little relevance. Rather, the CFPI metrics follow the premise that sustainability is
about improvement over time, on relevant environmental criteria. Emphasis is placed on demonstrating
continuous improvement over time, within a given geographical context.
The CFPI metrics are based on science, and are market-driven and outcome-based. Thus the approach focuses on
environmental impacts, rather than practices and processes. Other key principles underlying this work include
objectivity, and representation of relevant environmental impacts.
The indicators reported here track progress over the thirty years from 1981 to 2011, as follows:
Indicators – land use, soil loss, soil organic carbon change, energy use, and climate impact
Scope – crops and geography:
‒ In the prairie provinces – spring wheat, winter wheat, durum wheat, oats, peas, flax, canola, lentils, and
soybeans (Manitoba)
‒ In Ontario - winter wheat, soybeans, and corn
This report comprises indicators in two distinct formats:
Resource impact indicators – resource impact per unit of area (all the indicators are reported on an area
basis, enabling comparison of trends between all indicators)
Efficiency indicators – resource use or impact per unit of production (where data permits, indicators are
reported as resource use per unit of crop produced)
Efficiency indicators are reported where crop-specific data is available. This form of indicator focuses on how
efficiently resources are being used to meet the increasing demand for food. Increasing yields over the thirty year
study period are a key driver of improvements in sustainability, when measured as resource use per unit of crop
produced (efficiency indicator). Land use, energy use and climate impact are all reported on this basis. These three
efficiency indicators, for all the crops assessed, both in Ontario and on the prairies, showed improvement over the
thirty year study period.
When sustainability is reported as resource use per unit of area, the increases in sustainability over time are less
pronounced, and small decreases are seen in some crop-geographies for energy use and climate impact.
Due to data limitations, it was not possible to calculate the risk of soil loss and soil organic carbon change on a
crop-specific basis. Instead, soil loss and soil organic carbon change were calculated on the basis of land area, i.e.
as resource impact indicators. Both soil loss and soil organic carbon change improved considerably over the study
period, both in Ontario and on the Prairies.
The results in this report demonstrate that Canadian farmers have achieved considerable reductions in their
environmental footprint, between 1981 and 2011.
A p p l i c a t i o n o f S u s t a i n a b l e A g r i c u l t u r e M e t r i c s
t o C a n a d i a n F i e l d C r o p s , 2 0 1 5
File #545411.1 P a g e | 1
1.0 Introduction
Context The challenge of producing enough food for a rapidly growing population in a
sustainable fashion is increasingly on the minds of consumers. As a result, demand
for information on the sustainability of agricultural production continues to gain
strength. Canadian farmers are continually adopting practices that improve
productivity and sustainability. For all these reasons, there is a growing need to
monitor these sustainability improvements with outcomes-based indicators built
from available data.
Grain companies and food companies are responding to the demands of their
customers by asking for validation that producers are following sustainable
production practices:
General Mills has committed to “sustainably source 100% of its 10 priority
ingredients by 2020”, including wheat, oats, corn, dairy (General Mills News
Release, September 2013)
Unilever intends to source 100% of its agricultural raw materials sustainably
by 2020 (Unilever, 2015)
Walmart is sending out questionnaires to suppliers, asking for more
information on sustainability performance and sourcing of commodities
(Walmart, 2015)
The Canadian Field Print Initiative (CFPI), is working toward the objective of meeting
this demand for information on sustainable production. The CFPI is actively engaged
in the development of sustainable agriculture metrics, at the macro level as well as
at the farm level.
The work of Field to Market, the Keystone Alliance for Sustainable Agriculture, in the
United States, has served as a key reference for the early work of the Canadian Field
Print Initiative. This applies both to the macro-level indicators outlined in this report,
and to the Canadian Field Print Calculator. Field to Market has been a leader in the
development of sustainable agriculture metrics in North America.
The Canadian
Field Print
Initiative
The CFPI has its roots in a group of Canadian grower associations, agricultural
companies, food companies and environmental organizations. These groups joined
together around 2009 to lead the development of sustainability metrics for
Canadian grains, oilseeds and pulses. While the focus has been on Canadian
production systems, the metrics developed have followed the design of those built
by Field to Market (see Appendix) in the United States.
The CFPI is focused on the development of metrics that are market-driven, science-
based and outcomes-based (i.e. emphasis is on impacts, not practices). The CFPI’s
key objectives include:
Providing a widely accessible tool and results/benchmarks
Enabling sourcing of sustainably-produced crops

A p p l i c a t i o n o f S u s t a i n a b l e A g r i c u l t u r e M e t r i c s
t o C a n a d i a n F i e l d C r o p s , 2 0 1 5
File #545411.1 P a g e | 2
Strengthening the industry and informing public policy by documenting
sustainability
Taking into consideration the sustainability of the entire crop
rotation/production system
Maintaining alignment with other initiatives
In 2014, the CFPI was formalized under the Canadian Roundtable for Sustainable
Crops (CRSC), as the Canadian Field Print Initiative. Also in 2014, funding was
secured from Agriculture and Agri-Food Canada, under Growing Forward 2 (GF2),
for the sustainability metrics project entitled “Aligning Canadian Sustainable
Agriculture Metrics to the Sustainability Needs of the Global Food Industry”. This
project comprises three Activities:
1. Development of macro-level sustainability indicators
2. Development of the farm-level Canadian Field Print Calculator
3. A fertilizer use survey
Participants in the Canadian Field Print Initiative include:
Canadian Canola Growers Association Canadian Association of Agri-Retailers
Pulse Canada General Mills
Grain Farmers of Ontario Enns Brothers
Prairie Oat Growers Association Syngenta
Manitoba Pulse and Soybean Growers Farmers Edge
CropLife Canada AgriTrend
Fertilizer Canada Ducks Unlimited Canada
The structure of the CFPI includes an Executive Committee, comprising contributing
members who are responsible to Agriculture and Agri-Food Canada (AAFC) for
completion of the GF2 project. The larger group of participants comprises the CFPI
Steering Group. The CFPI’s structure also includes a Technical Resource Group,
comprising individuals with relevant technical expertise.
The macro-level indicators, updated in this report, provide the big picture of
sustainability trends in Canadian agriculture. While this level of analysis is important,
it was recognized that it contains limited information for producers as to how they
can improve sustainability within their own operations. The need was identified for a
tool that the producer can use to estimate sustainability impacts within his specific
operation, with reference to site-specific data on climate, soil and topography. The
Canadian Field Print Calculator is such a tool, and has the key benefits of enabling
the individual producer to see his performance on sustainability impact areas, in
comparison to:
regional averages (initially provincial averages, but ultimately more local
benchmarks)
his own farm, over time
his own farm, under alternative management scenarios
A p p l i c a t i o n o f S u s t a i n a b l e A g r i c u l t u r e M e t r i c s
t o C a n a d i a n F i e l d C r o p s , 2 0 1 5
File #545411.1 P a g e | 3
The ability of the producer to see the sustainability impacts of alternative
management practices, and the impacts of his own operation in comparison to
those of his neighbours, has turned out to be a strong motivator of continual
improvement in crop production sustainability. This is a key finding of pilot projects
conducted in the United States, using Field to Market’s Fieldprint Calculator.
CFPI Macro-
Level Indicators
A complete summary of the original sustainability indicators developed for Western
Canadian field crops can be found in the 2011 report, “Application of Sustainable
Agriculture Metrics to Selected Western Canadian Field Crops” (Pulse Canada et al,
2011). This report documents a project led by Pulse Canada, the Canadian Canola
Growers Association, Ducks Unlimited Canada, the Canadian Wheat Board and the
Flax Council of Canada. The methods used to develop the original macro-level
indicators for Western Canada are described in detail in the 2011 report, and are not
repeated here.
All indicators, for all crops, showed improvement from 1981 to 2006.
This report updates the indicators reported in 2011, as well as expanding both the
geographic scope of the analysis and the number of crops assessed. This process
included:
Addition of new data from the 2011 Census of Agriculture
Adjustment of methodologies to reflect changes that have taken place in
relevant Canadian research and data development
Expansion of the indicator set to include production of wheat, corn and
soybeans in Ontario, as well as soybeans in Manitoba

A p p l i c a t i o n o f S u s t a i n a b l e A g r i c u l t u r e M e t r i c s
t o C a n a d i a n F i e l d C r o p s , 2 0 1 5
File #545411.1 P a g e | 4
2.0 Data and Methods
Overview of
Data and
Methods
CFPI Macro-Level Indicators -
Principles
There are many possible approaches to measuring sustainability at the macro level.
All have strengths and weaknesses. The Canadian Field Print Initiative works from
the fundamental premise that what is important is to demonstrate improvement in
key areas of environmental impact. Thus the key criterion to demonstrate
sustainability is continuous improvement over time. Emphasis is on assessing the
sustainability of production within the physical context of that production. Under
this paradigm, comparison of different crops, or of the same crop in different
physical environments, is not an objective.
The following principles govern the development of CFPI macro-level indicators.
Indicators are
Outcomes-based – they quantify environmental impacts or causative factors
(which are related by coefficients to the environmental impacts)
Representative of relevant environmental impact areas – they capture the
most significant sources of impact
Objective
Science-based - based on well-developed methodology
Consistent with the intent of Field to Market indicators
‒ Provide crop-specific data on environmental impacts
‒ Provide data on environmental impacts on a per unit area basis
Temporally representative – consistent across time, and sensitive to
changes over time
Regionally representative – data that works well at smaller or larger scales
may not translate to good regional data
Collaborative
‒ Facilitate communication between groups with potential to contribute
to Canadian indicators over time
‒ Tie in with other initiatives
Representative of entire production systems (long-term goal)
Project Scope This report documents the development of sustainable agriculture indicators for
Canada, encompassing the following:
Crops – spring wheat, winter wheat, durum wheat, oats, peas, flax, canola,
lentils, soybeans, corn
A p p l i c a t i o n o f S u s t a i n a b l e A g r i c u l t u r e M e t r i c s
t o C a n a d i a n F i e l d C r o p s , 2 0 1 5
File #545411.1 P a g e | 5
Indicators – Land Use, Energy Use, Climate Impact, Soil Loss, Soil Organic
Carbon Change
Geography – Prairie Provinces, Ontario
Time frame – 1981-2011
CFPI Process to Update and
Expand Macro-Level
Indicators in 2015
The updating and expansion of the CFPI’s macro-level indicators has followed a
similar approach and methodology to the original indicator development
undertaken in 2011. It is helpful to distinguish two streams of work necessary to
complete this work:
Updating of existing indicators – this consisted primarily of populating the
models developed in 2011 with updated data from the same sources
(differences are noted under Data and Methods for each indicator)
Expansion of geography and crops – this required some systematic
assessment of alternative data sets and models, with input from the scientists
responsible for them, particularly with the expansion of indicator coverage
from the relatively uniform Prairie Provinces into Ontario, which has a
markedly different geography
While the methodologies used to develop the original CFPI indicators in 2011 were
chosen partly for their ability to apply across Canada, the differences between the
prairies and Ontario are significant. It was therefore essential to systematically
consider the research and modelling that have taken place in Ontario, while still
following the basic principles of indicator development outlined above.
To this end, Serecon organized and facilitated a series of workshops in Ontario in
September 2014. While these workshops largely related to the development of the
Canadian Field Print Calculator (CFPC) in Ontario, they also provided essential
contacts, information and insight relevant to the development of the macro-level
indicators. An example of this is the work done in Ontario relating to water quality,
both at the provincial level and as applied nationally (NAHARP indicators of water
quality). This will definitely inform future CFPI work on water quality indicators.
A further element of the process to update and expand the CFPI macro-level
indicators has been ongoing communication with the scientists and modellers who
were involved in the development of the original CFPI indicators in 2011. As in 2011,
the CFPI Soil Loss Indicator is built on the AAFC work that feeds into the NAHARP
Soil Erosion Indicator. Likewise, the CFPI Energy Use and Climate Impact Indicators
continue to be produced from the AAFC work feeding into NAHARP’s Greenhouse
Gas Indicator.
Indicator Formats Results for each indicator are presented in two different formats in this report:
1. Resource impact indicator. Resource impact per unit of area normalizes
the four metrics to a common basis, for comparison.
2. Efficiency indicator. Resource use or impact per unit of production. These
efficiency indicators illustrate resource impact relative to our ability to meet
productivity demands.

A p p l i c a t i o n o f S u s t a i n a b l e A g r i c u l t u r e M e t r i c s
t o C a n a d i a n F i e l d C r o p s , 2 0 1 5
File #545411.1 P a g e | 6
These two indicator formats are constructed from three basic sets of data for each
crop:
1. Resource impact data
2. Crop yield
3. Resource impact per unit of crop output
Su mmary of Ca na dian F ie ld Pr in t I n dica tor U ni ts ( i l lustr at ing ind icat or d im ens io ns )
Land Use Soil Loss Energy Use Climate Impact
Resource Impact hectares tonnes of soil/
hectare GJoules/hectare T CO2e/hectare
Crop Yield tonne/hectare tonne/hectare tonne/hectare tonne/hectare
Efficiency Indicator hectare/tonne of
crop tonnes of soil/ tonne of crop
Joules/tonne of crop
T CO2e/tonne of crop
Where data permits, results are presented graphically in three forms:
1. Line graph for each crop, for each indicator, on a per unit of area basis.
Resource values (e.g. energy use in GJoule/hectare) are plotted by year, for
the study period (generally 1981-2011). Shows change over time, on a per
hectare basis.
2. Line graph for each crop, for each indicator, on a per unit of production
basis (efficiency indicators). Resource values (e.g. energy use in
GJoule/tonne of crop) are plotted by year, for the study period (generally
1981-2011). Shows change over time, on a per tonne of product basis.
3. Summary spidergram for each crop, showing the change in all efficiency
indicators over time. To facilitate comparison of relative changes over time
across multiple indicators, with different units, the spidergram is built from
the four efficiency indicators for the crop, each indexed to 1 for the census
year 2001. Thus, for example, a 10% change in any indicator appears the
same in the spidergram. Trends represented by movement toward the
centre of the spidergram (toward a value of zero) are efficiency
improvements, or reductions of resource use or impact per unit of food
produced.
These graphical representations are consistent with the philosophy that there is no
specific end point that defines sustainability. Also in line with Field to Market
philosophy, sustainability is represented by diminishing resource impact outcomes
over time.
Updated Methods for the
2015 CFPI Indicators –
Overview
1. Soil Organic Carbon Change (SOCC): AAFC has developed SOCC data for
Census years since 1981. The CFPI reports this data twice, once in a standalone
SOCC Indicator, and again as a component of the Climate Impact Indicator. The
A p p l i c a t i o n o f S u s t a i n a b l e A g r i c u l t u r e M e t r i c s
t o C a n a d i a n F i e l d C r o p s , 2 0 1 5
File #545411.1 P a g e | 7
CFPI SOCC Indicator shows change over time in soil carbon change, which is in
itself an important indicator of sustainability. Soil organic carbon is also an
important contributor to climate impact (or, in the case of Canada’s Prairies, a
credit against climate impact), and for this reason we also report it as part of the
Climate Impact Indicator.
2. Soil Erosion: The modelling of soil erosion for this report follows a new
methodology developed by AAFC. This results in a Soil Erosion Indicator which,
unlike the one reported in 2011 for Western Canada, is not crop-specific. AAFC
intends to apply the new methodology on a crop-specific basis in the future.
Until this has been done, the CFPI will report non-crop-specific soil erosion. As a
result, the Soil Erosion Indicator reported here is not crop-specific.
Land Use
Indicator
Land is a primary input for all agricultural production. Agriculture is in competition
for land with other land uses, including forestry and urban uses. Crop production
involves a large area of land, leading to significant challenges and opportunities for
sustainable land use.
The CFPI Land Use Indicator focuses on changes in use of cropland for production,
over the study period, from 1981 to 2011.
The Land Use Indicator we report here is the same as that reported for Western
Canada in 2011. It would be preferable to calculate land use on the basis of planted
area, rather than harvested area, since planted area accounts for crop area
abandoned due to to adverse weather or other conditions. This would give a more
inclusive indication of the impacts of such losses on overall production efficiency.
However, we have found that Canadian data for areas planted to crops does not go
all the way back to 1981, for most crops. As a result, we have reported land use on
the basis of harvested area.
The Land Use Indicator is a simple inverse of yield. It provides a perspective that
emphasizes use of the land resource in terms of crop production. The results
presented for the Land Use Indicator include:
1. Yield, in tonnes of crop per harvested hectare
2. Land Use Indicator, in harvested hectares per tonne of crop
The Land Use Indicator is calculated from Census of Agriculture crop areas and
production data (reported in Statistics Canada’s Field Crop Reporting Series). This
data set also provides the area basis for the Energy Use and Climate Impact
Indicators. This approach enables reporting of the Land Use, Energy Use and
Climate Impact Indicators on as consistent an area basis as possible.
Note that the Census of Agriculture crop areas used to calculate the Land Use
Indicator are only reported for Census years, i.e. one year out of five. Analysis
showed that the year-to-year variability inherent in crop yield data (due to weather
and other drivers) caused considerable distortion of thirty-year time trends, when
only the seven Census year data points were used. To address this, and to reflect
crop yields from all years in the time period reported, the yield data from the
Census of Agriculture dataset was adjusted using annual yield data from CANSIM
A p p l i c a t i o n o f S u s t a i n a b l e A g r i c u l t u r e M e t r i c s
t o C a n a d i a n F i e l d C r o p s , 2 0 1 5
File #545411.1 P a g e | 8
(these two datasets were found to be different, but relatively consistent internally).
In this way, annual, moving-average yield data was generated for each crop. This
annual, moving-average yield data, based on Census of Agriculture crop areas, was
used to calculate the Land Use Indicator.
Soil Loss
Indicator
Canada does not have a detailed history of agricultural land use, cropping and
management practices. Field to Market’s Soil Loss Indicator is based on much more
detailed data from the National Resource Inventory (NRI) of the US National
Resources Conservation Service (NRCS). In spite of this lack of available data in
Canada, we created a soil loss indicator in 2011 that is similar to the US indicator.
The 2011 Western Canada macro-level Soil Loss Indicator was built using a
methodology developed by the National Agri-Environmental Health Analysis and
Reporting Program (NAHARP). This work was funded by AAFC, and resulted in
development of the Soil Erosion Risk Indicator (SoilERI) across Canada. While not
based on the high density of data available in the US, SoilERI leverages the data
available in Canada to provide fairly accurate spatial and temporal trends, when
interpreted at provincial and national scales.
SoilERI was reported as the total soil loss (tonnes/ha/year), encompassing water,
wind and tillage erosion indicators:
The Water Erosion Risk Indicator (WaterERI) was calculated based on
Universal Soil Loss Equation (USLE) methodology, where regression equations
were adjusted based on intensive runs of the Revised Universal Soil Loss
Equation (RUSLE) and RUSLE 2.
The Wind Erosion Risk Indicator (WindERI) was calculated based on the Wind
Erosion Equation (WEQ), however this method was not validated like the
water and tillage erosion calculations.
The Tillage Erosion Risk Indicator (TillERI) was calculated as the product of
tillage erosivity and landscape erodibility
SoilERI was calculated as the sum of WaterERI, WindERI, and TillERI for each
segment in each landform. The total soil erosion risk value was then area-weighted
for each landform, crop type and tillage system, and aggregated to the value for
each segment at the ecodistrict, provincial and national (Western Canada) levels.
Due to the landscape, topography, and agricultural practices in western Canada, soil
erosion in this region is mainly in the form of downward movement of soil on the
eroding portions of hill slopes. In other words, almost all of the eroded soil stays
within the field boundary (within-field erosion). For this reason, soil erosion in
western Canada should be reported as the most erodible segment within the area in
question.
Based on critical review of the Western Canada Soil Loss Indicator reported in 2011,
several changes were made to the macro-level indicator in 2015:
In 2015, the macro-level Soil Loss Indicator was updated with 2011 Census of
Agriculture data. Integrated data from the 2011 erosion dataset provided by
AAFC included WaterERI and TillERI for each SLC polygon in each Census year
A p p l i c a t i o n o f S u s t a i n a b l e A g r i c u l t u r e M e t r i c s
t o C a n a d i a n F i e l d C r o p s , 2 0 1 5
File #545411.1 P a g e | 9
from 1981 to 2011. In this dataset, these erosion risk indicator values are
calculated based on the most severely erodible slope segment of a two-
dimensional hill slope. WaterERI is based on soil erosion from the middle-
slope segment, whereas TillERI is based on soil erosion from the upper-slope
segment, due to these segments being the most severely erodible slope
segment under each type of soil erosion in Western Canada.
Unlike the 2011 macro-level indicator, these data were not separated by crop
type. The integration of the 2011 Census data removed the functionality of
the SoilERI to separate soil erosion by crop type. Consequently, for this
report, all crops within a given geographic unit have been assigned the same
rate of soil erosion. This enables us to report the best available soil erosion
data. The crop-type separation is to be included in the SoilERI when
separated 2011 data is available.
In 2015, the updated Census data was aggregated from the SLC polygon level
to the ecodistrict level, using polygon area-weighted averages of WaterERI
and TillERI within each province. Ecodistrict area-weighted averages were
then used to aggregate WaterERI and TillERI values from ecodistrict to
provincial levels. Soil ERI is reported as the sum of WaterERI (mid-slope
segment) and TillERI (upper-slope segment).
Wind erosion is not included in the macro-level Soil Loss Indicator in this
report, for two reasons. First, a high level of uncertainty still surrounds the
available modelled estimates of wind erosion for Canada. As well, while the
prairie provinces are considered to have a relatively high risk of soil erosion
for Canada, wind erosion in this region has been found to be minimal. One
caveat that applies to this methodology is the application to eastern
provinces (e.g. Ontario), where wind erosion may play a significant role in
total soil erosion.
The Soil Loss Indicator is presented in this report for Ontario cropland, and
for Prairie Provinces cropland. Values reported represent estimated risk of soil
loss, in tonnes of soil per hectare of cropland per year.
Energy Use
Indicator
Crop production involves many uses of energy, ranging from the production of
fertilizers and machinery to the burning of fuel to perform field work.
The CFPI Energy Use Indicator captures the major energy-intensive activities
necessary for crop production. As with the other CFPI indicators, emphasis is on
demonstrating how energy use to produce crops has changed over the study
period, from 1981 to 2011.
The 2015 CFPI Energy Use Indicator includes estimates of the following categories
of farm energy use:
Fuel for farm field work – tillage, seeding, manure/fertilizer application, weed
control, harvesting
Gasoline/diesel for farm transport vehicles
Electricity
Heating fuel
Production of fertilizer and pesticide
Production of machinery

A p p l i c a t i o n o f S u s t a i n a b l e A g r i c u l t u r e M e t r i c s
t o C a n a d i a n F i e l d C r o p s , 2 0 1 5
File #545411.1 P a g e | 10
The Energy Use Indicator reported here uses essentially the same methodology,
applying essentially the same algorithms, as used in 2011, to produce the original
Western Canada Energy Use Indicator (see Pulse Canada et al, 2011).
The Energy Use Indicator is presented in this report in two forms:
1. Energy use per harvested hectare
2. Energy use per tonne of crop produced (calculated by dividing 1, above, by
yield)
This Energy Use Indicator is based on a data run provided by AAFC early in 2015.
This differed from the data provided for the 2011 Western Canada indicators in that
it included data for the 2011 Census year, and data for wheat, soybeans and corn
produced in Ontario. The data provided comprised energy intensities, on a
harvested area basis.
Climate Impact
Indicator
Canadian agriculture contributed 8% of Canada’s greenhouse gas emissions in 2013
(Environment Canada, 2015). In turn, agriculture is susceptible to the impacts of
climate change resulting from greenhouse gas emissions.
The CFPI Climate Impact Indicator demonstrates how the climate impact of crop
production has changed over the study period, from 1981 to 2011. It includes the
terms incorporated in the Energy Use Indicator, converted to CO2 equivalents (T
CO2e). In addition, it includes the climate impact of nitrous oxide emissions, in T
CO2e and an estimate of Soil Organic Carbon Change (SOCC). Thus, the 2015 CFPI
Climate Impact Indicator includes estimates for:
The energy use categories listed above under the Energy Use Indicator
Direct nitrous oxide emissions
‒ From nitrogen fertilizer application (both chemical and organic)
‒ From nitrogen that becomes available after crop residue
decomposition
Indirect nitrous oxide emissions
‒ From leaching/runoff
‒ From volatilization
Soil organic carbon change (SOCC)
‒ From tillage changes
‒ From summerfallow frequency changes
‒ From changes between annual crops and perennial hay or pasture
The nitrous oxide elements of the CFPI Climate Impact Indicator use the same
methodology as the Western Canada Climate Impact Indicator reported in 2011 (see
Pulse Canada et al, 2011). Nitrous oxide emissions were calculated using the
Intergovernmental Panel on Climate Change (IPCC) Tier 2 methodology. Emissions
were estimated as the product of nitrogen inputs and specific emission factors.
The Climate Impact Indicator is presented in two forms:
1. Climate impact per harvested hectare
2. Climate impact per tonne of crop produced (calculated by dividing 1,
above, by yield)

A p p l i c a t i o n o f S u s t a i n a b l e A g r i c u l t u r e M e t r i c s
t o C a n a d i a n F i e l d C r o p s , 2 0 1 5
File #545411.1 P a g e | 11
Both forms of the Climate Impact Indicator show both
the contribution of energy use and nitrous oxide emissions (but not soil
carbon change), and
the total climate impact, incuding soil carbon change
Thus the magnitude of the contribution of SOCC to climate impact is clearly
illustrated.
The 2015 Climate Impact Indicator is based on a data run provided by AAFC in early
2015 for energy use and nitrous oxide, and a run of soil organic carbon change data
provided by AAFC in December, 2015. These runs provide for
updating of the 2011 indicator to incorporate 2011 Census data
expansion of the geography and crops covered to include wheat, soybeans
and corn in Ontario
incorporating SOCC into the Climate Impact Indicator, to provide a more
comprehensive estimate of climate impact
incorporating updated emission factors and global warming potentials.
The data provided comprised energy intensities, nitrous oxide intensities, and soil
carbon change, on a harvested area basis.
In Canada, estimation of direct nitrous oxide emissions from agricultural soils
follows a country-specific (Tier II) methodology, at the regional scale, developed by
Rochette et al (2008). In this methodology, the default constant IPCC N2O emission
factor for nitrogen inputs is replaced with a climate-dependent factor that increases
with increasing moisture levels. This generally results in the application of higher
emission factors in Ontario than on the prairies, owing to the relatively humid
climate in Ontario.
In addition to this, the nitrous oxide emission factor applied for Ontario (but not the
one for the Prairies) increased over the study period, to reflect increasingly humid
conditions in eastern Canada (X. Verge, personal communication, April 2, 2015).
In turn, the Climate Impact Indicators in this report reflect the impact of varying
moisture levels, throughout Canada and across time, on nitrous oxide emissions.
This is seen in the results presented below.
The SOCC portion of the Climate Impact Indicator is based on AAFC modelling of
SOCC, with data provided to the CFPI in December, 2015. This data comprises SOCC
estimates in CO2 equivalents, for the agricultural land (land in crops, improved
pasture and summerfallow, but not unimproved pasture) in each province. Thus the
agricultural land (excluding unmanaged pasture) is the area over which the carbon
change should be allocated, to be consistent with the carbon modelling approach
(D. Worth, personal communication, Nov. 26, 2015). Using this approach, the carbon
change for a given spatial area is independent of crop type. As a result, while the
energy use and nitrous oxide elements of the CFPI Climate Impact Indicator are
calculated and reported on a crop-specific basis, the SOCC element is not. This has
the implication that the SOCC component is not strictly comparable to the others.
A p p l i c a t i o n o f S u s t a i n a b l e A g r i c u l t u r e M e t r i c s
t o C a n a d i a n F i e l d C r o p s , 2 0 1 5
File #545411.1 P a g e | 12
This creates an issue for the reporting of SOCC as part of the CFPI Climate Impact
Indicator. There is considerable complexity and uncertainty in the measurement of
SOCC, and in the science relating to the contributions of different crops. The issue
of allocating SOCC across crops was discussed by the CFPI’s Technical Review
Committee in October 2015. It was decided at that time that SOCC should be
allocated across crops on the basis of each crop’s share of the rotation, i.e. on the
basis of crop areas. Note that, since the CFPI is reporting climate impact on a per-
hectare basis (and on a per-hectare basis adjusted for yield), this amounts to
reporting the same rate of soil carbon gain or loss for all crops in a given
geography.
Data Limitations Fertilizer application rates represent a data gap for analysis of climate impact from
crop production in Canada. In this analysis, provincial recommended nitrogen
application rates were taken from Yang et al, 2007. This dataset contains significant
inaccuracies, for example application of nitrogen to pulse crops such as peas and
lentils is probably overestimated.
This data gap surrounding fertilizer management in Canada was identified during
the development of the 2011 indicator report (Pulse Canada et al, 2011). As a result,
the Growing Forward 2 project, “Aligning Canadian Sustainable Agriculture Metrics
to the Sustainability Needs of the Global Food Industry”, comprises a Fertilizer Use
Survey, as well as the macro-level indicator work reported here, and the
development of the Canadian Field Print Calculator.
The Fertilizer Use Survey will provide data on nutrient management practices in
Canadian crop production, with data being collected from 2014 to 2017. The data
collected will provide for improved quantification of current and historic fertilizer
use for future versions of the macro-level indicators in this report.
Of particular importance for environmental sustainability, two key points must be
noted about this new data that is becoming available from the Fertilizer Use Survey:
1. the Fertilizer Use Survey will provide extensive data on the adoption of 4R
Nutrient Stewardship practices
2. the new data will reflect the importance of source, place and timing of
fertilizer application, unlike the current data which only accounts for
application rate
Data collection for the Fertilizer Use Survey began in the winter of 2014. An online
survey was conducted, engaging
400 Western Canada producers (plus top-up surveys) – canola, peas, spring
wheat
250 Ontario and Quebec producers – corn, soybeans
The tables below present fertilizer application rates from both data sources, for
comparison, revealing substantial differences between the two. Based on this
preliminary survey data, on the Prairies, the recommended application rates used for
the present report are much lower than actual rates for canola, much higher for

A p p l i c a t i o n o f S u s t a i n a b l e A g r i c u l t u r e M e t r i c s
t o C a n a d i a n F i e l d C r o p s , 2 0 1 5
File #545411.1 P a g e | 13
peas, and much lower for spring wheat. For Ontario, the recommended rate is
somewhat higher than the actual rate for corn, and lower for soybeans.
Fert i l i zer Ap p l i c at io n Rat es , Pra ir ie Pr o vin ces
Fertilizer Application Rates (kg N/ha)
Canola Peas Spring Wheat
Recomm. FUS Recomm. FUS Recomm. FUS
Alberta 85 110 40 16 55 96
Saskatchewan 75 105 25 9 35 92
Manitoba 90 125 15 11 80 115
Recomm. = recommended nitrogen application rates (Yang et al, 2007) - used in modelling
of CFPI macro-level indicators
FUS = Fertilizer Use Survey, 2015, Canadian Field Print Initiative - average rate of nitrogen
applied in 2014 (in fields where nitrogen was applied)
Fert i l i zer Ap p l i c at io n Rat es , O nt ar io
Fertilizer Application Rates (kg N/ha)
Corn Soybeans
Recomm. FUS Recomm. FUS
Ontario 170 154 0 16
Recomm. = recommended nitrogen application rates (Yang et al, 2007) - used in modelling
of CFPI macro-level indicators
FUS = Fertilizer Use Survey, 2015, Canadian Field Print Initiative - average rate of nitrogen
applied in 2014 (in fields where nitrogen was applied)
This data demonstrates the importance of improved fertilizer application data, given
both the disparity between the two datasets, and the importance of nitrogen
fertilizer use as a driver of both energy use and nitrous oxide emissions. Also
important for sustainability, nitrogen fertilizer enables increased crop yields, which
directly increase sustainability when assessed on an output basis.
Modelling Limitations Nitrous Oxide from Crop Residues of Grain Legumes. An additional weakness in
the modelling of climate impact relates to residues left on the fields by grain
legumes. Nitrous oxide emissions from nitrogen that becomes available after crop
residue decomposition, in the case of grain legumes, are likely still overestimated in
the climate impact indicators presented here. This issue was identified in the 2011
indicator report (Pulse Canada et al, 2011).
In this report, the nitrous oxide emissions from crop residues are estimated from
Crop-specific estimates of the amount of above-ground and below-ground
crop residue, and the nitrogen content of each (sourced from Janzen et al,
2003), and
Site-specific emission factors (the same emission factors are used for all direct
nitrous oxide emissions)( X. Verge, personal communication, June 28, 2015)

A p p l i c a t i o n o f S u s t a i n a b l e A g r i c u l t u r e M e t r i c s
t o C a n a d i a n F i e l d C r o p s , 2 0 1 5
File #545411.1 P a g e | 14
Of the crops covered in this report, peas have relatively high amounts of crop
residue nitrogen, resulting in a relatively high estimate of nitrous oxide emissions
for peas. However, research has been conducted by Zhong et al (2011) comparing
nitrous oxide emissions from crop residues of grain legumes (lentils and peas) to
those from a cereal crop (spring wheat). This work suggests that nitrous oxide
emissions are not directly related to biological N2 fixation by grain legumes such as
peas and lentils. Rather, it was found that, in the short term, nitrogen-rich residues
of N2-fixing crops have a limited impact on nitrous oxide emissions.
To summarize, the modelling used to generate the Climate Impact Indicators
reported here assumes that fixed nitrogen in the crop residues of grain legumes,
such as peas and lentils, contributes to nitrous oxide emissions in the same way as
nitrogen in other crop residues, e.g. wheat. It is likely that this leads to
overestimation of nitrous oxide emissions from the residues of peas and lentils. The
Climate Impact Indicators in this report should be interpreted in this context (R.
Lemke, personal communication, July 14, 2015).
Nitrous Oxide from Crop Residues of All Crops. There is evidence that crop
residues release nitrogen (as nitrous oxide) more gradually than does nitrogen
fertilizer. This has raised the question of whether the same emission factors should
be applied to both fertilizer nitrogen and crop residue nitrogen, as in the modelling
behind the indicators reported here. The contributions of crop residues and other
nitrogen sources to nitrous oxide emissions are presently being actively researched
in Western Canada.
The release of nitrous oxide from fertilizer is highly moisture-dependent, and highly
variable. However, it has not been demonstrated to be higher than that from crop
residues, when averaged over time. Thus, for macro-level modelling over a thirty-
year time period, the use of the same emission factors for nitrogen fertilizer and
crop residue nitrogen still reflects current understanding of nitrous oxide sources (R.
Lemke, personal communication, July 14, 2015).
Soil Organic
Carbon
Change
Indicator
The CFPI reports soil organic carbon change (SOCC) both as an indicator of SOCC
alone, and as part of the CFPI Climate Impact Indicator (see previous section). This
dual reporting of SOCC has the following advantages:
1. SOCC is, in itself, an important indicator of sustainability. The CFPI SOCC
Indicator demonstrates progress over time in this key sustainability area.
Uniquely, soil carbon responds to what happened in the past, and can
swamp the impacts of current management practices, so it is important to
highlight what is happening with SOCC alone.
2. SOCC is also a major component of whole-system greenhouse gas
accounting. Inclusion of SOCC in the CFPI Climate Impact Indicator provides
an indicator that captures all the major contributors of greenhouse gas
emissions from Canadian crop production, and aligns with international
conventions and standards for carbon footprinting.
AAFC produces a Soil Organic Carbon Change Indicator which assesses how organic
carbon levels change over time, in Canadian agricultural soils (McConkey et al,
2010). Change in soil organic carbon gives an indication of soil health. It also
A p p l i c a t i o n o f S u s t a i n a b l e A g r i c u l t u r e M e t r i c s
t o C a n a d i a n F i e l d C r o p s , 2 0 1 5
File #545411.1 P a g e | 15
provides an estimate of the amount of CO2 sequestered as soil organic carbon in
agricultural soils. This dataset is well suited to the reporting format of the CFPI
SOCC Indicator.
AAFC’s SOCC Indicator is based on the methodology used for Canadian National
Inventory reporting by Environment Canada. The AAFC SOCC Indicator uses the
Century model to predict the rate of change in organic carbon in Canada’s
agricultural soils, due to changes in land use and land management, including:
Tillage changes
Summerfallow frequency changes
Change between annual crops and perennial hay or pasture
Breaking native grass for cropland
Clearing forests for agriculture
The CFPI SOCC Indicator reported here is derived from AAFC’s SOCC data. The CFPI
SOCC Indicator reflects the impact of the three management practices on soil
organic carbon – tillage changes, summerfallow frequency changes and changes
between perennial and annual crops. While management changes drive the majority
of SOCC in the regions reported here, it should be noted that the CFPI SOCC
indicator does not account for the conversion of forest and grasslands to
agriculture.
Thus the CFPI SOCC Indicator demonstrates broad trends in SOCC in prairie and
Ontario agricultural land, attributable to farm management practices. “Agricultural
land”, in the context of the indicator reported here, includes all land in crops,
improved pasture and summerfallow, but does not include unimproved pasture.
Note that these SOCC trends relate to the entire crop production system rather than
to any specific crop. These results are reported as SOCC, in T CO2e/ha/year, on
agricultural land, by year. Negative values indicate a loss of carbon from the soil to
the atmosphere, and positive values indicate sequestration of carbon from the
atmosphere.
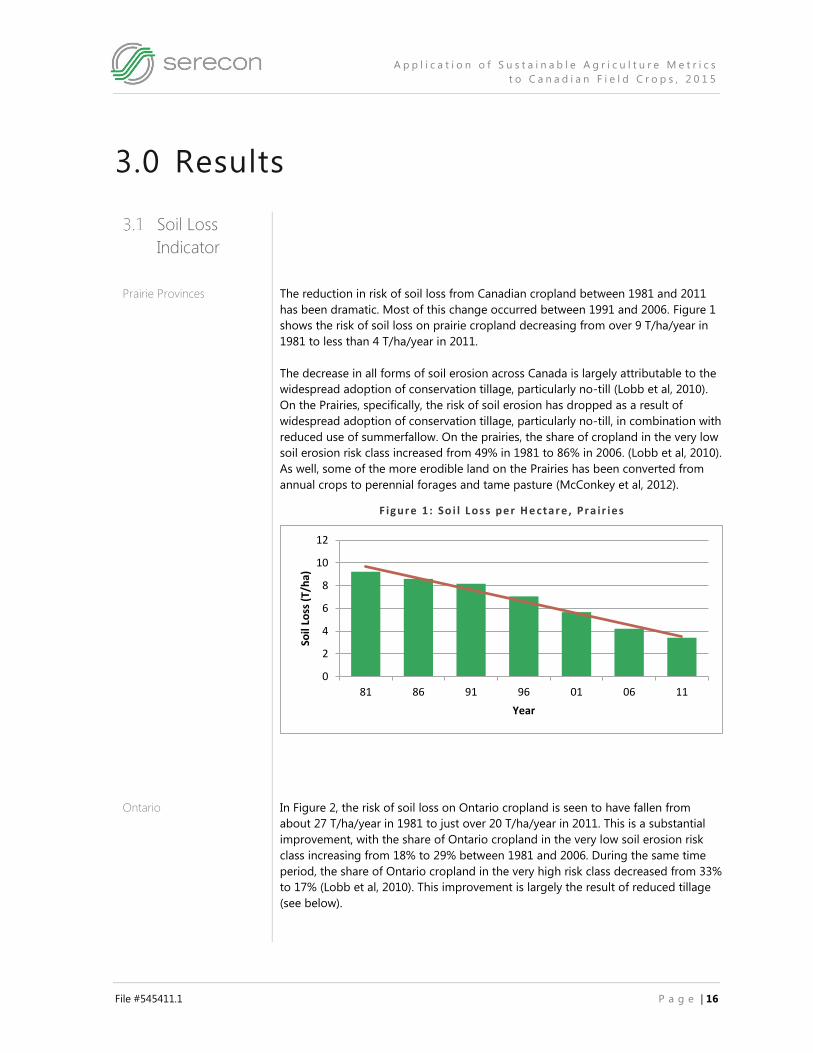
A p p l i c a t i o n o f S u s t a i n a b l e A g r i c u l t u r e M e t r i c s
t o C a n a d i a n F i e l d C r o p s , 2 0 1 5
File #545411.1 P a g e | 16
3.0 Results
Soil Loss
Indicator
Prairie Provinces The reduction in risk of soil loss from Canadian cropland between 1981 and 2011
has been dramatic. Most of this change occurred between 1991 and 2006. Figure 1
shows the risk of soil loss on prairie cropland decreasing from over 9 T/ha/year in
1981 to less than 4 T/ha/year in 2011.
The decrease in all forms of soil erosion across Canada is largely attributable to the
widespread adoption of conservation tillage, particularly no-till (Lobb et al, 2010).
On the Prairies, specifically, the risk of soil erosion has dropped as a result of
widespread adoption of conservation tillage, particularly no-till, in combination with
reduced use of summerfallow. On the prairies, the share of cropland in the very low
soil erosion risk class increased from 49% in 1981 to 86% in 2006. (Lobb et al, 2010).
As well, some of the more erodible land on the Prairies has been converted from
annual crops to perennial forages and tame pasture (McConkey et al, 2012).
F igure 1: So i l L os s per H e ctar e , Pra ir ies
Ontario In Figure 2, the risk of soil loss on Ontario cropland is seen to have fallen from
about 27 T/ha/year in 1981 to just over 20 T/ha/year in 2011. This is a substantial
improvement, with the share of Ontario cropland in the very low soil erosion risk
class increasing from 18% to 29% between 1981 and 2006. During the same time
period, the share of Ontario cropland in the very high risk class decreased from 33%
to 17% (Lobb et al, 2010). This improvement is largely the result of reduced tillage
(see below).
0
2
4
6
8
10
12
81 86 91 96 01 06 11
Soil
Loss
(T/
ha)
Year

A p p l i c a t i o n o f S u s t a i n a b l e A g r i c u l t u r e M e t r i c s
t o C a n a d i a n F i e l d C r o p s , 2 0 1 5
File #545411.1 P a g e | 17
F igure 2: So i l L os s per H e ctar e , Ont ar io
Context Relevant to Risk
of Soil Erosion – Ontario
and the Prairies
As noted above, substantial improvements have been made in the risk of soil loss
both in Ontario and on the Prairies. The risk of soil loss on the Prairies, on the basis
of cropland area, decreased by 57% over the study period, as compared to 25% in
Ontario. Adoption of reduced tillage practices (62% decrease in conventional till
from 1991 to 2006 on the Prairies, 39% reduction in Ontario) has been a strong
positive driver in both regions.
Differences between the contexts of production in Ontario and on the Prairies
underlie both the higher overall risk of soil loss in Ontario, and the greater reduction
in the risk of soil loss on the Prairies. Ontario includes the Mixedwood Plains
Ecozone (southwestern Ontario), which has the highest erosion risk in Canada, for
reasons including:
Water erosion is a constant threat in Ontario, where large, intense rainstorms
occur regularly
The western part of Ontario’s agricultural area has large areas of cropland on
hummocky landforms with maximum slopes of 10% or greater, creating a
high risk of both water and tillage erosion
Row crops of corn and soybean produced with conventional tillage have
relatively high risks of soil erosion. The acreage of corn has been constant
throughout the study period, but the acreage of soybeans has almost
quadrupled
In short, Ontario’s combination of moist climate, steep terrain (soil landscapes with
high erosion risks) and cropping systems with high erosion risks, leads to serious
overall levels of risk of erosion (Lobb et al, 2010).
0
5
10
15
20
25
30
81 86 91 96 01 06 11So
il Lo
ss (
T/h
a)
Year
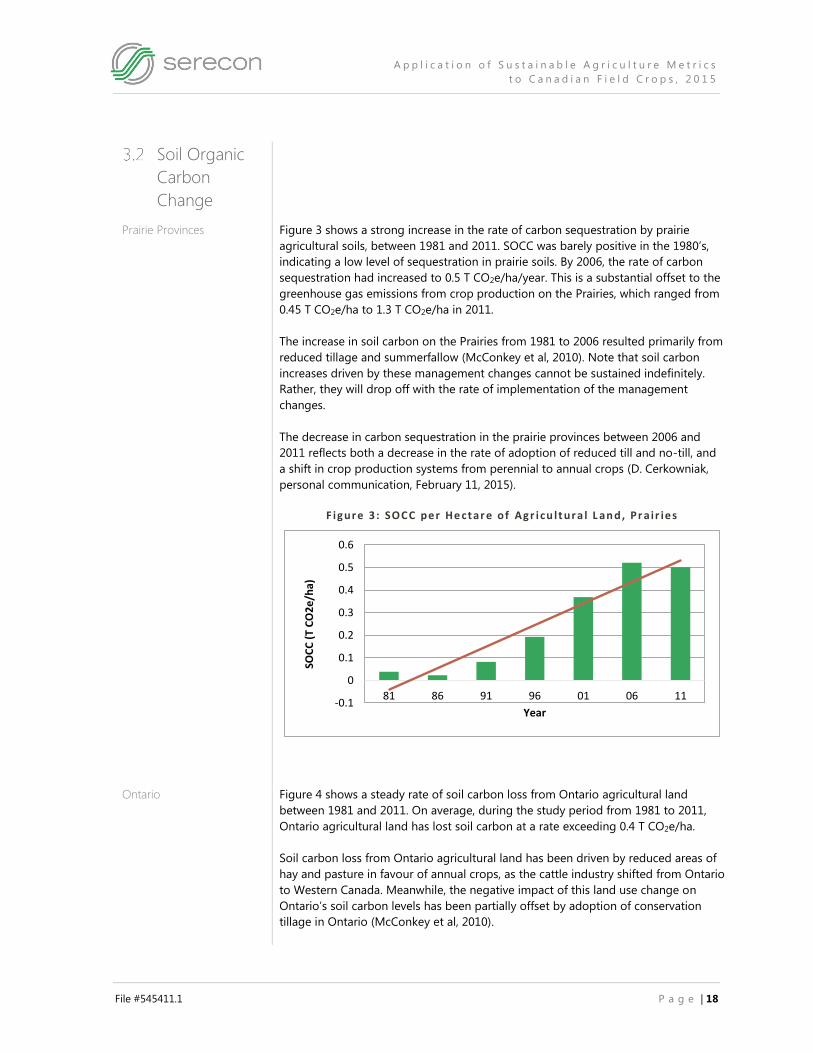
A p p l i c a t i o n o f S u s t a i n a b l e A g r i c u l t u r e M e t r i c s
t o C a n a d i a n F i e l d C r o p s , 2 0 1 5
File #545411.1 P a g e | 18
Soil Organic
Carbon
Change
Prairie Provinces Figure 3 shows a strong increase in the rate of carbon sequestration by prairie
agricultural soils, between 1981 and 2011. SOCC was barely positive in the 1980’s,
indicating a low level of sequestration in prairie soils. By 2006, the rate of carbon
sequestration had increased to 0.5 T CO2e/ha/year. This is a substantial offset to the
greenhouse gas emissions from crop production on the Prairies, which ranged from
0.45 T CO2e/ha to 1.3 T CO2e/ha in 2011.
The increase in soil carbon on the Prairies from 1981 to 2006 resulted primarily from
reduced tillage and summerfallow (McConkey et al, 2010). Note that soil carbon
increases driven by these management changes cannot be sustained indefinitely.
Rather, they will drop off with the rate of implementation of the management
changes.
The decrease in carbon sequestration in the prairie provinces between 2006 and
2011 reflects both a decrease in the rate of adoption of reduced till and no-till, and
a shift in crop production systems from perennial to annual crops (D. Cerkowniak,
personal communication, February 11, 2015).
F igure 3: SOCC per He ctar e of Agr i cu lt ura l L an d, Pr a ir ies
Ontario Figure 4 shows a steady rate of soil carbon loss from Ontario agricultural land
between 1981 and 2011. On average, during the study period from 1981 to 2011,
Ontario agricultural land has lost soil carbon at a rate exceeding 0.4 T CO2e/ha.
Soil carbon loss from Ontario agricultural land has been driven by reduced areas of
hay and pasture in favour of annual crops, as the cattle industry shifted from Ontario
to Western Canada. Meanwhile, the negative impact of this land use change on
Ontario’s soil carbon levels has been partially offset by adoption of conservation
tillage in Ontario (McConkey et al, 2010).
-0.1
0
0.1
0.2
0.3
0.4
0.5
0.6
81 86 91 96 01 06 11
SOC
C (
T C
O2
e/h
a)
Year

A p p l i c a t i o n o f S u s t a i n a b l e A g r i c u l t u r e M e t r i c s
t o C a n a d i a n F i e l d C r o p s , 2 0 1 5
File #545411.1 P a g e | 19
F igure 4: SOCC per He ctar e of Agr i cu lt ura l L an d , On tar io
Differences Between the
Prairie and Ontario
Contexts Relevant to Soil
Organic Carbon Change
Losses of soil organic carbon can be slowed (or gains of soil organic carbon can be
increased) by the following practices (McConkey et al, 2010):
Decreasing soil erosion
Reducing tillage intensity
Reducing summerfallow
Using cover crops
Periodically producing forages and crops that leave large quantities of
residue
Historical practices, as well as recent practice changes, have a large impact on
current soil organic carbon levels in Canada. Prior to 1981, decades of tillage and
summerfallow practices on the Prairies had reduced soil carbon to very low levels.
Consequently, the adoption of improved management practices such as reduced
tillage and summerfallow had the effect of rebuilding this lost soil carbon since
1981. This situation contrasts with Ontario, where soil organic carbon levels
benefited from the use of land for production of forages (pasture and hayland),
prior to 1981. Shifting this land base into annual crops has had the effect of
lowering soil organic carbon levels in Ontario since 1981. Both historical and more
recent practices are important, and both must be taken into account to provide the
full context of the state of soil organic carbon in any given region.
Land Use Changes on the Prairies and in Ontario, between 1981 and 2006, have
had opposite impacts on SOCC as estimated by NAHARP, and as presented in this
report. These SOCC estimates are based on the area of agricultural land: agricultural
land, in this context, includes all land in crops, improved pasture and summerfallow
(but not unimproved pasture) (personal communication, D. Cerkowniak, 9 February,
2015). Significant land use changes include:
On Canada’s Prairies, between 1981 and 2006, summerfallow area declined by
64%, primarily resulting in an increased area of land in crops (T. Huffman and
W. Eilers, 2010). Area in crops increased by 19% during this time. Given the
-0.6
-0.5
-0.4
-0.3
-0.2
-0.1
0
81 86 91 96 01 06 11
SOC
C (
T C
O2
/ha)
Year

A p p l i c a t i o n o f S u s t a i n a b l e A g r i c u l t u r e M e t r i c s
t o C a n a d i a n F i e l d C r o p s , 2 0 1 5
File #545411.1 P a g e | 20
area basis defined above for SOCC estimation, this means that the area of
SOCC estimation on the Prairies has shifted to land uses increasingly
conducive to carbon sequestration (from summerfallow to land in crops).
Between 1981 and 2006, cattle numbers in Ontario declined by 32%, allowing
the area of pasture to be reduced by 48% (T. Huffman and W. Eilers, 2010).
Increases in the proportion of land in more intensive annual crops came from
this decrease in pasture, and from decreases in idle land. Given the land base
defined above for estimation of SOCC, this means that agricultural land in
Ontario shifted toward uses increasingly conducive to loss of soil carbon
(from pasture to land in crops).
Land Management Changes. The use of conservation and no-till on cropped land
more than doubled in Canada between 1991 and 2006 (T. Huffman and W. Eilers,
2010). This trend has had a positive impact on SOCC both on the Prairies and in
Ontario.
On the Prairies, the area under conventional till decreased by 62% between
1991 and 2006
In Ontario, the area under conventional till decreased by 39% between 1991
and 2006
Approaches to reducing tillage need to be specific to different regions of Canada
(Soil Conservation Council of Canada, 2004). The benefits of seeding directly into
wheat and barley stubble in Western Canada have been widely demonstrated.
However, in Eastern Canada, where different crops are produced, under higher-
moisture weather conditions, different approaches need to be evaluated.
In summary, the 1981-2011 study period has seen benefits to soil organic carbon
levels resulting from adoption of reduced tillage, by producers on the Prairies and in
Ontario. At the same time, land use changes relating to shifts in production have
affected the Prairies and Ontario asymmetrically. In Ontario, pasture has given way
to annual crops, due to economic factors external to the individual producer that
have caused the cattle industry to shift westward, and Ontario production to shift
from perennial to more profitable annual crops. This land use change has been
detrimental to soil carbon levels. Meanwhile, on the Prairies, reduced use of
summerfallow has been beneficial to soil carbon levels.
Soil Management Practices. A variety of practices are being used by Ontario
producers to maintain and build soil carbon levels. As identified above, the
modelling of soil carbon change reported here accounts for changes in tillage,
summerfallow, and annual vs. perennial crop production. Ideally, soil management
practices that maintain and increase soil carbon levels would also be modelled, but,
to date, this analysis is not available. Consequently, important soil management
practices that are becoming prevalent in Ontario are not reflected in the indicators
in this report.
A p p l i c a t i o n o f S u s t a i n a b l e A g r i c u l t u r e M e t r i c s
t o C a n a d i a n F i e l d C r o p s , 2 0 1 5
File #545411.1 P a g e | 21
The following practices are part of a strong movement in Ontario to maintain and
build soil carbon levels (C. Brown, personal communication, July 10, 2015):
Use of cover crops that add organic matter to the soil (e.g. grasses that have
extensive, fibrous root systems)
Crop rotations including forages (e.g. red clover) and cereals
Addition of organic amendments, including manure, compost, biosolids
Crop residue management
The following observations provide an estimate of the extent of implementation of
some of these practices in Ontario (C. Brown, personal communication, July 17,
2015):
About a million acres of winter wheat is planned each fall (this goal is not
always reached, depending on soybean harvest/planting conditions)
The majority of cash crop farms have some winter wheat in rotation, and
most have some red clover as a cover crop. Other cover crops are also
coming into use, e.g. oats, cereal rye, oilseed radish and crimson clover and
cover crop mixes.
Dairy farms contribute substantially to sustainability by using rotations with
coverage from alfalfa/grass forage stands for 3 or 4 years. A typical dairy
rotation is: grain corn – silage corn (or soybeans) – cereals (oats/barley)
underseeded to alfalfa/grass mix – forage – forage. As well, manure is applied
to forage crops immediately after harvest, and ahead of corn crops in fall
and/or spring.
Biosolids and compost are applied mainly to cash crop fields ahead of corn,
adding significant organic matter to fields that otherwise would receive none
Residue management is increasing, and varies by location within Ontario.
Much residue management consists of no-till soybeans and no-till wheat, but
there is also some more aggressive tillage ahead of corn (in a corn – soy –
wheat rotation) to deal with the wheat straw and/or cover crop.
Energy Use
Indicator
Canada-wide, energy use has remained fairly constant over the past 30 years.
Included in this is energy used for synthesis of nitrogen fertilizers, and for field
operations. Synthesis of nitrogen fertilizers has increased substantially over the
study period, as consumption of nitrogen fertilizers has increased. Energy use for
field operations has fallen significantly over the study period, primarily due to
adoption of reduced and no-till by Canadian farmers, and also due to development
of more efficient machinery. Over time, energy costs from increased use of nitrogen
fertilizer and energy savings from reduced tillage have largely offset each other
(Verge and Dyer, 2014).
The carbon footprints of the legumes were significantly lower than those of the
non-legume crops, as a result of not needing to apply as much synthetic nitrogen
fertilizer. The highest CO2 emission intensities were for corn, winter wheat and
canola, again owing to their high requirememts for nitrogen fertilizer (Verge and
Dyer, 2014).
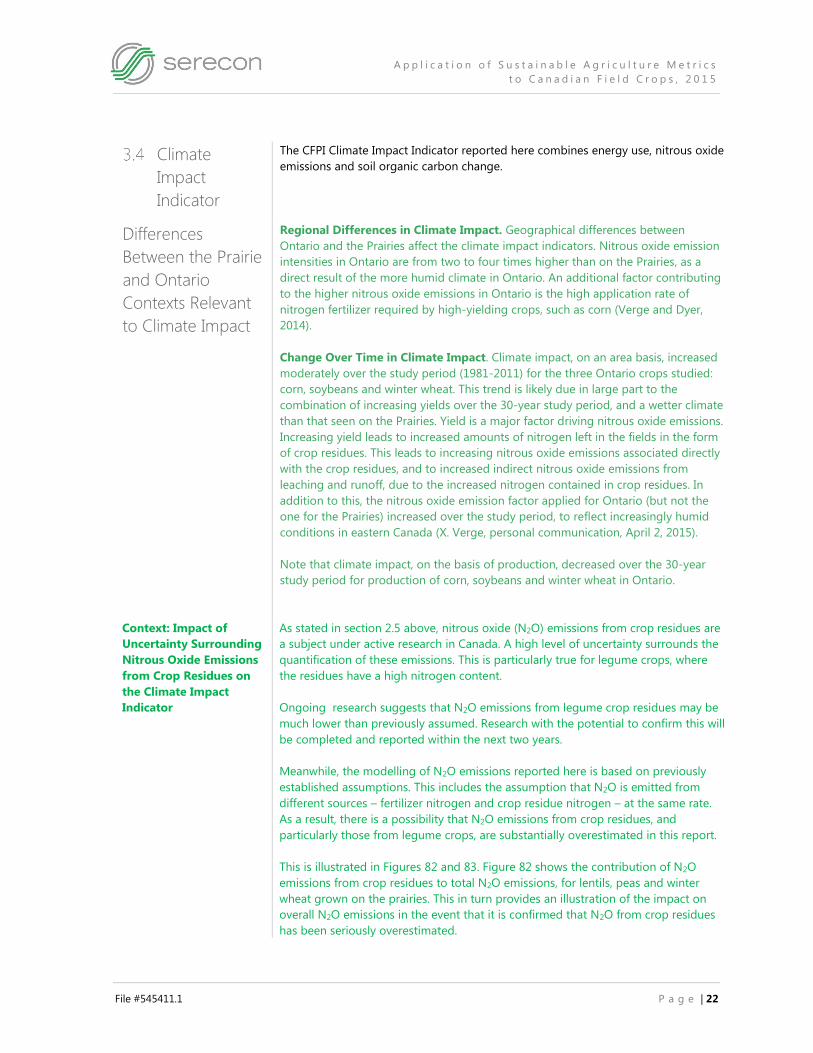
A p p l i c a t i o n o f S u s t a i n a b l e A g r i c u l t u r e M e t r i c s
t o C a n a d i a n F i e l d C r o p s , 2 0 1 5
File #545411.1 P a g e | 22
Climate
Impact
Indicator
The CFPI Climate Impact Indicator reported here combines energy use, nitrous oxide
emissions and soil organic carbon change.
Differences
Between the Prairie
and Ontario
Contexts Relevant
to Climate Impact
Regional Differences in Climate Impact. Geographical differences between
Ontario and the Prairies affect the climate impact indicators. Nitrous oxide emission
intensities in Ontario are from two to four times higher than on the Prairies, as a
direct result of the more humid climate in Ontario. An additional factor contributing
to the higher nitrous oxide emissions in Ontario is the high application rate of
nitrogen fertilizer required by high-yielding crops, such as corn (Verge and Dyer,
2014).
Change Over Time in Climate Impact. Climate impact, on an area basis, increased
moderately over the study period (1981-2011) for the three Ontario crops studied:
corn, soybeans and winter wheat. This trend is likely due in large part to the
combination of increasing yields over the 30-year study period, and a wetter climate
than that seen on the Prairies. Yield is a major factor driving nitrous oxide emissions.
Increasing yield leads to increased amounts of nitrogen left in the fields in the form
of crop residues. This leads to increasing nitrous oxide emissions associated directly
with the crop residues, and to increased indirect nitrous oxide emissions from
leaching and runoff, due to the increased nitrogen contained in crop residues. In
addition to this, the nitrous oxide emission factor applied for Ontario (but not the
one for the Prairies) increased over the study period, to reflect increasingly humid
conditions in eastern Canada (X. Verge, personal communication, April 2, 2015).
Note that climate impact, on the basis of production, decreased over the 30-year
study period for production of corn, soybeans and winter wheat in Ontario.
Context: Impact of
Uncertainty Surrounding
Nitrous Oxide Emissions
from Crop Residues on
the Climate Impact
Indicator
As stated in section 2.5 above, nitrous oxide (N2O) emissions from crop residues are
a subject under active research in Canada. A high level of uncertainty surrounds the
quantification of these emissions. This is particularly true for legume crops, where
the residues have a high nitrogen content.
Ongoing research suggests that N2O emissions from legume crop residues may be
much lower than previously assumed. Research with the potential to confirm this will
be completed and reported within the next two years.
Meanwhile, the modelling of N2O emissions reported here is based on previously
established assumptions. This includes the assumption that N2O is emitted from
different sources – fertilizer nitrogen and crop residue nitrogen – at the same rate.
As a result, there is a possibility that N2O emissions from crop residues, and
particularly those from legume crops, are substantially overestimated in this report.
This is illustrated in Figures 82 and 83. Figure 82 shows the contribution of N2O
emissions from crop residues to total N2O emissions, for lentils, peas and winter
wheat grown on the prairies. This in turn provides an illustration of the impact on
overall N2O emissions in the event that it is confirmed that N2O from crop residues
has been seriously overestimated.

A p p l i c a t i o n o f S u s t a i n a b l e A g r i c u l t u r e M e t r i c s
t o C a n a d i a n F i e l d C r o p s , 2 0 1 5
File #545411.1 P a g e | 23
F igure 82: N itr ou s O x ide per T o nne ( T CO 2 e /T on ne ) – Len t i ls , Peas a nd Winter Whe at , Pr a ir ies
As seen in Figure 82, a high proportion of N2O emissions from production of
legume crops is attributed to crop residues in our analysis – almost a half for lentils,
and over half for peas. A considerably lower share of N2O emissions from winter
wheat production is attributed to crop residues – well under half. Thus, of these
three crops, a future reduction of the estimated N2O emissions from crop residues
will reduce climate estimates most for peas, and least for winter wheat.
In Figure 83, Ontario production of soybeans and winter wheat are compared in the
same way. About a third of winter wheat’s N2O emissions, and almost all of the N2O
emissions of soybeans, are attributed to crop residues. If N2O emissions from crop
residues are indeed overestimated, then N2O emissions from winter wheat
production may be significantly less than estimated here, but N2O emissions from
soybean production could, in reality, be only a fraction of the estimates in this
report.
F igure 83: N itr ou s O x ide per T o nne ( T CO 2 e /T on ne ) – Soyb ean s a n d Wi nter Whe at , O ntar io
0
0.05
0.1
0.15
0.2
0.25
0.3
81 86 91 96 01 06 11
Lentils with CR Lentils w/o CR Peas with CR
Peas w/o CR W Wheat with CR W Wheat w/o CR
0
0.05
0.1
0.15
0.2
0.25
0.3
0.35
81 86 91 96 01 06 11
Soy with CR Soy w/o CR
W Wheat with CR W Wheat w/o CR

A p p l i c a t i o n o f S u s t a i n a b l e A g r i c u l t u r e M e t r i c s
t o C a n a d i a n F i e l d C r o p s , 2 0 1 5
File #545411.1 P a g e | 24
Of all the crops studied here, the uncertainty around N2O emissions from crop
residues has much the strongest impact on soybeans. As a crop where fertilizer
nitrogen is assumed to be absent (Yang et al, 2007), N2O emissions from soybean
production are strongly dominated by crop residues. If crop residue N2O emissions
are overestimated, then soybeans will be the most extreme case of the resulting
overestimation of climate impact.
It should also be noted that soybean production has among the lowest overall
estimated N2O emissions of the crops studied here. As well, soybeans have largely
replaced wheat and corn in Ontario, and wheat and canola in Manitoba. To this
extent, soybean production has been good for agriculture’s climate impact, as a
result of replacing crops whose production involves higher N2O emissions.

A p p l i c a t i o n o f S u s t a i n a b l e A g r i c u l t u r e M e t r i c s
t o C a n a d i a n F i e l d C r o p s , 2 0 1 5
File #545411.1 P a g e | 25
Spring Wheat,
Prairie
Provinces
Land Use Indicator The trend in the efficiency of land use in the production of spring wheat is clearly
seen in Figures 5 and 6, which allow us to observe the changes over a period of 30
years. Agronomic developments have led to substantial yield improvements,
resulting in a much more effective and efficient use of the production land base.
These yield improvements are seen in Figure 5, which shows steady increases in the
yield of spring wheat from 1981 to 2011. Expressed per unit of spring wheat
produced, land use efficiency has improved by 35% (Figure 6) over the same period.
F igure 5: Spr ing W hea t , P ra ir ies - To nne s per Har ve s ted He ct are
F igure 6: Spr ing W hea t , P ra ir ies - Har ves ted He ct ar es per T on ne
0
0.5
1
1.5
2
2.5
3
3.5
81 86 91 96 01 06 11
Yie
ld (
T/h
a)
Year
0
0.1
0.2
0.3
0.4
0.5
0.6
81 86 91 96 01 06 11
Lan
d U
se (
ha/
T)
Year
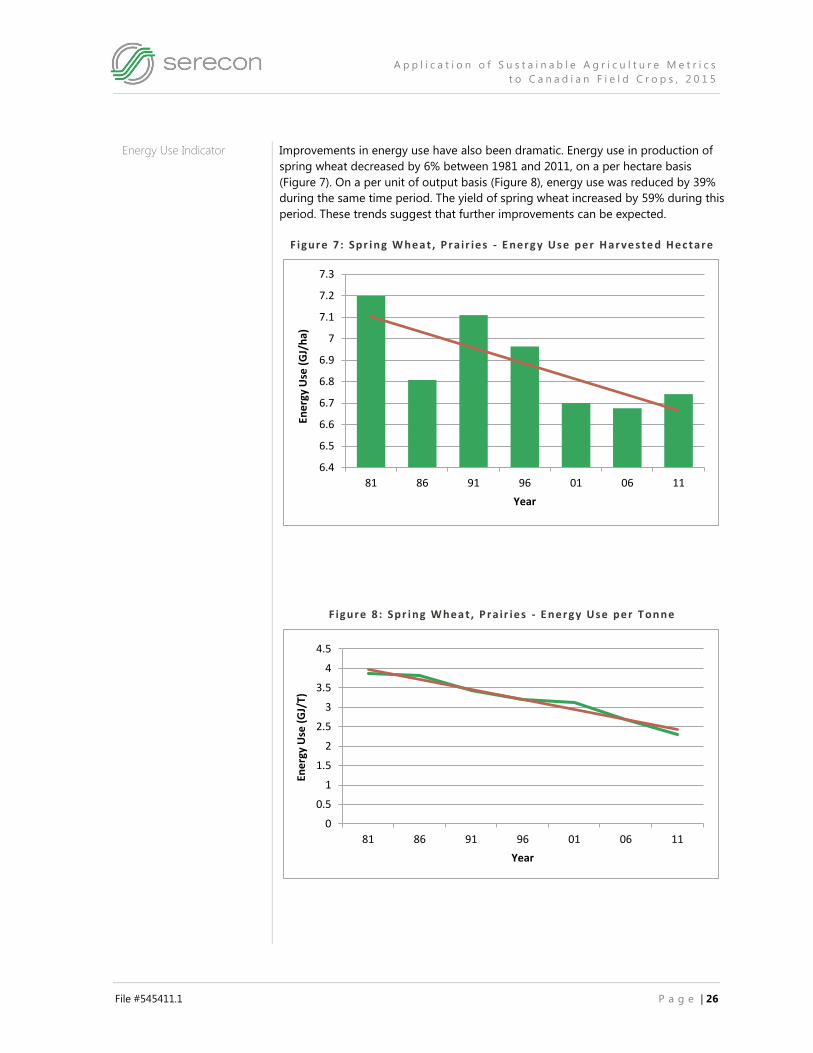
A p p l i c a t i o n o f S u s t a i n a b l e A g r i c u l t u r e M e t r i c s
t o C a n a d i a n F i e l d C r o p s , 2 0 1 5
File #545411.1 P a g e | 26
Energy Use Indicator Improvements in energy use have also been dramatic. Energy use in production of
spring wheat decreased by 6% between 1981 and 2011, on a per hectare basis
(Figure 7). On a per unit of output basis (Figure 8), energy use was reduced by 39%
during the same time period. The yield of spring wheat increased by 59% during this
period. These trends suggest that further improvements can be expected.
F igure 7: Spr ing W hea t , P ra ir ies - E nergy Use per H arve s te d H ec tare
F igure 8: Spr ing W hea t , P ra ir ies - E nergy Use per T on ne
6.4
6.5
6.6
6.7
6.8
6.9
7
7.1
7.2
7.3
81 86 91 96 01 06 11
Ene
rgy
Use
(G
J/h
a)
Year
0
0.5
1
1.5
2
2.5
3
3.5
4
4.5
81 86 91 96 01 06 11
Ene
rgy
Use
(G
J/T)
Year
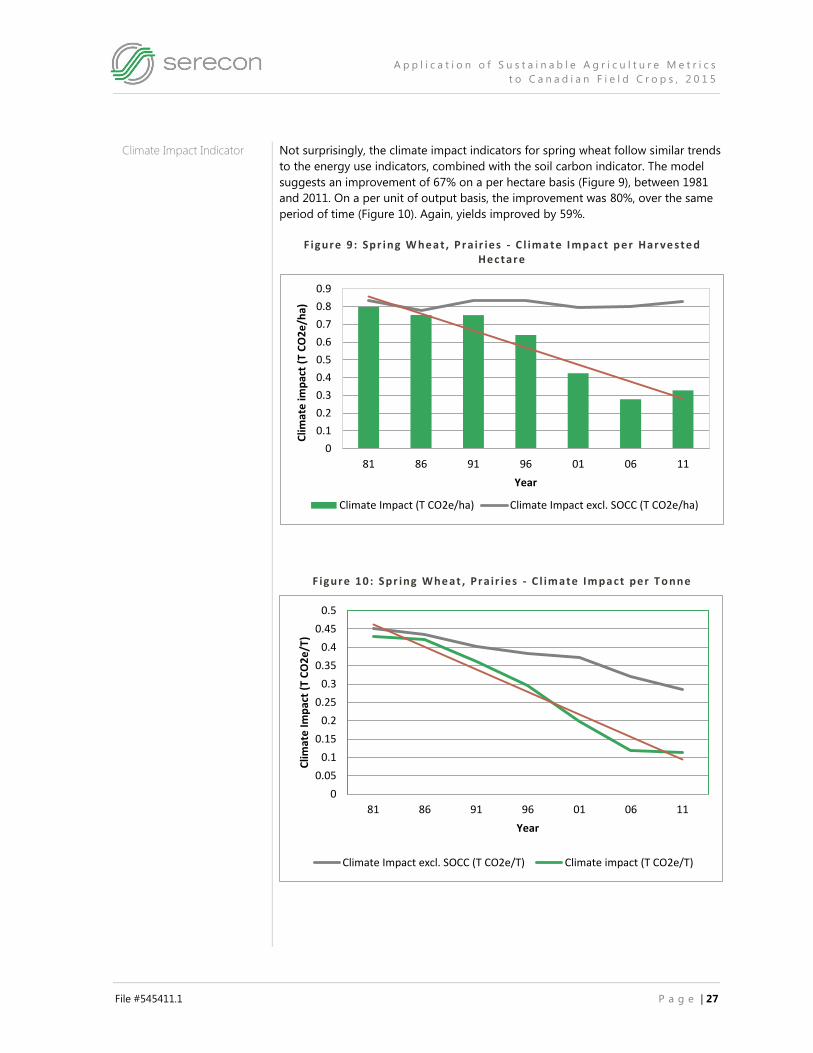
A p p l i c a t i o n o f S u s t a i n a b l e A g r i c u l t u r e M e t r i c s
t o C a n a d i a n F i e l d C r o p s , 2 0 1 5
File #545411.1 P a g e | 27
Climate Impact Indicator Not surprisingly, the climate impact indicators for spring wheat follow similar trends
to the energy use indicators, combined with the soil carbon indicator. The model
suggests an improvement of 67% on a per hectare basis (Figure 9), between 1981
and 2011. On a per unit of output basis, the improvement was 80%, over the same
period of time (Figure 10). Again, yields improved by 59%.
F igure 9: Spr ing W hea t , P ra ir ies - C l ima te I mp ac t p er Har ve ste d Hec tare
F igure 10: Spr ing Whe at , Pra ir ies - C l im ate Im pa ct per T o nne
0
0.1
0.2
0.3
0.4
0.5
0.6
0.7
0.8
0.9
81 86 91 96 01 06 11
Clim
ate
imp
act
(T C
O2
e/h
a)
Year
Climate Impact (T CO2e/ha) Climate Impact excl. SOCC (T CO2e/ha)
0
0.05
0.1
0.15
0.2
0.25
0.3
0.35
0.4
0.45
0.5
81 86 91 96 01 06 11
Clim
ate
Imp
act
(T C
O2
e/T
)
Year
Climate Impact excl. SOCC (T CO2e/T) Climate impact (T CO2e/T)
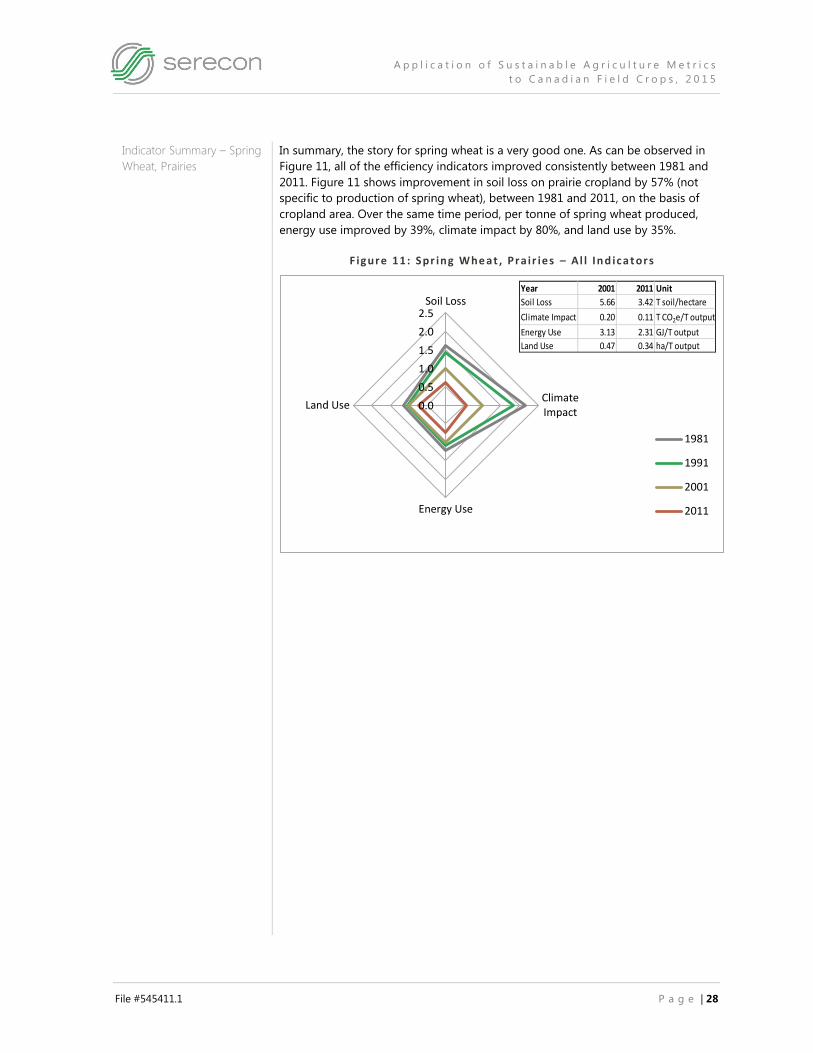
A p p l i c a t i o n o f S u s t a i n a b l e A g r i c u l t u r e M e t r i c s
t o C a n a d i a n F i e l d C r o p s , 2 0 1 5
File #545411.1 P a g e | 28
Indicator Summary – Spring
Wheat, Prairies
In summary, the story for spring wheat is a very good one. As can be observed in
Figure 11, all of the efficiency indicators improved consistently between 1981 and
2011. Figure 11 shows improvement in soil loss on prairie cropland by 57% (not
specific to production of spring wheat), between 1981 and 2011, on the basis of
cropland area. Over the same time period, per tonne of spring wheat produced,
energy use improved by 39%, climate impact by 80%, and land use by 35%.
F igure 11: Spr ing Whe at , Pra ir ies – A l l In d ic a t ors
0.0
0.5
1.0
1.5
2.0
2.5Soil Loss
ClimateImpact
Energy Use
Land Use
1981
1991
2001
2011
Year 2001 2011 Unit
Soil Loss 5.66 3.42 T soil/hectare
Climate Impact 0.20 0.11 T CO2e/T output
Energy Use 3.13 2.31 GJ/T output
Land Use 0.47 0.34 ha/T output
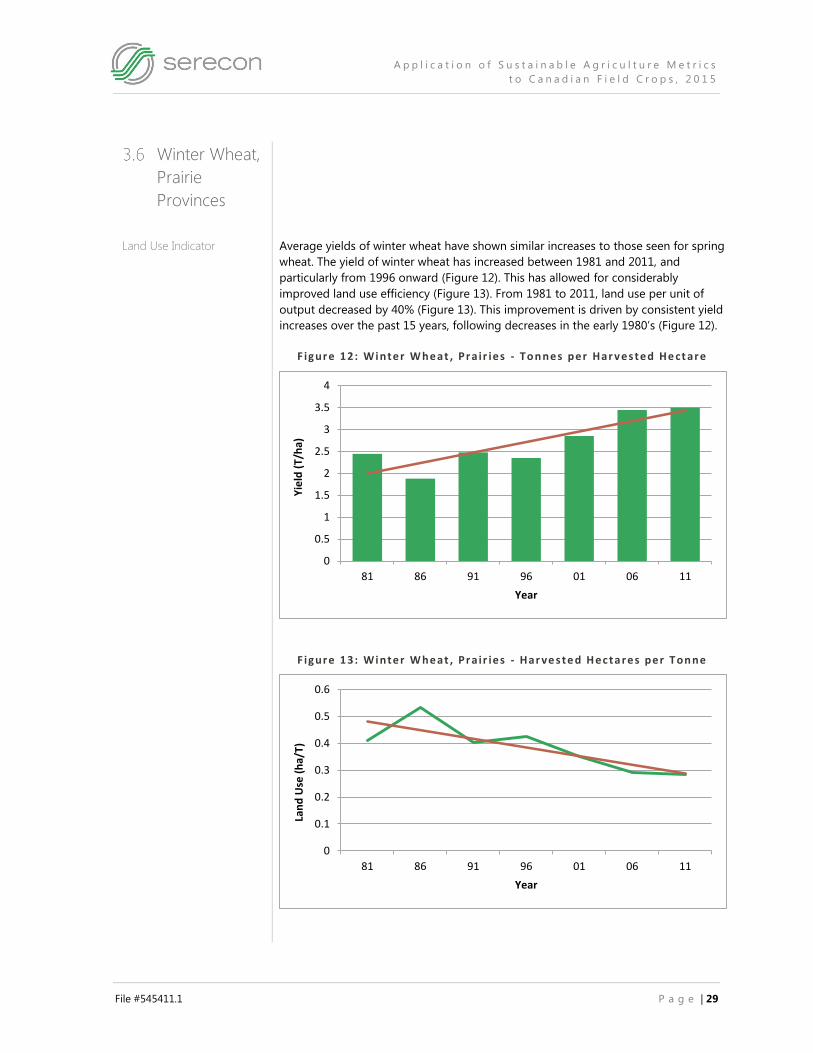
A p p l i c a t i o n o f S u s t a i n a b l e A g r i c u l t u r e M e t r i c s
t o C a n a d i a n F i e l d C r o p s , 2 0 1 5
File #545411.1 P a g e | 29
Winter Wheat,
Prairie
Provinces
Land Use Indicator Average yields of winter wheat have shown similar increases to those seen for spring
wheat. The yield of winter wheat has increased between 1981 and 2011, and
particularly from 1996 onward (Figure 12). This has allowed for considerably
improved land use efficiency (Figure 13). From 1981 to 2011, land use per unit of
output decreased by 40% (Figure 13). This improvement is driven by consistent yield
increases over the past 15 years, following decreases in the early 1980’s (Figure 12).
F igure 12: Winter W heat , Pra ir ies - To n nes per Har vested He ct are
F igure 13: Winter W heat , Pra ir ies - Har ve ste d H ec ta res per T on ne
0
0.5
1
1.5
2
2.5
3
3.5
4
81 86 91 96 01 06 11
Yie
ld (
T/h
a)
Year
0
0.1
0.2
0.3
0.4
0.5
0.6
81 86 91 96 01 06 11
Lan
d U
se (
ha/
T)
Year

A p p l i c a t i o n o f S u s t a i n a b l e A g r i c u l t u r e M e t r i c s
t o C a n a d i a n F i e l d C r o p s , 2 0 1 5
File #545411.1 P a g e | 30
Energy Use Indicator The use of energy in winter wheat production on the Prairies has decreased by 11%
from 1981 to 2011, on a per hectare basis (Figure 14). Over the same period, energy
use per unit of output has improved by 48% (Figure 15). Energy use per unit of
output actually increased between 1981 and 1986, but has improved dramatically
since 1986.
F igure 14: Winter W heat , Pra ir ies - E nergy U se per Har ves ted He ct are
F igure 15: Winter W heat , Pra ir ies - E nergy U se per To nne
0
1
2
3
4
5
6
7
8
9
10
81 86 91 96 01 06 11
Ene
rgy
Use
(G
J/h
a)
Year
0
0.5
1
1.5
2
2.5
3
3.5
4
4.5
5
81 86 91 96 01 06 11
Ene
rgy
Use
(G
J/T)
Year
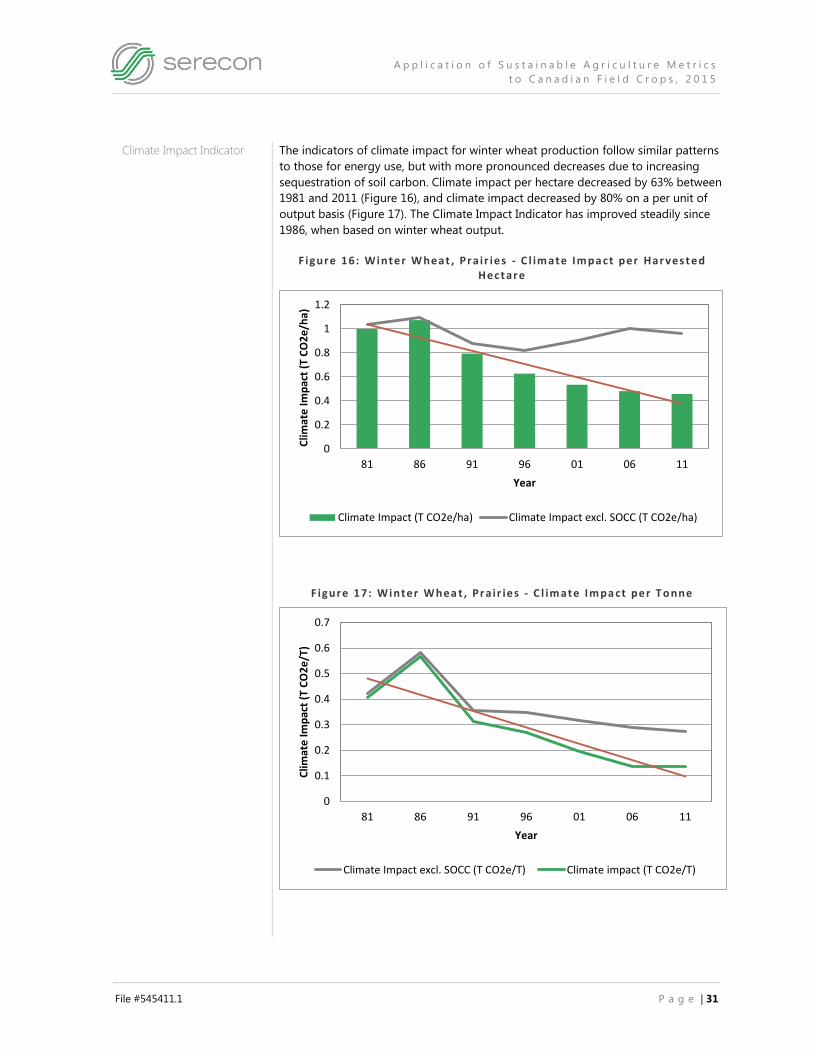
A p p l i c a t i o n o f S u s t a i n a b l e A g r i c u l t u r e M e t r i c s
t o C a n a d i a n F i e l d C r o p s , 2 0 1 5
File #545411.1 P a g e | 31
Climate Impact Indicator The indicators of climate impact for winter wheat production follow similar patterns
to those for energy use, but with more pronounced decreases due to increasing
sequestration of soil carbon. Climate impact per hectare decreased by 63% between
1981 and 2011 (Figure 16), and climate impact decreased by 80% on a per unit of
output basis (Figure 17). The Climate Impact Indicator has improved steadily since
1986, when based on winter wheat output.
F igure 16: Winter W heat , Pra ir ies - C l im ate Im pa ct per Har ves t ed Hec tare
F igure 17: Winter W hea t , Pra ir ies - C l im ate Im pa ct per T o nne
0
0.2
0.4
0.6
0.8
1
1.2
81 86 91 96 01 06 11
Clim
ate
Imp
act
(T C
O2
e/h
a)
Year
Climate Impact (T CO2e/ha) Climate Impact excl. SOCC (T CO2e/ha)
0
0.1
0.2
0.3
0.4
0.5
0.6
0.7
81 86 91 96 01 06 11
Clim
ate
Imp
act
(T C
O2
e/T
)
Year
Climate Impact excl. SOCC (T CO2e/T) Climate impact (T CO2e/T)
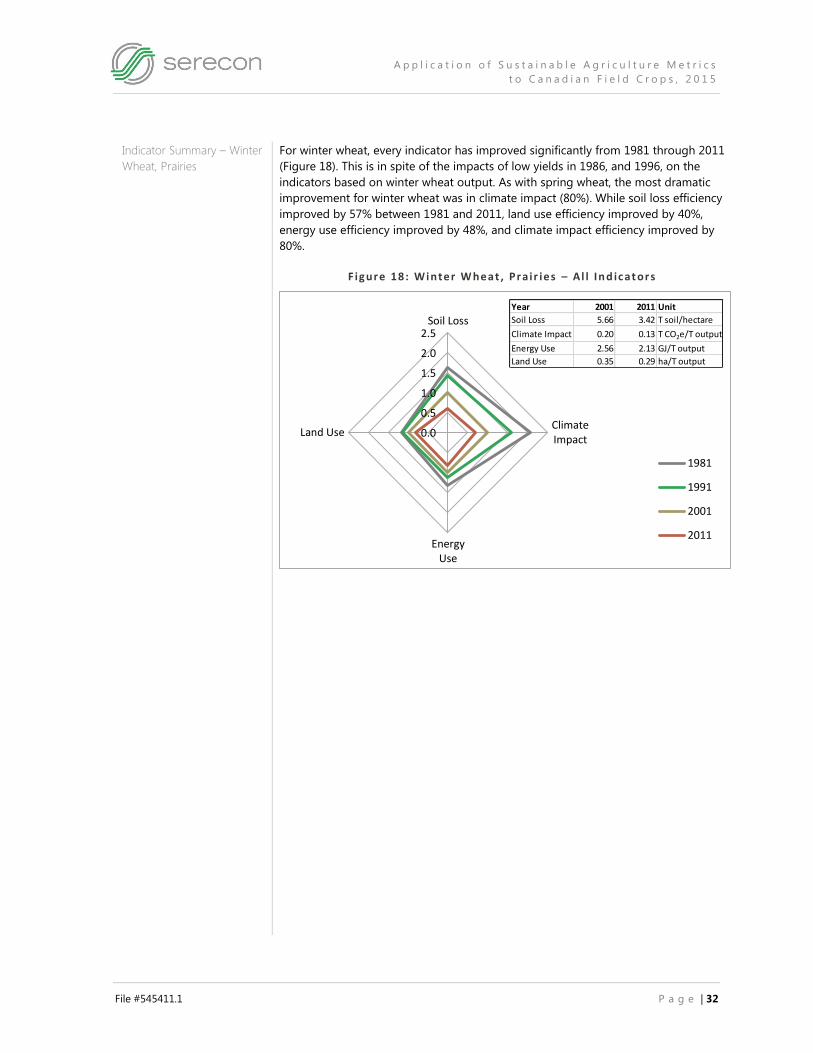
A p p l i c a t i o n o f S u s t a i n a b l e A g r i c u l t u r e M e t r i c s
t o C a n a d i a n F i e l d C r o p s , 2 0 1 5
File #545411.1 P a g e | 32
Indicator Summary – Winter
Wheat, Prairies
For winter wheat, every indicator has improved significantly from 1981 through 2011
(Figure 18). This is in spite of the impacts of low yields in 1986, and 1996, on the
indicators based on winter wheat output. As with spring wheat, the most dramatic
improvement for winter wheat was in climate impact (80%). While soil loss efficiency
improved by 57% between 1981 and 2011, land use efficiency improved by 40%,
energy use efficiency improved by 48%, and climate impact efficiency improved by
80%.
F igure 18: Winter W heat , Pra ir ies – A l l In d ic at ors
0.0
0.5
1.0
1.5
2.0
2.5Soil Loss
ClimateImpact
EnergyUse
Land Use
1981
1991
2001
2011
Year 2001 2011 Unit
Soil Loss 5.66 3.42 T soil/hectare
Climate Impact 0.20 0.13 T CO2e/T output
Energy Use 2.56 2.13 GJ/T output
Land Use 0.35 0.29 ha/T output
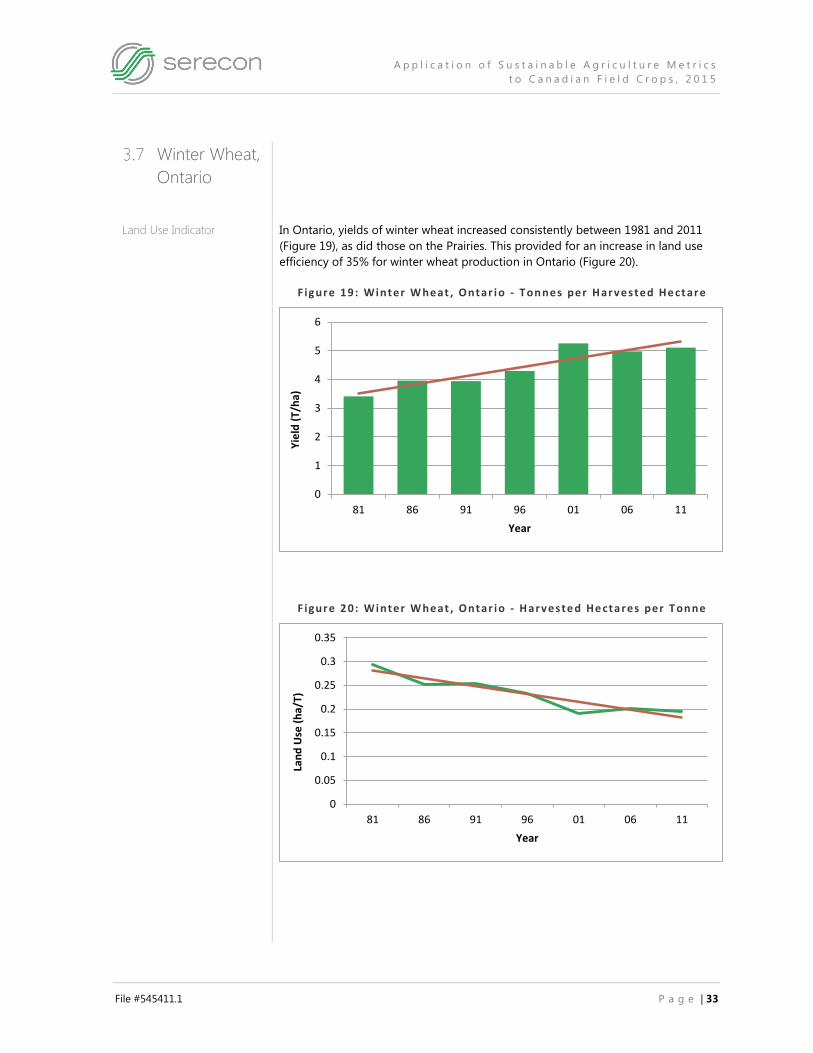
A p p l i c a t i o n o f S u s t a i n a b l e A g r i c u l t u r e M e t r i c s
t o C a n a d i a n F i e l d C r o p s , 2 0 1 5
File #545411.1 P a g e | 33
Winter Wheat,
Ontario
Land Use Indicator In Ontario, yields of winter wheat increased consistently between 1981 and 2011
(Figure 19), as did those on the Prairies. This provided for an increase in land use
efficiency of 35% for winter wheat production in Ontario (Figure 20).
F igure 19: Winter W heat , Ontar io - T on nes per H arvested He ct are
F igure 20: Winter W heat , Ontar io - H arveste d He cta res per T on ne
0
1
2
3
4
5
6
81 86 91 96 01 06 11
Yie
ld (
T/h
a)
Year
0
0.05
0.1
0.15
0.2
0.25
0.3
0.35
81 86 91 96 01 06 11
Lan
d U
se (
ha/
T)
Year

A p p l i c a t i o n o f S u s t a i n a b l e A g r i c u l t u r e M e t r i c s
t o C a n a d i a n F i e l d C r o p s , 2 0 1 5
File #545411.1 P a g e | 34
Energy Use Indicator For winter wheat production in Ontario, energy use on the basis of harvested area
was almost level between 1981 and 2011. An increase of 1% was seen over the study
period (Figure 21). On the basis of winter wheat production, given the steady
improvements in yield, energy use improved by 34% (Figure 22).
F igure 21: Winter W heat , Ontar io – E nergy Use per Har ves ted He ct are
F igure 22: Winter W heat , Ontar io – E nergy Use pe r To nne
9.4
9.6
9.8
10
10.2
10.4
10.6
10.8
11
81 86 91 96 01 06 11
Ene
rgy
Use
(G
J/h
a)
Year
0
0.5
1
1.5
2
2.5
3
3.5
81 86 91 96 01 06 11
Ene
rgy
Use
(G
J/T)
Year

A p p l i c a t i o n o f S u s t a i n a b l e A g r i c u l t u r e M e t r i c s
t o C a n a d i a n F i e l d C r o p s , 2 0 1 5
File #545411.1 P a g e | 35
Climate Impact Indicator Climate Impact for winter wheat production in Ontario shows similar trends over
time to energy use. As seen in Figure 23, climate impact for winter wheat in Ontario
increased moderately – by 9% – on the basis of harvested area, between 1981 and
2011. On the basis of winter wheat produced (Figure 24), climate impact decreased
by 30% between 1981 and 2011.
F igure 23: Winter W heat , Ontar io – C l ima te I mp ac t per Har ves t ed Hec tare
F igure 24: Winter W heat , Ontar io – C l ima te I mp ac t per T o nne
0
0.5
1
1.5
2
2.5
3
81 86 91 96 01 06 11
Clim
ate
Imp
act
(T C
O2
e/h
a)
Year
Climate Impact (T CO2e/ha) Climate Impact excl. SOCC (T CO2e/ha)
0
0.1
0.2
0.3
0.4
0.5
0.6
0.7
81 86 91 96 01 06 11
Clim
ate
Imp
act
(T C
O2
e/T
)
Year
Climate Impact excl. SOCC (T CO2e/T) Climate impact (T CO2e/T)

A p p l i c a t i o n o f S u s t a i n a b l e A g r i c u l t u r e M e t r i c s
t o C a n a d i a n F i e l d C r o p s , 2 0 1 5
File #545411.1 P a g e | 36
Indicator Summary – Winter
Wheat, Ontario
Figure 25 shows the improvement in all the output-based indicators for winter
wheat production in Ontario, from 1981 to 2011. Soil loss for winter wheat
production in Ontario decreased by 25%, on the basis of cropland area. Meanwhile,
on the basis of crop output, land use improved by 35%, energy use improved by
34%, and climate impact improved by 30%.
F igure 25: Winter W heat , Ontar io – A l l I nd icat ors
0.0
0.5
1.0
1.5
2.0Soil Loss
ClimateImpact
EnergyUse
Land Use
1981
1991
2001
2011
Year 2001 2011 Unit
Soil Loss 22.39 20.66 T soil/hectare
Climate Impact 0.44 0.47 T CO2e/T output
Energy Use 2.02 2.07 GJ/T output
Land Use 0.19 0.20 ha/T output

A p p l i c a t i o n o f S u s t a i n a b l e A g r i c u l t u r e M e t r i c s
t o C a n a d i a n F i e l d C r o p s , 2 0 1 5
File #545411.1 P a g e | 37
Durum Wheat,
Prairie
Provinces
Land Use Indicator Yield of durum wheat on the Prairies has increased substantially between 1981 and
2011 (Figure 26). This has driven a 35% improvement in land use on a per unit of
output basis (Figure 27).
F igure 26: D uru m W heat , Pra ir ies - To n nes per Har vested He ct are
F igure 27: D uru m W heat , Pra ir ies - Har ve ste d H ec ta res per T on ne
0
0.5
1
1.5
2
2.5
3
81 86 91 96 01 06 11
Yie
ld (
T/h
a)
Year
0
0.1
0.2
0.3
0.4
0.5
0.6
0.7
0.8
81 86 91 96 01 06 11
Lan
d U
se (
ha/
T)
Year

A p p l i c a t i o n o f S u s t a i n a b l e A g r i c u l t u r e M e t r i c s
t o C a n a d i a n F i e l d C r o p s , 2 0 1 5
File #545411.1 P a g e | 38
Energy Use Indicator From 1981 to 2011, energy use for production of durum wheat showed a decrease
of 16% on a per hectare basis (Figure 28). Durum wheat yields increased by 54%
over this period (Figure 26). Driven by this yield increase, energy use on the basis of
production of durum improved by 46% from 1981 to 2011 (Figure 29).
F igure 28: D uru m W heat , Pra ir ies - E nergy U se per Har ves ted He ct are
F igure 29: D uru m W heat , Pra ir ies - E nergy U se per To nne
5
5.2
5.4
5.6
5.8
6
6.2
6.4
6.6
6.8
7
81 86 91 96 01 06 11
Ene
rgy
Use
(G
J/h
a)
Year
0
0.5
1
1.5
2
2.5
3
3.5
4
4.5
5
81 86 91 96 01 06 11
Ene
rgy
Use
(G
J/T)
Year
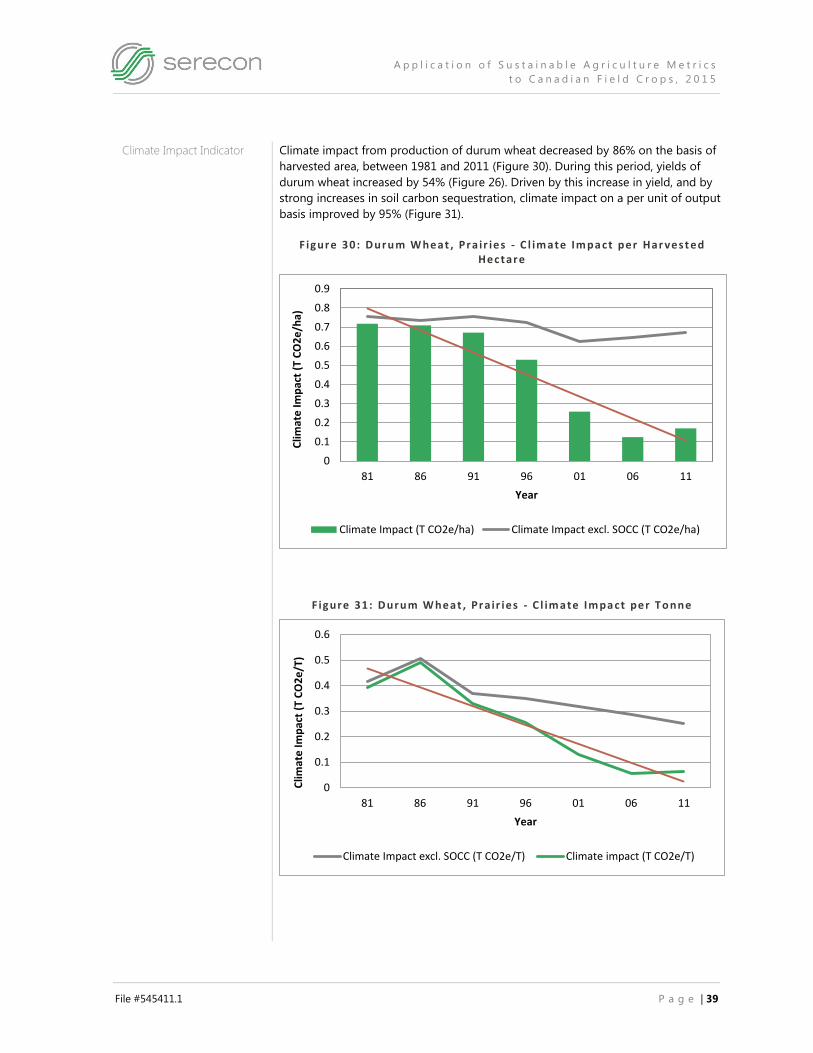
A p p l i c a t i o n o f S u s t a i n a b l e A g r i c u l t u r e M e t r i c s
t o C a n a d i a n F i e l d C r o p s , 2 0 1 5
File #545411.1 P a g e | 39
Climate Impact Indicator Climate impact from production of durum wheat decreased by 86% on the basis of
harvested area, between 1981 and 2011 (Figure 30). During this period, yields of
durum wheat increased by 54% (Figure 26). Driven by this increase in yield, and by
strong increases in soil carbon sequestration, climate impact on a per unit of output
basis improved by 95% (Figure 31).
F igure 30: D uru m W heat , Pra ir ies - C l im ate Im pa ct per Har ves t ed Hec tare
F igure 31: D uru m W heat , Pra ir ies - C l im ate Im pa ct per T o nne
0
0.1
0.2
0.3
0.4
0.5
0.6
0.7
0.8
0.9
81 86 91 96 01 06 11
Clim
ate
Imp
act
(T C
O2
e/h
a)
Year
Climate Impact (T CO2e/ha) Climate Impact excl. SOCC (T CO2e/ha)
0
0.1
0.2
0.3
0.4
0.5
0.6
81 86 91 96 01 06 11
Clim
ate
Imp
act
(T C
O2
e/T
)
Year
Climate Impact excl. SOCC (T CO2e/T) Climate impact (T CO2e/T)

A p p l i c a t i o n o f S u s t a i n a b l e A g r i c u l t u r e M e t r i c s
t o C a n a d i a n F i e l d C r o p s , 2 0 1 5
File #545411.1 P a g e | 40
Indicator Summary – Durum
Wheat, Prairies
As with production of spring and winter wheat, all four efficiency indicators for
durum wheat showed improvement between 1981 and 2011 (Figure 32). The
efficiency indicator showing the most improvement is that for climate impact (95%).
Soil loss (on the basis of all cropland area) improved by 57%. Meanwhile, on the
basis of durum wheat production, land use improved by 35%, and energy use
efficiency by 46%.
F igure 32: D uru m W heat , Pra ir ies – A l l In d ic at ors
0.0
1.0
2.0
3.0
4.0Soil Loss
ClimateImpact
EnergyUse
Land Use
1981
1991
2001
2011
Year 2001 2011 Unit
Soil Loss 5.66 3.42 T soil/hectare
Climate Impact 0.13 0.06 T CO2e/T output
Energy Use 2.90 2.18 GJ/T output
Land Use 0.51 0.37 ha/T output
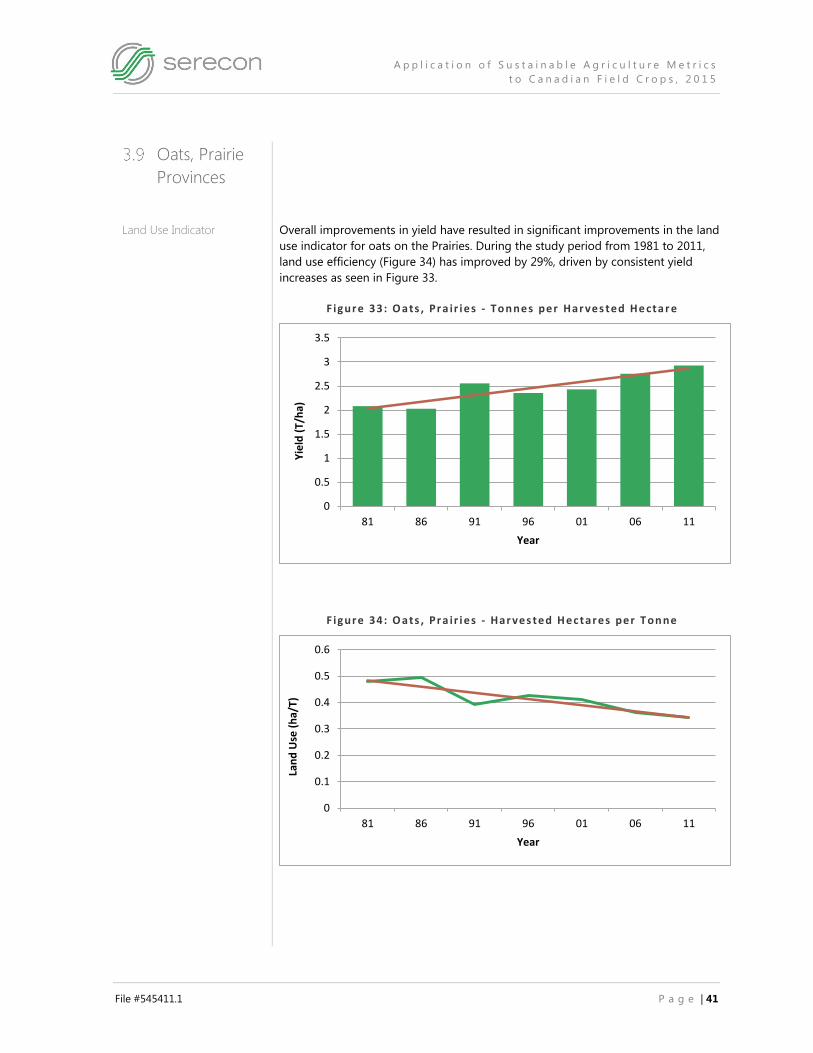
A p p l i c a t i o n o f S u s t a i n a b l e A g r i c u l t u r e M e t r i c s
t o C a n a d i a n F i e l d C r o p s , 2 0 1 5
File #545411.1 P a g e | 41
Oats, Prairie
Provinces
Land Use Indicator Overall improvements in yield have resulted in significant improvements in the land
use indicator for oats on the Prairies. During the study period from 1981 to 2011,
land use efficiency (Figure 34) has improved by 29%, driven by consistent yield
increases as seen in Figure 33.
F igure 33: O ats , Pra ir ies - To n nes per Har ves ted He cta r e
F igure 34: O ats , Pra ir ies - Har ves ted H ec tares per T on ne
0
0.5
1
1.5
2
2.5
3
3.5
81 86 91 96 01 06 11
Yie
ld (
T/h
a)
Year
0
0.1
0.2
0.3
0.4
0.5
0.6
81 86 91 96 01 06 11
Lan
d U
se (
ha/
T)
Year

A p p l i c a t i o n o f S u s t a i n a b l e A g r i c u l t u r e M e t r i c s
t o C a n a d i a n F i e l d C r o p s , 2 0 1 5
File #545411.1 P a g e | 42
Energy Use Indicator Energy use for oats improved by 14% between 1981 and 2011 on a per hectare
basis (Figure 35). When expressed on a per unit of output basis, this improvement
was approximately 39% (Figure 36).
Yield increases of 41% account for the difference between the two indicators, clearly
illustrating the impact of technological improvements in crop production on
sustainability. In addition, it is important to note that the percent improvement has
been fairly consistent from one period to the next. While it may be unrealistic to
suggest that this trend will continue, it certainly suggests that farmers have been
working hard to ensure their production makes effective use of energy inputs.
F igure 35: O ats , Pra ir ies - Energy Us e p er H ar veste d Hec tare
F igure 36: O ats , Pra ir ies - Energy Us e p er T o nne
6.2
6.4
6.6
6.8
7
7.2
7.4
7.6
7.8
8
81 86 91 96 01 06 11
Ene
rgy
Use
(G
J/h
a)
Year
0
0.5
1
1.5
2
2.5
3
3.5
4
4.5
81 86 91 96 01 06 11
Ene
rgy
Use
(G
J/T)
Year

A p p l i c a t i o n o f S u s t a i n a b l e A g r i c u l t u r e M e t r i c s
t o C a n a d i a n F i e l d C r o p s , 2 0 1 5
File #545411.1 P a g e | 43
Climate Impact Indicator The changes in the climate impact indicators for oats mirror those in the indicators
for energy use and soil carbon change. On a per hectare basis, climate impact from
production of oats dropped by 69% between 1981 and 2011 (Figure 37). On a per
unit of output basis, climate impact improved by 80% over the same time (Figure
38). This improvement in climate impact efficiency is driven by the yield increase of
41% (Figure 33) and strong increases in soil carbon sequestration.
F igure 37: O ats , Pra ir ies - C l im ate Im pa ct per Har ve s ted He ct are
F igure 38: O ats , Pra ir ies - C l im ate Im pa ct per To n n e
0
0.2
0.4
0.6
0.8
1
1.2
81 86 91 96 01 06 11
Clim
ate
Imp
act
(T C
O2
e/h
a)
Year
Climate Impact (T CO2e/ha) Climate Impact excl. SOCC (T CO2e/ha)
0
0.05
0.1
0.15
0.2
0.25
0.3
0.35
0.4
0.45
0.5
81 86 91 96 01 06 11
Clim
ate
Imp
act
(T C
O2
e/T
)
Year
Climate Impact excl. SOCC (T CO2e/T) Climate impact (T CO2e/T)
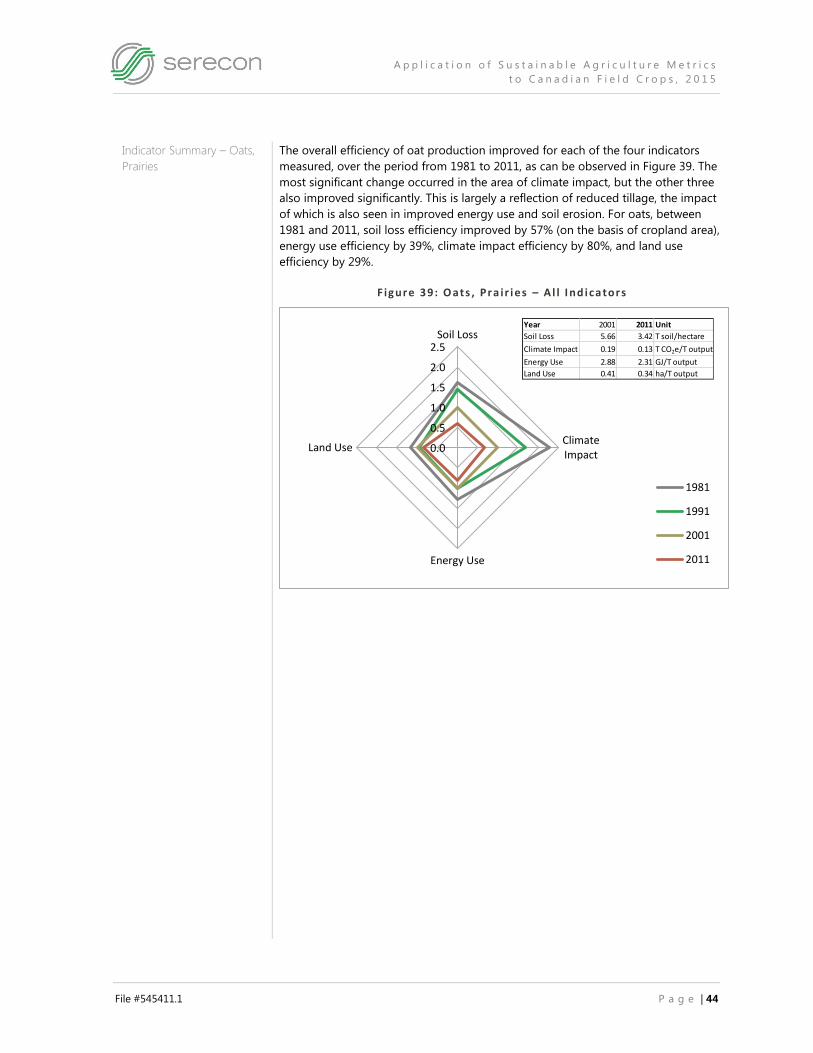
A p p l i c a t i o n o f S u s t a i n a b l e A g r i c u l t u r e M e t r i c s
t o C a n a d i a n F i e l d C r o p s , 2 0 1 5
File #545411.1 P a g e | 44
Indicator Summary – Oats,
Prairies
The overall efficiency of oat production improved for each of the four indicators
measured, over the period from 1981 to 2011, as can be observed in Figure 39. The
most significant change occurred in the area of climate impact, but the other three
also improved significantly. This is largely a reflection of reduced tillage, the impact
of which is also seen in improved energy use and soil erosion. For oats, between
1981 and 2011, soil loss efficiency improved by 57% (on the basis of cropland area),
energy use efficiency by 39%, climate impact efficiency by 80%, and land use
efficiency by 29%.
F igure 39: O ats , Pra ir ies – A l l I nd ica tors
0.0
0.5
1.0
1.5
2.0
2.5Soil Loss
ClimateImpact
Energy Use
Land Use
1981
1991
2001
2011
Year 2001 2011 Unit
Soil Loss 5.66 3.42 T soil/hectare
Climate Impact 0.19 0.13 T CO2e/T output
Energy Use 2.88 2.31 GJ/T output
Land Use 0.41 0.34 ha/T output

A p p l i c a t i o n o f S u s t a i n a b l e A g r i c u l t u r e M e t r i c s
t o C a n a d i a n F i e l d C r o p s , 2 0 1 5
File #545411.1 P a g e | 45
Peas, Prairie
Provinces
Land Use Indicator Land use efficiency for peas has improved by 18% in the period between 1981 and
2011 (Figure 41). This reflects overall improvement in yields for peas during the
same time frame (Figure 40). Note that the yield improvement for peas between
1981 and 2011 was significantly lower than that for most of the other crops. This
relatively small increase in yield results in relatively weak improvement in land use
efficiency for peas.
One factor that may have affected this indicator is the large increase in area planted
in peas. This area has increased from about 60,000 hectares in 1981 to over a million
hectares in the 2000’s, which suggests that production may be moving into areas
where yield potential is not as high. If this is the case, it would affect the increase in
yield as observed, and thus the land use efficiency indicator.
F igure 40: Peas , Pra ir ies - To n nes per Har ves ted He ctar e
F igure 41: Peas , Pra ir ies - Har ves ted H ec tares per T on ne
0
0.5
1
1.5
2
2.5
81 86 91 96 01 06 11
Yie
ld (
T/h
a)
Year
0
0.1
0.2
0.3
0.4
0.5
0.6
0.7
81 86 91 96 01 06 11
Lan
d U
se (
ha/
T)
Year
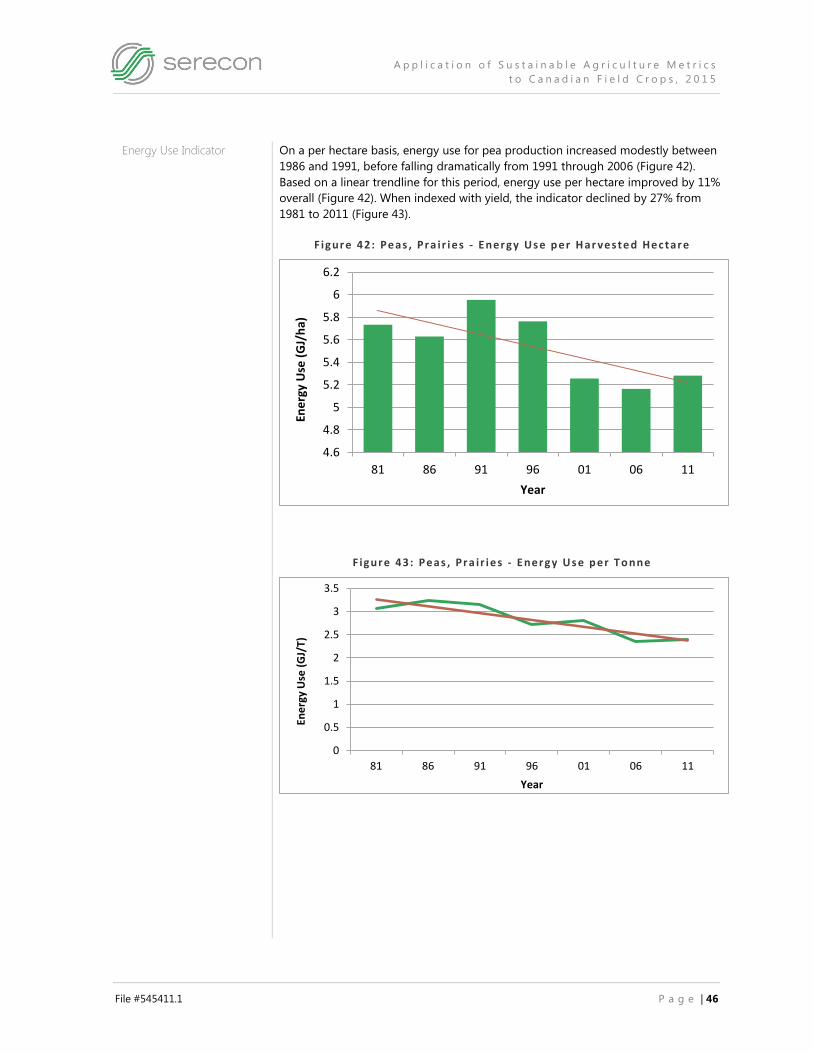
A p p l i c a t i o n o f S u s t a i n a b l e A g r i c u l t u r e M e t r i c s
t o C a n a d i a n F i e l d C r o p s , 2 0 1 5
File #545411.1 P a g e | 46
Energy Use Indicator On a per hectare basis, energy use for pea production increased modestly between
1986 and 1991, before falling dramatically from 1991 through 2006 (Figure 42).
Based on a linear trendline for this period, energy use per hectare improved by 11%
overall (Figure 42). When indexed with yield, the indicator declined by 27% from
1981 to 2011 (Figure 43).
F igure 42: Peas , Pra ir ies - Energy Us e p er H ar veste d Hec tare
F igure 43: Peas , Pra ir ies - Energy Us e p er T o nne
4.6
4.8
5
5.2
5.4
5.6
5.8
6
6.2
81 86 91 96 01 06 11
Ene
rgy
Use
(G
J/h
a)
Year
0
0.5
1
1.5
2
2.5
3
3.5
81 86 91 96 01 06 11
Ene
rgy
Use
(G
J/T)
Year

A p p l i c a t i o n o f S u s t a i n a b l e A g r i c u l t u r e M e t r i c s
t o C a n a d i a n F i e l d C r o p s , 2 0 1 5
File #545411.1 P a g e | 47
Climate Impact Indicator While following similar patterns to the energy use indicators, the climate impact
indicators for peas benfited from strong increases in carbon sequestration, and
improved much more than energy use between 1981 and 2011. On a per hectare
basis, climate impact for peas improved by 73% over this period (Figure 44). On the
basis of peas produced, the climate impact indicator improved by 76% (Figure 45),
with yield increasing by 22% (Figure 40).
F igure 44: Peas , Pra ir ies - C l im ate Im pa ct per Har ve s ted He ct are
F igure 45: Peas , Pra ir ies - C l im ate Im pa ct per To n n e
0
0.1
0.2
0.3
0.4
0.5
0.6
0.7
0.8
0.9
1
81 86 91 96 01 06 11
Clim
ate
Imp
act
(T C
O2
e/h
a)
Year
Climate Impact (T CO2e/ha) Climate Impact excl. SOCC (T CO2e/ha)
0
0.1
0.2
0.3
0.4
0.5
0.6
81 86 91 96 01 06 11
Clim
ate
Imp
act
(T C
O2
e/T
)
Year
Climate Impact excl. SOCC (T CO2e/T) Climate impact (T CO2e/T)

A p p l i c a t i o n o f S u s t a i n a b l e A g r i c u l t u r e M e t r i c s
t o C a n a d i a n F i e l d C r o p s , 2 0 1 5
File #545411.1 P a g e | 48
Indicator Summary – Peas,
Prairies
In summary, the story for peas in Western Canada is also very positive. All four
indicators improved significantly between 1981 and 2011, with the changes in the
climate impact efficiency again particularly strong (Figure 46). Between 1981 and
2011, soil loss efficiency improved by 57% (based on cropland area), climate impact
by 76%, and energy use by 27%, and land use by 18%.
F igure 46: Peas , Pra ir ies – A l l I nd ica tors
0.0
0.5
1.0
1.5
2.0
2.5Soil Loss
ClimateImpact
EnergyUse
Land Use
1981
1991
2001
2011
Year 2001 2011 Unit
Soil Loss 5.66 3.42 T soil/hectare
Climate Impact 0.20 0.17 T CO2e/T output
Energy Use 2.81 2.40 GJ/T output
Land Use 0.53 0.46 ha/T output
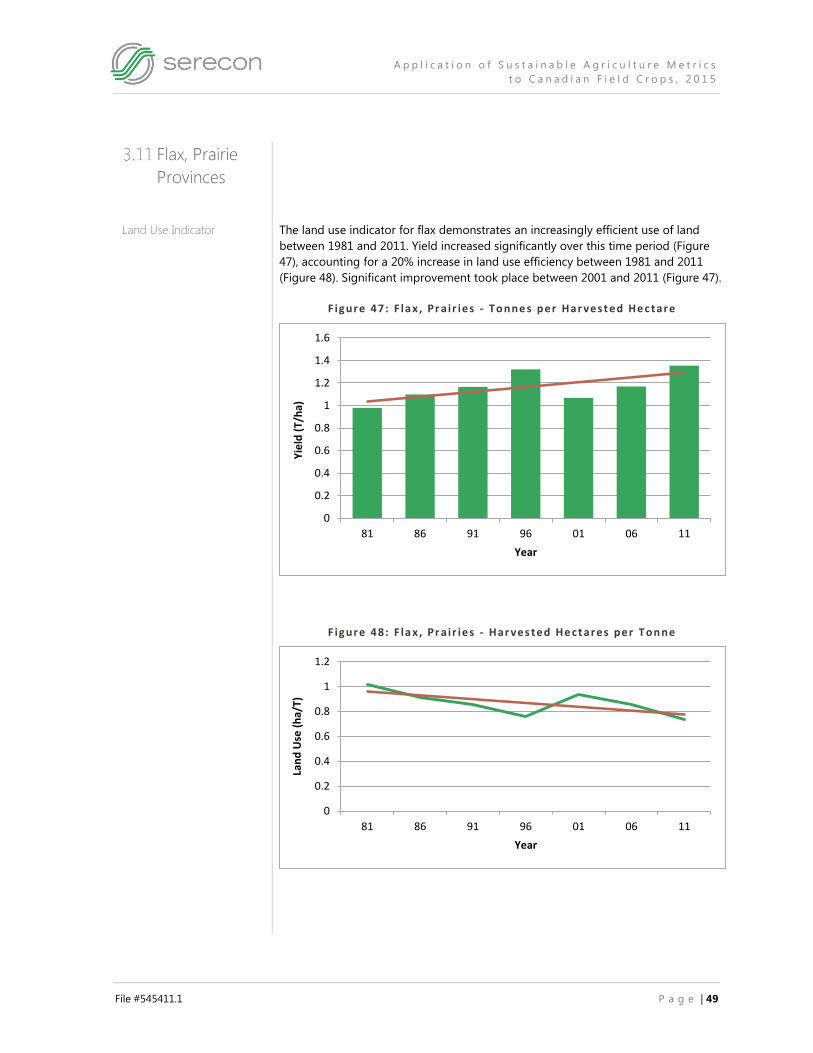
A p p l i c a t i o n o f S u s t a i n a b l e A g r i c u l t u r e M e t r i c s
t o C a n a d i a n F i e l d C r o p s , 2 0 1 5
File #545411.1 P a g e | 49
Flax, Prairie
Provinces
Land Use Indicator The land use indicator for flax demonstrates an increasingly efficient use of land
between 1981 and 2011. Yield increased significantly over this time period (Figure
47), accounting for a 20% increase in land use efficiency between 1981 and 2011
(Figure 48). Significant improvement took place between 2001 and 2011 (Figure 47).
F igure 47: F la x , Pr a ir ies - To nne s per Har ves t ed He c tare
F igure 48: F la x , Pr a ir ies - Har ves ted He ct ares per T on ne
0
0.2
0.4
0.6
0.8
1
1.2
1.4
1.6
81 86 91 96 01 06 11
Yie
ld (
T/h
a)
Year
0
0.2
0.4
0.6
0.8
1
1.2
81 86 91 96 01 06 11
Lan
d U
se (
ha/
T)
Year

A p p l i c a t i o n o f S u s t a i n a b l e A g r i c u l t u r e M e t r i c s
t o C a n a d i a n F i e l d C r o p s , 2 0 1 5
File #545411.1 P a g e | 50
Energy Use Indicator Energy use, on a per hectare basis, has improved by 18% between 1981 and 2011
(Figure 49). During the same time, yields of flax have increased by 24%, and energy
use per unit of output, as seen in Figure 50, has improved by 34%. Strong
improvement in output-based energy use occurred between 1981 and 1996. Poor
yields around 2001 created a bit of a blip in the output-based indicator, but the
improvement has resumed since that time.
F igure 49: F la x , Pr a ir ies - Energy Use per H arve ste d He ctar e
F igure 50: F la x , Pr a i r ies - Energy Use per T on ne
0
1
2
3
4
5
6
7
8
9
81 86 91 96 01 06 11
Ene
rgy
Use
(G
J/h
a)
Year
0
1
2
3
4
5
6
7
8
9
81 86 91 96 01 06 11
Ene
rgy
Use
(G
J/T)
Year

A p p l i c a t i o n o f S u s t a i n a b l e A g r i c u l t u r e M e t r i c s
t o C a n a d i a n F i e l d C r o p s , 2 0 1 5
File #545411.1 P a g e | 51
Climate Impact Indicator The climate impact indicators for flax have followed the trends set by energy use,
but show much more improvement than the energy use indicators, on the strength
of increasing soil carbon sequestration. Climate impact, on a per hectare basis, has
improved by 78% between 1981 and 2011 (Figure 51). At the same time, while yields
have improved by 24%, climate impact per unit of output has improved by 82%
(Figure 52).
F igure 51: F la x , Pr a ir ies - C l ima te I mp ac t per Har ve sted He ct are
F igure 52: F la x , Pr a ir ies - C l ima te I mp ac t per T o nne
0
0.2
0.4
0.6
0.8
1
1.2
81 86 91 96 01 06 11
Clim
ate
Imp
act
(T C
O2
e/h
a)
Year
Climate Impact (T CO2e/ha) Climate Impact excl. SOCC (T CO2e/ha)
0
0.2
0.4
0.6
0.8
1
1.2
81 86 91 96 01 06 11
Clim
ate
Imp
act
(T C
O2
e/T
)
Year
Climate Impact excl. SOCC (T CO2e/T) Climate impact (T CO2e/T)

A p p l i c a t i o n o f S u s t a i n a b l e A g r i c u l t u r e M e t r i c s
t o C a n a d i a n F i e l d C r o p s , 2 0 1 5
File #545411.1 P a g e | 52
Indicator Summary – Flax,
Prairies
The spider diagram (Figure 53) clearly indicates that the production of flax has
demonstrated improvements in all four indicator areas from 1981 through 2011.
While the improvements in soil loss (on a cropland area basis) are very strong, the
changes in climate impact are even stronger, largely on the strength of increasing
carbon sequestration. For flax, between 1981 and 2011, climate impact improved by
82%, energy use by 34%, and land use efficiency by 20%.
F igure 53: F la x , Pr a ir ies – A l l I nd ica tors
0.0
0.5
1.0
1.5
2.0
2.5Soil Loss
ClimateImpact
EnergyUse
Land Use
1981
1991
2001
2011
Year 2001 2011 Unit
Soil Loss 5.66 3.42 T soil/hectare
Climate Impact 0.41 0.22 T CO2e/T output
Energy Use 6.34 4.85 GJ/T output
Land Use 0.94 0.74 ha/T output
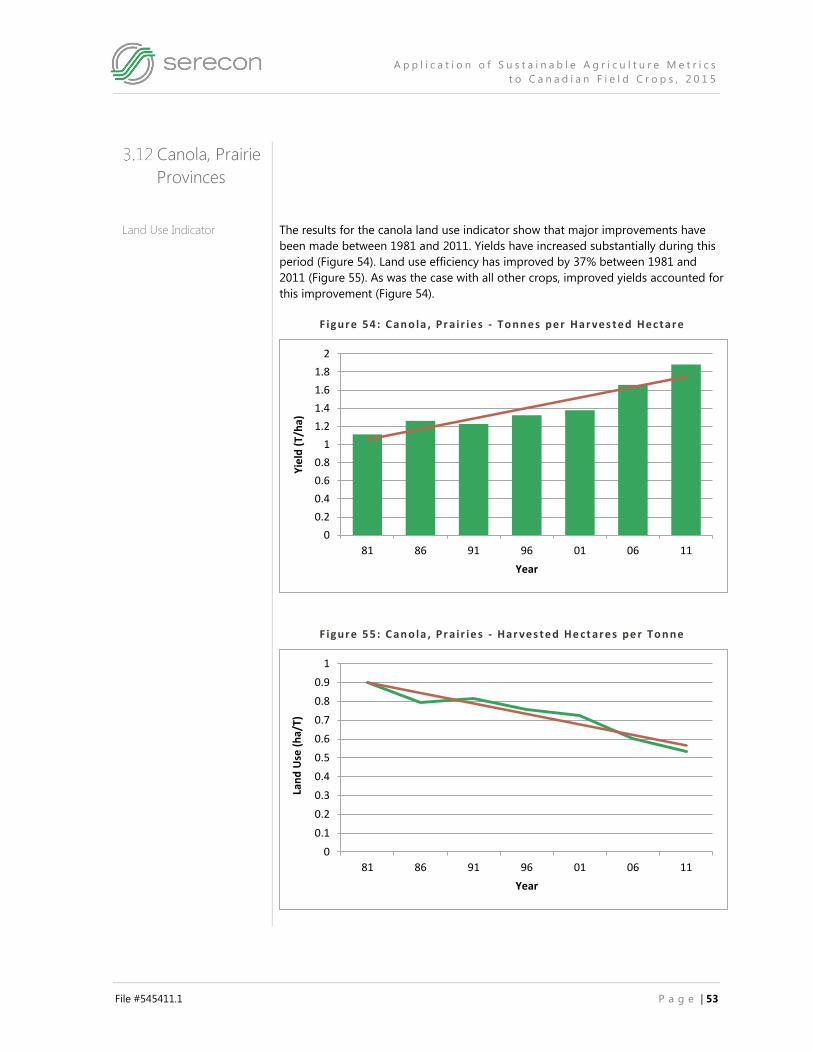
A p p l i c a t i o n o f S u s t a i n a b l e A g r i c u l t u r e M e t r i c s
t o C a n a d i a n F i e l d C r o p s , 2 0 1 5
File #545411.1 P a g e | 53
Canola, Prairie
Provinces
Land Use Indicator The results for the canola land use indicator show that major improvements have
been made between 1981 and 2011. Yields have increased substantially during this
period (Figure 54). Land use efficiency has improved by 37% between 1981 and
2011 (Figure 55). As was the case with all other crops, improved yields accounted for
this improvement (Figure 54).
F igure 54: C an o la , Pr a ir ie s - To nn es per Har ves ted Hec tare
F igure 55: C an o la , Pr a ir ie s - Har ves ted He ct ares pe r To n ne
0
0.2
0.4
0.6
0.8
1
1.2
1.4
1.6
1.8
2
81 86 91 96 01 06 11
Yie
ld (
T/h
a)
Year
0
0.1
0.2
0.3
0.4
0.5
0.6
0.7
0.8
0.9
1
81 86 91 96 01 06 11
Lan
d U
se (
ha/
T)
Year

A p p l i c a t i o n o f S u s t a i n a b l e A g r i c u l t u r e M e t r i c s
t o C a n a d i a n F i e l d C r o p s , 2 0 1 5
File #545411.1 P a g e | 54
Energy Use Indicator Canola also improved in the area of energy use, with an improvement of 8% on a
per hectare basis, between 1981 and 2011 (Figure 56). Energy use for canola, on a
per unit of output basis, improved by 43% between 1981 and 2011 (Figure 57), with
yields increasing by 66% (Figure 54).
F igure 56: C an o la , Pr a ir ie s - E nergy Use per H ar ves ted He ctar e
F igure 57: C an o la , Pr a ir ie s - E nergy Use per T on ne
8.4
8.6
8.8
9
9.2
9.4
9.6
9.8
10
81 86 91 96 01 06 11
Ene
rgy
Use
(G
J/h
a)
Year
0
1
2
3
4
5
6
7
8
9
10
81 86 91 96 01 06 11
Ene
rgy
Use
(G
J/T)
Year

A p p l i c a t i o n o f S u s t a i n a b l e A g r i c u l t u r e M e t r i c s
t o C a n a d i a n F i e l d C r o p s , 2 0 1 5
File #545411.1 P a g e | 55
Climate Impact Indicator Canola’s indicators for climate impact mirror the trends in energy use, both in terms
of magnitude and timing. Climate impact for canola also reflects strong increases in
soil carbon sequestration on the Prairies. The emissions intensity on a harvested
area basis (climate impact per hectare) decreased by 53% between 1981 and 2011
(Figure 58). However, with yields of canola increasing strongly over this period,
climate impact per unit of output improved by 71% (Figure 59).
F igure 58: C an o la , Pr a ir ie s - C l ima te I mp ac t per Ha rves ted He ct are
F igure 59: C an o la , Pr a ir ie s - C l ima te I mp ac t per To nne
0
0.2
0.4
0.6
0.8
1
1.2
1.4
81 86 91 96 01 06 11
Clim
ate
Imp
act
(T C
O2
e/h
a)
Year
Climate Impact (T CO2e/ha) Climate Impact excl. SOCC (T CO2e/ha)
0
0.2
0.4
0.6
0.8
1
1.2
81 86 91 96 01 06 11
Clim
ate
Imp
act
(T C
O2
e/T
)
Year
Climate Impact excl. SOCC (T CO2e/T) Climate impact (T CO2e/T)
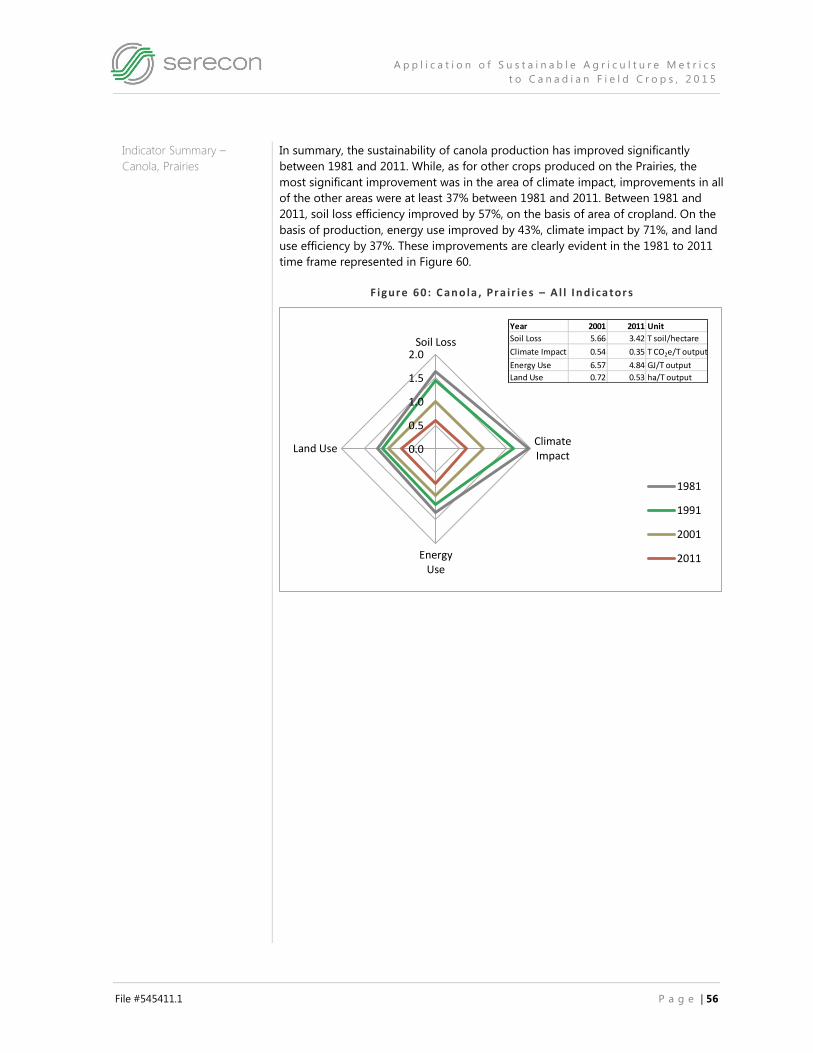
A p p l i c a t i o n o f S u s t a i n a b l e A g r i c u l t u r e M e t r i c s
t o C a n a d i a n F i e l d C r o p s , 2 0 1 5
File #545411.1 P a g e | 56
Indicator Summary –
Canola, Prairies
In summary, the sustainability of canola production has improved significantly
between 1981 and 2011. While, as for other crops produced on the Prairies, the
most significant improvement was in the area of climate impact, improvements in all
of the other areas were at least 37% between 1981 and 2011. Between 1981 and
2011, soil loss efficiency improved by 57%, on the basis of area of cropland. On the
basis of production, energy use improved by 43%, climate impact by 71%, and land
use efficiency by 37%. These improvements are clearly evident in the 1981 to 2011
time frame represented in Figure 60.
F igure 60: C an o la , Pr a ir ie s – A l l I n dica tor s
0.0
0.5
1.0
1.5
2.0Soil Loss
ClimateImpact
EnergyUse
Land Use
1981
1991
2001
2011
Year 2001 2011 Unit
Soil Loss 5.66 3.42 T soil/hectare
Climate Impact 0.54 0.35 T CO2e/T output
Energy Use 6.57 4.84 GJ/T output
Land Use 0.72 0.53 ha/T output

A p p l i c a t i o n o f S u s t a i n a b l e A g r i c u l t u r e M e t r i c s
t o C a n a d i a n F i e l d C r o p s , 2 0 1 5
File #545411.1 P a g e | 57
Lentils, Prairie
Provinces
Lentil production has a shorter history than production of most of the crops in this
report. As a result, all indicators for lentils reflect the time period from 1991 to 2011.
Land Use Indicator The harvested area of lentils on the Prairies has increased dramatically, from around
50,000 hectares in 1981 to over a million hectares by 2010. During the 20-year study
period, from 1991 to 2011, yields of lentils have increased strongly (Figure 61).
During this same time frame, land use efficiency has improved by 13% (Figure 62).
F igure 61: L ent i ls , Pr a ir ie s - To nn es per Har ves ted Hec tare
F igure 62: L ent i ls , Pr a ir ie s - Har ves ted He ct ares pe r To n ne
0
0.2
0.4
0.6
0.8
1
1.2
1.4
1.6
1.8
91 96 01 06 11
Yie
ld (
T/h
a)
Year
0
0.1
0.2
0.3
0.4
0.5
0.6
0.7
0.8
0.9
1
91 96 01 06 11
Lan
d U
se (
ha/
T)
Year

A p p l i c a t i o n o f S u s t a i n a b l e A g r i c u l t u r e M e t r i c s
t o C a n a d i a n F i e l d C r o p s , 2 0 1 5
File #545411.1 P a g e | 58
Energy Use Indicator For lentils, energy use per hectare decreased by 14% between 1991 and 2011
(Figure 63). Over the same time, yields increased by 19% (Figure 61) and energy use
per unit of output improved by 25% (Figure 64).
As with a number of the other crops, the output-based energy use indicator for
lentils suggests a significant improvement between 1996 and 2011, following an
initial increase between 1991 and 1996 (Figure 64). This increase in output-based
energy use between 1991 and 1996 appears to have been driven in part by low
yields around the years 1996 and 2001. Again, over the entire study period from
1991 to 2011, energy use per unit of output improved by 25% (Figure 64).
F igure 63: L ent i ls , Pr a ir ie s - E nergy Use per H ar ves ted He ctar e
F igure 64: L ent i ls , Pr a ir ie s - E nergy Use per T on ne
4.2
4.4
4.6
4.8
5
5.2
5.4
5.6
5.8
91 96 01 06 11
Ene
rgy
Use
(G
J/h
a)
Year
0
0.5
1
1.5
2
2.5
3
3.5
4
4.5
5
91 96 01 06 11
Ene
rgy
Use
(G
J/T)
Year

A p p l i c a t i o n o f S u s t a i n a b l e A g r i c u l t u r e M e t r i c s
t o C a n a d i a n F i e l d C r o p s , 2 0 1 5
File #545411.1 P a g e | 59
Climate Impact Indicator The indicators for the climate impact of lentil production show a similar pattern over
time to the energy use indicators. The overall rate of decline in climate impact
between 1991 and 1986 is also strongly influenced by increasing soil carbon
sequestration. Strong improvement is seen in output-based climate impact for
lentils, particularly between 1996 and 2006 (Figure 66).
Climate impact to produce lentils, on a per hectare basis, decreased by 106%
between 1991 and 2011, based on a linear trend line (Figure 65). Thus, on the basis
of a linear trend, soil carbon sequestration was able to outweigh greenhouse gas
emissions from farm energy and nitrous oxide emissions, by 2011. With yields
increasing by 19% over the same period, output-based climate impact improved by
104%, based on a linear trend line (Figure 66).
F igure 65: L ent i ls , Pr a ir ie s - C l ima te I mp ac t per Ha rves ted He ct are
F igure 66: L ent i ls , Pr a ir ie s - C l ima te I mp ac t per To nne
-0.1
0
0.1
0.2
0.3
0.4
0.5
0.6
0.7
91 96 01 06 11
Clim
ate
Imp
act
(T C
O2
r/h
a)
Year
Climate Impact (T CO2e/ha) Climate Impact excl. SOCC (T CO2e/ha)
-0.1
0
0.1
0.2
0.3
0.4
0.5
0.6
91 96 01 06 11Clim
ate
Imp
act
(T C
O2
e/T
)
Year
Climate Impact excl. SOCC (T CO2e/T) Climate impact (T CO2e/T)

A p p l i c a t i o n o f S u s t a i n a b l e A g r i c u l t u r e M e t r i c s
t o C a n a d i a n F i e l d C r o p s , 2 0 1 5
File #545411.1 P a g e | 60
Indicator Summary – Lentils,
Prairies
The story for lentils is very positive, based on the indicator analysis. After a bit of
difficulty between 1991 and 2001, when yields declined, there have been consistent
improvements in all four indicators between 2001 and 2011 (Figure 67). Lentils have
demonstrated improvement across all four indicators, between 1991 and 2011.
Between 1991 and 2011, soil loss efficiency improved by 38% (on the basis of
cropland area). Output-based climate impact improved by 104%, energy use by
25%, and land use efficiency by 13%.
F igure 67: L ent i ls , Pr a ir ie s – A l l I n dica tor s
0.0
1.0
2.0
3.0
4.0Soil Loss
ClimateImpact
EnergyUse
Land Use
1991
2001
2011
Year 2001 2011 Unit
Soil Loss 5.66 3.42 T soil/hectare
Climate Impact 0.12 0.05 T CO2e/T output
Energy Use 4.29 3.04 GJ/T output
Land Use 0.87 0.62 ha/T output
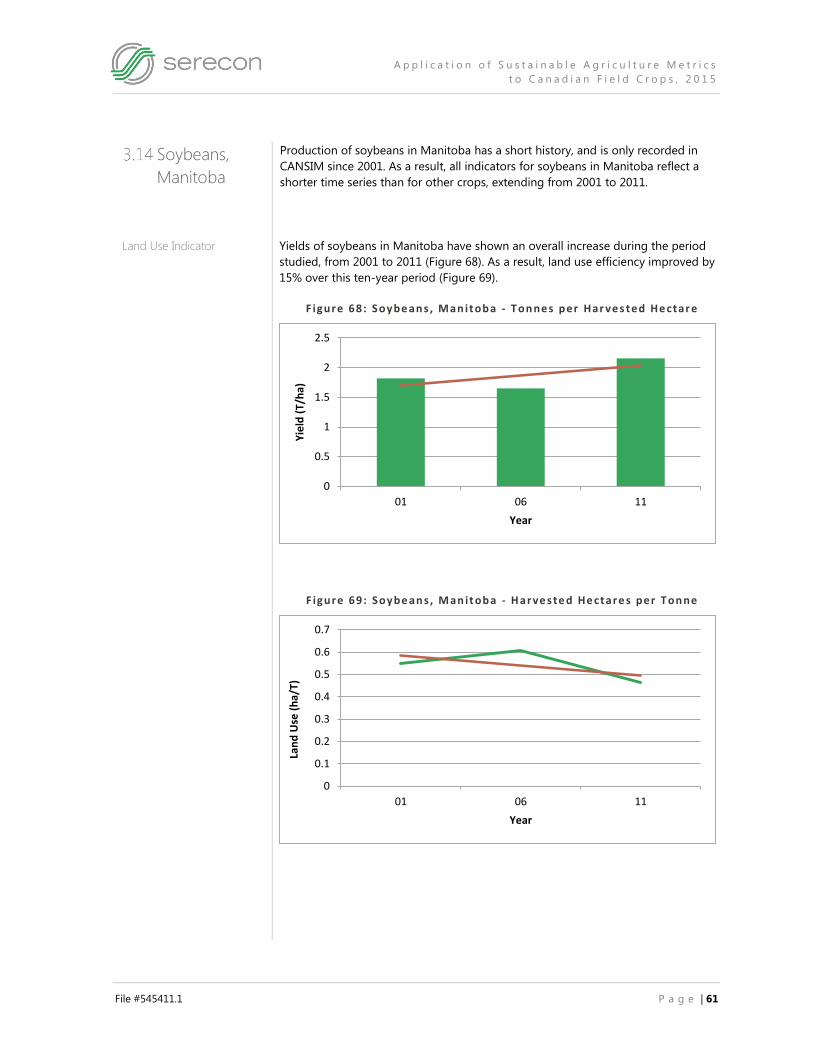
A p p l i c a t i o n o f S u s t a i n a b l e A g r i c u l t u r e M e t r i c s
t o C a n a d i a n F i e l d C r o p s , 2 0 1 5
File #545411.1 P a g e | 61
Soybeans,
Manitoba
Production of soybeans in Manitoba has a short history, and is only recorded in
CANSIM since 2001. As a result, all indicators for soybeans in Manitoba reflect a
shorter time series than for other crops, extending from 2001 to 2011.
Land Use Indicator Yields of soybeans in Manitoba have shown an overall increase during the period
studied, from 2001 to 2011 (Figure 68). As a result, land use efficiency improved by
15% over this ten-year period (Figure 69).
F igure 68: Soybe an s, Man it ob a - T on nes per Har ve s ted He ctar e
F igure 69: Soybe an s, Man it ob a - H arve ste d He ctare s per T on ne
0
0.5
1
1.5
2
2.5
01 06 11
Yie
ld (
T/h
a)
Year
0
0.1
0.2
0.3
0.4
0.5
0.6
0.7
01 06 11
Lan
d U
se (
ha/
T)
Year

A p p l i c a t i o n o f S u s t a i n a b l e A g r i c u l t u r e M e t r i c s
t o C a n a d i a n F i e l d C r o p s , 2 0 1 5
File #545411.1 P a g e | 62
Energy Use Indicator Energy use to produce soybeans in Manitoba showed a significant decrease
between 2001 and 2011. An overall decrease of 7% in energy use based on
harvested area, over the ten years, is seen in Figure 70. Output-based energy use
decreased by 20% over the ten-year period, as seen in Figure 71.
F igure 70: Soybe an s, Man it ob a - Energy Use per Ha rves ted He ct are
F igure 71: Soybe an s, Man it ob a - Energy Use per To nne
3.25
3.3
3.35
3.4
3.45
3.5
3.55
3.6
3.65
3.7
3.75
01 06 11
Ene
rgy
Use
(G
J/h
a)
Year
0
0.5
1
1.5
2
2.5
01 06 11
Ene
rgy
Use
(G
J/T)
Year
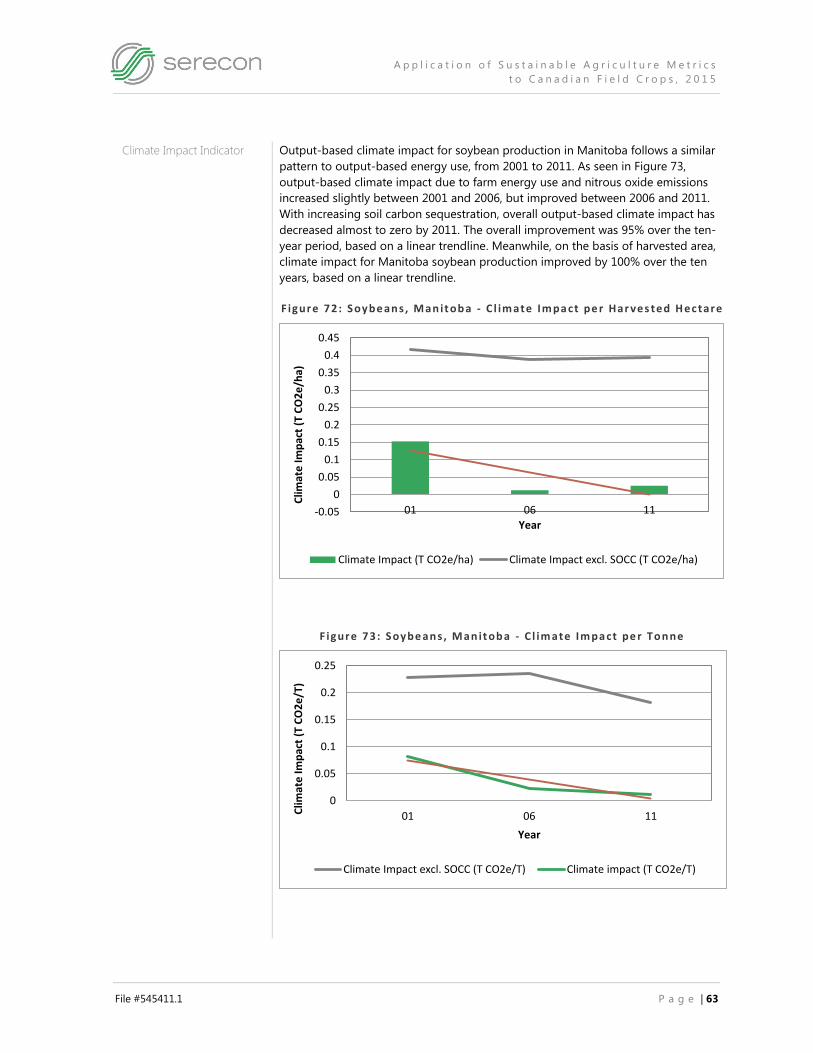
A p p l i c a t i o n o f S u s t a i n a b l e A g r i c u l t u r e M e t r i c s
t o C a n a d i a n F i e l d C r o p s , 2 0 1 5
File #545411.1 P a g e | 63
Climate Impact Indicator Output-based climate impact for soybean production in Manitoba follows a similar
pattern to output-based energy use, from 2001 to 2011. As seen in Figure 73,
output-based climate impact due to farm energy use and nitrous oxide emissions
increased slightly between 2001 and 2006, but improved between 2006 and 2011.
With increasing soil carbon sequestration, overall output-based climate impact has
decreased almost to zero by 2011. The overall improvement was 95% over the ten-
year period, based on a linear trendline. Meanwhile, on the basis of harvested area,
climate impact for Manitoba soybean production improved by 100% over the ten
years, based on a linear trendline.
F igure 72: Soybe an s, Man it ob a - C l im ate Im pa ct pe r Har ves ted H ec tare
F igure 73: Soybe an s, Man it ob a - C l im ate Im pa ct pe r To n ne
-0.05
0
0.05
0.1
0.15
0.2
0.25
0.3
0.35
0.4
0.45
01 06 11
Clim
ate
Imp
act
(T C
O2
e/h
a)
Year
Climate Impact (T CO2e/ha) Climate Impact excl. SOCC (T CO2e/ha)
0
0.05
0.1
0.15
0.2
0.25
01 06 11Clim
ate
Imp
act
(T C
O2
e/T
)
Year
Climate Impact excl. SOCC (T CO2e/T) Climate impact (T CO2e/T)

A p p l i c a t i o n o f S u s t a i n a b l e A g r i c u l t u r e M e t r i c s
t o C a n a d i a n F i e l d C r o p s , 2 0 1 5
File #545411.1 P a g e | 64
Indicator Summary –
Soybeans, Manitoba
Figure 74 shows consistent improvement for Manitoba soybean production, on all
four sustainability indicators over the ten years from 2001 to 2011. Output-based
land use efficiency improved by 15%, energy use by 20%, and climate impact by
95%.
F igure 74: Soybe an s, Man it ob a – A l l In d icat ors
Context: Soybean
Production in Manitoba
and Ontario
Context is very important when results for Manitoba and Ontario soybeans are
considered:
Manitoba and Ontario represent markedly different physical environments in
terms of climate, topography and soil type
Production of soybeans has a shorter history in Manitoba
‒ Manitoba soybean production is represented by three data points (10
years) in this analysis
‒ Ontario soybean production is represented by seven data points (30
years)
As a result of this shorter time series, the trends documented here for
Manitoba soybean production are probably less reliable than those for
Ontario soybean production.
Direct comparisons of soybean production in Ontario and Manitoba cannot be
made.
0
0.2
0.4
0.6
0.8
1
SoilLoss
Climate
Impact
EnergyUse
LandUse
2001
2011
Year 2001 2011 Unit
Soil Loss 3.31 2.79 T soil/hectare
Climate Impact 0.08 0.01 T CO2e/T output
Energy Use 2.03 1.60 GJ/T output
Land Use 0.55 0.46 ha/T output
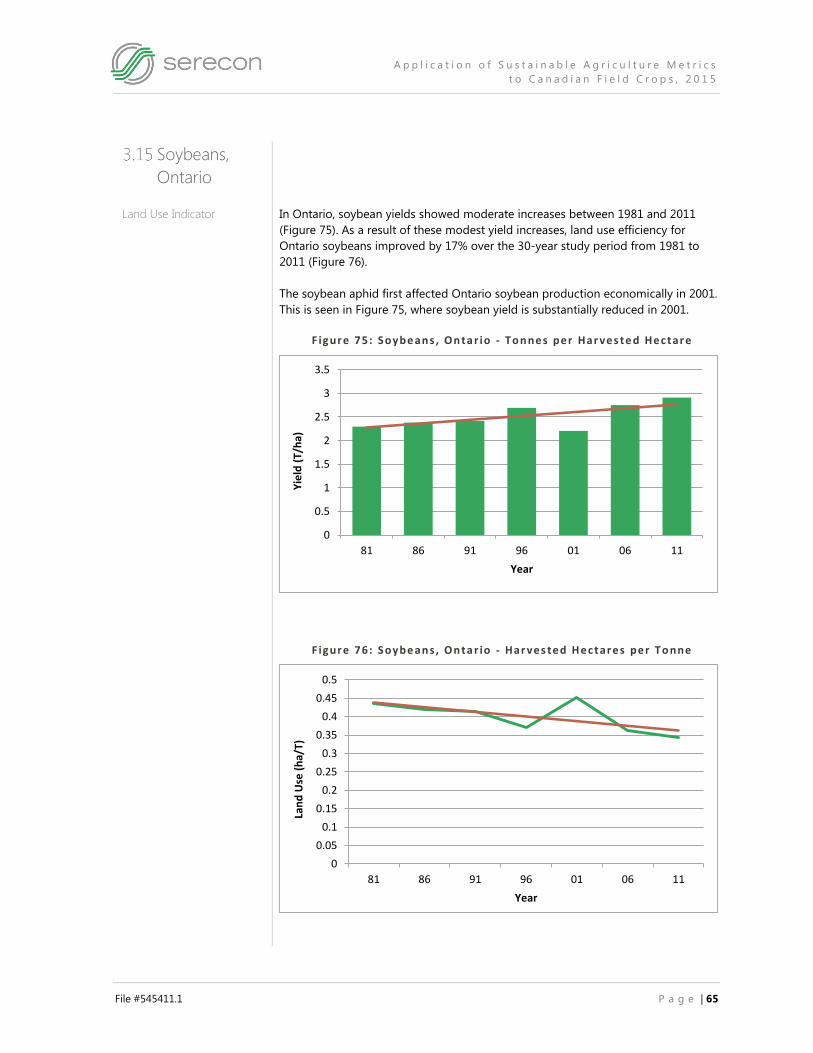
A p p l i c a t i o n o f S u s t a i n a b l e A g r i c u l t u r e M e t r i c s
t o C a n a d i a n F i e l d C r o p s , 2 0 1 5
File #545411.1 P a g e | 65
Soybeans,
Ontario
Land Use Indicator In Ontario, soybean yields showed moderate increases between 1981 and 2011
(Figure 75). As a result of these modest yield increases, land use efficiency for
Ontario soybeans improved by 17% over the 30-year study period from 1981 to
2011 (Figure 76).
The soybean aphid first affected Ontario soybean production economically in 2001.
This is seen in Figure 75, where soybean yield is substantially reduced in 2001.
F igure 75: Soybe an s, On ta r io - To n nes per Har ves te d Hec tare
F igure 76: Soybe an s, On ta r io - Har ves ted H ec tares per T o nne
0
0.5
1
1.5
2
2.5
3
3.5
81 86 91 96 01 06 11
Yie
ld (
T/h
a)
Year
0
0.05
0.1
0.15
0.2
0.25
0.3
0.35
0.4
0.45
0.5
81 86 91 96 01 06 11
Lan
d U
se (
ha/
T)
Year

A p p l i c a t i o n o f S u s t a i n a b l e A g r i c u l t u r e M e t r i c s
t o C a n a d i a n F i e l d C r o p s , 2 0 1 5
File #545411.1 P a g e | 66
Energy Use Indicator Energy use for soybean production in Ontario also improved, at a moderate rate.
Energy use on the basis of harvested area decreased by 12% between 1981 and
2011 (Figure 77). Output-based energy use decreased by 28% over the same 30-
year study period (Figure 78).
F igure 77: Soybe an s, On ta r io - E nergy Us e p er H ar vested He ct are
F igure 78: Soybe an s, On ta r io - E nergy Us e p er T o nn e
Climate Impact Indicator From 1981 to 2011, climate impact for production of soybeans in Ontario increased
slightly on the basis of harvested area, but improved moderately if based on output.
Based on harvested area, climate impact increased by 3% over the 30-year study
period (Figure 79). Based on output, climate impact improved by 17% over the same
study period (Figure 80).
0
0.5
1
1.5
2
2.5
3
3.5
4
4.5
5
81 86 91 96 01 06 11
Ene
rgy
Use
(G
J/h
a)
Year
0
0.2
0.4
0.6
0.8
1
1.2
1.4
1.6
1.8
2
81 86 91 96 01 06 11
Ene
rgy
Use
(G
J/T)
Year

A p p l i c a t i o n o f S u s t a i n a b l e A g r i c u l t u r e M e t r i c s
t o C a n a d i a n F i e l d C r o p s , 2 0 1 5
File #545411.1 P a g e | 67
The slight increase in area-based climate impact for Ontario soybean production is
largely the result of increasing yields resulting in increasing amounts of crop residue,
in combination with relatively high moisture in Ontario, leading to relatively high
nitrous oxide emissions (see box in section 3.6, Winter Wheat, Ontario).
As identified in section 2.5, above, research indicates that nitrous oxide emissions
from crop residues of legumes, such as soybeans, may be overestimated in this
study. Nitrogen-rich residues of N2-fixing crops have been found to have a limited
impact on N2O emissions in the short term.
F igure 79: Soybe an s, On ta r io - C l im ate Im pa ct per H arve s te d H ec tare
F igure 80: Soybe an s, On ta r io - C l im ate Im pa ct per T on ne
0
0.2
0.4
0.6
0.8
1
1.2
1.4
81 86 91 96 01 06 11
Clim
ate
Imp
act
(T C
O2
e/h
a)
Year
Climate Impact (T CO2e/ha) Climate Impact excl. SOCC (T CO2e/ha)
0
0.05
0.1
0.15
0.2
0.25
0.3
0.35
0.4
0.45
0.5
81 86 91 96 01 06 11
Clim
ate
Imp
act
(T C
O2
e/T
)
Year
Climate Impact excl. SOCC (T CO2e/T) Climate impact (T CO2e/T)
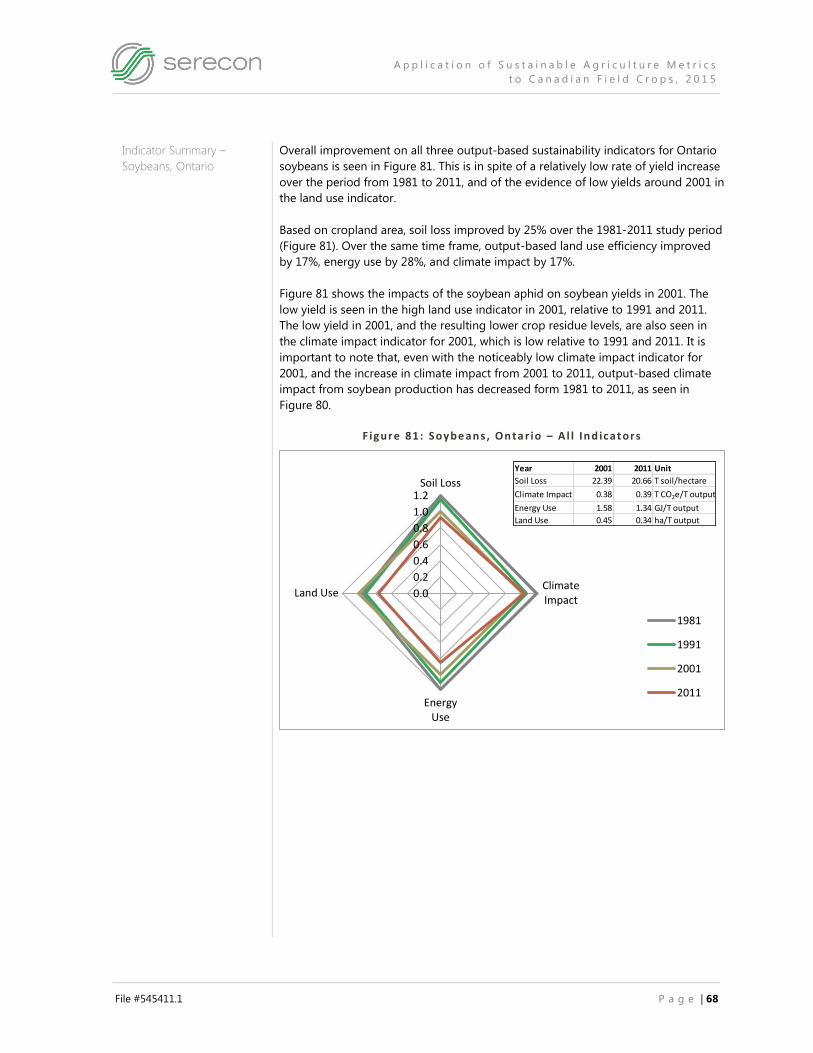
A p p l i c a t i o n o f S u s t a i n a b l e A g r i c u l t u r e M e t r i c s
t o C a n a d i a n F i e l d C r o p s , 2 0 1 5
File #545411.1 P a g e | 68
Indicator Summary –
Soybeans, Ontario
Overall improvement on all three output-based sustainability indicators for Ontario
soybeans is seen in Figure 81. This is in spite of a relatively low rate of yield increase
over the period from 1981 to 2011, and of the evidence of low yields around 2001 in
the land use indicator.
Based on cropland area, soil loss improved by 25% over the 1981-2011 study period
(Figure 81). Over the same time frame, output-based land use efficiency improved
by 17%, energy use by 28%, and climate impact by 17%.
Figure 81 shows the impacts of the soybean aphid on soybean yields in 2001. The
low yield is seen in the high land use indicator in 2001, relative to 1991 and 2011.
The low yield in 2001, and the resulting lower crop residue levels, are also seen in
the climate impact indicator for 2001, which is low relative to 1991 and 2011. It is
important to note that, even with the noticeably low climate impact indicator for
2001, and the increase in climate impact from 2001 to 2011, output-based climate
impact from soybean production has decreased form 1981 to 2011, as seen in
Figure 80.
F igure 81: Soybe an s, On ta r io – A l l In d ic at ors
0.0
0.2
0.4
0.6
0.8
1.0
1.2Soil Loss
ClimateImpact
EnergyUse
Land Use
1981
1991
2001
2011
Year 2001 2011 Unit
Soil Loss 22.39 20.66 T soil/hectare
Climate Impact 0.38 0.39 T CO2e/T output
Energy Use 1.58 1.34 GJ/T output
Land Use 0.45 0.34 ha/T output

A p p l i c a t i o n o f S u s t a i n a b l e A g r i c u l t u r e M e t r i c s
t o C a n a d i a n F i e l d C r o p s , 2 0 1 5
File #545411.1 P a g e | 69
Corn, Ontario
Land Use Indicator Corn yields in Ontario showed strong improvement over the 1981-2011 period
(Figure 82). This drove consistently strong improvements in land use efficiency,
which improved by 39% overall between 1981 and 2011 (Figure 83).
F igure 84: C or n, On tar io - To n nes per Har ves ted He ctar e
F igure 85: C or n, On tar io - Har ves ted H ec tares per T on ne
0
2
4
6
8
10
12
81 86 91 96 01 06 11
Yie
ld (
T/h
a)
Year
0
0.02
0.04
0.06
0.08
0.1
0.12
0.14
0.16
0.18
0.2
81 86 91 96 01 06 11
Lad
Use
(h
a/T)
Year

A p p l i c a t i o n o f S u s t a i n a b l e A g r i c u l t u r e M e t r i c s
t o C a n a d i a n F i e l d C r o p s , 2 0 1 5
File #545411.1 P a g e | 70
Energy Use Indicator Of the crops studied, corn has the highest area-based energy use, by a substantial
margin, owing to the large amount of fertilizer required by this crop (Verge and
Dyer, 2014).
Energy use for Ontario corn production shows relatively low per-unit-area intensities
for 1996 and 2001. However, a slight overall increase of 0.2% is seen over the 30-
year period from 1981 to 2011 (Figure 84). Over the same period, output-based
energy use improved by 39%, driven by strong yield increases (69%) between 1981
and 2011 (Figure 85).
F igure 86: C or n, On tar io - Energy Us e p er H ar veste d Hec tare
F igure 87: C or n, On tar io - Energy Us e p er T o nne
16.3
16.4
16.5
16.6
16.7
16.8
16.9
17
17.1
17.2
81 86 91 96 01 06 11
Ene
rgy
Use
(G
J/h
a)
Year
0
0.5
1
1.5
2
2.5
3
3.5
81 86 91 96 01 06 11
Ene
rgy
Use
(G
J/T)
Year

A p p l i c a t i o n o f S u s t a i n a b l e A g r i c u l t u r e M e t r i c s
t o C a n a d i a n F i e l d C r o p s , 2 0 1 5
File #545411.1 P a g e | 71
Climate Impact Indicator Area-based climate impact shows the same low level as energy use for 2001. Over
the 1981-2011 study period, area-based climate impact for Ontario corn production
increased slightly, by 4% (Figure 86). Output-based climate impact decreased by
37%, on the strength of strong yield increases (Figure 87).
The increase in area-based climate impact for Ontario corn production is largely the
result of increasing yields, resulting in increasing amounts of crop residue, in
combination with relatively high moisture in Ontario, leading to relatively high
nitrous oxide emissions (see box in section 3.6, Winter Wheat, Ontario).
F igure 88: C or n, On tar io - C l im ate Im pa ct per Har ve s ted He ct are
F igure 89: C or n, On tar io - C l im ate Im pa ct per To n n e
0
0.5
1
1.5
2
2.5
3
3.5
4
81 86 91 96 01 06 11
Clim
ate
Imp
act
(T C
O2
e/h
a)
Year
Climate Impact (T CO2e/ha) Climate Impact excl. SOCC (T CO2e/ha)
0
0.1
0.2
0.3
0.4
0.5
0.6
81 86 91 96 01 06 11
Clim
ate
Imp
act
(T C
O2
e/T
)
Year
Climate Impact excl. SOCC (T CO2e/T) Climate impact (T CO2e/T)

A p p l i c a t i o n o f S u s t a i n a b l e A g r i c u l t u r e M e t r i c s
t o C a n a d i a n F i e l d C r o p s , 2 0 1 5
File #545411.1 P a g e | 72
Indicator Summary – Corn,
Ontario
Figure 88 shows consistent improvement on all three output-based sustainability
indicators for Ontario corn production, from 1981 to 2011. Land use efficiency
improved by 39%, energy use by 39%, and climate impact by 37%. Meanwhile, soil
loss (calculated on an area basis, and therefore without the benefit of corn’s yield
increases) improved by 25%).
F igure 90: C or n, On tar io – A l l I nd ica tors
0.0
0.5
1.0
1.5Soil Loss
ClimateImpact
EnergyUse
Land Use
1981
1991
2001
2011
Year 2001 2011 Unit
Soil Loss 22.39 20.66 T soil/hectare
Climate Impact 0.44 0.36 T CO2e/T output
Energy Use 2.29 1.75 GJ/T output
Land Use 0.14 0.10 ha/T output
A p p l i c a t i o n o f S u s t a i n a b l e A g r i c u l t u r e M e t r i c s
t o C a n a d i a n F i e l d C r o p s , 2 0 1 5
File #545411.1 P a g e | 73
4.0 Summary
This report documents trends on sustainability parameters for crop production in
two distinct agricultural regions of Canada. Land use, soil loss, soil organic carbon
change, energy use and climate impact are reported for the time period from 1981
to 2011, for Ontario and the Prairies. This represents expansion of the sustainability
indicators reported in 2011 to include Ontario, and updating to include 2011 Census
of Agriculture data.
The sustainability indicators show a very positive picture for crop production both in
Ontario and on the Prairies. The positive trends reported in 2011 for the Prairie
Provinces have continued over a further five years, and are also demonstrated for
the 30-year study period in Ontario.
The premise underlying these indicators is that the key criterion for sustainability is
improvement over time, in key areas of environmental impact. Emphasis is therefore
on demonstrating continuous improvement over time, within a given geographical
context. It is recognized that different regions and different crops provide very
different opportunities to improve the sustainability of production. For this reason,
comparisons of different crops, or of the same crop in different geographical
regions, should not be made. The results in this report should be interpreted in this
light.
Where data permitted, the sustainability indicators were calculated as resource use
per unit of output, e.g. energy use was calculated as GJ/tonne of crop produced.
This approach focuses on how efficiently we are using resources to meet increasing
demand for food. Land use, energy use and climate impact were all calculated on
this basis. These three efficiency indicators, for all the crops assessed, in both
Ontario and on the Prairies, showed improvement.
Due to data limitations, it was not possible to calculate soil loss and soil organic
carbon change on a crop-specific basis. Thus the output-based efficiency indicators
calculated for land use, energy use and climate impact could not be created for soil
loss and soil organic carbon change. Instead, soil loss and soil organic carbon
change were calculated on the basis of cropland area, e.g. soil loss in
tonnes/ha/year. Both soil loss and soil organic carbon change improved over the
study period, both on the Prairies and in Ontario.
Land use, energy use and climate impact were also calculated on the basis of area.
Thus, for example, energy use was calculated as GJ/ha, as well as GJ/tonne of crop.
Resource use per unit of area normalizes the metrics to a common unit for
comparison, as does resource use per unit of output. However, it must be
understood that an equal amount of resources (land, energy or GHG production)
may be used per hectare, with varying levels of production. Calculated on the basis
of area, the following sustainability impacts increased somewhat over the study
period:
climate impact for production of winter wheat, corn and soybeans, in Ontario
energy use for production of winter wheat and corn, in Ontario

A p p l i c a t i o n o f S u s t a i n a b l e A g r i c u l t u r e M e t r i c s
t o C a n a d i a n F i e l d C r o p s , 2 0 1 5
File #545411.1 P a g e | 74
For all other crop-geographies, area-based land use, energy use and climate impact
showed improvement.
The sustainability indicators reported here on an output basis all showed
improvement, largely on the strength of consistent yield increases. Of the indicators
based on area rather than output, the strong improvements in the risk of soil loss
are noteworthy.
A p p l i c a t i o n o f S u s t a i n a b l e A g r i c u l t u r e M e t r i c s
t o C a n a d i a n F i e l d C r o p s , 2 0 1 5
File #545411.1 P a g e | 75
5.0 References
Environment Canada. 2015. National Inventory Report, 1990-2013. Greenhouse Gas Sources
and Sinks in Canada. The Canadian Government’s Submission to the UN Framework
Convention on Climate Change. Gatineau, Quebec.
Field to Market. 2009. Environmental Resource Indicators Report, First Report, January 2009.
Field to Market. 2012v2. Environmental and Socioeconomic Indicators for Measuring
Outcomes of On-Farm Agricultural Production in the United States: Second Report,
(Version 2), December 2012. Available at: www.fieldtomarket.org.
Huffman, T. and W. Eilers. 2010. Agricultural Land Use. Pages 14-19 in Eilers, W., R. MacKay, L.
Graham and A. Lefebvre (eds). 2010. Environmental Sustainability of Canadian Agriculture:
Agri-Environmental Indicator Report Series – Report #3. Agriculture and Agri-Food
Canada, Ottawa, Ontario.
Janzen, H.H., K.A. Beauchemin, Y. Bruinsma, C.A. Campbell, R.L. Desjardins, B.H. Ellert, E.G.
Smith. 2003. The Fate of Nitrogen inAgroecosystems: An Illustration Using Canadian
Estimates. Nutrient Cycling in Agroecosystems 67: 85-102.
Kuneman, G. and E. Fellus (eds). 2014. Sustainability Performance Assessment Version 2.0
Towards Consistent Measurement of sustainability at Farm Level. Sustainable Agriculture
Initiative Platform, Brussels, Belgium. Available at:
http://www.saiplatform.org/uploads/SPA%20Guidelines%202%200.pdf
Lobb, D.A., S. Li and B.G. McConkey. 2010. Soil Erosion. Pages 46-53 in Eilers, W., R. MacKay, L.
Graham and A. Lefebvre (eds). 2010. Environmental Sustainability of Canadian Agriculture:
Agri-Environmental Indicator Report Series – Report #3. Agriculture and Agri-Food
Canada, Ottawa, Ontario.
McConkey, B.G., D.A. Lobb, S. Li, J.M.W. Black and P.M. Krug. 2011. Soil Erosion on Cropland:
Introduction and Trends in Canada. Canadian Biodiversity: Ecosystem Status and Trends
2010, Technical Thematic Report No. 16. Canadian Councils of Resource Ministers. Ottawa,
Ontario.
McConkey, B.G., D. Cerkowniak, W.N. Smith, R.L. Desjardins, and M.J. Bentham. 2010. Soil
Organic Matter. Pages 54-60 in Eilers, W., R. MacKay, L. Graham and A. Lefebvre (eds).
2010. Environmental Sustainability of Canadian Agriculture: Agri-Environmental Indicator
Report Series – Report #3. Agriculture and Agri-Food Canada, Ottawa, Ontario.
Pulse Canada, Canadian Canola Growers Association, Canadian Wheat Board, Ducks Unlimited
Canada, Flax Council of Canada and General Mills (2011). Application of Sustainable
Agriculture Metrics to Selected Western Canadian Field Crops: Final Report, November
2011. Available at: www.pulsecanada.com/fieldtomarket.
Rochette, P., D.E. Worth, E.C. Huffman, J.A. Brierley, B.G. McConkey, J. Yang, J.J. Hutchinson, R.L.
Desjardins, R. Lemke, S. Gameda. 2008. Estimation of N2O Emissions from Agricultural
Soils in Canada. II. 1990-2005 Inventory. Can. J. Soil Sci. 88: 655-669.
Serecon Management Consulting Inc. 2009. Environmental Indicators Analysis: Pre-Feasibility
Study.

A p p l i c a t i o n o f S u s t a i n a b l e A g r i c u l t u r e M e t r i c s
t o C a n a d i a n F i e l d C r o p s , 2 0 1 5
File #545411.1 P a g e | 76
Soil Conservation Council of Canada. 2004. Reduced Tillage Helps Reduce Carbon Dioxide
Levels. Available at: http://www.soilcc.ca/ggmp_feature_articles/2004/2004-02.php
Unilever. 2015. Sustainable Sourcing: Growing for the Future – Sustainable Sourcing Has Never
Been More Important. Available at: https://www.unilever.com/sustainable-living/the-
sustainable-living-plan/reducing-environmental-impact/sustainable-sourcing/
Verge, X.P.C. and J.A. Dyer. 2014. Greenhouse Gas Intensities for Selected Crops in Ontario and
Western Canada from 1981 to 2011.
Walmart. 2015. Supplier Sustainability Assessment. Available at:
http://isites.harvard.edu/fs/docs/icb.topic744501.files/WalmartSupplier%20Assessment.pdf
Yang, J.Y., R. De Jong, C.F. Drury, E.C. Huffman, V. Kirkwood, and X.M. Yang. 2007. Development
of a Canadian Agricultural Nitrogen Budget (CANB v2.0) Model and the Evaluation of
Various Policy Scenarios. Can. J. Soil Sci. 87: 153-165.
Zhong, Z., R.L. Lemke, L.M. Nelson. 2011. Nitrous Oxide Emissions from Grain Legumes as
Affected by Wetting/Drying Cycles and Crop Residues. Biology and Fertility of Soils 47:
687-699.
A p p l i c a t i o n o f S u s t a i n a b l e A g r i c u l t u r e M e t r i c s
t o C a n a d i a n F i e l d C r o p s , 2 0 1 5
File #545411.1 A p p e n d i x | P a g e | 1
Appendix
F ie ld to Market ,
the Keystone
A l l iance for
Susta inab le
Agr icu l ture
The work of Field to Market, the Keystone Alliance for Sustainable Agriculture, in the
United States, serves as a key reference for the Canadian Field Print Initiative. This
applies both to the macro-level indicators outlined in this report, and to the
Canadian Field Print Calculator.
Field to Market continues to be a leader in the development of sustainable
agriculture metrics in North America. This is true both in terms of the importance of
the stakeholders engaged with Field to Market, and the extent of representation
from the US food production sector. Field to Market’s Fieldprint Calculator is listed
by SAI Platform’s Sustainability Performance Assessment (SPA) project among the
most promising on-farm sustainability tools, demonstrating Field to Market’s
importance at the global level (Kuneman and Fellus, 2014). The SPA project aims to
develop more uniform criteria for measuring and reporting on-farm sustainability. In
addition to this work on on-farm sustainability measurement, Field to Market
remains a leader in development of macro-level sustainability indicators for
agriculture.
Field to Market is a collaborative stakeholder group working to define and measure
agricultural sustainability (Field to Market, 2012). It includes producers,
agribusinesses, food, fibre and retail companies, conservation organisations,
universities and agency partners. These member organisations provide oversight
and technical guidance in the development of metrics and tools.
Field to Market (2012) defines the following criteria for the macro-level indicators
they develop:
National scale – analysis of sustainability performance at the national level,
ultimately providing context for smaller-scale projects
Trends over time – metrics that provide for analysis of changes over time
Science-based – application of the best available science and transparent
methodologies
Outcomes-based – focus on the sustainability impacts of a range of
agricultural products and practices
Public dataset availability – based on publicly available, national-level data
On-farm – focus on outcomes resulting from on-farm production
Grower direct control – focus on outcomes that respond directly to the
producer’s management decisions
Field to Market updated its macro-level indicators in 2012 (Field to Market, 2012V2).
Field to Market reports essentially the same environmental indicator set in 2012 as it
did in its original indicator report in 2009 (Field to Market, 2009). Thus, the following
environmental indicators are reported:

A p p l i c a t i o n o f S u s t a i n a b l e A g r i c u l t u r e M e t r i c s
t o C a n a d i a n F i e l d C r o p s , 2 0 1 5
File #545411.1 A p p e n d i x | P a g e | 2
Land Use
Soil Erosion
Irrigation Water Applied
Energy Use
Climate Impact
This indicator set reflects Field to Market’s effort to define a relatively small set of
key outcome indicators to reflect agricultural sustainability.