application of sodar to air pollution meteorology†
TRANSCRIPT

This article was downloaded by: [University Library Technische Universität München]On: 10 November 2014, At: 09:07Publisher: Taylor & FrancisInforma Ltd Registered in England and Wales Registered Number: 1072954 Registered office: Mortimer House,37-41 Mortimer Street, London W1T 3JH, UK
International Journal of Remote SensingPublication details, including instructions for authors and subscription information:http://www.tandfonline.com/loi/tres20
Application of sodar to air pollution meteorology†S. P. SINGAL a , B. S. GERA a & D. R. PAHWA aa National Physical Laboratory , New Delhi, IndiaPublished online: 10 May 2007.
To cite this article: S. P. SINGAL , B. S. GERA & D. R. PAHWA (1994) Application of sodar to air pollution meteorology†,International Journal of Remote Sensing, 15:2, 427-441, DOI: 10.1080/01431169408954084
To link to this article: http://dx.doi.org/10.1080/01431169408954084
PLEASE SCROLL DOWN FOR ARTICLE
Taylor & Francis makes every effort to ensure the accuracy of all the information (the “Content”) contained in thepublications on our platform. However, Taylor & Francis, our agents, and our licensors make no representationsor warranties whatsoever as to the accuracy, completeness, or suitability for any purpose of the Content. Anyopinions and views expressed in this publication are the opinions and views of the authors, and are not theviews of or endorsed by Taylor & Francis. The accuracy of the Content should not be relied upon and should beindependently verified with primary sources of information. Taylor and Francis shall not be liable for any losses,actions, claims, proceedings, demands, costs, expenses, damages, and other liabilities whatsoever or howsoevercaused arising directly or indirectly in connection with, in relation to or arising out of the use of the Content.
This article may be used for research, teaching, and private study purposes. Any substantial or systematicreproduction, redistribution, reselling, loan, sub-licensing, systematic supply, or distribution in anyform to anyone is expressly forbidden. Terms & Conditions of access and use can be found at http://www.tandfonline.com/page/terms-and-conditions
INT. 1. REMOTE SENSING, 1994, VOL. 15, No.2, 427-441
Application of sodar to air pollution meteorology]
S. P. SINGAL, B. S. GERA and D. R. PAHWA
National Physical Laboratory, New Delhi, India
Abstract. A complete description of urban diffusion and dispersion generallyrequires knowledge of emission sources, an appropriate dispersion model,atmospheric stability, mixingheight and dispersion parameters, etc. To determinethe air pollution related to meteorological parameters, a remote sensing acousticsounding system has been found to be a useful tool. This paper describes thetechniques developed at the National Physical Laboratory, New Delhi todetermine Pasquill stability classification, mixing height and diffusion coefficientsfrom monostatic sodar echograms. On the assumption that the Gaussian plumemodel holds good, concentrations of particulate matter with distances have beencompared with actually observed values of particulate matter concentration toshow the validity of approach.
I. IntroductionToday the atmosphere is being used as a giant sewer. Although it has a very large
capacity to dilute the contaminants, there are times when, even though the emissionof the pollutants remains the same, certain atmospheric conditions characterisingtransport, dispersion and diffusion processes develop which drastically diminish theability of the atmosphere to disperse pollutants and this can lead to serious airpollution episodes. It is a well-known fact that transportation, dispersion anddiffusion characteristics of the atmosphere depend on the depth of the planetaryboundary layer, its stability, meso-scale flow pattern and wind speed and winddirection, etc., therefore, a knowledge of these parameters becomes essential if weneed to determine the air quality at a place, even when the number and distributionof air pollution sources remain the same.
Traditional weather forecasting techniques like radiosonde are able to foreseeweather phenomena only on the synoptic scale. Conventional in situ techniques likethe instrumented tower, tethered balloon and instrumented aircraft etc., may beprecise, but, they require a large network for the necessary observational input andphysical realism needed to describe meso- and micro-scale weather systems. Moreover to operate these systems on a continuous basis is costly. The need to study thedetailed structure and characteristics of the atmospheric boundary layer and thenecessity to use economical methods have encouraged a growing effort to use remotesensing techniques, (Derr 1972), using acoustical, optical and electromagnetic waves.These techniques use the principal of active echo sounding and have the potential todetermine various atmospheric characteristics continuously in both space and timewith varying success depending on the sensitivity and resolution of individualequipment to probe the atmosphere (Little 1972, Beran and Hall 1974).
t Based on an invited talk presented by Dr S. P. Singal at the 6th InternationalSymposium on Acoustic Remote Sensing and Associated Techniques of the Atmosphere andOceans, Athens, Greece.
0143-1161/94 $10.00 © 1994 Taylor & Francis Ltd
Dow
nloa
ded
by [
Uni
vers
ity L
ibra
ry T
echn
isch
e U
nive
rsitä
t Mün
chen
] at
09:
07 1
0 N
ovem
ber
2014
428 S. P. Sinqal et al.
Taking into account the extensive developments in remote sensing systemsduring the last two decades, the overall cost of the system, the availability of tracersand the capability of measurements of stability, wind vector, mixing height,inversion height, fumigation period, turbulence strength, and the detection and onsettimes of the various atmospheric phenomena (Brown and Hall 1978, Singal 1989), itis believed that urban meteorological measurements relating to air pol ution monitoring situations can be made up entirely of an acoustic remote sensing system. It is asimple and relatively inexpensive technique. Further, strong scattering of acousticwaves by small scale turbulent fluctuations in temperature, wind speed and humiditywithin the atmospheric boundary layer are responsible for making a sodar apotential technique for boundary layer studies (Little 1969). Moreover, continuousefforts to use a sodar to monitor and predict hazardous air pollution situations havebeen made for the last few years (Wyckoff et al. 1973, Clark et al. 1977, Russell andUthe 1978, Coulter 1979, Prater and Coils 1981, Maughan et al. 1982, Singal 1988,Singal et al. 1984, 1985, 1986, 1989, Best et al. 1986, Foken et al. 1987, Walczewskiand Felesky-Bielak 1988, Neff and King 1990, Gera and Singal 1990).
A monostatic (back-scattering) non-Doppler sodar system has been operating atthe National Physical Laboratory (NPL), New Delhi for the last few years. Thissystem has the capability of detecting echoes from a height range of 700 m. Refleximages of different atmospheric stabilities and turbulence conditions have beenobserved and studied during these years (Singal et al. 1984) in the light of radiosondedata, obtained twice daily at OO.OOGMT and 12.00GMT, and surface measurementsof wind velocity and temperature. Stability information, depth of the mixing heightand dispersion coefficients have been inferred (Singal et al. 1985, 1989, Gera andSingal 1990). In this paper, the work done at NPL in this field has been describedand a case study to compute pollution concentration assuming gaussian dispersionmodel has been presented.
2. Sodar echoes and stack plume behaviourThe effluents emanating from stacks of industrial plants disperse and diffuse
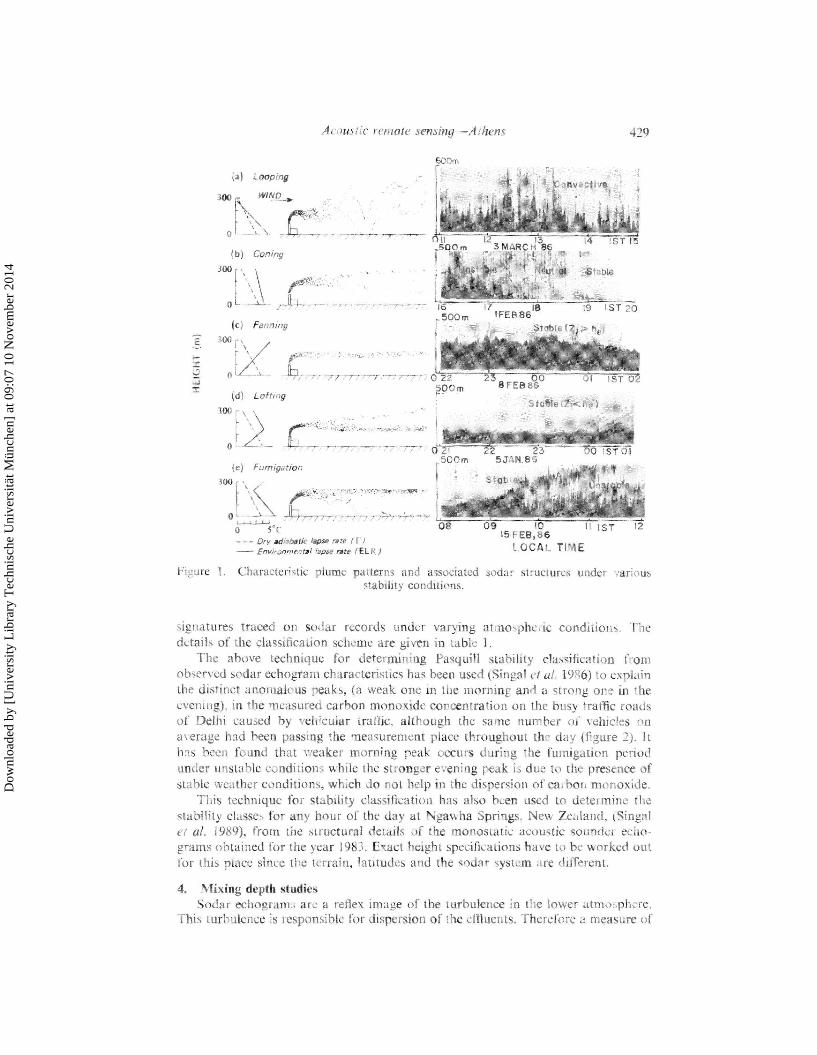
according to the conditions of atmospheric stability and the magnitude of the windvector. For normal wind conditions, the plume disperses and diffuses as a functionof lapse rate and since sodar echoes also depend upon lapse rate and the associatedturbulence, sodar echo patterns obtained under various atmospheric conditions,therefore, have been correlated with lapse rate conditions and associated stackplume behaviour. It may be seen (figure I) that looping under strong lapse rateconditions (unstable weather) is linked with sodar thermal plume structure; coningunder subadiabatic conditions is associated with evening transition from unstable tostable weather conditions; fanning is a property of the stable weather when inversiondepth is more than the height of the plume stack; lofting occurs under conditions ofinversion depth less than the height of the plume stack; and fumigation is the periodof the morning eroding stable layer.
3. Sodar echoes and stability classificationPasquill (1962) divided the atmospheric boundary layer into six categories of
stability from A to F which can be classified on the basis of data of surface windspeed, wind direction, daytime insolation, night-time sky conditions and temperature lapse rate etc. Using standard deviation of horizontal wind direction fluctuations to represent the various stability categories, Singal et al. (/985) have workedout a scheme to determine Pasquill stability categories based on different types of
Dow
nloa
ded
by [
Uni
vers
ity L
ibra
ry T
echn
isch
e U
nive
rsitä
t Mün
chen
] at
09:
07 1
0 N
ovem
ber
2014
Dow
nloa
ded
by [
Uni
vers
ity L
ibra
ry T
echn
isch
e U
nive
rsitä
t Mün
chen
] at
09:
07 1
0 N
ovem
ber
2014
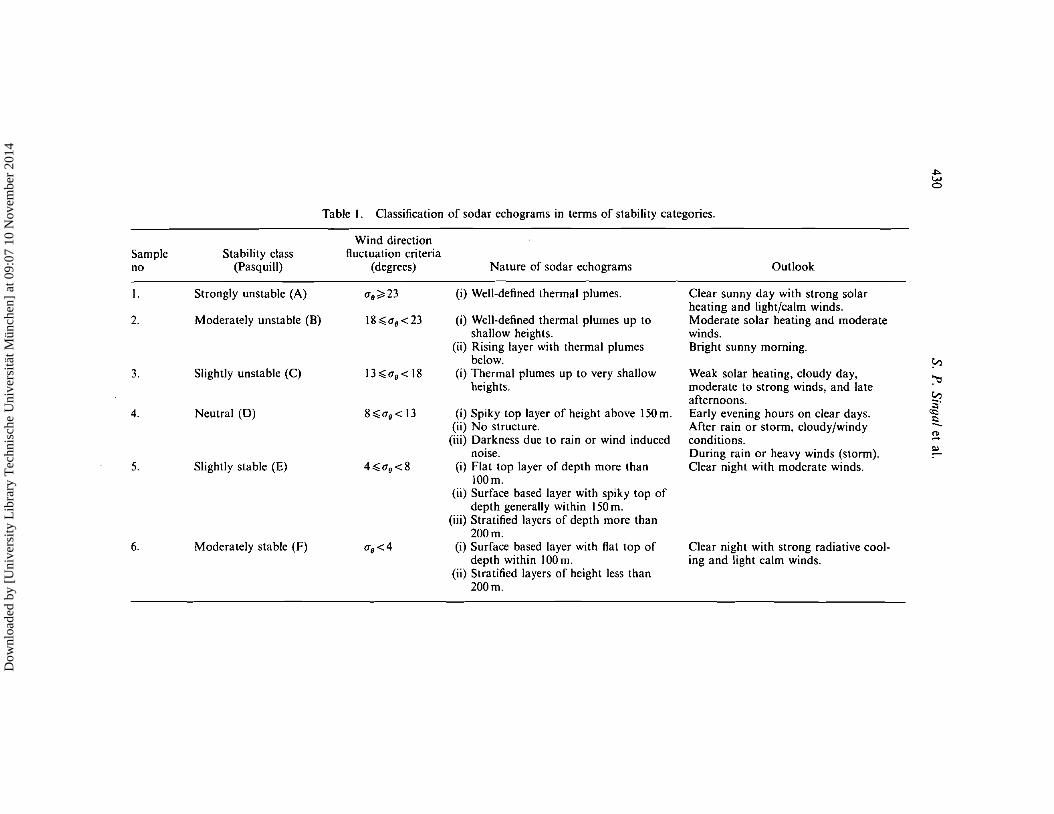
Table I. Classification of sodar echograms in terms of stability categories.
J>.wo
Wind directionSample Stability class fluctuation criteriano (Pasquill) (degrees) Nature of sodar echograms
I. Strongly unstable (A) <1.;;' 23 (i) Well-defined thermal plumes.
2. Moderately unstable (B) 18;;;<1. <23 (i) Well-defined thermal plumes up toshallow heights.
(ii) Rising layer with thermal plumesbelow.
3. Slightly unstable (C) 13;;;<1.< 18 (i) Thermal plumes up to very shallowheights.
4. Neutral (D) 8;;;<1.<13 (i) Spiky top layer of height above 150m.(ii) No structure.
(iii) Darkness due to rain or wind inducednoise.
5. Slightly stable (E) 4;;;<1.<8 (i) Flat top layer of depth more than100m.
(ii) Surface based layer with spiky top ofdepth generally within 150m.
(iii) Stratified layers of depth more than200m.
6. Moderately stable (F) <1.<4 (i) Surface based layer with flat top ofdepth within 100m.
(ii) Stratified layers of height less than200m.
Outlook
Clear sunny day with strong solarheating and light/calm winds.Moderate solar heating and moderatewinds.Bright sunny morning.
Weak solar heating, cloudy day,moderate to strong winds, and lateafternoons.Early evening hours on clear days.After rain or storm, cloudy/windyconditions.During rain or heavy winds (storm).Clear night with moderate winds.
Clear night with strong radiative cooling and light calm winds.
~
:-0V:l~.
'"-~
e:..
Dow
nloa
ded
by [
Uni
vers
ity L
ibra
ry T
echn
isch
e U
nive
rsitä
t Mün
chen
] at
09:
07 1
0 N
ovem
ber
2014
Acoustic remote sensing-Athens
EE: 8·0
Il-2000
" 1500-e."0c 6·0 10000 JANUARY- APRIL 19B3Ec NEW DELHI0.Q
!llI!!IIIII!!!!!l!!
0 4·0
jllu
"0c.2e 2·0c"uc0
U
00 04 OB 12 161ST 00
Time of doy (hrsl
431
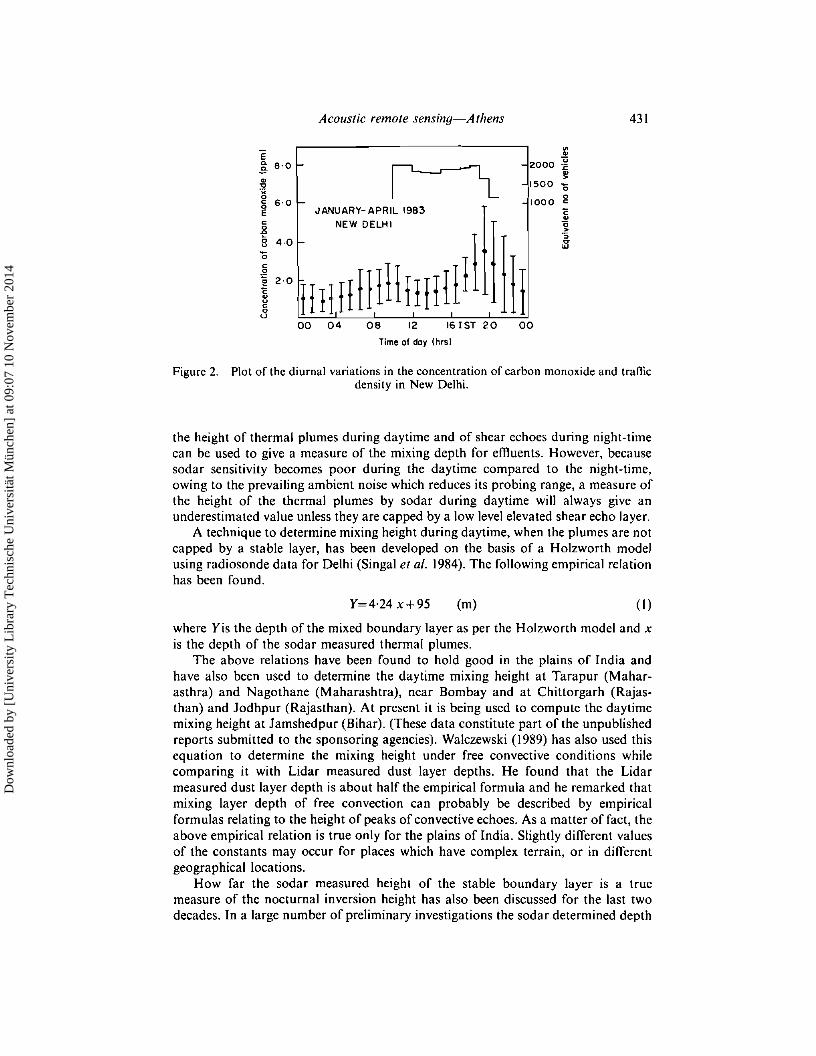
Figure 2. Plot of the diurnal variations in the concentrationof carbon monoxide and trafficdensity in New Delhi.
the height of thermal plumes during daytime and of shear echoes during night-timecan be used to give a measure of the mixing depth for effluents. However, becausesodar sensitivity becomes poor during the daytime compared to the night-time,owing to the prevailing ambient noise which reduces its probing range, a measure ofthe height of the thermal plumes by sodar during daytime will always give anunderestimated value unless they are capped by a low level elevated shear echo layer.
A technique to determine mixing height during daytime, when the plumes are notcapped by a stable layer, has been developed on the basis of a Holzworth modelusing radiosonde data for Delhi (Singal et al. 1984). The following empirical relationhas been found.
Y=4·24 x+95 (m) (I)
where Yis the depth of the mixed boundary layer as per the Holzworth model and xis the depth of the sodar measured thermal plumes.
The above relations have been found to hold good in the plains of India andhave also been used to determine the daytime mixing height at Tarapur (Maharasthra) and Nagothane (Maharashtra), near Bombay and at Chittorgarh (Rajasthan) and Jodhpur (Rajasthan). At present it is being used to compute the daytimemixing height at Jamshedpur (Bihar). (These data constitute part of the unpublishedreports submitted to the sponsoring agencies). Walczewski (1989) has also used thisequation to determine the mixing height under free convective conditions whilecomparing it with Lidar measured dust layer depths. He found that the Lidarmeasured dust layer depth is about half the empirical formula and he remarked thatmixing layer depth of free convection can probably be described by empiricalformulas relating to the height of peaks of convective echoes. As a matter of fact, theabove empirical relation is true only for the plains of India. Slightly different valuesof the constants may occur for places which have complex terrain, or in differentgeographical locations.
How far the sodar measured height of the stable boundary layer is a truemeasure of the nocturnal inversion height has also been discussed for the last twodecades. In a large number of preliminary investigations the sodar determined depth
Dow
nloa
ded
by [
Uni
vers
ity L
ibra
ry T
echn
isch
e U
nive
rsitä
t Mün
chen
] at
09:
07 1
0 N
ovem
ber
2014
432 S. P. Sinqal et al.
of the shear echoes has been reported to be equal to the height of the ground basedinversion layer measured by radiosonde (Wyckoff et al. 1973, Goroch 1976, Hickset al. 1977, Singal and Aggarwal 1979, Evers et al. 1987), tethered balloon sensors(Gogh and Zib 1978, Fitzharris et al. 1983, Walczewski 1989) and instrumentedtower and aircraft, etc. (Russell and Uthe 1978). However, Mahrt et al. (1979) whileanalysing in detail the O'Neill-Wangara data of aircraft and acoustic sounderobservations found that, on the average, the top of the sodar shear layer occurs justbelow the tow level wind maximum which, in turn, approximately coincides with theheight of the maximum in gradient Richardson number. Further, the temperatureinversion height is often around 25 per cent higher than the low level wind jet height.Similar analysis of data have been reported by Nieuwstadt and Driedonks (1979),Nieuwstadt (1981,1984) and Arya (1981).
It is still being debated whether sodar yield nocturnal mixing or inversion heightsthat are smaller than those relevant for air pollution modelling. In this context,Caughey (1982) has remarked that it is extremely valuable to obtain a qualitativepictorial representation of the turbulent stable boundary layer from acousticsounding in addition to the usual highly detailed direct measurement of the flow.Koracin and Berkowicz (1988) have reasoned for the lower measurement of theinversion height by sodar. They stated that the discrepancy is due to the dispersionof pollutants under stable conditions being governed by velocity fluctuations, whilethe vertical sodar is sensitive to temperature fluctuations with the magnitudedecreasing much faster with height than the velocity fluctuations. Further, likeCaughey they also consider that in the absence of other more reliable measurementsand taking into account the difficulties in the interpretation of sodar echograms,sodar measured height is the best measure of the turbulent stable boundary layer.
5. Determination of dispersion coefficientWork has also been carried out to determine the cross-wind dispersion coefficient
tT). from sodar data (Gera and Singal 1990). Knowledge of the bulk Richardson'snumber is used to determine the standard deviation of wind direction fluctuations,tTo, which in turn is used to compute tT,.. The values of the cross-wind dispersioncoefficient so determined have been found to agree closely with the value of thecoefficient determined from the P-G curves (Turner 1970).
Vertical dispersion coefficient (J. can be computed from a knowledge of the crosswind horizontal dispersion coefficient (J y using Martin's empirical relation (Turner1970):
0·117QtTy a, ~ U A.
wmax(2)
Here Q is the quantity of emission measured in gm sec-I, U is the downwind speedat the surface level measured in m s - I and 1>max is a function whose value is given interms of downwind distance x as per Martin's nomograms.
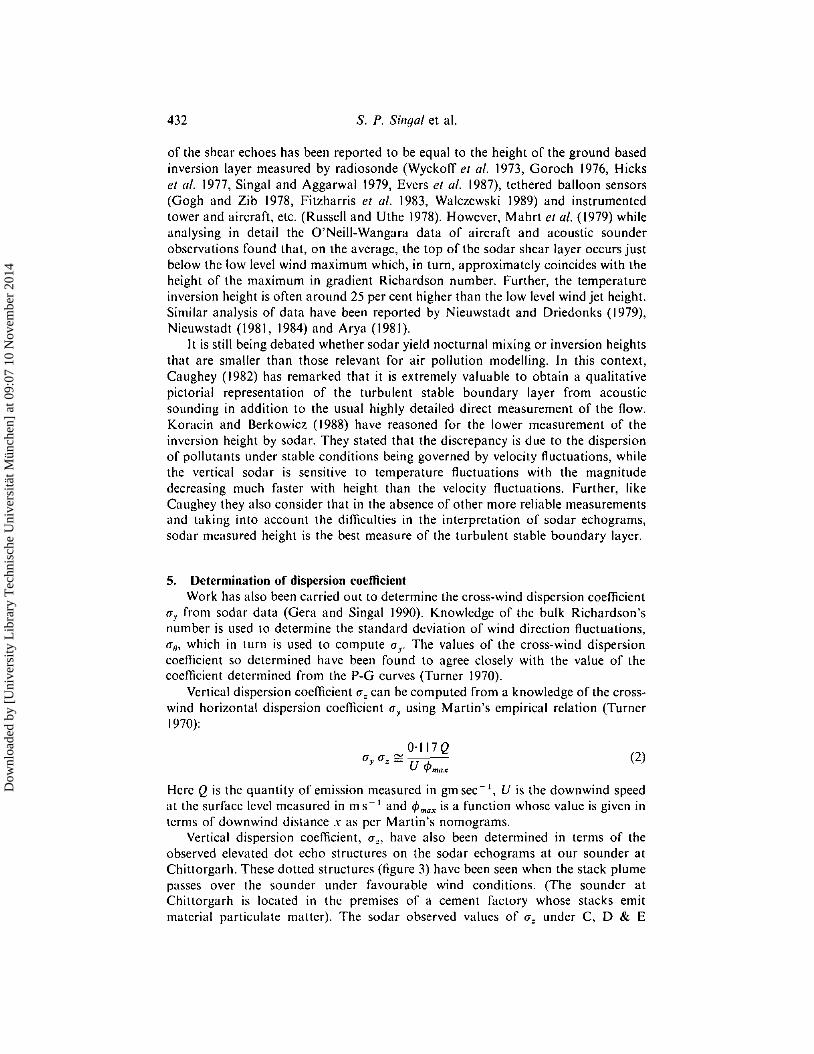
Vertical dispersion coefficient, tT" have also been determined in terms of theobserved elevated dot echo structures on the sodar echograms at our sounder atChittorgarh. These dotted structures (figure 3) have been seen when the stack plumepasses over the sounder under favourable wind conditions. (The sounder atChittorgarh is located in the premises of a cement factory whose stacks emitmaterial particulate matter). The sodar observed values of a, under C, D & E
Dow
nloa
ded
by [
Uni
vers
ity L
ibra
ry T
echn
isch
e U
nive
rsitä
t Mün
chen
] at
09:
07 1
0 N
ovem
ber
2014
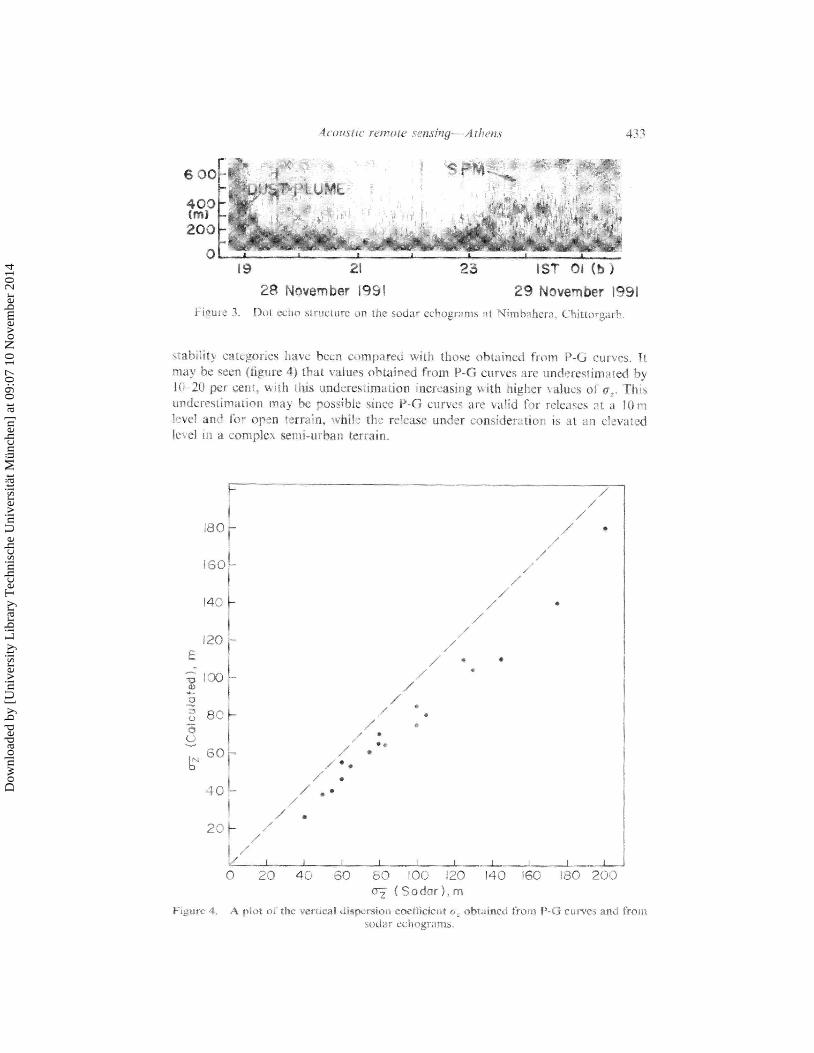
\z,lhilr L$ c , i ~ ~ g c ~ i hgt1 c ~ C C B C O ~ T ~ : ~ P C C I \$ i t 11 % # I ( > ~ C C I ~ ! ; ~ % G C L ~ j'1"<'8124 P-C; Lxtri c%. I t nr:i? hi. \i.c.ii (iiriirrc 41 riiiir x:iiuei ohiaincd f*rt>in I)-(i coi-xci nrc iindci-c\iimo~cll h j 1 4 3 2u pel" cc$ll> i l l $ % ii$1<1c~c\ii224it1rt3~1 1~3~+~eii%i$lg $% $ill l3lgilCr \ ;3iiic=% < 3 i S GZ" -1 h i %
itltiici-c,.srtrrn~:i~i~~~~ a>rtj he po8~~it3lc xincc B-6; C%~TYC,"S ;BIT xaiid f ~ 2 i l ' Y C ~ C ~ ~ \ C % .BI .t I11111
1c\e8 ,141d f t ~ c?pcm-% terrala, %it$le the rcica%c tinder. cosns%'t!c,.t.a$~.t~u 13 ;i1 ctc\;tacd Ii3 c1 I D pi cox~~pBc\ \CI~IB-~IT!-KIB~: ~i- i -~~i in ,
Dow
nloa
ded
by [
Uni
vers
ity L
ibra
ry T
echn
isch
e U
nive
rsitä
t Mün
chen
] at
09:
07 1
0 N
ovem
ber
2014
434 S. P. Singa/ et al.
6. Determination of effective stack heightOne method to determine the effective stack height, he (physical stack height plus
plume rise height), for the emitted plume is by the use of Brigg's equation (Turner1970). By this approach the increase in height above the stack height, h, depends onthe stack characteristics and the ambient atmospheric conditions relationship.
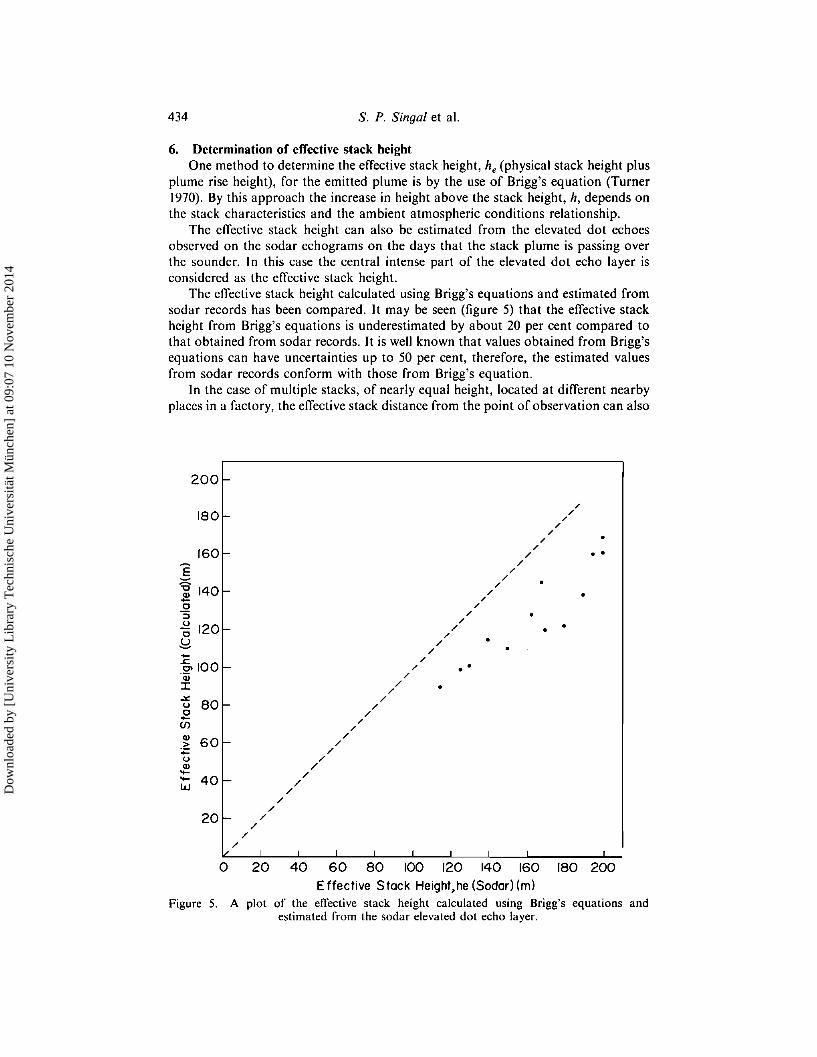
The effective stack height can also be estimated from the elevated dot echoesobserved on the sodar echograms on the days that the stack plume is passing overthe sounder. In this case the central intense part of the elevated dot echo layer isconsidered as the effective stack height.
The effective stack height calculated using Brigg's equations and estimated fromsodar records has been compared. It may be seen (figure 5) that the effective stackheight from Brigg's equations is underestimated by about 20 per cent compared tothat obtained from sodar records. It is well known that values obtained from Brigg'sequations can have uncertainties up to 50 per cent, therefore, the estimated valuesfrom sodar records conform with those from Brigg's equation.
In the case of multiple stacks, of nearly equal height, located at different nearbyplaces in a factory, the effective stack distance from the point of observation can also
200 -
..
•
I , , " ",
//
//
//
//
//
//
//
//
//
//
//
//
//
//
//
//
//
//
//
//
/20f- /
//
I, / I
40f-
120f-
160f-
180-
~ 100f-Q)
I
~ 80.E(J)
.~ 60--oQ)--l.LJ
E:; 140f.2!o:;~o~
Figure 5. A plot
40o 20 60 80 100 120 140 160 180 200Effective Stack Height,he (Soder) (rn)
of the effective stack height calculated using Brigg's equations andestimated from the sodar elevated dot echo layer.
Dow
nloa
ded
by [
Uni
vers
ity L
ibra
ry T
echn
isch
e U
nive
rsitä
t Mün
chen
] at
09:
07 1
0 N
ovem
ber
2014
Acoustic remote sensing-Athens 435
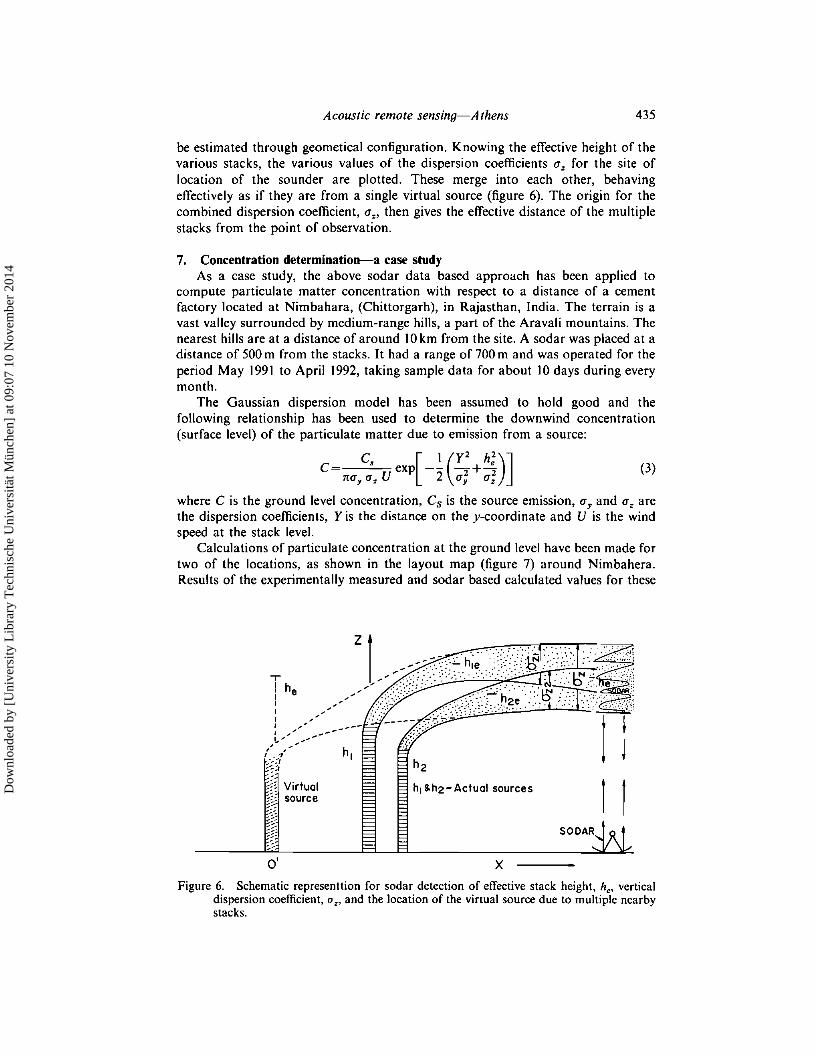
be estimated through geometical configuration. Knowing the effective height of thevarious stacks, the various values of the dispersion coefficients a, for the site oflocation of the sounder are plotted. These merge into each other, behavingeffectively as if they are from a single virtual source (figure 6). The origin for thecombined dispersion coefficient, lIZ' then gives the effective distance of the multiplestacks from the point of observation.
7. Concentration determination-a case studyAs a case study, the above sodar data based approach has been applied to
compute particulate matter concentration with respect to a distance of a cementfactory located at Nimbahara, (Chittorgarh), in Rajasthan, India. The terrain is avast valley surrounded by medium-range hills, a part of the Aravali mountains. Thenearest hills are at a distance of around 10 km from the site. A sodar was placed at adistance of 500 m from the stacks. It had a range of 700 m and was operated for theperiod May 1991 to April 1992, taking sample data for about 10 days during everymonth.
The Gaussian dispersion model has been assumed to hold good and thefollowing relationship has been used to determine the downwind concentration(surface level) of the particulate matter due to emission from a source:
C C, exp[-~ (Y2 +h;)J (3)n{1y a ; U 2 {1; {1;
where C is the ground level concentration, Cs is the source emission, {1y and a, arethe dispersion coefficients, Y is the distance on the y-coordinate and U is the windspeed at the stack level.
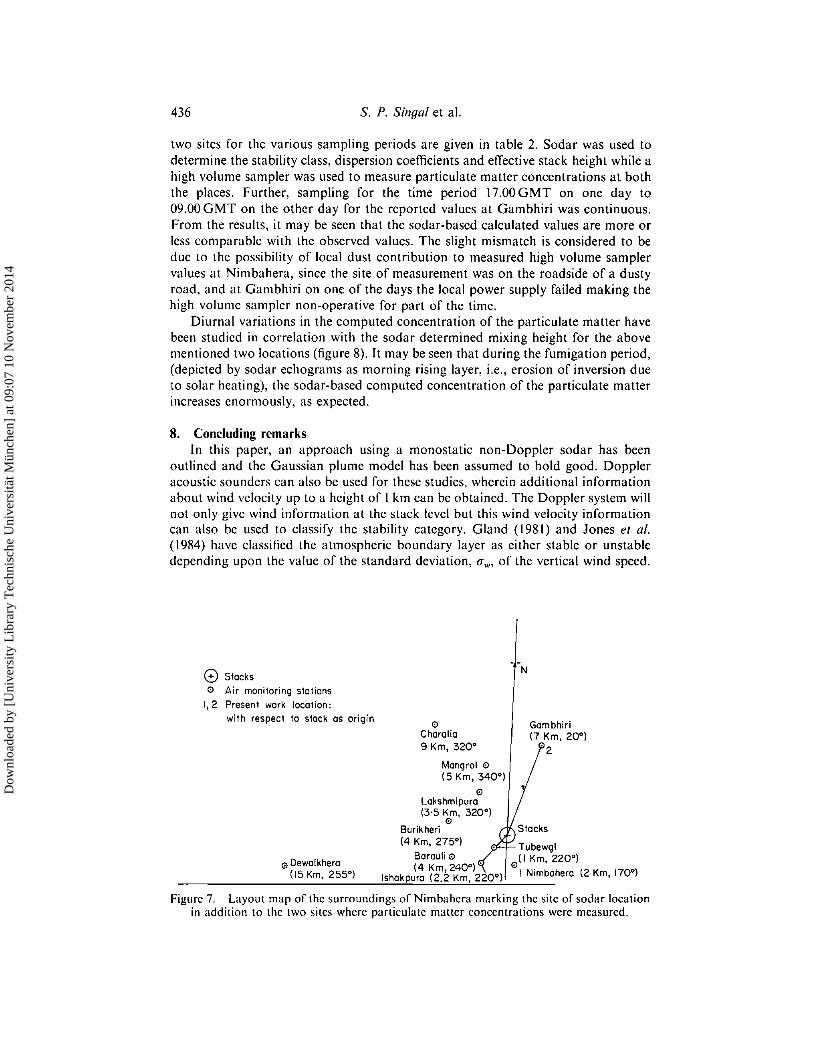
Calculations of particulate concentration at the ground level have been made fortwo of the locations, as shown in the layout map (figure 7) around Nimbahera.Results of the experimentally measured and sodar based calculated values for these
..,! heIIIII
0'
hi lh2-Actuol sources
xFigure 6. Schematic representtion for sodar detection of effective stack height, he> vertical
dispersion coefficient, u" and the location of the virtual source due to multiple nearbystacks.
Dow
nloa
ded
by [
Uni
vers
ity L
ibra
ry T
echn
isch
e U
nive
rsitä
t Mün
chen
] at
09:
07 1
0 N
ovem
ber
2014
436 S. P. Singal et al.
two sites for the various sampling periods are given in table 2. Sodar was used todetermine the stability class, dispersion coefficients and effective stack height while ahigh volume sampler was used to measure particulate matter concentrations at boththe places. Further, sampling for the time period 17.00 GMT on one day to09.00 GMT on the other day for the reported values at Gambhiri was continuous.From the results, it may be seen that the sodar-based calculated values are more orless comparable with the observed values. The slight mismatch is considered to bedue to the possibility of local dust contribution to measured high volume samplervalues at Nimbahera, since the site of measurement was on the roadside of a dustyroad, and at Gambhiri on one of the days the local power supply failed making thehigh volume sampler non-operative for part of the time.
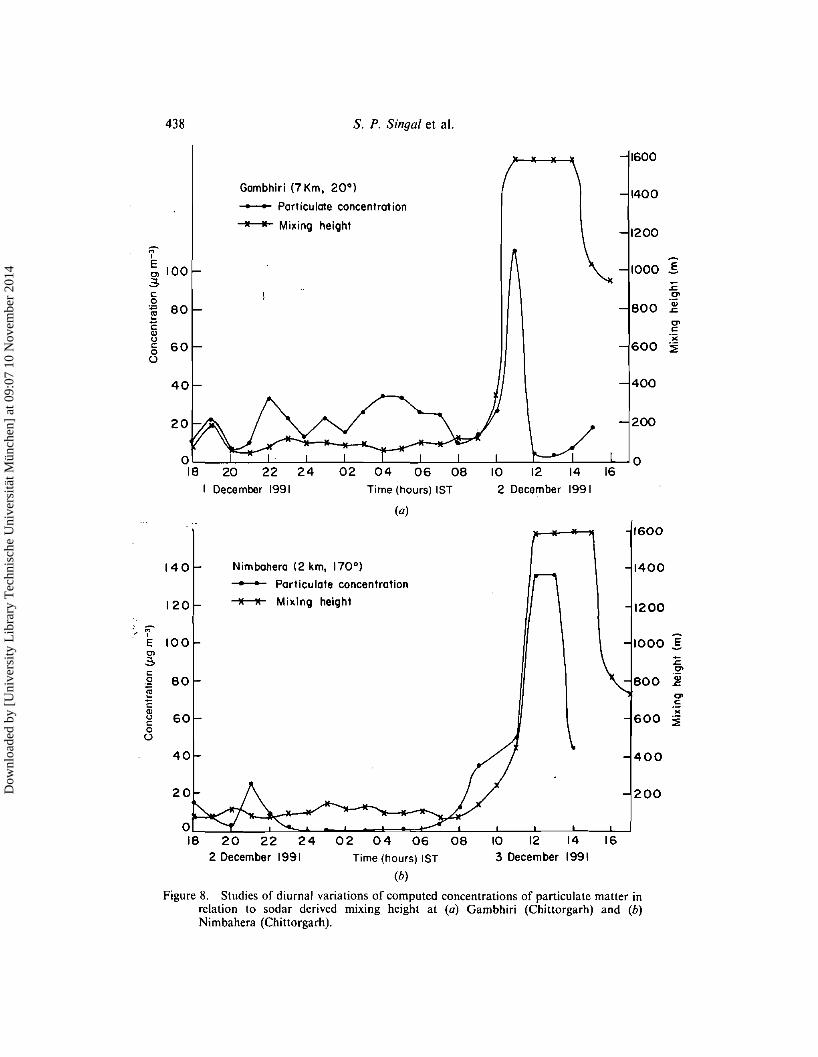
Diurnal variations in the computed concentration of the particulate matter havebeen studied in correlation with the sodar determined mixing height for the abovementioned two locations (figure 8). It may be seen that during the fumigation period,(depicted by sodar echograms as morning rising layer, i.e., erosion of inversion dueto solar heating), the sodar-based computed concentration of the particulate matterincreases enormously, as expected.
8. Concluding remarksIn this paper, an approach using a monostatic non-Doppler sodar has been
outlined and the Gaussian plume model has been assumed to hold good. Doppleracoustic sounders can also be used for these studies, wherein additional informationabout wind velocity up to a height of I km can be obtained. The Doppler system willnot only give wind information at the stack level but this wind velocity informationcan also be used to classify the stability category. Gland (1981) and Jones et al.(1984) have classified the atmospheric boundary layer as either stable or unstabledepending upon the value of the standard deviation, (Jw, of the vertical wind speed.
o Stackso Air monitoring stations
1,2 Present work locotion:with respect to stack as arigin
o Dewalkhera(15 Km, 255°)
eCharalla9 Km, 320°
Mangral 0(5 Km, 340°)
oLakshmipura(3'5 Km, 320°)
oBurikheri(4 Km, 275°)
Barauli 0(4 Km,2400) .
ishakpura (2.2 Km, 220°)
N
Gambhiri(7 Km, 20°)
'2
Tubewgl0(1 Km, 220°)
I Nimbahera (2 Km, 170°)
Figure 7. Layout map or the surroundings or Nimbahera marking the site or sodar locationin addition to the two sites where particulate matter concentrations were measured.
Dow
nloa
ded
by [
Uni
vers
ity L
ibra
ry T
echn
isch
e U
nive
rsitä
t Mün
chen
] at
09:
07 1
0 N
ovem
ber
2014
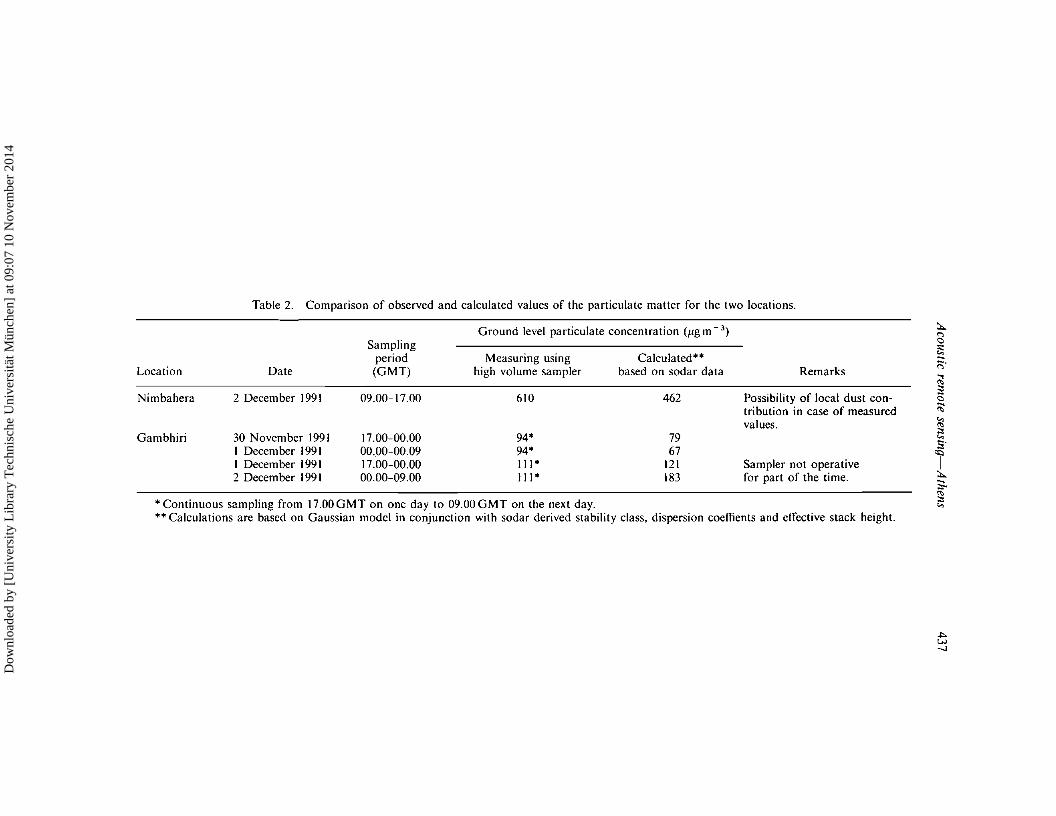
Table 2. Comparison of observed and calculated values of the particulate matter for the two locations.
Ground level particulate concentration (pg m - 3)Sampling
period Measuring using Calculated"Location Date (GMT) high volume sampler based on sodar data Remarks
Nimbahera 2 Decem ber I991 09.00-17.00 610 462 Possibility of local dust con-tribution in case of measuredvalues.
Gambhiri 30 November 1991 17.00-00.00 94' 79I December 1991 00.00-00.09 94" 67I December 1991 17.00-00.00 III" 121 Sampler not operative2 December 1991 00.00-09.00 III" 183 for part of the time.
"Continuous sampling from 17.00 GMT on one day to 09.00 GMT on the next day."Calculations are based on Gaussian model in conjunction with sodar derived stability class, dispersion coeffients and effective stack height.
:..::11:;~.
~'"'"~s·
1sa
~w-..J
Dow
nloa
ded
by [
Uni
vers
ity L
ibra
ry T
echn
isch
e U
nive
rsitä
t Mün
chen
] at
09:
07 1
0 N
ovem
ber
2014
438 S. P. Singal et al.
DecemberTime (hours) 1ST
Gambhiri (7 Km, 200)
---- Particulate concentration
........... Mixing height
O'--_.l.-_-::'-:'-_-,-L-_---'-=----:-'-_--J'-::------="-::-_...L-_~---'--__:_:....... O18
I
c:gl!!C'"uc:oo
(0)
, -. M, ,E012-c:sl!!C'"cc:oo
Nimbahera (2 km, 170 0)
............... Particulate concentration
~ Mixing height
20 22 24 02 04 082 December 1991 Time (hours) 1ST
(b)
Figure 8. Studies of diurnal variations of computed concentrations of particulate matter inrelation to sodar derived mixing height at (a) Gambhiri (Chittorgarh) and (b)Nimbahera (Chittorgarh).
Dow
nloa
ded
by [
Uni
vers
ity L
ibra
ry T
echn
isch
e U
nive
rsitä
t Mün
chen
] at
09:
07 1
0 N
ovem
ber
2014
Acoustic remote sensing-Athens 439
Thomas (1986) has reported two schemes of Pasquill stability classification based onDoppler sodar data. According to one scheme he used standard deviation, CT w , andhorizontal wind speed, u, at a height of 100m to determine stability, and accordingto the other scheme, he used standard deviation, CT"" of the vertical wind direction ata height of 100 m and the vertical profile of back-scattered amplitude. He establishedstatistical equivalence of both these schemes. Best et al. (1986) used the turbulenceparameter, CTw/U, to classify stability which, according to Gland (1981), leads tounrealistic results in the case of weak winds associated with strong atmosphericstability.
AcknowledgmentsWe wish to thank the Director, National Physical Laboratory, New Delhi, India
for his keen interest in the sodar project and for permitting us to publish this paper.
ReferencesARYA, S. P. S., 1981, Parameterizing the height of the stable atmospheric boundary layer.
Journal of Applied Meteorology, 20,1192-1202.BERAN, D. W., and HALL, F. F., JR., 1974, Remote sensing for air pollution meteorology.
Bulletin of the American Meteorological Society, 55, 1097-1105.BEST, P. R., KANOWSKI, M. L., and GREEN, D., 1986, Convective dispersion modelling
utilising acoustic sounder information, Atmospheric Research, 20, 173-198.BROWN, E. H., and HALL, F. F., JR., 1978, Advances in atmospheric acoustics. Review of
Geophysics and Space Physics, 16, 47-110.CAUGHEY, S. J., 1982, Observed characteristics of the atmospheric boundary layer. In
Turbulence and Air Pollution Modelling, edited by T. M. Nieuwstadt and H. Van Dop(Dordrecht, Holland: D. Reidel Publishing Co.), pp. 107-158.
CLARK, G. H., CHANASH, E., and BENDUN, E. O. K., 1977, Pattern recognition studies inacoustic sounding. Journal of Applied Meteorology, 16, 1365-1368.
COULTER, R. L., 1979, A comparison of three methods for measuring mixing layer height.Journal of Applied Meteorology, 11, 1495-1499.
DERR, V. E., 1972, Remote sensing of the troposphere, Wave Propagation Laboratory,NOAA, Boulder, Colorado, U.S.A. Catalogue No.C 55:602:175.
EVERS, K., NEISEER, J., and WEISS, E., 1987, Acoustic sounding of the urban boundary layerover Berlin-Adlershof in summer. Zeitschrift fur Meteoroloqie, 37, 241-252.
FITZHARRIS, B. B., TURNER, A., and McKINLEY, W., 1983, Cold season inversion frequenciesas measured by acoustic sounder in the Cromwell basin. New Zealand Journal ofScience, 26, 307-313.
FOKEN, TH., HARTMAN, K. H., KEDAR, J., KUCHLER, W., NEISSER, J., and VOGT, F., 1987,Possibilities of an optimal encoding of sodar information, Zeitschrift fur Meteoroloqie,35, 348-354.
GERA, B. S., and SINGAL, S. P., 1990, Sodar in air pollution meteorology, AtmosphericEnvironment, 24A, 2003-2009.
GLAND, H., 1981, Qualifying test on a three-dimensional doppler sodar, SATOLAS, ReportHE/3281.9 French Electricity Board, Dept of Aquatic and Atmospehric Environment,Div. of Applied Meteoorology and Pollution, Paris, France.
GOGH, R. G. VON, and Zre, P., 1978, Comparison of simultaneous tethered balloon andmonostatic acoustic sounder records of the statically stable lower atmosphere. Journalof Applied Meteorology, 17, 34-39.
GOROCH, A. K., 1976, Comparison of radiosonde and acoustic echo sounder measurements ofatmospheric thermal strata. Journal of Applied Meteorology, 15, 520-521.
HICKS, R. 8., SMITH, D., IRWIN, P. J., and MATHEWS, T., 1977, Preliminary results ofatmospheric acoustic sounding at Calgary, Boundary-Layer Meteorology, 12,201-212.
JONES, D. E., SMITH, P. J., SHAW, N. A., and BOURNE, I. A., 1984, Analysis of acoustic radarwind data. Proceedings of 8th International Clean Air Conference, Melbourne. Australia, (Sydney: Clean Air Society of Australia and New Zealand) pp. 337-349.
Dow
nloa
ded
by [
Uni
vers
ity L
ibra
ry T
echn
isch
e U
nive
rsitä
t Mün
chen
] at
09:
07 1
0 N
ovem
ber
2014
440 S. P. Singa/ et al.
KORACIN, D., and BERKOWICZ, R., 1988, Nocturnal boundary layer height: Observations byacoustic sounders and predictions in terms of surface layer parameters. BoundaryLayer Meteorology, 43, 65-83.
LITTLE, C. G., 1969, Acoustic methods for the remote probing of the lower atmosphere.Proceedings of I.£.E.E., 57, 571-578.
LITTLE, C. G., 1972, Status of remote sensing of the troposphere. Bulletin of AmericanMeteorological Society, 53, 936-949.
MAHRT, L., HEALD, R. c., LENSCHOW, D. H., STANKOV, B. B., and TROEN, I., 1979, Anobservational study of the structure of the nocturnal boundary layer. Boundary-LayerMeteorology, 17,247-264.
MAUGHAN, R. A., SPANTON, A. M., and WILLIAMS, M. L.. 1982, An analysis of the frequencydistribution of sodar derived mixing heights classified by atmospheric stability.Atmospheric Enoironment, 16, 1209-1218.
NEFF, W. D., and KING, C. W., 1990, The usc of sodars in an urban air quality study. InAcoustic Remote Sensing, edited by S. P. Singal, (New Delhi: Tata McGraw Hill),pp. 506-512.
NmuwsTADT, F. T. M., 1981, The steady state height and resistance laws of the nocturnalboundary layer: Theory compared with Cabauw observations. Boundary-LayerMeteorology, 20, 3-17.
NmuwsTADT, F. T. M., 1984, Some aspects of the turbulent stable boundary layer. BoundaryLayer Meteorology, 30, 31-55.
NIEUWSTADT, F. T. M., and DRIEDONKS, A. G. M., 1979, The nocturnal boundary layer: Acase study compared with model calculations. Journal of Applied Meteorology, 16,115-129.
PASQUILL, F., 1962, Atmospheric Diffusion (London: D. Van Nostrand Co. Ltd.).PRATER, B. E., and COLLS, J. J., 1981, Correlation between acoustic sounder dispersion
estimates, meteorological parameters and pollution concentration. AtmosphericEnuironment, 15, 793-798.
RUSSELL, P. B., and UTHE, E. E., 1978, Acoustic and direct measurements of atmosphericmixing at three sites during an air pollution incident. Atmospheric Environment, 12,1061-1074.
SINGAL, S. P., 1988. The use of an acoustic sounder in air quality studies. Journal of ScientificIndustrial Research. 47, 520-533.
SINGAL, S. P., 1989, Acoustic sounding stability studies. In Encyclopedia of EnuironmentControl Technology, vol2, Air Pollution Control. edited by P. N. CheremissinolT,(Houston, Texas: Gulf Publishing) pp. 1003-1061.
SINGAL, S. P., and AGGARWAL, S. K., 1979, Sodar and radiosonde studies of thermal structureof the lower atmosphere at Delhi. Indian Journal of Radio Space Physics, 8, 76-81.
SINGAL, S. P., GERA, B. S., and AGGARWAL, S. K., 1984, Nowcasting by acoustic remotesensing: experiences with the systems established at the National Physical Laboratory,New Delhi. Journal of Scientific Industrial Research, 43, 469-488.
SINGAL, S. P., AGGARWAL, S. K., PAHWA, D. R., and GERA, B. S., 1985, Stability studies withthe help of acoustic sounding, Atmospheric Environment, 19,221-228.
SINGAL, S. P., AGGARWAL, S. K., GERA, B. S., PAHWA, D. R., and MUKESH SHARMA, 1986,Correlation of studies of surface level carbon monoxide concentration and sodarobserved thermal structures. Atmospheric Research, 20, 133-139.
SINGAL, S. P., LEWTHWAITE, E. W. D.. and WRATT, D. S., 1989, Estimating atmosphericstability from monostatic acoustic sounder records. Atmospheric Environment, 23,2079-2084.
THOMAS, P., 1986, Stability classification by acoustic remote sensing. Atmospheric Research,20, 165-172.
TURNER, D. B., 1970, Workbook of atmospheric dispersion estimates, Publication No. AP-26,Office of Air Programs, Environmental Protection Agency, U.S.A.
WALCZEWSKI, J., 1989, Development of sodar and acoustic soundings of the atmosphere inPolland. Zeitschift Meteorologie, 39, 129-141.
WALCZEWSKI, J., and FELESKY-BIELAK, M., 1988, Diurnal variations of characteristic sodarechoes and the diurnal change of atmospheric stability. Atmospheric and Environment,22, 1793-1800.
Dow
nloa
ded
by [
Uni
vers
ity L
ibra
ry T
echn
isch
e U
nive
rsitä
t Mün
chen
] at
09:
07 1
0 N
ovem
ber
2014
Acoustic remote sensing-Athens 441
WYCKOFF, R. J., BERAN, D. W., and HALL, F. F., JR., 1973, A comparison of the low levelradiosonde and the acoustic echo sounder for monitoring atmospheric stability.Journal of Applied Meteorology, 12, 1196-1204.
Dow
nloa
ded
by [
Uni
vers
ity L
ibra
ry T
echn
isch
e U
nive
rsitä
t Mün
chen
] at
09:
07 1
0 N
ovem
ber
2014