appendix i : coverage maps & impact assessment spectrum study final page 1 of 70 16 november...
TRANSCRIPT

Interleaved Spectrum Study
Final Page 1 of 70 16 November 2007 Version 1.0 Coverage Maps and Impact assessment Appendix I
Appendix I : Coverage Maps & Impact Assessment Contents: Introduction.............................................................................................................................2 Impact on the Main Multiplexes .............................................................................................2 Theoretical Interleaved Coverage Achieved...........................................................................3 Theoretical Worst Case Impact on PSB Multiplexes .............................................................6
Impact on Bilsdale ch26......................................................................................................7 Impact on The Wrekin ch30 ...............................................................................................9 Impact on Sheffield PSB ch24..........................................................................................11 Summary Table of Worst Case Impact of Interleaved channels on PSB multiplexes......13
Worst Case Impact on COM Multiplexes.............................................................................21 Impact on Waltham COM ch29.......................................................................................21 Impact on Idle COM ch45 ................................................................................................21 Impact on Moel-y-Parc COM ch51 ..................................................................................21 Summary Table of Worst Case Impact of Interleaved channels on COM multiplexes....21

Interleaved Spectrum Study
Final Page 2 of 70 16 November 2007 Version 1.0 Coverage Maps and Impact assessment Appendix I
Introduction The introduction of any new application within the spectrum reserved for the six main multiplexes will have an impact on the coverage of the main multiplexes. The methodology adopted as part of this study for assessing the parameters associated with an interleaved channel is aimed at protecting the core coverage of a station, as defined by the digital preferred service area (DPSA), and limiting any impact to areas of station overlap. This approach protects the UK target of 98.5% coverage for the PSB multiplexes whilst allowing sufficient flexibility to identify viable interleaved channels at the majority of the 71 broadcasting stations considered. The coverage of the 71 interleaved channels (see Appendix II) and the impact on version 5.5 of the UK plan has been assessed.
Impact on the Main Multiplexes On a national basis the impact of introducing an interleaved channel at 71 stations is minimal. Basing the interleaved channels on the specified templates, UK coverage of locations where all three public service multiplexes (3PSB) are predicted as being available falls by 290 households (0.001% of UK). Coverage of locations where all six of the main multiplexes are predicted as available (6Core) falls by 2,260 households (0.009% of UK), Table AI-1. It should be noted that the use of templates is a worst case with respect to the impact on the main multiplexes; real antennas will have a lower impact. The theoretical maximum impact on the gross coverage of individual PSB stations is summarised in Table AI-4 and Table AI-5. The impact on the coverage of the PSB channels at Bilsdale (ch26), The Wrekin (ch30) and Sheffield (ch24) have been considered in more detail, Figures AI-2 to AI-7. This shows that whilst there is an impact on the gross coverage of a station it is in overlap areas and outside the DPSA. The impact on the gross coverage of individual COM stations is summarised in Table AI-6 and Table AI-7. The impact on the coverage of the COM channels at Waltham (ch29), Moel-y-Parc (ch51) and Idle (ch45) have been considered in more detail, Figures AI-8 to AI-13. This shows that whilst there is an impact on the gross coverage of a station it is in overlap areas and outside the DPSA. V5.5
coverage households
V5.5 percentage
of UK
V5.5 + 71 Interleaved
stations households
V5.5 +71 percentage
of UK
Worst case theoretical potential
Impact on v5.5 coverage households
PSB1 26,041,592 99.10% 26,041,236 99.09% -356 PSB2 26,008,270 98.97% 26,007,333 98.97% -937 PSB3 26,016,709 99.00% 26,013,973 98.99% -2,736 COM4 24,379,842 92.77% 24,373,766 92.75% -6,076 COM5 24,348,610 92.65% 24,346,493 92.65% -2,117 COM6 24,420,188 92.93% 24,414,064 92.90% -6,124 3PSB 25,906,370 98.58% 25,906,080 98.58% -290 6CORE 23,794,798 90.55% 23,792,538 90.54% -2,260
Table AI-1 : Comparison of the coverage of the Main multiplexes pre and post the introduction of interleaved channels

Interleaved Spectrum Study
Final Page 3 of 70 16 November 2007 Version 1.0 Coverage Maps and Impact assessment Appendix I
The UKPM uses a cut-off method to assess whether a location is classified as served or not. At some locations the increase in interference resulting from the introduction of interleaved services will result in the UKPM classifying these locations as not having a service, e.g. the 290 households. However, the planning rules are designed to limit the increase in interference to PSB multiplexes within the DPSA to 0.5dB and 1.0dB for commercial multiplexes. As such from a viewers point, those that are predicted as being impacted will suffer a degradation of margin of 0.5dB or 1.0dB which should in its self not result in a loss of service. Though digital systems degrade rapidly, at any location to receive a service reliably a degree of margin is required to allow for the dynamics of the RF channel. Consequently, a reduction of margin of 0.5dB or 1dB should not result in a loss of service. In areas where an impact is predicted it should manifest itself as a small increase in the number of glitches during periods of interference. Though within the DPSA the increase in interference is controlled so that a service should not be lost, outside the DPSA in overlap areas no such control exists. In these areas any predicted impact may result in the ability to receive the affected station. It should however be noted that in all cases the affected service does not provide the best service – best being as a minimum a 3PSB service and the greatest number of commercial multiplexes.
Theoretical Interleaved Coverage Achieved The 71 sites allocated an interleaved channel serve over 80% of UK households if QPSK2/3 modulation is adopted. This coverage falls to a little over 60% if a higher data rate but less robust 64QAM 2/3 modulation scheme is used, Table AI-2. The overall UK coverage of the two modulation schemes is shown in figure AI-1. The gross coverage of individual stations for these two modulation schemes is summarised in Table AI-3.
Modulation scheme
Theoretical Maximum Coverage of 71
stations households
71 stations percentage of
UK QPSK 2/3 21,504,356 81.83% 64QAM 2/3 16,857,312 64.15%
Table AI-2 : Theoretical Maximum Coverage of the 71 Interleaved Spectrum Stations It should be noted that coverage is based on the template and maximum ERP associated with each of the interleaved channels. Real antennas and ERPs will generally result in a reduction in coverage.

Interleaved Spectrum Study
Final Page 4 of 70 16 November 2007 Version 1.0 Coverage Maps and Impact assessment Appendix I
No. Station Ch
QPSK2/3 Households
served
64QAM2/3 Households
served N0. Station Ch
QPSK2/3 Households
served
64QAM2/3 Households
served
10100 CRYSTAL PALACE 29 3931009 2940378 11300 DOVER 57 319390 110551 10101 GUILDFORD 54 721099 198172 11400 TACOLNESTON 57 387237 255428 10103 REIGATE 51 263328 105226 11500 SUDBURY 49 347461 151614 10104 TUNBRIDGE WELLS 51 64744 24468 11600 BILSDALE 24 1009412 587156 10105 HEMEL HEMPSTEAD 49 589709 194604 11700 OXFORD 49 259667 152181 10200 SUTTON COLDFIELD 51 1338947 878929 11800 LLANDDONA 51 48025 33302 10201 BRIERLEY HILL 56 159420 94398 11900 CARMEL 52 102306 59724 10202 KIDDERMINSTER 56 63891 44248 12000 BELMONT 21 655746 259550 10206 BROMSGROVE 29 260141 145829 12002 OLIVERS MOUNT 56 48148 45736 10207 MALVERN 51 246390 135830 12100 THE WREKIN 48 320660 164181 10208 LARK STOKE 48 133082 66143 12300 ANGUS 48 476080 372816 10211 FENTON 29 242279 159555 12400 SANDY HEATH 49 429123 206233 10300 WINTER HILL 56 3008009 2614006 12402 LUTON 45 166709 91727 10302 PENDLE FOREST 30 158514 111716 12500 MIDHURST 46 248723 47993 10306 SADDLEWORTH 43 290267 75990 12600 HANNINGTON 43 470400 172149 10307 STORETON 30 254806 81691 12900 PRESELY 30 70426 35605 10335 LANCASTER 30 135153 63165 13000 LIMAVADY 56 78457 52501 10400 EMLEY MOOR 45 974489 684945 13001 LONDONDERRY 51 55957 48934 10403 SHEFFIELD 26 269629 162291 13100 CARADON HILL 30 238480 134973 10407 KEIGHLEY 56 311269 122538 13105 PLYMPTON 49 114655 63753 10500 BLACK HILL 51 1395627 1158332 13200 STOCKLAND HILL 30 299435 119445 10600 WENVOE 51 718212 507821 13600 BEACON HILL 49 134122 95120 10601 KILVEY HILL 30 195114 150783 13700 CALDBECK 21 139929 109664 10700 DIVIS 30 398166 279100 13800 HUNTSHAW CROSS 51 79755 54086 10801 SALISBURY 49 90465 33410 13900 HEATHFIELD 54 158880 85062 10804 POOLE 50 255945 163476 14100 REDRUTH 55 93671 71146 10805 WHITEHAWK HILL 54 211857 137366 14500 MOEL Y PARC 30 396672 96468 10860 ROWRIDGE VP 29 767967 511251 14700 CRAIGKELLY 52 715401 623422 10900 PONTOP PIKE 56 1163999 990002 14900 RIDGE HILL 30 132457 59025 10903 FENHAM 30 646056 500919 15100 BROUGHER MOUNTAIN 30 29475 18435 11000 MENDIP 55 295821 159286 15200 DARVEL 30 805318 346052 11007 BRISTOL KINGS WESTON 30 443183 230024 15211 ROSNEATH VP 48 161375 75242 11008 BRISTOL ILCHESTER CR 51 232606 162060 15300 KNOCKMORE 56 97389 61924 11100 WALTHAM 55 769427 391088 15600 ROSEMARKIE 52 89509 79000 11101 NOTTINGHAM 62 476259 284036 15800 BLUEBELL HILL 56 203385 102491 11200 DURRIS 30 412973 183405
Table AI-3 : Theoretical Predicted Gross coverage of Interleaved channels1
1 Note coverage is based on antenna templates and maximum ERP, real antenna patterns and actual ERP will generally result in lower coverage.

Interleaved Spectrum Study
Final Page 5 of 70 16 November 2007 Version 1.0 Coverage Maps and Impact assessment Appendix I
Figure AI -1 : Theoretical Maximum UK coverage of 71 site interleaved spectrum network,
70% locations

Interleaved Spectrum Study
Final Page 6 of 70 16 November 2007 Version 1.0 Coverage Maps and Impact assessment Appendix I
Theoretical Worst Case Impact on PSB Multiplexes Results Local TV 71 sites Run1 70% Locations PSB_1 Ch
Chg on
v5.5 %Chg
on v5.5 PSB_2 Ch Chg on
v5.5 %Chg
on v5.5 PSB_3 Ch Chg on
v5.5 %Chg
on v5.5 3CORE Chg on
v5.5 %Chg
on v5.5 Max Impact
11600 Bilsdale 2241753 23 0 0.0% 1914195 26 -
288377 -13.1% 1801547 29 -7653 -0.4% 1658962 -
108163 -6.1% -288377
12100 The Wrekin 1101097 23 0 0.0% 1065251 26 -1551 -0.1% 1147697 30 -
213434 -15.7% 938568 -33840 -3.5% -213434 12300 Angus 431447 57 0 0.0% 421282 60 0 0.0% 353041 53 -82835 -19.0% 348446 -71314 -17.0% -82835 10903 Fenham 422843 21 -8228 -1.9% 390002 24 -62424 -13.8% 449503 27 0 0.0% 378093 -43555 -10.3% -62424 12600 Hannington 983634 42 0 0.0% 903324 45 -14296 -1.6% 796345 51 -50448 -6.0% 673261 -13290 -1.9% -50448
10508 Cathcart 34133 48 -
37002 -52.0% 47898 52 -10667 -18.2% 73060 56 -207 -0.3% 23021 -28900 -55.7% -37002 10413 Idle 168380 21 -7383 -4.2% 141774 24 -34303 -19.5% 175442 27 0 0.0% 139567 -33270 -19.2% -34303 15800 Bluebell Hill 680744 43 -162 0.0% 1000039 54 -31746 -3.1% 701042 46 -832 -0.1% 637168 -3705 -0.6% -31746 11300 Dover 430710 50 -159 0.0% 405375 53 -1 0.0% 359564 51 -30021 -7.7% 286449 -10512 -3.5% -30021
10566 Kelvindale 9297 30 -
28184 -75.2% 8260 48 -10253 -55.4% 13288 52 -2446 -15.5% 3602 -10965 -75.3% -28184
10403 Sheffield 340602 21 -
25020 -6.8% 322548 24 -28013 -8.0% 345955 27 0 0.0% 310708 -34485 -10.0% -28013 10103 Reigate 414229 53 -767 -0.2% 476199 57 -27161 -5.4% 379921 60 0 0.0% 325687 -292 -0.1% -27161 10101 Guildford 191257 43 -9867 -4.9% 179258 46 -12539 -6.5% 176554 49 -26380 -13.0% 150895 -14548 -8.8% -26380
10406 Halifax 118253 21 -
22032 -15.7% 130129 24 -10487 -7.5% 140318 27 0 0.0% 114397 -24161 -17.4% -22032
11000 Mendip 1608879 54 -
19050 -1.2% 1394995 58 0 0.0% 1415213 61 0 0.0% 1390478 -98 0.0% -19050 10309 Ladder Hill 16160 26 -132 -0.8% 16076 23 0 0.0% 16286 29 -17607 -51.9% 14101 -741 -5.0% -17607 11596 Burnham on Crouch 34045 42 0 0.0% 31223 49 -15887 -33.7% 38287 52 0 0.0% 25823 -851 -3.2% -15887 10311 Birch Vale 28616 46 0 0.0% 12260 43 -15243 -55.4% 29370 50 0 0.0% 12234 -14999 -55.1% -15243 13115 Ivybridge 16023 52 0 0.0% 7689 49 -14498 -65.3% 9509 48 -6031 -38.8% 7444 -7404 -49.9% -14498
11030 Hutton 12504 55 -
12912 -50.8% 29361 59 0 0.0% 28997 62 0 0.0% 12486 -12804 -50.6% -12912 10355 Dog Hill 29944 46 0 0.0% 17073 43 -12817 -42.9% 29874 50 0 0.0% 16948 -12522 -42.5% -12817 15805 Farleigh 6360 50 -2 0.0% 4408 53 0 0.0% 252 56 -11744 -97.9% 226 -4119 -94.8% -11744 10177 Poplar 47543 42 0 0.0% 39184 45 -599 -1.5% 58461 49 -11392 -16.3% 38094 -1018 -2.6% -11392
Table AI-4 : Worst case impact to gross PSB coverage : Highest 25 sites

Interleaved Spectrum Study
Final Page 7 of 70 16 November 2007 Version 1.0 Coverage Maps and Impact assessment Appendix I
Impact on Bilsdale ch26 The damage to the gross coverage of Bilsdale PSB on ch26 is caused by the assignment of the channel to the relay at Sheffield for use by an interleaved application. Though the damage is numerically significant, 288,377 households, it occurs well outside Bilsdale’s service area, in areas served principally by Emley Moor, Belmont and Sheffield, figure AI-3a and figure 2. No loss of coverage is predicted within Bilsdale’s DPSA, figure AI-3b. Loss to gross 3PSB coverage is also significant in terms of population but again it occurs well outside Bilsdale’s service area, figure AI-3c, and no damage occurs within the DPSA, figure AI-3d.
Figure AI-2 : DPSA allocation in North East England
Emley Moor
Olivers Mnt
Belmont/Caldbeck
Winter Hill
Bilsdale
Pontop Pike

Interleaved Spectrum Study
Final Page 8 of 70 16 November 2007 Version 1.0 Coverage Maps and Impact assessment Appendix I
Figure : AI-3a
Worst case impact to gross ch26 288,377 Households in red
Figure : AI-3b
Worst case impact to gross ch26 within the DPSA 0 Households
Figure : AI-3c
Worst case impact to gross 3PSB 108,163 in red
Figure : AI-3d
Worst case impact to gross 3PSB within the DPSA 0 Households
Figure AI-3 : Worst Case Impact of Interleaved Spectrum on Bilsdale

Interleaved Spectrum Study
Final Page 9 of 70 16 November 2007 Version 1.0 Coverage Maps and Impact assessment Appendix I
Impact on The Wrekin ch30 The main impact to the gross coverage of The Wrekin occurs in an area between Chester and Stoke-on-Trent and around Gloucester and Cheltenham. In both cases the impact is outside the DPSA with 4 English and 2 Welsh households predicted as being impacted, Figure AI-5. The impact to gross coverage around Gloucester and Cheltenham is not only well out side the DPSA it is in an area where there are not expected to be any viewers of The Wrekin, the area being served by Ridge Hill, Malvern and Mendip. The impact around Chester is of more concern. In this area Moel-y-Parc is often assigned as the preferred station. Whilst it may provide the best service it is unlikely English viewers will watch a Welsh station. Definition of the DPSA in this area needs to be reviewed.
Figure AI-4 : DPSA allocation in West Midlands
Sutton Coldfield
Moel-y-Parc
Ridge Hill
Winter Hill
The Wrekin
Waltham

Interleaved Spectrum Study
Final Page 10 of 70 16 November 2007 Version 1.0 Coverage Maps and Impact assessment Appendix I
Figure AI-5a
Worst case impact to gross ch30 coverage 205,349 English and 8,085 Welsh households in red
Figure AI-5b
Worst case impact to net ch30 within the DPSA 4 English and 2 Welsh households
Figure AI-5c
Worst case impact to gross 3PSB 33,164 English and 676 Welsh households in red
Figure AI-5d
Worst case impact to net 3PSB within the DPSA 4 English and 2 Welsh households
Figure AI-5 : Worst Case Impact of Interleaved Spectrum on The Wrekin

Interleaved Spectrum Study
Final Page 11 of 70 16 November 2007 Version 1.0 Coverage Maps and Impact assessment Appendix I
Impact on Sheffield PSB ch24 Sheffield is a relay of the main station at Emley Moor and is designed to serve a deficiency in the town of Sheffield. Coverage of Sheffield is split between the Sheffield relay, Emley Moor and the main station at Belmont, Figure AI-6. The impact on the gross coverage of Sheffield ch24 is due to the co-channel interleaved channel allocated to Bilsdale. The impact whilst numerically significant, 28,013, is limited to households outside the DPSA within which there is no impact. A similar situation occurs with 3PSB coverage, the impact occurring outside the DPSA, Figure AI-7.
Figure AI-6 : DPSA allocation in South West Yorkshire
Sutton Coldfield
Sheffield
Belmont
Emley Moor
Chesterfield
Waltham

Interleaved Spectrum Study
Final Page 12 of 70 16 November 2007 Version 1.0 Coverage Maps and Impact assessment Appendix I
Figure AI-7a
Worst case impact of gross ch24 coverage 28,013 Households in red
Figure AI-7b
Worst case impact of net ch24 within the DPSA 0 Household
Figure AI-7c
Worst case impact of gross 3PSB coverage 34,485 Households in red
Figure AI-7d
Worst case impact of net 3PSB within the DPSA 0 Households
Figure AI-7 : Worst Case Impact of Interleaved Spectrum on Sheffield

Interleaved Spectrum Study
Final Page 13 of 70 16 November 2007 Version 1.0 Coverage Maps and Impact assessment Appendix I
Summary Table of Worst Case Impact of Interleaved channels on PSB multiplexes Results Local TV 71 sites Run1 70% Locations PSB_1 Ch
Chg on v5.5
%Chg on v5.5 PSB_2 Ch
Chg on v5.5
%Chg on v5.5 PSB_3 Ch
Chg on v5.5
%Chg on v5.5 3CORE
Chg on v5.5
%Chg on v5.5
10100 Crystal Palace 5663694 23 0 0.0% 5593995 26 -2 0.0% 5430915 30 -5656 -0.1% 5365970 -2430 0.0% 10101 Guildford 191257 43 -9867 -4.9% 179258 46 -12539 -6.5% 176554 49 -26380 -13.0% 150895 -14548 -8.8% 10102 Hertford 43156 54 -368 -0.8% 26575 58 0 0.0% 42532 61 0 0.0% 25944 -31 -0.1% 10103 Reigate 414229 53 -767 -0.2% 476199 57 -27161 -5.4% 379921 60 0 0.0% 325687 -292 -0.1% 10104 Tunbridge Wells 107477 49 -2031 -1.9% 106073 52 -171 -0.2% 99711 47 0 0.0% 94937 -82 -0.1% 10105 Hemel Hempstead 212674 41 0 0.0% 213633 44 0 0.0% 214648 47 0 0.0% 210932 0 0.0% 10106 Woolwich 47783 53 0 0.0% 51519 57 -626 -1.2% 46222 60 0 0.0% 44784 0 0.0% 10107 High Wycombe 32711 55 -3 0.0% 35080 59 0 0.0% 35272 62 0 0.0% 32709 -3 0.0% 10109 Wooburn 16481 48 0 0.0% 17100 52 0 0.0% 22998 56 0 0.0% 15804 0 0.0% 10110 Henley 12164 54 -829 -6.4% 8820 58 0 0.0% 8995 61 0 0.0% 8669 -29 -0.3% 10111 Bishops Stortford 7415 55 0 0.0% 7420 59 0 0.0% 7365 62 0 0.0% 7320 0 0.0% 10112 Chesham 8063 43 -14 -0.2% 8073 46 0 0.0% 7943 50 0 0.0% 7695 -12 -0.2% 10113 Welwyn 8512 43 -61 -0.7% 8586 46 -1 0.0% 8136 50 0 0.0% 7856 0 0.0% 10114 Great Missenden 3409 54 -182 -5.1% 2452 58 0 0.0% 2588 61 0 0.0% 2305 -1 0.0% 10115 Mickleham 5925 54 -1123 -15.9% 5130 58 0 0.0% 5629 61 0 0.0% 4819 -235 -4.6% 10117 Kenley 28193 43 -620 -2.2% 29874 46 -127 -0.4% 53831 50 -377 -0.7% 26130 -690 -2.6% 10118 Chepping Wycombe 8138 41 0 0.0% 7988 44 0 0.0% 8009 47 0 0.0% 7971 0 0.0%
10121 Hughenden 1574 43 -163 -9.4% 1727 46 0 0.0% 1337 50 0 0.0% 1307 -7 -0.5% 10122 Forest Row 2732 45 0 0.0% 2724 48 0 0.0% 3625 56 -577 -13.7% 2624 0 0.0%
10123 Chingford 2004 48 0 0.0% 2206 52 0 0.0% 17242 56 -352 -2.0% 2003 0 0.0% 10124 Hemel Hempstead Town 8556 53 0 0.0% 9927 57 -181 -1.8% 7452 60 0 0.0% 7452 0 0.0% 10125 Walthamstow North 24423 42 0 0.0% 15997 45 -445 -2.7% 18119 49 -4784 -20.9% 13401 -853 -6.0% 10126 St Marks VP 5117 53 0 0.0% 6646 57 -407 -5.8% 6700 60 0 0.0% 5044 0 0.0% 10130 Marlow Bottom 5665 54 -51 -0.9% 3352 58 0 0.0% 3261 61 0 0.0% 3119 -2 -0.1% 10131 Cane Hill 10854 54 -16 -0.1% 8947 58 0 0.0% 10790 61 0 0.0% 8942 0 0.0%
Table AI-5 : Worst Case impact to gross coverage of Interleaved channels on PSB multiplexes

Interleaved Spectrum Study
Final Page 14 of 70 16 November 2007 Version 1.0 Coverage Maps and Impact assessment Appendix I
Results Local TV 71 sites Run1 70% Locations PSB_1 Ch
Chg on v5.5
%Chg on v5.5 PSB_2 Ch
Chg on
v5.5 %Chg on
v5.5 PSB_3 Ch
Chg on
v5.5 %Chg on
v5.5 3CORE
Chg on
v5.5 %Chg
on v5.5 10133 New Addington 4252 54 0 0.0% 2663 58 0 0.0% 4178 61 0 0.0% 2414 0 0.0% 10134 West Wycombe 5216 43 -23 -0.4% 5225 46 0 0.0% 5161 50 -9 -0.2% 4889 -9 -0.2% 10135 Otford 9579 53 0 0.0% 9559 57 -63 -0.7% 10055 60 0 0.0% 8855 0 0.0% 10136 Lea Bridge 9362 55 -149 -1.6% 10232 59 0 0.0% 9595 62 0 0.0% 8896 -149 -1.6% 10137 Micklefield 3364 53 0 0.0% 3452 57 -20 -0.6% 3452 60 0 0.0% 3358 0 0.0% 10138 Alexandra Palace 27807 54 -1214 -4.2% 37624 58 0 0.0% 25567 61 0 0.0% 20556 0 0.0% 10139 Dorking HP 3894 41 0 0.0% 3882 44 0 0.0% 3883 47 0 0.0% 3882 0 0.0% 10140 Caterham 3551 55 -17 -0.5% 3578 59 0 0.0% 3578 62 0 0.0% 3551 -17 -0.5% 10141 East Grinstead 2952 55 0 0.0% 4145 43 0 0.0% 3358 62 0 0.0% 2922 0 0.0% 10142 Biggin Hill 2142 42 0 0.0% 1968 45 -132 -6.3% 1740 49 -595 -25.5% 1656 -438 -20.9% 10143 Croydon Old Town 12191 48 0 0.0% 12499 52 0 0.0% 23557 56 0 0.0% 12076 0 0.0% 10147 Skirmett 268 41 0 0.0% 268 44 0 0.0% 268 47 0 0.0% 268 0 0.0% 10148 St Albans 5909 53 0 0.0% 6937 57 -72 -1.0% 3647 60 0 0.0% 3638 0 0.0% 10149 Gravesend 6712 55 0 0.0% 6707 59 0 0.0% 6789 57 -203 -2.9% 6205 -21 -0.3% 10150 Wonersh 3271 42 0 0.0% 4552 45 -79 -1.7% 2552 51 -487 -16.0% 2405 -68 -2.7% 10154 New Barnet 9202 55 0 0.0% 9211 59 0 0.0% 9149 62 0 0.0% 9109 0 0.0% 10155 Edmonton 4953 54 0 0.0% 5218 58 0 0.0% 4953 61 0 0.0% 4354 0 0.0% 10158 Finchley 7180 48 0 0.0% 7730 52 0 0.0% 10452 56 0 0.0% 7064 0 0.0% 10159 Old Coulsdon 821 48 0 0.0% 786 52 0 0.0% 1781 56 0 0.0% 756 0 0.0% 10162 Kensal Town 16286 48 0 0.0% 18044 52 0 0.0% 34294 56 0 0.0% 14776 0 0.0% 10164 Hammersmith 34673 55 0 0.0% 36944 59 0 0.0% 35158 62 0 0.0% 33447 0 0.0% 10166 Hampstead Heath 1932 41 0 0.0% 1958 44 0 0.0% 1958 47 0 0.0% 1926 0 0.0% 10167 St Marks HP 3913 53 0 0.0% 5280 57 -466 -8.1% 5476 60 0 0.0% 3821 0 0.0% 10168 Assendon 429 55 0 0.0% 610 59 0 0.0% 591 62 0 0.0% 429 0 0.0% 10170 Worlds End 46008 43 0 0.0% 45989 46 0 0.0% 47758 50 -65 -0.1% 43747 -65 -0.1%
Table AI-5 : Worst Case impact to gross coverage of Interleaved channels on PSB multiplexes

Interleaved Spectrum Study
Final Page 15 of 70 16 November 2007 Version 1.0 Coverage Maps and Impact assessment Appendix I
Results Local TV 71 sites Run1 70% Locations PSB_1 Ch
Chg on
v5.5 %Chg
on v5.5 PSB_2 Ch
Chg on
v5.5 %Chg
on v5.5 PSB_3 Ch
Chg on
v5.5 %Chg
on v5.5 3CORE
Chg on
v5.5 %Chg
on v5.5 10173 Orpington 16503 55 -343 -2.0% 17131 59 0 0.0% 16597 62 0 0.0% 16123 -298 -1.8% 10174 Greenwich 2872 48 0 0.0% 3428 52 0 0.0% 13149 56 0 0.0% 2825 0 0.0%
10177 Poplar 47543 42 0 0.0% 39184 45 -599 -1.5% 58461 49 -
11392 -16.3% 38094 -1018 -2.6% 10179 Dorking VP 1886 41 0 0.0% 1886 44 0 0.0% 1868 47 0 0.0% 1868 0 0.0% 10180 Farningham 1147 48 0 0.0% 1148 52 0 0.0% 1164 56 -25 -2.1% 998 0 0.0% 10184 Sutton HP 874 55 0 0.0% 874 59 0 0.0% 874 62 0 0.0% 874 0 0.0% 10185 Sutton VP 11222 55 0 0.0% 11676 59 0 0.0% 11828 62 0 0.0% 11184 0 0.0%
10200 Sutton Coldfield 3392206 43 -
11139 -0.3% 3374265 46 -64 0.0% 3266581 50 -1511 0.0% 3220776 -5842 -0.2% 10201 Kinver 2110 48 -1 0.0% 2139 52 0 0.0% 930 56 -1736 -65.1% 930 -1178 -55.9% 10202 Kidderminster 49547 54 0 0.0% 48783 58 0 0.0% 49445 61 0 0.0% 48736 0 0.0% 10203 Brierley Hill 139607 53 0 0.0% 135713 57 -380 -0.3% 137159 60 0 0.0% 132654 -227 -0.2% 10205 Edgbaston 26104 21 -545 -2.0% 27026 24 0 0.0% 27277 27 0 0.0% 26035 -443 -1.7% 10206 Bromsgrove 79126 23 0 0.0% 79658 26 -1 0.0% 77612 30 -6027 -7.2% 74402 -2554 -3.3% 10207 Malvern 117055 53 0 0.0% 112582 57 -1065 -0.9% 117551 60 0 0.0% 111443 -944 -0.8% 10208 Lark Stoke 150076 23 0 0.0% 151786 26 -17 0.0% 146103 30 -6932 -4.5% 139194 -3644 -2.6% 10210 Leek 13643 22 0 0.0% 13659 25 0 0.0% 13712 28 0 0.0% 13593 0 0.0% 10211 Fenton 171149 21 -282 -0.2% 167850 24 -50 0.0% 166364 27 0 0.0% 165848 -18 0.0% 10212 Ashbourne 5051 22 0 0.0% 5058 25 0 0.0% 5055 28 0 0.0% 5046 0 0.0% 10214 Hartington 219 48 -2 -0.9% 220 52 0 0.0% 284 56 0 0.0% 217 -2 -0.9% 10216 Over Norton 2474 48 -161 -6.1% 2628 52 0 0.0% 3038 56 0 0.0% 2474 -125 -4.8% 10217 Bretch Hill 12835 48 -744 -5.5% 13596 52 0 0.0% 20059 56 -5 0.0% 12809 -723 -5.3% 10219 Icomb Hill 2288 22 0 0.0% 2323 25 0 0.0% 2351 28 0 0.0% 2284 0 0.0% 10221 Leamington Spa 32964 55 -616 -1.8% 34050 59 0 0.0% 34312 62 -228 -0.7% 32943 -637 -1.9% 10222 Kenilworth 3637 53 0 0.0% 2400 57 0 0.0% 3695 60 0 0.0% 2387 0 0.0% 10227 Allesley Park 28079 22 0 0.0% 28309 25 0 0.0% 28546 28 0 0.0% 28059 0 0.0%
Table AI-5 : Worst Case impact to gross coverage of Interleaved channels on PSB multiplexes

Interleaved Spectrum Study
Final Page 16 of 70 16 November 2007 Version 1.0 Coverage Maps and Impact assessment Appendix I
Results Local TV 71 sites Run1 70% Locations PSB_1 Ch
Chg on
v5.5 %Chg
on v5.5 PSB_2 Ch
Chg on
v5.5 %Chg
on v5.5 PSB_3 Ch
Chg on
v5.5 %Chg
on v5.5 3CORE
Chg on
v5.5 %Chg
on v5.5 10228 Cheadle 4885 48 -238 -4.6% 5162 52 -1 0.0% 5133 56 -115 -2.2% 4795 -177 -3.6% 10229 Tenbury Wells 2345 53 0 0.0% 2237 57 0 0.0% 2333 60 0 0.0% 2222 0 0.0% 10230 Redditch 5934 22 0 0.0% 5972 25 0 0.0% 5995 28 -22 -0.4% 5934 0 0.0% 10232 Ironbridge 1086 54 0 0.0% 1086 58 0 0.0% 1072 61 0 0.0% 1072 0 0.0% 10233 Guiting Power 375 41 0 0.0% 375 44 0 0.0% 375 47 0 0.0% 375 0 0.0% 10235 Ambergate 11154 22 0 0.0% 11548 25 0 0.0% 11817 28 0 0.0% 11145 0 0.0% 10236 Ipstones Edge 379 53 0 0.0% 367 57 0 0.0% 378 60 0 0.0% 367 0 0.0% 10237 Whittingslow 2666 53 0 0.0% 2688 57 0 0.0% 2637 60 0 0.0% 2627 0 0.0% 10238 Oakamoor 443 21 -1 -0.2% 447 24 0 0.0% 442 27 0 0.0% 432 -1 -0.2%
10242 Turves Green 9068 55 -
1250 -12.1% 10297 59 0 0.0% 9541 62 -867 -8.3% 8687 -1610 -15.6% 10243 Brailes 863 21 0 0.0% 867 24 0 0.0% 888 27 0 0.0% 863 0 0.0% 10245 Bridgnorth 3554 55 0 0.0% 3557 59 0 0.0% 3659 62 0 0.0% 3550 0 0.0% 10247 Woodford Halse 1459 22 0 0.0% 1460 25 0 0.0% 1461 28 0 0.0% 1459 0 0.0% 10249 Winshill 6380 53 0 0.0% 3470 57 0 0.0% 6444 60 0 0.0% 2214 0 0.0%
10251 Gravelly Hill 2363 55 -
1929 -44.9% 4493 59 0 0.0% 4687 62 -5 -0.1% 2363 -1929 -44.9%
10252 Harborne 13877 48 -
1369 -9.0% 16673 52 -181 -1.1% 10891 56 -7606 -41.1% 8224 -3397 -29.2% 10253 Repton 2912 53 0 0.0% 851 57 0 0.0% 2938 60 0 0.0% 820 0 0.0% 10254 Earl Sterndale 457 54 0 0.0% 456 58 0 0.0% 456 61 0 0.0% 455 0 0.0% 10255 Winchcombe 1826 54 0 0.0% 1825 58 0 0.0% 1829 61 0 0.0% 1825 0 0.0% 10256 Hamstead 5435 21 0 0.0% 5454 24 0 0.0% 5454 27 0 0.0% 5435 0 0.0% 10257 Queslett 1692 54 0 0.0% 1692 58 0 0.0% 1692 61 0 0.0% 1692 0 0.0% 10258 Long Compton 328 22 0 0.0% 328 25 0 0.0% 328 28 0 0.0% 328 0 0.0% 10259 Perry Beeches 3688 22 0 0.0% 3757 25 0 0.0% 3790 28 0 0.0% 3688 0 0.0% 10260 Rugeley 8384 48 -3 0.0% 8587 52 0 0.0% 3203 56 -3 -0.1% 3156 -4 -0.1%
10266 Gib Heath 4775 55 -
6652 -58.2% 11122 59 0 0.0% 11238 62 -523 -4.4% 4746 -6374 -57.3%
Table AI-5 : Worst Case impact to gross coverage of Interleaved channels on PSB multiplexes

Interleaved Spectrum Study
Final Page 17 of 70 16 November 2007 Version 1.0 Coverage Maps and Impact assessment Appendix I
Results Local TV 71 sites Run1 70% Locations PSB_1 Ch
Chg on
v5.5 %Chg
on v5.5 PSB_2 Ch
Chg on
v5.5 %Chg
on v5.5 PSB_3 Ch
Chg on
v5.5 %Chg
on v5.5 3CORE
Chg on
v5.5 %Chg
on v5.5
10300 Winter Hill 3171362 62 -
5218 -0.2% 3240524 59 0 0.0% 3067737 54 0 0.0% 3038374 -6 0.0% 10301 Darwen 36536 45 0 0.0% 36844 49 0 0.0% 36377 42 0 0.0% 36334 0 0.0% 10302 Pendle Forest 121678 28 0 0.0% 121579 25 0 0.0% 122161 22 0 0.0% 121053 0 0.0%
10303 Haslingden 262545 26 -42 0.0% 257843 23 0 0.0% 300660 29 -
10862 -3.5% 246713 -1176 -0.5% 10304 Elton 2917 27 0 0.0% 2953 24 0 0.0% 2803 21 0 0.0% 2756 0 0.0%
10306 Saddleworth 90292 45 -
1033 -1.1% 93625 49 0 0.0% 89577 42 0 0.0% 88314 -692 -0.8% 10307 Storeton 244349 28 0 0.0% 245087 25 0 0.0% 255668 22 0 0.0% 240373 0 0.0% 10308 Bacup 8947 46 0 0.0% 8966 43 -2 0.0% 8909 50 0 0.0% 8907 -2 0.0%
10309 Ladder Hill 16160 26 -132 -0.8% 16076 23 0 0.0% 16286 29 -
17607 -51.9% 14101 -741 -5.0% 10310 Bidston 13882 44 0 0.0% 13840 41 0 0.0% 13937 47 0 0.0% 13806 0 0.0%
10311 Birch Vale 28616 46 0 0.0% 12260 43 -
15243 -55.4% 29370 50 0 0.0% 12234 -
14999 -55.1% 10312 Whitworth 24271 28 0 0.0% 23781 25 0 0.0% 23258 22 0 0.0% 22751 0 0.0% 10313 Glossop 23841 28 0 0.0% 23454 25 0 0.0% 23251 22 0 0.0% 23024 0 0.0% 10314 Buxton 11107 27 0 0.0% 11031 24 -72 -0.6% 11539 21 -52 -0.4% 11015 -84 -0.8% 10315 Moss Bank 3153 27 0 0.0% 3153 24 0 0.0% 3125 21 0 0.0% 3125 0 0.0% 10317 Chaigley 2389 27 0 0.0% 2243 24 -10 -0.4% 2189 21 0 0.0% 2143 -9 -0.4% 10318 Trawden 6224 53 0 0.0% 5995 60 0 0.0% 6412 57 -76 -1.2% 5992 0 0.0% 10319 Whalley 11500 46 0 0.0% 11461 43 -7 -0.1% 11535 50 0 0.0% 11436 -7 -0.1% 10322 Littleborough 22777 27 0 0.0% 22723 24 0 0.0% 22487 21 -1 0.0% 22301 -1 0.0% 10325 North Oldham 89068 27 0 0.0% 87908 24 -46 -0.1% 87021 21 0 0.0% 86485 0 0.0% 10326 Macclesfield 19621 28 0 0.0% 19540 25 0 0.0% 19443 22 0 0.0% 19391 0 0.0% 10327 Congleton 9778 44 0 0.0% 9785 41 0 0.0% 9758 47 0 0.0% 9754 0 0.0% 10328 Manchester Hulme 7827 44 0 0.0% 7827 41 0 0.0% 7932 47 0 0.0% 7827 0 0.0% 10330 Burbage 4952 47 0 0.0% 4918 41 0 0.0% 4926 44 0 0.0% 4900 0 0.0% 10331 Oakenhead 6882 44 0 0.0% 6890 41 0 0.0% 6887 47 0 0.0% 6872 0 0.0%
Table AI-5 : Worst Case impact to gross coverage of Interleaved channels on PSB multiplexes

Interleaved Spectrum Study
Final Page 18 of 70 16 November 2007 Version 1.0 Coverage Maps and Impact assessment Appendix I
Results Local TV 71 sites Run1 70% Locations PSB_1 Ch
Chg on
v5.5 %Chg
on v5.5 PSB_2 Ch
Chg on
v5.5 %Chg
on v5.5 PSB_3 Ch
Chg on
v5.5 %Chg
on v5.5 3CORE
Chg on
v5.5 %Chg
on v5.5 10332 Whitewell 3246 53 0 0.0% 3161 60 0 0.0% 3177 57 0 0.0% 3161 0 0.0% 10333 Delph 2097 26 0 0.0% 2133 23 0 0.0% 2224 29 0 0.0% 2075 0 0.0% 10334 Far Highfield 687 52 0 0.0% 791 56 -37 -4.5% 797 48 0 0.0% 683 -3 -0.4% 10335 Lancaster 156710 27 0 0.0% 156426 24 -49 0.0% 154721 21 -277 -0.2% 153730 -101 -0.1% 10336 Kendal 27763 60 0 0.0% 27795 53 0 0.0% 27987 57 0 0.0% 27425 0 0.0% 10338 Windermere 9397 41 0 0.0% 9273 47 0 0.0% 9333 44 0 0.0% 9262 0 0.0% 10339 Blackburn 8364 46 0 0.0% 8341 43 0 0.0% 8478 50 0 0.0% 8258 0 0.0% 10341 Prestbury 1568 46 0 0.0% 1084 43 -468 -30.2% 1572 50 0 0.0% 1084 -468 -30.2% 10342 Stockport 3857 24 0 0.0% 3816 21 0 0.0% 3846 27 0 0.0% 3801 0 0.0% 10344 Millom Park 8136 28 0 0.0% 8086 25 0 0.0% 8566 22 0 0.0% 8086 0 0.0% 10345 Coniston 628 24 0 0.0% 629 27 0 0.0% 635 21 0 0.0% 628 0 0.0% 10346 Lees 5513 28 0 0.0% 5466 25 0 0.0% 5402 22 0 0.0% 5399 0 0.0% 10347 Ramsbottom 39431 53 0 0.0% 35747 60 0 0.0% 36497 57 -1838 -4.8% 34909 -474 -1.3% 10348 Dalton 4060 46 0 0.0% 4059 43 0 0.0% 4039 50 0 0.0% 4025 0 0.0% 10349 Over Biddulph 6192 57 0 0.0% 6183 53 0 0.0% 6195 60 0 0.0% 6175 0 0.0% 10350 Hawkshead 2265 23 0 0.0% 2290 29 0 0.0% 2265 26 0 0.0% 2257 0 0.0% 10352 Haughton Green 1147 46 0 0.0% 945 43 -202 -17.6% 1147 50 0 0.0% 945 -202 -17.6% 10353 Parbold 2703 44 0 0.0% 2703 41 0 0.0% 2728 47 0 0.0% 2703 0 0.0% 10354 Chinley 2442 53 0 0.0% 2435 60 0 0.0% 2429 57 0 0.0% 2426 0 0.0%
10355 Dog Hill 29944 46 0 0.0% 17073 43 -
12817 -42.9% 29874 50 0 0.0% 16948 -
12522 -42.5% 10356 Barrow Town Hall 4031 44 0 0.0% 4207 41 0 0.0% 4029 47 0 0.0% 4029 0 0.0% 10357 Roose VP 1708 22 0 0.0% 1709 28 0 0.0% 1708 25 0 0.0% 1708 0 0.0% 10358 Romiley 5463 44 0 0.0% 5449 41 0 0.0% 5462 47 0 0.0% 5433 0 0.0% 10359 Bollington 2614 27 0 0.0% 2456 24 0 0.0% 2368 21 0 0.0% 2362 0 0.0% 10360 Langley 2896 27 0 0.0% 2878 24 0 0.0% 2775 21 0 0.0% 2740 0 0.0%
Table AI-5 : Worst Case impact to gross coverage of Interleaved channels on PSB multiplexes

Interleaved Spectrum Study
Final Page 19 of 70 16 November 2007 Version 1.0 Coverage Maps and Impact assessment Appendix I
Results Local TV 71 sites Run1 70% Locations PSB_1 Ch
Chg on
v5.5 %Chg
on v5.5 PSB_2 Ch
Chg on
v5.5 %Chg
on v5.5 PSB_3 Ch
Chg on
v5.5 %Chg
on v5.5 3CORE
Chg on
v5.5 %Chg
on v5.5 10361 Kendal Fell 11764 43 0 0.0% 11766 50 0 0.0% 11758 46 0 0.0% 11736 0 0.0% 10362 Ribblesdale 213 44 0 0.0% 213 41 0 0.0% 213 47 0 0.0% 213 0 0.0% 10364 Backbarrow 581 53 0 0.0% 582 60 0 0.0% 584 57 -3 -0.5% 576 0 0.0% 10365 West Kirby 5878 27 0 0.0% 6502 24 0 0.0% 5775 21 0 0.0% 5679 0 0.0% 10366 Brook Bottom 5543 53 0 0.0% 6186 60 0 0.0% 6260 57 0 0.0% 5432 0 0.0% 10368 Mottram In Longdendale 6897 46 0 0.0% 6352 43 -485 -7.1% 6852 50 0 0.0% 6307 -485 -7.1% 10370 Stavely In Cartmel 533 46 0 0.0% 535 43 0 0.0% 532 50 0 0.0% 532 0 0.0% 10371 Penny Bridge 702 26 0 0.0% 700 23 0 0.0% 733 29 0 0.0% 697 0 0.0% 10372 Cartmel 328 28 0 0.0% 328 25 0 0.0% 328 22 0 0.0% 328 0 0.0% 10373 Urswick 348 44 0 0.0% 348 41 0 0.0% 362 47 0 0.0% 348 0 0.0% 10374 Melling VP 1222 57 0 0.0% 1219 60 0 0.0% 1219 53 0 0.0% 1214 0 0.0% 10376 Austwick 459 45 0 0.0% 460 49 0 0.0% 458 42 0 0.0% 458 0 0.0% 10377 Chatburn 493 26 0 0.0% 493 23 0 0.0% 505 29 0 0.0% 493 0 0.0% 10378 Woodnook 9456 45 0 0.0% 9545 49 0 0.0% 9478 42 0 0.0% 9454 0 0.0% 10379 Melling HP 200 57 0 0.0% 200 60 0 0.0% 200 53 0 0.0% 200 0 0.0% 10380 Newchurch 4202 21 -2 0.0% 3565 24 0 0.0% 3535 27 0 0.0% 3534 0 0.0% 10382 Roose HP 10271 22 0 0.0% 9918 28 0 0.0% 9883 25 0 0.0% 9818 0 0.0% 10385 Middleton 8095 22 0 0.0% 8083 25 0 0.0% 8094 28 0 0.0% 8051 0 0.0% 10387 Wardle 11783 28 0 0.0% 11703 25 0 0.0% 11593 22 0 0.0% 11565 0 0.0% 10388 Norden 7469 53 0 0.0% 7459 57 -6 -0.1% 6980 60 0 0.0% 6923 0 0.0% 10389 Brinscall 1079 21 0 0.0% 1073 24 0 0.0% 1080 27 0 0.0% 1071 0 0.0% 10390 Broadbottom 538 45 0 0.0% 537 42 0 0.0% 538 49 0 0.0% 536 0 0.0% 10391 Portwood 2166 28 0 0.0% 2134 25 0 0.0% 1971 22 0 0.0% 1916 0 0.0% 10394 Whaley Bridge 1722 45 0 0.0% 1707 49 0 0.0% 1722 42 0 0.0% 1705 0 0.0% 10396 Walton Le Dale 5150 27 0 0.0% 4698 24 -211 -4.3% 4713 21 -88 -1.8% 4555 -246 -5.1%
Table AI-5 : Worst Case impact to gross coverage of Interleaved channels on PSB multiplexes

Interleaved Spectrum Study
Final Page 20 of 70 16 November 2007 Version 1.0 Coverage Maps and Impact assessment Appendix I
Results Local TV 71 sites Run1 70% Locations PSB_1 Ch
Chg on
v5.5 %Chg
on v5.5 PSB_2 Ch
Chg on
v5.5 %Chg
on v5.5 PSB_3 Ch
Chg on
v5.5 %Chg
on v5.5 3CORE
Chg on
v5.5 %Chg
on v5.5 10400 Emley Moor 2679138 41 0 0.0% 2589384 44 -428 0.0% 2579237 47 0 0.0% 2547624 -262 0.0% 10401 Wharfedale 42728 22 0 0.0% 42531 25 -23 -0.1% 42859 28 0 0.0% 41993 0 0.0%
10403 Sheffield 340602 21 -
25020 -6.8% 322548 24 -
28013 -8.0% 345955 27 0 0.0% 310708 -
34485 -10.0% 10404 Skipton 24821 42 0 0.0% 24513 45 -140 -0.6% 24559 49 0 0.0% 24402 -88 -0.4%
10405 Chesterfield 74510 23 0 0.0% 61325 26 -
10733 -14.9% 65427 29 0 0.0% 57693 -6134 -9.6%
10406 Halifax 118253 21 -
22032 -15.7% 130129 24 -
10487 -7.5% 140318 27 0 0.0% 114397 -
24161 -17.4% 10407 Keighley 100787 54 0 0.0% 99269 58 0 0.0% 99146 61 0 0.0% 98483 0 0.0% 10408 Shatton Edge 3046 54 0 0.0% 3046 58 0 0.0% 3044 61 0 0.0% 3044 0 0.0% 10409 Hebden Bridge 6512 22 0 0.0% 6522 25 0 0.0% 6523 28 0 0.0% 6501 0 0.0% 10410 Ripponden 4551 54 0 0.0% 4466 58 0 0.0% 4494 61 0 0.0% 4466 0 0.0% 10411 Cop Hill 25920 22 0 0.0% 25849 25 0 0.0% 25903 28 0 0.0% 25161 0 0.0%
10413 Idle 168380 21 -7383 -4.2% 141774 24 -
34303 -19.5% 175442 27 0 0.0% 139567 -
33270 -19.2% 10414 Headingley 8387 54 0 0.0% 8616 58 0 0.0% 8551 61 0 0.0% 8340 0 0.0% 10415 Beecroft Hill 169327 55 -6274 -3.6% 173113 59 0 0.0% 179262 62 -42 0.0% 167712 -4877 -2.8% 10417 Oxenhope 17059 22 0 0.0% 17159 25 0 0.0% 17257 28 0 0.0% 16996 0 0.0% 10418 Calver Peak 3471 42 0 0.0% 3453 45 0 0.0% 3460 49 0 0.0% 3450 0 0.0% 10422 Tideswell Moor 3668 60 0 0.0% 3803 53 0 0.0% 4792 57 0 0.0% 3335 0 0.0% 10426 Hope 1411 22 0 0.0% 1410 25 0 0.0% 1410 28 0 0.0% 1410 0 0.0% 10427 Addingham 6428 43 0 0.0% 6438 46 0 0.0% 6446 50 0 0.0% 6403 0 0.0% 10428 Luddenden 10124 57 0 0.0% 7057 60 0 0.0% 5972 53 0 0.0% 5809 0 0.0% 10431 Dronfield 3469 55 -171 -4.7% 3635 59 0 0.0% 3684 62 0 0.0% 3448 -171 -4.7% 10432 Hasland 6796 53 0 0.0% 6574 57 0 0.0% 6973 60 0 0.0% 5372 0 0.0% 10433 Edale 119 53 0 0.0% 119 57 0 0.0% 119 60 0 0.0% 119 0 0.0% 10435 Totley Rise 7559 48 0 0.0% 8428 51 0 0.0% 8484 52 0 0.0% 7510 0 0.0% 10441 Cullingworth 8385 55 -43 -0.5% 8412 59 0 0.0% 8628 62 0 0.0% 8362 0 0.0%
Table AI-5 : Worst Case impact to gross coverage of Interleaved channels on PSB multiplexes

Interleaved Spectrum Study
Final Page 21 of 70 16 November 2007 Version 1.0 Coverage Maps and Impact assessment Appendix I
Results Local TV 71 sites Run1 70% Locations PSB_1 Ch
Chg on
v5.5 %Chg
on v5.5 PSB_2 Ch
Chg on
v5.5 %Chg
on v5.5 PSB_3 Ch
Chg on
v5.5 %Chg
on v5.5 3CORE
Chg on
v5.5 %Chg
on v5.5 10442 Skipton Town 8330 21 0 0.0% 8329 24 -1 0.0% 8344 27 0 0.0% 8328 -1 0.0% 10443 Batley 5617 54 0 0.0% 5659 58 0 0.0% 5687 61 0 0.0% 5600 0 0.0% 10444 Heyshaw 10645 53 0 0.0% 16848 57 0 0.0% 10668 60 0 0.0% 10465 0 0.0% 10446 Primrose Hill 50315 57 0 0.0% 40200 60 0 0.0% 33003 53 0 0.0% 32899 0 0.0% 10447 Armitage Bridge 11347 54 0 0.0% 11265 58 0 0.0% 11386 61 0 0.0% 11188 0 0.0% 10448 Wincobank 6597 55 -33 -0.5% 6458 59 0 0.0% 6669 62 -36 -0.5% 6336 -35 -0.5% 10449 Holmfirth 2324 54 0 0.0% 2301 58 0 0.0% 2311 61 0 0.0% 2282 0 0.0% 10450 Hagg Wood 15737 55 0 0.0% 15326 59 0 0.0% 15821 62 0 0.0% 15316 0 0.0% 10452 Keighley Town 10505 23 0 0.0% 10107 26 -31 -0.3% 10172 29 0 0.0% 9984 -22 -0.2% 10453 Sutton In Craven 6374 23 0 0.0% 6380 26 -12 -0.2% 6196 29 0 0.0% 5988 0 0.0% 10455 Cragg Vale 1679 54 0 0.0% 1677 58 0 0.0% 1677 61 0 0.0% 1677 0 0.0% 10456 Lydgate 1894 23 0 0.0% 1890 26 0 0.0% 1883 29 0 0.0% 1856 0 0.0% 10457 Stocksbridge 5647 54 0 0.0% 5652 58 0 0.0% 5669 61 0 0.0% 5643 0 0.0% 10458 Oughtibridge 9690 55 0 0.0% 9192 59 0 0.0% 9337 62 -3 0.0% 9139 -3 0.0% 10459 Holmfield 6509 55 0 0.0% 6417 59 0 0.0% 6731 62 0 0.0% 6386 0 0.0% 10460 Grassington 1484 23 0 0.0% 1483 26 0 0.0% 1489 29 0 0.0% 1482 0 0.0% 10461 Cowling 2467 42 0 0.0% 1671 45 -795 -32.2% 2480 49 0 0.0% 1671 -795 -32.2% 10463 Cornholme 3304 54 0 0.0% 3267 58 0 0.0% 3262 61 0 0.0% 3262 0 0.0% 10464 Walsden 6375 57 0 0.0% 6288 60 0 0.0% 6291 53 0 0.0% 6285 0 0.0% 10465 Todmorden 6833 42 0 0.0% 6564 45 -210 -3.1% 6731 49 0 0.0% 6522 -191 -2.8% 10466 Walsden South 1178 43 -64 -5.2% 1240 46 0 0.0% 1238 50 0 0.0% 1176 -62 -5.0% 10467 Bradford West 9493 55 -562 -5.6% 9656 59 0 0.0% 10251 62 0 0.0% 9459 -96 -1.0% 10468 Copley 2079 55 0 0.0% 2063 59 0 0.0% 2084 62 0 0.0% 2030 0 0.0% 10469 Kettlewell 447 42 0 0.0% 447 45 0 0.0% 445 49 0 0.0% 445 0 0.0% 10470 Brockwell 6435 49 0 0.0% 6291 42 0 0.0% 6350 45 -42 -0.7% 6266 -13 -0.2%
Table AI-5 : Worst Case impact to gross coverage of Interleaved channels on PSB multiplexes
Interleaved Spectrum Study
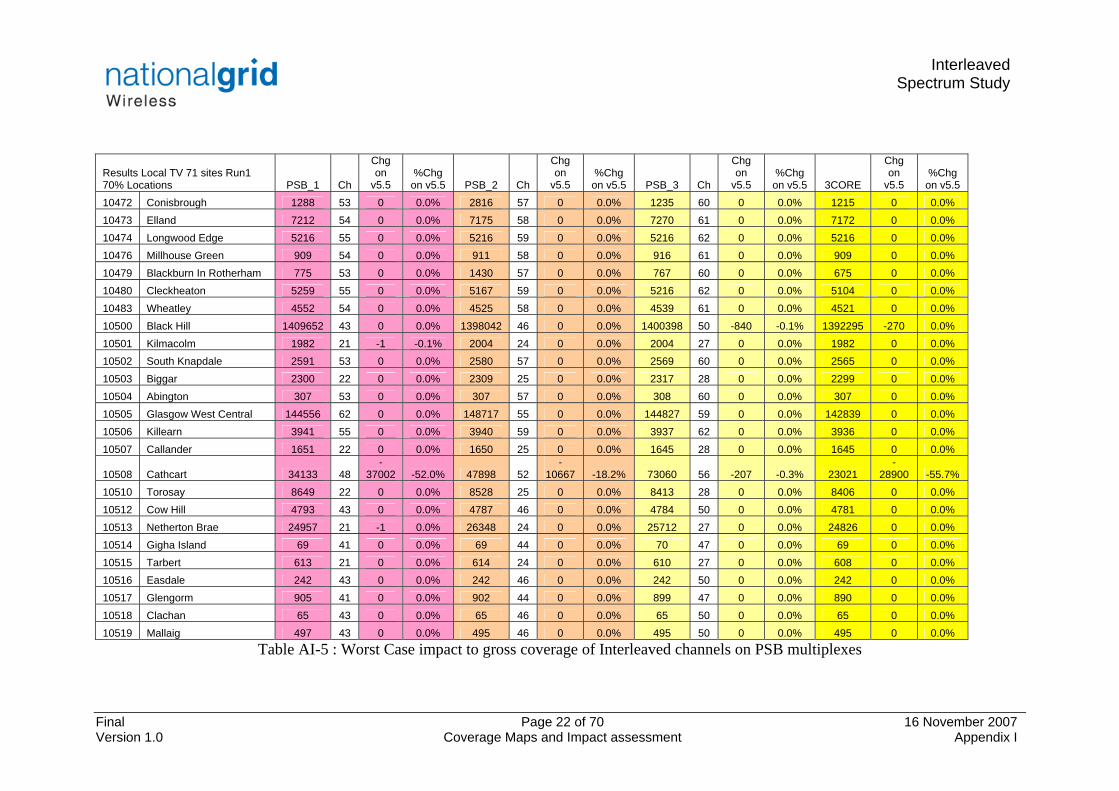
Final Page 22 of 70 16 November 2007 Version 1.0 Coverage Maps and Impact assessment Appendix I
Results Local TV 71 sites Run1 70% Locations PSB_1 Ch
Chg on
v5.5 %Chg
on v5.5 PSB_2 Ch
Chg on
v5.5 %Chg
on v5.5 PSB_3 Ch
Chg on
v5.5 %Chg
on v5.5 3CORE
Chg on
v5.5 %Chg
on v5.5 10472 Conisbrough 1288 53 0 0.0% 2816 57 0 0.0% 1235 60 0 0.0% 1215 0 0.0% 10473 Elland 7212 54 0 0.0% 7175 58 0 0.0% 7270 61 0 0.0% 7172 0 0.0% 10474 Longwood Edge 5216 55 0 0.0% 5216 59 0 0.0% 5216 62 0 0.0% 5216 0 0.0% 10476 Millhouse Green 909 54 0 0.0% 911 58 0 0.0% 916 61 0 0.0% 909 0 0.0% 10479 Blackburn In Rotherham 775 53 0 0.0% 1430 57 0 0.0% 767 60 0 0.0% 675 0 0.0% 10480 Cleckheaton 5259 55 0 0.0% 5167 59 0 0.0% 5216 62 0 0.0% 5104 0 0.0% 10483 Wheatley 4552 54 0 0.0% 4525 58 0 0.0% 4539 61 0 0.0% 4521 0 0.0% 10500 Black Hill 1409652 43 0 0.0% 1398042 46 0 0.0% 1400398 50 -840 -0.1% 1392295 -270 0.0% 10501 Kilmacolm 1982 21 -1 -0.1% 2004 24 0 0.0% 2004 27 0 0.0% 1982 0 0.0% 10502 South Knapdale 2591 53 0 0.0% 2580 57 0 0.0% 2569 60 0 0.0% 2565 0 0.0% 10503 Biggar 2300 22 0 0.0% 2309 25 0 0.0% 2317 28 0 0.0% 2299 0 0.0% 10504 Abington 307 53 0 0.0% 307 57 0 0.0% 308 60 0 0.0% 307 0 0.0% 10505 Glasgow West Central 144556 62 0 0.0% 148717 55 0 0.0% 144827 59 0 0.0% 142839 0 0.0% 10506 Killearn 3941 55 0 0.0% 3940 59 0 0.0% 3937 62 0 0.0% 3936 0 0.0% 10507 Callander 1651 22 0 0.0% 1650 25 0 0.0% 1645 28 0 0.0% 1645 0 0.0%
10508 Cathcart 34133 48 -
37002 -52.0% 47898 52 -
10667 -18.2% 73060 56 -207 -0.3% 23021 -
28900 -55.7% 10510 Torosay 8649 22 0 0.0% 8528 25 0 0.0% 8413 28 0 0.0% 8406 0 0.0% 10512 Cow Hill 4793 43 0 0.0% 4787 46 0 0.0% 4784 50 0 0.0% 4781 0 0.0% 10513 Netherton Brae 24957 21 -1 0.0% 26348 24 0 0.0% 25712 27 0 0.0% 24826 0 0.0% 10514 Gigha Island 69 41 0 0.0% 69 44 0 0.0% 70 47 0 0.0% 69 0 0.0% 10515 Tarbert 613 21 0 0.0% 614 24 0 0.0% 610 27 0 0.0% 608 0 0.0% 10516 Easdale 242 43 0 0.0% 242 46 0 0.0% 242 50 0 0.0% 242 0 0.0% 10517 Glengorm 905 41 0 0.0% 902 44 0 0.0% 899 47 0 0.0% 890 0 0.0% 10518 Clachan 65 43 0 0.0% 65 46 0 0.0% 65 50 0 0.0% 65 0 0.0% 10519 Mallaig 497 43 0 0.0% 495 46 0 0.0% 495 50 0 0.0% 495 0 0.0%
Table AI-5 : Worst Case impact to gross coverage of Interleaved channels on PSB multiplexes

Interleaved Spectrum Study
Final Page 23 of 70 16 November 2007 Version 1.0 Coverage Maps and Impact assessment Appendix I
Results Local TV 71 sites Run1 70% Locations PSB_1 Ch
Chg on
v5.5 %Chg
on v5.5 PSB_2 Ch
Chg on
v5.5 %Chg
on v5.5 PSB_3 Ch
Chg on
v5.5 %Chg
on v5.5 3CORE
Chg on
v5.5 %Chg
on v5.5 10520 Ballachulish 566 23 0 0.0% 566 26 0 0.0% 566 29 0 0.0% 566 0 0.0% 10522 Haddington 4091 54 0 0.0% 4054 58 0 0.0% 4060 61 0 0.0% 4054 0 0.0% 10523 Kinlochleven 517 55 0 0.0% 516 59 0 0.0% 516 62 0 0.0% 516 0 0.0% 10524 Onich 518 54 0 0.0% 517 58 0 0.0% 517 61 0 0.0% 517 0 0.0% 10525 Strachur 777 23 0 0.0% 777 26 0 0.0% 777 29 0 0.0% 777 0 0.0% 10526 Spean Bridge 441 21 0 0.0% 441 24 0 0.0% 441 27 0 0.0% 441 0 0.0% 10527 Oban 4055 41 0 0.0% 4055 44 0 0.0% 4053 47 0 0.0% 4052 0 0.0% 10528 Bellanoch 365 42 0 0.0% 364 45 0 0.0% 355 49 0 0.0% 355 0 0.0% 10529 Tayvallich 129 43 0 0.0% 129 46 0 0.0% 129 50 0 0.0% 129 0 0.0% 10531 Dychliemore Link 0 22 0 - 0 25 0 - 0 28 0 - 0 0 - 10532 Castlebay 226 21 0 0.0% 217 24 0 0.0% 222 27 0 0.0% 217 0 0.0% 10534 Dalmally 189 41 0 0.0% 187 44 0 0.0% 187 47 0 0.0% 187 0 0.0% 10536 Dollar 1434 54 0 0.0% 1435 58 0 0.0% 1438 61 0 0.0% 1434 0 0.0% 10537 Ravenscraig VP 9168 21 0 0.0% 9060 24 0 0.0% 8967 27 0 0.0% 8963 0 0.0%
10538 Kirkfieldbank 703 48 -
2500 -78.1% 3038 52 -362 -10.6% 3456 56 0 0.0% 703 -2500 -78.1% 10539 Tillicoultry 4001 53 0 0.0% 4022 57 0 0.0% 3997 60 0 0.0% 3971 0 0.0% 10541 Fintry 341 24 0 0.0% 352 27 0 0.0% 341 21 0 0.0% 340 0 0.0% 10542 Fiunary 137 43 0 0.0% 137 46 0 0.0% 137 50 0 0.0% 137 0 0.0% 10544 Twechar 2211 22 0 0.0% 2174 25 0 0.0% 2238 28 0 0.0% 2174 0 0.0% 10545 Strathblane 935 21 -1 -0.1% 937 24 0 0.0% 936 27 0 0.0% 935 -1 -0.1% 10546 Taynuilt 403 43 0 0.0% 403 46 0 0.0% 403 50 0 0.0% 403 0 0.0% 10548 Broughton 1122 21 -2 -0.2% 1106 24 0 0.0% 1117 27 0 0.0% 1094 0 0.0% 10549 Bridge Of Allan 5189 23 0 0.0% 5231 26 0 0.0% 5337 29 0 0.0% 5113 0 0.0% 10551 Leadhills 212 54 0 0.0% 211 58 0 0.0% 211 61 0 0.0% 211 0 0.0% 10552 Glespin 203 54 0 0.0% 265 58 0 0.0% 283 61 0 0.0% 203 0 0.0%
Table AI-5 : Worst Case impact to gross coverage of Interleaved channels on PSB multiplexes

Interleaved Spectrum Study
Final Page 24 of 70 16 November 2007 Version 1.0 Coverage Maps and Impact assessment Appendix I
Results Local TV 71 sites Run1 70% Locations PSB_1 Ch
Chg on v5.5
%Chg on v5.5 PSB_2 Ch
Chg on v5.5
%Chg on v5.5 PSB_3 Ch
Chg on v5.5
%Chg on v5.5 3CORE
Chg on v5.5
%Chg on v5.5
10556 Deanston 300 53 0 0.0% 300 57 0 0.0% 300 60 0 0.0% 300 0 0.0% 10557 Ravenscraig HP 6128 21 0 0.0% 6123 24 0 0.0% 6075 27 0 0.0% 6075 0 0.0% 10560 Strontian 123 42 0 0.0% 123 45 0 0.0% 123 49 0 0.0% 123 0 0.0% 10564 Arisaig 202 23 0 0.0% 201 26 0 0.0% 200 29 0 0.0% 200 0 0.0% 10566 Kelvindale 9297 30 -28184 -75.2% 8260 48 -10253 -55.4% 13288 52 -2446 -15.5% 3602 -10965 -75.3% 10567 Uplawmoor 256 54 0 0.0% 256 58 0 0.0% 256 61 0 0.0% 256 0 0.0% 10568 Cumbernauld Village 10193 54 0 0.0% 10193 58 0 0.0% 10230 61 0 0.0% 10177 0 0.0% 10572 Acharacle 75 43 0 0.0% 75 46 0 0.0% 73 50 0 0.0% 73 0 0.0% 10574 Loch Feochan 126 58 0 0.0% 126 61 0 0.0% 126 54 0 0.0% 126 0 0.0% 10575 Kintraw 89 43 0 0.0% 89 46 0 0.0% 89 50 0 0.0% 89 0 0.0% 10578 Dunoon Forest Road 8539 21 0 0.0% 8461 24 0 0.0% 8626 27 0 0.0% 8441 0 0.0% 10591 Kilmelford 305 55 0 0.0% 307 59 0 0.0% 306 62 0 0.0% 304 0 0.0% 10595 Strathyre Link 104 43 0 0.0% 101 46 0 0.0% 93 50 0 0.0% 93 0 0.0% 10596 Strathyre 110 21 0 0.0% 110 24 0 0.0% 110 27 0 0.0% 110 0 0.0% 10600 Wenvoe 916944 41 0 0.0% 892506 44 0 0.0% 849914 47 0 0.0% 849022 0 0.0% 10601 Kilvey Hill 175200 23 0 0.0% 174635 26 0 0.0% 177658 29 -64 0.0% 173297 -34 0.0% 10602 Rhondda VP 27597 26 0 0.0% 27799 23 0 0.0% 27495 29 0 0.0% 27035 0 0.0% 10603 Mynydd Machen 147829 23 0 0.0% 148334 26 0 0.0% 126859 29 -849 -0.7% 124737 -639 -0.5% 10604 Maesteg 10179 22 0 0.0% 10208 28 0 0.0% 10260 25 0 0.0% 10178 0 0.0% 10605 Pontypridd 36525 22 0 0.0% 35913 28 0 0.0% 36430 25 0 0.0% 35742 0 0.0% 10606 Aberdare 24243 21 0 0.0% 24305 27 0 0.0% 24314 24 0 0.0% 24224 0 0.0% 10607 Merthyr Tydfil 17170 22 0 0.0% 17185 28 0 0.0% 17176 25 0 0.0% 17170 0 0.0% 10608 Bargoed 22453 21 0 0.0% 22010 27 0 0.0% 21819 24 0 0.0% 21731 0 0.0% 10609 Rhymney 9741 57 0 0.0% 9191 60 0 0.0% 9851 53 0 0.0% 9169 0 0.0% 10610 South Tredegar 1832 42 0 0.0% 1832 45 0 0.0% 1693 49 0 0.0% 1693 0 0.0%
Table AI-5 : Worst Case impact to gross coverage of Interleaved channels on PSB multiplexes

Interleaved Spectrum Study
Final Page 25 of 70 16 November 2007 Version 1.0 Coverage Maps and Impact assessment Appendix I
Results Local TV 71 sites Run1 70% Locations PSB_1 Ch
Chg on v5.5
%Chg on v5.5 PSB_2 Ch
Chg on v5.5
%Chg on v5.5 PSB_3 Ch
Chg on v5.5
%Chg on v5.5 3CORE
Chg on v5.5
%Chg on v5.5
10611 Clydach 1007 29 -124 -11.0% 1041 26 0 0.0% 1051 23 0 0.0% 980 -51 -4.9% 10612 Abertillery 6533 22 0 0.0% 6482 28 0 0.0% 6497 25 0 0.0% 6482 0 0.0% 10613 Ebbw Vale 23605 55 -222 -0.9% 23873 62 0 0.0% 23906 59 0 0.0% 23557 -178 -0.7% 10614 Blaina 5952 46 0 0.0% 6014 43 0 0.0% 6003 50 -1 0.0% 5940 0 0.0% 10615 Pontypool 23760 23 0 0.0% 23929 26 0 0.0% 21419 29 -162 -0.8% 21226 -157 -0.7% 10616 Cilfrew 4359 45 0 0.0% 4294 49 0 0.0% 4516 42 0 0.0% 4223 0 0.0% 10617 Blaenavon 14790 57 0 0.0% 15456 60 0 0.0% 14715 53 0 0.0% 14601 0 0.0% 10618 Abergavenny 16274 45 0 0.0% 16555 49 0 0.0% 16180 42 0 0.0% 16016 0 0.0% 10619 Ferndale 7679 57 0 0.0% 7655 60 0 0.0% 7718 53 0 0.0% 7655 0 0.0% 10620 Porth 16001 46 0 0.0% 16124 43 0 0.0% 16078 50 -6 0.0% 15940 0 0.0% 10621 Wattsville 4578 57 0 0.0% 4681 60 0 0.0% 4587 53 0 0.0% 4578 0 0.0% 10622 Llangeinor 23067 55 -1344 -5.5% 25969 62 0 0.0% 25716 59 0 0.0% 22929 -1288 -5.3% 10623 Treharris 6795 56 0 0.0% 6943 48 0 0.0% 6863 52 -1 0.0% 6790 0 0.0% 10624 Cwmafon 2905 21 0 0.0% 2926 27 0 0.0% 2927 24 0 0.0% 2904 0 0.0% 10625 Llyswen 1741 21 0 0.0% 1781 27 0 0.0% 1775 24 0 0.0% 1739 0 0.0% 10626 Llanhilleth 2402 45 0 0.0% 2387 49 0 0.0% 2388 42 0 0.0% 2360 0 0.0% 10628 Gilfach 4626 21 0 0.0% 4665 27 0 0.0% 4667 24 0 0.0% 4511 0 0.0% 10629 Taffs Well 14320 55 -1490 -9.4% 15985 62 0 0.0% 16026 59 0 0.0% 14235 -1419 -9.1% 10630 Ogmore Vale 2675 57 0 0.0% 2674 60 0 0.0% 2675 53 0 0.0% 2674 0 0.0% 10631 Abertridwr 6530 57 0 0.0% 6409 60 0 0.0% 6739 53 0 0.0% 6398 0 0.0% 10632 Ynysowen 14039 55 -652 -4.4% 14488 62 0 0.0% 14634 59 0 0.0% 13901 -517 -3.6% 10633 Ebbw Vale South 3780 21 0 0.0% 3916 27 0 0.0% 3809 24 0 0.0% 3772 0 0.0% 10634 Nant Y Moel 2145 21 0 0.0% 2093 27 0 0.0% 2126 24 0 0.0% 2093 0 0.0% 10635 Tonypandy 4078 55 0 0.0% 3848 62 0 0.0% 3893 59 0 0.0% 3848 0 0.0% 10636 Alltwen 3804 46 0 0.0% 3833 43 0 0.0% 3788 50 0 0.0% 3788 0 0.0%
Table AI-5 : Worst Case impact to gross coverage of Interleaved channels on PSB multiplexes
Interleaved Spectrum Study
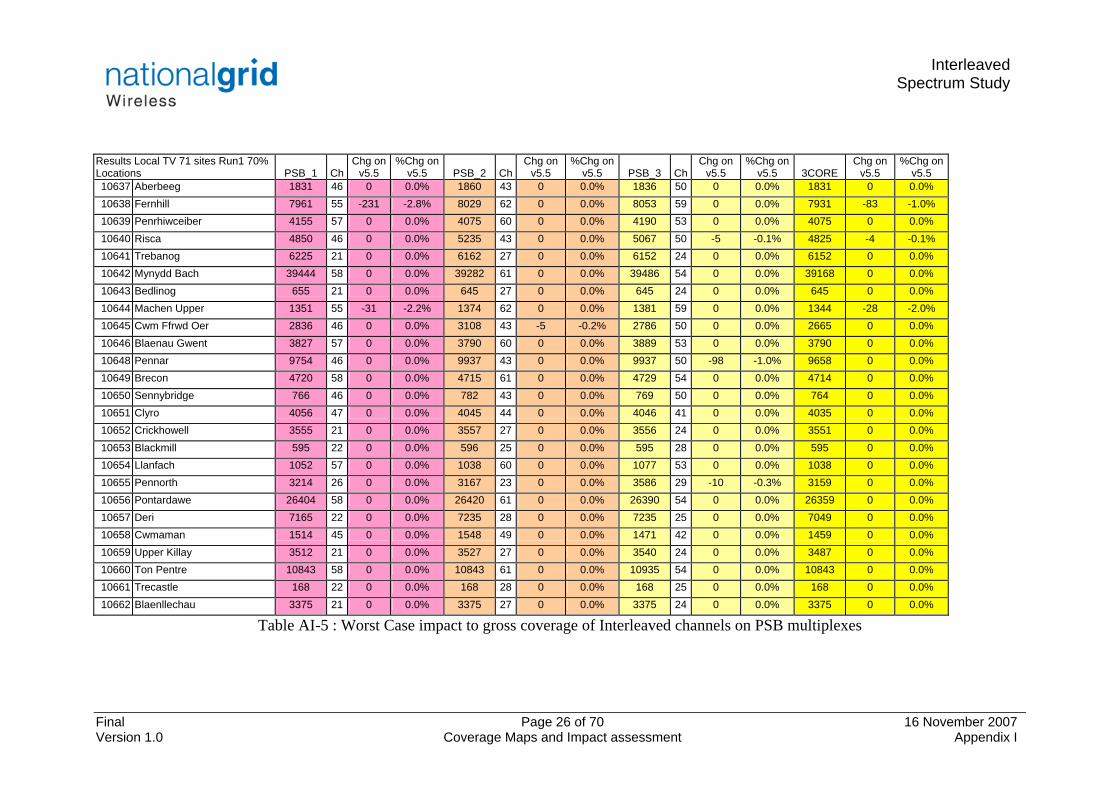
Final Page 26 of 70 16 November 2007 Version 1.0 Coverage Maps and Impact assessment Appendix I
Results Local TV 71 sites Run1 70% Locations PSB_1 Ch
Chg on v5.5
%Chg on v5.5 PSB_2 Ch
Chg on v5.5
%Chg on v5.5 PSB_3 Ch
Chg on v5.5
%Chg on v5.5 3CORE
Chg on v5.5
%Chg on v5.5
10637 Aberbeeg 1831 46 0 0.0% 1860 43 0 0.0% 1836 50 0 0.0% 1831 0 0.0% 10638 Fernhill 7961 55 -231 -2.8% 8029 62 0 0.0% 8053 59 0 0.0% 7931 -83 -1.0% 10639 Penrhiwceiber 4155 57 0 0.0% 4075 60 0 0.0% 4190 53 0 0.0% 4075 0 0.0% 10640 Risca 4850 46 0 0.0% 5235 43 0 0.0% 5067 50 -5 -0.1% 4825 -4 -0.1% 10641 Trebanog 6225 21 0 0.0% 6162 27 0 0.0% 6152 24 0 0.0% 6152 0 0.0% 10642 Mynydd Bach 39444 58 0 0.0% 39282 61 0 0.0% 39486 54 0 0.0% 39168 0 0.0% 10643 Bedlinog 655 21 0 0.0% 645 27 0 0.0% 645 24 0 0.0% 645 0 0.0% 10644 Machen Upper 1351 55 -31 -2.2% 1374 62 0 0.0% 1381 59 0 0.0% 1344 -28 -2.0% 10645 Cwm Ffrwd Oer 2836 46 0 0.0% 3108 43 -5 -0.2% 2786 50 0 0.0% 2665 0 0.0% 10646 Blaenau Gwent 3827 57 0 0.0% 3790 60 0 0.0% 3889 53 0 0.0% 3790 0 0.0% 10648 Pennar 9754 46 0 0.0% 9937 43 0 0.0% 9937 50 -98 -1.0% 9658 0 0.0% 10649 Brecon 4720 58 0 0.0% 4715 61 0 0.0% 4729 54 0 0.0% 4714 0 0.0% 10650 Sennybridge 766 46 0 0.0% 782 43 0 0.0% 769 50 0 0.0% 764 0 0.0% 10651 Clyro 4056 47 0 0.0% 4045 44 0 0.0% 4046 41 0 0.0% 4035 0 0.0% 10652 Crickhowell 3555 21 0 0.0% 3557 27 0 0.0% 3556 24 0 0.0% 3551 0 0.0% 10653 Blackmill 595 22 0 0.0% 596 25 0 0.0% 595 28 0 0.0% 595 0 0.0% 10654 Llanfach 1052 57 0 0.0% 1038 60 0 0.0% 1077 53 0 0.0% 1038 0 0.0% 10655 Pennorth 3214 26 0 0.0% 3167 23 0 0.0% 3586 29 -10 -0.3% 3159 0 0.0% 10656 Pontardawe 26404 58 0 0.0% 26420 61 0 0.0% 26390 54 0 0.0% 26359 0 0.0% 10657 Deri 7165 22 0 0.0% 7235 28 0 0.0% 7235 25 0 0.0% 7049 0 0.0% 10658 Cwmaman 1514 45 0 0.0% 1548 49 0 0.0% 1471 42 0 0.0% 1459 0 0.0% 10659 Upper Killay 3512 21 0 0.0% 3527 27 0 0.0% 3540 24 0 0.0% 3487 0 0.0% 10660 Ton Pentre 10843 58 0 0.0% 10843 61 0 0.0% 10935 54 0 0.0% 10843 0 0.0% 10661 Trecastle 168 22 0 0.0% 168 28 0 0.0% 168 25 0 0.0% 168 0 0.0% 10662 Blaenllechau 3375 21 0 0.0% 3375 27 0 0.0% 3375 24 0 0.0% 3375 0 0.0%
Table AI-5 : Worst Case impact to gross coverage of Interleaved channels on PSB multiplexes

Interleaved Spectrum Study
Final Page 27 of 70 16 November 2007 Version 1.0 Coverage Maps and Impact assessment Appendix I
Results Local TV 71 sites Run1 70% Locations PSB_1 Ch
Chg on v5.5
%Chg on v5.5 PSB_2 Ch
Chg on v5.5
%Chg on v5.5 PSB_3 Ch
Chg on v5.5
%Chg on v5.5 3CORE
Chg on v5.5
%Chg on v5.5
10663 Monmouth 6316 55 -99 -1.5% 6487 62 0 0.0% 6472 59 0 0.0% 6304 -86 -1.3% 10664 Usk 1183 52 0 0.0% 1181 56 0 0.0% 1181 48 -2 -0.2% 1179 -2 -0.2% 10665 Cwmfelinfach 3016 52 -53 -1.7% 3071 56 0 0.0% 2960 48 0 0.0% 2923 0 0.0% 10666 Llanfoist 8448 57 0 0.0% 8441 60 0 0.0% 8454 53 0 0.0% 8437 0 0.0% 10667 Nantyglo 3288 57 0 0.0% 3242 60 0 0.0% 3347 53 0 0.0% 3242 0 0.0% 10668 Abercynon 2743 58 0 0.0% 2758 54 0 0.0% 2743 61 0 0.0% 2743 0 0.0% 10669 Tynewydd 2099 55 -167 -7.4% 2099 62 0 0.0% 2197 59 0 0.0% 2099 0 0.0% 10670 Craig Cefn Parc 2791 46 0 0.0% 2979 43 0 0.0% 2893 50 0 0.0% 2744 0 0.0% 10671 Briton Ferry 15459 46 0 0.0% 15620 43 0 0.0% 15509 50 0 0.0% 15404 0 0.0% 10672 Dowlais 6530 58 0 0.0% 6557 61 0 0.0% 6531 54 0 0.0% 6512 0 0.0% 10673 Rhondda Fach 2979 22 0 0.0% 2989 28 0 0.0% 2986 25 0 0.0% 2979 0 0.0% 10674 Trefechan 7653 45 0 0.0% 7553 42 0 0.0% 7649 49 0 0.0% 7549 0 0.0% 10675 Crucorney 295 21 0 0.0% 300 24 0 0.0% 299 27 0 0.0% 293 0 0.0% 10676 Tonyrefail 3038 55 -718 -19.1% 4008 62 0 0.0% 4012 59 0 0.0% 3038 -692 -18.6% 10677 Efail Fach 476 49 0 0.0% 476 45 0 0.0% 482 52 -4 -0.8% 476 0 0.0% 10678 Llanharan 1866 21 0 0.0% 1939 27 0 0.0% 1927 24 0 0.0% 1866 0 0.0% 10679 Burry Port 2648 58 0 0.0% 2630 61 0 0.0% 2648 54 0 0.0% 2630 0 0.0% 10680 Rhondda HP 3212 26 0 0.0% 3203 23 0 0.0% 3316 29 0 0.0% 3156 0 0.0% 10681 Gellifendigaid 3569 55 -88 -2.4% 3629 62 0 0.0% 3629 59 0 0.0% 3541 -88 -2.4% 10683 South Maesteg 3720 55 0 0.0% 3642 62 0 0.0% 3664 59 0 0.0% 3642 0 0.0% 10687 Van Terrace 939 45 0 0.0% 996 49 0 0.0% 915 42 0 0.0% 915 0 0.0% 10692 Neath Abbey HP 695 48 0 0.0% 675 52 -20 -2.9% 730 56 0 0.0% 675 -20 -2.9% 10693 Neath Abbey VP 11156 48 -1 0.0% 10576 52 -541 -4.9% 11256 56 0 0.0% 10533 -526 -4.8% 10694 Crumlin 7144 57 0 0.0% 7207 60 0 0.0% 7117 53 0 0.0% 7021 0 0.0% 10700 Divis 536549 27 0 0.0% 539241 24 0 0.0% 558341 21 -6332 -1.1% 534110 -37 0.0%
Table AI-5 : Worst Case impact to gross coverage of Interleaved channels on PSB multiplexes

Interleaved Spectrum Study
Final Page 28 of 70 16 November 2007 Version 1.0 Coverage Maps and Impact assessment Appendix I
Results Local TV 71 sites Run1 70% Locations PSB_1 Ch
Chg on v5.5
%Chg on v5.5 PSB_2 Ch
Chg on v5.5
%Chg on v5.5 PSB_3 Ch
Chg on v5.5
%Chg on v5.5 3CORE
Chg on v5.5
%Chg on v5.5
10701 Larne 11321 45 0 0.0% 11209 49 0 0.0% 11425 42 0 0.0% 11209 0 0.0% 10702 Carnmoney Hill 42220 46 0 0.0% 42312 43 0 0.0% 41877 50 0 0.0% 41312 0 0.0% 10703 Kilkeel 2913 45 0 0.0% 2913 49 0 0.0% 2997 42 0 0.0% 2913 0 0.0% 10705 Newcastle 6241 55 0 0.0% 6847 62 0 0.0% 6428 59 0 0.0% 6156 0 0.0% 10706 Armagh 8891 45 0 0.0% 9089 49 0 0.0% 8820 42 0 0.0% 8820 0 0.0% 10707 Black Mountain 157704 45 0 0.0% 157272 49 0 0.0% 158403 42 0 0.0% 156939 0 0.0% 10708 Whitehead 2353 48 -98 -4.0% 1935 56 -83 -4.1% 1912 52 0 0.0% 1885 -27 -1.4% 10709 Bellair 1301 48 0 0.0% 1234 56 -15 -1.2% 1237 52 0 0.0% 1234 -3 -0.2% 10710 Draperstown 1216 45 0 0.0% 1213 49 0 0.0% 1219 42 0 0.0% 1210 0 0.0% 10711 Moneymore 715 45 0 0.0% 715 49 0 0.0% 715 42 0 0.0% 715 0 0.0% 10713 Newry North 9540 41 0 0.0% 9474 44 0 0.0% 9551 47 0 0.0% 9464 0 0.0% 10714 Rostrevor 5404 48 -4 -0.1% 4769 46 0 0.0% 4766 50 0 0.0% 4758 0 0.0% 10715 Newry South 4656 45 0 0.0% 4626 49 0 0.0% 4657 42 0 0.0% 4626 0 0.0% 10716 Benagh 556 22 0 0.0% 373 28 0 0.0% 361 25 0 0.0% 361 0 0.0% 10718 Cushendun 96 22 0 0.0% 96 28 0 0.0% 96 25 0 0.0% 96 0 0.0% 10719 Cushendall 94 46 0 0.0% 94 43 0 0.0% 94 50 0 0.0% 94 0 0.0% 10720 Glynn 390 58 0 0.0% 390 61 0 0.0% 390 54 0 0.0% 390 0 0.0% 10721 Newtownards 4587 58 0 0.0% 4582 61 0 0.0% 4564 54 0 0.0% 4559 0 0.0% 10723 Banbridge 6201 44 0 0.0% 6206 46 0 0.0% 6201 50 0 0.0% 6201 0 0.0% 10724 Dromore 912 58 0 0.0% 912 61 0 0.0% 912 54 0 0.0% 912 0 0.0% 10727 Glenariff 976 58 0 0.0% 976 61 0 0.0% 976 54 0 0.0% 976 0 0.0% 10728 Leitrim 1317 57 0 0.0% 1319 60 0 0.0% 1315 53 0 0.0% 1312 0 0.0% 10730 Killowen Mountain 0 27 0 - 0 24 0 - 0 21 0 - 0 0 - 10732 Bangor 5734 62 0 0.0% 5749 55 0 0.0% 5734 59 0 0.0% 5721 0 0.0% 10735 Conlig 680 45 -31 -4.4% 711 49 0 0.0% 680 42 0 0.0% 680 0 0.0%
Table AI-5 : Worst Case impact to gross coverage of Interleaved channels on PSB multiplexes

Interleaved Spectrum Study
Final Page 29 of 70 16 November 2007 Version 1.0 Coverage Maps and Impact assessment Appendix I
Results Local TV 71 sites Run1 70% Locations PSB_1 Ch
Chg on v5.5
%Chg on v5.5 PSB_2 Ch
Chg on v5.5
%Chg on v5.5 PSB_3 Ch
Chg on v5.5
%Chg on v5.5 3CORE
Chg on v5.5
%Chg on v5.5
10740 Camlough 8354 58 0 0.0% 8417 61 0 0.0% 8354 54 0 0.0% 8352 0 0.0% 10800 Rowridge 878750 24 0 0.0% 882695 27 0 0.0% 874259 21 0 0.0% 871866 0 0.0% 10801 Salisbury 35888 57 0 0.0% 36895 60 0 0.0% 37020 53 0 0.0% 35518 0 0.0% 10802 Till Valley 944 46 -22 -2.3% 872 50 -63 -6.7% 913 43 -78 -7.9% 872 -62 -6.6% 10803 Ventnor 3892 42 0 0.0% 4046 45 0 0.0% 5205 49 -237 -4.4% 3753 -7 -0.2% 10804 Poole 40552 57 0 0.0% 49818 60 0 0.0% 38856 53 0 0.0% 36275 0 0.0% 10805 Whitehawk Hill 176376 53 -283 -0.2% 144140 57 -466 -0.3% 173197 60 0 0.0% 138250 -128 -0.1% 10806 Shrewton 803 41 0 0.0% 803 44 0 0.0% 803 47 0 0.0% 803 0 0.0% 10807 Findon 106515 41 0 0.0% 104250 44 0 0.0% 103475 47 0 0.0% 102792 0 0.0% 10808 Patcham 6597 43 0 0.0% 6442 46 -103 -1.6% 6157 50 0 0.0% 5907 0 0.0% 10810 Winterborne Stickland 6500 48 0 0.0% 6828 52 0 0.0% 6549 56 0 0.0% 6425 0 0.0% 10817 Corfe Castle 762 41 0 0.0% 760 44 0 0.0% 764 47 0 0.0% 760 0 0.0% 10819 Portslade 2244 41 0 0.0% 2082 44 0 0.0% 2082 47 0 0.0% 2082 0 0.0% 10820 Westbourne 13970 41 0 0.0% 11315 44 0 0.0% 11367 47 0 0.0% 11289 0 0.0% 10822 Ovingdean VP 650 43 0 0.0% 604 46 0 0.0% 910 50 0 0.0% 550 0 0.0% 10823 Saltdean 1214 51 0 0.0% 1615 55 0 0.0% 1200 47 0 0.0% 926 0 0.0% 10824 Coldean 3284 41 0 0.0% 4491 44 0 0.0% 3188 47 0 0.0% 3182 0 0.0% 10825 Bevendean 2127 46 -34 -1.6% 2311 43 0 0.0% 3140 29 -3076 -49.5% 1630 -517 -24.1% 10826 Brighton Central 13151 45 0 0.0% 12971 41 0 0.0% 11912 47 0 0.0% 9772 0 0.0% 10827 Donhead 706 41 0 0.0% 696 44 0 0.0% 696 47 0 0.0% 695 0 0.0% 10829 Millbrook VP 32083 41 0 0.0% 29297 44 0 0.0% 29577 47 0 0.0% 29297 0 0.0% 10830 Brighstone 908 41 0 0.0% 872 44 0 0.0% 867 47 0 0.0% 867 0 0.0% 10831 Hangleton 622 45 0 0.0% 1722 49 0 0.0% 908 42 0 0.0% 622 0 0.0% 10832 Lulworth 256 55 0 0.0% 267 59 0 0.0% 267 62 0 0.0% 256 0 0.0% 10833 Piddletrenthide 500 45 0 0.0% 466 49 0 0.0% 500 42 0 0.0% 466 0 0.0%
Table AI-5 : Worst Case impact to gross coverage of Interleaved channels on PSB multiplexes

Interleaved Spectrum Study
Final Page 30 of 70 16 November 2007 Version 1.0 Coverage Maps and Impact assessment Appendix I
Results Local TV 71 sites Run1 70% Locations PSB_1 Ch
Chg on v5.5
%Chg on v5.5 PSB_2 Ch
Chg on v5.5
%Chg on v5.5 PSB_3 Ch
Chg on v5.5
%Chg on v5.5 3CORE
Chg on v5.5
%Chg on v5.5
10834 Luscombe Valley 3488 45 0 0.0% 5617 49 -4515 -44.6% 3485 42 0 0.0% 3117 -313 -9.1% 10836 Winterbourne Steepleton 1083 45 0 0.0% 1324 49 -2 -0.2% 1096 42 0 0.0% 1058 0 0.0% 10837 Cheselbourne 220 57 0 0.0% 218 53 0 0.0% 221 60 0 0.0% 218 0 0.0% 10838 Brading 423 41 0 0.0% 336 44 0 0.0% 336 47 0 0.0% 336 0 0.0% 10839 Singleton 393 41 0 0.0% 391 44 0 0.0% 391 47 0 0.0% 391 0 0.0% 10840 Ovingdean HP 48 43 0 0.0% 48 46 0 0.0% 113 50 0 0.0% 29 0 0.0% 10844 Horndean 1892 56 0 0.0% 1538 50 -408 -21.0% 1834 62 0 0.0% 1516 -122 -7.4% 10845 Canford Heath 5350 45 0 0.0% 5311 42 0 0.0% 4251 49 -3681 -46.4% 4019 -1292 -24.3% 10847 Poulner 4100 42 0 0.0% 4253 45 0 0.0% 3696 49 -199 -5.1% 3189 -183 -5.4% 10848 Bovington 310 41 0 0.0% 306 44 0 0.0% 306 47 0 0.0% 306 0 0.0% 10851 North Winchester 1210 56 -4 -0.3% 928 59 0 0.0% 777 49 -1932 -71.3% 679 -145 -17.6% 10852 Hythe Marina 4054 53 0 0.0% 3666 57 0 0.0% 4124 60 0 0.0% 3638 0 0.0% 10853 Hatch Bottom 16646 54 -2605 -13.5% 9675 58 0 0.0% 10740 61 0 0.0% 9675 0 0.0% 10859 Millbrook HP 1265 41 0 0.0% 1198 44 0 0.0% 1198 47 0 0.0% 1198 0 0.0% 10860 Rowridge VP 1029966 24 0 0.0% 1029001 27 0 0.0% 1030800 21 0 0.0% 1024252 0 0.0% 10900 Pontop Pike 1056300 54 0 0.0% 1093619 58 0 0.0% 1091406 61 0 0.0% 1050944 0 0.0% 10902 Newton 46966 23 0 0.0% 46510 26 0 0.0% 45170 29 -4023 -8.2% 44232 -1914 -4.1% 10903 Fenham 422843 21 -8228 -1.9% 390002 24 -62424 -13.8% 449503 27 0 0.0% 378093 -43555 -10.3% 10906 Weardale 10531 41 0 0.0% 10536 44 0 0.0% 10606 47 0 0.0% 10510 0 0.0% 10908 Alston 909 42 0 0.0% 906 45 0 0.0% 905 49 0 0.0% 905 0 0.0% 10909 Catton Beacon 853 43 0 0.0% 850 46 0 0.0% 845 50 0 0.0% 845 0 0.0% 10910 Morpeth 15749 22 0 0.0% 15500 25 0 0.0% 16089 28 0 0.0% 15213 0 0.0% 10911 Bellingham 1131 21 -68 -5.7% 1099 24 -5 -0.5% 1112 27 0 0.0% 1099 -5 -0.5% 10912 Humshaugh 1552 42 0 0.0% 1435 45 0 0.0% 1235 49 0 0.0% 1234 0 0.0% 10913 Haydon Bridge 3248 41 0 0.0% 3251 44 0 0.0% 3245 47 0 0.0% 3236 0 0.0%
Table AI-5 : Worst Case impact to gross coverage of Interleaved channels on PSB multiplexes

Interleaved Spectrum Study
Final Page 31 of 70 16 November 2007 Version 1.0 Coverage Maps and Impact assessment Appendix I
Results Local TV 71 sites Run1 70% Locations PSB_1 Ch
Chg on v5.5
%Chg on v5.5 PSB_2 Ch
Chg on v5.5
%Chg on v5.5 PSB_3 Ch
Chg on v5.5
%Chg on v5.5 3CORE
Chg on v5.5
%Chg on v5.5
10914 Shotleyfield 10706 22 0 0.0% 10682 25 0 0.0% 10736 28 0 0.0% 10682 0 0.0% 10915 Durham 3007 41 0 0.0% 3027 44 0 0.0% 3039 47 0 0.0% 3007 0 0.0% 10917 Ireshopeburn 710 55 0 0.0% 710 59 0 0.0% 709 62 0 0.0% 709 0 0.0% 10918 Hedleyhope 1242 43 0 0.0% 1242 46 0 0.0% 1242 50 0 0.0% 1242 0 0.0% 10919 Seaham 10380 41 0 0.0% 9470 44 0 0.0% 10303 47 0 0.0% 9470 0 0.0% 10920 Sunderland 26345 48 -119 -0.4% 24407 51 0 0.0% 16053 52 -45 -0.3% 15674 -64 -0.4% 10921 Staithes 713 51 0 0.0% 714 48 0 0.0% 726 52 0 0.0% 712 0 0.0% 10922 Esh 3232 42 0 0.0% 3232 45 0 0.0% 3230 49 0 0.0% 3230 0 0.0% 10925 Falstone 138 41 0 0.0% 138 44 0 0.0% 134 47 0 0.0% 134 0 0.0% 10926 Kielder 112 23 0 0.0% 112 26 0 0.0% 112 29 0 0.0% 112 0 0.0% 10927 Byrness 145 21 -2 -1.4% 142 24 -2 -1.4% 142 27 0 0.0% 142 0 0.0% 10928 Wall 5553 48 -136 -2.4% 5652 51 -25 -0.4% 5654 52 -10 -0.2% 5540 -112 -2.0% 10929 Whitaside 272 41 0 0.0% 272 44 0 0.0% 272 47 0 0.0% 272 0 0.0% 10930 Felling 12891 46 0 0.0% 12334 50 0 0.0% 12927 43 0 0.0% 12321 0 0.0% 10932 Blaydon Burn 1691 41 0 0.0% 1691 44 0 0.0% 1691 47 0 0.0% 1691 0 0.0% 10934 Allenheads 334 21 -2 -0.6% 335 24 0 0.0% 324 27 0 0.0% 321 -1 -0.3% 11000 Mendip 1608879 54 -19050 -1.2% 1394995 58 0 0.0% 1415213 61 0 0.0% 1390478 -98 0.0% 11001 Crockerton 8816 43 -24 -0.3% 8783 46 -2 0.0% 8704 50 -1 0.0% 8679 -2 0.0% 11002 Bath 34267 22 0 0.0% 34512 25 0 0.0% 34690 28 0 0.0% 34235 0 0.0% 11003 Westwood 20652 43 -279 -1.3% 20837 46 0 0.0% 21152 50 0 0.0% 20440 -154 -0.7% 11004 Avening 484 41 0 0.0% 484 44 0 0.0% 484 47 0 0.0% 484 0 0.0% 11005 Calne 7456 21 0 0.0% 7563 24 0 0.0% 7599 27 0 0.0% 7456 0 0.0% 11006 Redcliff Bay 1421 53 0 0.0% 1384 57 0 0.0% 1415 60 0 0.0% 1366 0 0.0% 11007 Bristol Kings Weston 96462 43 -384 -0.4% 96784 46 -21 0.0% 96466 50 -5279 -5.2% 92548 -2823 -3.0% 11008 Bristol Ilchester Crescent 69795 41 0 0.0% 69846 44 0 0.0% 69474 47 0 0.0% 69111 0 0.0%
Table AI-5 : Worst Case impact to gross coverage of Interleaved channels on PSB multiplexes
Interleaved Spectrum Study
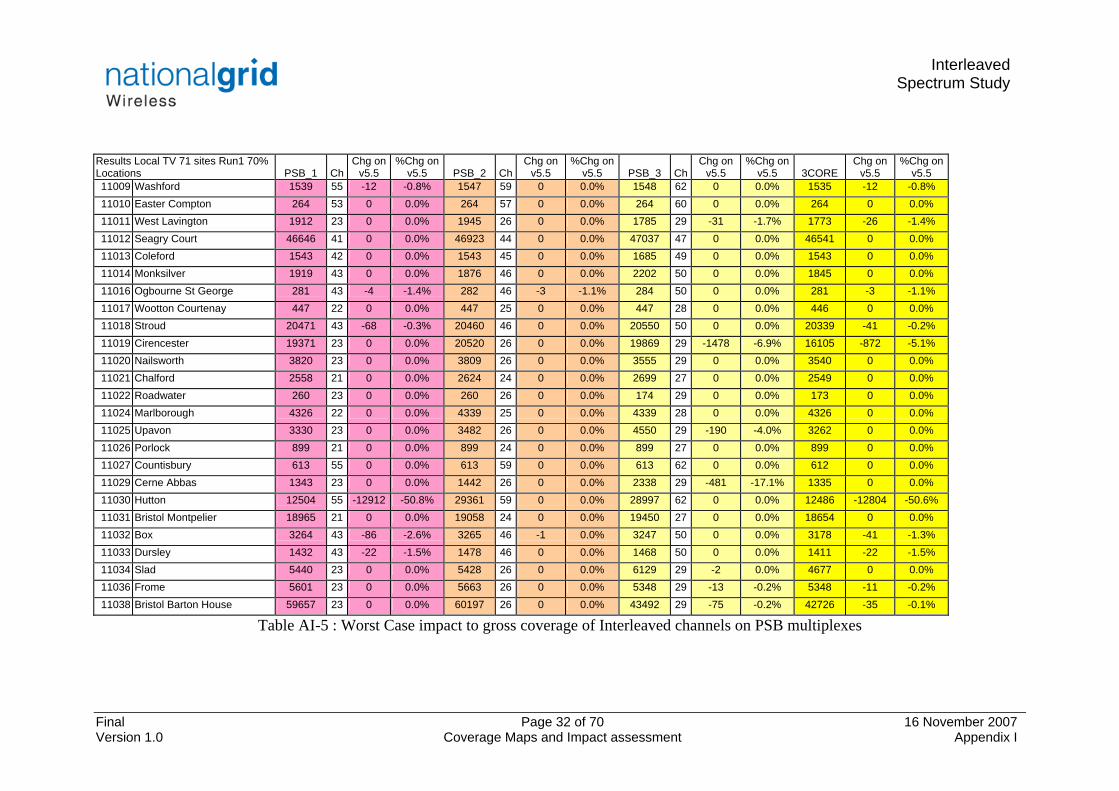
Final Page 32 of 70 16 November 2007 Version 1.0 Coverage Maps and Impact assessment Appendix I
Results Local TV 71 sites Run1 70% Locations PSB_1 Ch
Chg on v5.5
%Chg on v5.5 PSB_2 Ch
Chg on v5.5
%Chg on v5.5 PSB_3 Ch
Chg on v5.5
%Chg on v5.5 3CORE
Chg on v5.5
%Chg on v5.5
11009 Washford 1539 55 -12 -0.8% 1547 59 0 0.0% 1548 62 0 0.0% 1535 -12 -0.8% 11010 Easter Compton 264 53 0 0.0% 264 57 0 0.0% 264 60 0 0.0% 264 0 0.0% 11011 West Lavington 1912 23 0 0.0% 1945 26 0 0.0% 1785 29 -31 -1.7% 1773 -26 -1.4% 11012 Seagry Court 46646 41 0 0.0% 46923 44 0 0.0% 47037 47 0 0.0% 46541 0 0.0% 11013 Coleford 1543 42 0 0.0% 1543 45 0 0.0% 1685 49 0 0.0% 1543 0 0.0% 11014 Monksilver 1919 43 0 0.0% 1876 46 0 0.0% 2202 50 0 0.0% 1845 0 0.0% 11016 Ogbourne St George 281 43 -4 -1.4% 282 46 -3 -1.1% 284 50 0 0.0% 281 -3 -1.1% 11017 Wootton Courtenay 447 22 0 0.0% 447 25 0 0.0% 447 28 0 0.0% 446 0 0.0% 11018 Stroud 20471 43 -68 -0.3% 20460 46 0 0.0% 20550 50 0 0.0% 20339 -41 -0.2% 11019 Cirencester 19371 23 0 0.0% 20520 26 0 0.0% 19869 29 -1478 -6.9% 16105 -872 -5.1% 11020 Nailsworth 3820 23 0 0.0% 3809 26 0 0.0% 3555 29 0 0.0% 3540 0 0.0% 11021 Chalford 2558 21 0 0.0% 2624 24 0 0.0% 2699 27 0 0.0% 2549 0 0.0% 11022 Roadwater 260 23 0 0.0% 260 26 0 0.0% 174 29 0 0.0% 173 0 0.0% 11024 Marlborough 4326 22 0 0.0% 4339 25 0 0.0% 4339 28 0 0.0% 4326 0 0.0% 11025 Upavon 3330 23 0 0.0% 3482 26 0 0.0% 4550 29 -190 -4.0% 3262 0 0.0% 11026 Porlock 899 21 0 0.0% 899 24 0 0.0% 899 27 0 0.0% 899 0 0.0% 11027 Countisbury 613 55 0 0.0% 613 59 0 0.0% 613 62 0 0.0% 612 0 0.0% 11029 Cerne Abbas 1343 23 0 0.0% 1442 26 0 0.0% 2338 29 -481 -17.1% 1335 0 0.0% 11030 Hutton 12504 55 -12912 -50.8% 29361 59 0 0.0% 28997 62 0 0.0% 12486 -12804 -50.6% 11031 Bristol Montpelier 18965 21 0 0.0% 19058 24 0 0.0% 19450 27 0 0.0% 18654 0 0.0% 11032 Box 3264 43 -86 -2.6% 3265 46 -1 0.0% 3247 50 0 0.0% 3178 -41 -1.3% 11033 Dursley 1432 43 -22 -1.5% 1478 46 0 0.0% 1468 50 0 0.0% 1411 -22 -1.5% 11034 Slad 5440 23 0 0.0% 5428 26 0 0.0% 6129 29 -2 0.0% 4677 0 0.0% 11036 Frome 5601 23 0 0.0% 5663 26 0 0.0% 5348 29 -13 -0.2% 5348 -11 -0.2% 11038 Bristol Barton House 59657 23 0 0.0% 60197 26 0 0.0% 43492 29 -75 -0.2% 42726 -35 -0.1%
Table AI-5 : Worst Case impact to gross coverage of Interleaved channels on PSB multiplexes

Interleaved Spectrum Study
Final Page 33 of 70 16 November 2007 Version 1.0 Coverage Maps and Impact assessment Appendix I
Results Local TV 71 sites Run1 70% Locations PSB_1 Ch
Chg on v5.5
%Chg on v5.5 PSB_2 Ch
Chg on v5.5
%Chg on v5.5 PSB_3 Ch
Chg on v5.5
%Chg on v5.5 3CORE
Chg on v5.5
%Chg on v5.5
11039 Bruton 1150 43 0 0.0% 1129 46 0 0.0% 1148 50 -11 -0.9% 1121 -6 -0.5% 11040 Kewstoke 2068 43 -49 -2.3% 2077 46 0 0.0% 2761 50 0 0.0% 2022 0 0.0% 11041 Burrington 1336 53 0 0.0% 1337 57 0 0.0% 1552 60 0 0.0% 1334 0 0.0% 11042 Ubley 3576 21 0 0.0% 3690 24 0 0.0% 3906 27 0 0.0% 3576 0 0.0% 11045 Portishead 7379 55 -1210 -14.1% 9122 59 0 0.0% 9129 62 0 0.0% 7339 -1189 -13.9% 11046 Backwell 10004 22 0 0.0% 10039 25 0 0.0% 10081 28 0 0.0% 9952 0 0.0% 11048 Tintern 523 21 0 0.0% 523 24 0 0.0% 523 27 0 0.0% 522 0 0.0% 11051 Chiseldon 914 21 0 0.0% 948 24 0 0.0% 951 27 0 0.0% 914 0 0.0% 11052 Chepstow 3420 21 0 0.0% 3484 24 0 0.0% 3492 27 0 0.0% 3420 0 0.0% 11053 Blakeney 562 21 0 0.0% 572 24 0 0.0% 573 27 0 0.0% 562 0 0.0% 11054 Lydbrook 1089 43 0 0.0% 1087 46 0 0.0% 1087 50 0 0.0% 1085 0 0.0% 11055 Parkend 1235 41 0 0.0% 1238 44 0 0.0% 1264 47 0 0.0% 1202 0 0.0% 11056 Clearwell 342 55 -32 -8.6% 392 59 0 0.0% 389 62 0 0.0% 342 -28 -7.6% 11058 Woodcombe 1476 55 -1076 -42.2% 2622 59 0 0.0% 2619 62 0 0.0% 1474 -1076 -42.2% 11059 Exford 165 41 0 0.0% 165 44 0 0.0% 165 47 0 0.0% 165 0 0.0% 11060 Kilve 143 55 -7 -4.7% 156 59 0 0.0% 156 62 0 0.0% 143 -7 -4.7% 11061 Crewkerne 3320 43 -4 -0.1% 3158 46 -9 -0.3% 3333 50 -26 -0.8% 3158 -8 -0.3% 11062 Carhampton 771 21 0 0.0% 771 24 0 0.0% 771 27 0 0.0% 771 0 0.0% 11063 Chitterne 159 43 0 0.0% 159 46 0 0.0% 159 50 0 0.0% 158 0 0.0% 11066 Chalford Vale 749 43 0 0.0% 742 46 0 0.0% 741 50 0 0.0% 741 0 0.0% 11068 Chilfrome 797 43 0 0.0% 795 46 0 0.0% 860 50 0 0.0% 784 0 0.0% 11071 Corsham VP 1664 43 -3 -0.2% 1669 46 0 0.0% 1698 50 0 0.0% 1656 0 0.0% 11072 Redbrook 255 42 0 0.0% 253 45 0 0.0% 253 49 0 0.0% 253 0 0.0% 11073 Siston 8401 23 0 0.0% 8391 26 0 0.0% 5899 29 -155 -2.6% 5899 -155 -2.6% 11074 Bristol Warmley 5178 42 0 0.0% 5221 45 0 0.0% 4986 49 0 0.0% 4925 0 0.0%
Table AI-5 : Worst Case impact to gross coverage of Interleaved channels on PSB multiplexes

Interleaved Spectrum Study
Final Page 34 of 70 16 November 2007 Version 1.0 Coverage Maps and Impact assessment Appendix I
Results Local TV 71 sites Run1 70% Locations PSB_1 Ch
Chg on v5.5
%Chg on v5.5 PSB_2 Ch
Chg on v5.5
%Chg on v5.5 PSB_3 Ch
Chg on v5.5
%Chg on v5.5 3CORE
Chg on v5.5
%Chg on v5.5
11076 Pillowell HP 790 43 0 0.0% 790 46 0 0.0% 834 50 0 0.0% 790 0 0.0% 11079 Pillowell VP 84 43 0 0.0% 84 46 0 0.0% 84 50 0 0.0% 84 0 0.0% 11080 Corsham HP 1757 43 -92 -5.0% 1760 46 -96 -5.2% 1652 50 0 0.0% 1631 0 0.0% 11083 Portbury 1606 21 0 0.0% 1632 24 0 0.0% 1636 27 0 0.0% 1606 0 0.0% 11100 Waltham 2055493 54 -896 0.0% 2031282 61 -2077 -0.1% 1691466 58 0 0.0% 1675977 -1899 -0.1% 11101 Nottingham 231469 21 -7761 -3.2% 242936 24 -184 -0.1% 245619 27 0 0.0% 231430 -7717 -3.2% 11102 Derby 36629 51 -10687 -22.6% 38557 48 -10046 -20.7% 54379 52 -24 0.0% 34666 -11566 -25.0% 11103 Leicester 7904 22 0 0.0% 8173 25 0 0.0% 8198 28 0 0.0% 7904 0 0.0% 11104 Belper 13146 55 -547 -4.0% 13684 59 0 0.0% 13071 62 -742 -5.4% 12821 -834 -6.1% 11105 Eastwood 2961 23 0 0.0% 3061 26 0 0.0% 3037 30 0 0.0% 2827 0 0.0% 11106 Stamford 4010 41 0 0.0% 4010 44 0 0.0% 3990 47 0 0.0% 3950 0 0.0% 11107 Parwich 225 21 0 0.0% 225 24 0 0.0% 225 27 0 0.0% 225 0 0.0% 11108 Stanton Moor 13321 55 -31 -0.2% 13177 59 0 0.0% 13217 62 -19 -0.1% 13106 -13 -0.1% 11109 Bolehill 9781 53 0 0.0% 8765 57 0 0.0% 9842 60 0 0.0% 8277 0 0.0% 11110 Matlock 6969 21 0 0.0% 6974 24 0 0.0% 6975 27 0 0.0% 6943 0 0.0% 11111 Ashford In The Water 1350 23 0 0.0% 1312 26 -29 -2.2% 1561 30 -18 -1.1% 1283 0 0.0% 11112 Birchover 476 42 0 0.0% 464 45 0 0.0% 522 49 0 0.0% 463 0 0.0% 11113 Little Eaton 8857 23 0 0.0% 9166 26 -94 -1.0% 5214 30 0 0.0% 4689 0 0.0% 11118 Darley Dale 3989 41 0 0.0% 4004 44 0 0.0% 3989 47 0 0.0% 3970 0 0.0% 11200 Durris 359529 22 0 0.0% 353843 25 0 0.0% 348409 28 0 0.0% 347228 0 0.0% 11201 Peterhead 10310 55 -1 0.0% 10658 62 0 0.0% 10659 59 0 0.0% 10213 0 0.0% 11202 Gartley Moor 14404 58 0 0.0% 14219 61 0 0.0% 14671 54 0 0.0% 14212 0 0.0% 11203 Rosehearty 12522 44 0 0.0% 12616 41 0 0.0% 10156 47 0 0.0% 10156 0 0.0% 11204 Balgownie 35636 46 0 0.0% 36054 43 0 0.0% 35041 50 0 0.0% 35009 0 0.0% 11205 Tullich 1921 55 0 0.0% 1679 62 0 0.0% 1797 59 0 0.0% 1679 0 0.0%
Table AI-5 : Worst Case impact to gross coverage of Interleaved channels on PSB multiplexes

Interleaved Spectrum Study
Final Page 35 of 70 16 November 2007 Version 1.0 Coverage Maps and Impact assessment Appendix I
Results Local TV 71 sites Run1 70% Locations PSB_1 Ch
Chg on v5.5
%Chg on v5.5 PSB_2 Ch
Chg on v5.5
%Chg on v5.5 PSB_3 Ch
Chg on v5.5
%Chg on v5.5 3CORE
Chg on v5.5
%Chg on v5.5
11206 Braemar 307 45 0 0.0% 307 42 0 0.0% 307 49 0 0.0% 307 0 0.0% 11207 Tomintoul 247 46 0 0.0% 247 43 0 0.0% 247 50 0 0.0% 247 0 0.0% 11208 Banff 2243 42 0 0.0% 2340 45 0 0.0% 2287 49 0 0.0% 2242 0 0.0% 11209 Ellon 3732 45 0 0.0% 3715 49 0 0.0% 3720 42 0 0.0% 3697 0 0.0% 11210 Brechin 3634 46 0 0.0% 3624 43 0 0.0% 3624 50 0 0.0% 3624 0 0.0% 11211 Boddam 2892 45 0 0.0% 2702 42 0 0.0% 1272 49 0 0.0% 1272 0 0.0% 11213 Lumphanan 271 49 0 0.0% 276 42 0 0.0% 276 45 0 0.0% 271 0 0.0% 11222 Gourdon 320 55 0 0.0% 320 62 0 0.0% 320 59 0 0.0% 320 0 0.0% 11300 Dover 430710 50 -159 0.0% 405375 53 -1 0.0% 359564 51 -30021 -7.7% 286449 -10512 -3.5% 11302 Margate 22040 50 0 0.0% 29222 53 0 0.0% 24380 51 0 0.0% 21287 0 0.0% 11303 Dover Town 12544 26 0 0.0% 12684 23 0 0.0% 12519 30 0 0.0% 12338 0 0.0% 11304 Hythe 1634 21 0 0.0% 1717 24 0 0.0% 1615 27 0 0.0% 1520 0 0.0% 11305 Chartham 12463 21 0 0.0% 12533 27 0 0.0% 12290 24 0 0.0% 12177 0 0.0% 11306 Faversham 7673 22 0 0.0% 5311 28 0 0.0% 7731 25 0 0.0% 5272 0 0.0% 11308 Rye 877 43 0 0.0% 877 46 0 0.0% 1212 56 -52 -4.1% 729 0 0.0% 11310 Newnham 190 21 0 0.0% 159 27 0 0.0% 159 24 0 0.0% 159 0 0.0% 11311 Ramsgate 16297 50 0 0.0% 16386 53 0 0.0% 16323 51 0 0.0% 16218 0 0.0% 11313 Lyminge 585 22 0 0.0% 371 28 0 0.0% 657 25 0 0.0% 362 0 0.0% 11314 Horn Street 1081 43 0 0.0% 1035 46 0 0.0% 2258 56 0 0.0% 538 0 0.0% 11315 Folkestone 9962 26 0 0.0% 10056 23 0 0.0% 8332 30 0 0.0% 8157 0 0.0% 11316 Elham 589 26 0 0.0% 415 23 0 0.0% 394 30 0 0.0% 384 0 0.0% 11317 Lydden 509 46 0 0.0% 509 43 0 0.0% 485 45 0 0.0% 458 0 0.0% 11319 Turnpike Hill 781 43 0 0.0% 780 46 0 0.0% 536 56 0 0.0% 465 0 0.0% 11399 Broadstairs 8316 50 0 0.0% 8380 53 0 0.0% 8370 51 0 0.0% 8274 0 0.0% 11400 Tacolneston 516321 55 -5772 -1.1% 503366 59 0 0.0% 493050 62 -759 -0.2% 480267 -2633 -0.5%
Table AI-5 : Worst Case impact to gross coverage of Interleaved channels on PSB multiplexes