appendix d odor analysis - santa barbara...
TRANSCRIPT

APPENDIX D ODOR ANALYSIS

Air Quality Assessment Report Subject Site: Cate School
1960 Cate Mesa Road
Carpinteria, CA 93013
SAMPLING DATE: September 10 – 24, 2014
REPORT DATE: October 23, 2014
JOB #: JOB #: HFC-6722-ENV
CLIENT: Hartigan/Foley
General Building Contractors, Inc.
ATTENTION: Kevin Hartigan
__________________
Nate Seward, PE, CIH
Principal Hygienist

Cate School Air Quality Assessment Report 1960 Cate Mesa Road
Carpinteria, CA
CEI.Cate.Fnl Page 1
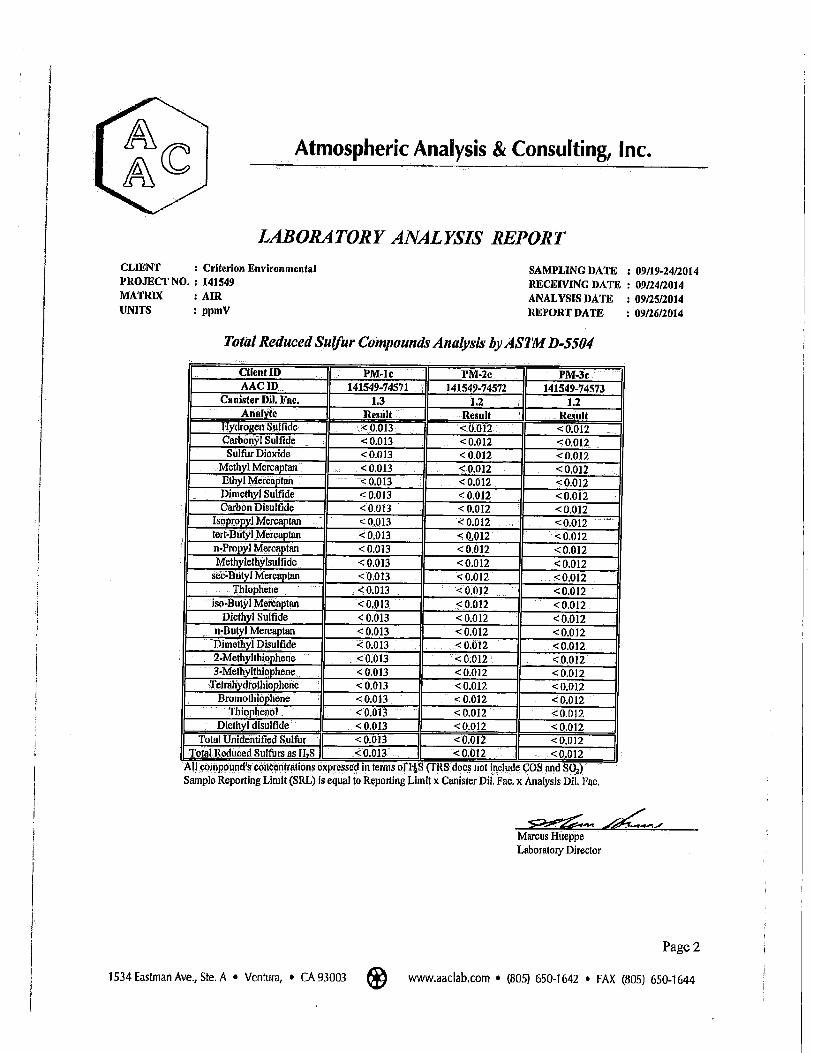
BACKGROUND Cate School is a boarding school located at 1960 Cate Mesa Road, Carpinteria, California. At the request of Hartigan/Foley, Criterion Environmental, Inc. (CEI) performed an Air Quality Assessment along the northern property line of the Cate School campus, adjacent to the Waste Water Treatment Plant (WWTP). Due to the nature of treating and processing waste water within a treatment facility, it is expected and common to find some odor within the facility. In most cases, the odors released are typically hydrogen sulfide (H2S) and other sulfur based compounds along with other similar odorous compounds such as mercaptans, amines and ammonia. The assessment was performed over a two-week period in September 2014 by CEI personnel under the direction of Nate Seward, Professional Mechanical Engineer (M31978) and Certified Industrial Hygienist, (CP 9582) with CEI. This report documents the findings of the assessment. PURPOSE The purpose of the Air Quality Assessment was to monitor the air quality primarily for odorous organic sulfides (including hydrogen sulfide), ammonia and other common compounds typically associated with wastewater treatment facilities and to determine if such compounds were present at levels consistent with Federal, State and County regulations. Note: Odors often consist of a mixture or blend of various odorous and/or volatile organic compounds. A human’s odor detection sensitivity varies from person to person and is also differs between genders and among age groups. Since the detection of odors is widely variable, the odor intensity (the perceived strength of the odor sensation) is also variable among people. In addition, categorizing odors into pleasant fragrances or unpleasant odors varies among people. There are many factors that should be considered when determining the reaction or response to an odor such as: intensity, distance from the source, duration, frequency, offensiveness, location, potential hazards, etc. “Nuisance odors” are generally those types of odors that do not pose a hazard or health risk and which may be offensive to some and innocuous to others. According to the Santa Barbara County Environmental Thresholds and Guidelines Manual, a nuisance odor is defined as “an odor or other long-term air quality nuisance problem impacting a considerable amount of people…”. SAMPLING STRATEGY CEI collected samples daily (M-F) over 10 working days. Ten (10) different sampling locations were chosen along the northern property line, primarily downwind and less than 30’ from the WWTP (See Figure 1. Sampling Location Map). Sampling was performed on school days during school hours between September 10th – 24th, 2014. Utilizing ASTM Method D5504, the samples were analyzed for the presence of various sulfur compounds, including hydrogen sulfide (H2S), as well as several mercaptans, amines and phenols. During the air quality assessment, field observations (see Attachment 1; Daily Field Notes) were recorded each day which described the sampling conditions. The sampling locations were spaced approximately 12 feet from each other and extended along the property line between the WWTP and the neighboring property. Samples were collected approximately 3 feet from the fence at the property line. Five of the Showing a sampling location
adjacent to the fence line

Cate School Air Quality Assessment Report 1960 Cate Mesa Road
Carpinteria, CA
CEI.Cate.Fnl Page 2
samples were taken between 8am and noon and the other five samples were taken between noon and 4pm to ensure collection of data during the school hours. Figure 1. Sampling Location Map
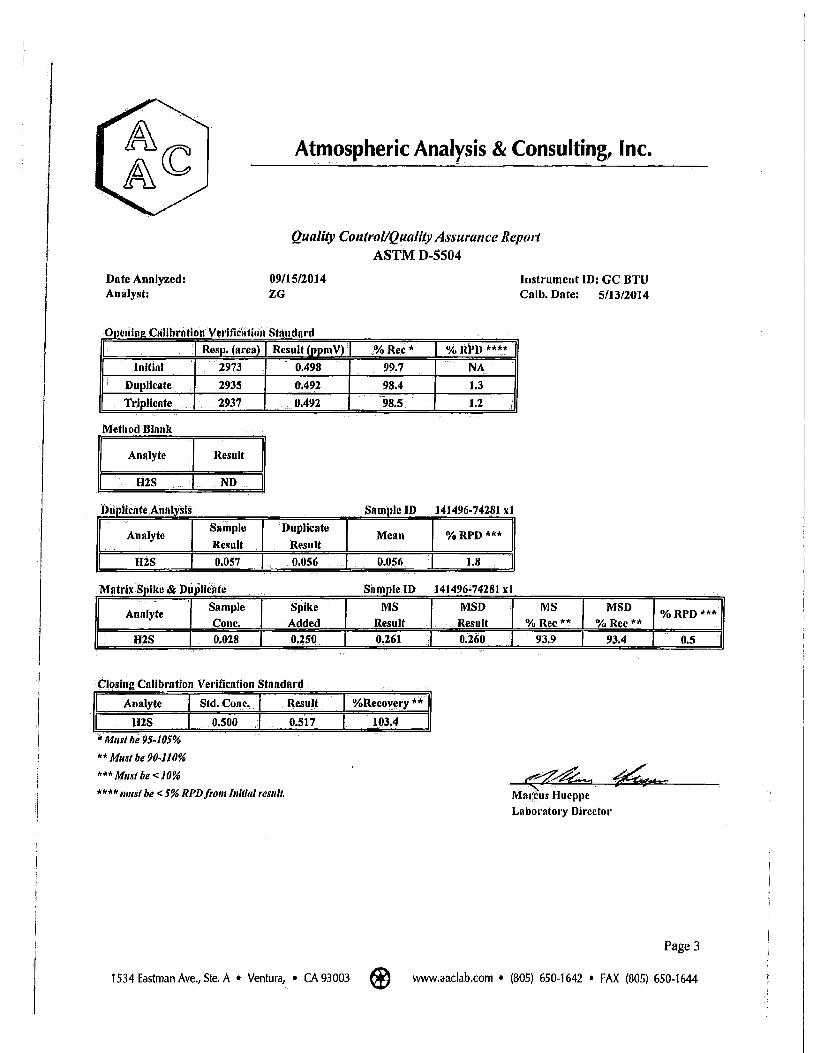
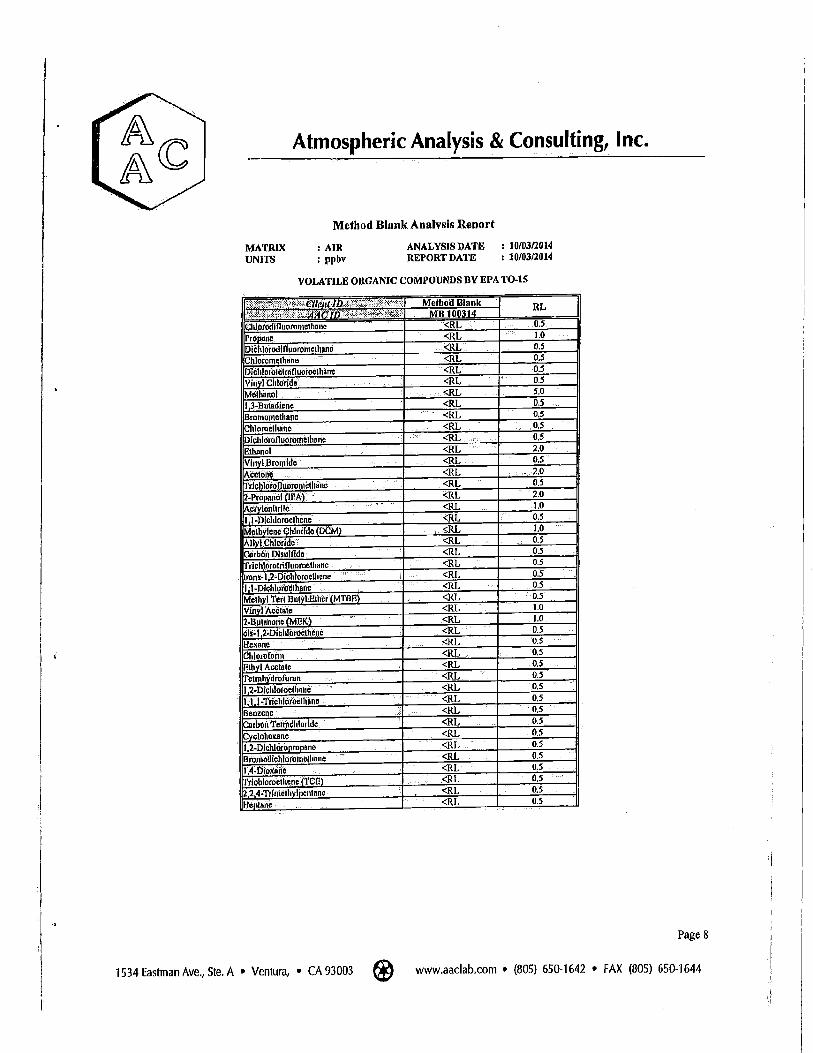
Sampling Methodology Canisters were used to collect airborne sulfur compounds by ASTM Method D5504. CEI utilized 6 liter SUMMA air capture canisters with an attached 2hr flow valve connected to capture the air sample over an approximate two hour period of time (see photo above for sampling). The interior of the canisters are electro-plated and electro-polished to provide a residual-free, re-useable sampling media. The canisters are cleaned and certified by in-house (QA/QC) procedures by the lab. In addition to using ASTM Method D5504, two (2) of the samples (1C & 3C) were also analyzed by EPA Method TO-15 to ascertain the presence of Volatile Organic Compounds (VOCs) and Tentatively Identifiable Compounds (TICs). TICs are those compounds checked against the library database that are outside of the standard VOCs analysis under Method TO-15. Laboratory calibration standards and quality control/quality assurance procedures, including method blanks and duplicate analysis, was followed in accordance with NELAC Standards. The analysis of the samples was performed by Atmospheric Analysis and Consulting (AAC), an NELAC Certified Lab located in Ventura, CA, under appropriate chain of custody procedures. Ammonia samples were collected using a Gastec pump set for 100ml volume sample collection. Specific Draeger tubes

Cate School Air Quality Assessment Report 1960 Cate Mesa Road
Carpinteria, CA
CEI.Cate.Fnl Page 3
designed for Ammonia were used to collect the air sample on site. The samples were collected within the general breathing zone (approximately 4 feet from the ground). Field Observations – There were no signs of equipment malfunction at the plant or in any of the piping lines in use throughout our time of investigation. General atmospheric conditions were recorded during the investigation. The ambient weather conditions remained relatively static, meaning there were no major changes in weather patterns or conditions throughout the assessment period. The average temperature during the assessments in the morning was 71.8⁰F, while the afternoon average
temperature averaged 76.3⁰F. Wind speed and direction remained
relatively consistent during the sampling periods, with the average wind speed around 8 mph from the west/southwest. In general, musky odors were observed by CEI personnel at the plant where it was strongest and dissipated downwind of the plant. At the northern property line near the plant, the intensity of the odors were intermittent due to the changing atmospheric conditions and wind direction at the fence line. See Attachment 1 for the daily field notes. Figure 2. Aerial Photo; Northern Cate School Campus
SAMPLE RESULTS Air quality contaminant thresholds are established and used by various Federal, State and local agencies, including those published in the Santa Barbara County Environmental Thresholds and Guidelines Manual and used by the Santa Barbara Air Pollution Control District (SBAPCD). These
Facing west along the fence line, adjacent to WWTP
Waste Water Treatment Plant
Property Line
along tree line
General wind direction
Sampling Locations

Cate School Air Quality Assessment Report 1960 Cate Mesa Road
Carpinteria, CA
CEI.Cate.Fnl Page 4
standards are generally used by environmental professionals preparing documents and evaluating projects under the California Environmental Quality Act (CEQA). Of these air quality thresholds, many are compared to hazard levels which generally are associated to health risks to the public. The primary pollutant that is associated with a WWTP and regulated by Santa Barbara County agencies is hydrogen sulfide (H2S) at 0.03ppm or 30ppb averaged over one hour. The Cate School sample results for H2S along with over 20 other sulfides, mercaptans and phenols were all below the established reporting limit (12ppb). In addition, the samples did not yield detectable ammonia levels. The detection threshold for ammonia is 0.2 ppm. In a further effort to identify the composition of the detected odor, two (2) of the sample canisters used in ASTM D5505 were also analyzed by EPA Method TO-15 for VOCs and TICs. The two samples were collected on two different days and at two different locations. These results indicated the following compounds were found in very low concentrations: VOCs PM-1c PM-3c
Chloromethane
Methanol
Acetone
Carbon Disulfide
Benzene
Chloromethane
Methanol
Ethanol
Acetone
2-Propanol (IPA)
Carbon Disulfide
2-Butanone (MEK)
Benzene
Toleune
1,4-Dichlorobenzene
TICs PM-1c PM-3c
Propane
2-Methyl-1-propene
Butane
2-Methylbutane
2-Methyl-1-propanol
Propane
1-Butanol
The results of the TO-15 analysis indicated the presence of VOCs that are commonly found in the local outdoor environment. Based on the types VOCs found, we conclude that these VOC’s are not likely associated with the WWTP but are related to products used in adjacent or upwind sources (fuels, cleaning products, adhesives, paints, glues, etc.). This conclusion is consistent for both samples analyzed using the TO-15 method. CONCLUSIONS The air quality analysis undertaken by CEI tested for the substances most commonly found to create odors and/or hazardous conditions associated with off gassing from wastewater treatment systems. The analysis found the presence of ammonia and sulfur-based compounds, including hydrogen sulfide, various mercaptans and amines at levels below the laboratory reporting limits and the adopted SBAPCD thresholds. In addition, the additional analysis of two air samples to

Cate School Air Quality Assessment Report 1960 Cate Mesa Road
Carpinteria, CA
CEI.Cate.Fnl Page 5
determine the presence of VOCs determined that VOC’s were found at levels that were all below OSHA and regulatory thresholds, including SBAPCD thresholds. Based on field and laboratory test results in accordance with ASTM D5504 and EPA Method TO-15, no odorous organic sulfides or any other substances were found at levels in excess of applicable air quality regulations or thresholds set by the Santa Barbara County Environmental Thresholds and Guidelines. In addition, the results are well below Cal OSHA and EPA reporting limits for hazardous compounds.
Limitations Statement The data compiled and evaluated as part of this assessment was limited and may not represent all conditions at the subject site. Air sampling can provide some guidance, but should not be considered definitive. This assessment reflects the data collected from specific locations tested to identify conditions in those locations and therefore, should not be considered comprehensive or all encompassing. The findings from this report have been based solely upon the subjective evaluation of limited data collected during this assessment. All data collection, findings, conclusions and recommendations presented by CEI within this report are based upon limited data using current standard practices accepted within the industry. The data collected during this assessment and any resulting recommendations shall be used only by the client for the site described in this report. Any use or reliance of this report, including any of its information or recommendations by a third party without the explicit authorization of CEI or the client shall be strictly at the risk of the third party. If you have any questions or concerns regarding the information provided, please do not hesitate to call us at 805.644.8347. Respectfully submitted,
Criterion Environmental, Inc. _____________________ Nate Seward, PE, CIH Professional Engineer (M31978) Certified Industrial Hygienist (CP 9582) Principal Hygienist


Pollutant Density (kg/m3)Existing Max
PPBExisting Conc
(mg/m3)Future Max
PPBFuture Conc
(mg/m3)Odor Threshold
Carbon Disulphide 1.2600 3.31 0.0042 4.303 0.005 0.05 mg/m3Chloromethane 1.0030 0.7 0.0007 0.910 0.001 10 ppmMethanol 1.4157 12 0.0170 15.600 0.022 8.9 ppmAcetone 2.5508 5.83 0.0149 7.579 0.019 20 ppmEthanol 0.0850 6.86 0.0006 8.918 0.001 84 ppm
Future concentration and Maximum PPB based on a linear increase in throughput.
http://www.epa.gov/ttnatw01/hlthef/carbondi.htmlhttp://www.epa.gov/ttnatw01/hlthef/methylch.htmlhttp://www.epa.gov/opptintr/aegl/pubs/methanol_interim4_february2005_c.pdfhttp://des.nh.gov/organization/commissioner/pip/factsheets/ard/documents/ard-ehp-7.pdfhttp://nj.gov/health/eoh/rtkweb/documents/fs/0844.pdf
Agency for Toxic Substances and Disease Registry (ATSDR). Toxicological Profile for Carbon disulfide (Update). Public Health Service, U.S. Department of Health and Human Services, Atlanta. 1996.Agency for Toxic Substances and Disease Registry (ATSDR). Toxicological Profile for Chloromethane (Update). U.S. Public Health Service, U.S. Department of Health and Human Services, Atlanta, GA. 1998.Hellman and Small (1974)
WASTE WATER ODOR