appendix a: evidence base for the draft housing ...mycouncil.oxford.gov.uk/documents/s37808/appendix...
TRANSCRIPT

Appendix A: Evidence Base for the Draft Housing & Homelessness Strategy 2018-21
July 2017
People in Oxford
Issue Source
Population The mid-2016 population estimate of the usual resident population in Oxford was 161,200.1 At the time of the Census 2011 151,900 people lived in Oxford. Of those 18,700 people lived in communal establishments (e.g. halls of residence). There were 4,000 short term migrants in Oxford who were not included in the population figure. The population increased by 12% between 2001 and 2011.There was a 26% increase in the number of children aged 0 to 9, and only a 1% increase in the population aged 60 and over. Due to the large number of students, Oxford has a relatively young population. 35% of the population is aged between 15 and 29 years (compared to an England average of 20%).2 The population turnover is also very high.3
1ONS Mid-2016
population estimates
2Census 2011
3Census 2001
Households The number of households in Oxford in 2017 as per the 2014-based household projections is 60,000.1 At the time of the Census 2011 the number of households was 55,400 (excludes those living in communal establishments). The average number of people per household was 2.40. This was an increase since 2001 when it was 2.32. The average number of people per household in England did not change in the same time period (2.40%).2
1 2014 based
household projections for England and local authority districts, DCLG Live table 406
2Census 2011
Ethnicity There is a fairly large BME population in Oxford (22.3%) compared to the national average (14.3%). The White Other group (12.4%) is also large compared to the national average (4.6%). Oxford South East England White British 63.6% 85.2% 79.8% White Irish/Other 14.1% 5.5% 5.7% Mixed 4.0% 2.0% 2.2% Asian 12.4% 5.2% 7.7% Black 4.6% 1.6% 3.4% Other 1.3% 0.6% 1.0%
Census 2011
Deprivation According to the 2015 Index of Multiple Deprivation, 10 of Oxford's 83 Super Output Areas are among the 20% most deprived areas in England, with 2 of those in the 10% most deprived. These areas, which are in the Leys, Rose Hill and Barton areas of the city, experience multiple levels of deprivation - low skills, low incomes and relatively high levels of crime. 1 The 2015 Income Deprivation Affecting Children Index shows 16 Super Output Areas in Oxford among the 20% most deprived areas in England, with 6 of those in the 10% most deprived.1 As at May 2014 there were 3,890 children (aged 0-15) in Oxford living in families in receipt of out of work benefits. This is 14.4% of children in Oxford, and is higher than in the other districts in Oxfordshire (which range from 6.5% in South Oxfordshire to 9.3% in Cherwell). However,
1English Indices of
Deprivation 2015, DCLG 2Children in out-of-
work benefit households: 2014 snapshot, Ad hoc statistics DWP 3Oxford Health Profile
2016, Public Health England. © Crown Copyright 2016
15

Appendix A: Evidence Base for the Draft Housing & Homelessness Strategy 2018-21
July 2017
this is a reduction from 2013 when the figure was 4,550 (17.2%)2 There are inequalities in health within Oxford. Life expectancy in the most deprived areas is 9.7 years lower for men, and 3.3 years lower for women, compared to those from the least deprived areas.3
Unemployment In common with the rest of the UK, there was a sharp increase in unemployment as a result of the 2008 recession. The number of people claiming unemployment benefit rose from 1,600 in October 2008 to a peak of nearly 3,000 in May 2009. After four years in which the number of claims were elevated, they started falling in 2013. The number of Out-of-work benefits (1,105 in April 2017) is now significantly below the pre-recession average. 1.0% of the working age population in Oxford were claiming Out-of-work benefits in April 2017 compared to 2.0% in Great Britain (Jobseeker's Allowance claimants plus those who claim Universal Credit who are out of work). The proportion of people claiming in Oxford is lower than the national average (due to the large number of full-time students who are not eligible).
Nomis (ONS claimant counts)
Benefits Total main benefit claimants within the working age population amounted to 6.7% in Oxford compared to 11.1% in Great Britain in November 2016. This has reduced from a peak in 2009 of 10.2% (Great Britain 15.0%).
Nomis (DWP benefit claims)
Income Annual median earnings for full-time employees resident in Oxford were £29,811 in 2016, while median full-time earnings for employees working in Oxford were higher at £31,675. The median earnings in England were £28,500.
ASHE gross annual pay full-time employees 2016 (provisional)
Qualifications Oxford is, in general, a well-educated city - according to the Census 2011 42.6% of the population over 16 was qualified to NVQ Level 4 compared to England 27.4%. However there are very high levels of people without qualifications in some areas (mainly those areas with a high level of deprivation).1
The attainment levels of Oxford school pupils are below the national average. In 2014, 53.5% of Oxford pupils gained 5 A*-C grades at GCSE (including English and Maths), compared to a national average of 56.6%.
The gap has, however, reduced from 2011 when it was 10.5 percentage points and Oxford schools have moved out of the bottom quartile in national GCSE rankings for the first time in a number of years.2 (From 2015 data is no longer published at district level, only education authority level, which in Oxfordshire is the County Council. The way attainment is measured has also changed and is now measured through Attainment 8 and Progress 8 scores.)
1Census 2011
2GCSE and
Equivalent Results for Young People, ONS Neighbourhood Statistics 3English Indices of
Deprivation 2015, DCLG
16

Appendix A: Evidence Base for the Draft Housing & Homelessness Strategy 2018-21
July 2017
Looking at the 2015 Index of Deprivation nearly one-third of LSOAs in Oxford are amongst the 20% most deprived in England for the Children and Young People (CYP) sub-domain. Barton and Sandhills 13, Rose Hill and Iffley 76, and Northfield Brook 69 are amongst the 1% most deprived areas in the CYP sub-domain in England. The measure is based on average points score for Key Stage 2 and 4 attainment, proportion of secondary school (authorised and unauthorised) absences, proportion of young people not staying on in education above age 16, and young people aged 21 not entering higher education.3
NEET In August 2016, 4.5% (190) of young people in Oxford hub areas were not in education, employment or training (NEETs), compared to 3.5% (648) for Oxfordshire. The figures for the Early Intervention Hubs covering Oxford City were:
East Oxford 3.8% (East and Central Oxford, Botley and Cumnor, Wolvercote and North Oxford, and Barton)
Littlemore 5.6% (Littlemore, Iffley and South Oxford, Cowley, and Blackbird Leys area).
7.8% (340) of young people in Oxford were Not Known, i.e. information was missing whether they were in education, employment or training, or not. The data covers young people in school year groups 12 to 14, which approximately corresponds to age 16-19. In August 2015 there were 4.2% (178) NEETs in Oxford hub areas and 4.6% (196) Not Knowns. The percentage of NEETs in Oxfordshire reduced from 5.6% in August 2013 to 3.3% in 2015, but increased slightly in 2016 to 3.5%.
1NEET Data,
Oxfordshire County Council
Teenage pregnancy The under 18 conception rate in Oxford in 2015 was 17.2 per 1000. This is lower than the national average of 20.8, but higher than the Oxfordshire average of 13.2. The under 18 conception rate in Oxford has decreased considerably during the last 10 years, but it continues to be higher than other Oxfordshire districts. 1
1ONS, Conception
Statistics, 2015 2Director of
Public Health for Oxfordshire Annual report 2014/15
17

Appendix A: Evidence Base for the Draft Housing & Homelessness Strategy 2018-21
July 2017
The five wards in Oxfordshire with the highest under 18 conception rates are all in Oxford City2: Blackbird Leys St Mary’s (incl Holywell) Iffley Fields Barton and Sandhills Rose Hill and Iffley
Housing needs, affordability and supply of housing
Issue Source
Tenure At the time of the Census 2011 there were over 59,000 homes in Oxford.1 Oxford has a very large private rented sector (28%), it retains a sizable social rented sector (21%) and the level of owner occupation is among the lowest in the country (47%), which is very low for the South East region.2
Oxford South East England
Owner Occupation 46.7% 67.6% 63.4%
Shared ownership 1.7% 1.1% 0.8%
Social rented 21.4% 13.7% 17.7%
Private rented 28.2% 16.3% 16.8%
Living rent free 2.0% 1.3% 1.3%
1Council Tax
2Census 2011
Overcrowding and under-occupation The census 2011 shows that 6.2% of households in Oxford had an occupancy rating for bedrooms of -1 or less, compared to a national average of 4.8%. An occupancy rating of -1 implies that there is one bedroom too few for the number of people living in the household. Census data also shows that 29.1% of households have an occupancy rating of +2 or more (meaning that there are at least two more bedrooms than are technically required by the household), compared to an England average of 34.3%. 29% of council owned dwellings are under-occupied (using the same criteria as the ‘bedroom tax’ rules for who can share a bedroom); this corresponds to 38% of family-sized properties (two-beds or larger). Of the households under-occupying, the majority (68%) require a one-bed property. 61% of under-occupying households have a main tenant aged 60 or over.
Census 2011
Disability and mobility
The City Council’s housing register (July 2017) identified by using the Health and Housing Assessment process, there were 293
18

Appendix A: Evidence Base for the Draft Housing & Homelessness Strategy 2018-21
July 2017
households on the housing register with a mobility need, the majority (188) require only level access, 5 require a wheelchair adapted property and the rest (100) require some adaptions, such as level access shower, stair lift or walk-in bath.
In July 2017, the housing register indicated that there were 139 applicants who had a Health and Housing Assessment (HAHA) award, and needed to move from their current accommodation.
Empty homes In October 2016 there were 618 empty homes in Oxford, of which 303 were long term empty homes (empty for more than six months). The council tax definition of empty is a dwelling that is unoccupied and unfurnished. There were also 892 homes classed as second homes, defined as a furnished dwelling which is no one’s sole or main residence. Some of these will in effect be empty and not in use. The total number of dwellings was 60,433.1
In 2016/17 the number of empty homes brought back into use through
1Council Tax reports
2OCC performance
indicators 3LAHS 2016
19

Appendix A: Evidence Base for the Draft Housing & Homelessness Strategy 2018-21
July 2017
intervention by the Empty Property Officer was 22.2 Of Oxford City Council’s stock 13 were long-term empty as at 1 April 2017.3
Student accommodation In December 2015 the University of Oxford had 17,748 full-time students with accommodation requirements. There were 14,816 units of university (or college) provided accommodation. This leaves a total of 2,932 students living outside of university provided accommodation, below the Core Strategy target of 3,000.1 In December 2015 Oxford Brookes University had 8,954 students with accommodation requirements. There were 5,207 places in accommodation provided by Oxford Brookes. This means that there were 3,747 students at Oxford Brookes University without a place in university provided accommodation, above the Core Strategy target of 3,000. Oxford Brookes University is currently working on a fully revised student accommodation strategy, taking into account fundamental shifts in the makeup of the student body and the impact this has on the accommodation the University needs to provide to ensure it can meet the 3,000 target.1 In 2014/15 there were a total of 32,395 full-time students (22,930 under-graduate and 9,465 post-graduate students) at the University of Oxford and Oxford Brookes University.2
1Annual monitoring
report 2015/16 2HESA
Social housing stock Oxford City Council properties (incl. 90 properties in Abingdon and 109 in Kidlington) as at April 2017:
Number of bedrooms
0 1 2 3 4 5+ Sum:
Flat / Maisonette
158 1198 1704 149 5 0 3214
House / Bungalow
0 271 831 2856 245 37 4240
Sheltered 15 251 26 0 0 0 292
Sum: 173 1720 2561 3005 250 37 7746
Housing Association nomination properties:
Number of bedrooms
0 1 2 3 4 5+ Sum:
Flat / Maisonette
155 780 544 29 1 0 1509
House / Bungalow
0 35 562 766 141 25 1529
Sheltered 203 460 50 2 0 0 715
Sum: 358 1275 1156 797 142 25 3753
Northgate HMIS
20

Appendix A: Evidence Base for the Draft Housing & Homelessness Strategy 2018-21
July 2017
Right to Buy The Right to Buy scheme was introduced in 1980 and has led to a steady loss of council housing stock. In April 2012 the discount was increased from £16,000 to £75,000, and is now £78,600. In the last five years a total of 156 properties have been sold through the right to buy.
8
45 46
3225
0
10
20
30
40
50
2012/13 2013/14 2014/15 2015/16 2016/17
Right to Buy sales
House prices House price inflation in Oxford (March 2016 to March 2017) is running at 3.7% compared to a UK average of 5.7%. House price growth in Oxford, Cambridge and London has slowed to less than 5% for the first time in five years as affordability pressures, and tax changes for investors, constrain demand.1
Oxford 2012 2013 2014 2015 2016
Median house price 278,000 287,250 315,000 350,000 375,000
Sale counts 1,495 1,728 1,831 1,678 1,442
The median house price in Oxford in 2016 was £375,000. The median price for a detached house was £732,500, for a semi-detached house £410,000, for a terraced house £390,000 and for a flat/maisonette £281,500. House prices have steadily increased in the last five years. The number of properties sold is lower than before the credit crunch when generally the number of sold properties was around 2,500 per year.
2 House prices in Oxford are much higher than other areas in Oxfordshire and the South East.
House prices, 2016 2
10th percentile
Lower quartile Median Mean
Oxford 240,000 292,500 375,000 486,001
Oxfordshire 200,000 260,000 330,000 394,318
South East 160,000 218,000 295,000 354,822
London 250,000 330,000 441,000 585,648
England 101,500 145,000 224,000 288,227
1Hometrack UK Cities
House Price Index, March 2017 2ONS, House Price
Statistics for Small Areas
Affordability 1ONS, House Price
Statistics for Small
21

Appendix A: Evidence Base for the Draft Housing & Homelessness Strategy 2018-21
July 2017
House prices have been increasing at a much higher rate than earnings. The median house price in Oxford increased by 146% from 2001 to 2016 (£152,500 – £375,000).1 Median earnings for full-time employees in Oxford increased by 44% in the same period (£21,960 – £31,675).2
The chart above shows the household income required to secure a 95% mortgage on a median-priced semi-detached house in Oxford at 4.5 times household income. It compares that figure to median earnings over the same period. In 1997 such a loan was in the reach of a household with one median-earning worker, but in 2014 it would have taken an income of £70,000 - over twice the median wage. (Housing: rising prices, low
sales, deteriorating affordability, Mark Fransham, OCC, Sep 2015)
Even if you can afford to buy a property, accessing a mortgage, in particular the size of the deposit required, is now one of the main obstacles to entering the housing market. 59% of people responding to the Property Tracker survey saw raising a deposit as a barrier to buying a property.3
Areas 2ASHE gross annual
full-time earnings by place of work, table 7.7a 3Property Tracker
Survey Sep 2015 (Building Societies Association) 4Broken market,
broken dreams – Home Truths 2014/15 (NHF)
22

Appendix A: Evidence Base for the Draft Housing & Homelessness Strategy 2018-21
July 2017
First-time buyers now need to be richer and have larger deposits than previously. The income of an average first-time buyer in England today (£36,500) is nearly double that of an average first-time buyer in the early 1980s (£20,000) after accounting for inflation, and the deposit required today (£30,000) is almost ten times the deposit required in the early 1980s (£2,000-3,000), after accounting for inflation. It is increasingly the case that in order to get on the housing ladder, first-time buyers need financial assistance from their family. In 2005, roughly a third of first-time buyers received assistance – this grew to almost two-thirds in 2011.4
Rents Private sector rents in Oxford are considerably higher than social housing rents. Weekly rents in Oxford
Property type
Average Council
social rent, 2016
Average Council
affordable rent,
2016
Average Housing
Association social
rent, 2016
1
Average Housing
Association
affordable rent, 2016
1
Average private
rent2
LHA rate for
Oxfordshire, Apr
20163
Room N/A N/A N/A N/A £117.69 £80.55
1 bed £89.76 £140.79 £98.61 £140.78 £210.92 £158.90
2 bed £102.95 £163.24 £116.20 £169.60 £253.85 £192.48
3 bed £114.82 £206.87 £129.26 £187.73 £301.38 £230.14
4 bed £121.78 N/A £141.70 N/A £448.15 £299.18
Oxford has been identified as the most unaffordable location outside of London for private renting where median rents for two bedroom homes account for 55% of local median full-time earnings.4
Rent levels for two-beds in Oxford in 2016/17, compared to regional and national rent levels:
2 Bedrooms2
Area Average Lower quartile
Median Upper quartile
England 791 515 650 895
South East 909 750 875 1,045
Oxfordshire 988 840 925 1,100
Oxford 1,164 1,000 1,150 1,275
The Local Housing Allowance was set at the 30th percentile of rents in the broad rental market area until 1 April 2013. After April 2013 LHA rates were set annually using either the 30th percentile of rents in the broad rental market area in September, or the previous April LHA rate uprated by the Consumer Price Index of September. However, the Government announced in the 2015 Summer Budget the decision to freeze Local Housing Allowance rates for four years. From April 2016, rates will either remain at the previous April LHA rate or be set at the 30th percentile of local rents if this is lower.
1SDR returns 2016
(average rent for general needs properties, social and affordable rent excl service charges) 2Valuation Office
Agency, Summary of monthly private sector rents recorded over the 12 months to the end of March 2016 3LHA rates April 2016
4Shelter Private Rent
Watch, Analysis of local rent levels and affordability, 2011
23

Appendix A: Evidence Base for the Draft Housing & Homelessness Strategy 2018-21
July 2017
The Broad Rental Market Area covers most of Oxfordshire. However, the rents in Oxford are higher than in most other parts of Oxfordshire so even those in the 30th percentile in Oxford are not covered by the LHA. The lower quartile rent for a 2-bed in Oxford is £1,000 per month2, but the LHA is only £8343
. If the rents keep on rising in the next few years the
LHA freeze means the gap will increase even further.
Housing benefit The number of households in Oxford receiving housing benefit as at January 2017 was 9,992. 72% were social sector tenants, and 28% were private sector tenants. 8% of the social sector tenants (560 claimants) had their housing benefit reduced because of the spare room subsidy (bedroom tax). 54% were on passported benefits (income support, ESA, JSA and pension credit with guarantee credit element), 30% were employed, and 16% were not employed and not on passported benefits. The proportion of those claiming housing benefit who are in employment has more than doubled from 14% in May 2009. The corresponding figures for England were 11% in May 2009 and 24% in January 2017. In December 2016 there were 247 households on Universal Credit with a housing entitlement.
Stat-Xplore, Department for Work and Pensions
Welfare Reform In July 2015, the government delivered an emergency budget which aimed to cut £12 billion from benefits paid to working age people. The budget included the following measures:
From April 2016, most benefits, including tax credits and Local Housing Allowance, are frozen for four years.
For those having children after April 2017, child tax credit and Universal Credit are limited to two children.
From April 2017 there is no longer automatic entitlement to the housing element of Universal Credit for 18-21 year olds who are unemployed. Though there are various exceptions for parents, vulnerable groups and people who could previously afford their rent without assistance.
Social housing rents to be reduced by 1% every year for four years from April 2016.
Universal credit Universal Credit is a benefit which combines a number of existing benefits into one claim: Jobseekers Allowance Housing Benefit Working Tax Credit Child Tax Credit Employment and Support Allowance Income Support Universal Credit is being introduced in stages. Universal Credit started in Oxford in April 2015, though only for single people without children who
24

Appendix A: Evidence Base for the Draft Housing & Homelessness Strategy 2018-21
July 2017
would normally apply for Jobseekers Allowance. The Department of Work and Pensions is in the process of extending Universal Credit to other groups of people, but this will not happen in Oxford until October 2017. Benefit cap The benefit cap means that the housing benefit is cut so that benefit claimants who are part of a couple or have children get no more than £385 a week in total benefits, for single people the cap is £258 per week. The cap was reduced in November/December 2016 from £500 and £350 respectively. As at March 2017 224 households in Oxford had their benefits capped. As at October 2016, before the reduction, only 55 households were affected by the benefit cap. Average loss of housing benefit due to the benefit cap is £65 per week. Bedroom tax/Removal of spare room subsidy The bedroom tax was introduced in April 2013. Those of working age who rent their home from a registered social landlord, will have their housing benefit cut if they have more bedrooms than the bedroom tax rules allow. The amount of net rent covered by housing benefit is cut by: 14% for one spare bedroom 25% for two or more spare bedrooms In March 2017 556 social housing tenants in Oxford had their housing benefits reduced because of the bedroom tax.
Discretionary Housing Payments Applicants who receive housing benefit that does not cover the whole of their rent can apply for a Discretionary Housing Payment. A Discretionary Housing Payment is intended to be a short-term measure to help relieve poverty or difficult circumstances. 2012/13 Claims paid 373 Total spend £199,205 Average payment per claim £534.06 2013/14 Claims paid 498 Total spend £431,244 Average payment per claim £865.95 2014/15 Claims Paid 711 Total Spend £464,903 Average payment per claim £653.87 2015/16 Claims Paid 454 Total Spend £270,504 Average payment per claim £595.83
25

Appendix A: Evidence Base for the Draft Housing & Homelessness Strategy 2018-21
July 2017
2016/17 Claims Paid 549 Total Spend £379,009 Average payment per claim £690.36 Our DHP grant for 2016/17 from the DWP was £376,792 but we spent £379,009. We assessed 744 applications for DHP and 549 were successful. The most common reason we turned down DHP applications was because customers didn’t have a plan to improve their situation. Nearly half of our DHP spend was because of changes to the benefit cap which cut housing benefit for 197 Oxford households from 12 December 2016.
Mortgage possession claims In 2016, 24 mortgage possession claims were issued in Oxford. Mortgage possession claims went up to 204 in 2008, but the figure has reduced considerably since then. Number of mortgage possession claims in the last 10 years
166
204
93 88 98
63 5741
15 24
0
50
100
150
200
250
2007 2008 2009 2010 2011 2012 2013 2014 2015 2016
The actual number of repossessions in 2016 was only 3 whereas in 2008 there were 61 repossessions.
Ministry of Justice
Housing need The 2014 Oxfordshire Strategic Housing Market Assessment states that in Oxford in particular there are significant affordability pressures, both in regard to the (un)affordability of market housing and in terms of an acute shortage of affordable housing. The deterioration in the affordability of market housing for sale across Oxfordshire has resulted in an increasing proportion of households renting homes for longer, and more young people in their 20s and 30s living with families or in shared accommodation. Between 2001-11 we also saw a 30% increase in households living in overcrowded homes. The SHMA indicates a need to deliver 1,029 affordable homes a year in Oxford if all households who are not able to meet their needs in the housing market where to be allocated an affordable home. This assumes that households will spend up to 35% of their gross income on housing costs, and that the current housing need (backlog need) is addressed over the period to 2031.
Strategic Housing Market Assessment 2014
26

Appendix A: Evidence Base for the Draft Housing & Homelessness Strategy 2018-21
July 2017
New homes The total number of net new residential dwellings provided in last 5 years are 2011/12 228 2012/13 213 2013/14 71 215* 2014/15 270 332* 2015/16 346 383* *Note: Total completions for the year 2013/14 and later including C3 residential dwellings plus a dwelling equivalent figure for C2 student accommodation and care home rooms to reflect changes introduced in the Planning Practice Guidance in 2014.
In 2013/14 the Planning Practice Guidance (PPG) introduced that student accommodation can be counted, based on the amount of accommodation it releases in the housing market. In assessing the contribution of student rooms to housing delivery in Oxford, the number of student rooms is divided by five to establish the dwelling equivalent figure. For example, a development of 100 student rooms will be assessed as releasing 20 ‘dwellings’. The PPG also introduced that care homes can be counted. The City Council has taken the approach that one room in a C2 care home would on average release one dwelling in the housing market. Therefore a 1:1 ratio of rooms to dwellings delivered will be applied.
Annual monitoring report 2015/16 – Net additional dwellings
New affordable homes Number of affordable homes delivered (gross) were 2012/13 94 2013/14 4 2014/15 15 2015/16 166 2016/17 20
New affordable homes
In 2017/18 there are plans to deliver 74 affordable homes.
NI155
Housing register The number of people on the Housing Register was 3399 in May 2017, with 2292 of those on the general register and 1107 on the transfer
Northgate HMIS
27

Appendix A: Evidence Base for the Draft Housing & Homelessness Strategy 2018-21
July 2017
register (council and housing association tenants in Oxford wishing to move). Breakdown May 2017:
All bands
Bands 1-4
Number %
Number %
Band 1 (highest housing need) 59 1.7%
2 254 7.5% 3 776 22.8% 4 162 4.8% 5 (lowest housing need) 2148 63.2%
3399 100.0%
Register GR 2292 67.4%
620 49.6%
TR 1107 32.6%
631 50.4%
3399 100.0%
1251 100.0%
Age 16-24 236 6.9%
118 9.4%
25-44 1777 52.3%
655 52.4%
45-59 919 27.0%
324 25.9%
60+ 467 13.7%
154 12.3%
3399 100.0%
1251 100.0%
Ethnicity White 1693 49.8%
671 53.6%
BME 837 24.6%
323 25.8%
None stated 869 25.6%
257 20.5%
3399 100.0%
1251 100.0%
Dependent children / Expecting
Yes 1701 50.0%
814 65.1%
No 1698 50.0%
437 34.9%
3399 100.0%
1251 100.0%
Household Type Couple with dep children 829 24.4%
406 32.5%
Lone parent dep children 872 25.7%
408 32.6%
Single 1272 37.4%
312 24.9%
Other 426 12.5%
125 10.0%
3399 100.0%
1251 100.0%
Minimum bedroom requirement
0 1279 37.6%
311 24.9%
1 235 6.9%
52 4.2%
2 1076 31.7%
360 28.8%
3 606 17.8%
348 27.8%
4 150 4.4%
128 10.2%
5+ 53 1.6%
52 4.2%
3399 100.0%
1251 100.0%
28

Appendix A: Evidence Base for the Draft Housing & Homelessness Strategy 2018-21
July 2017
Overcrowding
Lacking 1 bedroom 689 20.3%
689 55.1% Lacking 2 or more bedrooms 55 1.6%
55 4.4%
Total overcrowded 744 21.9%
744 59.5% (Overcrowded households are normally placed in band 2 or 3)
Lettings Lettings of council and housing association properties in the last 5 years (incl transfers): 2012/13 492 2013/14 517 2014/15 479 2015/16 629 2016/17 516
Number of properties allocated
In 2016/17 516 properties were let through the Council’s choice based lettings scheme. Of those 386 were Council properties and 130 were Housing Association properties. We let 81 properties to homeless applicants, 49 to Move On applicants*, 221 to other general register applicants (excl Homeless and Move On), and 165 to transfer applicants. (*Move On applicants – applicants referred from various supported housing projects across the city, from Social Services i.e. former care leavers who are ready to move on to independent accommodation, and from the Mother & Baby unit .)
Of the transfer applicants 51 were underoccupying tenants who downsized to a smaller property. Of the properties let 28% were houses/bungalows and 72% were flats/maisonettes. 46% were family sized accommodation.
Northgate HMIS
29

Appendix A: Evidence Base for the Draft Housing & Homelessness Strategy 2018-21
July 2017
Family 237
Non-family 147
Designated Elderly/ 1 bed gen needs bungalows 50
Sheltered 82
TOTAL 516
Of the stock (OCC and housing associations) 69% are family-sized properties (2 bed or larger non-sheltered), but of those let during 2016/17 only 46% were family-sized (59% in 2015/16 and 53% in 2014/15). There were 221 lettings of council owned general needs properties to new tenants in social housing. When the new compulsory fixed term tenancies are introduced these tenants would most likely have been offered a fixed term tenancy. There is still uncertainty as to whether existing tenants transferring property or those moving into sheltered accommodation will be affected.
Lettings of Council owned properties
General needs
housing Sheltered
housing
General register applicants 221 27
Housing association tenants 19 3
Oxford City Council tenants 96 20
REMS scheme The Removal and Expenses Scheme (REMS) is a scheme for council tenants who are under-occupying their properties and who want to move to a smaller property. Tenants accepted on the scheme will be placed in band 1 on the housing register if they are giving up two or more bedrooms and in band 2 if they are giving up one bedroom. They may also be eligible for compensation plus certain other expenses. Of under-occupying households in council owned dwellings only 6% are on the REMS scheme. Number of properties released through the REMS scheme in the last five years. 2012/13 28 2013/14 58 2014/15 57 2015/16 41 2016/17 50
Northgate
30

Appendix A: Evidence Base for the Draft Housing & Homelessness Strategy 2018-21
July 2017
28
58 57
41
50
0
10
20
30
40
50
60
70
2012/13 2013/14 2014/15 2015/16 2016/17
Homelessness
Issue Source
Temporary accommodation 2012/13 120 2013/14 113 2014/15 107 2015/16 115 2016/17 96
Number of households in temporary accommodation
Type of accommodation as at 31 March 2017: 31% Private sector leased properties 68% Own stock 0% Bed & Breakfast As at 31 March 2017 84% of households in temporary accommodation were families with dependent children or expected babies. 46% were BME households. For households accepted as homeless who were housed during 2016/17, the average time they spent in temporary accommodation since they were accepted was 10 months.
P1E
Acceptances Please also see appendix 1 at the end of this document for a comparison of acceptances in Oxford and England for the last five
P1E
31

Appendix A: Evidence Base for the Draft Housing & Homelessness Strategy 2018-21
July 2017
years. Acceptances Claims % Acc 2012/13 104 338 30.8% 2013/14 114 265 43.0% 2014/15 114 287 39.7% 2015/16 141 295 47.8% 2016/17 125 260 48.1%
Homelessness claims and acceptances
338
265287 295
260
104 114 114141 125
0
100
200
300
400
2012/13 2013/14 2014/15 2015/16 2016/17
Claims Acceptances
Acceptances – age For the last couple of years the proportion of young households between 16 and 24 years old accepted as homeless has been holding steady at around one fifth, whereas previously the proportion was much higher. 2014/15 2015/16 2016/17 16-24 28.1% 19.1% 20.8% 25-44 61.4% 63.8% 61.6% 45-59 9.6% 16.3% 15.2% 60 and over 0.9% 0.7% 2.4%
P1E
Acceptances – ethnicity Asian and Black households are over-represented among homeless acceptances compared to the population in Oxford. The percentage of acceptances of White British households has reduced since 2014/15. 2014/15 2015/16 2016/17 White British 45.6% 36.2% 35.2% White Other 16.7% 16.3% 16.0% Mixed 5.3% 7.8% 5.6% Asian 10.5% 9.9% 19.2% Black 14.0% 22.7% 14.4% Other 2.6% 5.7% 4.8% None stated 5.3% 1.4% 4.8%
P1E
Acceptances – household type The main type of household accepted as homeless used to be lone female parents, though in the last year we accepted approximately the same proportion of couples with children as homeless.
P1E
32

Appendix A: Evidence Base for the Draft Housing & Homelessness Strategy 2018-21
July 2017
2014/15 2015/16 2016/17 Couple w children 33.3% 31.9% 38.4% Lone parent Female 50.9% 49.6% 40.8% Lone parent Male 0.9% 7.1% 6.4% Single Female 7.0% 3.5% 4.6% Single Male 6.1% 7.1% 7.2% Other 1.8% 0.7% 2.4%
Acceptances – reason for homelessness Since 2014/15 the most common reason for losing the last settled accommodation is loss of rented accommodation (where the main reason is the ending of AST), followed by family and friends no longer willing or able to accommodate. Previously the most common reason was family and friends no longer willing or able to accommodate. 2014/15 2015/16 2016/17 Exclusions by parents, 33.3% 27.7% 25.6% relatives, friends Loss of rented accom 40.4% 51.8% 50.4% (end of AST/other reason) Relationship breakdown 8.8% 7.1% 10.4% Left institution/care 2.6% 0.7% 2.4% Mortgage/Rent arrears 7.0% 5.7% 4.0%
P1E
Homeless decisions The number of homeless applications has gone down since 2012/13. Our focus has shifted to early prevention and the council therefore tries to remedy the situation before there is a need to take an application. The number of households accepted as statutory homeless was slightly lower in 2016/17 than the previous year, though there is continuing high pressure from tenancy ends in the private rented sector (PRS), and we have less options in the PRS to help prevent homelessness.
Homeless applications 2012/13 2013/14 2014/15 2015/16 2016/17
Claims 338 265 287 295 260
Acceptances 104 114 114 141 125
2014/15 2015/16 2016/17 Accepted 39.7% (114) 47.8% (141) 48.1% (125) Intentionally homeless 17.8% (51) 14.8% (43) 17.7% (46) Not in priority need 10.1% (29) 9.5% (28) 10.4% (27) Not homeless 28.9% (83) 25.4% (75) 21.2% (55) Not eligible 3.5% (10) 2.7% (8) 2.7% (7)
P1E Northgate HMIS
Homeless decisions – Age There has been a shift towards older age groups in those applying as homeless. Age – total homeless decisions 2014/15 2015/16 2016/17 16-24 25.1% 21.0% 19.2% 25-44 55.4% 61.4% 59.2% 45-59 17.8% 15.9% 17.7%
Northgate HMIS
33

Appendix A: Evidence Base for the Draft Housing & Homelessness Strategy 2018-21
July 2017
60 and over 1.7% 1.7% 3.8%
2016/17 Accepted Intent
homeless Not
homeless
Total number 125 46 55
Age 16-24 20.8% 19.6% 20.0%
25-44 61.6% 58.7% 56.4%
45-59 15.2% 17.4% 18.2%
60+ 2.4% 4.3% 5.5%
Homeless decisions – Ethnicity Black households are over-represented among homeless applicants compared to the population in Oxford. Ethnicity – total homeless decisions 2014/15 2015/16 2016/17 White British 44.9% 39.7% 40.8% White Other 12.9% 15.6% 13.1% Mixed 4.5% 7.1% 5.8% Asian 11.5% 8.5% 13.1% Black 13.6% 17.3% 16.5% Other 4.5% 5.4% 3.8% None stated 8.0% 6.4% 6.9%
2016/17 Accepted Intent
homeless Not
homeless
Total number 125 46 55
Ethnicity White British 35.2% 45.7% 45.5%
White Other 16.0% 6.5% 14.5%
Mixed 5.6% 6.5% 9.1%
Asian 19.2% 2.2% 12.7%
Black 14.4% 19.6% 9.1%
Other 4.8% 6.5% 1.8%
None stated 4.8% 13.0% 7.3%
Northgate HMIS
Homeless decisions – Household type There is a high percentage of Lone female parents among those applying as homeless. Household type – total homeless decisions 2014/15 2015/16 2016/17 Couple w children 24.7% 30.2% 28.5% Lone parent Female 48.8% 44.7% 38.8% Lone parent Male 1.7% 4.4% 5.4% Single Female 10.5% 9.5% 11.9% Single Male 11.5% 9.8% 12.7% Other 2.8% 1.4% 2.7%
2016/17 Accepted Intent
homeless Not
homeless
Total number 125 46 55
Northgate HMIS
34

Appendix A: Evidence Base for the Draft Housing & Homelessness Strategy 2018-21
July 2017
Household type Couple w children 38.4% 28.3% 21.8%
Lone parent Female 40.8% 45.7% 49.1%
Lone parent Male 6.4% 2.2% 5.5%
Single Female 4.8% 10.9% 10.9%
Single Male 7.2% 10.9% 10.9%
Other 2.4% 2.2% 1.8%
Homeless decisions – Reasons for homelessness In 2016/17 the most common reason for homelessness for all homeless decisions was loss of rented accommodation (where the main reason is the ending of AST). Rent arrears was the most common reason among those with an Intentionally homeless decision. Reason for homelessness – total homeless decisions 2014/15 2015/16 2016/17 Exclusions by parents, 26.5% 26.4% 22.7% relatives, friends Loss of rented accom 39.7% 45.1% 36.5% (end of AST/other reason) Relationship breakdown 9.4% 6.8% 13.1% Rent/mortgage arrears 10.1% 12.5% 13.8%
2016/17 Accepted Intent
homeless Not
homeless
Total number 125 46 55
Homeless reason Family / friend exclusion 25.6% 23.9% 20.0%
Loss of rented accom (end of AST / Other) 50.4% 17.4% 30.9%
Relationship breakdown 10.4% 4.3% 25.5%
Violence / harassment 0.8% 0.0% 5.5%
Left institution / care 2.4% 2.2% 1.8%
Rent / mortgage arrears 4.0% 41.3% 12.7%
Other reason 6.4% 10.7% 3.6%
Northgate HMIS
Young people The number of 16/17 year olds applying as homeless has stayed low in the last few years. A reason for this is the strong joint working with Children’s Social Care to ensure young people are appropriately supported if they become homeless or families are supported to look after their children at home. Homeless Of which accepted decisions as homeless 2012/13 1 1 2013/14 1 1 2014/15 1 1 2015/16 1 0 2016/17 0 0
18-20 year olds formerly in care: Homeless Of which accepted decisions as homeless 2012/13 9 3
35

Appendix A: Evidence Base for the Draft Housing & Homelessness Strategy 2018-21
July 2017
2013/14 8 5 2014/15 7 2 2015/16 2 2 2016/17 0 0
Homeless prevention Number of homeless prevention cases: 2013/14 916 2014/15 1147 2015/16 1170 2016/17 1107
Homeless prevention 2016/17 Mediation 0.3% 3
Conciliation incl home visits for family/friends excl 2.5% 28
Homeless prevention fund 12.6% 139
Debt advice 0.3% 3
Resolving HB problems 0.3% 3
Resolving rent arrears 1.6% 18
Sancuary scheme 13.6% 151
Crisis intervention 0.4% 4
Negotiation or legal advocacy to remain in PRS 21.5% 238
Other assistance to remain in PRS 18.7% 207
Mortgage arrears intervention 0.0% 0
Hostel or HMO 0.0% 0
Deposit/Bond schemes 6.2% 69
Private rented (no bond) 1.7% 19
Friends/Relatives 0.5% 5
Supported accom 1.2% 13
Management move 1
Part 6 offer 5.1% 56
Negotiation with RSL 0.0% 0
Other 13.6% 150
P1E
Home Choice (Private sector rent deposit/bond scheme) It has been increasingly difficult to secure access to privately rented accommodation in the last few years (since the LHA rate change). There is also a very buoyant private sector rental market in Oxford, where landlords and agents can increase rental prices and be more selective about tenants. Many landlords are now exiting the Housing Benefit market, or not solely relying on this, due to the LHA rate changes and Benefit Cap, and Universal Credit/Direct Payments to tenants. We have increasingly been forced to place people in PRS accommodation outside of Oxford. In 2016/17 we placed more households out of Oxford than in Oxford. However, finding properties outside Oxford is now also becoming more difficult. Rent Guarantee Scheme: The Council has introduced a Rent Guarantee Scheme (RGS) as an extension of the existing Home Choice Scheme. The RGS is a 2-year pilot
36

Appendix A: Evidence Base for the Draft Housing & Homelessness Strategy 2018-21
July 2017
aimed to support at least 80 households in the private rented sector Real Lettings: The Council has also part funded Real Lettings to acquire properties and let them on ASTs at local housing allowance rates. Number of new starts in the Homechoice scheme: 2012/13 110 2013/14 104 2014/15 95 2015/16 71 2016/17 79 (incl RGS and Real Lettings)
PRS new lettings through the Homechoice scheme
110 10495
7179
94
74
5239
3516
30
43
32
44
0
20
40
60
80
100
120
2012/13 2013/14 2014/15 2015/16 2016/17
Total Oxford Out of Oxford
In April 2017 there were 866 live Homechoice tenancies.
The Lord Mayor’s Deposit Guarantee Scheme (LMDGS) Number of new starts: 2012/13 16 2013/14 13 2014/15 10 2015/16 8 2016/17 6
In April 2017 there were 105 live LMDGS tenancies.
Non statutory homelessness In May 2017 there were a total of 69 move on applicants* on the housing register (18 of which were assessed as ready to move on from hostels etc), and 49 other non-statutory homeless applicants. (*Move On applicants – applicants referred from various supported housing projects across the city, from Social Services i.e. former care leavers who are ready to move on to independent accommodation, and from the Mother & Baby unit .)
Northgate HMIS
Rough sleeping All local authorities in England are required to submit an annual figure to the government to indicate the number of people sleeping rough in their area on a typical night, either by conducting a street count or an estimate. Homeless Link provides guidance on how to conduct the counts and estimates, and validates that each local authority follow the guidance.
37

Appendix A: Evidence Base for the Draft Housing & Homelessness Strategy 2018-21
July 2017
Street counts: 2012: 12 2013: 19 2014: 26 2015: 39 2016: 33
2016 street count number broken down:
The vast majority, 91%, were already known to services.
8 out of the 33 were long term/entrenched rough sleepers
6 were from EU countries other than the UK and Ireland
19 did not have an identifiable connection to one of the local authorities in Oxfordshire. This means that the outreach team cannot assist individuals to access supported accommodation in the City or County. 4 people had an identifiable connection to one of the District Council’s in Oxfordshire.
Since 2014 Oxford City Council has also carried out ‘estimates’, in order to have comparable figure with the other local authorities in Oxfordshire. Estimates and street counts use different methodologies, both set out by Homeless Link. The estimates of how many individuals slept rough in Oxford on a typical night were: 2014: 43 2015: 56 2016: 47 2016 estimate number broken down:
23 of the 47 included in the estimate were also found rough sleeping during the street count.
96% of rough sleepers were known to services.
13 out of the 47 were long term/entrenched rough sleepers
6 were from EU countries other than the UK and Ireland
20 did not have an identifiable connection to one of the local authorities in Oxfordshire. This means that the outreach team cannot assist individuals to access supported accommodation in the City or County.
In addition to the street count figures, we monitor rough sleeping numbers regularly through the Oxford CHAIN data base. The number of rough sleepers in the City is high for a city its size. The majority of people seen sleeping rough in the city are known to services, rather than being new to rough sleeping.
Oxford City Council street counts Oxford City Council estimates Oxford CHAIN
38
Appendix A: Evidence Base for the Draft Housing & Homelessness Strategy 2018-21
July 2017
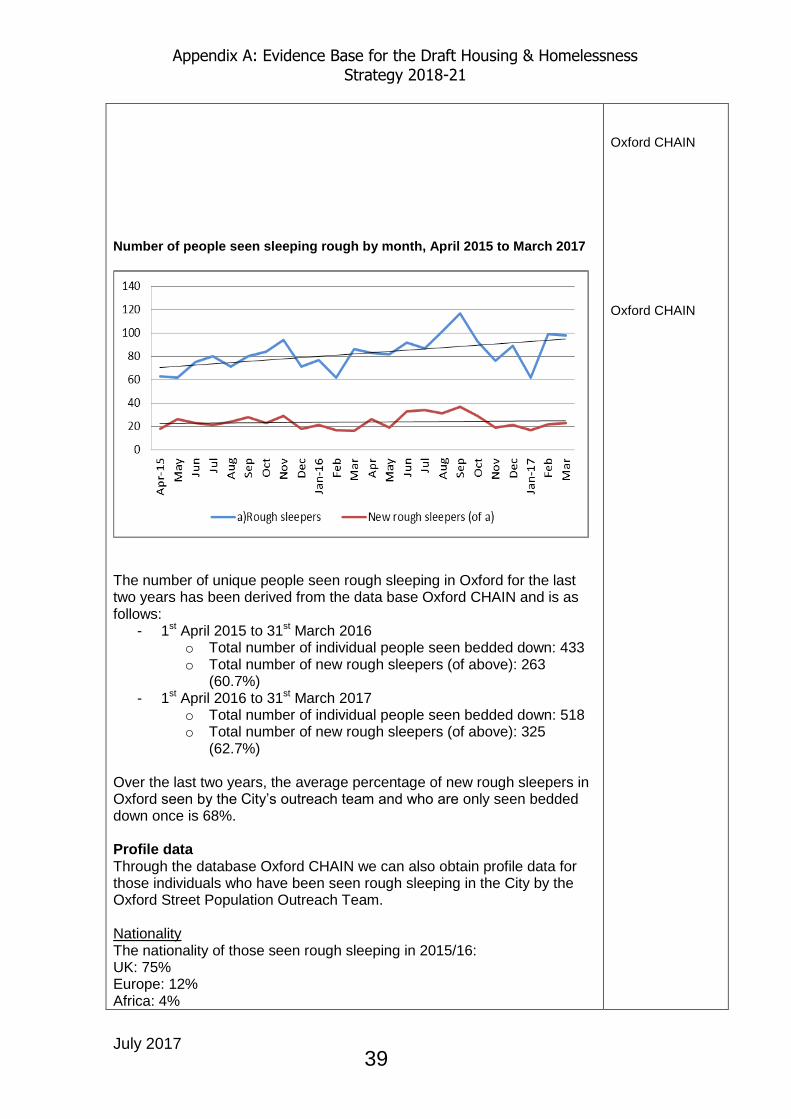
Number of people seen sleeping rough by month, April 2015 to March 2017
The number of unique people seen rough sleeping in Oxford for the last two years has been derived from the data base Oxford CHAIN and is as follows:
- 1st April 2015 to 31st March 2016 o Total number of individual people seen bedded down: 433 o Total number of new rough sleepers (of above): 263
(60.7%) - 1st April 2016 to 31st March 2017
o Total number of individual people seen bedded down: 518 o Total number of new rough sleepers (of above): 325
(62.7%) Over the last two years, the average percentage of new rough sleepers in Oxford seen by the City’s outreach team and who are only seen bedded down once is 68%. Profile data Through the database Oxford CHAIN we can also obtain profile data for those individuals who have been seen rough sleeping in the City by the Oxford Street Population Outreach Team. Nationality The nationality of those seen rough sleeping in 2015/16: UK: 75% Europe: 12% Africa: 4%
Oxford CHAIN Oxford CHAIN
39

Appendix A: Evidence Base for the Draft Housing & Homelessness Strategy 2018-21
July 2017
Middle East: 2% Americas: 1% Asia: 1% Not known: 5% The nationality of those seen rough sleeping in 2016/17: UK: 81% Europe: 10% Africa:2% Middle East: 1% Asia: 1% Not known: 4% Polish was the predominant non-UK nationality of those seen rough sleeping in 2015/16 and 2016/17. Age 7% of those seen rough sleeping in 2015/16 were under the age of 25; 8% of those seen rough sleeping in 2016/17 were under the age of 25 4% of those seen rough sleeping in 2015/16 were aged 60 or over; 6% of those seen rough sleeping in 2016/17 were aged 60 or over Gender 85% of those seen rough sleeping in 2015/16 were male; 83% of those seen rough sleeping in 2016/17 were male Between 2015/16 and 2016/17, there has been a 2% increase in those seen rough sleeping who were female. Support Needs There has been a marked increase in the number of people sleeping rough and assessed by the outreach team as having multiple support needs over the last few years. This shows that the client group Oxford SPOT work with is complex and needs a lot of support from a number of different services, demonstrating that housing alone is not enough. A large proportion of those assessed had mental health support needs, often in addition to other support needs. To illustrate the increase in multiple needs for those seen rough sleeping and assessed by the outreach team, we have used quarterly data for the same period in 2015/16 and 2016/17. Support needs for those rough sleeping and assessed by the outreach team during the period January to March 2015 (base 137)
40

Appendix A: Evidence Base for the Draft Housing & Homelessness Strategy 2018-21
July 2017
Support needs for those rough sleeping and assessed by the outreach team during the period January to March 2017 (base 103)
Hostel accommodation for people sleeping rough and single homeless people There are currently two homeless hostels in the City – O’Hanlon House and Simon House – with a total of 108 beds. However, Simon House is due to be de-commissioned by 1st April 2018. From 1st April 2018 and until 31st March 2020, the following number of bed spaces funded for City Council use under the pooled budget arrangements:
- 27 in O’Hanlon House - 31 in Connection Support dispersed housing
41

Appendix A: Evidence Base for the Draft Housing & Homelessness Strategy 2018-21
July 2017
- 21 in Mayday Trust dispersed housing The pooled budget also funds the following provision across the County for the Districts:
- 29 in O’Hanlon House (beds proportioned between Districts for District use)
- 13 in Banbury for Cherwell District Council - 6 in Chipping Norton for West Oxfordshire District Council - 13 in Abingdon for South Oxfordshire and the Vale of White Horse
District Councils In addition to the above, the City aims to fund the following from its own funds in order to meet demand in the City:
- 41 in dispersed housing - 10 in Mayday Trust dispersed housing - 10 in specialist housing adopting the ‘Housing First’ approach - 20/25 beds for people with high/complex needs
42

Appendix A: Evidence Base for the Draft Housing & Homelessness Strategy 2018-21
July 2017
Appendix 1 - Homeless acceptances 2012/13 to 2016/17 This report looks at data from the P1E homelessness returns to the government over the last five years. The P1E records the decisions taken by local authorities on homelessness applications and households accepted as owed a main homelessness duty (i.e. accepted as statutory homeless). Acceptances
Number of households accepted as statutory homeless by Oxford City Council: 2012/13 104 2013/14 114 2014/15 114 2015/16 141 2016/17 125 The number of households accepted as homeless in Oxford decreased by 11% between 2015/16 and 2016/17. In the same period the numbers increased nationally by 2%. The proportion of households accepted in Oxford has generally been lower than the England average apart from 2015/16.
Age
In the last five years the proportion of young people being accepted as homeless has gone down quite considerably and the proportion of older households has gone up. In 2012/13 46% of accepted households had a main applicant aged between 16-24, but in 2016/17 that figure was only 21%.
43

Appendix A: Evidence Base for the Draft Housing & Homelessness Strategy 2018-21
July 2017
Looking at national figures the proportion of young people being accepted as homeless has gone down as well, though from a much lower level than in Oxford. In previous years Oxford had a much larger proportion of young people being accepted as homeless compared to national figures, but in 2015/16 this had come down to below the national level.
Reason for homelessness
The proportion of accepted households losing their last settled accommodation due to family or friends not being able or willing to accommodate them has decreased in the last five years and the proportion of households losing their private sector rented tenancy has increased. Losing a private sector rented tenancy is now the main reason for homelessness.
44

Appendix A: Evidence Base for the Draft Housing & Homelessness Strategy 2018-21
July 2017
Looking at the actual numbers, in 2016/17 there were 10 fewer households that had lost their rented accommodation than in 2015/16.
The trend in Oxford of family/friend exclusions decreasing and loss of PRS accommodation increasing has been similar to the trend nationally, though this trend has been much more pronounced in Oxford.
45

Appendix A: Evidence Base for the Draft Housing & Homelessness Strategy 2018-21
July 2017
The decrease in family/friend exclusions and the increase in loss of private sector rented accommodation go hand in hand with the shift in age groups from younger to older. The main reason for homelessness for 16-24 year olds is family/friend exclusion, and for those over 25 it is loss of rented accommodation. The reason for there being fewer family/friend exclusions might be because applicants’ families agree to them staying at home and bidding via Choice based lettings to avoid having a homeless duty discharged into the private sector, especially as this might be to a property outside Oxford. It might also be due to parents having to pay the ‘bedroom tax’ if their children move out. Discharge of duty
As there is limited social housing becoming available for offers Oxford City Council is now, in appropriate cases, discharging its homelessness duty by offering suitable accommodation in the private sector (using powers in the Localism Act).
46

Appendix A: Evidence Base for the Draft Housing & Homelessness Strategy 2018-21
July 2017
In some instances accommodation is offered outside the city because of the high cost of private rented housing in Oxford and lack of available accommodation. In 2016/17 we discharged duty to 43 households by offering accommodation in the private rented sector.
Household type
In the last year the proportion of lone female parents has gone down and the proportion of couples with children has increased.
47

Appendix A: Evidence Base for the Draft Housing & Homelessness Strategy 2018-21
July 2017
Compared to national data Oxford accepted a larger proportion of households with dependent children in 2016/17 (85% compared to 73%) and a smaller proportion of single households (12% compared to 23%).
Priority Need
The proportion of accepted households having expected babies (and no other children) as their priority need has gone down in the last five years, and the proportion having dependent children has increased, with the exception of last year when there was a slight decrease. This shift in priority need category goes together with the shift in age groups from 16-24 to 25-44.
48
Appendix A: Evidence Base for the Draft Housing & Homelessness Strategy 2018-21
July 2017
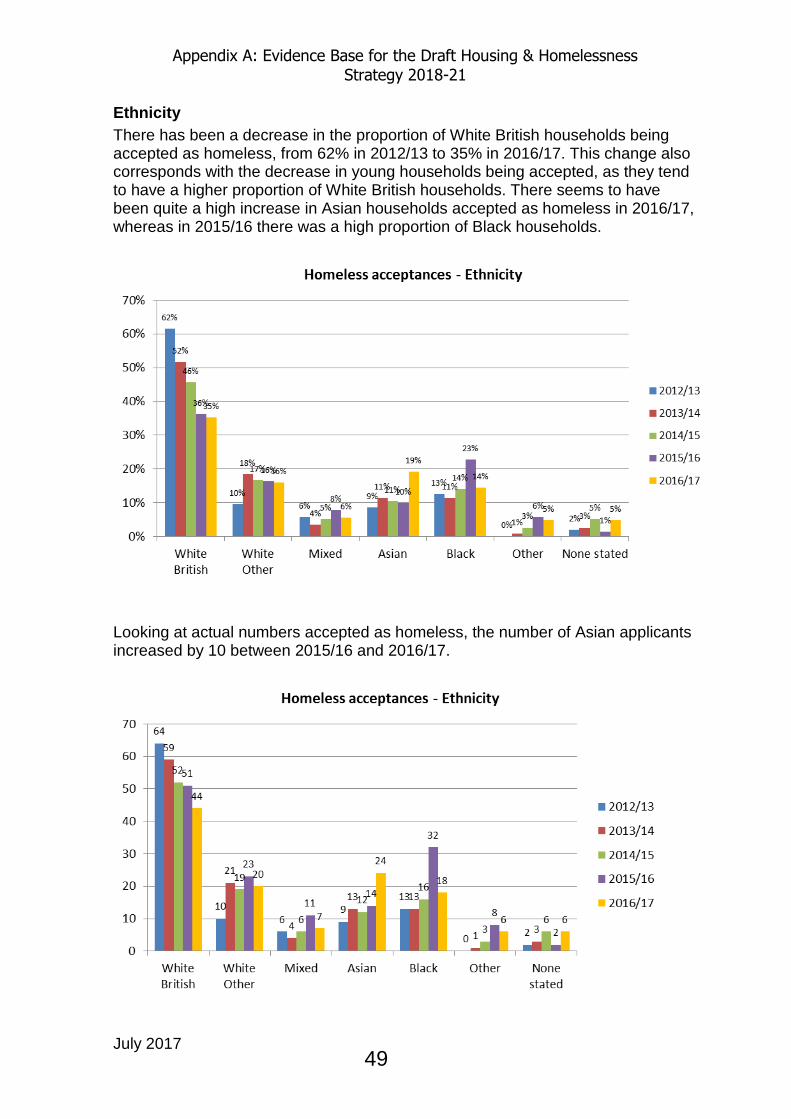
Ethnicity
There has been a decrease in the proportion of White British households being accepted as homeless, from 62% in 2012/13 to 35% in 2016/17. This change also corresponds with the decrease in young households being accepted, as they tend to have a higher proportion of White British households. There seems to have been quite a high increase in Asian households accepted as homeless in 2016/17, whereas in 2015/16 there was a high proportion of Black households.
Looking at actual numbers accepted as homeless, the number of Asian applicants increased by 10 between 2015/16 and 2016/17.
49

Appendix A: Evidence Base for the Draft Housing & Homelessness Strategy 2018-21
July 2017
Compared to national figures Oxford accepted a lower proportion of White households and a higher proportion of Asian households in 2016/17.
Compared to the population in Oxford as a whole, White British households are under-represented among those accepted as homeless in 2016/17 and Black and Asian households are over-represented.
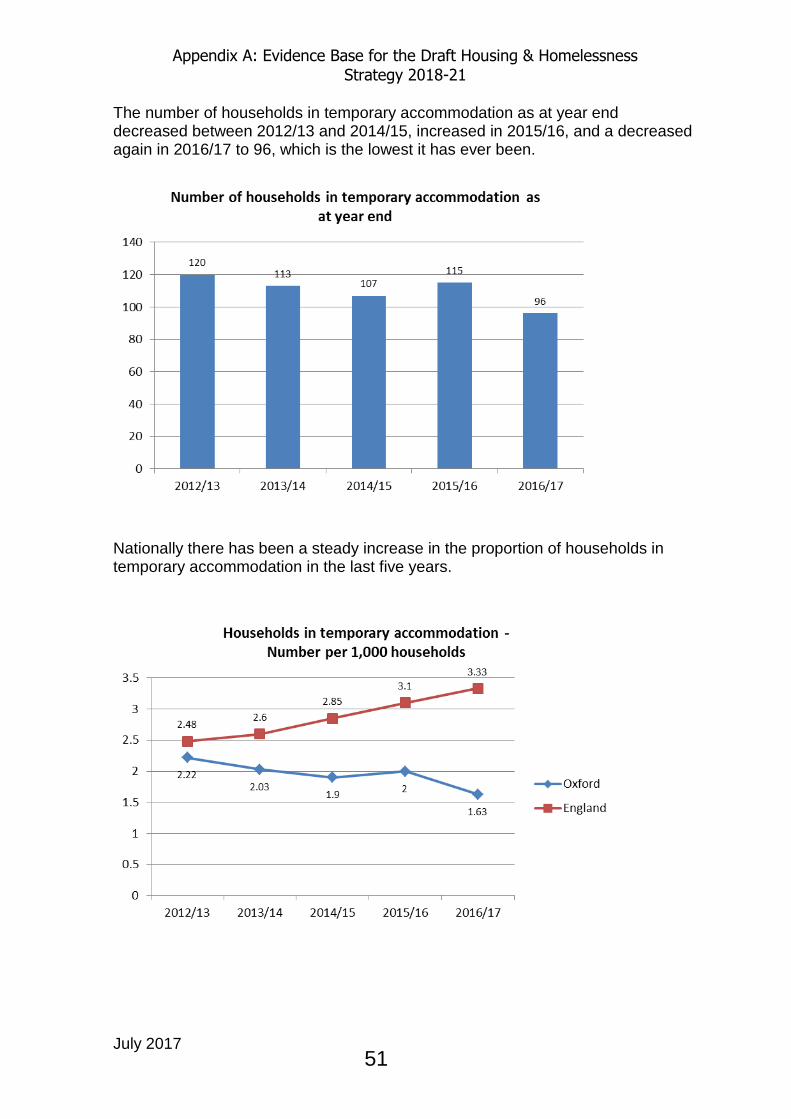
Number of households in homeless temporary accommodation
50
Appendix A: Evidence Base for the Draft Housing & Homelessness Strategy 2018-21
July 2017
The number of households in temporary accommodation as at year end decreased between 2012/13 and 2014/15, increased in 2015/16, and a decreased again in 2016/17 to 96, which is the lowest it has ever been.
Nationally there has been a steady increase in the proportion of households in temporary accommodation in the last five years.
51

This page is intentionally left blank