appendix a: discussion of useer methodology
TRANSCRIPT
A-1
U S E E R 2 0 2 1 | A P P E N D I X
Appendix A: Discussion of USEER Methodology
I. Survey Overview
The 2021 USEER methodology relies on the most recently available data from the BLS QCEW (QCEW, third quarter 2020), the BLS Unemployment Situation Table B-1 monthly reports, together with a detailed supplemental survey of business establishments across the United States designed and conducted by BW Research Partnership in partnership with NASEO and EFI. During a time of rapid change in energy technology and business employment structure, supplemental surveys are an important tool to capture developing trends. Taken together, the BLS and survey data provide the most comprehensive calculation of energy-related employment available. The methodology has been used for local, state, and federal energy related data collection and analysis for a decade, including SEIA’s National Solar Jobs Census series, traditional and clean energy reports for state agencies in the Commonwealth of Massachusetts, New York State, the State of Vermont, the Commonwealth of Pennsylvania, the State of California, the State of Connecticut, the State of New Hampshire, the State of Rhode Island, and numerous nonprofit agencies across the United States.
The 2021 USEER survey uses a stratified sampling plan that is representative by industry code (NAICS or ANAICS)1, establishment size, and geography to determine the proportion of establishments that work with specific energy-related technologies, as well as the proportion of workers in such establishments that work with the same. These data are then analyzed and applied to existing public data published by the BLS, effectively constraining the potential universe of energy establishments and employment.
The 2021 USEER survey was administered by telephone (more than 177,000 outbound calls) and by web, with nearly 114,000 emails sent to participants throughout the United States. The phone survey was conducted by ReconMR. The web instrument was programmed internally, and each respondent was required to use a unique ID in order to prevent duplication.
The sample was split into two categories, referred to as the known and unknown universes. The known universe includes establishments that have previously been identified as energy-related, either in prior research or in some other manner, such as membership in an industry association or participation in government programs. These establishments were surveyed census-style, and their associated establishment and employment totals were removed from the unknown universe for both sampling and for resulting employment calculations and estimates.
The unknown universe included tens of thousands of businesses in potentially energy-related NAICS codes, across agriculture, mining and extraction, utilities, construction, manufacturing, wholesale trade, distribution (including pipeline distribution), professional services, and repair and maintenance. Each of these segments and their total reported establishments (within the BLS QCEW) were carefully analyzed by size
1 ANAICS is a term used by BLS, which means Allocation NAICS, and refers to the industries included in the aggregation of industries likely to participate in said activities. https://www.bls.gov/ggs/ggs_technote_extended.pdf
A-2
U S E E R 2 0 2 1 | A P P E N D I X
(employment) and state to develop representative clusters for sampling. In total, approximately 35,000 business establishments participated in the survey effort, with approximately 7,900 providing full responses to the survey. These responses were used to develop incidence rates among industries (by state) as well as to apportion employment across various industry categories in ways currently not provided by state and federal labor market information agencies. The margin of error for incidence in the USEER is +/-0.52 percent at a 95 percent confidence interval.
For several industries, particularly transportation of goods, the USEER uses the methodology developed by the DOE and the National Renewable Energy Laboratory for the first installment of the QER. Proportion of employment was calculated by dividing commodity shipments by value (in millions of dollars) for coal, fuel oil, gas, motor vehicles, petroleum, and other coal and petroleum products out of total commodity value at the state level by truck, rail, air, and water transport. This proportion was applied to NAICS employment for truck transportation (NAICS 484), water transportation (NAICS 483), air transportation (NAICS 481), and Railroad Retirement Board employment for rail transportation at the state level. With this analysis, truck transportation represents the majority of energy-related transportation employment (67 percent), followed by rail (24 percent), water (8 percent), and air (1 percent).
Of important note, the USEER expressly excludes any employment in retail trade NAICS codes. This excludes motor vehicle dealerships, gas stations2, appliance and hardware stores, and other retail establishments.
All data in the USEER rely on the BLS QCEW data for the end of the second quarter of 2020, and the BLS Unemployment Situation Table B-1 monthly reports through December 2020. Employment extrapolations are based off BLS QCEW and survey data, resulting in totals that carry precise decimal values. As a result, some employment totals for tables in the report will sum differently due to rounding. The USEER survey was administered between September 29, 2020 and December 29, 2020 and averaged 15 minutes in length.
II. Methodology Discussion
Employment data collected by the BLS provide information on many, but not all, energy-related job categories. Most notably, BLS does not collect data on employment levels by energy technology across business segments. For instance, residential solar installation establishments are typically labeled as electrical contractors (together with all other traditional electrical businesses) without being identified specifically as solar companies. Petroleum-engineering firms are included in engineering services, with civil, mechanical, and other engineers, while electric vehicle prototype manufacturers are combined with gasoline and diesel-fueled vehicle manufacturing. As a result, BLS employment data does not capture the full scope of energy employment trends.3
Given the complex relationship between energy and the overall economy, the 2021 USEER investigates, with a special supplemental survey, the three Traditional Energy sectors—Electric Power Generation, Fuels and Transmission, Distribution, and Storage —followed by individual analyses of employment in two important energy end-use
2 Gas station employment had been reported in previous years. The 2021 USEER excludes mention of employment in this industry. 3 DOE, Quadrennial Energy Review: Energy Transmission, Storage, and Distribution Infrastructure, 8-7.

A-3
U S E E R 2 0 2 1 | A P P E N D I X
sectors—Energy Efficiency and Motor Vehicles. The spread of business activities within each of the five analyzed sectors presents additional taxonomic challenges, as early-stage research and development, repair and maintenance, or professional and technical services vary across energy, energy efficiency, and manufacturing. Natural gas business activities, for instance, differ from business activities relating to advanced building materials and solar photovoltaic (PV) materials.
Historically, the BLS has conducted supplemental surveys to acquire more complete information on new industries, specific demographic profiles within the workforce, or new labor force trends such as the role of contingent workers. In this way, significant modification to the current BLS structure of industry and occupational classifications is avoided by capturing the required energy employment data using a supplemental survey tool based on existing BLS data and classifications.
The 2021 USEER relies on such a comprehensive survey of 35,000 business representatives across the United States, conducted by BW Research Partnership in partnership with NASEO and EFI. The survey data are used to filter and analyze the concentration, intensity, and distribution of various energy technologies and activities throughout traditional industry sectors, using second-quarter 2020 employment data from the BLS QCEW and the BLS Unemployment Situation Table B-1 monthly reports through December 2020. USEER data also provides an additional layer of information to track sector-specific growth potential, obstacles, and opportunities. The data presented in the USEER are not intended to remove, replace, or replicate existing data from the BLS QCEW, but instead to reorganize categories and provide insight for policymakers and the public regarding trends in energy employment, energy production, and energy consumption across the United States.
The USEER provides data for direct employment only and does not attempt to estimate indirect employment or induced employment related to the analyzed sectors. Many employment studies, such as those included in chapter 8 of the first installment of the QER, generate employment estimates that rely on input/output modeling. These studies typically define an activity based on reported expenditures or expenditures and associated levels of employment reported by a defined industry or activity, such as U.S. solar PV installation. In this example, solar PV installation firm employment would be the “direct” jobs. Most studies go at least one step further, identifying “indirect” employment, which includes the supply chain or other support services to the industry. In the solar example, these would include U.S. manufacturing jobs related to producing PV equipment used in domestic installations (and their suppliers and vendors) as well as consulting, tax, legal, and other professional services to support domestic PV installation companies. Another typical calculation is “induced” jobs, which includes jobs created or supported by wages paid and other benefits provided by employers of direct and indirect employees.
In the USEER, by comparison, the direct job category of interest is defined as the solar industry generally, including utility-scale solar, residential, and commercial installations, as well as the manufacturing, professional services, and wholesale trade that make up the sector. However, the indirect jobs that support this industry are not included, such as polysilicon production (the raw material used in solar panels), aluminum production and extrusion activities for frame manufacturing, or other aspects of the solar energy value chain. Induced jobs—those created throughout the economy as a result of the spending of wages by the employees whose income derives, in whole or part, from this industry—are also not included.

A-4
U S E E R 2 0 2 1 | A P P E N D I X
For this survey, a Qualifying Firm is—
An organization with employees in the United States that is directly involved with researching, developing, producing, manufacturing, distributing, selling, implementing, installing, or repairing components, goods or services related to Electric Power Generation; Electric Power Transmission, Distribution, and Storage; Energy Efficiency, including Heating, Cooling and Building Envelope; Fuels, including Extraction, Processing, Production, and Distribution; and Transportation, including Motor Vehicles. This also includes supporting services such as consulting, finance, tax, and legal services related to energy, fuels, energy efficiency, or motor vehicles.
Qualifying Workers are—
Employees of a qualifying firm that spend some portion of their time supporting the qualifying energy, energy-efficiency, or motor vehicle portion of the business.4
This report provides detail into levels of employment activity that include both “a portion of their time” and “a majority of their time” when referencing qualifying workers. This is especially true within the Energy Efficiency sector where the employing construction or repair firms frequently are engaged in both traditional energy-related construction or installation as well as in high-efficiency activities that qualify for ENERGY STAR designation.
Primary energy consumption5 in the United States is divided among four sectors: Electric Power Sector (38.5 percent), Residential and Commercial Buildings (11.7 percent), Industrial (23.8 percent), and Transportation (26.1 percent). This distribution of energy consumption by sector is based on total 2020 estimates published by the Energy Information Administration (EIA).6
End-use electricity consumption, in turn, is divided with 74.7 percent consumed by Residential and Commercial Buildings, 25.1 percent by Industrial; and 0.2 percent by Transportation.7 Thus, Residential and Commercial Buildings consumed 40.4 percent of all energy (an amount consisting of their direct energy end-use, their electricity end-use, and the electrical system energy losses allocated to the sector by EIA).8
As with the 2020 report, the 2021 USEER identifies jobs that manufacture ENERGY STAR appliances and other ENERGY STAR labeled products, as well as employment in building design and contracting services that provide insulation, improve natural lighting, and reduce overall energy consumption across homes and businesses.9 As with the 2020 report, the 2021 USEER includes a section that disaggregates ENERGY STAR technologies more thoroughly, further highlighting the employment impacts of the program. Also included are breakouts related to the ENERGY STAR Residential New Construction and Commercial and Industrial building programs. Finally, employment related to Energy
4 Data presented in this report exclude retail employees. Qualifying Workers in energy will be referenced as energy-related jobs. Where “portion of their time” includes employees whose activities are less than 50 percent of their time, specific reference will be made of that fact. 5 Primary energy consumption is the direct consumption of energy at its first point of use. Importantly, this does not include consumption of electricity, so that primary energy consumption in the Residential and Commercial Building sector includes direct use of fuels like natural gas for heating, but not electricity used for lighting and cooling. 6 EIA, Monthly Energy Review, Table 2.1. Percentages are based on primary energy consumption in 2020 through October and do not add up to 100.0 percent due to rounding. 7 EIA, Monthly Energy Review, Table 7.6. Percentages of retail electricity sales in 2020. 8 EIA, Monthly Energy Review, Table 2.1. Percentage based on total energy consumption in 2020. 9 Estimates do not include retail employment.
A-5
U S E E R 2 0 2 1 | A P P E N D I X
Efficiency programs at utilities are quantified. For a more complete definition of Energy Efficiency jobs, see the introduction to the Energy Efficiency chapter.
Motor Vehicles are included in this report primarily due to their intensive use of energy and contribution to carbon emissions.10 This report delineates employment between traditional gas and diesel motor vehicles, hybrid and plug-in hybrid, all-electric, natural gas, hydrogen, and fuel cell technologies, as well as Motor Vehicle component parts for such vehicles. USEER also includes an estimate for Motor Vehicle component parts that contribute to increased fuel economy. It does not, however, cover all sectors of transportation, such as aviation and maritime transportation. According to the EIA, the transportation sector accounted for 26.1 percent of U.S. primary energy consumption in 2020;11 66 percent of overall U.S. petroleum consumption was attributable to the transportation sector.12
Motor Vehicles employment reported at the state level includes overall value chain (manufacturing, wholesale trade, commodity flows or freight transport of motor vehicles, professional and business services, and repair and maintenance) and employment by detailed technology (gas and diesel, hybrid, plug-in hybrid, electric, hydrogen and fuel cell, natural gas, and other). Employment at the state level is not reported by value chain within detailed technology.
BW Research Partnership, an independent research organization, collected and analyzed data in partnership with NASEO and EFI. The data set includes technology, value-chain, and energy employment data to the county-level in all 50 U.S. states and the District of Columbia. In a time of rapid change in energy technologies across the board, continued refinement of supplemental surveys will continue to be an important tool in analyzing existing BLS data sets.
Another benefit of using the QCEW framework and a supplemental survey is the ability to understand and report the concentration of energy-related activities within traditional industries, such as construction, manufacturing, and utilities. This helps to illustrate the significant impact that energy and energy-related activities have on the overall economy. The impacts to the various selected industries are illustrated briefly below.13
Methodology Update Announcement
A new feature of this year’s USEER includes a methodology revision for union membership and union coverage rates. These data have been revised due to feedback from industry and concerns over non-response bias. As a result, the data on union membership are not comparable to previous USEER reports. The updated methodology includes Current Population Statistics (CPS), CIC-NAICS crosswalks, and data from the Bureau of Labor Statistics (BLS), in addition to USEER survey data. Union membership is
10 The USEER covers motor vehicle employment across vehicle parts manufacturing, automotive repair and maintenance, as well as vehicle, parts, and supplies wholesalers, including air, rail, water, and truck transportation of motor vehicle parts and supplies. It does not capture jobs associated with the final assembly of some transportation equipment such as forklifts and golf carts. 11 EIA, Monthly Energy Review, Table 2.1. 12 EIA, Monthly Energy Review, Table 3.7c. Percentage calculated using the sum of sector totals in Tables 3.7a through 3.7c. 13 Because the USEER uses modeling to estimate fuel-stock employment in agriculture and forestry, and because these industry codes are not effectively captured by QCEW, no estimate is made as to the percent of the total industry captured by the USEER.

A-6
U S E E R 2 0 2 1 | A P P E N D I X
weighted by NAICS codes within each detailed technology and summed within each category to calculate final detailed technology union membership and coverage rates.
Workers are counted as union members if they are a member of a labor union or of an employee association similar to a union. Workers are counted as covered by a collective bargaining agreement if they are union members or if they are not members but say they are covered by a union contract.” Definitions are from Barry T. Hirsch and David A. Macpherson, “Union Membership and Coverage Database from the Current Population Survey: Note,” Industrial and Labor Relations Review, 56, no. 2 (January 2003): 349-54, http://unionstats.gsu.edu/UnionStats.pdf.

A-7
U S E E R 2 0 2 1 | A P P E N D I X
Appendix B: USEER 2021 Employer Survey
Introduction: Hello, my name is ________ and I am calling on behalf of the the Solar Energy Industries Association (SEIA), the National Association of State Energy Officials, or NASEO. We are conducting a national survey about the energy, energy-related, and advanced manufacturing industries. May I please speak to the person most knowledgeable about staffing at [organization]?
Is now a convenient time?
This survey uses specific terms to describe various technologies and activities. If you require any definitions for clarification, please ask me at any time.
(If needed): This important survey addresses businesses that research, develop, manufacture, install or work with products that generate, distribute or save energy.
(If needed): This includes organizations involved in fossil and renewable energy production, energy efficiency products and services, motor vehicles, solar, wind, fossil and other energy sources, and other energy related products and services.
(If needed): Your individual responses will not be published; only aggregated information will be used in reporting the survey results.
(If needed): The survey should take approximately 15-30 minutes of your time. Your participation will help determine how investments of time and money should be made to support the industry and prepare the present and future labor pool.
(If needed): If you have any questions about SEIA’s involvement in this survey, please contact Shawn Rumery at [email protected]
````````````````````````````````````````````````````````````````````````` A. Does your organization have at least one location with employees in the United States?
(Please count yourself as an employee if you are an owner-operated business or sole proprietor).
1 Yes [CONTINUE] 2 No [TERMINATE]

A-8
U S E E R 2 0 2 1 | A P P E N D I X
For this survey, please only answer for your current business location. If your organization has other U.S. locations, please do not include their data. What is the zip code of your current location? [SHOW ADDRESS FROM SAMPLE FILE]
____________________ (Accept all five-digit responses)
(DON’T READ) Have check box for Refused (Terminate if Refused)
B. Is your organization involved, in whole or part, with an activity related to energy? (PAUSE, IF UNSURE OR NO READ REMAINDER OF QUESTION, IF YES GO TO SC) We define this as being directly involved with researching, developing, producing, manufacturing, distributing, selling, implementing, installing, or repairing components, goods or services related to Electric Power Generation; Electric Power Transmission, Distribution, and Storage, including electric vehicle charging and fuel distribution and storage; Energy Efficiency, Including Heating, Cooling and Building Envelope; Fuels, including Extraction, Processing, Production, and Distribution; and Transportation, including Motor Vehicles. This also includes supporting services such as consulting, finance, tax, and legal services related to energy.
1 Yes [CONTINUE] 2 No [TERMINATE] 3 Not sure [TERMINATE] C. Which of the following industries describes your organization’s work?
[ALLOW MULTIPLE RESPONSES] [IF NEEDED: If your organization is involved in energy research or professional services for the industry, please select the options that are most relevant to your organization.] 1. Electric Power Generation 2. Electric Power Transmission and Distribution, including electric vehicle charging 3. Energy Storage, including fuel storage and electric vehicle batteries 4. Energy Efficiency, Including Heating, Cooling and Building Envelope (IF NEEDED THIS
INCLUDES THERMAL OR HOT WATER SOLAR) 5. Fuels 6. Transportation Vehicles, including Motor Vehicles (IF NEEDED: Including industrial
vehicles, such as forklifts, and recreational vehicles, such as golf carts) 7. Component Parts for Transportation Vehicles 8. Carbon Capture and Storage 9. Other (Specify _______) TERMINATE 10. DK/NA TERMINATE
[ASK SCREENER D IF SC COUNT>1] D. Which do you consider your organization’s primary industry, based on the majority of
labor hours performed at your location? [PIPE IN SC CATEGORIES, ACCEPT ONE]

A-9
U S E E R 2 0 2 1 | A P P E N D I X
1. Electric Power Generation 2. Electric Power Transmission and Distribution, including electric vehicle charging 3. Storage, including fuel storage and electric vehicle batteries 4. Energy Efficiency, Including Heating, Cooling and Building Envelope (IF NEEDED THIS
INCLUDES THERMAL OR HOT WATER SOLAR) 5. Fuels 6. Transportation Vehicles, including Motor Vehicles (IF NEEDED: Including industrial
vehicles, such as forklifts, and recreational vehicles, such as golf carts) 7. Component Parts for Transportation Vehicles 8. Carbon Capture and Storage
CREATE SDPRIME FROM SC IF SC COUNT=1, OR SD IF SC COUNT>1
E. [ASK FOR EACH SC] Which of the following [INSERT SC RESPONSE] technologies is your organization directly engaged with? [READ LIST, ALLOW MULTIPLE RESPONSES] A. Electric Power Generation (IF SC=1) [RANDOMIZE]
1. Solar Photovoltaic Electric Generation [SET SOLAR=1] 2. Concentrated Solar Electric Generation [SET SOLAR=1] 3. Wind Generation 4. Geothermal Generation 5. Bioenergy/Biomass Generation 6. Low-Impact Hydroelectric Generation including Wave/Kinetic Generation 7. Traditional Hydroelectric Generation 8. Advanced/Low Emission Natural Gas 9. Nuclear Generation 10. Coal Generation 11. Oil and other Petroleum Generation 12. Natural Gas Generation 13. Combined Heat and Power 14. Other Generation (Specify)
B. Electric Power Transmission and Distribution (IF SC=2) [RANDOMIZE]
1. Traditional Transmission and Distribution 2. Smart Grid 3. Micro Grids 4. Other Grid Modernization 5. Electric Vehicle Charging 6. Other (Specify)
C. Storage (IF SC=3) [RANDOMIZE] [IF SEA=1, “(including battery storage for solar
generation)”
1. Pumped hydro-power storage 2. Battery storage [IF SEA=1, “(including battery storage for solar generation)” 3. Mechanical storage (flywheels, compressed air energy storage, etc.) 4. Thermal storage 5. Liquefied natural gas 6. Compressed natural gas 7. Crude oil 8. Refined petroleum fuels (liquid) 9. Refined petroleum fuels (gas)

A-10
U S E E R 2 0 2 1 | A P P E N D I X
10. Coal storage (piles, domes, etc.) 11. Biofuels, including ethanol and biodiesel 12. Nuclear fuel 13. Other gas fuel (Specify) 14. Other liquid fuel (Specify) 15. Other Storage 16. Other (Specify)
IF SEC=2, ASK C_2 AND C_3
C_2. What type of Battery Storage do you work with? [READ LIST, ALLOW MULTIPLE RESPONSES] [RANDOMIZE]
1. Lithium batteries 2. Lead-based batteries 3. Other solid-electrode batteries (Specify) 4. Vanadium redox flow batteries 5. Other flow batteries (Specify)
C_3. What is the application of your battery storage work? [READ LIST, ALLOW MULTIPLE RESPONSES] [RANDOMIZE]
1. Consumer devices 2. Vehicles or other transportation (including electric vehicles) 3. Buildings or industrial facilities 4. Electric grid 5. Other (Specify)
D. Energy Efficiency, Including Heating, Cooling and Building Envelope (IF SC=4) [RANDOMIZE]
1. ENERGY STAR® Certified Appliances (not including HVAC) 2. ENERGY STAR Certified Heating, Ventilation, and Cooling (HVAC) 3. Other high efficiency HVAC that are out of scope for ENERGY STAR certification
(e.g. indirect evaporative coolers, air to water heat pumps, energy recovery systems, etc.)
4. Traditional HVAC goods, control systems, and services 5. ENERGY STAR certified water heaters 6. ENERGY STAR Certified Electronics (TVs, Telephones, Audio/Video, etc.) 7. ENERGY STAR Certified Windows, Doors and Skylights 8. ENERGY STAR Certified Roofing 9. ENERGY STAR Certified Insulation 10. Air sealing 11. ENERGY STAR Certified Commercial Food Service Equipment 12. ENERGY STAR Certified Data Center Equipment 13. ENERGY STAR Certified LED lighting 14. Other LED, CFL, and efficient lighting 15. Solar thermal water heating and cooling [SET SOLAR=1] 16. Other renewable heating and cooling (geothermal, biomass, heat pumps, etc.) 17. Advanced building materials/insulation 18. Recycled building materials 19. Reduced water consumption products and appliances 20. Other (Specify)

A-11
U S E E R 2 0 2 1 | A P P E N D I X
E. Fuels (IF SC=5) [RANDOMIZE]
1. Coal 2. Petroleum 3. Natural Gas 4. Other Fossil Fuel 5. Corn Ethanol 6. Other Ethanol/Non-Woody Biomass, including Biodiesel 7. Woody Biomass/Cellulosic Biofuel 8. Other Biofuels 9. Nuclear Fuel 10. Other (Specify)
F. Transportation Vehicles, Including Motor Vehicles (IF SC=6) [RANDOMIZE]
1. Gasoline and Diesel Motor Vehicles (excluding freight transport) 2. Hybrid Electric Vehicles 3. Plug-In Hybrid Vehicles 4. Electric Vehicles 5. Natural Gas Vehicles 6. Hydrogen Vehicles 7. Fuel Cell Vehicles 8. Other (Specify _________)
G. Component Parts for Transportation Vehicles (IF SC=7) [RANDOMIZE]
1. Transportation Vehicle Motor or Engine & Drive Parts 2. Transportation Vehicle Exhaust System Parts 3. Transportation Vehicle Body Parts 4. Other Transportation Vehicle Parts (Specify _______)
SET SOLAR=1 IF SEA=1 OR 2, OR TSF=1, AND SED=5 IF SE TOTAL>1, ASK SEPRIME, IF NOT, SKIP SEPRIME. Which of the following technologies is your organization PRIMARILY engaged
with? [PIPE-IN RESPONSES FROM SEA-SEG] [IF RESPONDENT ONLY IDENTIFIES WITH ONE INDUSTRY AT SCREENER E (QC), USE THAT INDUSTRY FOR THE REMAINDER OF THE SURVEY IN PLACE OF “ENERGY” / IF MORE THAN ONE, CONTINUE TO USE “ENERGY.” EXCEPTION - IF THE ONLY SELECTION AT SCREENER C IS “OTHER” OR “DK/NA,” USE “ENERGY”] F. Which of the following industry descriptions describe your organization’s focus as it
relates to the [energy/ SC] industry? [ALLOW MULTIPLE RESPONSES]
1. An organization that manufactures and/or assembles [energy/ SC] goods or produces components that go into energy products
A-12
U S E E R 2 0 2 1 | A P P E N D I X
2. An organization that conducts research and development and related services for [energy/ SC]
3. An organization involved in the wholesale trade and distribution of [energy/ SC] products and services
4. An organization that installs [energy/ SC] systems or provides services for installation or construction of [energy/ SC] systems
5. A public or private utility 6. An organization that provides consulting, engineering, finance, legal, or
other professional services related to energy 7. An organization that conducts operations and maintenance (O&M) for
[energy/ SC] systems 8. Other support services (Specify: ______) 9. Other (Specify: ______) 10. (DON’T READ) Not sure
[ASK SCREENER G IF MORE THAN ONE SELECTED AT SCREENER F] G. Which do you consider your organization’s primary focus as it relates to the [energy/ SC]
industry, based on the labor hours at your location
1. An organization that manufactures and/or assembles [energy/ SC] goods or produces components that go into energy products
2. An organization that conducts research and development and related services for [energy/ SC]
3. An organization involved in the wholesale trade and distribution of [energy/ SC] products and services
4. An organization that installs [energy/ SC] systems or provides services for installation of [energy/ SC] systems
5. A public or private utility 6. An organization that provides consulting, engineering, finance, legal, or
other professional services related to energy 7. An organization that conducts operations and maintenance (O&M) for
[energy/ SC] systems 8. Other support services (Specify: ______) 9. Other (Specify: ______) 10. (DON’T READ) Not sure
SET SGPRIME BASED ON SCREENER G RESPONSE OR SCREENER F RESPONSE IF SCREENER F COUNT=1
IF SGPRIME=4, ASK SCREENER H, OTHERWISE SKIP
H. Does your organization work on ENERGY STAR certified new home construction?
1. Yes 2. No 3. DK/NA
I. Does your organization work on ENERGY STAR certified buildings and plants
(commercial and industrial)?
a. Yes b. No c. DK/NA

A-13
U S E E R 2 0 2 1 | A P P E N D I X
J. Does your organization have an energy manager or director responsible for energy management at one or more facilities?
a. Yes b. No c. DK/NA
IF SGPRIME=5, ASK SCREENER K K. Does your organization employ workers that are in charge of administering, managing,
evaluating, or otherwise working on utility-led energy efficiency programs, rebates, and other activities?
a. Yes b. No c. DK/NA
`````````````````````````````````````````````````````````````````````````` For this survey, we will just be asking about the employees that work from or directly report to your current location.
1. Including all full-time and part-time employees, how many permanent employees work
at or from your current location? (IF NEEDED: this includes employees currently working remotely due to COVID-19 that would otherwise report to a single location) Record # of employees ___________ (DON’T READ) Have check box for Refused 2. Based on [Take Q1 #] full-time and part-time permanent employees at your location,
how many employees do you expect to have at your location 12 months from now? 1 More [record #_______] 2 Fewer [record #_______] 3 (DON’T READ) Same number 4 (DON’T READ) Refused
[If amount differs by 10% or more in either direction, ask: ] Just to confirm, you currently have ____ permanent employees at your current location and you expect to have _____ (more/fewer) employees, for a total of ____ permanent employees 12 months from now.
3. Of the [Take Q1 #] full time and part-time permanent employees at your current location, how many of these workers support the [energy/ SC] portion of your business? Please note that your response should include administrative staff supporting the energy portion of your business.
Record # of employees ___________ (DON’T READ) Have check box for Refused

A-14
U S E E R 2 0 2 1 | A P P E N D I X
[IF NEEDED: SUPPORT WORKERS ARE DEFINED AS THOSE INDIVIDUALS THAT SPEND ANY AMOUNT OF TIME, DIRECTLY WORKING ON ENERGY RELATED PROJECTS INCLUDING ADMINSTRATIVE SUPPORT WORKERS] [Q3 SHOULD BE LESS THAN OR EQUAL TO Q1 - BUILD IN CHECK] 4. Of your [Take Q3 #] energy staff at your location (office staff and in the field), please
classify them into the area where they spent most of their time over the last 12 months. Please count each employee only once.
a. In-state within your region/metropolitan area [Record #] b. In-state outside your region/metropolitan area [Record #] c. Out-of-state [Record #]
5. How many full-time and part-time permanent employees did you have working at your
current location 12 months ago that supported the [energy/ SC] portion of your business?
Record # of employees ___________ (DON’T READ) Have check box for Refused 6. Based on [Take Q3 #] full-time and part-time permanent employees at your location
that support the [energy/SC] portion of your business, how many employees do you expect to have at your location 12 months from now?
1 More [record #_______] 2 Fewer [record #_______] 3 (DON’T READ) Same number 4 (DON’T READ) Refused
To confirm, you currently have ____ permanent employees supporting the energy portion of your business and you expect that number to be _____ (more/fewer) 12 months from now, for a total of ____
7. Thinking of your [INSERT Q3] energy employees, how many spend at least 50% of their
time supporting the energy portion of your business? 8. Thinking of your [Q3 ANSWER] energy employees, how many spend all of their time
supporting the energy portion of your business? Record: _______ SECTION 2 – COVID Questions We will now be asking you a few questions about how your business has been affected by COVID-19.
9. Did your firm lay off, furlough, or reduce pay of any energy workers as a result of COVID-19 and related stay-at-home orders?
1. Yes 2. No 3. DK/NA
IF Q9=1, ASK Q10, OTHERWISE SKIP

A-15
U S E E R 2 0 2 1 | A P P E N D I X
10. How many employees were impacted by these layoffs or other reductions in work?
1. Temporarily lay off, meaning no pay or benefits for a temporary period: Record # of employees ________
2. Permanently lay off: Record # of employees ___________ 3. Furlough, meaning no pay, but continuation of employee benefits such as
healthcare: Record # of employees ___________ 4. Reduce hours: Record # of employees ___________ 5. Reduce pay and/or benefits: Record # of employees ____ 6. (DON’T READ) Refused
If Q10 = 1, 2, OR 3, ASK Q11-13 OTHERWISE SKIP
11. Thinking of your [insert Q10 total] impacted employees, how many were:
1. Non-supervisory staff 2. Supervisors or managers but not executive staff or owner 3. Executive staff or owner
12. Has your firm since brought back any laid off or furloughed employees? If so how many?
1. Yes: Record # of employees_____ 2. No 3. DK/NA
[build in check – Q12 may not exceed Q10.1 + Q10.2 + Q10.3]
[ASK: Just to confirm, you furloughed [Q10] energy workers, [Q11] have returned and you now have [Q3] energy workers, meaning that you had approximately [insert Q3 – Q10 + Q12] energy workers on or around March 1, 2020?]
13. How many of your [Q10.1 + Q10.2 + Q10.3] total laid off or furloughed employees do you expect to bring back by December 31, 2020?
Record # of employees ___________
(DON’T READ) Have check box for Refused
14. Has your firm received emergency financial relief such as funds designated through the Paycheck Protection Program (PPP), the Economic Injury Disaster Loan (EIDL), and/or other state, federal, or local emergency loan programs? (Select all that apply)
a. No, we have not received emergency funds b. Yes, through the Paycheck Protection Program (PPP) c. Yes, through the Economic Injury Disaster Loan (EIDL) d. Yes, through another state emergency loan program (Specify____) e. Yes, through another federal emergency loan program (Specify____) f. Yes, through another local emergency loan program (Specify____) g. DK/NA
[IF Q14 = 2, 3, 4, 5, OR 6, ASK Q15]

A-16
U S E E R 2 0 2 1 | A P P E N D I X
14. When do you expect that the emergency funds your firm has received will be exhausted?
a. The funds have been exhausted b. On or before November 30, 2020 c. After November 30, 2020 d. DK/NA
15. Has, or do you expect, that your firm will lay off, furlough, or reduce the pay of any
additional workers as a result of exhausting these funds?
1. Yes 2. No 3. DK/NA
Workforce Profile Questions If SC COUNT > 1 response, ASK Q16 16. Thinking of your [Take Q3] [energy/ SC] workers at your location, please classify them
in the following categories. Please count each employee only once and categorize them in the area where they spend the most time.
PIPE IN SCREENER C RESPONSES Record # of employees ___________ If SC COUNT > 1 response and Q7>0, ASK Q17 17. Thinking of your [Take Q7] [energy/ SC] workers that spend at least 50% of their time
supporting the energy portion of your business, please classify them in the following categories. Please count each employee only once and categorize them in the area where they spend the most time.
PIPE IN SCREENER C RESPONSES AND EMPLOYMENT FROM Q7 Record # of employees ___________ BUILD CHECK SO TOTAL MUST = Q7 IF SC = 1 and Screener E.A > 1 response, ASK Q18 OTHERWISE SKIP USE Q3 IN PLACE OF Q16 IF SELECTED COUNT AT SCREENER C WAS ONE (ONE CHOICE) 18. Thinking of your [PIPE IN Q16/Q3 GENERATION ANSWER] energy generation (including
solar) workers at your location, please classify them in the following categories. Please count each employee only once and categorize them in the technology area where they spend the most time.
PIPE IN SCREENER E.A RESPONSES

A-17
U S E E R 2 0 2 1 | A P P E N D I X
Record # of employees ___________ IF SC = 2 and Screener E.B > 1 response, ASK Q19 OTHERWISE SKIP 19. Thinking of your [PIPE IN Q16/Q3 ELECTRIC POWER TRANSMISSION AND DISTRIBUTION
ANSWER] energy transmission, distribution, and storage workers at your location, please classify them in the following categories. Please count each employee only once and categorize them in the technology area where they spend the most time.
PIPE IN SCREENER E.B RESPONSES Record # of employees ___________ IF SC = 3 and Screener E.C > 1 response, ASK Q20 OTHERWISE SKIP 20. Thinking of your [PIPE IN Q16/Q3 STORAGE ANSWER] storage workers at your location,
please classify them in the following categories. Please count each employee only once and categorize them in the technology area where they spend the most time.
PIPE IN SCREENER E.C RESPONSES Record # of employees ___________ IF Q20_2(BATTERY STORAGE)>0, ASK Q21 21. Thinking of your [PIPE IN Q20_2 #] battery storage workers at your location, please
classify in them in the following categories. Please count each employee only once and categorize them in the battery storage application category where they spend the most time.
1. Consumer devices [Record # of employees] 2. Vehicles or other transportation [Record # of employees] 3. Buildings or industrial facilities [Record # of employees] 4. Electric Grid [Record # of employees] 5. Other (Specify) [Record # of employees]
IF SC = 4 and Screener E.D > 1 response, ASK Q22 OTHERWISE SKIP 22. Thinking of your [PIPE IN Q16/Q3 ENERGY EFFICIENCY, INCLUDING HEATING, COOLING
AND BUILDING ENVELOPE ANSWER] energy efficiency, including heating, cooling and building envelope, workers at your location, please classify them in the following categories. Please count each employee only once and categorize them in the technology area where they spend the most time.
PIPE IN SCREENER E.D RESPONSES Record # of employees ___________ IF SC = 5 and Screener E.E > 1 response, ASK Q23 OTHERWISE SKIP

A-18
U S E E R 2 0 2 1 | A P P E N D I X
23. Thinking of your [PIPE IN Q16/Q3 FUELS ANSWER] fuels-related workers at your location, please classify them in the following categories. Please count each employee only once and categorize them in the technology area where they spend the most time.
PIPE IN SCREENER E.E RESPONSES Record # of employees ___________ IF SC = 6 and Screener E.F > 1 response, ASK Q24 OTHERWISE SKIP 24. Thinking of your [PIPE IN Q16/Q3 TRANSPORTATION VEHICLES ANSWER] motor-vehicle
related workers at your location, please classify them in the following categories. Please count each employee only once and categorize them in the technology area where they spend the most time.
PIPE IN SCREENER E.F RESPONSES Record # of employees ___________ IF SC = 5 and Screener E.G > 1 response, ASK Q25 OTHERWISE SKIP 25. Thinking of your [PIPE IN Q16/Q3 COMPONENT PARTS ANSWER] energy generation
workers at your location, please classify them in the following categories. Please count each employee only once and categorize them in the technology area where they spend the most time.
PIPE IN SCREENER E.G RESPONSES Record # of employees ___________ Demographic questions 26. Thinking of your [Take Q3] [energy/ SC] employees, how many are:
a) Male: Record # employees ____________ b) Female: Record # of employees _________ c) Gender non-binary: Record # of employees _________ d) (DON’T READ) Refused
Q26 a+b+c must = Q3 27. Thinking of your [Take Q3] [energy/ SC] employees, please indicate the ethnicity:
(a) Hispanic (b) Not Hispanic or Latinx (c) (DON’T READ) Refused
Q27 a+b must = Q3 28. Thinking of your [Take Q3][energy/SC] employees, please indicate the race and choose
all that apply:
a) American Indian or Alaskan Native: Record # of employees ________

A-19
U S E E R 2 0 2 1 | A P P E N D I X
b) Asian: Record # of employees ___________ c) Black or African American: Record # of employees ___________ d) Native Hawaiian or other Pacific Islander: Record # of employees ____ e) White Record # of employees ___________ f) Two or more races: Record # of employees________ g) (DON’T READ) Refused
Q28 a- must = Q3 29. Thinking of your [Take Q3] [energy/ SC] employees, how many are:
a) Veterans of the U.S. Armed Forces Record # of employees ___ b) 55 and over Record # of employees ___________ c) Represented by unions Record # of employees ___________ d) (DON’T READ) Refused
30. Thinking of the current [Take Q3] [energy/ SC] employees at your location, how many
are in the following occupational categories? (Please only assign one category to each employee that supports the [energy/ SC] portion of your business. If they fall into more than one category, please assign them to the category in which they devote more of their time.)
a. Production/Manufacturing positions (includes assembly workers and those involved in the design, quality control and manufacturing process)
Record # of employees ___________ (DON’T READ) Have check box for Refused
b. Installation, construction or repair positions (includes technicians, building
trades people, and supervisors that are working at project site)
Record # of employees ___________ (DON’T READ) Have check box for Refused
c. Administrative positions (includes customer service representatives, clerks, office and operations support)
Record # of employees ___________ (DON’T READ) Have check box for Refused
d. Management/Professional positions (engineers, etc. - does not include
those supervisors that spend a majority of their time at project sites or sales managers)
Record # of employees ___________ (DON’T READ) Have check box for Refused
e. Sales positions (includes cost estimators, sales representatives, and sales managers)
Record # of employees ___________ (DON’T READ) Have check box for Refused
f. Other (Specify: _______________)

A-20
U S E E R 2 0 2 1 | A P P E N D I X
Record # of employees ___________ (DON’T READ) Have check box for Refused (CREATE INTERNAL CONTROL SO Q30 A+B+C+D+E+F EQUALS Q3] SECTION 3 – Workforce Development & Training Needs 24. Does your firm have an adequate number of qualified energy employees to meet
current needs?
1. Yes 2. No 3. DK/NA
IF Q31 = 2, ask Q32 25. Are you currently searching for employees for new positions or to fill vacancies or have
you recently searched for new employees?
1. Yes 2. No 3. DK/NA
If Q32 = 1 ask Q33 26. Thinking of your firm’s recent recruitment efforts, please indicate your level of difficulty
finding qualified applicants to fill the positions.
1. Very difficult 2. Somewhat difficult 3. Not at all difficult 4. DK/NA
27. Approximately how much of your organization’s work at your current location, in terms
of total gross revenue, is related to energy?
Record $:_____________________________ ASK Q28 if SE has multiple responses, otherwise SKIP 28. Approximately how much of your organization’s work at your current location, in terms
of total gross revenue, is related to each of the following products or services? (Use numbers to indicate percentages, for instance 20=20%)
1. INSERT SE RESPONSE 1 ____% 2. INSERT SE RESPONSE 2 ____% 3. INSERT SE RESPONSE 3 ____% 4. … 5. All other revenue not related to energy ____%
Q35 total must equal 100% SECTION 8 – Technology Specific Questions
A-21
U S E E R 2 0 2 1 | A P P E N D I X
ASK Q36 if SDPRIME = 1 or 3 & SGPRIME DOES NOT = 5 otherwise SKIP 29. How much of your firm’s work, as a percentage of your total gross energy revenue, is
attributed to utility projects, including those funded by or owned by utilities?
1. All of it (100%) 2. Half to most of it (50% to 99%) 3. A quarter to almost half of it (25% to 49%) 4. Less than a quarter (1% to 24%) 5. (DON’T READ) DK/NA
ASK Q37 if SDPRIME = 2 and SGPRIME DOES NOT = 5, otherwise SKIP
30. How much of your firm’s work, as a percentage of your total revenue related to transportation and distribution of energy, is attributed to utility grid modernization projects, including those funded by or owned by utilities?
1. All of it (100%) 2. Half to most of it (50% to 99%) 3. A quarter to almost half of it (25% to 49%) 4. Less than a quarter (1% to 24%) 5. (DON’T READ) DK/NA
ASK SECTION 6 IF SOLAR=1 SECTION 6 – Solar Questions IF SGPRIME=1, ASK S1 S1. Which solar energy components are manufactured at your location? (select all that
apply) [RANDOMIZE]
1. Wafers 2. Cells 3. Modules 4. Inverters 5. Mounting Structures, including trackers 6. Battery Storage 7. Cables/conduits/wires 8. Monitoring Systems 9. Other (Specify:_______) 10. (DON’T READ) Not sure
IF SGPRIME=4, ASK S2 – S7 S2. Does your location install residential, non-residential, community solar, and/or
utility-scale solar systems?
a) Residential (installed on a single-family home) Y/N
b) Non-residential (installed on commercial, industrial, agricultural, school, government, and nonprofit buildings) Y/N
c) Community Solar (installations of local solar facilities shared by multiple
community subscribers) Y/N
A-22
U S E E R 2 0 2 1 | A P P E N D I X
d) Utility-scale (installation in which the offtaker of power is a utility-scale or
wholesale power market) Y/N S3. How many kilowatts (kW) of solar energy systems has your location installed over
the last 12 months? Installed is defined as a completed installation project and does not include projects that have not yet been completed. (NOTE if respondent answers in megawatts rather than kilowatts, data can be entered as such but please confirm the units the respondent is reporting).
Record_____kW____MW
IF S2=MULTIPLE RESPONSES, ASK S4 and S5 OTHERWISE SKIP
S4. How many kilowatts (kW) has your location installed in each category in the last 12 months? (NOTE if respondent answers in megawatts rather than kilowatts, data can be entered as such but please confirm the units the respondent is reporting).
[PIPE IN S2 Categories]
a.) Residential: Record _____kW ______MW b.) Non-residential: Record _____kW ______MW c.) Community Solar: Record_____kW______MW d.) Utility-scale: Record _____kW _____MW
ASK S5-S7 IF Q10_1+Q10_2+Q13_5>0
S5. What percentage of employees’ time is dedicated to the following installation or construction categories including sales, design, engineering and support?
[PIPE IN S2 Categories]
a.) Residential: [Record %] ______ b.) Non-residential: [Record %] _______ c.) Community Solar: [Record %] ______ d.) Utility-scale: [Record %] _______
S6. Thinking of your [PIPE IN SOLAR EMPLOYMENT] solar staff working in the field, how
many work in the following areas relative to your location?
(Please only assign one category to each employee that supports solar portion of your business. If they fall into more than one category, please assign them to the category in which they devote more of their time.)
a. In the field as non-electrician installers [Record #] ______ b. In the field as electrician installers[Record #] ______ c. In the field on operations and maintenance [Record #] _____ d. In the field as engineers [Record#] _____ e. On site evaluation, design, and permitting [Record #]_______ f. On finance, sales, or administrative processes [Record #]_____
A-23
U S E E R 2 0 2 1 | A P P E N D I X
S7. Of your installation workers, what percentage hold either an electrician license or specialty solar license?
Electrician License [Record %] _______
Specialty Solar License [Record %] _______ Other [Record %] _______
S8. How do you perceive the licensing requirements in your state impacts the pricing you are able to offer your solar customers?
a) Impacts very negatively (i.e. increases the cost our customers must pay) b) Impacts somewhat negatively c) Does not impact positively or negatively (i.e. does not impact the cost our
customers must pay) d) Impacts somewhat positively e) Impacts very positively (i.e. decreases the cost our customers must pay)
IF SEC=2, ASK S9 & S10 S9. Does your location offer residential, non-residential, and/or utility-scale battery
storage systems to be collocated with solar systems? a.) Residential Y/N b.) Non-residential Y/N c.) Utility-scale Y/N
S10. How many kilowatt-hours (kWh) of battery storage collocated with solar systems has your location installed over the last 12 months? (Note if respondent answers in megawatt-hours (MWh) rather than kilowatts, data can be entered as such but please confirm the units the respondent is reporting).
Record ______kWh____MWh
IF SGPRIME=4, ASK S12 S11. What percentage of your employees work in battery storage, including
administrative support? [Record %]_____ S12. What percentage of your firm’s solar work is outsourced or contracted to a third-
party? [Record %]_____ SUBSECTION FOR SOLAR – WAGE IF SGPRIME=4, ASK S14 & S15
S13. Thinking of your full-time employees who are unlicensed installers at your firm, what is the average hourly wage for entry-level installer, mid-level installer, and senior/crew-lead level employees?
a. Entry-level (Enter $)______ b. Mid-level (Enter $)______ c. Senior/supervisor (Enter $)______

A-24
U S E E R 2 0 2 1 | A P P E N D I X
S14. Thinking of your full-time employees who are licensed electrician installers at your firm, what is the average hourly wage for entry-level installer, mid-level installer, and senior/crew-lead level employees?
a. Entry-level (Enter $)______ b. Mid-level (Enter $)______ c. Senior/supervisor (Enter $)______
IF SGPRIME=1, ASK S16
S15. Thinking of your production/assembly workers at your firm, what is the average hourly wage for entry-level, mid-level, and senior/foreman level employees?
d. Entry-level (Enter $)______ e. Mid-level (Enter $)______ f. Senior/foreman (Enter $)______
SECTION 7 – Motor Vehicles & Component Parts ASK Q38 & 39 if SC=7, OTHERWISE SKIP ASK Q38 IF SF=1 31. Does your firm manufacture products that are intended to help achieve increasing fuel
economy standards, such as:
1. Efficient engines 2. Drivetrains 3. Lightweight materials 4. Low rolling resistant tires 5. Other (Specify)
32. Of your firm’s gross revenue related to component parts for transportation vehicles,
how much is earned from products that increase fuel economy for vehicles?
1. All of it (100%) 2. Half to most of it (50% to 99%) 3. A quarter to almost half of it (25% to 49%) 4. Less than a quarter (1% to 24%) 5. (DON’T READ) DK/NA
ASK Q40 if SC = 6, otherwise SKIP 33. With which of the following types of transportation vehicles does your firm primarily
design, manufacture, sell, repair, or otherwise work with? [SELECT ONE]
1. Automobiles 2. Light Duty Vehicles 3. Heavy Duty Vehicles 4. Industrial Vehicles, such as forklifts 5. Recreational Vehicles, such as golf carts 6. Rail 7. Other (specify ________)
ASK Q41-Q42 if SC = 7, otherwise SKIP

A-25
U S E E R 2 0 2 1 | A P P E N D I X
34. Does your firm manufacture, design, sell, and/or distribute parts solely used for alternative vehicles, or vehicles with a fuel source other than gasoline or diesel?
1. Yes 2. No 3. Don’t know/ Refused
ASK Q42 IF Q41=1, otherwise SKIP 35. How much of your firm’s work, as a percentage of your total revenue, is attributed to
parts solely used for alternative vehicles, or vehicles with a fuel source other than gasoline or diesel?
1. All of it (100%) 2. Half to most of it (50% to 99%) 3. A quarter to almost half of it (25% to 49%) 4. Less than a quarter (1% to 24%) 5. (DON’T READ) DK/NA
36. Thinking of the type of fuel used, does your organization offer parts for any of the
following types of transportation vehicles? [ALLOW MULTIPLE]
1. Gasoline and Diesel Motor Vehicles (excluding freight transport) 2. Hybrid Electric Vehicles 3. Plug-In Hybrid Vehicles 4. Electric Vehicles 5. Natural Gas Vehicles 6. Hydrogen or Fuel Cell Vehicles 7. Other (Specify _________)
IF SCREENER H=1, ASK Q44 37. How many of your [Take Q3#] energy employees work on ENERGY STAR certified new
home construction?
Record # of employees: ______________ IF SCREENER I=1, ASK Q45 38. How many of your [Take Q3#] energy employees work on ENERGY STAR certified
buildings and plants (commercial and industrial)?
Record # of employees: ______________ IF SCREENER K=1, ASK Q46 39. How many of your [Take Q3#] energy employees work on administering, managing,
evaluating, or otherwise working on utility-led energy efficiency programs, rebates, and other activities?
Record # of employees: ______________ IF SOLAR=1, ASK S16
A-26
U S E E R 2 0 2 1 | A P P E N D I X
S16. Would you like to receive a free copy of the U.S. Solar Market Insight 2019 Year in Review Full Report produced by the Solar Energy Industries Association (SEIA) and Wood MacKenzie Research?
1. Yes 2. No
Thank you for completing the survey. Since it sometimes becomes necessary for the project manager to confirm responses to certain questions, please verify your contact information.
da. First and Last Name (Interview note enter 99 for REF) 1. First Name 2. Last name db. Position (Interview note enter 99 for REF) dc. Phone (Interviewer Note 9999999999 for REF) dd. Email (Interview note enter 99 for REF) de. Organization Name (Interview note enter 99 for REF) df. Organization Street Address (Interview note enter 99 for REF) dg. Organization City (Interview note enter 99 for REF) dh. Organization State (Interview note enter 99 for REF) di. Organization Zip (Interviewer Note 99999 for REF)
Thank you very much for your time. HOW DID THE CALL END? 1 COMPLETED INTERVIEW 2 SURVEY SAID THEY DID NOT QUALIFY 3 CALLBACK NEEDED, PARTIAL 4 REFUSAL 5 SOMETHING ELSE PLEASE DISPOSITION CALL CORRECTLY. Thank you for your time!
Appendix C: Summary of Energy-Related Employment within Existing Industries by NAICS Codes
NAICS 21: Mining, Quarrying, and Oil and Gas Extraction (Mining and Extraction)
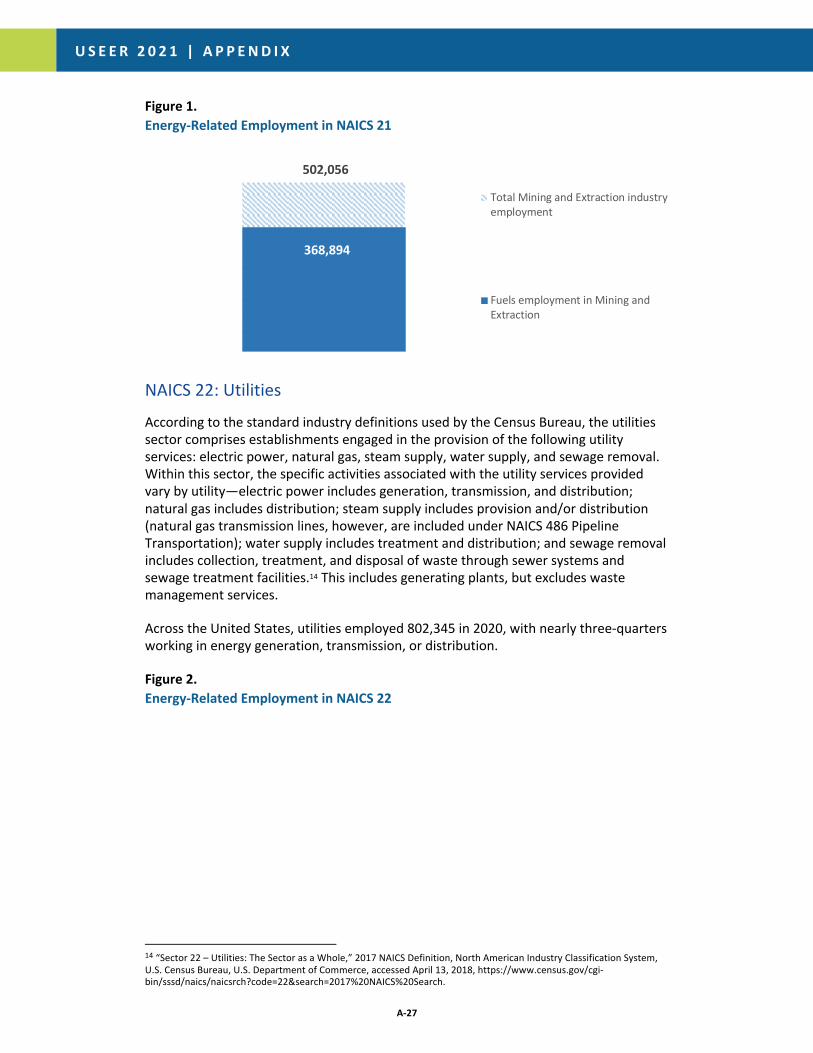
The 2021 USEER survey finds that 368,894 workers (100 percent in fuels) were associated with the mining and extraction of oil, gas, coal, and nuclear fuel stock in 2020. This represents 73 percent of the total mining and extraction jobs (502,056) in the United States in that year, including support activities for mining (NAICS 213).
A-27
U S E E R 2 0 2 1 | A P P E N D I X
Figure 1. Energy-Related Employment in NAICS 21
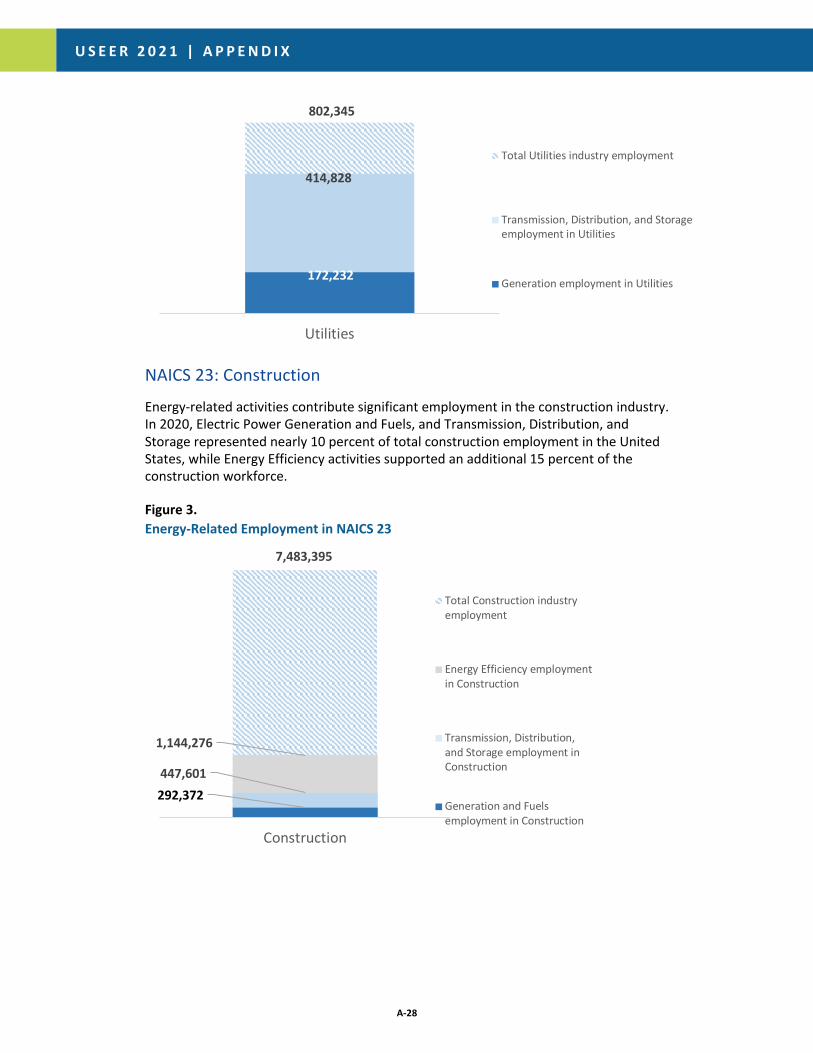
NAICS 22: Utilities
According to the standard industry definitions used by the Census Bureau, the utilities sector comprises establishments engaged in the provision of the following utility services: electric power, natural gas, steam supply, water supply, and sewage removal. Within this sector, the specific activities associated with the utility services provided vary by utility—electric power includes generation, transmission, and distribution; natural gas includes distribution; steam supply includes provision and/or distribution (natural gas transmission lines, however, are included under NAICS 486 Pipeline Transportation); water supply includes treatment and distribution; and sewage removal includes collection, treatment, and disposal of waste through sewer systems and sewage treatment facilities.14 This includes generating plants, but excludes waste management services.
Across the United States, utilities employed 802,345 in 2020, with nearly three-quarters working in energy generation, transmission, or distribution.
Figure 2. Energy-Related Employment in NAICS 22
14 “Sector 22 – Utilities: The Sector as a Whole,” 2017 NAICS Definition, North American Industry Classification System, U.S. Census Bureau, U.S. Department of Commerce, accessed April 13, 2018, https://www.census.gov/cgi-bin/sssd/naics/naicsrch?code=22&search=2017%20NAICS%20Search.
502,056
368,894
Total Mining and Extraction industryemployment
Fuels employment in Mining andExtraction
A-28
U S E E R 2 0 2 1 | A P P E N D I X
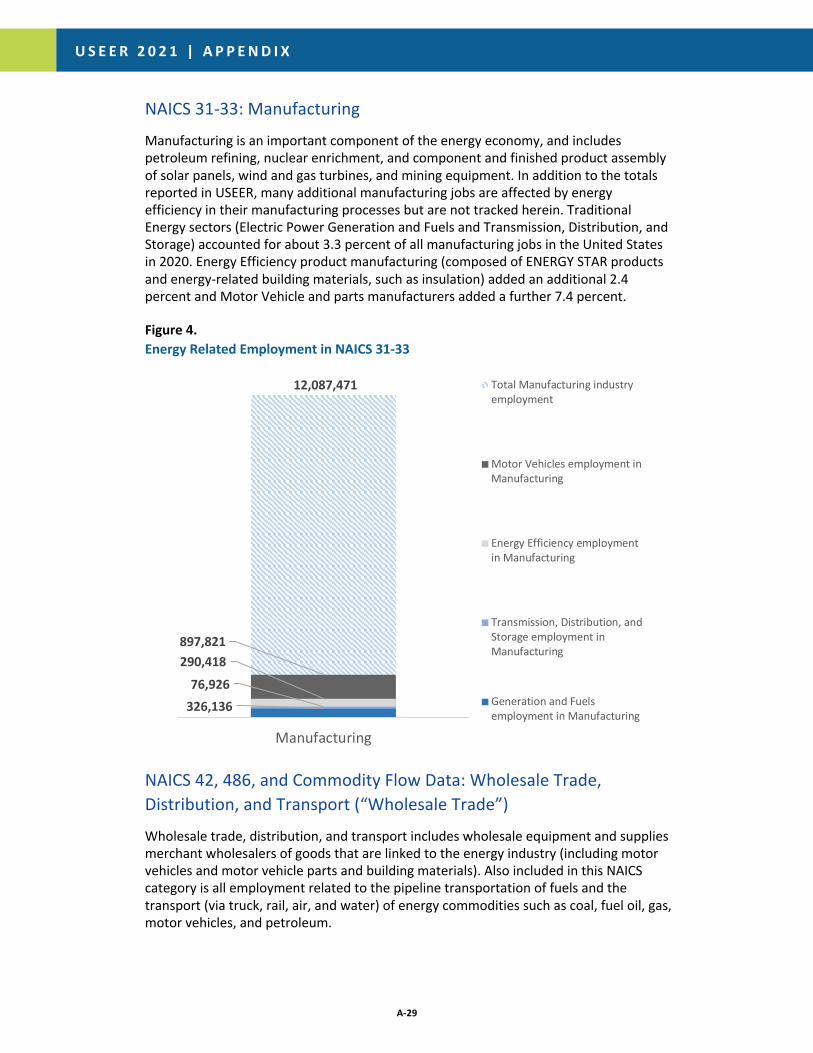
NAICS 23: Construction
Energy-related activities contribute significant employment in the construction industry. In 2020, Electric Power Generation and Fuels, and Transmission, Distribution, and Storage represented nearly 10 percent of total construction employment in the United States, while Energy Efficiency activities supported an additional 15 percent of the construction workforce.
Figure 3. Energy-Related Employment in NAICS 23
802,345
414,828
172,232
Utilities
Total Utilities industry employment
Transmission, Distribution, and Storageemployment in Utilities
Generation employment in Utilities
7,483,395
1,144,276
447,601292,372
Construction
Total Construction industryemployment
Energy Efficiency employmentin Construction
Transmission, Distribution,and Storage employment inConstruction
Generation and Fuelsemployment in Construction
A-29
U S E E R 2 0 2 1 | A P P E N D I X
NAICS 31-33: Manufacturing
Manufacturing is an important component of the energy economy, and includes petroleum refining, nuclear enrichment, and component and finished product assembly of solar panels, wind and gas turbines, and mining equipment. In addition to the totals reported in USEER, many additional manufacturing jobs are affected by energy efficiency in their manufacturing processes but are not tracked herein. Traditional Energy sectors (Electric Power Generation and Fuels and Transmission, Distribution, and Storage) accounted for about 3.3 percent of all manufacturing jobs in the United States in 2020. Energy Efficiency product manufacturing (composed of ENERGY STAR products and energy-related building materials, such as insulation) added an additional 2.4 percent and Motor Vehicle and parts manufacturers added a further 7.4 percent.
Figure 4. Energy Related Employment in NAICS 31-33
NAICS 42, 486, and Commodity Flow Data: Wholesale Trade, Distribution, and Transport (“Wholesale Trade”)
Wholesale trade, distribution, and transport includes wholesale equipment and supplies merchant wholesalers of goods that are linked to the energy industry (including motor vehicles and motor vehicle parts and building materials). Also included in this NAICS category is all employment related to the pipeline transportation of fuels and the transport (via truck, rail, air, and water) of energy commodities such as coal, fuel oil, gas, motor vehicles, and petroleum.
12,087,471
897,821290,418
76,926326,136
Manufacturing
Total Manufacturing industryemployment
Motor Vehicles employment inManufacturing
Energy Efficiency employmentin Manufacturing
Transmission, Distribution, andStorage employment inManufacturing
Generation and Fuelsemployment in Manufacturing

A-30
U S E E R 2 0 2 1 | A P P E N D I X
NAICS 51, 52, 53, 54, 55 and 56: Information (Software, etc.), Finance, Insurance, Professional and Business Services (Professional and Business Services)
Professional and business services provide support for energy-related activity in the United States. Firms from this sector are primarily involved in software development and other information services; finance and insurance; real estate and rental and leasing; professional, scientific and technical services; management of companies and enterprises and administrative support; and waste management and remediation services.
NAICS 81: Other Services (Repair and Maintenance/Other)
Other services are important to the energy economy, including repair and maintenance and nonprofit activity. Motor Vehicles accounted for over one-fifth (22.3 percent) of the workforce in the larger industry in 2020, driven by employment in automotive repair and maintenance. Generation and Fuels combined for 1 percent of the overall workforce in other services.
A-31
U S E E R 2 0 2 1 | A P P E N D I X
Appendix D: Electric Power Generation and Fuels Employment by Industry
Agriculture and Forestry
The QCEW does not capture a significant portion of agricultural labor. The BLS estimates that its methodologies exclude the majority of agricultural workers (52 percent) due to the nature of the industry. In addition, forestry and logging employment is highly seasonal and relies heavily on unreported subcontractors. The 2020 USEER estimates employment in these segments using a customized model based on inputs on fuel stocks generated by the U.S. Department of Agriculture Economic Research Service (ERS).15 Based on these inputs, an estimated 36,000 agriculture and forestry employees worked in 2020 to support fuel production.16
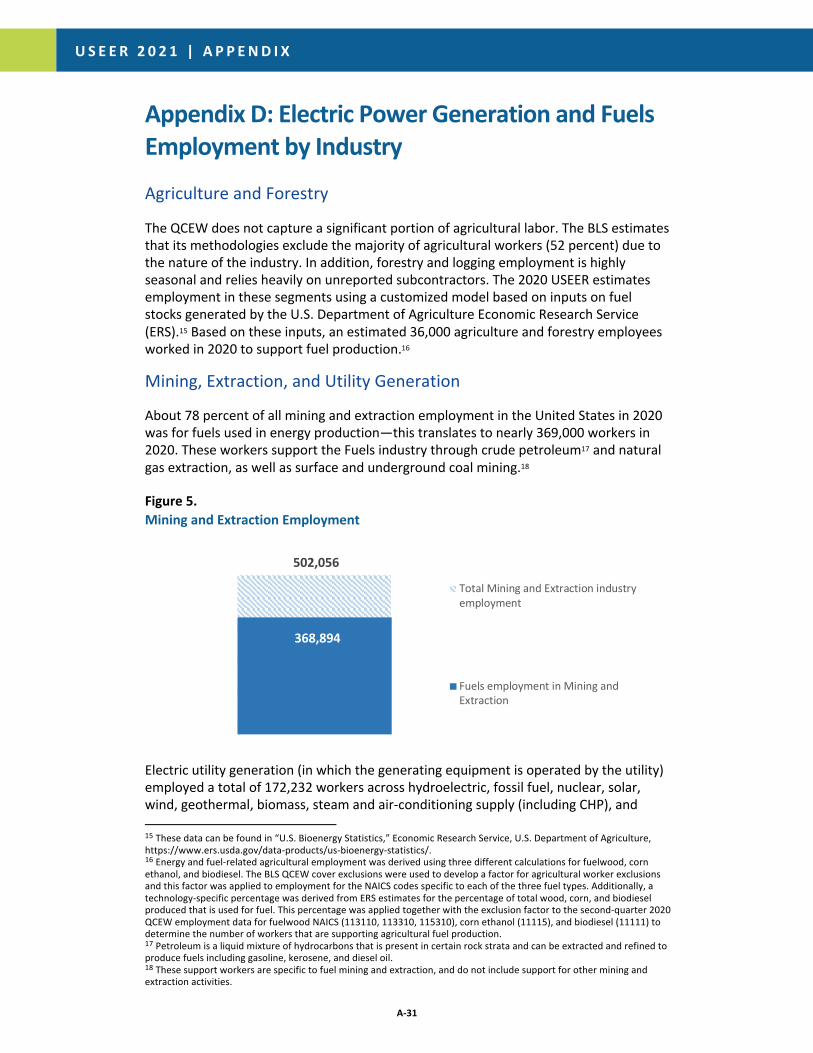
Mining, Extraction, and Utility Generation
About 78 percent of all mining and extraction employment in the United States in 2020 was for fuels used in energy production—this translates to nearly 369,000 workers in 2020. These workers support the Fuels industry through crude petroleum17 and natural gas extraction, as well as surface and underground coal mining.18
Figure 5. Mining and Extraction Employment
Electric utility generation (in which the generating equipment is operated by the utility) employed a total of 172,232 workers across hydroelectric, fossil fuel, nuclear, solar, wind, geothermal, biomass, steam and air-conditioning supply (including CHP), and
15 These data can be found in “U.S. Bioenergy Statistics,” Economic Research Service, U.S. Department of Agriculture, https://www.ers.usda.gov/data-products/us-bioenergy-statistics/. 16 Energy and fuel-related agricultural employment was derived using three different calculations for fuelwood, corn ethanol, and biodiesel. The BLS QCEW cover exclusions were used to develop a factor for agricultural worker exclusions and this factor was applied to employment for the NAICS codes specific to each of the three fuel types. Additionally, a technology-specific percentage was derived from ERS estimates for the percentage of total wood, corn, and biodiesel produced that is used for fuel. This percentage was applied together with the exclusion factor to the second-quarter 2020 QCEW employment data for fuelwood NAICS (113110, 113310, 115310), corn ethanol (11115), and biodiesel (11111) to determine the number of workers that are supporting agricultural fuel production. 17 Petroleum is a liquid mixture of hydrocarbons that is present in certain rock strata and can be extracted and refined to produce fuels including gasoline, kerosene, and diesel oil. 18 These support workers are specific to fuel mining and extraction, and do not include support for other mining and extraction activities.
502,056
368,894
Total Mining and Extraction industryemployment
Fuels employment in Mining andExtraction

A-32
U S E E R 2 0 2 1 | A P P E N D I X
other electric power generation. It is important to note that utility generation employment excludes any utilities that support water supply and irrigation systems or sewage treatment. It also excludes non-utility owned or operated generation from wind, solar, CHP, biomass, nuclear, or fossil fuels.
Figure 6. Utilities Employment
802,345
172,232
Total Utilities industryemployment
Generation employment inUtilities
A-33
U S E E R 2 0 2 1 | A P P E N D I X
Construction
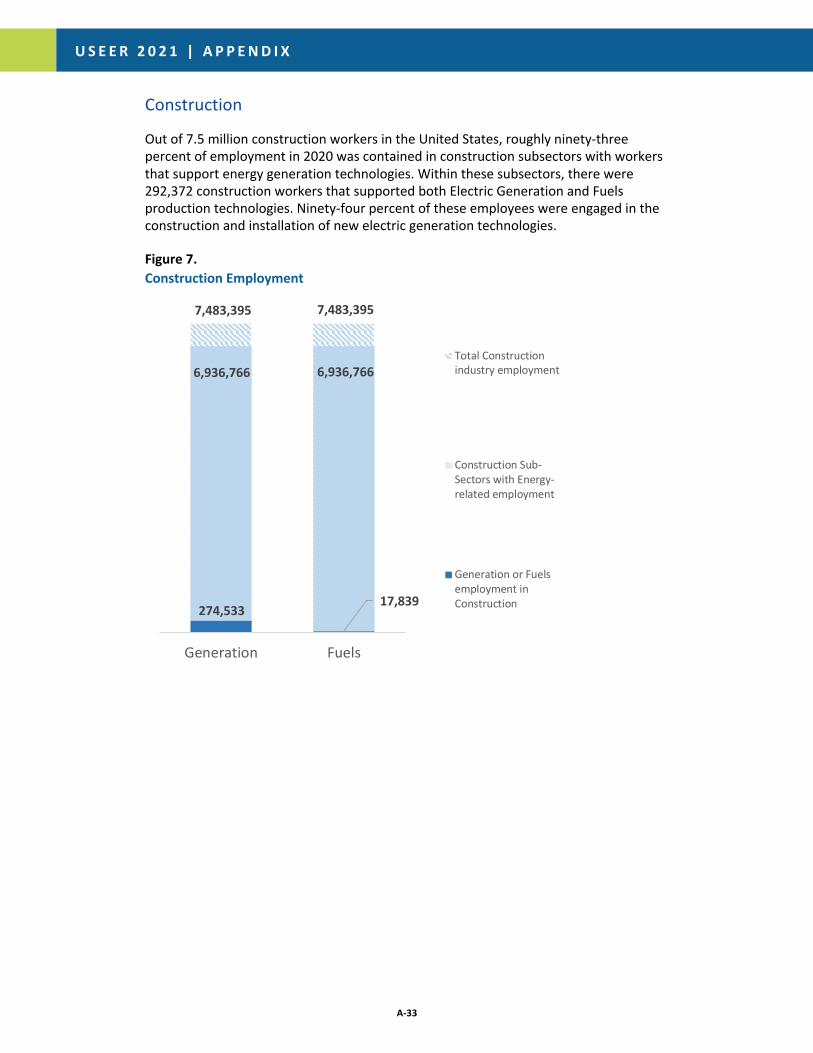
Out of 7.5 million construction workers in the United States, roughly ninety-three percent of employment in 2020 was contained in construction subsectors with workers that support energy generation technologies. Within these subsectors, there were 292,372 construction workers that supported both Electric Generation and Fuels production technologies. Ninety-four percent of these employees were engaged in the construction and installation of new electric generation technologies.
Figure 7. Construction Employment
7,483,395 7,483,395
6,936,766 6,936,766
274,533 17,839
Generation Fuels
Total Constructionindustry employment
Construction Sub-Sectors with Energy-related employment
Generation or Fuelsemployment inConstruction
A-34
U S E E R 2 0 2 1 | A P P E N D I X
Manufacturing
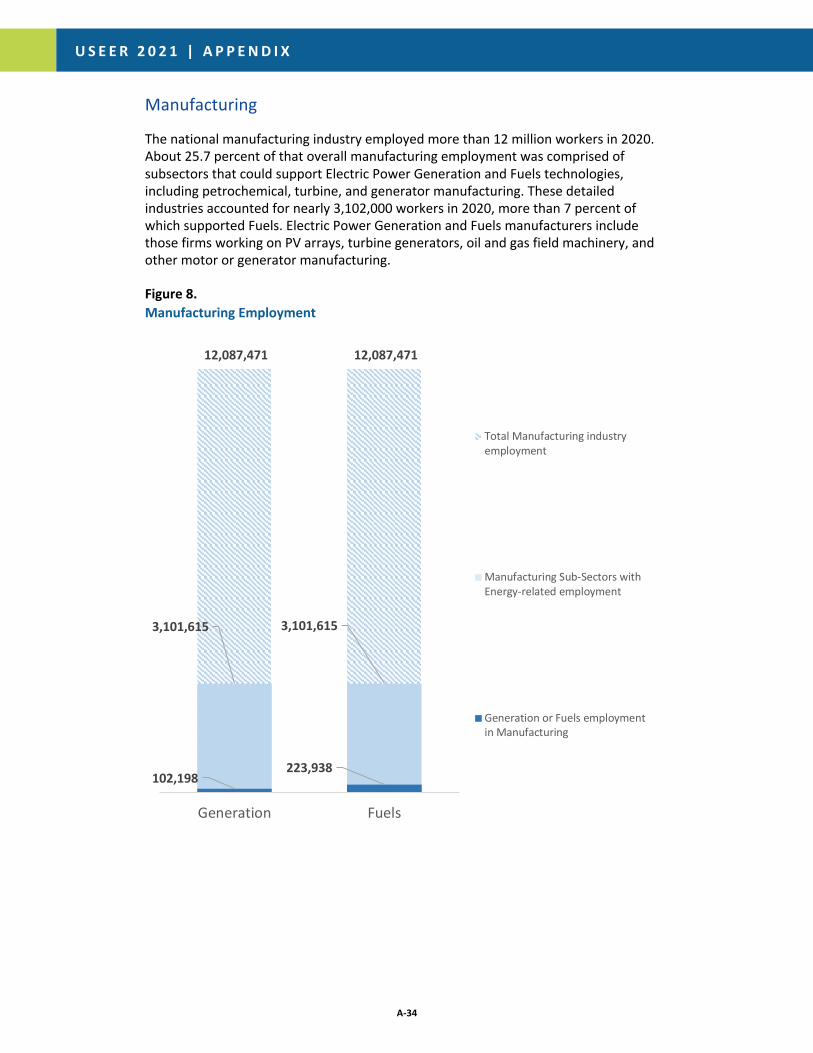
The national manufacturing industry employed more than 12 million workers in 2020. About 25.7 percent of that overall manufacturing employment was comprised of subsectors that could support Electric Power Generation and Fuels technologies, including petrochemical, turbine, and generator manufacturing. These detailed industries accounted for nearly 3,102,000 workers in 2020, more than 7 percent of which supported Fuels. Electric Power Generation and Fuels manufacturers include those firms working on PV arrays, turbine generators, oil and gas field machinery, and other motor or generator manufacturing.
Figure 8. Manufacturing Employment
12,087,471 12,087,471
3,101,615 3,101,615
102,198 223,938
Generation Fuels
Total Manufacturing industryemployment
Manufacturing Sub-Sectors withEnergy-related employment
Generation or Fuels employmentin Manufacturing
A-35
U S E E R 2 0 2 1 | A P P E N D I X
Wholesale Trade
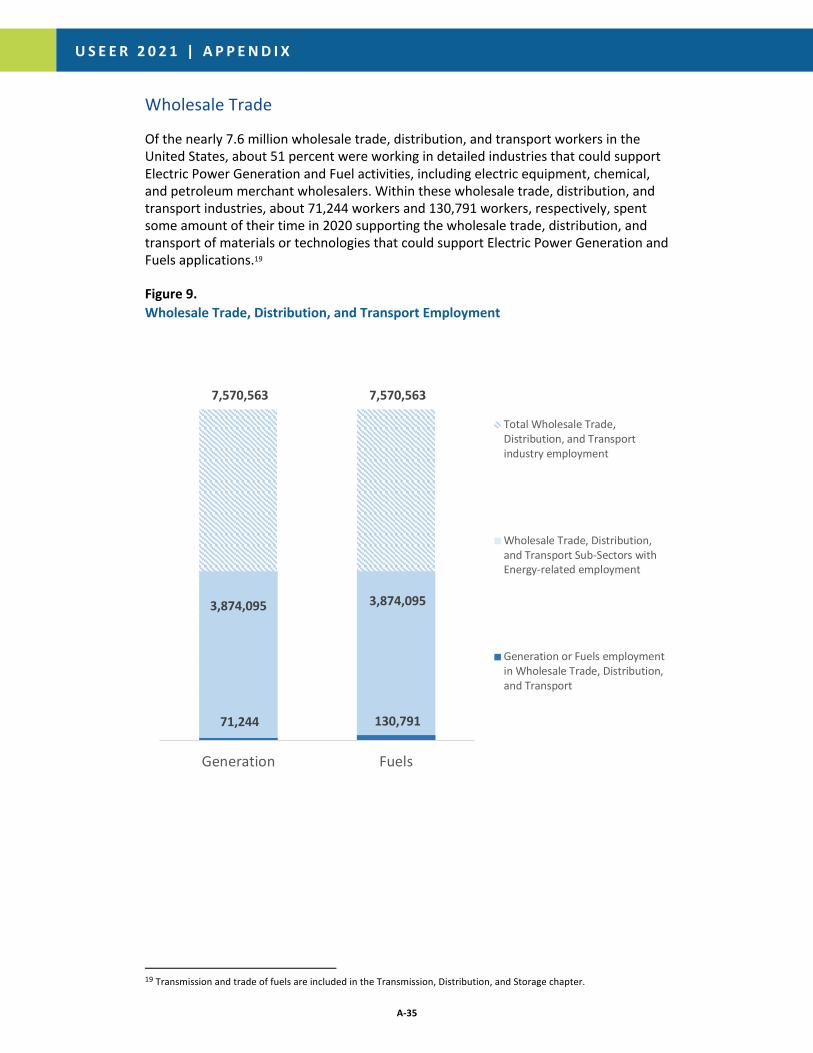
Of the nearly 7.6 million wholesale trade, distribution, and transport workers in the United States, about 51 percent were working in detailed industries that could support Electric Power Generation and Fuel activities, including electric equipment, chemical, and petroleum merchant wholesalers. Within these wholesale trade, distribution, and transport industries, about 71,244 workers and 130,791 workers, respectively, spent some amount of their time in 2020 supporting the wholesale trade, distribution, and transport of materials or technologies that could support Electric Power Generation and Fuels applications.19
Figure 9. Wholesale Trade, Distribution, and Transport Employment
19 Transmission and trade of fuels are included in the Transmission, Distribution, and Storage chapter.
7,570,563 7,570,563
3,874,095 3,874,095
71,244 130,791
Generation Fuels
Total Wholesale Trade,Distribution, and Transportindustry employment
Wholesale Trade, Distribution,and Transport Sub-Sectors withEnergy-related employment
Generation or Fuels employmentin Wholesale Trade, Distribution,and Transport
A-36
U S E E R 2 0 2 1 | A P P E N D I X
Professional and Business Services
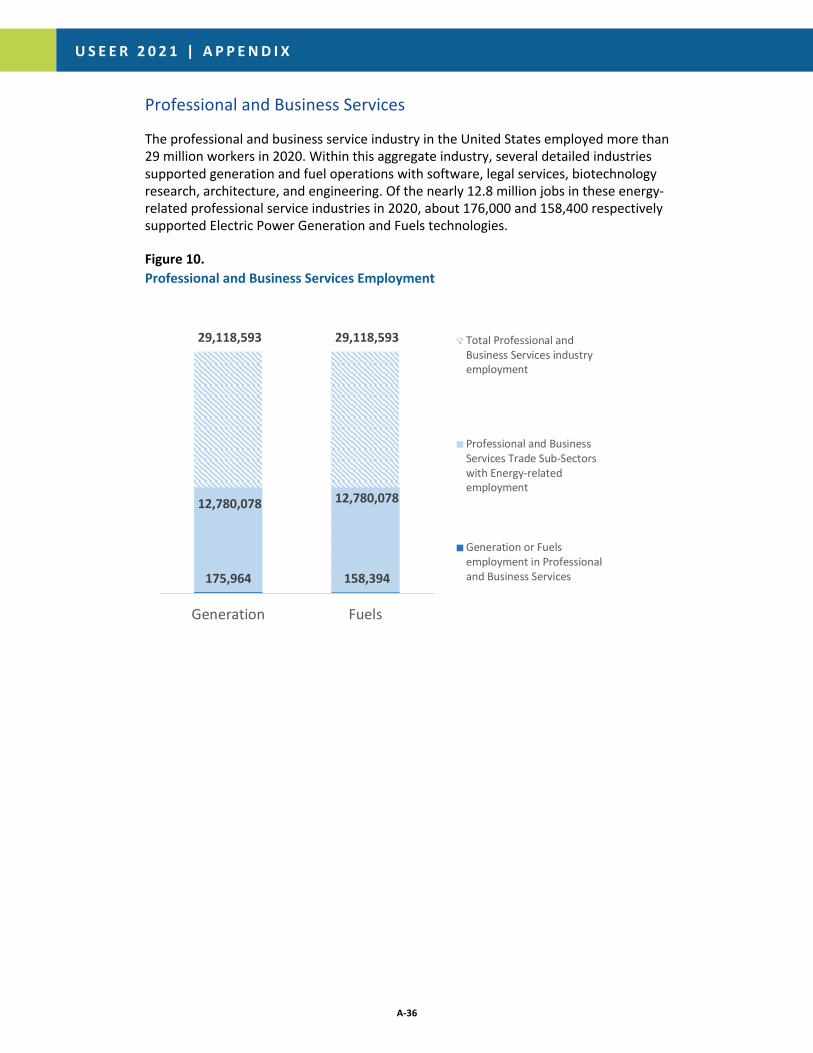
The professional and business service industry in the United States employed more than 29 million workers in 2020. Within this aggregate industry, several detailed industries supported generation and fuel operations with software, legal services, biotechnology research, architecture, and engineering. Of the nearly 12.8 million jobs in these energy-related professional service industries in 2020, about 176,000 and 158,400 respectively supported Electric Power Generation and Fuels technologies.
Figure 10. Professional and Business Services Employment
29,118,593 29,118,593
12,780,078 12,780,078
175,964 158,394
Generation Fuels
Total Professional andBusiness Services industryemployment
Professional and BusinessServices Trade Sub-Sectorswith Energy-relatedemployment
Generation or Fuelsemployment in Professionaland Business Services
A-37
U S E E R 2 0 2 1 | A P P E N D I X
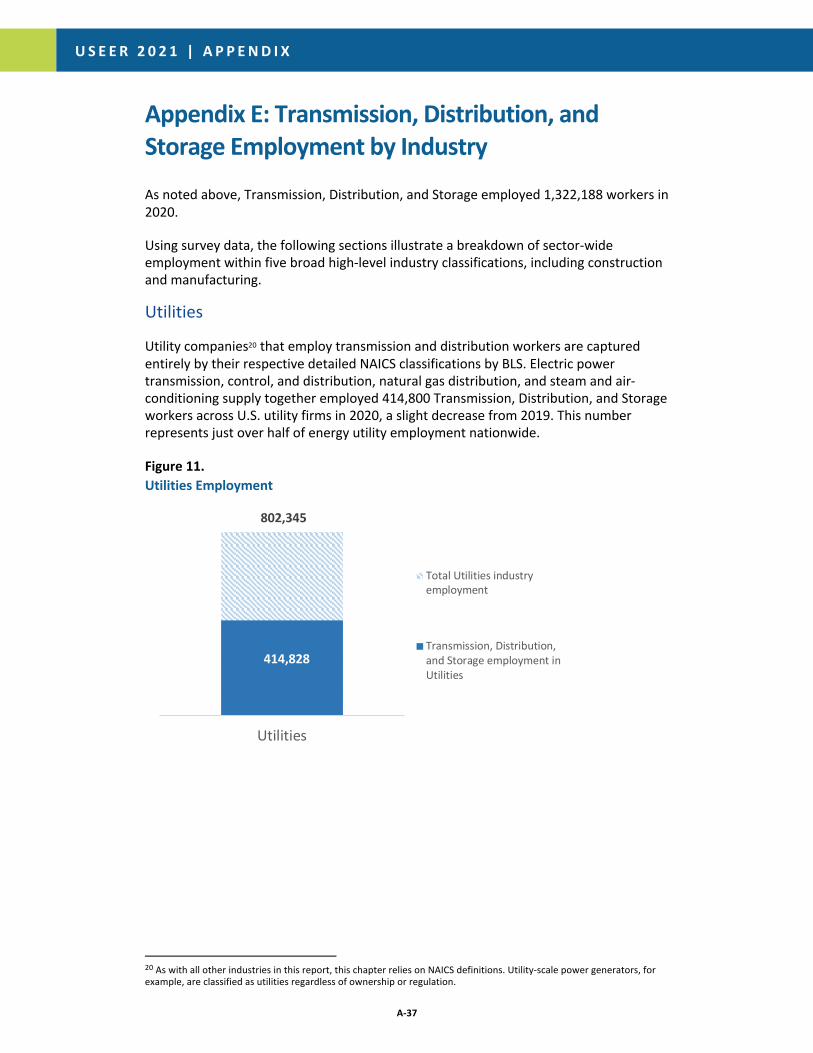
Appendix E: Transmission, Distribution, and Storage Employment by Industry
As noted above, Transmission, Distribution, and Storage employed 1,322,188 workers in 2020.
Using survey data, the following sections illustrate a breakdown of sector-wide employment within five broad high-level industry classifications, including construction and manufacturing.
Utilities
Utility companies20 that employ transmission and distribution workers are captured entirely by their respective detailed NAICS classifications by BLS. Electric power transmission, control, and distribution, natural gas distribution, and steam and air-conditioning supply together employed 414,800 Transmission, Distribution, and Storage workers across U.S. utility firms in 2020, a slight decrease from 2019. This number represents just over half of energy utility employment nationwide.
Figure 11. Utilities Employment
20 As with all other industries in this report, this chapter relies on NAICS definitions. Utility-scale power generators, for example, are classified as utilities regardless of ownership or regulation.
802,345
414,828
Utilities
Total Utilities industryemployment
Transmission, Distribution,and Storage employment inUtilities
A-38
U S E E R 2 0 2 1 | A P P E N D I X
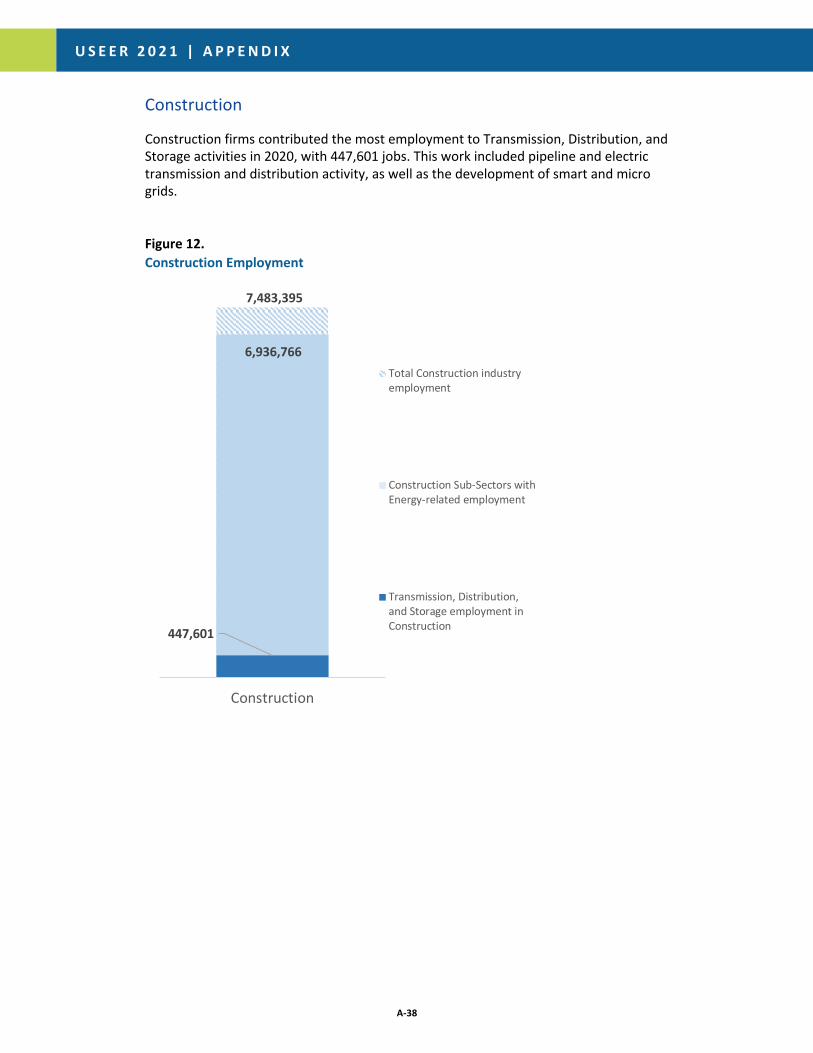
Construction
Construction firms contributed the most employment to Transmission, Distribution, and Storage activities in 2020, with 447,601 jobs. This work included pipeline and electric transmission and distribution activity, as well as the development of smart and micro grids.
Figure 12. Construction Employment
7,483,395
6,936,766
447,601
Construction
Total Construction industryemployment
Construction Sub-Sectors withEnergy-related employment
Transmission, Distribution,and Storage employment inConstruction
A-39
U S E E R 2 0 2 1 | A P P E N D I X
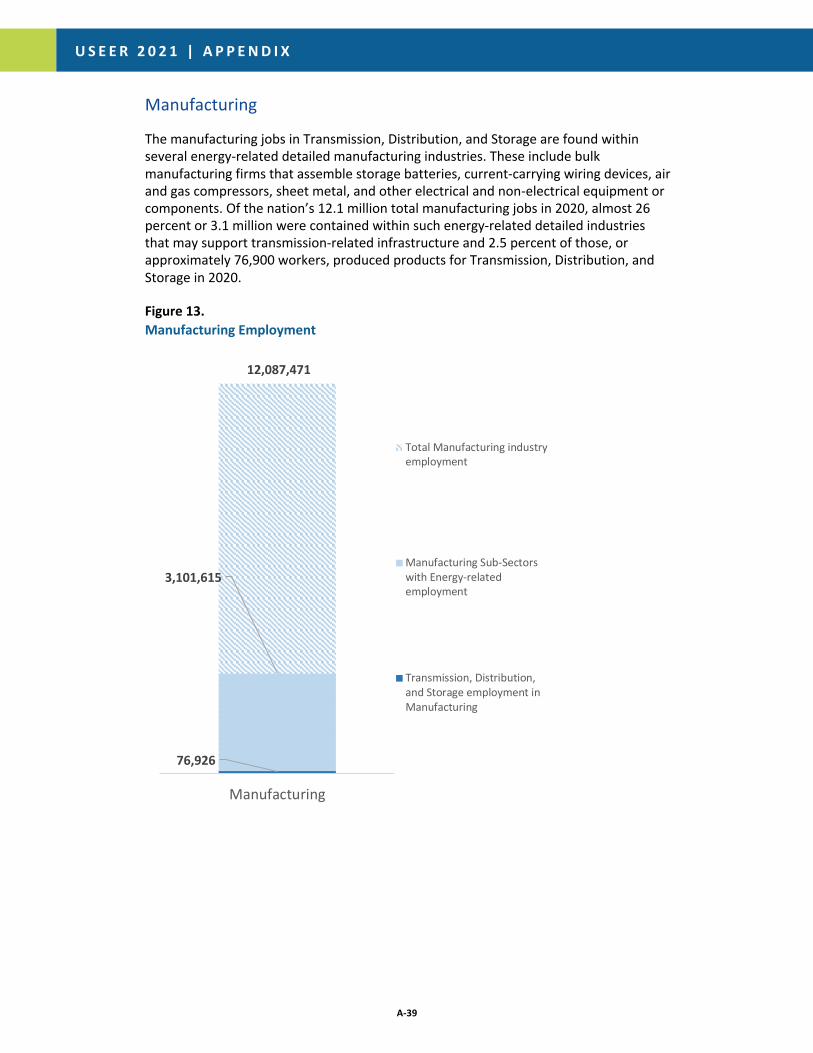
Manufacturing
The manufacturing jobs in Transmission, Distribution, and Storage are found within several energy-related detailed manufacturing industries. These include bulk manufacturing firms that assemble storage batteries, current-carrying wiring devices, air and gas compressors, sheet metal, and other electrical and non-electrical equipment or components. Of the nation’s 12.1 million total manufacturing jobs in 2020, almost 26 percent or 3.1 million were contained within such energy-related detailed industries that may support transmission-related infrastructure and 2.5 percent of those, or approximately 76,900 workers, produced products for Transmission, Distribution, and Storage in 2020.
Figure 13. Manufacturing Employment
12,087,471
3,101,615
76,926
Manufacturing
Total Manufacturing industryemployment
Manufacturing Sub-Sectorswith Energy-relatedemployment
Transmission, Distribution,and Storage employment inManufacturing
A-40
U S E E R 2 0 2 1 | A P P E N D I X
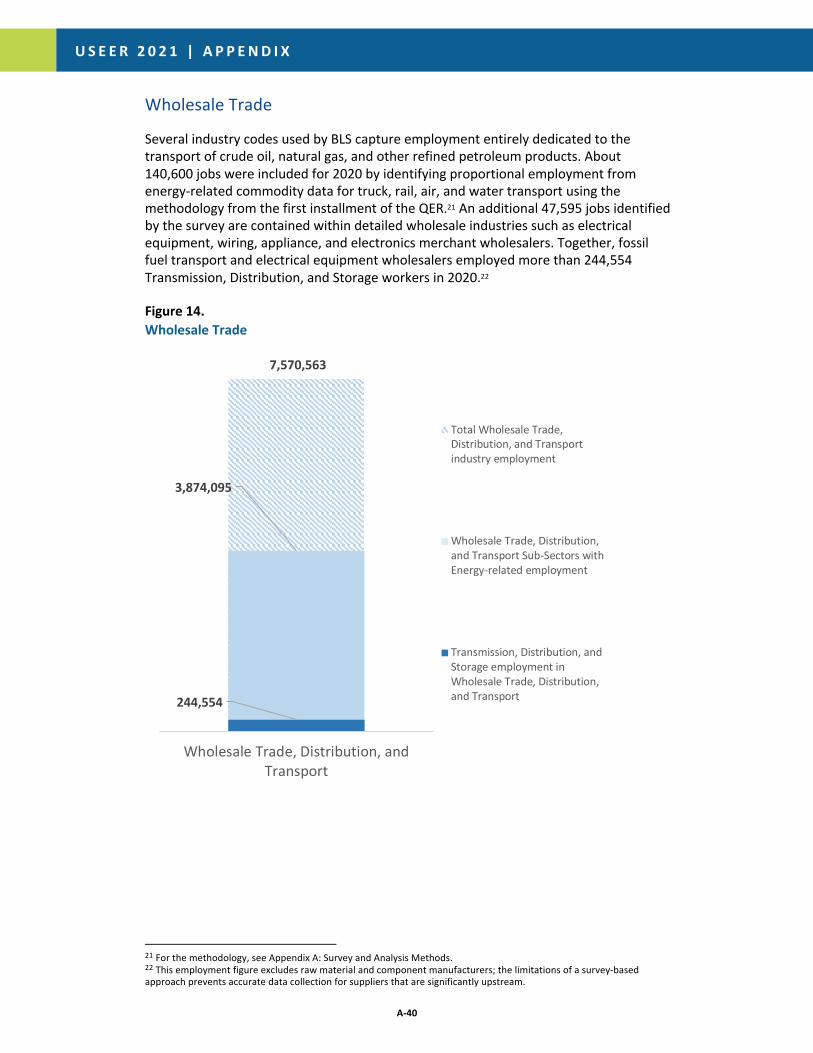
Wholesale Trade
Several industry codes used by BLS capture employment entirely dedicated to the transport of crude oil, natural gas, and other refined petroleum products. About 140,600 jobs were included for 2020 by identifying proportional employment from energy-related commodity data for truck, rail, air, and water transport using the methodology from the first installment of the QER.21 An additional 47,595 jobs identified by the survey are contained within detailed wholesale industries such as electrical equipment, wiring, appliance, and electronics merchant wholesalers. Together, fossil fuel transport and electrical equipment wholesalers employed more than 244,554 Transmission, Distribution, and Storage workers in 2020.22
Figure 14. Wholesale Trade
21 For the methodology, see Appendix A: Survey and Analysis Methods. 22 This employment figure excludes raw material and component manufacturers; the limitations of a survey-based approach prevents accurate data collection for suppliers that are significantly upstream.
7,570,563
3,874,095
244,554
Wholesale Trade, Distribution, andTransport
Total Wholesale Trade,Distribution, and Transportindustry employment
Wholesale Trade, Distribution,and Transport Sub-Sectors withEnergy-related employment
Transmission, Distribution, andStorage employment inWholesale Trade, Distribution,and Transport
A-41
U S E E R 2 0 2 1 | A P P E N D I X
Professional and Business Services
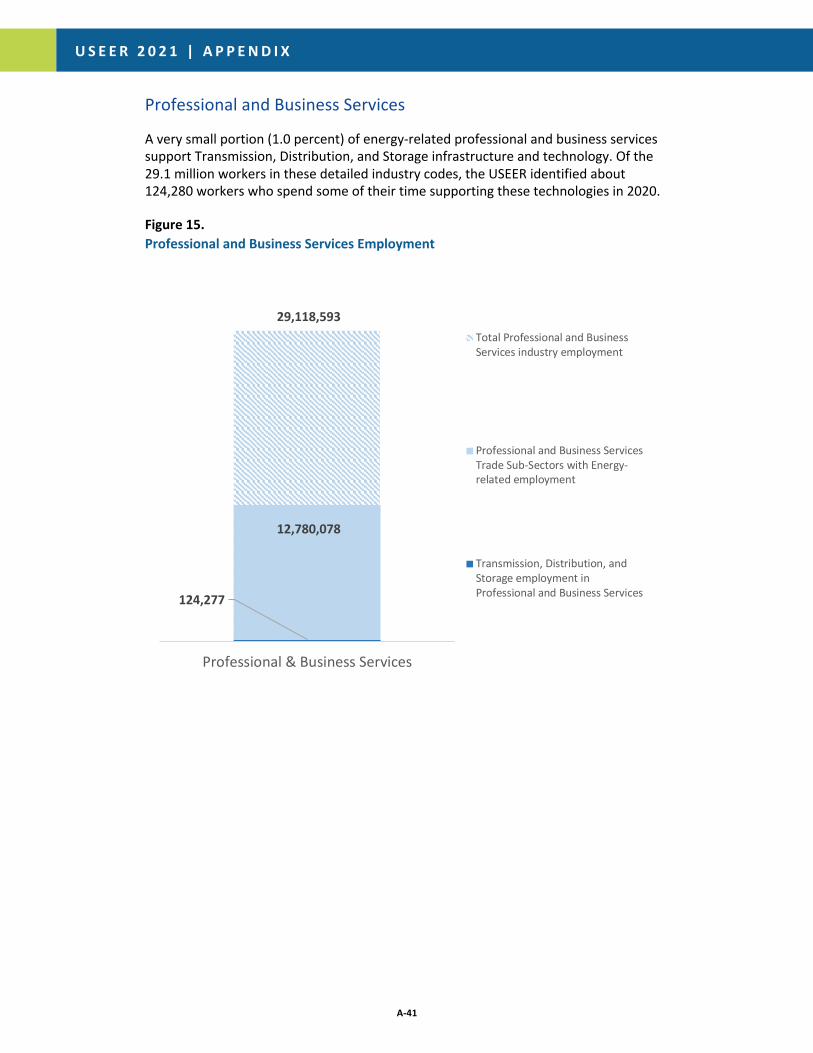
A very small portion (1.0 percent) of energy-related professional and business services support Transmission, Distribution, and Storage infrastructure and technology. Of the 29.1 million workers in these detailed industry codes, the USEER identified about 124,280 workers who spend some of their time supporting these technologies in 2020.
Figure 15. Professional and Business Services Employment
29,118,593
12,780,078
124,277
Professional & Business Services
Total Professional and BusinessServices industry employment
Professional and Business ServicesTrade Sub-Sectors with Energy-related employment
Transmission, Distribution, andStorage employment inProfessional and Business Services
A-42
U S E E R 2 0 2 1 | A P P E N D I X
Appendix F: Energy Efficiency Employment by Industry
Construction
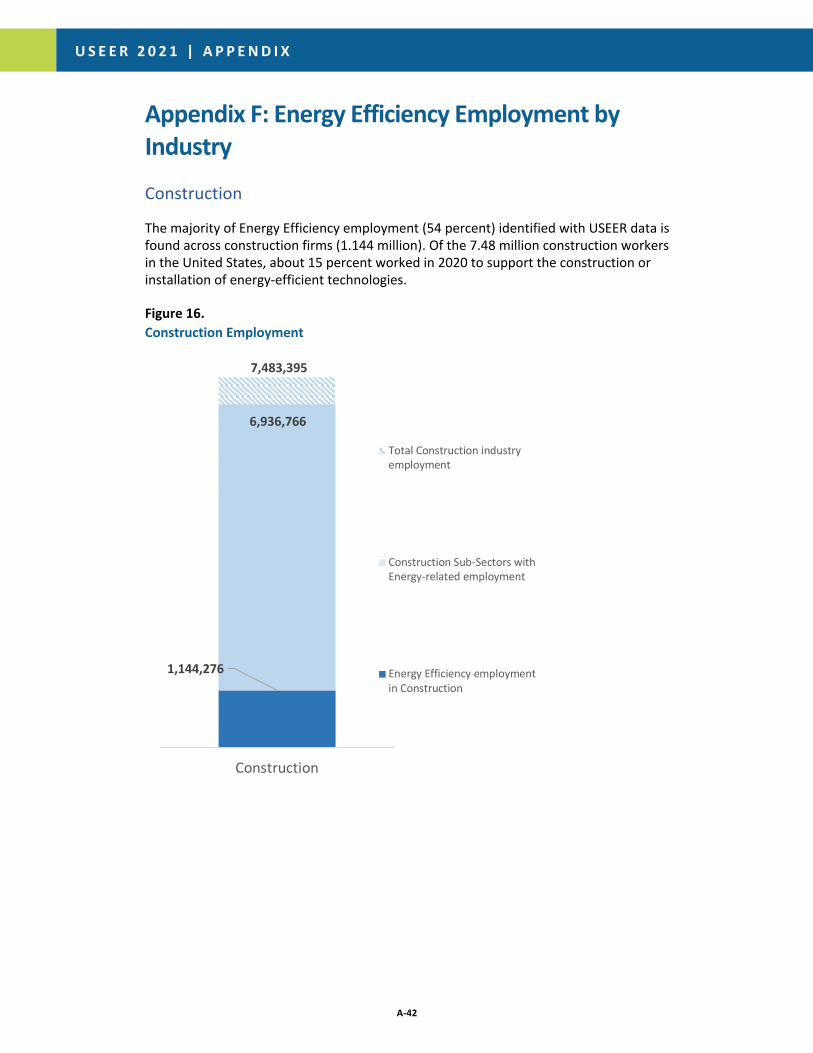
The majority of Energy Efficiency employment (54 percent) identified with USEER data is found across construction firms (1.144 million). Of the 7.48 million construction workers in the United States, about 15 percent worked in 2020 to support the construction or installation of energy-efficient technologies.
Figure 16. Construction Employment
7,483,395
6,936,766
1,144,276
Construction
Total Construction industryemployment
Construction Sub-Sectors withEnergy-related employment
Energy Efficiency employmentin Construction
A-43
U S E E R 2 0 2 1 | A P P E N D I X
Manufacturing
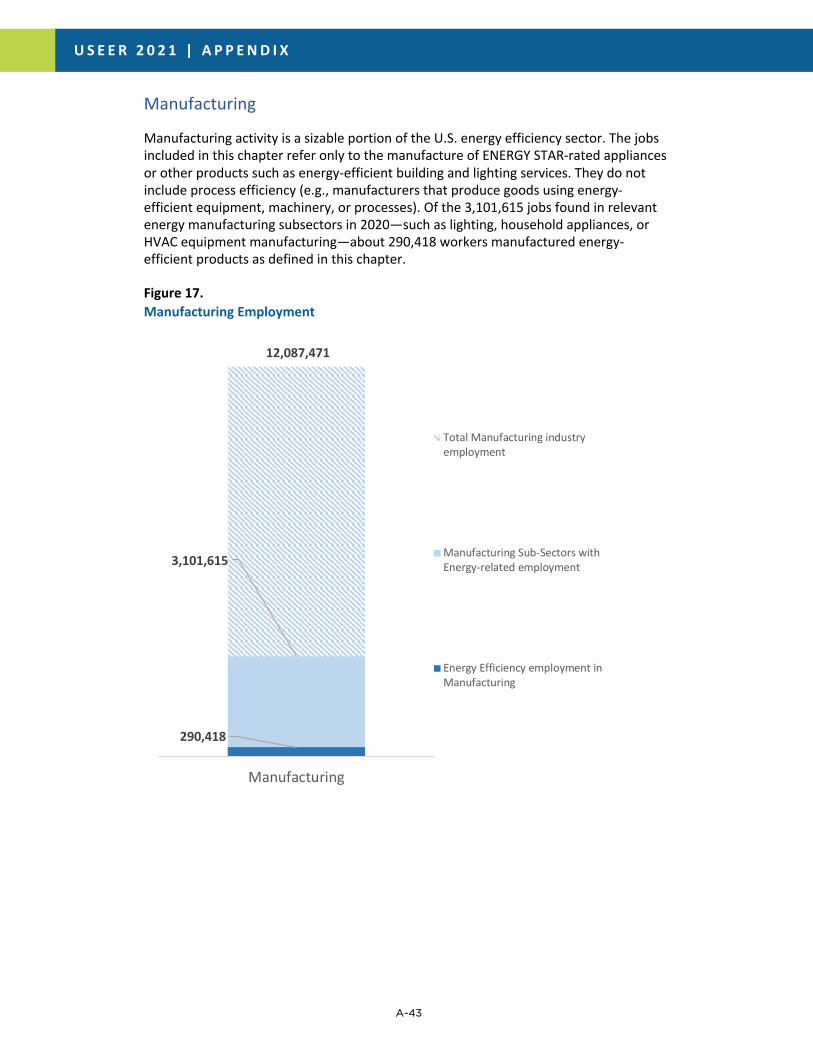
Manufacturing activity is a sizable portion of the U.S. energy efficiency sector. The jobs included in this chapter refer only to the manufacture of ENERGY STAR-rated appliances or other products such as energy-efficient building and lighting services. They do not include process efficiency (e.g., manufacturers that produce goods using energy-efficient equipment, machinery, or processes). Of the 3,101,615 jobs found in relevant energy manufacturing subsectors in 2020—such as lighting, household appliances, or HVAC equipment manufacturing—about 290,418 workers manufactured energy-efficient products as defined in this chapter.
Figure 17. Manufacturing Employment
12,087,471
3,101,615
290,418
Manufacturing
Total Manufacturing industryemployment
Manufacturing Sub-Sectors withEnergy-related employment
Energy Efficiency employment inManufacturing
A-44
U S E E R 2 0 2 1 | A P P E N D I X
Wholesale Trade
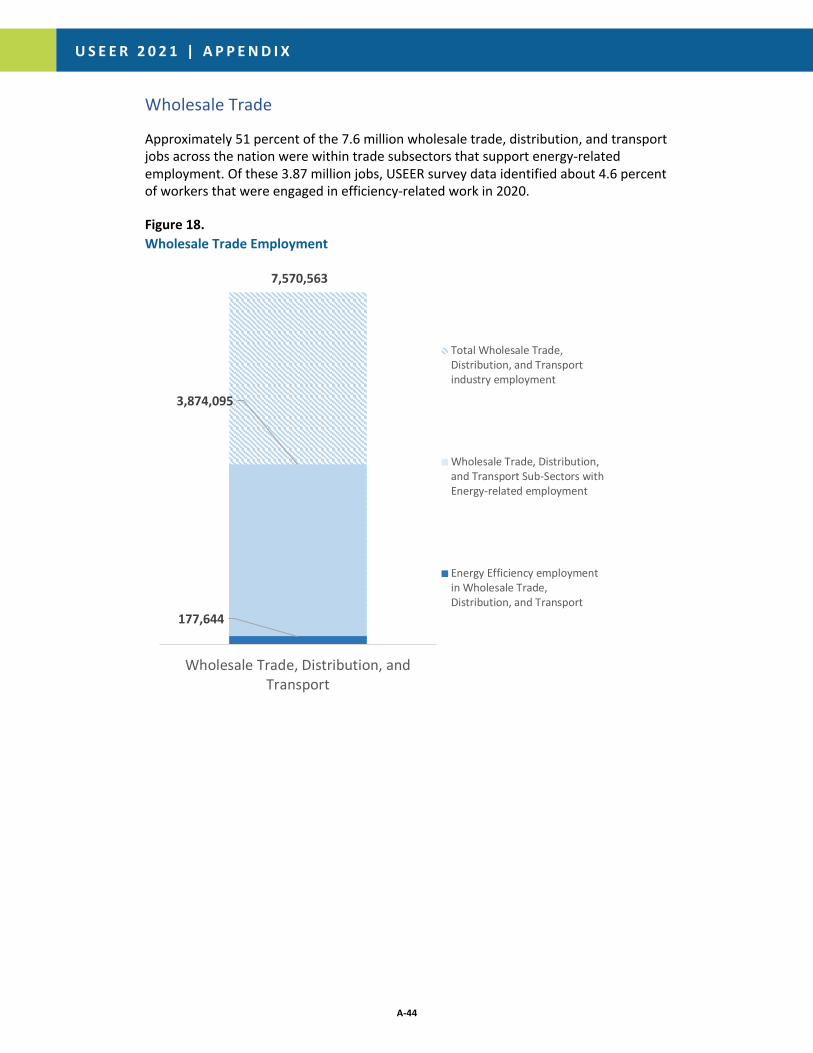
Approximately 51 percent of the 7.6 million wholesale trade, distribution, and transport jobs across the nation were within trade subsectors that support energy-related employment. Of these 3.87 million jobs, USEER survey data identified about 4.6 percent of workers that were engaged in efficiency-related work in 2020.
Figure 18. Wholesale Trade Employment
7,570,563
3,874,095
177,644
Wholesale Trade, Distribution, andTransport
Total Wholesale Trade,Distribution, and Transportindustry employment
Wholesale Trade, Distribution,and Transport Sub-Sectors withEnergy-related employment
Energy Efficiency employmentin Wholesale Trade,Distribution, and Transport
A-45
U S E E R 2 0 2 1 | A P P E N D I X
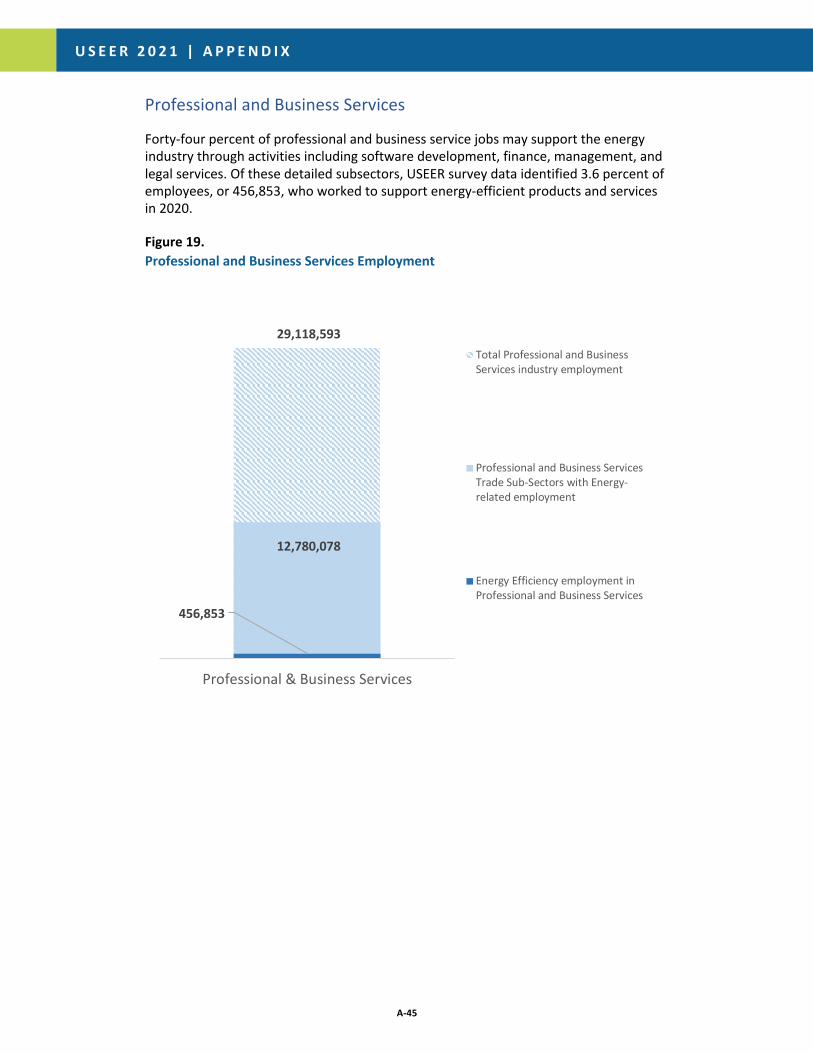
Professional and Business Services
Forty-four percent of professional and business service jobs may support the energy industry through activities including software development, finance, management, and legal services. Of these detailed subsectors, USEER survey data identified 3.6 percent of employees, or 456,853, who worked to support energy-efficient products and services in 2020.
Figure 19. Professional and Business Services Employment
29,118,593
12,780,078
456,853
Professional & Business Services
Total Professional and BusinessServices industry employment
Professional and Business ServicesTrade Sub-Sectors with Energy-related employment
Energy Efficiency employment inProfessional and Business Services
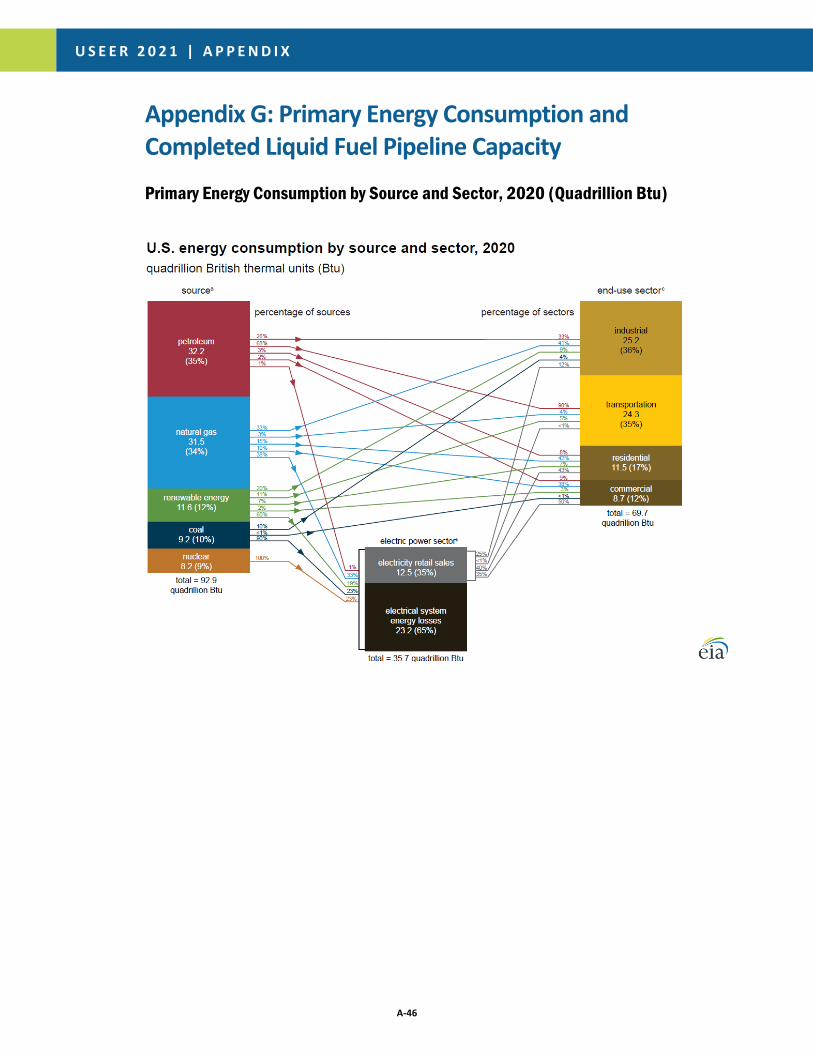
A-46
U S E E R 2 0 2 1 | A P P E N D I X
Appendix G: Primary Energy Consumption and Completed Liquid Fuel Pipeline Capacity
Primary Energy Consumption by Source and Sector, 2020 (Quadrillion Btu)
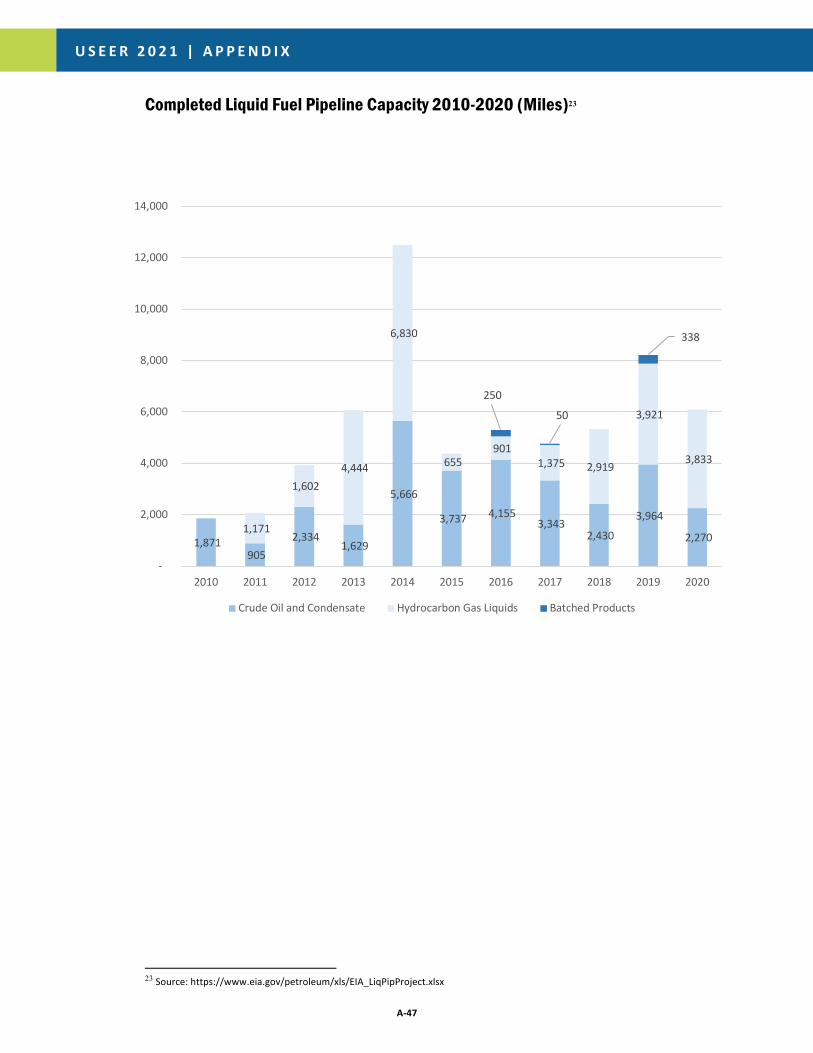
A-47
U S E E R 2 0 2 1 | A P P E N D I X
Completed Liquid Fuel Pipeline Capacity 2010-2020 (Miles)23
23 Source: https://www.eia.gov/petroleum/xls/EIA_LiqPipProject.xlsx
1,871 905
2,334 1,629
5,666
3,737 4,155 3,343
2,430
3,964
2,270 1,171
1,602 4,444
6,830
655 901
1,375 2,919
3,921
3,833
250
50
338
-
2,000
4,000
6,000
8,000
10,000
12,000
14,000
2010 2011 2012 2013 2014 2015 2016 2017 2018 2019 2020
Crude Oil and Condensate Hydrocarbon Gas Liquids Batched Products

A-48
U S E E R 2 0 2 1 | A P P E N D I X
Appendix H: ENERGY STAR® Unit Shipment and Market Penetration Report Calendar Year 2018 Summary
For more details: https://www.energystar.gov/ia/partners/downloads/unit_shipment_data/2018/2018%20Unit%20Shipment%20Data%20Summary%20Report%20.pdf?ff4f-7d06
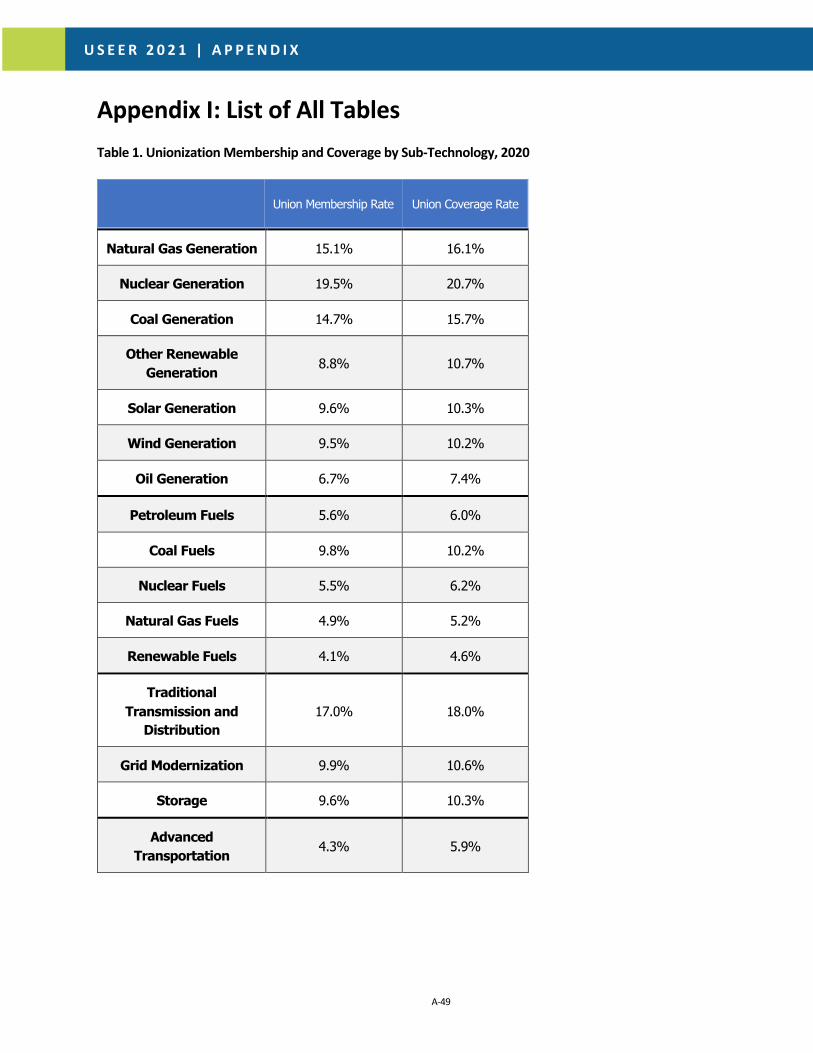
U S E E R 2 0 2 1 | A P P E N D I X
Appendix I: List of All Tables Table 1. Unionization Membership and Coverage by Sub-Technology, 2020
Union Membership Rate Union Coverage Rate
Natural Gas Generation 15.1% 16.1%
Nuclear Generation 19.5% 20.7%
Coal Generation 14.7% 15.7%
Other Renewable Generation 8.8% 10.7%
Solar Generation 9.6% 10.3%
Wind Generation 9.5% 10.2%
Oil Generation 6.7% 7.4%
Petroleum Fuels 5.6% 6.0%
Coal Fuels 9.8% 10.2%
Nuclear Fuels 5.5% 6.2%
Natural Gas Fuels 4.9% 5.2%
Renewable Fuels 4.1% 4.6%
Traditional Transmission and
Distribution 17.0% 18.0%
Grid Modernization 9.9% 10.6%
Storage 9.6% 10.3%
Advanced Transportation 4.3% 5.9%
A-49
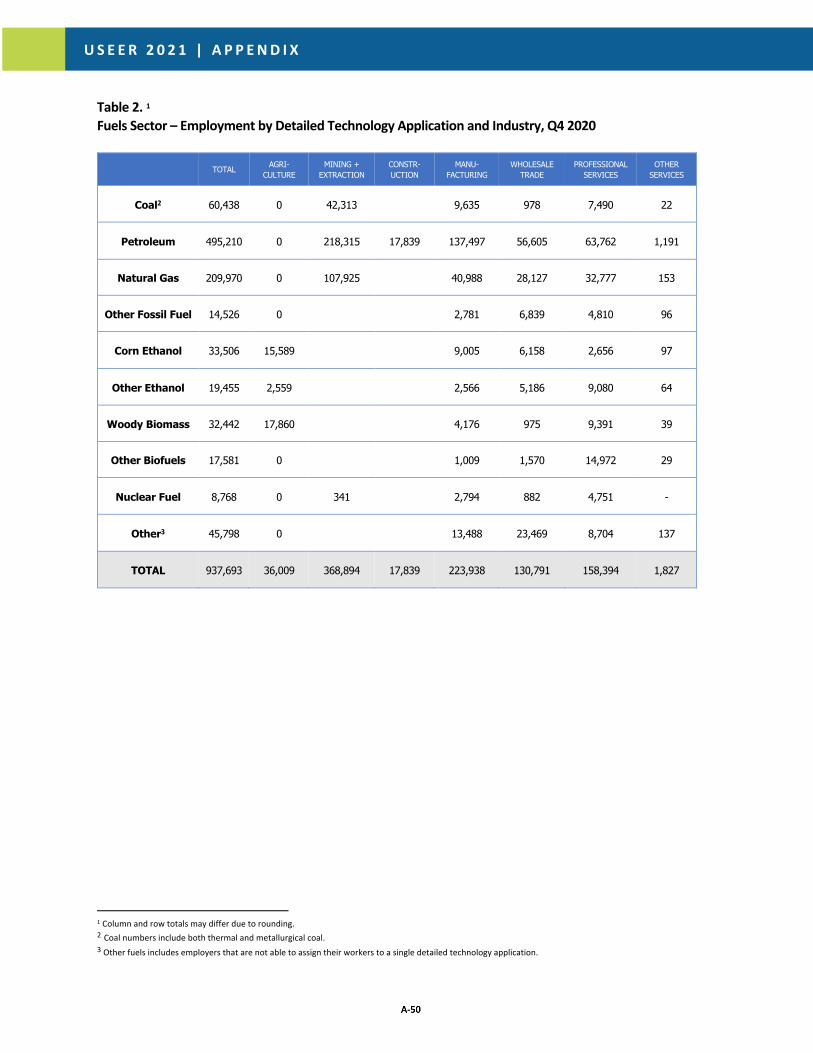
U S E E R 2 0 2 1 | A P P E N D I X
Table 2. 1 Fuels Sector – Employment by Detailed Technology Application and Industry, Q4 2020
TOTAL AGRI-CULTURE
MINING + EXTRACTION
CONSTR-UCTION
MANU-FACTURING
WHOLESALE TRADE
PROFESSIONAL SERVICES
OTHER SERVICES
Coal2 60,438 0 42,313 9,635 978 7,490 22
Petroleum 495,210 0 218,315 17,839 137,497 56,605 63,762 1,191
Natural Gas 209,970 0 107,925 40,988 28,127 32,777 153
Other Fossil Fuel 14,526 0 2,781 6,839 4,810 96
Corn Ethanol 33,506 15,589 9,005 6,158 2,656 97
Other Ethanol 19,455 2,559 2,566 5,186 9,080 64
Woody Biomass 32,442 17,860 4,176 975 9,391 39
Other Biofuels 17,581 0 1,009 1,570 14,972 29
Nuclear Fuel 8,768 0 341 2,794 882 4,751 -
Other3 45,798 0 13,488 23,469 8,704 137
TOTAL 937,693 36,009 368,894 17,839 223,938 130,791 158,394 1,827
1 Column and row totals may differ due to rounding. 2 Coal numbers include both thermal and metallurgical coal. 3 Other fuels includes employers that are not able to assign their workers to a single detailed technology application.
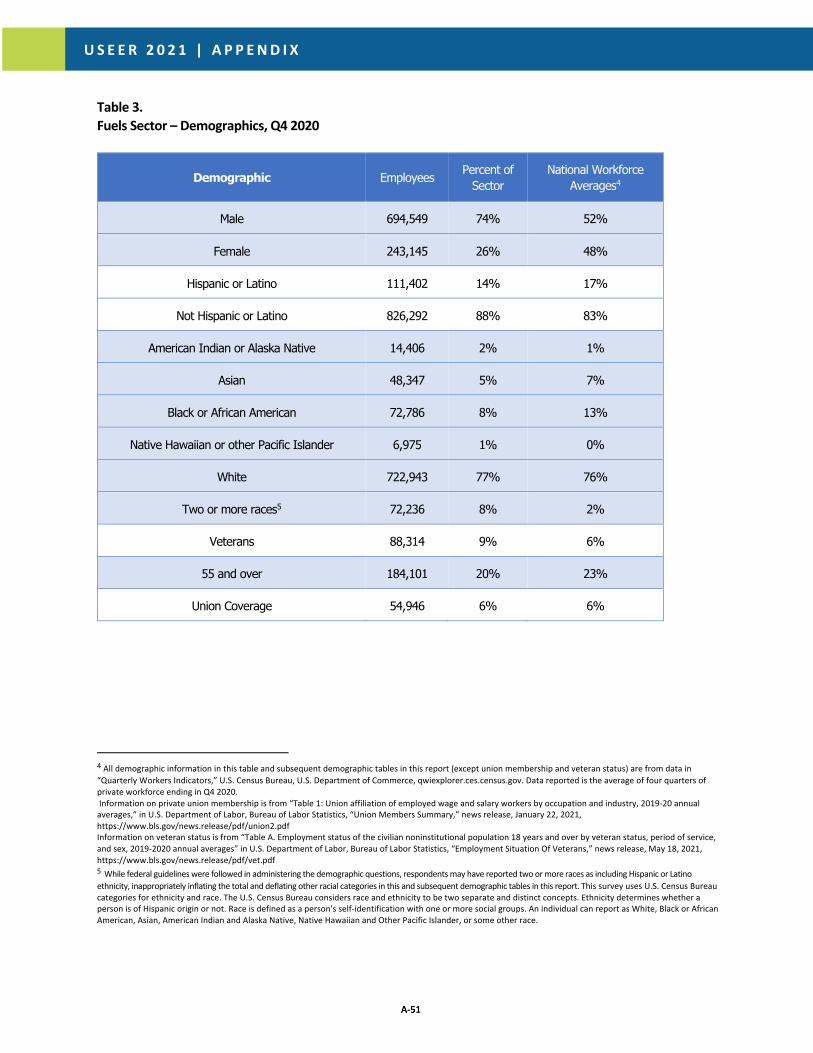
U S E E R 2 0 2 1 | A P P E N D I X
Table 3. Fuels Sector – Demographics, Q4 2020
Demographic Employees Percent of Sector
National Workforce Averages4
Male 694,549 74% 52%
Female 243,145 26% 48%
Hispanic or Latino 111,402 14% 17%
Not Hispanic or Latino 826,292 88% 83%
American Indian or Alaska Native 14,406 2% 1%
Asian 48,347 5% 7%
Black or African American 72,786 8% 13%
Native Hawaiian or other Pacific Islander 6,975 1% 0%
White 722,943 77% 76%
Two or more races5 72,236 8% 2%
Veterans 88,314 9% 6%
55 and over 184,101 20% 23%
Union Coverage 54,946 6% 6%
4 All demographic information in this table and subsequent demographic tables in this report (except union membership and veteran status) are from data in “Quarterly Workers Indicators,” U.S. Census Bureau, U.S. Department of Commerce, qwiexplorer.ces.census.gov. Data reported is the average of four quarters of private workforce ending in Q4 2020. Information on private union membership is from “Table 1: Union affiliation of employed wage and salary workers by occupation and industry, 2019-20 annual averages,” in U.S. Department of Labor, Bureau of Labor Statistics, “Union Members Summary,” news release, January 22, 2021, https://www.bls.gov/news.release/pdf/union2.pdf Information on veteran status is from “Table A. Employment status of the civilian noninstitutional population 18 years and over by veteran status, period of service, and sex, 2019-2020 annual averages” in U.S. Department of Labor, Bureau of Labor Statistics, “Employment Situation Of Veterans,” news release, May 18, 2021, https://www.bls.gov/news.release/pdf/vet.pdf 5 While federal guidelines were followed in administering the demographic questions, respondents may have reported two or more races as including Hispanic or Latino ethnicity, inappropriately inflating the total and deflating other racial categories in this and subsequent demographic tables in this report. This survey uses U.S. Census Bureau categories for ethnicity and race. The U.S. Census Bureau considers race and ethnicity to be two separate and distinct concepts. Ethnicity determines whether a person is of Hispanic origin or not. Race is defined as a person's self-identification with one or more social groups. An individual can report as White, Black or African American, Asian, American Indian and Alaska Native, Native Hawaiian and Other Pacific Islander, or some other race.

U S E E R 2 0 2 1 | A P P E N D I X
Table 4. Petroleum Fuels – Demographics, Q4 2020
Demographic Employees Percent of Sector
National Workforce Averages
Male 371,934 75% 52%
Female 123,276 25% 48%
Hispanic or Latino 63,831 13% 17%
Not Hispanic or Latino 431,379 87% 83%
American Indian or Alaska Native 8,618 2% 1%
Asian 28,086 6% 7%
Black or African American 44,846 9% 13%
Native Hawaiian or other Pacific Islander 4,173 1% 0%
White 372,174 75% 76%
Two or more races 37,314 8% 2%
Veterans 42,227 9% 6%
55 and over 93,595 19% 23%
Union Coverage 29,713 6% 6%
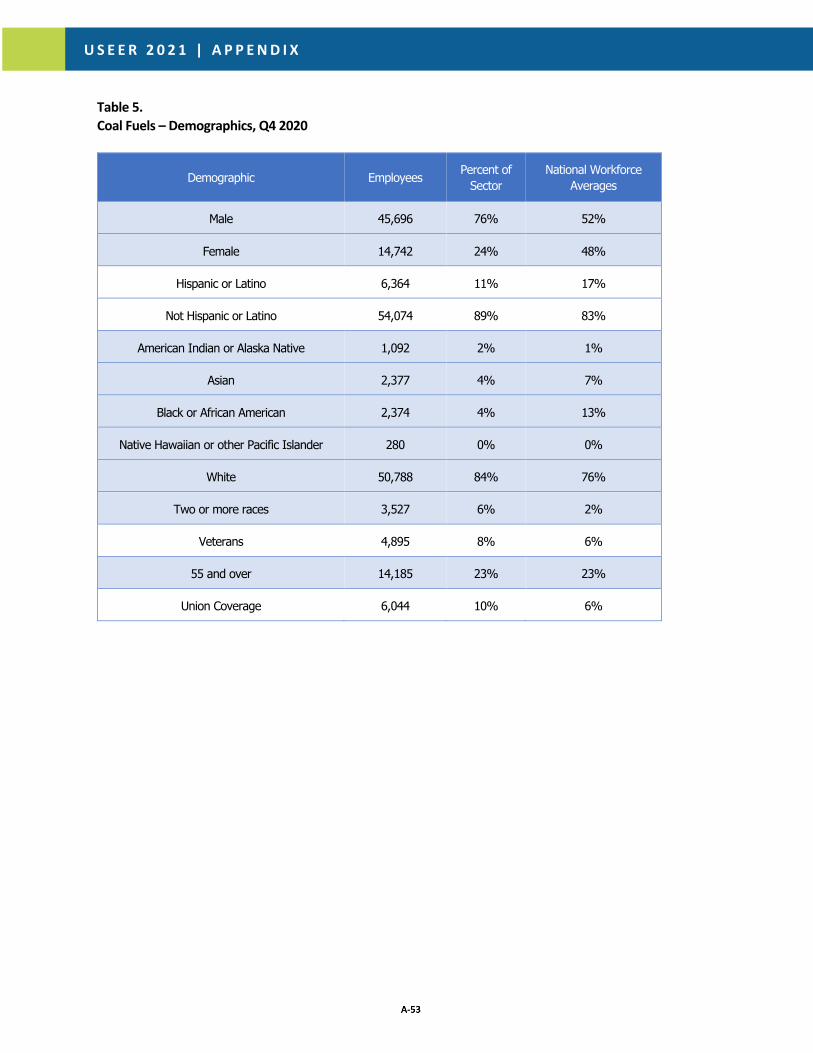
U S E E R 2 0 2 1 | A P P E N D I X
Table 5. Coal Fuels – Demographics, Q4 2020
Demographic Employees Percent of Sector
National Workforce Averages
Male 45,696 76% 52%
Female 14,742 24% 48%
Hispanic or Latino 6,364 11% 17%
Not Hispanic or Latino 54,074 89% 83%
American Indian or Alaska Native 1,092 2% 1%
Asian 2,377 4% 7%
Black or African American 2,374 4% 13%
Native Hawaiian or other Pacific Islander 280 0% 0%
White 50,788 84% 76%
Two or more races 3,527 6% 2%
Veterans 4,895 8% 6%
55 and over 14,185 23% 23%
Union Coverage 6,044 10% 6%

U S E E R 2 0 2 1 | A P P E N D I X
Table 6. Natural Gas Fuels – Demographics, Q4 2020
Demographic Employees Percent of Sector
National Workforce Averages
Male 153,724 73% 52%
Female 56,246 27% 48%
Hispanic or Latino 24,438 12% 17%
Not Hispanic or Latino 185,532 88% 83%
American Indian or Alaska Native 3,157 2% 1%
Asian 8,617 4% 7%
Black or African American 16,904 8% 13%
Native Hawaiian or other Pacific Islander 1,091 1% 0%
White 157,649 75% 76%
Two or more races 22,552 11% 2%
Veterans 16,728 8% 6%
55 and over 41,740 20% 23%
Union Coverage 10,499 5% 6%

U S E E R 2 0 2 1 | A P P E N D I X
Table 7. Nuclear Fuels – Demographics, Q4 2020
Demographic Employees Percent of Sector
National Workforce Averages
Male 6,195 71% 52%
Female 2,573 29% 48%
Hispanic or Latino 1,218 14% 17%
Not Hispanic or Latino 7,550 86% 83%
American Indian or Alaska Native 85 1% 1%
Asian 714 8% 7%
Black or African American 548 6% 13%
Native Hawaiian or other Pacific Islander
73 1% 0%
White 6,177 70% 76%
Two or more races 1,171 13% 2%
Veterans 799 9% 6%
55 and over 1,292 15% 23%
Union Coverage 526 6% 6%
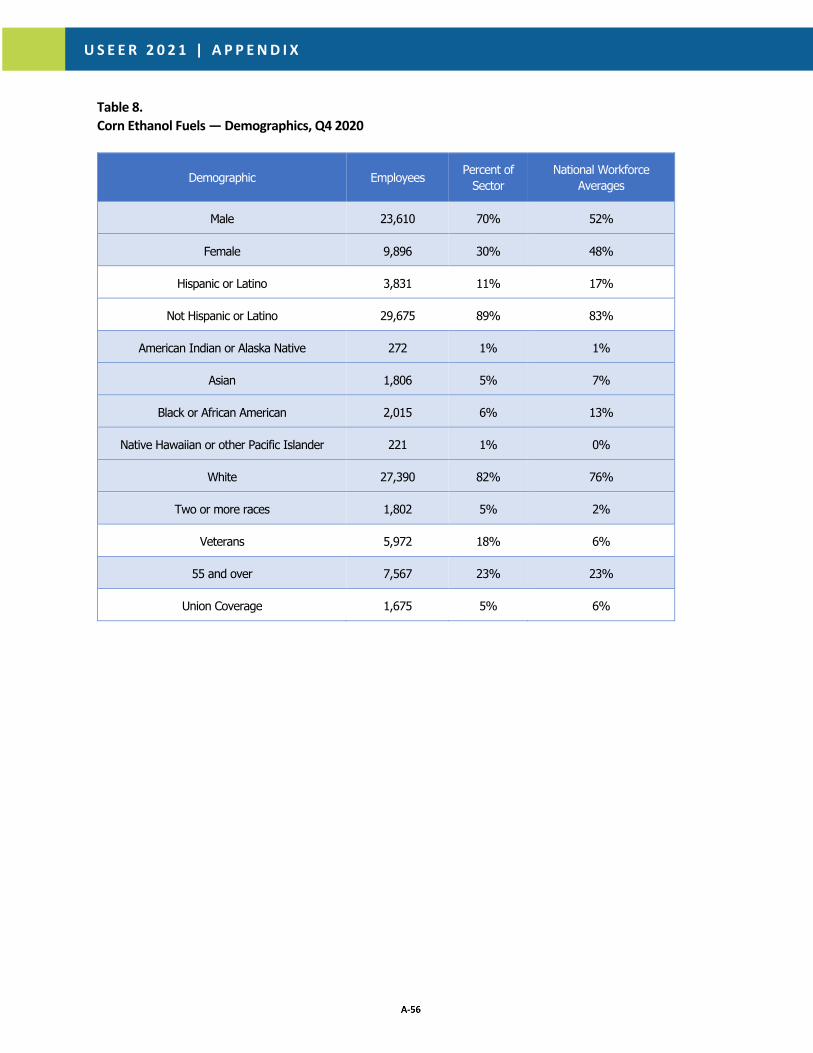
U S E E R 2 0 2 1 | A P P E N D I X
Table 8. Corn Ethanol Fuels — Demographics, Q4 2020
Demographic Employees Percent of Sector
National Workforce Averages
Male 23,610 70% 52%
Female 9,896 30% 48%
Hispanic or Latino 3,831 11% 17%
Not Hispanic or Latino 29,675 89% 83%
American Indian or Alaska Native 272 1% 1%
Asian 1,806 5% 7%
Black or African American 2,015 6% 13%
Native Hawaiian or other Pacific Islander 221 1% 0%
White 27,390 82% 76%
Two or more races 1,802 5% 2%
Veterans 5,972 18% 6%
55 and over 7,567 23% 23%
Union Coverage 1,675 5% 6%
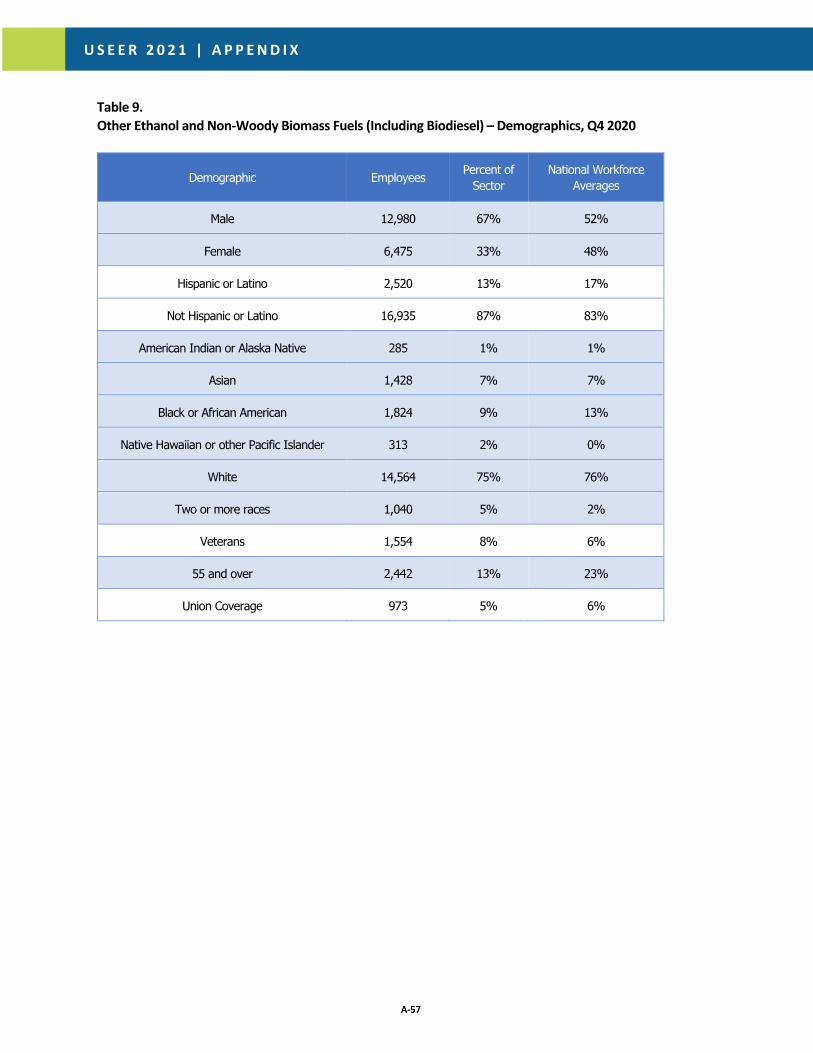
U S E E R 2 0 2 1 | A P P E N D I X
Table 9. Other Ethanol and Non-Woody Biomass Fuels (Including Biodiesel) – Demographics, Q4 2020
Demographic Employees Percent of Sector
National Workforce Averages
Male 12,980 67% 52%
Female 6,475 33% 48%
Hispanic or Latino 2,520 13% 17%
Not Hispanic or Latino 16,935 87% 83%
American Indian or Alaska Native 285 1% 1%
Asian 1,428 7% 7%
Black or African American 1,824 9% 13%
Native Hawaiian or other Pacific Islander 313 2% 0%
White 14,564 75% 76%
Two or more races 1,040 5% 2%
Veterans 1,554 8% 6%
55 and over 2,442 13% 23%
Union Coverage 973 5% 6%

U S E E R 2 0 2 1 | A P P E N D I X
Table 10. Woody Biomass Fuel for Energy and Cellulosic Biofuel – Demographics, Q4 2020
Demographic Employees Percent of Sector
National Workforce Averages
Male 23,322 72% 52%
Female 9,120 28% 48%
Hispanic or Latino 2,056 6% 17%
Not Hispanic or Latino 30,386 94% 83%
American Indian or Alaska Native 273 1% 1%
Asian 1,557 5% 7%
Black or African American 1,246 4% 13%
Native Hawaiian or other Pacific Islander 263 1% 0%
White 27,540 85% 76%
Two or more races 1,562 5% 2%
Veterans 4,713 15% 6%
55 and over 6,645 20% 23%
Union Coverage 1,622 5% 6%
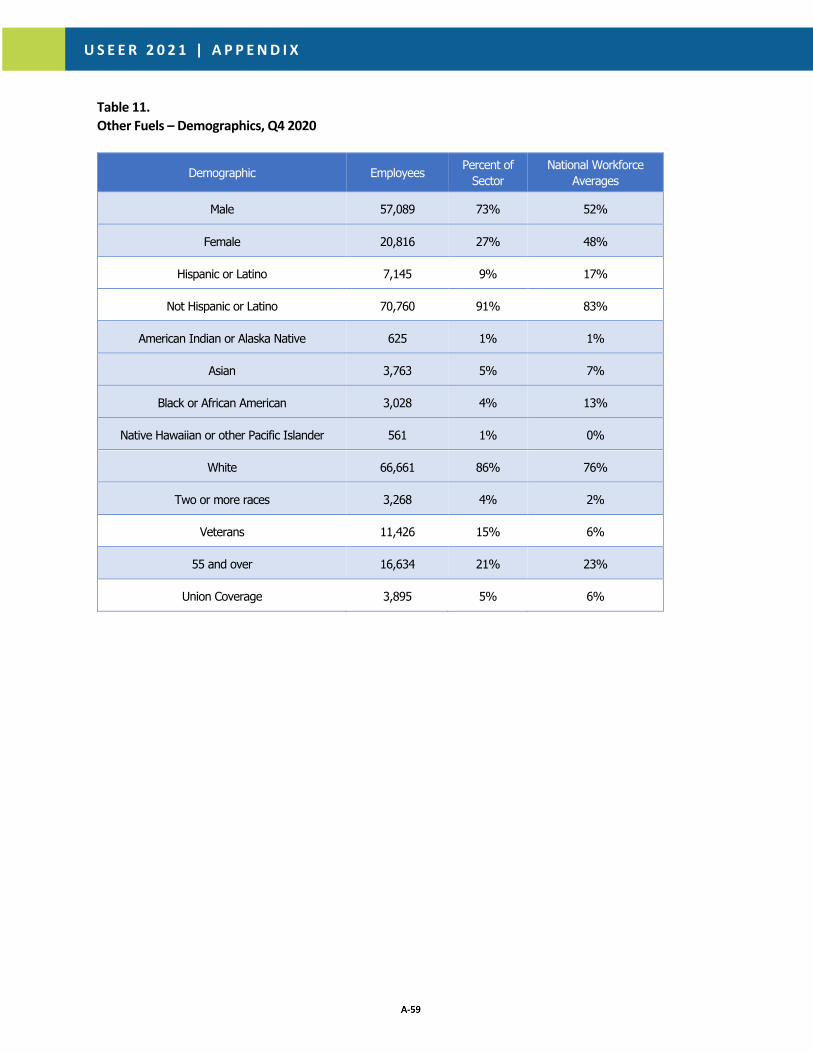
U S E E R 2 0 2 1 | A P P E N D I X
Table 11. Other Fuels – Demographics, Q4 2020
Demographic Employees Percent of Sector
National Workforce Averages
Male 57,089 73% 52%
Female 20,816 27% 48%
Hispanic or Latino 7,145 9% 17%
Not Hispanic or Latino 70,760 91% 83%
American Indian or Alaska Native 625 1% 1%
Asian 3,763 5% 7%
Black or African American 3,028 4% 13%
Native Hawaiian or other Pacific Islander 561 1% 0%
White 66,661 86% 76%
Two or more races 3,268 4% 2%
Veterans 11,426 15% 6%
55 and over 16,634 21% 23%
Union Coverage 3,895 5% 6%
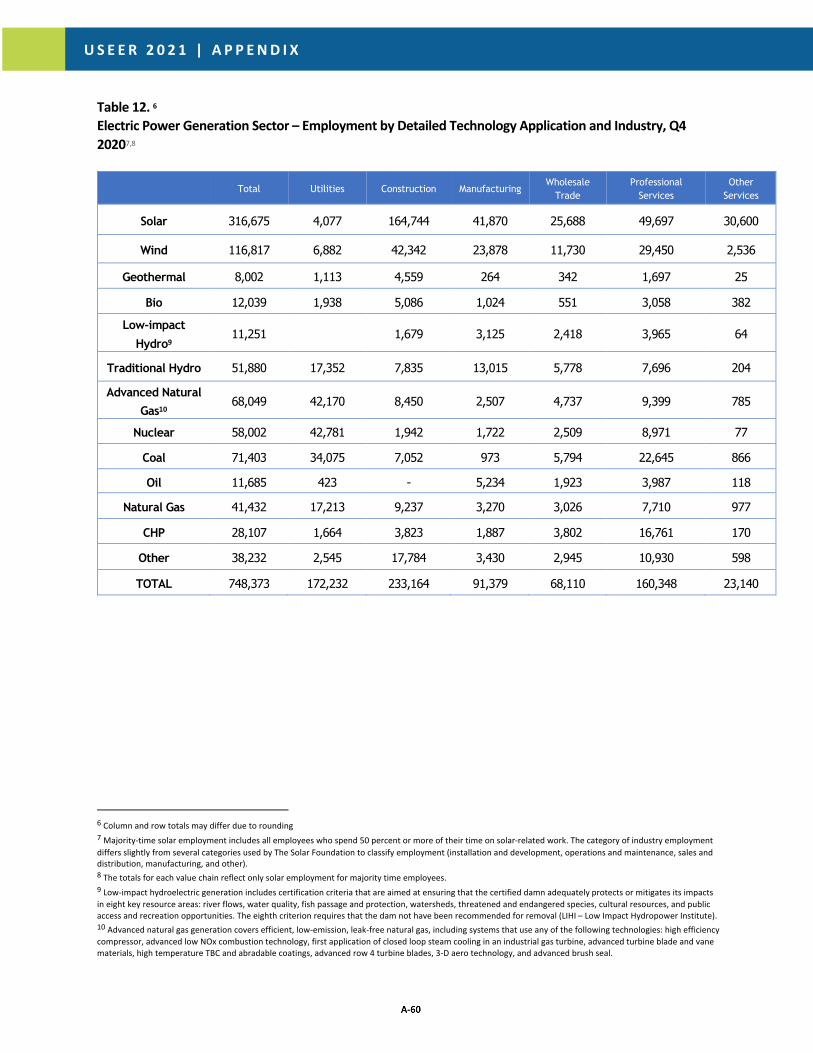
U S E E R 2 0 2 1 | A P P E N D I X
Table 12. 6 Electric Power Generation Sector – Employment by Detailed Technology Application and Industry, Q4 20207,8
Total Utilities Construction Manufacturing Wholesale
Trade Professional
Services Other
Services
Solar 316,675 4,077 164,744 41,870 25,688 49,697 30,600
Wind 116,817 6,882 42,342 23,878 11,730 29,450 2,536
Geothermal 8,002 1,113 4,559 264 342 1,697 25
Bio 12,039 1,938 5,086 1,024 551 3,058 382
Low-impact Hydro9
11,251 1,679 3,125 2,418 3,965 64
Traditional Hydro 51,880 17,352 7,835 13,015 5,778 7,696 204
Advanced Natural Gas10
68,049 42,170 8,450 2,507 4,737 9,399 785
Nuclear 58,002 42,781 1,942 1,722 2,509 8,971 77
Coal 71,403 34,075 7,052 973 5,794 22,645 866
Oil 11,685 423 - 5,234 1,923 3,987 118
Natural Gas 41,432 17,213 9,237 3,270 3,026 7,710 977
CHP 28,107 1,664 3,823 1,887 3,802 16,761 170
Other 38,232 2,545 17,784 3,430 2,945 10,930 598
TOTAL 748,373 172,232 233,164 91,379 68,110 160,348 23,140
6 Column and row totals may differ due to rounding 7 Majority-time solar employment includes all employees who spend 50 percent or more of their time on solar-related work. The category of industry employment differs slightly from several categories used by The Solar Foundation to classify employment (installation and development, operations and maintenance, sales and distribution, manufacturing, and other). 8 The totals for each value chain reflect only solar employment for majority time employees. 9 Low-impact hydroelectric generation includes certification criteria that are aimed at ensuring that the certified damn adequately protects or mitigates its impacts in eight key resource areas: river flows, water quality, fish passage and protection, watersheds, threatened and endangered species, cultural resources, and public access and recreation opportunities. The eighth criterion requires that the dam not have been recommended for removal (LIHI – Low Impact Hydropower Institute). 10 Advanced natural gas generation covers efficient, low-emission, leak-free natural gas, including systems that use any of the following technologies: high efficiency compressor, advanced low NOx combustion technology, first application of closed loop steam cooling in an industrial gas turbine, advanced turbine blade and vane materials, high temperature TBC and abradable coatings, advanced row 4 turbine blades, 3-D aero technology, and advanced brush seal.
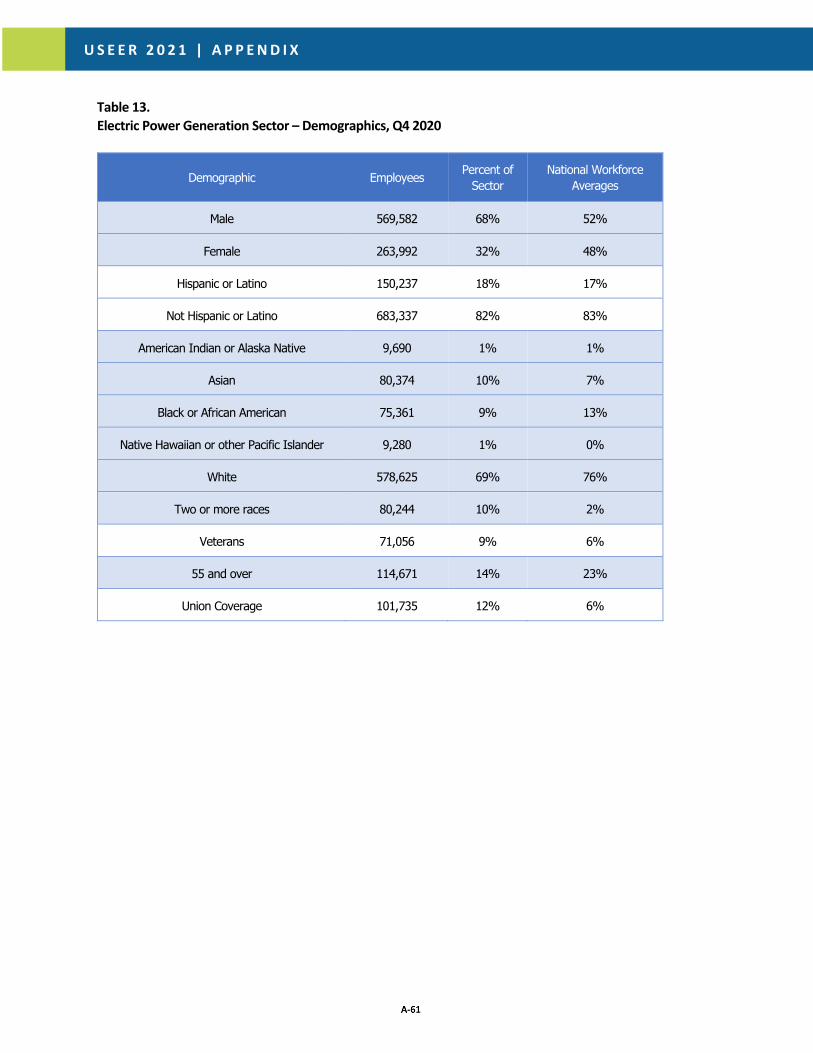
U S E E R 2 0 2 1 | A P P E N D I X
Table 13. Electric Power Generation Sector – Demographics, Q4 2020
Demographic Employees Percent of Sector
National Workforce Averages
Male 569,582 68% 52%
Female 263,992 32% 48%
Hispanic or Latino 150,237 18% 17%
Not Hispanic or Latino 683,337 82% 83%
American Indian or Alaska Native 9,690 1% 1%
Asian 80,374 10% 7%
Black or African American 75,361 9% 13%
Native Hawaiian or other Pacific Islander 9,280 1% 0%
White 578,625 69% 76%
Two or more races 80,244 10% 2%
Veterans 71,056 9% 6%
55 and over 114,671 14% 23%
Union Coverage 101,735 12% 6%
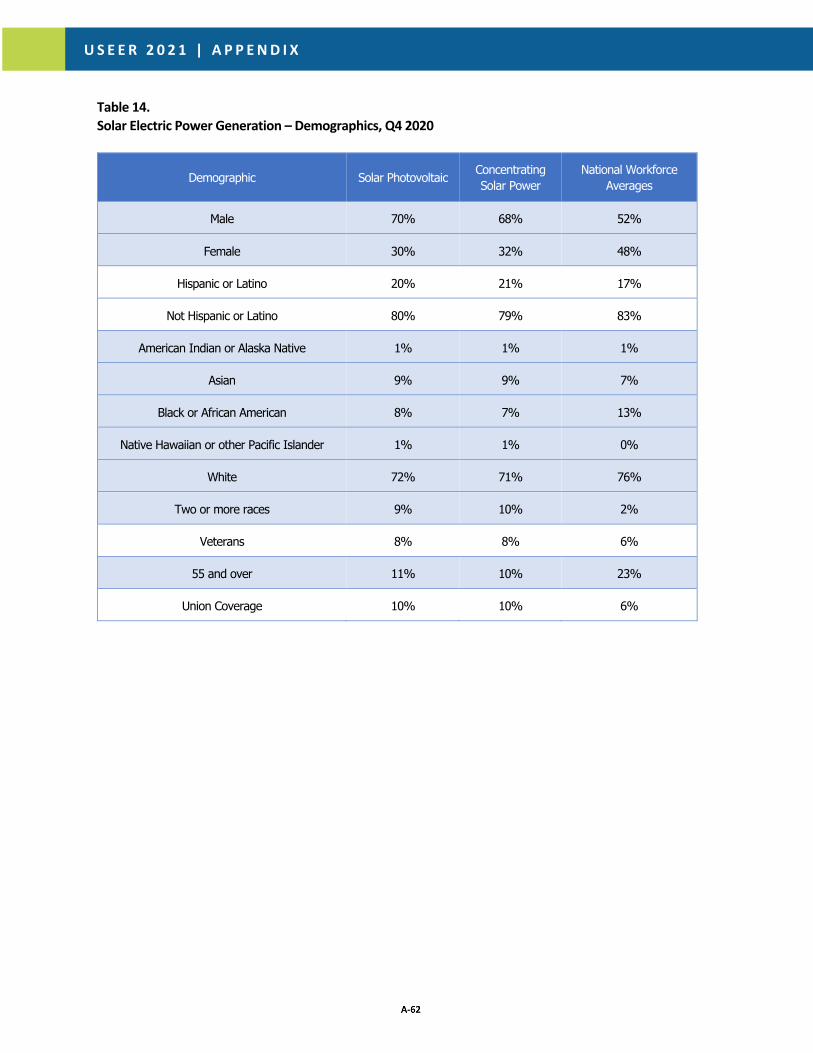
U S E E R 2 0 2 1 | A P P E N D I X
Table 14. Solar Electric Power Generation – Demographics, Q4 2020
Demographic Solar Photovoltaic Concentrating Solar Power
National Workforce Averages
Male 70% 68% 52%
Female 30% 32% 48%
Hispanic or Latino 20% 21% 17%
Not Hispanic or Latino 80% 79% 83%
American Indian or Alaska Native 1% 1% 1%
Asian 9% 9% 7%
Black or African American 8% 7% 13%
Native Hawaiian or other Pacific Islander 1% 1% 0%
White 72% 71% 76%
Two or more races 9% 10% 2%
Veterans 8% 8% 6%
55 and over 11% 10% 23%
Union Coverage 10% 10% 6%
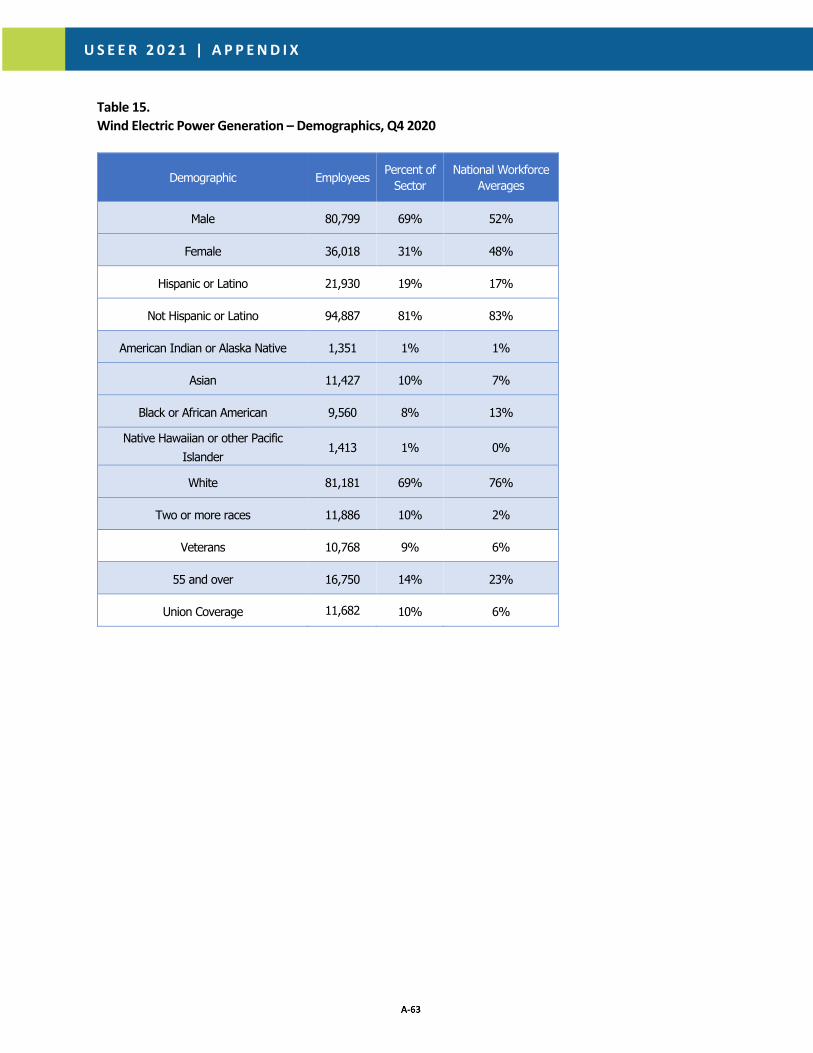
U S E E R 2 0 2 1 | A P P E N D I X
Table 15. Wind Electric Power Generation – Demographics, Q4 2020
Demographic Employees Percent of Sector
National Workforce Averages
Male 80,799 69% 52%
Female 36,018 31% 48%
Hispanic or Latino 21,930 19% 17%
Not Hispanic or Latino 94,887 81% 83%
American Indian or Alaska Native 1,351 1% 1%
Asian 11,427 10% 7%
Black or African American 9,560 8% 13%
Native Hawaiian or other Pacific Islander
1,413 1% 0%
White 81,181 69% 76%
Two or more races 11,886 10% 2%
Veterans 10,768 9% 6%
55 and over 16,750 14% 23%
Union Coverage 11,682 10% 6%
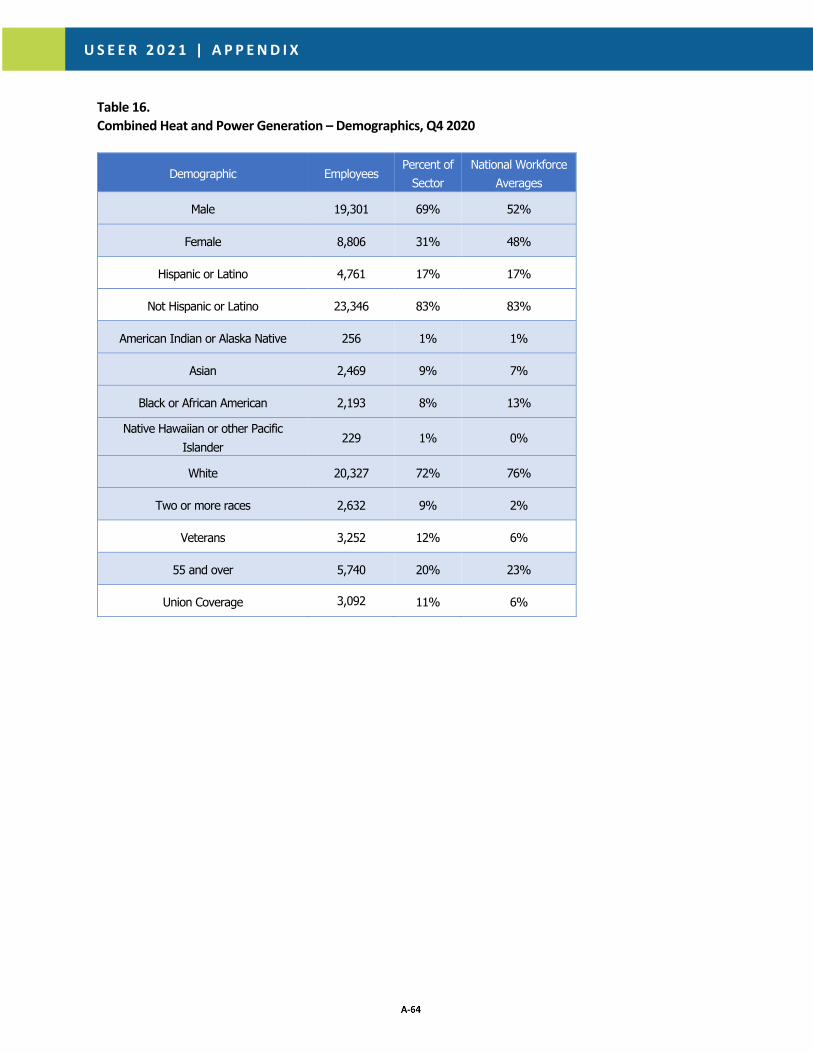
U S E E R 2 0 2 1 | A P P E N D I X
Table 16. Combined Heat and Power Generation – Demographics, Q4 2020
Demographic Employees Percent of
Sector National Workforce
Averages
Male 19,301 69% 52%
Female 8,806 31% 48%
Hispanic or Latino 4,761 17% 17%
Not Hispanic or Latino 23,346 83% 83%
American Indian or Alaska Native 256 1% 1%
Asian 2,469 9% 7%
Black or African American 2,193 8% 13%
Native Hawaiian or other Pacific Islander
229 1% 0%
White 20,327 72% 76%
Two or more races 2,632 9% 2%
Veterans 3,252 12% 6%
55 and over 5,740 20% 23%
Union Coverage 3,092 11% 6%
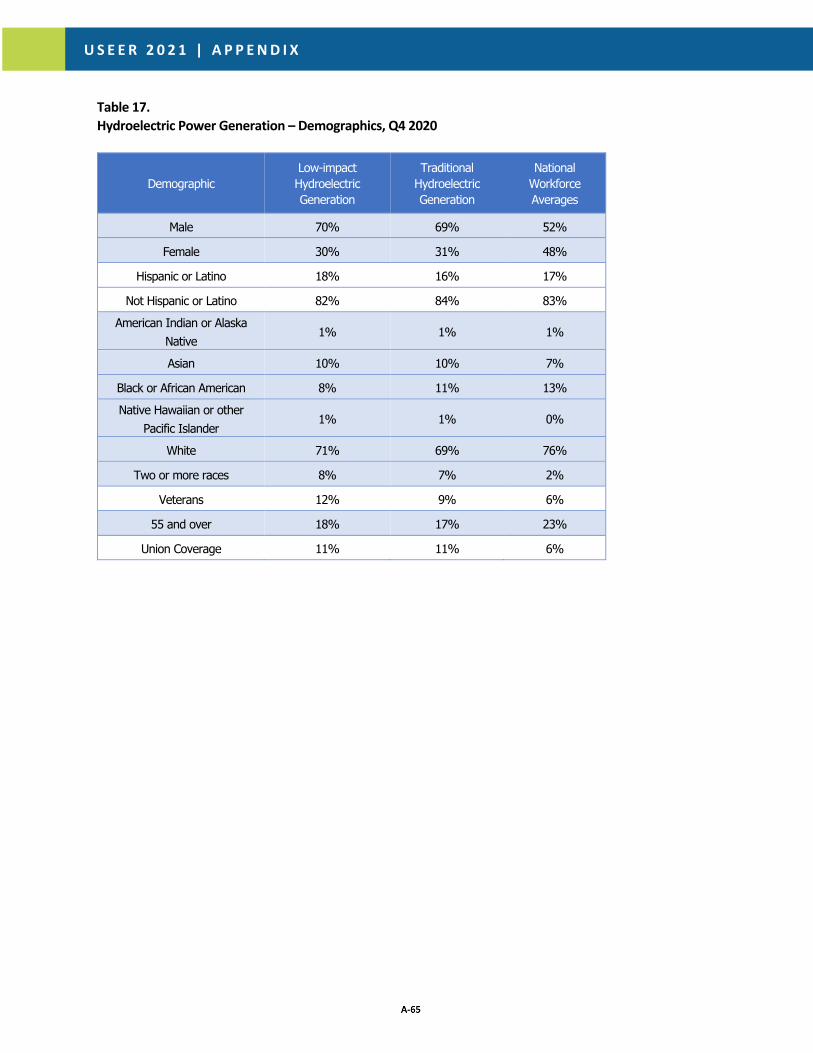
U S E E R 2 0 2 1 | A P P E N D I X
Table 17. Hydroelectric Power Generation – Demographics, Q4 2020
Demographic Low-impact Hydroelectric Generation
Traditional Hydroelectric Generation
National Workforce Averages
Male 70% 69% 52%
Female 30% 31% 48%
Hispanic or Latino 18% 16% 17%
Not Hispanic or Latino 82% 84% 83% American Indian or Alaska
Native 1% 1% 1%
Asian 10% 10% 7%
Black or African American 8% 11% 13% Native Hawaiian or other
Pacific Islander 1% 1% 0%
White 71% 69% 76%
Two or more races 8% 7% 2%
Veterans 12% 9% 6%
55 and over 18% 17% 23%
Union Coverage 11% 11% 6%

U S E E R 2 0 2 1 | A P P E N D I X
Table 18. Coal Electric Power Generation – Demographics, Q4 2020
Demographic Employees Percent of Sector
National Workforce Averages
Male 47,538 67% 52%
Female 23,865 33% 48%
Hispanic or Latino 9,648 14% 17%
Not Hispanic or Latino 61,755 86% 83%
American Indian or Alaska Native 740 1% 1%
Asian 6,972 10% 7%
Black or African American 8,041 11% 13%
Native Hawaiian or other Pacific Islander
555 1% 0%
White 50,390 71% 76%
Two or more races 4,705 7% 2%
Veterans 5,286 7% 6%
55 and over 12,401 17% 23%
Union Coverage 11,424 16% 6%

U S E E R 2 0 2 1 | A P P E N D I X
Table 19. Natural Gas Electric Power Generation – Demographics, Q4 2020
Demographic Employees Percent of Sector
National Workforce Averages
Male 69,789 64% 52%
Female 39,692 36% 48%
Hispanic or Latino 20,308 19% 17%
Not Hispanic or Latino 89,173 81% 83%
American Indian or Alaska Native 1,302 1% 1%
Asian 10,725 10% 7%
Black or African American 10,877 10% 13%
Native Hawaiian or other Pacific Islander
1,008 1% 0%
White 68,325 62% 76%
Two or more races 17,245 16% 2%
Veterans 9,395 9% 6%
55 and over 15,723 14% 23%
Union Coverage 17,517 16% 6%

U S E E R 2 0 2 1 | A P P E N D I X
Table 20. Nuclear Electric Power Generation – Demographics, Q4 2020
Demographic Employees Percent of Sector
National Workforce Averages
Male 38,099 66% 52%
Female 19,903 34% 48%
Hispanic or Latino 8,118 14% 17%
Not Hispanic or Latino 49,884 86% 83%
American Indian or Alaska Native 648 1% 1%
Asian 5,860 10% 7%
Black or African American 7,260 13% 13%
Native Hawaiian or other Pacific Islander 447 1% 0%
White 38,489 66% 76%
Two or more races 5,298 9% 2%
Veterans 3,552 6% 6%
55 and over 8,518 15% 23%
Union Coverage 12,180 21% 6%

U S E E R 2 0 2 1 | A P P E N D I X
Table 21. Oil Electric Power Generation – Demographics, Q4 2020
Demographic Employees Percent of Sector
National Workforce Averages
Male 8,376 72% 52%
Female 3,309 28% 48%
Hispanic or Latino 2,046 18% 17%
Not Hispanic or Latino 9,639 82% 83%
American Indian or Alaska Native 137 1% 1%
Asian 1,163 10% 7%
Black or African American 970 8% 13%
Native Hawaiian or other Pacific Islander 124 1% 0%
White 8,299 71% 76%
Two or more races 993 8% 2%
Veterans 1,017 9% 6%
55 and over 1,807 15% 23%
Union Coverage 818 7% 6%

U S E E R 2 0 2 1 | A P P E N D I X
Table 22. Biomass Electric Power Generation – Demographics, Q4 2020
Demographic Employees Percent of Sector
National Workforce Averages
Male 8,331 69% 52%
Female 3,708 31% 48%
Hispanic or Latino 1,874 16% 17%
Not Hispanic or Latino 10,165 84% 83%
American Indian or Alaska Native 144 1% 1%
Asian 1,155 10% 7%
Black or African American 1,307 11% 13%
Native Hawaiian or other Pacific Islander 134 1% 0%
White 8,528 71% 76%
Two or more races 770 6% 2%
Veterans 1,424 12% 6%
55 and over 2,654 22% 23%
Union Coverage 1,324 11% 6%
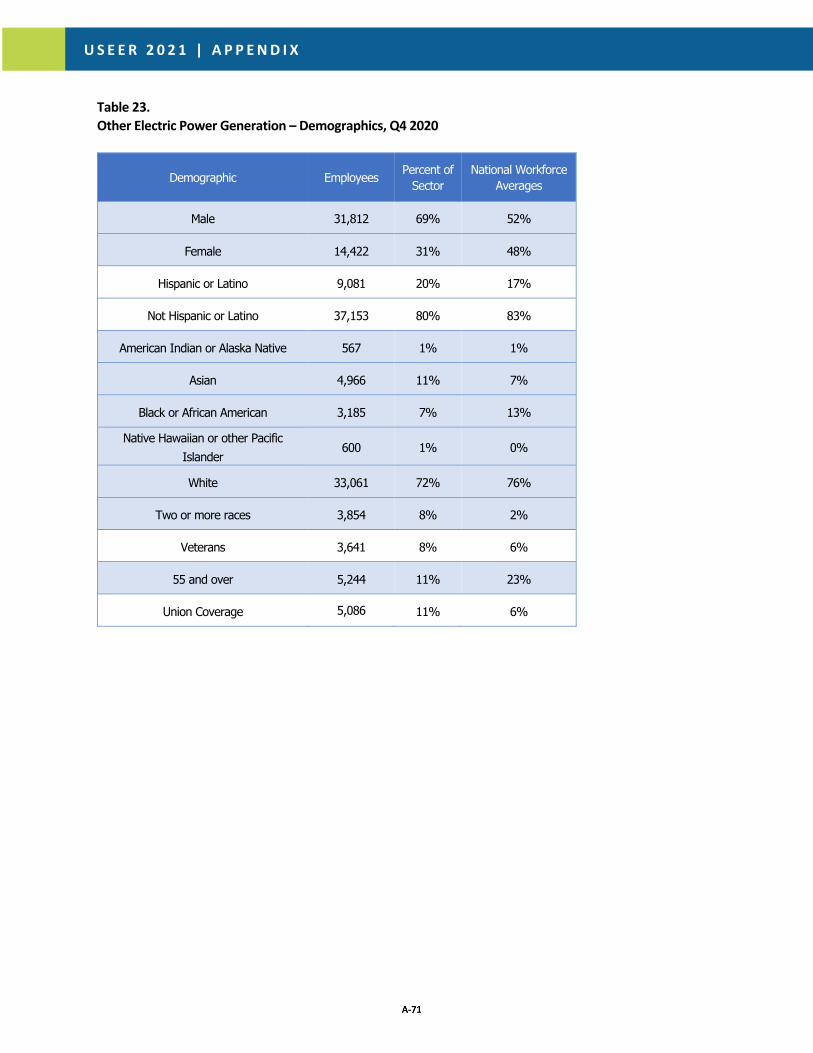
U S E E R 2 0 2 1 | A P P E N D I X
Table 23. Other Electric Power Generation – Demographics, Q4 2020
Demographic Employees Percent of Sector
National Workforce Averages
Male 31,812 69% 52%
Female 14,422 31% 48%
Hispanic or Latino 9,081 20% 17%
Not Hispanic or Latino 37,153 80% 83%
American Indian or Alaska Native 567 1% 1%
Asian 4,966 11% 7%
Black or African American 3,185 7% 13%
Native Hawaiian or other Pacific Islander
600 1% 0%
White 33,061 72% 76%
Two or more races 3,854 8% 2%
Veterans 3,641 8% 6%
55 and over 5,244 11% 23%
Union Coverage 5,086 11% 6%
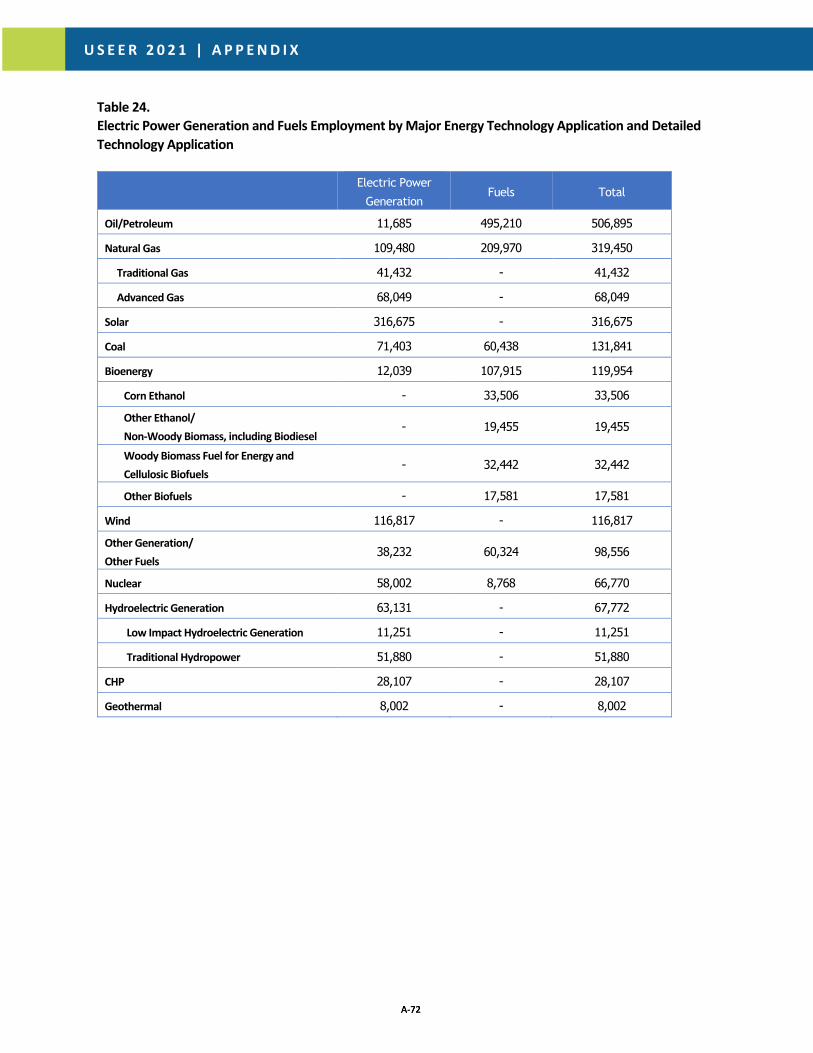
U S E E R 2 0 2 1 | A P P E N D I X
Table 24. Electric Power Generation and Fuels Employment by Major Energy Technology Application and Detailed Technology Application
Electric Power
Generation Fuels Total
Oil/Petroleum 11,685 495,210 506,895
Natural Gas 109,480 209,970 319,450
Traditional Gas 41,432 - 41,432
Advanced Gas 68,049 - 68,049
Solar 316,675 - 316,675
Coal 71,403 60,438 131,841
Bioenergy 12,039 107,915 119,954
Corn Ethanol - 33,506 33,506 Other Ethanol/ Non-Woody Biomass, including Biodiesel
- 19,455 19,455
Woody Biomass Fuel for Energy and Cellulosic Biofuels
- 32,442 32,442
Other Biofuels - 17,581 17,581
Wind 116,817 - 116,817 Other Generation/ Other Fuels
38,232 60,324 98,556
Nuclear 58,002 8,768 66,770
Hydroelectric Generation 63,131 - 67,772
Low Impact Hydroelectric Generation 11,251 - 11,251
Traditional Hydropower 51,880 - 51,880
CHP 28,107 - 28,107
Geothermal 8,002 - 8,002
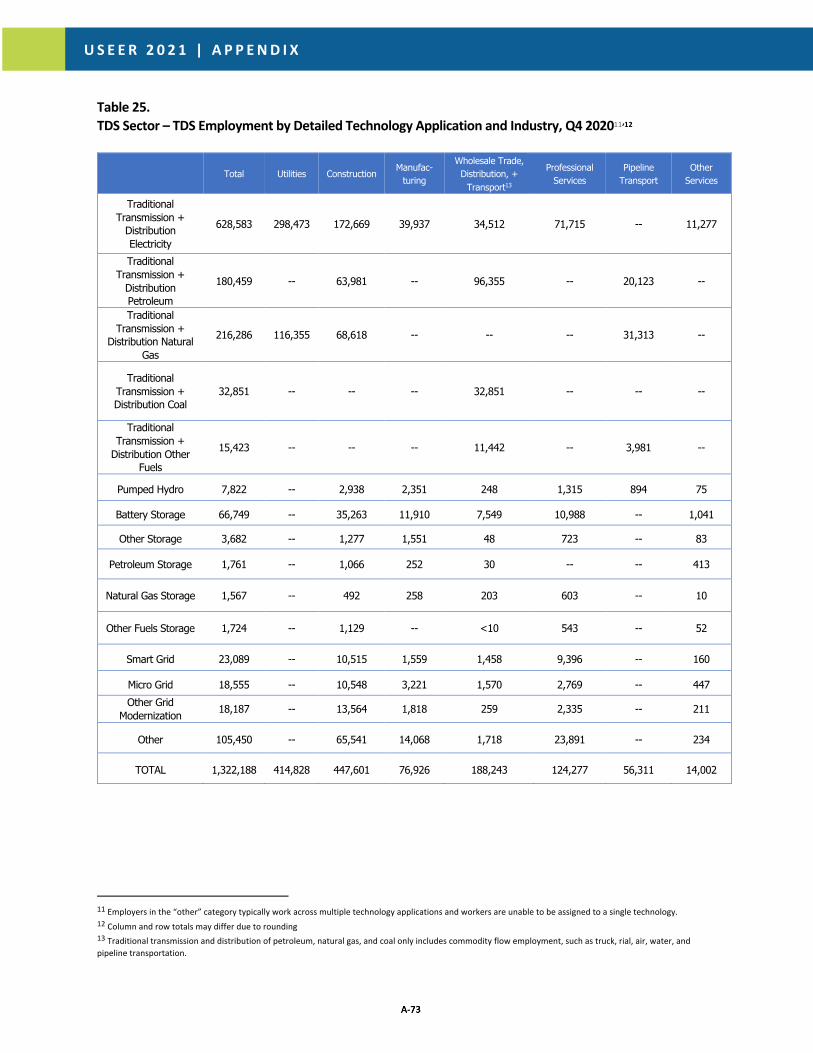
U S E E R 2 0 2 1 | A P P E N D I X
Table 25. TDS Sector – TDS Employment by Detailed Technology Application and Industry, Q4 202011,12
Total Utilities Construction Manufac- turing
Wholesale Trade, Distribution, +
Transport13
Professional Services
Pipeline Transport
Other Services
Traditional Transmission +
Distribution Electricity
628,583 298,473 172,669 39,937 34,512 71,715 -- 11,277
Traditional Transmission +
Distribution Petroleum
180,459 -- 63,981 -- 96,355 -- 20,123 --
Traditional Transmission +
Distribution Natural Gas
216,286 116,355 68,618 -- -- -- 31,313 --
Traditional Transmission + Distribution Coal
32,851 -- -- -- 32,851 -- -- --
Traditional Transmission +
Distribution Other Fuels
15,423 -- -- -- 11,442 -- 3,981 --
Pumped Hydro 7,822 -- 2,938 2,351 248 1,315 894 75
Battery Storage 66,749 -- 35,263 11,910 7,549 10,988 -- 1,041
Other Storage 3,682 -- 1,277 1,551 48 723 -- 83
Petroleum Storage 1,761 -- 1,066 252 30 -- -- 413
Natural Gas Storage 1,567 -- 492 258 203 603 -- 10
Other Fuels Storage 1,724 -- 1,129 -- <10 543 -- 52
Smart Grid 23,089 -- 10,515 1,559 1,458 9,396 -- 160
Micro Grid 18,555 -- 10,548 3,221 1,570 2,769 -- 447 Other Grid
Modernization 18,187 -- 13,564 1,818 259 2,335 -- 211
Other 105,450 -- 65,541 14,068 1,718 23,891 -- 234
TOTAL 1,322,188 414,828 447,601 76,926 188,243 124,277 56,311 14,002
11 Employers in the “other” category typically work across multiple technology applications and workers are unable to be assigned to a single technology. 12 Column and row totals may differ due to rounding 13 Traditional transmission and distribution of petroleum, natural gas, and coal only includes commodity flow employment, such as truck, rial, air, water, and pipeline transportation.
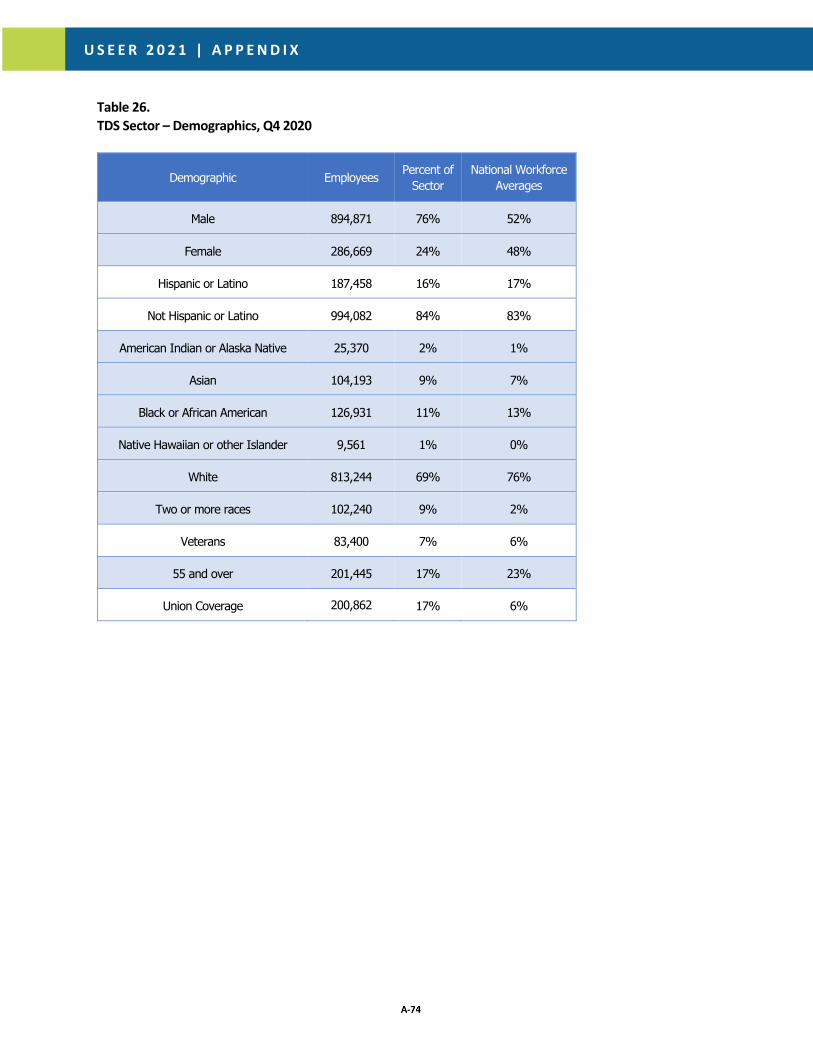
U S E E R 2 0 2 1 | A P P E N D I X
Table 26. TDS Sector – Demographics, Q4 2020
Demographic Employees Percent of Sector
National Workforce Averages
Male 894,871 76% 52%
Female 286,669 24% 48%
Hispanic or Latino 187,458 16% 17%
Not Hispanic or Latino 994,082 84% 83%
American Indian or Alaska Native 25,370 2% 1%
Asian 104,193 9% 7%
Black or African American 126,931 11% 13%
Native Hawaiian or other Islander 9,561 1% 0%
White 813,244 69% 76%
Two or more races 102,240 9% 2%
Veterans 83,400 7% 6%
55 and over 201,445 17% 23%
Union Coverage 200,862 17% 6%
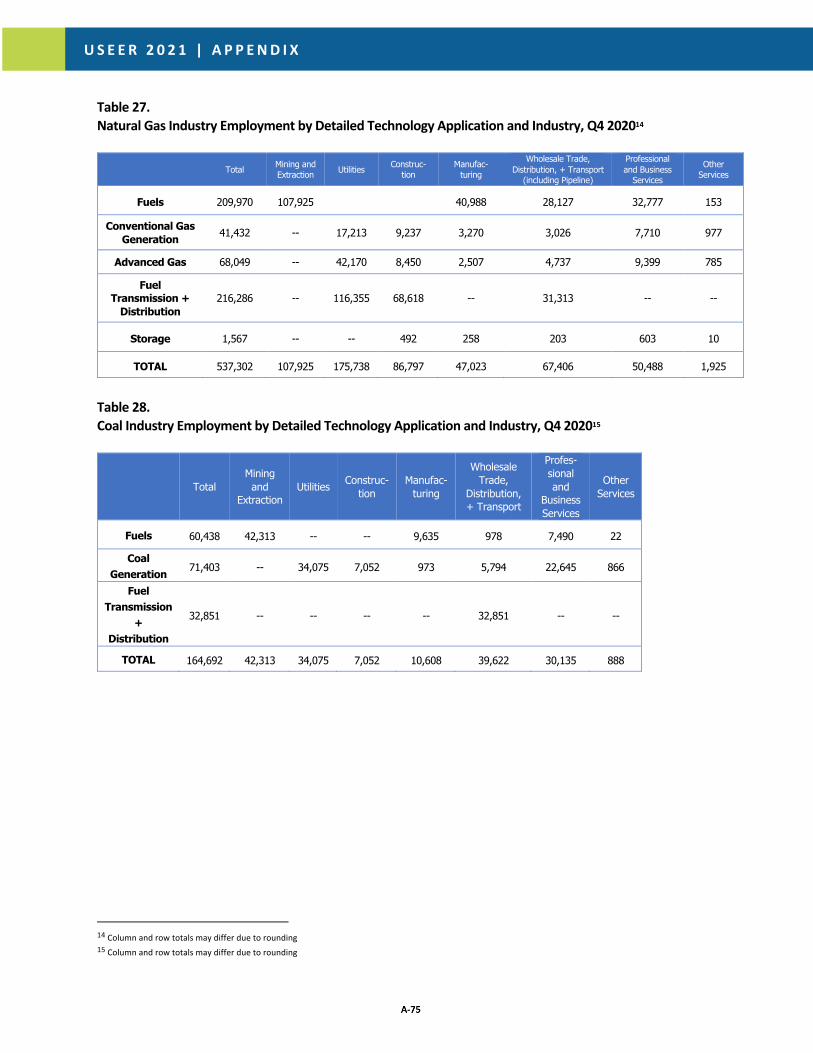
U S E E R 2 0 2 1 | A P P E N D I X
Table 27. Natural Gas Industry Employment by Detailed Technology Application and Industry, Q4 202014
Total Mining and Extraction Utilities Construc-
tion Manufac-
turing
Wholesale Trade, Distribution, + Transport
(including Pipeline)
Professional and Business
Services
Other Services
Fuels 209,970 107,925 40,988 28,127 32,777 153
Conventional Gas Generation 41,432 -- 17,213 9,237 3,270 3,026 7,710 977
Advanced Gas 68,049 -- 42,170 8,450 2,507 4,737 9,399 785
Fuel Transmission +
Distribution 216,286 -- 116,355 68,618 -- 31,313 -- --
Storage 1,567 -- -- 492 258 203 603 10
TOTAL 537,302 107,925 175,738 86,797 47,023 67,406 50,488 1,925
Table 28. Coal Industry Employment by Detailed Technology Application and Industry, Q4 202015
Total Mining and
Extraction Utilities Construc-
tion Manufac-
turing
Wholesale Trade,
Distribution, + Transport
Profes-sional and
Business Services
Other Services
Fuels 60,438 42,313 -- -- 9,635 978 7,490 22
Coal Generation 71,403 -- 34,075 7,052 973 5,794 22,645 866
Fuel Transmission
+ Distribution
32,851 -- -- -- -- 32,851 -- --
TOTAL 164,692 42,313 34,075 7,052 10,608 39,622 30,135 888
14 Column and row totals may differ due to rounding 15 Column and row totals may differ due to rounding
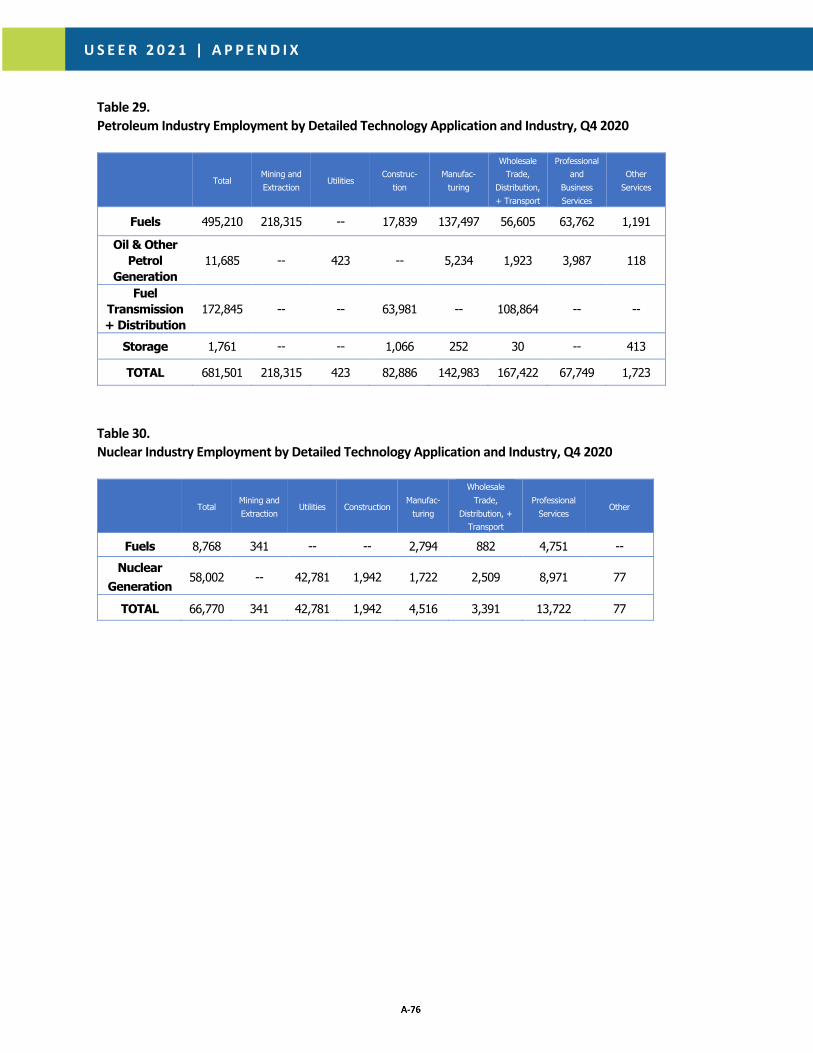
U S E E R 2 0 2 1 | A P P E N D I X
Table 29. Petroleum Industry Employment by Detailed Technology Application and Industry, Q4 2020
Total Mining and Extraction
Utilities Construc-
tion Manufac-
turing
Wholesale Trade,
Distribution, + Transport
Professional and
Business Services
Other Services
Fuels 495,210 218,315 -- 17,839 137,497 56,605 63,762 1,191
Oil & Other Petrol
Generation 11,685 -- 423 -- 5,234 1,923 3,987 118
Fuel Transmission + Distribution
172,845 -- -- 63,981 -- 108,864 -- --
Storage 1,761 -- -- 1,066 252 30 -- 413
TOTAL 681,501 218,315 423 82,886 142,983 167,422 67,749 1,723
Table 30. Nuclear Industry Employment by Detailed Technology Application and Industry, Q4 2020
Total Mining and Extraction
Utilities Construction Manufac-
turing
Wholesale Trade,
Distribution, + Transport
Professional Services
Other
Fuels 8,768 341 -- -- 2,794 882 4,751 -- Nuclear
Generation 58,002 -- 42,781 1,942 1,722 2,509 8,971 77
TOTAL 66,770 341 42,781 1,942 4,516 3,391 13,722 77
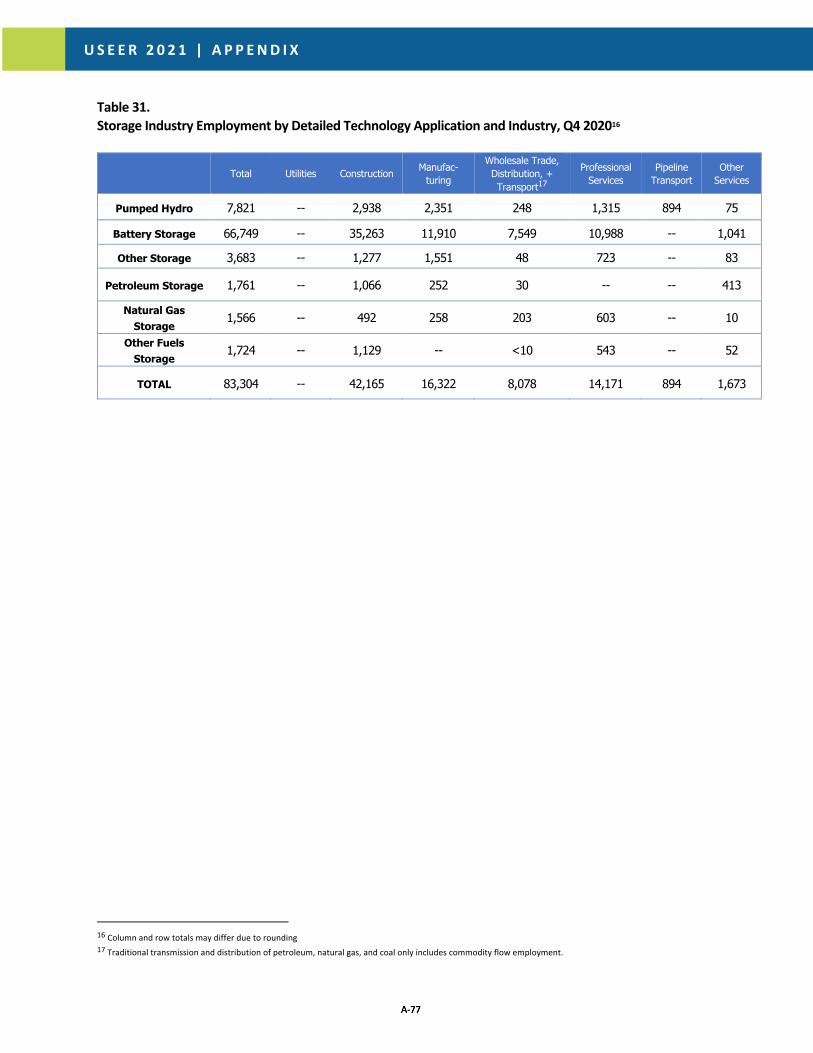
U S E E R 2 0 2 1 | A P P E N D I X
Table 31. Storage Industry Employment by Detailed Technology Application and Industry, Q4 202016
Total Utilities Construction Manufac-turing
Wholesale Trade, Distribution, + Transport17
Professional Services
Pipeline Transport
Other Services
Pumped Hydro 7,821 -- 2,938 2,351 248 1,315 894 75
Battery Storage 66,749 -- 35,263 11,910 7,549 10,988 -- 1,041
Other Storage 3,683 -- 1,277 1,551 48 723 -- 83
Petroleum Storage 1,761 -- 1,066 252 30 -- -- 413
Natural Gas Storage
1,566 -- 492 258 203 603 -- 10
Other Fuels Storage
1,724 -- 1,129 -- <10 543 -- 52
TOTAL 83,304 -- 42,165 16,322 8,078 14,171 894 1,673
16 Column and row totals may differ due to rounding 17 Traditional transmission and distribution of petroleum, natural gas, and coal only includes commodity flow employment.
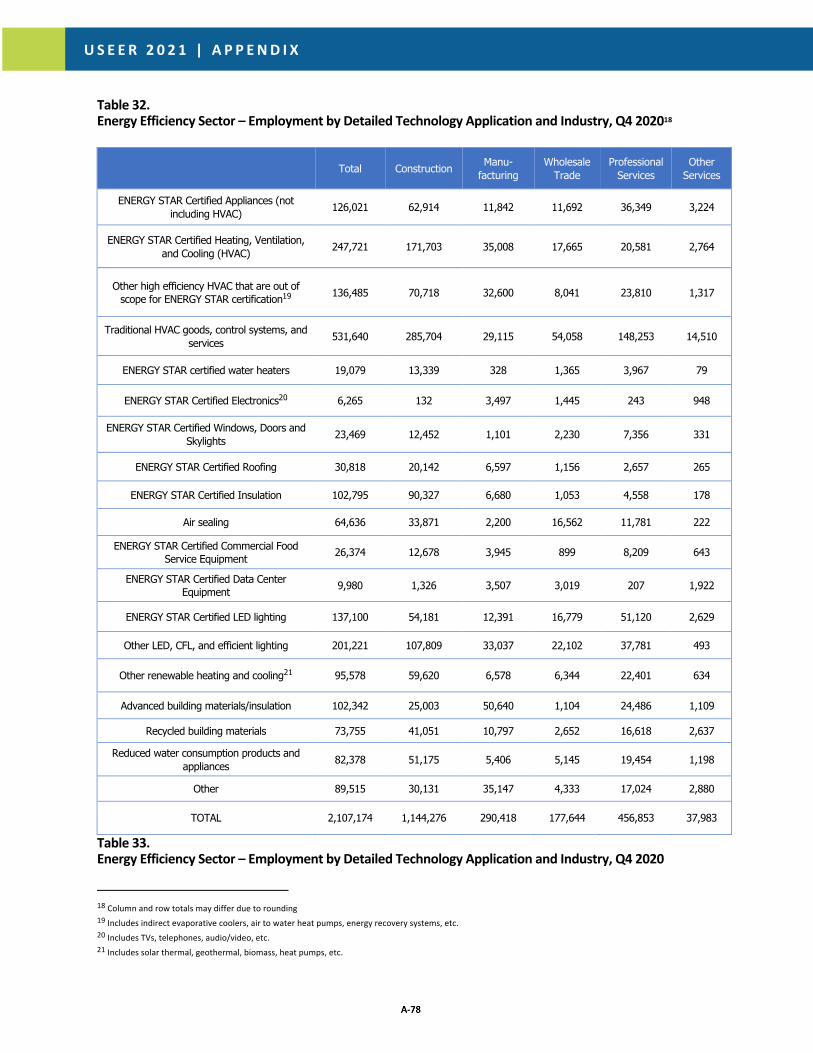
U S E E R 2 0 2 1 | A P P E N D I X
Table 32. Energy Efficiency Sector – Employment by Detailed Technology Application and Industry, Q4 202018
Total Construction Manu- facturing
Wholesale Trade
Professional Services
Other Services
ENERGY STAR Certified Appliances (not including HVAC) 126,021 62,914 11,842 11,692 36,349 3,224
ENERGY STAR Certified Heating, Ventilation, and Cooling (HVAC) 247,721 171,703 35,008 17,665 20,581 2,764
Other high efficiency HVAC that are out of scope for ENERGY STAR certification19 136,485 70,718 32,600 8,041 23,810 1,317
Traditional HVAC goods, control systems, and services 531,640 285,704 29,115 54,058 148,253 14,510
ENERGY STAR certified water heaters 19,079 13,339 328 1,365 3,967 79
ENERGY STAR Certified Electronics20 6,265 132 3,497 1,445 243 948
ENERGY STAR Certified Windows, Doors and Skylights 23,469 12,452 1,101 2,230 7,356 331
ENERGY STAR Certified Roofing 30,818 20,142 6,597 1,156 2,657 265
ENERGY STAR Certified Insulation 102,795 90,327 6,680 1,053 4,558 178
Air sealing 64,636 33,871 2,200 16,562 11,781 222
ENERGY STAR Certified Commercial Food Service Equipment 26,374 12,678 3,945 899 8,209 643
ENERGY STAR Certified Data Center Equipment 9,980 1,326 3,507 3,019 207 1,922
ENERGY STAR Certified LED lighting 137,100 54,181 12,391 16,779 51,120 2,629
Other LED, CFL, and efficient lighting 201,221 107,809 33,037 22,102 37,781 493
Other renewable heating and cooling21 95,578 59,620 6,578 6,344 22,401 634
Advanced building materials/insulation 102,342 25,003 50,640 1,104 24,486 1,109
Recycled building materials 73,755 41,051 10,797 2,652 16,618 2,637
Reduced water consumption products and appliances 82,378 51,175 5,406 5,145 19,454 1,198
Other 89,515 30,131 35,147 4,333 17,024 2,880
TOTAL 2,107,174 1,144,276 290,418 177,644 456,853 37,983
Table 33. Energy Efficiency Sector – Employment by Detailed Technology Application and Industry, Q4 2020
18 Column and row totals may differ due to rounding 19 Includes indirect evaporative coolers, air to water heat pumps, energy recovery systems, etc. 20 Includes TVs, telephones, audio/video, etc. 21 Includes solar thermal, geothermal, biomass, heat pumps, etc.
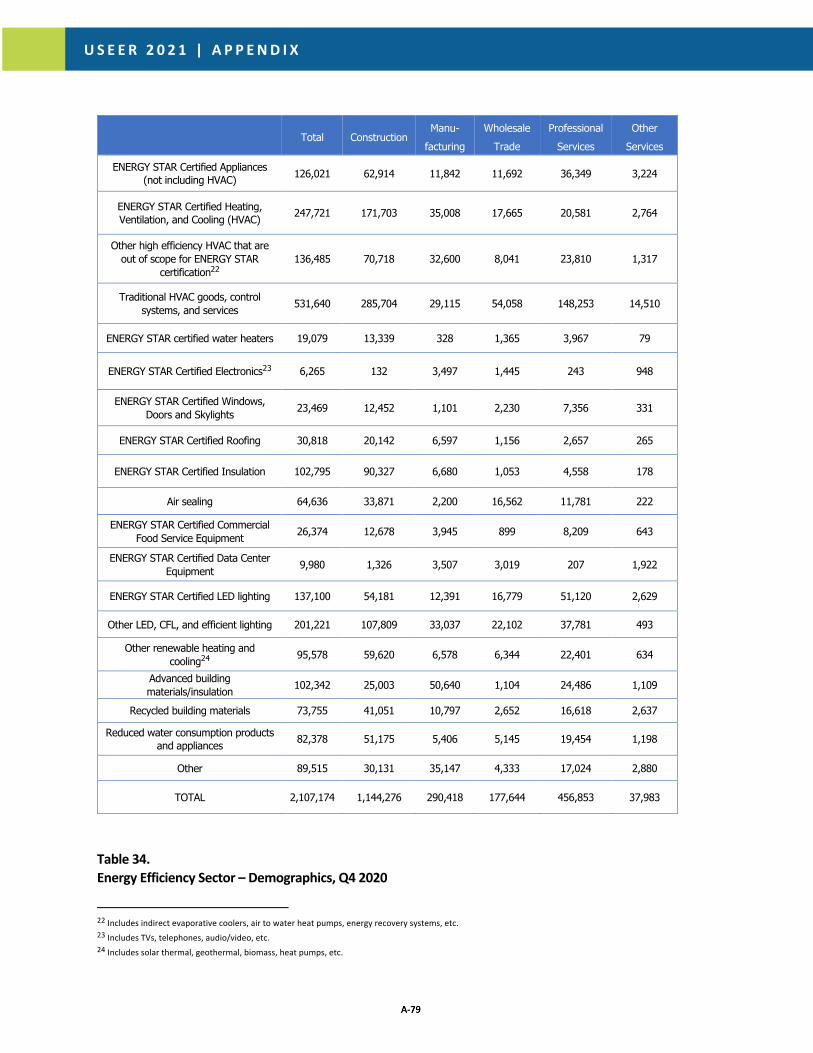
U S E E R 2 0 2 1 | A P P E N D I X
Total Construction Manu-
facturing Wholesale
Trade Professional
Services Other
Services
ENERGY STAR Certified Appliances (not including HVAC) 126,021 62,914 11,842 11,692 36,349 3,224
ENERGY STAR Certified Heating, Ventilation, and Cooling (HVAC) 247,721 171,703 35,008 17,665 20,581 2,764
Other high efficiency HVAC that are out of scope for ENERGY STAR
certification22 136,485 70,718 32,600 8,041 23,810 1,317
Traditional HVAC goods, control systems, and services 531,640 285,704 29,115 54,058 148,253 14,510
ENERGY STAR certified water heaters 19,079 13,339 328 1,365 3,967 79
ENERGY STAR Certified Electronics23 6,265 132 3,497 1,445 243 948
ENERGY STAR Certified Windows, Doors and Skylights 23,469 12,452 1,101 2,230 7,356 331
ENERGY STAR Certified Roofing 30,818 20,142 6,597 1,156 2,657 265
ENERGY STAR Certified Insulation 102,795 90,327 6,680 1,053 4,558 178
Air sealing 64,636 33,871 2,200 16,562 11,781 222
ENERGY STAR Certified Commercial Food Service Equipment 26,374 12,678 3,945 899 8,209 643
ENERGY STAR Certified Data Center Equipment 9,980 1,326 3,507 3,019 207 1,922
ENERGY STAR Certified LED lighting 137,100 54,181 12,391 16,779 51,120 2,629
Other LED, CFL, and efficient lighting 201,221 107,809 33,037 22,102 37,781 493
Other renewable heating and cooling24 95,578 59,620 6,578 6,344 22,401 634
Advanced building materials/insulation 102,342 25,003 50,640 1,104 24,486 1,109
Recycled building materials 73,755 41,051 10,797 2,652 16,618 2,637
Reduced water consumption products and appliances 82,378 51,175 5,406 5,145 19,454 1,198
Other 89,515 30,131 35,147 4,333 17,024 2,880
TOTAL 2,107,174 1,144,276 290,418 177,644 456,853 37,983
Table 34. Energy Efficiency Sector – Demographics, Q4 2020
22 Includes indirect evaporative coolers, air to water heat pumps, energy recovery systems, etc. 23 Includes TVs, telephones, audio/video, etc. 24 Includes solar thermal, geothermal, biomass, heat pumps, etc.
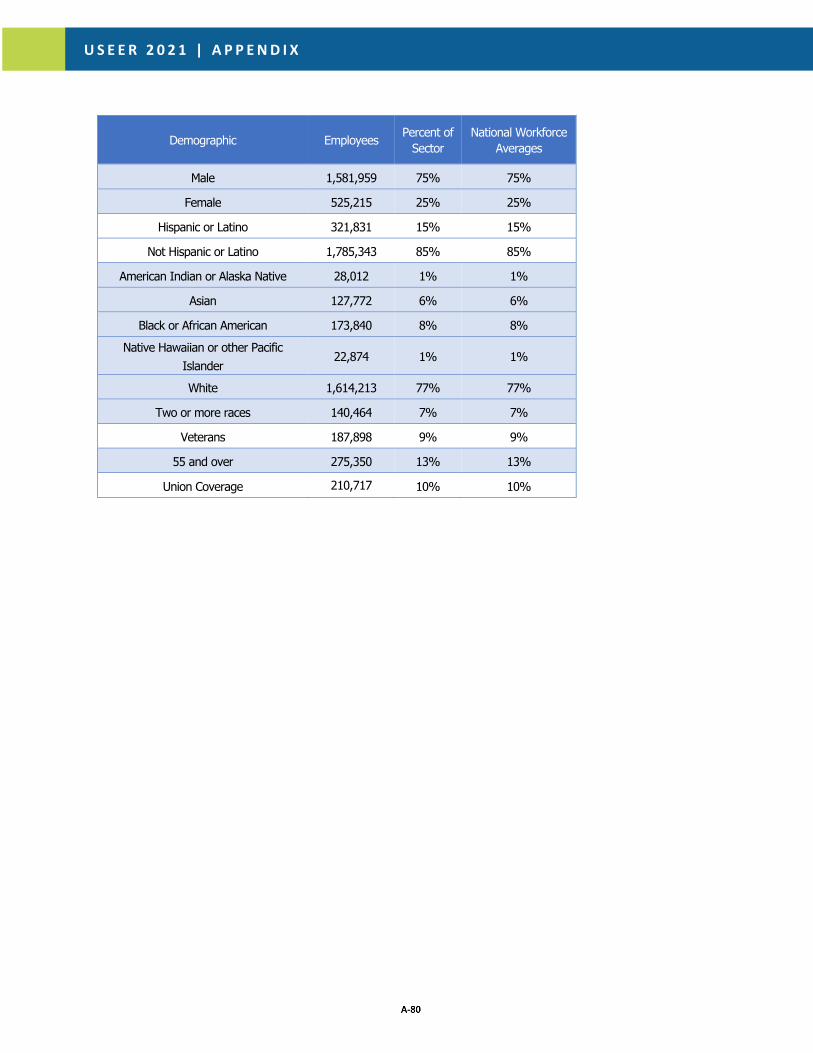
U S E E R 2 0 2 1 | A P P E N D I X
Demographic Employees Percent of Sector
National Workforce Averages
Male 1,581,959 75% 75%
Female 525,215 25% 25%
Hispanic or Latino 321,831 15% 15%
Not Hispanic or Latino 1,785,343 85% 85%
American Indian or Alaska Native 28,012 1% 1%
Asian 127,772 6% 6%
Black or African American 173,840 8% 8% Native Hawaiian or other Pacific
Islander 22,874 1% 1%
White 1,614,213 77% 77%
Two or more races 140,464 7% 7%
Veterans 187,898 9% 9%
55 and over 275,350 13% 13%
Union Coverage 210,717 10% 10%

U S E E R 2 0 2 1 | A P P E N D I X
Table 35. Motor Vehicles and Component Parts Sector – Demographics, Q4 2020
Demographic Employees Percent of Sector
National Workforce Averages
Male 1,694,968 77% 52%
Female 518,639 23% 48%
Hispanic or Latino 385,640 17% 17%
Not Hispanic or Latino 1,827,967 83% 83%
American Indian or Alaska Native 33,744 2% 1%
Asian 107,009 5% 7%
Black or African American 182,836 12% 13%
Native Hawaiian or other Pacific Islander
15,659 1% 0%
White 1,695,319 73% 76%
Two or more races 179,040 8% 2%
Veterans 189,591 9% 6%
55 and over 414,999 19% 23%
Union Coverage 132,816 6% 6%