ap statistics course description
TRANSCRIPT
52269-00003 AP Statistics Course Description 2009-10; Fonts: Century Old Style Regular, Century Old Style Italic, Century Old Style Bold, Serifa 45 Light, Serifa 65 Bold, Serifa 75 Black; Univers 47 Light Condensed, Univers 67 Bold Condensed • Dr1 12/5/07 RI60436 • D1rev 12/10/07 RI60436 • D2 2/7/08 RI60436 • D2rev 2/12/08 RI60436 • D3 3/3/08 RI60436 • CS4 1/20/10 mc • dr01 1/20/10 mc • dr01revs 2/1/10 mc • pdf 2/3/10 mc • pdf 2/19/10 mc • Drft03 3/26/10 jdb • PDF Drft03 3/30/10 jdb • PDF Drft04 4/6/10 jdb • Preflight 04/13/10 ljg
StatIStIcSCourse DescriptionE f f e c t i v e F a l l 2 0 1 0
AP Course Descriptions are updated regularly. Please visit AP Central® (apcentral.collegeboard.com) to determine whether a more recent Course Description PDF is available.
52269-00003 AP Statistics Course Description 2009-10; Fonts: Century Old Style Regular, Century Old Style Italic, Century Old Style Bold, Serifa 45 Light, Serifa 65 Bold, Serifa 75 Black; Univers 47 Light Condensed, Univers 67 Bold Condensed • Dr1 12/5/07 RI60436 • D1rev 12/10/07 RI60436 • D2 2/7/08 RI60436 • D2rev 2/12/08 RI60436 • D3 3/3/08 RI60436 • CS4 1/20/10 mc • dr01 1/20/10 mc • dr01revs 2/1/10 mc • pdf 2/3/10 mc • pdf 2/19/10 mc • Drft03 3/26/10 jdb • PDF Drft03 3/30/10 jdb • Drft04 4/2/10 jdb • PDF Drft04 4/6/10 jdb • Preflight 04/13/10 ljg
The College Board
The College Board is a not-for-profi t membership association whose mission is to connect students to college success and opportunity. Founded in 1900, the College Board is composed of more than 5,700 schools, colleges, universities and other educational organizations. Each year, the College Board serves seven million students and their parents, 23,000 high schools, and 3,800 colleges through major programs and services in college readiness, college admission, guidance, assessment, fi nancial aid, and enrollment. Among its widely recognized programs are the SAT®, the PSAT/NMSQT®, the Advanced Placement Program® (AP®), SpringBoard® and ACCUPLACER®. The College Board is committed to the principles of excellence and equity, and that commitment is embodied in all of its programs, services, activities and concerns.
For further information, visit www.collegeboard.com.
The College Board and the Advanced Placement Program encourage teachers, AP Coordinators and school administrators to make equitable access a guiding principle for their AP programs. The College Board is committed to the principle that all students deserve an opportunity to participate in rigorous and academically challenging courses and programs. All students who are willing to accept the challenge of a rigorous academic curriculum should be considered for admission to AP courses. The Board encourages the elimination of barriers that restrict access to AP courses for students from ethnic, racial and socioeconomic groups that have been traditionally underrepresented in the AP Program. Schools should make every effort to ensure that their AP classes refl ect the diversity of their student population.
© 2010 The College Board. College Board, ACCUPLACER, Advanced Placement Program, AP, AP Central, SAT, SpringBoard and the acorn logo are registered trademarks of the College Board. PSAT/NMSQT is a registered trademark of the College Board and National Merit Scholarship Corporation. All other products and services may be trademarks of their respective owners. Permission to use College Board materials may be requested online at: www.collegeboard.com/inquiry/cbpermit.html.
i
52269-00003 AP Statistics Course Description 2009-10; Fonts: Century Old Style Regular, Century Old Style Italic, Century Old Style Bold, Serifa 45 Light, Serifa 65 Bold, Serifa 75 Black; Univers 47 Light Condensed, Univers 67 Bold Condensed • Dr1 12/5/07 RI60436 • D1rev 12/10/07 RI60436 • D2 2/7/08 RI60436 • D2rev 2/12/08 RI60436 • D3 3/3/08 RI60436 • CS4 1/20/10 mc • dr01 1/20/10 mc • dr01revs 2/1/10 mc • pdf 2/3/10 mc • pdf 2/19/10 mc • Drft03 3/26/10 jdb • PDF Drft03 3/30/10 jdb • Drft04 4/2/10 jdb • PDF Drft04 4/6/10 jdb • Preflight 04/13/10 ljg • 71328-82910 • dr01 04/20/10 ljg
contents
Welcome to the AP Program . . . . . . . . . . . . . . . . . . . . . . . . . . . . . . . . . . . . . . . . . . . . . . . . . 1AP Course Audit . . . . . . . . . . . . . . . . . . . . . . . . . . . . . . . . . . . . . . . . . . . . . . . . . . . . . . . . 1AP Development Committees . . . . . . . . . . . . . . . . . . . . . . . . . . . . . . . . . . . . . . . . . . . . 2AP Reading . . . . . . . . . . . . . . . . . . . . . . . . . . . . . . . . . . . . . . . . . . . . . . . . . . . . . . . . . . . . 2AP Exam Scores . . . . . . . . . . . . . . . . . . . . . . . . . . . . . . . . . . . . . . . . . . . . . . . . . . . . . . . . 2
Credit and Placement for AP Scores . . . . . . . . . . . . . . . . . . . . . . . . . . . . . . . . . . . . . 2Setting Credit and Placement Policies for AP Scores . . . . . . . . . . . . . . . . . . . . . . . 3
AP Statistics . . . . . . . . . . . . . . . . . . . . . . . . . . . . . . . . . . . . . . . . . . . . . . . . . . . . . . . . . . . . . . 4Introduction . . . . . . . . . . . . . . . . . . . . . . . . . . . . . . . . . . . . . . . . . . . . . . . . . . . . . . . . . . . 4The Course . . . . . . . . . . . . . . . . . . . . . . . . . . . . . . . . . . . . . . . . . . . . . . . . . . . . . . . . . . . 4
Student Selection . . . . . . . . . . . . . . . . . . . . . . . . . . . . . . . . . . . . . . . . . . . . . . . . . . . . 5Teaching the Course . . . . . . . . . . . . . . . . . . . . . . . . . . . . . . . . . . . . . . . . . . . . . . . . . 5Course Content Overview . . . . . . . . . . . . . . . . . . . . . . . . . . . . . . . . . . . . . . . . . . . . . 6
Topic Outline . . . . . . . . . . . . . . . . . . . . . . . . . . . . . . . . . . . . . . . . . . . . . . . . . . . . . . . . . . 7The Use of Technology . . . . . . . . . . . . . . . . . . . . . . . . . . . . . . . . . . . . . . . . . . . . . . 10Formulas and Tables . . . . . . . . . . . . . . . . . . . . . . . . . . . . . . . . . . . . . . . . . . . . . . . . 11
Descriptive Statistics . . . . . . . . . . . . . . . . . . . . . . . . . . . . . . . . . . . . . . . . . . . . . . 12Probability . . . . . . . . . . . . . . . . . . . . . . . . . . . . . . . . . . . . . . . . . . . . . . . . . . . . . . . 13Inferential Statistics . . . . . . . . . . . . . . . . . . . . . . . . . . . . . . . . . . . . . . . . . . . . . . . 13
The Exam . . . . . . . . . . . . . . . . . . . . . . . . . . . . . . . . . . . . . . . . . . . . . . . . . . . . . . . . . . . . 19Multiple-Choice Questions . . . . . . . . . . . . . . . . . . . . . . . . . . . . . . . . . . . . . . . . . . . 19
Answers to Multiple-Choice Questions . . . . . . . . . . . . . . . . . . . . . . . . . . . . . . . 26Free-Response Questions . . . . . . . . . . . . . . . . . . . . . . . . . . . . . . . . . . . . . . . . . . . . 27Scoring of Free-Response Questions . . . . . . . . . . . . . . . . . . . . . . . . . . . . . . . . . . . 27
Teacher Support . . . . . . . . . . . . . . . . . . . . . . . . . . . . . . . . . . . . . . . . . . . . . . . . . . . . . . . . . . 35AP Central (apcentral .collegeboard .com) . . . . . . . . . . . . . . . . . . . . . . . . . . . . . . . . . . 35Additional Resources . . . . . . . . . . . . . . . . . . . . . . . . . . . . . . . . . . . . . . . . . . . . . . . . . . . 37
©2010TheCollegeBoard.VisittheCollegeBoardontheWeb:www.collegeboard.com.

Blank Page ii
52269-00003 AP Statistics Course Description 2009-10; Fonts: Century Old Style Regular, Century Old Style Italic, Century Old Style Bold, Serifa 45 Light, Serifa 65 Bold, Serifa 75 Black; Univers 47 Light Condensed, Univers 67 Bold Condensed • Dr1 12/5/07 RI60436 • D1rev 12/10/07 RI60436 • D2 2/7/08 RI60436 • D2rev 2/12/08 RI60436 • D3 3/3/08 RI60436 • CS4 1/20/10 mc • dr01 1/20/10 mc • dr01revs 2/1/10 mc • pdf 2/3/10 mc • pdf 2/19/10 mc • Drft03 3/26/10 jdb • PDF Drft03 3/30/10 jdb • Drft04 4/2/10 jdb • PDF Drft04 4/6/10 jdb • Preflight 04/13/10 ljg • 71328-82910 • dr01 04/20/10 ljg
1
Welcome to the AP ® ProgramAP® is a rigorous academic program built on the commitment, passion and hard work of students and educators from both secondary schools and higher education. With more than 30 courses in a wide variety of subject areas, AP provides willing and academically prepared high school students with the opportunity to study and learn at the college level.
Through AP courses, talented and dedicated AP teachers help students develop and apply the skills, abilities and content knowledge they will need later in college. Each AP course is modeled upon a comparable college course, and college and university faculty play a vital role in ensuring that AP courses align with college-level standards. For example, through the AP Course Audit, AP teachers submit their syllabi for review and approval by college faculty. Only courses using syllabi that meet or exceed the college-level curricular and resource requirements for each AP course are authorized to carry the “AP” label.
AP courses culminate in a suite of college-level assessments developed and scored by college and university faculty members as well as experienced AP teachers. AP Exams are an essential part of the AP experience, enabling students to demonstrate their mastery of college-level course work. Strong performance on AP Exams is rewarded by colleges and universities worldwide. More than 90 percent of four-year colleges and universities in the United States grant students credit, placement or both on the basis of successful AP Exam scores. But performing well on an AP Exam means more than just the successful completion of a course; it is the gateway to success in college. Research consistently shows that students who score a 3 or higher typically experience greater academic success in college and improved graduation rates than their non-AP student peers.
AP Course AuditThe intent of the AP Course Audit is to provide secondary and higher education constituents with the assurance that an “AP” designation on a student’s transcript is credible, meaning the AP Program has authorized a course that has met or exceeded the curricular requirements and classroom resources that demonstrate the academic rigor of a comparable college course. To receive authorization from the College Board to label a course “AP,” teachers must participate in the AP Course Audit. Courses authorized to use the “AP” designation are listed in the AP Course Ledger made available to colleges and universities each fall. It is the school’s responsibility to ensure that its AP Course Ledger entry accurately refl ects the AP courses offered within each academic year.
The AP Program unequivocally supports the principle that each individual school must develop its own curriculum for courses labeled “AP.” Rather than mandating any one curriculum for AP courses, the AP Course Audit instead provides each AP teacher with a set of expectations that college and secondary school faculty nationwide have established for college-level courses. AP teachers are encouraged to develop or maintain their own curriculum that either includes or exceeds each of these expectations; such courses will be authorized to use the “AP” designation. Credit for the success of AP courses belongs to the individual schools and teachers that create powerful, locally designed AP curricula.
©2010TheCollegeBoard.VisittheCollegeBoardontheWeb:www.collegeboard.com.
2
52269-00003 AP Statistics Course Description 2009-10; Fonts: Century Old Style Regular, Century Old Style Italic, Century Old Style Bold, Serifa 45 Light, Serifa 65 Bold, Serifa 75 Black; Univers 47 Light Condensed, Univers 67 Bold Condensed • Dr1 12/5/07 RI60436 • D1rev 12/10/07 RI60436 • D2 2/7/08 RI60436 • D2rev 2/12/08 RI60436 • D3 3/3/08 RI60436 • CS4 1/20/10 mc • dr01 1/20/10 mc • dr01revs 2/1/10 mc • pdf 2/3/10 mc • pdf 2/19/10 mc • Drft03 3/26/10 jdb • PDF Drft03 3/30/10 jdb • Drft04 4/2/10 jdb • PDF Drft04 4/6/10 jdb • Preflight 04/13/10 ljg • 71328-82910 • dr01 04/20/10 ljg
2
Complete information about the AP Course Audit is available at www.collegeboard.com/apcourseaudit.
AP Development CommitteesAn AP Development Committee is a group of nationally renowned subject-matter experts in a particular discipline that includes professionals in secondary and postsecondary education as well as from professional organizations. These experts ensure that AP courses and exams refl ect the most up-to-date information available,as befi tting a college-level course, and that student profi ciency is assessed properly.To fi nd a list of current AP Development Committee members, please visit:apcentral.collegeboard.com/developmentcommittees.
AP ReadingAP Exams — with the exception of AP Studio Art, which is a portfolio assessment — consist of dozens of multiple-choice questions scored by machine, and free-response questions scored at the annual AP Reading by thousands of college faculty and expert AP teachers. AP Readers use scoring standards developed by college and university faculty who teach the corresponding college course. The AP Reading offers educators both signifi cant professional development and the opportunity to network with colleagues. For more information about the AP Reading, or to apply to serve as a Reader, visit apcentral.collegeboard.com/readers.
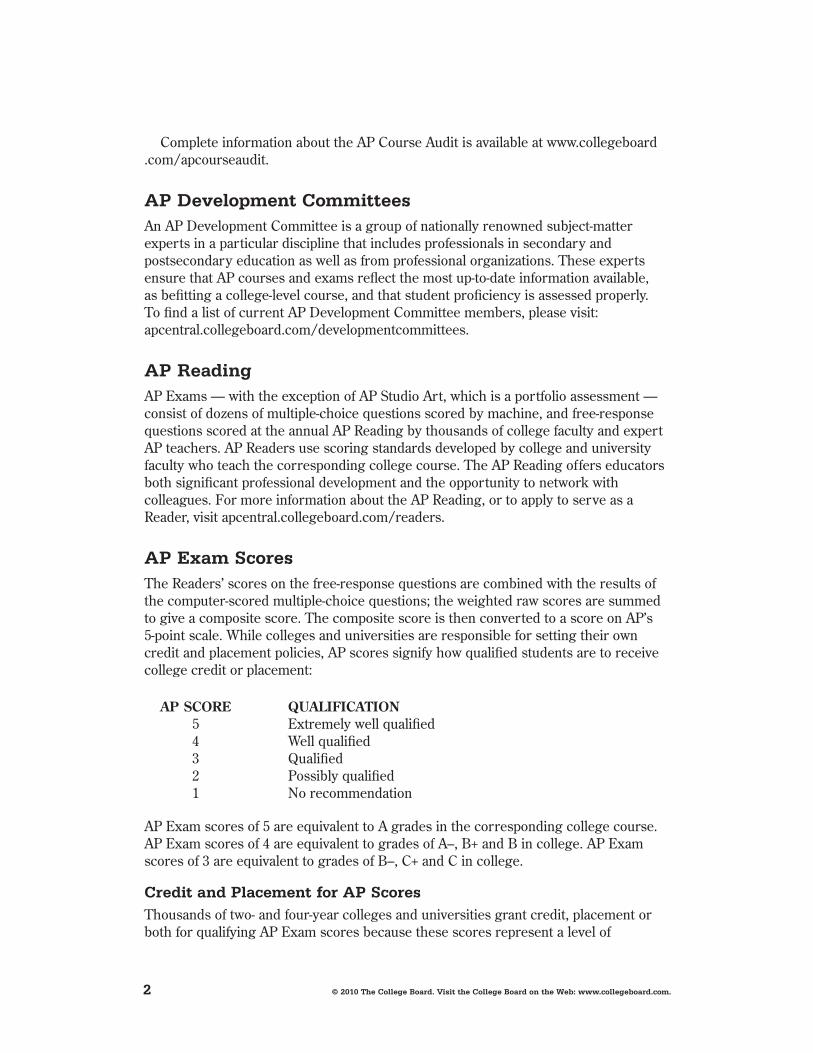
AP Exam ScoresThe Readers’ scores on the free-response questions are combined with the results of the computer-scored multiple-choice questions; the weighted raw scores are summed to give a composite score. The composite score is then converted to a score on AP’s 5-point scale. While colleges and universities are responsible for setting their own credit and placement policies, AP scores signify how qualifi ed students are to receive college credit or placement:
AP SCORE QUALIFICATION 5 Extremely well qualifi ed 4 Well qualifi ed 3 Qualifi ed 2 Possibly qualifi ed 1 No recommendation
AP Exam scores of 5 are equivalent to A grades in the corresponding college course. AP Exam scores of 4 are equivalent to grades of A–, B+ and B in college. AP Exam scores of 3 are equivalent to grades of B–, C+ and C in college.
Credit and Placement for AP ScoresThousands of two- and four-year colleges and universities grant credit, placement or both for qualifying AP Exam scores because these scores represent a level of
©2010TheCollegeBoard.VisittheCollegeBoardontheWeb:www.collegeboard.com.
3
52269-00003 AP Statistics Course Description 2009-10; Fonts: Century Old Style Regular, Century Old Style Italic, Century Old Style Bold, Serifa 45 Light, Serifa 65 Bold, Serifa 75 Black; Univers 47 Light Condensed, Univers 67 Bold Condensed • Dr1 12/5/07 RI60436 • D1rev 12/10/07 RI60436 • D2 2/7/08 RI60436 • D2rev 2/12/08 RI60436 • D3 3/3/08 RI60436 • CS4 1/20/10 mc • dr01 1/20/10 mc • dr01revs 2/1/10 mc • pdf 2/3/10 mc • pdf 2/19/10 mc • Drft03 3/26/10 jdb • PDF Drft03 3/30/10 jdb • Drft04 4/2/10 jdb • PDF Drft04 4/6/10 jdb • Preflight 04/13/10 ljg • 71328-82910 • dr01 04/20/10 ljg
3
achievement equivalent to that of students who have taken the comparable college course. This college-level equivalency is ensured through several AP Program processes:
• College faculty are involved in course and exam development and other AP activities. Currently, college faculty:
• Serve as chairs and members of the committees that develop the Course Descriptions and exams for each AP course.
• Are responsible for standard setting and are involved in the evaluation of student responses at the annual AP Reading. The Chief Reader for each AP exam is a college faculty member.
• Lead professional development seminars for new and experienced AP teachers.
• Serve as the senior reviewers in the annual AP Course Audit, ensuring AP teachers’ syllabi meet the curriculum guidelines for college-level courses.
• AP courses and exams are reviewed and updated regularly based on the resultsof curriculum surveys at up to 200 colleges and universities, collaborations among the College Board and key educational and disciplinary organizations, and the interactions of committee members with professional organizations in their discipline.
• Periodic college comparability studies are undertaken in which the performance of college students on a selection of AP Exam questions is compared with that of AP students to ensure that grades earned by college students are aligned with scores AP students earn on the exam.
For more information about the role of colleges and universities in the AP Program, visit the Value of AP to Colleges and Universities section of the College Board website at http://professionals.collegeboard.com/higher-ed/placement/ap.
Setting Credit and Placement Policies for AP ScoresThe College Board website for education professionals has a section specifi cally for colleges and universities that provides guidance in setting AP credit and placement policies. Visit http://professionals.collegeboard.com/higher-ed/placement/ap/policy.
Additional resources, including links to AP research studies, released exam questions and sample student responses at varying levels of achievement for each AP Exam are also available. To view student samples and scoring guidelines, visit http://apcentral.collegeboard.com/apc/public/exam/exam_questions/index.html.
To review recent validity research studies, visit http://professionals.collegeboard.com/data-reports-research/cb/ap.
The “AP Credit Policy Info” online search tool provides links to credit and placement policies at more than 1,000 colleges and universities. This tool helps students fi nd the credit hours and/or advanced placement they may receive for qualifying exam scores within each AP subject at a specifi ed institution. AP Credit Policy Info is available at www.collegeboard.com/ap/creditpolicy. If the information for your institution is not listed or is incorrect, please contact [email protected].
©2010TheCollegeBoard.VisittheCollegeBoardontheWeb:www.collegeboard.com.
4
52269-00003 AP Statistics Course Description 2009-10; Fonts: Century Old Style Regular, Century Old Style Italic, Century Old Style Bold, Serifa 45 Light, Serifa 65 Bold, Serifa 75 Black; Univers 47 Light Condensed, Univers 67 Bold Condensed • Dr1 12/5/07 RI60436 • D1rev 12/10/07 RI60436 • D2 2/7/08 RI60436 • D2rev 2/12/08 RI60436 • D3 3/3/08 RI60436 • CS4 1/20/10 mc • dr01 1/20/10 mc • dr01revs 2/1/10 mc • pdf 2/3/10 mc • pdf 2/19/10 mc • Drft03 3/26/10 jdb • PDF Drft03 3/30/10 jdb • Drft04 4/2/10 jdb • PDF Drft04 4/6/10 jdb • Preflight 04/13/10 ljg • 71328-82910 • dr01 04/20/10 ljg
aP Statistics
I n T r o d u C T I o nThe Advanced Placement Program offers a course description and exam in statistics to secondary school students who wish to complete studies equivalent to a one-semester, introductory, non-calculus-based, college course in statistics .
Statistics and mathematics educators who serve as members of the AP Statistics Development Committee have prepared the Course Description and exam to reflect the content of a typical introductory college course in statistics . The exam is representative of such a course and therefore is considered appropriate for the measurement of skills and knowledge in the field of introductory statistics .
In colleges and universities, the number of students who take a sta tistics course is almost as large as the number of students who take a calculus course . A July 2002 article in the Chronicle of Higher Education reports that the enrollment in statistics courses from 1990 to 2000 increased by 45 percent — one testament to the growth of statistics in those institutions . An introductory statistics course, similar to the AP Statistics course, is typically required for majors such as social sciences, health sciences and business . Every semester about 236,000 college and univer sity students enroll in an introductory statistics course offered by a mathematics or statistics department . In addition, a large number of students enroll in an introductory statistics course offered by other departments . Science, engineering and mathematics majors usually take an upper-level calculus-based course in statistics, for which the AP Statistics course is effective preparation .
T h e C o u r s eThe purpose of the AP course in statistics is to introduce students to the major concepts and tools for collecting, analyzing and drawing conclusions from data . Students are exposed to four broad conceptual themes:
1 . Exploring Data: Describing patterns and departures from patterns
2 . Sampling and Experimentation: Planning and conducting a study
3 . Anticipating Patterns: Exploring random phenomena using probability and simulation
4 . Statistical Inference: Estimating population parameters and testing hypotheses
Students who successfully complete the course and exam may receive credit, advanced placement or both for a one-semester introductory college statistics course . This does not necessarily imply that the high school course should be one semester long . Each high school needs to determine the length of its AP Statistics course to best serve the needs of its students . Statistics, like some other AP courses, could be effectively studied in a one-semester, a two-trimester or a one-year course . Most schools, however, offer it as a one-year course .
©2010TheCollegeBoard.VisittheCollegeBoardontheWeb:www.collegeboard.com.
5
studentselectionThe College Board and the Advanced Placement Program encourage teachers, AP Coordinators and school administrators to make equitable access a guiding principle for their AP programs . The College Board is committed to the principle that all students deserve an opportunity to participate in rigorous and academically challenging courses and programs . All students who are willing to accept the challenge of a rigorous academic curriculum should be considered for admission to AP courses . The Board encourages the elimination of barriers that restrict access to AP courses for students from ethnic, racial and socioeconomic groups that have been traditionally underrepresented in the AP Program . Schools should make every effort to ensure that their AP classes reflect the diversity of their student population .
The AP Statistics course is an excellent option for any secondary school student who has successfully completed a second-year course in algebra and who possesses sufficient mathematical maturity and quantitative reasoning ability .
Because second-year algebra is the prerequisite course, AP Statistics usually will be taken in either the junior or senior year . The decisions about whether to take AP Statistics and when to take it depend on a student’s plans:
• Students planning to take a science course in their senior year will benefit greatly from taking AP Statistics in their junior year .
• For students who would otherwise take no mathematics in their senior year, AP Statistics allows them to continue to develop their quantitative skills .
• Students who wish to leave open the option of taking calculus in college should include precalculus in their high school program and perhaps take AP Statistics concurrently with precalculus .
Students with the appropriate mathematical background are encouraged to take both AP Statistics and AP Calculus in high school .
Students who take the AP Statistics course are strongly encouraged to take the exam .
TeachingtheCourseThe AP Statistics course lends itself naturally to a mode of teaching that engages students in constructing their own knowledge . For example, students working individually or in small groups can plan and perform data collection and analyses where the teacher serves in the role of a consultant, rather than a director . This approach gives students ample opportunity to think through problems, make decisions and share questions and conclusions with other students as well as with the teacher .
Important components of the course should include the use of technol ogy, projects and laboratories, cooperative group problem-solving, and writing, as a part of concept-oriented instruction and assessment . This approach to teaching AP Statistics will allow students to build interdisciplinary connections with other subjects and with their world outside school .
©2010TheCollegeBoard.VisittheCollegeBoardontheWeb:www.collegeboard.com.
6
The AP Statistics course depends heavily on the availability of tech nology suitable for the interactive, investigative aspects of data analysis . Therefore, schools should make every effort to provide students and teachers easy access to computers to facilitate the teaching and learning of statistics .
Providing instructional information and educational opportunities for teachers is an important component of the AP Program . The College Board offers workshops, summer courses and institutes for teachers in all AP courses . Further information about these and other training opportunities may be obtained at AP Central
(apcentral .collegeboard .com) and from your College Board regional office (contact information is on the inside back cover) . The Teachers’ Resources section of AP Central offers reviews of textbooks, articles, websites and other teaching resources . The electronic discussion groups (EDGs) accessible through AP Central also provide a moderated forum for exchanging ideas, insights and practices among members of the AP professional community .
Additionally, the following publications provide some insight into the philosophy of the AP Statistics course .
Cobb, George, “Teaching Statistics: More Data, Less Lecturing .” 1992 . In Heeding the Call for Change: Suggestions for Curricular Action, ed . Lynn Arthur . Washington, D .C .: Mathematical Association of America . To order MAA publications call 800-331-1622 or go to www .maa .org .
Gordon, Florence and Sheldon, eds . 1992 . Statistics for the Twenty-First Century, MAA Notes No . 26 . Washington, D .C .: Mathematical Association of America .
Moore, Thomas, ed . 2000 . Teaching Statistics: Resources for Undergraduate Instructors, MAA Notes Vol . 52 . Washington, D .C .: Mathematical Association of America .
National Council of Teachers of Mathematics . 2003 . Principles and Standards for School Mathematics, 3rd ed . Reston, Va .: National Council of Teachers of Mathematics . www .nctm .org .
CourseContentoverviewThe topics for AP Statistics are divided into four major themes: exploratory analysis (20–30 percent of the exam), planning and conducting a study (10–15 percent of the exam), probability (20–30 percent of the exam), and statistical inference (30–40 percent of the exam) .
I . Exploratory analysis of data makes use of graphical and numerical techniques to study patterns and departures from patterns. In examining distributions of data, students should be able to detect important characteristics, such as shape, location, variability and unusual values . From careful observations of patterns in data, students can generate conjectures about relationships among variables . The notion of how one variable may be associated with another permeates almost all of statistics, from simple comparisons of proportions through linear regression . The difference between association and causation must accompany this conceptual development throughout .
©2010TheCollegeBoard.VisittheCollegeBoardontheWeb:www.collegeboard.com.
7
II . Data must be collected according to a well-developed plan if valid information is to be obtained. If data are to be collected to provide an answer to a question of interest, a careful plan must be developed . Both the type of analysis that is appropriate and the nature of conclusions that can be drawn from that analysis depend in a critical way on how the data was collected . Collecting data in a reasonable way, through either sampling or experimentation, is an essential step in the data analysis process .
III . Probability is the tool used for anticipating what the distribution of data should look like under a given model. Random phenomena are not haphazard: they display an order that emerges only in the long run and is described by a distribution . The mathematical descrip tion of variation is central to statistics . The probability required for statistical inference is not primarily axiomatic or combinatorial but is oriented toward using probability distributions to describe data .
IV . Statistical inference guides the selection of appropriate models. Models and data interact in statistical work: models are used to draw conclusions from data, while the data are allowed to criticize and even falsify the model through inferential and diagnostic methods . Inference from data can be thought of as the process of selecting a reasonable model, including a statement in probability language, of how confident one can be about the selection .
T o p I C o u T l I n eFollowing is an outline of the major topics covered by the AP Statistics Exam . The ordering here is intended to define the scope of the course but not necessarily the sequence . The percentages in parentheses for each content area indicate the coverage for that content area in the exam .
I . Exploring Data: Describing patterns and departures from patterns (20%–30%)
Exploratory analysis of data makes use of graphical and numerical techniques tostudy patterns and departures from patterns. Emphasis should be placed on interpreting information from graphical and numerical displays and summaries .
A . Constructing and interpreting graphical displays of distributions of univariate data (dotplot, stemplot, histogram, cumulative frequency plot)1 . Center and spread2 . Clusters and gaps3 . Outliers and other unusual features4 . Shape
B . Summarizing distributions of univariate data1 . Measuring center: median, mean2 . Measuring spread: range, interquartile range, standard deviation3 . Measuring position: quartiles, percentiles, standardized scores (z-scores)4 . Using boxplots5 . The effect of changing units on summary measures
©2010TheCollegeBoard.VisittheCollegeBoardontheWeb:www.collegeboard.com.
8
C . Comparing distributions of univariate data (dotplots, back-to-back stemplots, parallel boxplots)1 . Comparing center and spread: within group, between group variation2 . Comparing clusters and gaps3 . Comparing outliers and other unusual features4 . Comparing shapes
D . Exploring bivariate data1 . Analyzing patterns in scatterplots2 . Correlation and linearity3 . Least-squares regression line4 . Residual plots, outliers and influential points5 . Transformations to achieve linearity: logarithmic and
power transformationsE . Exploring categorical data
1 . Frequency tables and bar charts2 . Marginal and joint frequencies for two-way tables3 . Conditional relative frequencies and association4 . Comparing distributions using bar charts
II . Sampling and Experimentation: Planning and conducting a study (10%–15%)
Data must be collected according to a well-developed plan if valid information on a conjecture is to be obtained. This plan includes clarifying the question and deciding upon a method of data collection and analysis.
A . Overview of methods of data collection1 . Census2 . Sample survey3 . Experiment4 . Observational study
B . Planning and conducting surveys1 . Characteristics of a well-designed and well-conducted survey2 . Populations, samples and random selection3 . Sources of bias in sampling and surveys4 . Sampling methods, including simple random sampling, stratified random
sampling and cluster samplingC . Planning and conducting experiments
1 . Characteristics of a well-designed and well-conducted experiment2 . Treatments, control groups, experimental units, random assignments
and replication3 . Sources of bias and confounding, including placebo effect and blinding4 . Completely randomized design5 . Randomized block design, including matched pairs design
D . Generalizability of results and types of conclusions that can be drawn from observational studies, experiments and surveys
©2010TheCollegeBoard.VisittheCollegeBoardontheWeb:www.collegeboard.com.
9
III . Anticipating Patterns: Exploring random phenomena using probability and simulation (20%–30%)
Probability is the tool used for anticipating what the distribution of data should look like under a given model.
A . Probability1 . Interpreting probability, including long-run relative frequency
interpretation2 . “Law of Large Numbers” concept3 . Addition rule, multiplication rule, conditional probability and
independence4 . Discrete random variables and their probability distributions, including
binomial and geometric 5 . Simulation of random behavior and probability distributions6 . Mean (expected value) and standard deviation of a random variable, and
linear transformation of a random variableB . Combining independent random variables
1 . Notion of independence versus dependence2 . Mean and standard deviation for sums and differences of independent
random variablesC . The normal distribution
1 . Properties of the normal distribution2 . Using tables of the normal distribution3 . The normal distribution as a model for measurements
D . Sampling distributions1 . Sampling distribution of a sample proportion2 . Sampling distribution of a sample mean3 . Central Limit Theorem4 . Sampling distribution of a difference between two independent
sample proportions5 . Sampling distribution of a difference between two independent
sample means6 . Simulation of sampling distributions7 . t-distribution8 . Chi-square distribution
IV . Statistical Inference: Estimating population parameters and testing hypotheses (30%–40%)
Statistical inference guides the selection of appropriate models.
A . Estimation (point estimators and confidence intervals)1 . Estimating population parameters and margins of error2 . Properties of point estimators, including unbiasedness and variability3 . Logic of confidence intervals, meaning of confidence level and confidence
intervals, and properties of confidence intervals4 . Large sample confidence interval for a proportion5 . Large sample confidence interval for a difference between two proportions
©2010TheCollegeBoard.VisittheCollegeBoardontheWeb:www.collegeboard.com.
10
6 . Confidence interval for a mean7 . Confidence interval for a difference between two means (unpaired
and paired)8 . Confidence interval for the slope of a least-squares regression line
B . Tests of significance1 . Logic of significance testing, null and alternative hypotheses; p-values;
one- and two-sided tests; concepts of Type I and Type II errors; concept of power
2 . Large sample test for a proportion3 . Large sample test for a difference between two proportions4 . Test for a mean5 . Test for a difference between two means (unpaired and paired)6 . Chi-square test for goodness of fit, homogeneity of proportions, and
independence (one- and two-way tables)7 . Test for the slope of a least-squares regression line
TheuseofTechnologyThe AP Statistics course adheres to the philosophy and methods of modern data analysis . Although the distinction between graphing calculators and computers is becoming blurred as technology advances, at present the fundamental tool of data analysis is the computer . The computer does more than eliminate the drudgery of hand computation and graphing — it is an essential tool for structured inquiry .
Data analysis is a journey of discovery . It is an iterative process that involves a dialogue between the data and a mathematical model . As more is learned about the data, the model is refined and new questions are formed . The computer aids in this journey in some essential ways . First, it produces graphs that are specifically designed for data analysis . These graphical displays make it easier to observe patterns in data, to identify important subgroups of the data and to locate any unusual data points . Second, the computer allows the student to fit complex mathematical models to the data and to assess how well the model fits the data by examining the residuals . Finally, the computer is helpful in identifying an observation that has an undue influence on the analysis and in isolating its effects .
In addition to its use in data analysis, the computer facilitates the simulation approach to probability that is emphasized in the AP Statistics course . Probabilities of random events, probability distributions of random variables and sampling distributions of statistics can be studied conceptually, using simulation . This frees the student and teacher from a narrow approach that depends on a few simple probabilistic models .
Because the computer is central to what statisticians do, it is considered essential for teaching the AP Statistics course . However, it is not yet possible for students to have access to a computer during the AP Statistics Exam . Without a computer and under the conditions of a timed exam, students cannot be asked to perform the amount of computation that is needed for many statistical investigations . Consequently, standard computer output will be provided as necessary and students will be expected to interpret it . (See two examples of computer output in the Multiple-Choice Questions section on pages 21 and 23 .)
©2010TheCollegeBoard.VisittheCollegeBoardontheWeb:www.collegeboard.com.
11
A graphing calculator is a useful computational aid, particularly in analyzing small data sets, but should not be considered equivalent to a computer in the teaching of statistics . If a graphing calculator is used in the course, its computational capabilities should include standard statistical univariate and bivariate summaries through linear regression . Its graphical capabilities should include common univariate and bivariate displays such as histograms, boxplots and scatterplots . Students find calculators where data are entered into a spreadsheet format particularly easy to use . Ideally, students should have access to both computers and calculators for work in and outside the classroom .
Currently, the graphing calculator is the only computational aid that is available to students for use as a tool for data analysis on the AP Exam . Students who utilize graphing calculators on the exam should be aware of the following policy .
It is not only inappropriate, but unethical, for students who are taking the AP Statistics Exam to have access to any information in their graphing calculators or elsewhere that is not directly related to upgrading the statistical functionality of older graphing calculators to make them comparable to statistical features found on newer models .
During the exam, students are not permitted to have access to any information in their graphing calculators or elsewhere that is not directly related to upgrading the statistical functionality of older graphing calculators to make them comparable to statistical features found on newer models .
Acceptable upgrades include improving the calculator’s computational functional-ities and/or graphical functionalities for data that students key into the calculator while taking the exam .
Unacceptable enhancements include, but are not limited to, keying or scanning text or response templates into the calculator . Students attempting to augment the capabilities of their graphing calculators in any way other than for the purpose of upgrading features, as described above, will be considered to be cheating on the exam .
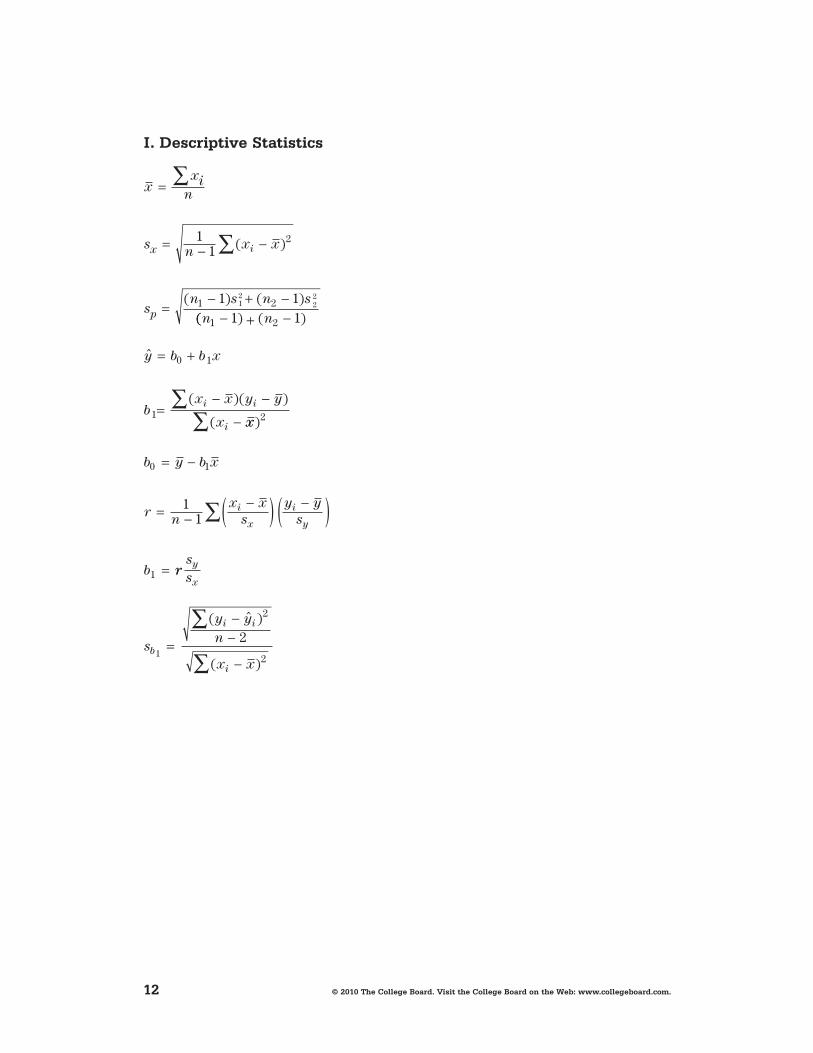
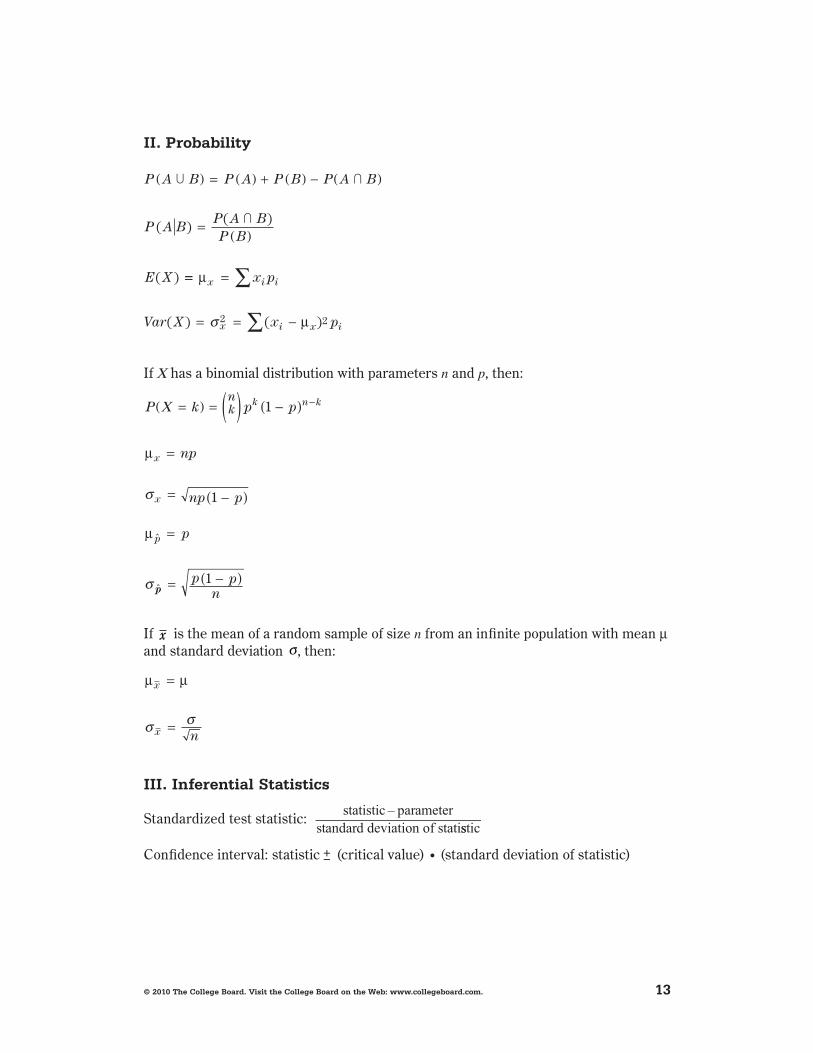
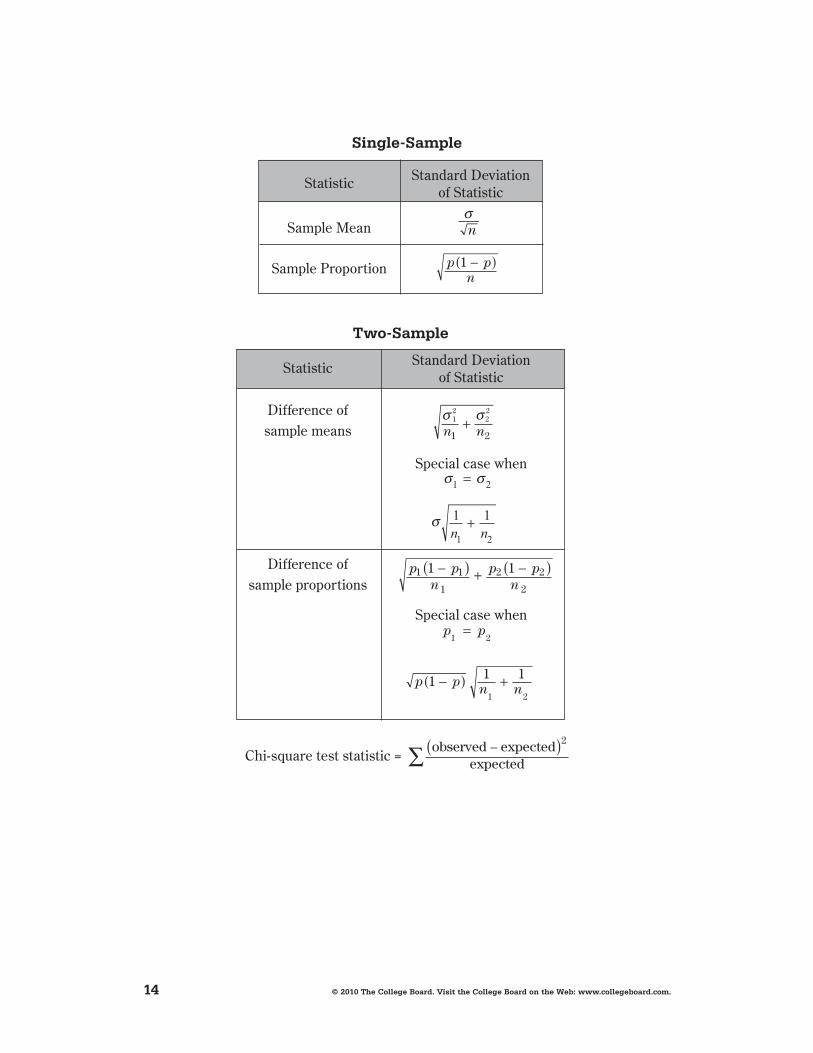
FormulasandTablesStudents enrolled in the AP Statistics course should concentrate their time and effort on developing a thorough understanding of the fundamental concepts of statistics . They do not need to memorize formulas .
The following list of formulas and tables will be furnished to students taking the AP Statistics Exam . Teachers are encouraged to familiarize their students with the form and notation of these formulas by making them accessible at the appropriate times during the course .
©2010TheCollegeBoard.VisittheCollegeBoardontheWeb:www.collegeboard.com.
12
I.descriptivestatistics
x x i
n
s n x x
s n s n s
x
p
i
=
= − −
= − + −
∑
∑ 1 1
1 1
2
1 2 1 2
2 2
( )
( ) ( ) ( ( ) ( )
ˆ
( ) ( )
(
n n
y b b x
b x x y y
x
i i
i
1 2
0 1
1
1 1 − + −
= +
= − −
− ∑
x x
b y b x
r n x x
s y y
s
b
i
x
i
y
) 2
0 1
1
1 1
∑
∑
= −
= − − ( ) −
= r r s s
s
y yn
x x
y
x
b
i i
i
1
2
2
2=
−−
−
∑
∑
( ˆ )
( )
( )
©2010TheCollegeBoard.VisittheCollegeBoardontheWeb:www.collegeboard.com.
13
II.probability
P A B P A P B P A B
P A BP A BP B
E X
U I
I
( ) = ( ) + ( ) − ( )
= ( )( )( )
( ) == =
= = −
∑
∑
µ
µ
x i i
x i x i
x p
Var X x p( ) ( )σ 2 2
If C has a binomial distribution with parameters n and p, then:
P k p p
np
np p
p
kn k n k
x
p
Χ =( ) = ( ) −( )
=
= −( )
=
−1
1
µ
µ
x
σ
σ
ˆ
ppp p
n= −( )1
If x is the mean of a random sample of size n from an infinite population with mean μ and standard deviation σ, then:
µ µx
x n
=
=σ σ
III.Inferentialstatistics
Standardized test statistic: statistic – parameterstandard deviation of statisstic
Confidence interval: statistic (critical value) • (standard deviation of statistic)
©2010TheCollegeBoard.VisittheCollegeBoardontheWeb:www.collegeboard.com.
14
single-sample
Two-sample
Statistic Standard Deviation of Statistic
Difference of sample means
Special case when
Difference of sample proportions
Special case when
Statistic Standard Deviation of Statistic
Sample Mean
Sample Proportion
σn
p pn
1 −( )
σ σ12
22
1 2n n+
σ σ
σ
1 2
1 2
1 1
=
+n n
p pn
p pn
1 1
1
2 2
2
1 1−( ) + −( )
p p
p p n n
1 2
1 2
1 1 1
=
−( ) +
Chi-square test statistic = observed – expected
expected
2( )∑
©2010TheCollegeBoard.VisittheCollegeBoardontheWeb:www.collegeboard.com.
15
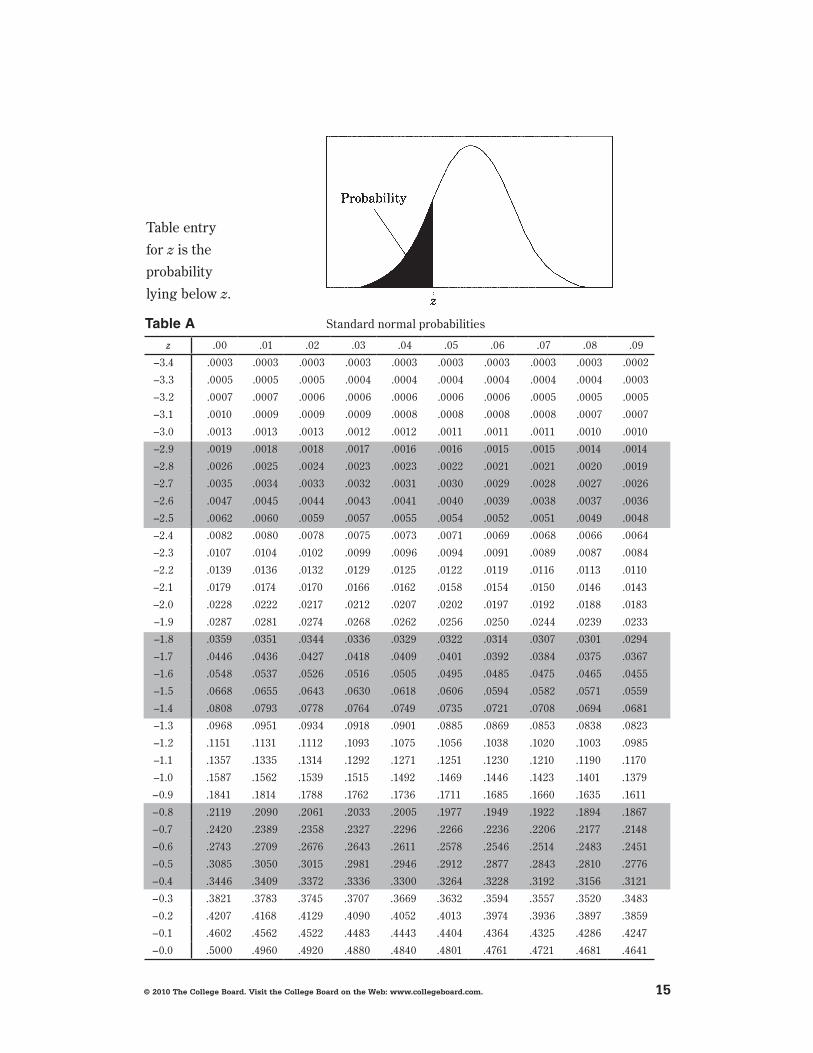
Table entry
for z is the
probability
lying below z .
Table A Standard normal probabilities
z .00 .01 .02 .03 .04 .05 .06 .07 .08 .09
–3 .4 .0003 .0003 .0003 .0003 .0003 .0003 .0003 .0003 .0003 .0002
–3 .3 .0005 .0005 .0005 .0004 .0004 .0004 .0004 .0004 .0004 .0003
–3 .2 .0007 .0007 .0006 .0006 .0006 .0006 .0006 .0005 .0005 .0005
–3 .1 .0010 .0009 .0009 .0009 .0008 .0008 .0008 .0008 .0007 .0007
–3 .0 .0013 .0013 .0013 .0012 .0012 .0011 .0011 .0011 .0010 .0010
–2 .9 .0019 .0018 .0018 .0017 .0016 .0016 .0015 .0015 .0014 .0014
–2 .8 .0026 .0025 .0024 .0023 .0023 .0022 .0021 .0021 .0020 .0019
–2 .7 .0035 .0034 .0033 .0032 .0031 .0030 .0029 .0028 .0027 .0026
–2 .6 .0047 .0045 .0044 .0043 .0041 .0040 .0039 .0038 .0037 .0036
–2 .5 .0062 .0060 .0059 .0057 .0055 .0054 .0052 .0051 .0049 .0048
–2 .4 .0082 .0080 .0078 .0075 .0073 .0071 .0069 .0068 .0066 .0064
–2 .3 .0107 .0104 .0102 .0099 .0096 .0094 .0091 .0089 .0087 .0084
–2 .2 .0139 .0136 .0132 .0129 .0125 .0122 .0119 .0116 .0113 .0110
–2 .1 .0179 .0174 .0170 .0166 .0162 .0158 .0154 .0150 .0146 .0143
–2 .0 .0228 .0222 .0217 .0212 .0207 .0202 .0197 .0192 .0188 .0183
–1 .9 .0287 .0281 .0274 .0268 .0262 .0256 .0250 .0244 .0239 .0233
–1 .8 .0359 .0351 .0344 .0336 .0329 .0322 .0314 .0307 .0301 .0294
–1 .7 .0446 .0436 .0427 .0418 .0409 .0401 .0392 .0384 .0375 .0367
–1 .6 .0548 .0537 .0526 .0516 .0505 .0495 .0485 .0475 .0465 .0455
–1 .5 .0668 .0655 .0643 .0630 .0618 .0606 .0594 .0582 .0571 .0559
–1 .4 .0808 .0793 .0778 .0764 .0749 .0735 .0721 .0708 .0694 .0681
–1 .3 .0968 .0951 .0934 .0918 .0901 .0885 .0869 .0853 .0838 .0823
–1 .2 .1151 .1131 .1112 .1093 .1075 .1056 .1038 .1020 .1003 .0985
–1 .1 .1357 .1335 .1314 .1292 .1271 .1251 .1230 .1210 .1190 .1170
–1 .0 .1587 .1562 .1539 .1515 .1492 .1469 .1446 .1423 .1401 .1379
–0 .9 .1841 .1814 .1788 .1762 .1736 .1711 .1685 .1660 .1635 .1611
–0 .8 .2119 .2090 .2061 .2033 .2005 .1977 .1949 .1922 .1894 .1867
–0 .7 .2420 .2389 .2358 .2327 .2296 .2266 .2236 .2206 .2177 .2148
–0 .6 .2743 .2709 .2676 .2643 .2611 .2578 .2546 .2514 .2483 .2451
–0 .5 .3085 .3050 .3015 .2981 .2946 .2912 .2877 .2843 .2810 .2776
–0 .4 .3446 .3409 .3372 .3336 .3300 .3264 .3228 .3192 .3156 .3121
–0 .3 .3821 .3783 .3745 .3707 .3669 .3632 .3594 .3557 .3520 .3483
–0 .2 .4207 .4168 .4129 .4090 .4052 .4013 .3974 .3936 .3897 .3859
–0 .1 .4602 .4562 .4522 .4483 .4443 .4404 .4364 .4325 .4286 .4247
–0 .0 .5000 .4960 .4920 .4880 .4840 .4801 .4761 .4721 .4681 .4641
©2010TheCollegeBoard.VisittheCollegeBoardontheWeb:www.collegeboard.com.
16
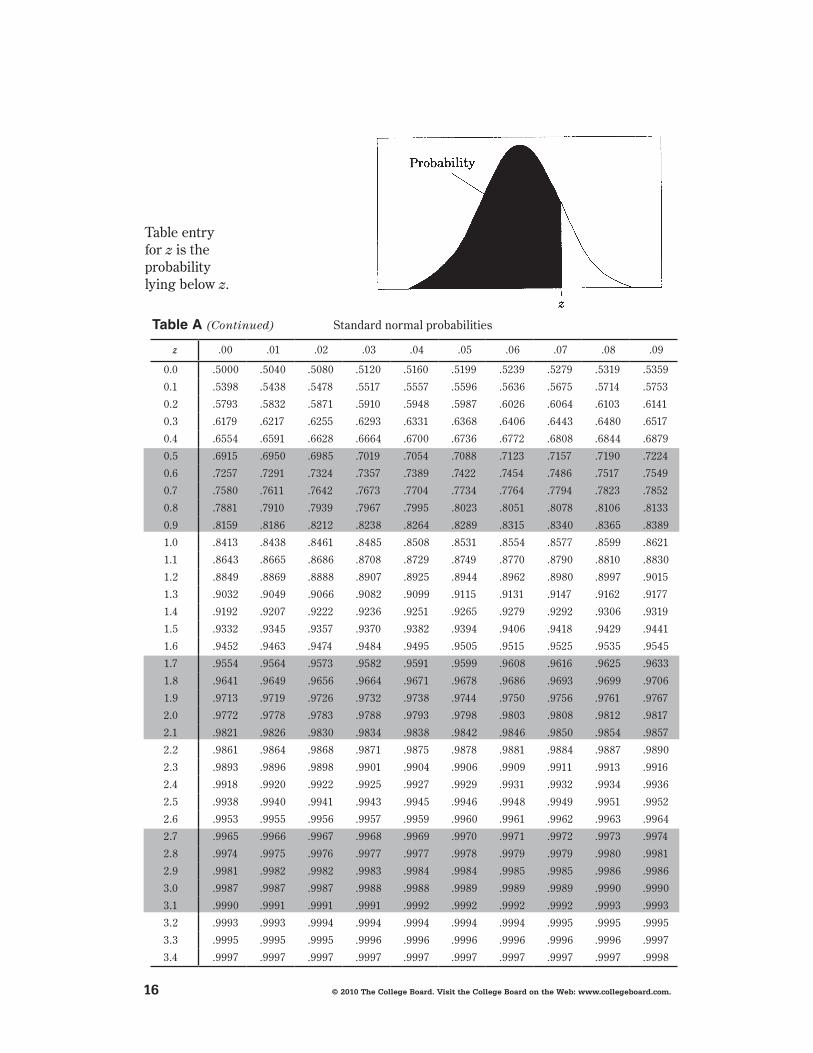
Table A (Continued) Standard normal probabilities
z .00 .01 .02 .03 .04 .05 .06 .07 .08 .09
0 .0 .5000 .5040 .5080 .5120 .5160 .5199 .5239 .5279 .5319 .5359
0 .1 .5398 .5438 .5478 .5517 .5557 .5596 .5636 .5675 .5714 .5753
0 .2 .5793 .5832 .5871 .5910 .5948 .5987 .6026 .6064 .6103 .6141
0 .3 .6179 .6217 .6255 .6293 .6331 .6368 .6406 .6443 .6480 .6517
0 .4 .6554 .6591 .6628 .6664 .6700 .6736 .6772 .6808 .6844 .6879
0 .5 .6915 .6950 .6985 .7019 .7054 .7088 .7123 .7157 .7190 .7224
0 .6 .7257 .7291 .7324 .7357 .7389 .7422 .7454 .7486 .7517 .7549
0 .7 .7580 .7611 .7642 .7673 .7704 .7734 .7764 .7794 .7823 .7852
0 .8 .7881 .7910 .7939 .7967 .7995 .8023 .8051 .8078 .8106 .8133
0 .9 .8159 .8186 .8212 .8238 .8264 .8289 .8315 .8340 .8365 .8389
1 .0 .8413 .8438 .8461 .8485 .8508 .8531 .8554 .8577 .8599 .8621
1 .1 .8643 .8665 .8686 .8708 .8729 .8749 .8770 .8790 .8810 .8830
1 .2 .8849 .8869 .8888 .8907 .8925 .8944 .8962 .8980 .8997 .9015
1 .3 .9032 .9049 .9066 .9082 .9099 .9115 .9131 .9147 .9162 .9177
1 .4 .9192 .9207 .9222 .9236 .9251 .9265 .9279 .9292 .9306 .9319
1 .5 .9332 .9345 .9357 .9370 .9382 .9394 .9406 .9418 .9429 .9441
1 .6 .9452 .9463 .9474 .9484 .9495 .9505 .9515 .9525 .9535 .9545
1 .7 .9554 .9564 .9573 .9582 .9591 .9599 .9608 .9616 .9625 .9633
1 .8 .9641 .9649 .9656 .9664 .9671 .9678 .9686 .9693 .9699 .9706
1 .9 .9713 .9719 .9726 .9732 .9738 .9744 .9750 .9756 .9761 .9767
2 .0 .9772 .9778 .9783 .9788 .9793 .9798 .9803 .9808 .9812 .9817
2 .1 .9821 .9826 .9830 .9834 .9838 .9842 .9846 .9850 .9854 .9857
2 .2 .9861 .9864 .9868 .9871 .9875 .9878 .9881 .9884 .9887 .9890
2 .3 .9893 .9896 .9898 .9901 .9904 .9906 .9909 .9911 .9913 .9916
2 .4 .9918 .9920 .9922 .9925 .9927 .9929 .9931 .9932 .9934 .9936
2 .5 .9938 .9940 .9941 .9943 .9945 .9946 .9948 .9949 .9951 .9952
2 .6 .9953 .9955 .9956 .9957 .9959 .9960 .9961 .9962 .9963 .9964
2 .7 .9965 .9966 .9967 .9968 .9969 .9970 .9971 .9972 .9973 .9974
2 .8 .9974 .9975 .9976 .9977 .9977 .9978 .9979 .9979 .9980 .9981
2 .9 .9981 .9982 .9982 .9983 .9984 .9984 .9985 .9985 .9986 .9986
3 .0 .9987 .9987 .9987 .9988 .9988 .9989 .9989 .9989 .9990 .9990
3 .1 .9990 .9991 .9991 .9991 .9992 .9992 .9992 .9992 .9993 .9993
3 .2 .9993 .9993 .9994 .9994 .9994 .9994 .9994 .9995 .9995 .9995
3 .3 .9995 .9995 .9995 .9996 .9996 .9996 .9996 .9996 .9996 .9997
3 .4 .9997 .9997 .9997 .9997 .9997 .9997 .9997 .9997 .9997 .9998
Table entry for z is theprobability lying below z .
©2010TheCollegeBoard.VisittheCollegeBoardontheWeb:www.collegeboard.com.
17
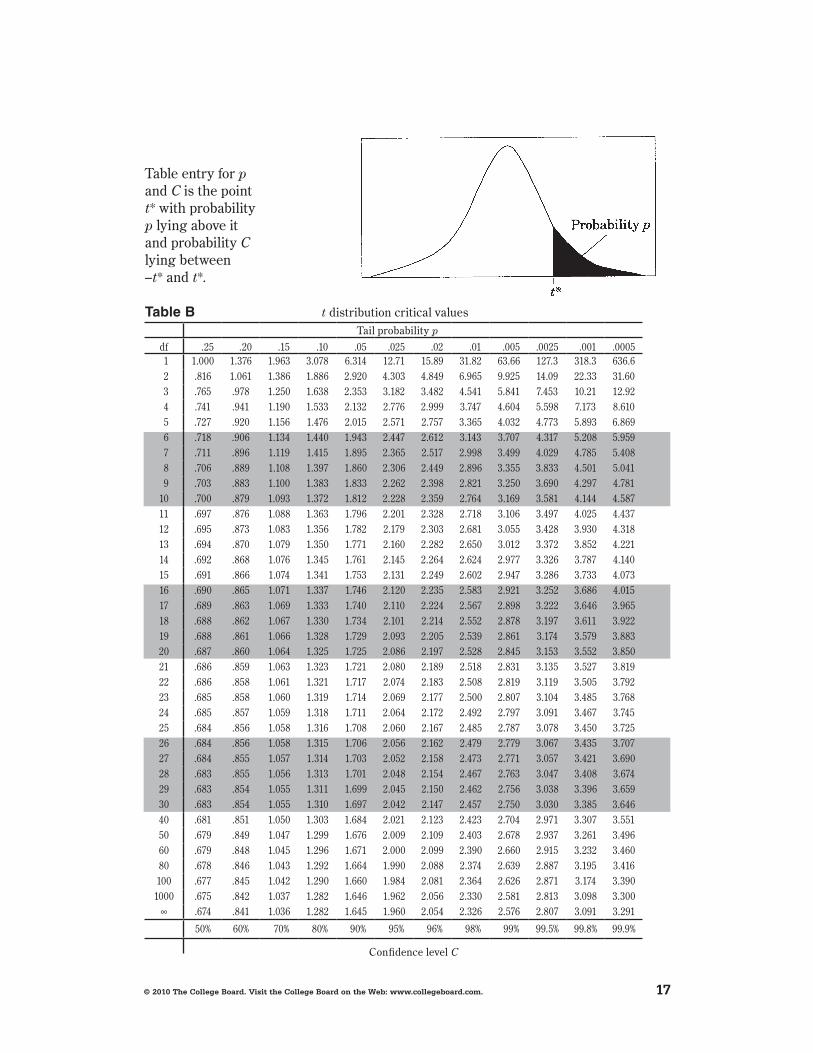
Table entry for pand C is the pointt* with probability p lying above it and probability C lying between –t* and t* .
Table B t distribution critical valuesTail probability p
df .25 .20 .15 .10 .05 .025 .02 .01 .005 .0025 .001 .0005 1 1 .000 1 .376 1 .963 3 .078 6 .314 12 .71 15 .89 31 .82 63 .66 127 .3 318 .3 636 .6 2 .816 1 .061 1 .386 1 .886 2 .920 4 .303 4 .849 6 .965 9 .925 14 .09 22 .33 31 .60 3 .765 .978 1 .250 1 .638 2 .353 3 .182 3 .482 4 .541 5 .841 7 .453 10 .21 12 .92 4 .741 .941 1 .190 1 .533 2 .132 2 .776 2 .999 3 .747 4 .604 5 .598 7 .173 8 .610 5 .727 .920 1 .156 1 .476 2 .015 2 .571 2 .757 3 .365 4 .032 4 .773 5 .893 6 .869 6 .718 .906 1 .134 1 .440 1 .943 2 .447 2 .612 3 .143 3 .707 4 .317 5 .208 5 .959 7 .711 .896 1 .119 1 .415 1 .895 2 .365 2 .517 2 .998 3 .499 4 .029 4 .785 5 .408 8 .706 .889 1 .108 1 .397 1 .860 2 .306 2 .449 2 .896 3 .355 3 .833 4 .501 5 .041 9 .703 .883 1 .100 1 .383 1 .833 2 .262 2 .398 2 .821 3 .250 3 .690 4 .297 4 .78110 .700 .879 1 .093 1 .372 1 .812 2 .228 2 .359 2 .764 3 .169 3 .581 4 .144 4 .58711 .697 .876 1 .088 1 .363 1 .796 2 .201 2 .328 2 .718 3 .106 3 .497 4 .025 4 .43712 .695 .873 1 .083 1 .356 1 .782 2 .179 2 .303 2 .681 3 .055 3 .428 3 .930 4 .31813 .694 .870 1 .079 1 .350 1 .771 2 .160 2 .282 2 .650 3 .012 3 .372 3 .852 4 .22114 .692 .868 1 .076 1 .345 1 .761 2 .145 2 .264 2 .624 2 .977 3 .326 3 .787 4 .14015 .691 .866 1 .074 1 .341 1 .753 2 .131 2 .249 2 .602 2 .947 3 .286 3 .733 4 .07316 .690 .865 1 .071 1 .337 1 .746 2 .120 2 .235 2 .583 2 .921 3 .252 3 .686 4 .01517 .689 .863 1 .069 1 .333 1 .740 2 .110 2 .224 2 .567 2 .898 3 .222 3 .646 3 .96518 .688 .862 1 .067 1 .330 1 .734 2 .101 2 .214 2 .552 2 .878 3 .197 3 .611 3 .92219 .688 .861 1 .066 1 .328 1 .729 2 .093 2 .205 2 .539 2 .861 3 .174 3 .579 3 .88320 .687 .860 1 .064 1 .325 1 .725 2 .086 2 .197 2 .528 2 .845 3 .153 3 .552 3 .85021 .686 .859 1 .063 1 .323 1 .721 2 .080 2 .189 2 .518 2 .831 3 .135 3 .527 3 .81922 .686 .858 1 .061 1 .321 1 .717 2 .074 2 .183 2 .508 2 .819 3 .119 3 .505 3 .79223 .685 .858 1 .060 1 .319 1 .714 2 .069 2 .177 2 .500 2 .807 3 .104 3 .485 3 .76824 .685 .857 1 .059 1 .318 1 .711 2 .064 2 .172 2 .492 2 .797 3 .091 3 .467 3 .74525 .684 .856 1 .058 1 .316 1 .708 2 .060 2 .167 2 .485 2 .787 3 .078 3 .450 3 .72526 .684 .856 1 .058 1 .315 1 .706 2 .056 2 .162 2 .479 2 .779 3 .067 3 .435 3 .70727 .684 .855 1 .057 1 .314 1 .703 2 .052 2 .158 2 .473 2 .771 3 .057 3 .421 3 .69028 .683 .855 1 .056 1 .313 1 .701 2 .048 2 .154 2 .467 2 .763 3 .047 3 .408 3 .67429 .683 .854 1 .055 1 .311 1 .699 2 .045 2 .150 2 .462 2 .756 3 .038 3 .396 3 .65930 .683 .854 1 .055 1 .310 1 .697 2 .042 2 .147 2 .457 2 .750 3 .030 3 .385 3 .64640 .681 .851 1 .050 1 .303 1 .684 2 .021 2 .123 2 .423 2 .704 2 .971 3 .307 3 .55150 .679 .849 1 .047 1 .299 1 .676 2 .009 2 .109 2 .403 2 .678 2 .937 3 .261 3 .49660 .679 .848 1 .045 1 .296 1 .671 2 .000 2 .099 2 .390 2 .660 2 .915 3 .232 3 .46080 .678 .846 1 .043 1 .292 1 .664 1 .990 2 .088 2 .374 2 .639 2 .887 3 .195 3 .416100 .677 .845 1 .042 1 .290 1 .660 1 .984 2 .081 2 .364 2 .626 2 .871 3 .174 3 .390
1000 .675 .842 1 .037 1 .282 1 .646 1 .962 2 .056 2 .330 2 .581 2 .813 3 .098 3 .300∞ .674 .841 1 .036 1 .282 1 .645 1 .960 2 .054 2 .326 2 .576 2 .807 3 .091 3 .291
50% 60% 70% 80% 90% 95% 96% 98% 99% 99 .5% 99 .8% 99 .9%
Confidence level C
©2010TheCollegeBoard.VisittheCollegeBoardontheWeb:www.collegeboard.com.
18
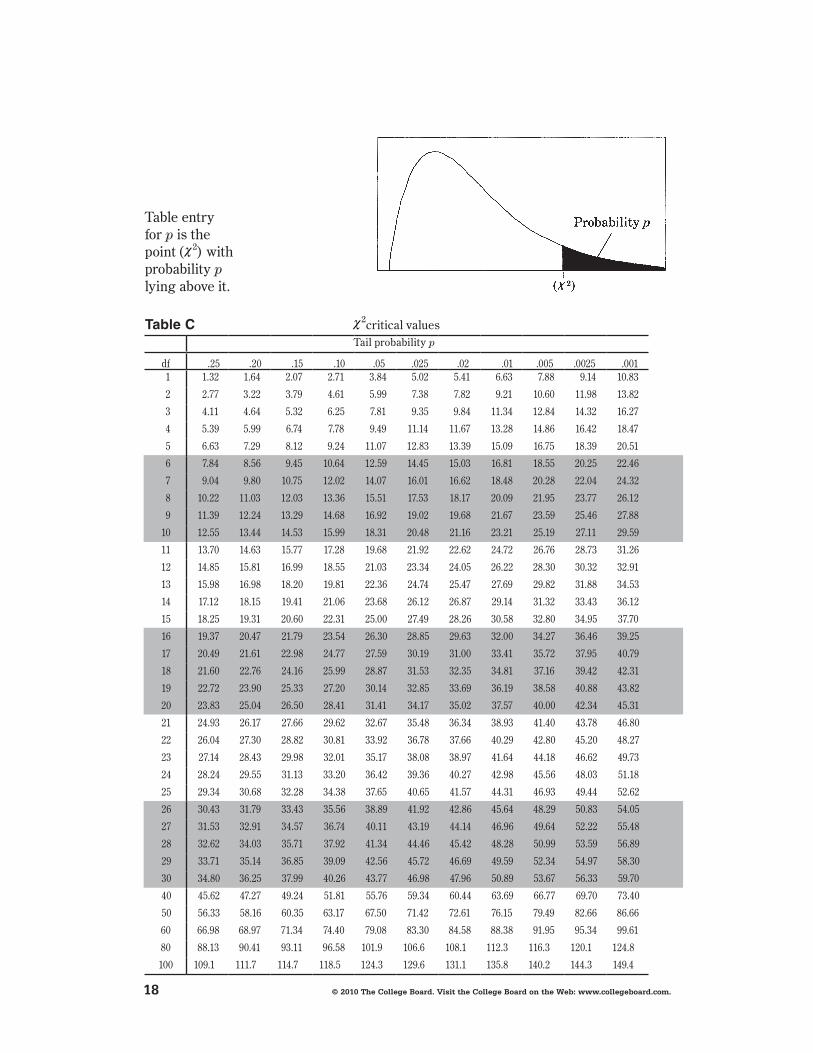
Table C χ 2critical valuesTail probability p
df .25 .20 .15 .10 .05 .025 .02 .01 .005 .0025 .001 1 1 .32 1 .64 2 .07 2 .71 3 .84 5 .02 5 .41 6 .63 7 .88 9 .14 10 .83
2 2 .77 3 .22 3 .79 4 .61 5 .99 7 .38 7 .82 9 .21 10 .60 11 .98 13 .82
3 4 .11 4 .64 5 .32 6 .25 7 .81 9 .35 9 .84 11 .34 12 .84 14 .32 16 .27
4 5 .39 5 .99 6 .74 7 .78 9 .49 11 .14 11 .67 13 .28 14 .86 16 .42 18 .47
5 6 .63 7 .29 8 .12 9 .24 11 .07 12 .83 13 .39 15 .09 16 .75 18 .39 20 .51
6 7 .84 8 .56 9 .45 10 .64 12 .59 14 .45 15 .03 16 .81 18 .55 20 .25 22 .46
7 9 .04 9 .80 10 .75 12 .02 14 .07 16 .01 16 .62 18 .48 20 .28 22 .04 24 .32
8 10 .22 11 .03 12 .03 13 .36 15 .51 17 .53 18 .17 20 .09 21 .95 23 .77 26 .12
9 11 .39 12 .24 13 .29 14 .68 16 .92 19 .02 19 .68 21 .67 23 .59 25 .46 27 .88
10 12 .55 13 .44 14 .53 15 .99 18 .31 20 .48 21 .16 23 .21 25 .19 27 .11 29 .59
11 13 .70 14 .63 15 .77 17 .28 19 .68 21 .92 22 .62 24 .72 26 .76 28 .73 31 .26
12 14 .85 15 .81 16 .99 18 .55 21 .03 23 .34 24 .05 26 .22 28 .30 30 .32 32 .91
13 15 .98 16 .98 18 .20 19 .81 22 .36 24 .74 25 .47 27 .69 29 .82 31 .88 34 .53
14 17 .12 18 .15 19 .41 21 .06 23 .68 26 .12 26 .87 29 .14 31 .32 33 .43 36 .12
15 18 .25 19 .31 20 .60 22 .31 25 .00 27 .49 28 .26 30 .58 32 .80 34 .95 37 .70
16 19 .37 20 .47 21 .79 23 .54 26 .30 28 .85 29 .63 32 .00 34 .27 36 .46 39 .25
17 20 .49 21 .61 22 .98 24 .77 27 .59 30 .19 31 .00 33 .41 35 .72 37 .95 40 .79
18 21 .60 22 .76 24 .16 25 .99 28 .87 31 .53 32 .35 34 .81 37 .16 39 .42 42 .31
19 22 .72 23 .90 25 .33 27 .20 30 .14 32 .85 33 .69 36 .19 38 .58 40 .88 43 .82
20 23 .83 25 .04 26 .50 28 .41 31 .41 34 .17 35 .02 37 .57 40 .00 42 .34 45 .31
21 24 .93 26 .17 27 .66 29 .62 32 .67 35 .48 36 .34 38 .93 41 .40 43 .78 46 .80
22 26 .04 27 .30 28 .82 30 .81 33 .92 36 .78 37 .66 40 .29 42 .80 45 .20 48 .27
23 27 .14 28 .43 29 .98 32 .01 35 .17 38 .08 38 .97 41 .64 44 .18 46 .62 49 .73
24 28 .24 29 .55 31 .13 33 .20 36 .42 39 .36 40 .27 42 .98 45 .56 48 .03 51 .18
25 29 .34 30 .68 32 .28 34 .38 37 .65 40 .65 41 .57 44 .31 46 .93 49 .44 52 .62
26 30 .43 31 .79 33 .43 35 .56 38 .89 41 .92 42 .86 45 .64 48 .29 50 .83 54 .05
27 31 .53 32 .91 34 .57 36 .74 40 .11 43 .19 44 .14 46 .96 49 .64 52 .22 55 .48
28 32 .62 34 .03 35 .71 37 .92 41 .34 44 .46 45 .42 48 .28 50 .99 53 .59 56 .89
29 33 .71 35 .14 36 .85 39 .09 42 .56 45 .72 46 .69 49 .59 52 .34 54 .97 58 .30
30 34 .80 36 .25 37 .99 40 .26 43 .77 46 .98 47 .96 50 .89 53 .67 56 .33 59 .70
40 45 .62 47 .27 49 .24 51 .81 55 .76 59 .34 60 .44 63 .69 66 .77 69 .70 73 .40
50 56 .33 58 .16 60 .35 63 .17 67 .50 71 .42 72 .61 76 .15 79 .49 82 .66 86 .66
60 66 .98 68 .97 71 .34 74 .40 79 .08 83 .30 84 .58 88 .38 91 .95 95 .34 99 .61
80 88 .13 90 .41 93 .11 96 .58 101 .9 106 .6 108 .1 112 .3 116 .3 120 .1 124 .8
100 109 .1 111 .7 114 .7 118 .5 124 .3 129 .6 131 .1 135 .8 140 .2 144 .3 149 .4
Table entry for p is thepoint (χ 2) withprobability plying above it .
©2010TheCollegeBoard.VisittheCollegeBoardontheWeb:www.collegeboard.com.
19
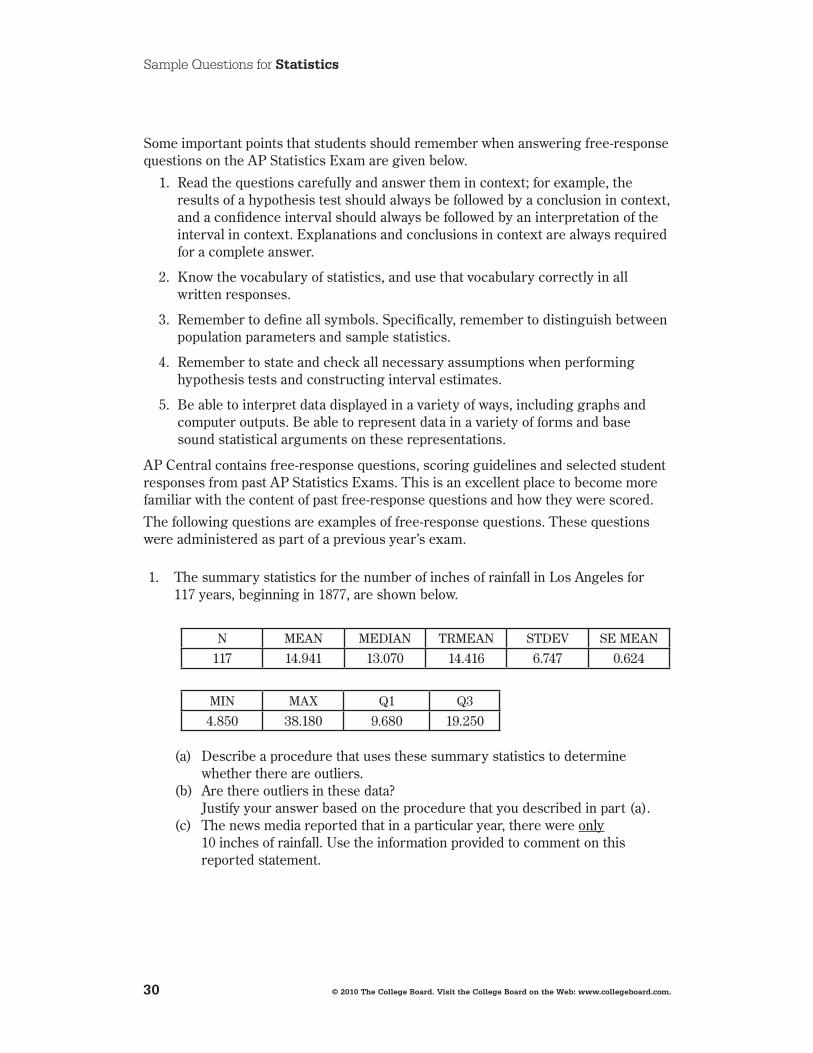
Sample Questions for statistics
T h e e x a mThe AP Statistics Exam is 3 hours long and seeks to determine how well a student has mastered the concepts and techniques of the subject matter of the course . This paper-and-pencil exam consists of (1) a 90-minute multiple-choice section testing proficiency in a wide variety of topics, and (2) a 90-minute free-response section requiring the student to answer open-ended questions and to complete an investigative task involving more extended reasoning . In the determination of the score for the exam, the two sections will be given equal weight .
Each student will be expected to bring a graphing calculator with statistical capabilities to the exam . The expected computational and graphic features for these calculators are described in an earlier section . Minicomputers, pocket organizers, electronic writing pads (e .g ., Newton) and calculators with qwerty (i .e ., typewriter) keyboards will not be allowed . Calculator memories will not be cleared . However, calculator memories may be used only for storing programs, not for storing notes . During the exam, students are not permitted to have access to any information in their graphing calculators or elsewhere that is not directly related to upgrading the statistical functionality of older graphing calculators to make them comparable to statistical features found on newer models . Acceptable upgrades include improving the calculator’s computational functionalities and/or graphical functionalities for data that students key into the calculator while taking the exam . Unacceptable enhancements include, but are not limited to, keying or scanning text or response templates into the calculator . Students attempting to augment the capabilities of their graphing cal culators in any way other than for the purpose of upgrading features as described above will be considered to be cheating on the exam . A student may bring up to two calculators to the exam .
multiple-ChoiceQuestionsThe following are examples of the kinds of multiple-choice questions found on the AP Statistics Exam; the answers to these questions follow question 18 . The distribution of topics and the levels of difficulty are illustrative of the composition of the exam; however, this group of questions does not constitute a complete exam, nor does it show the complete range of questions that appear in an exam .
Multiple-choice scores are based on the number of questions answered correctly . Points are not deducted for incorrect answers, and no points are awarded for unanswered questions . Because no points are deducted for incorrect answers, students are encouraged to answer all multiple-choice questions . On difficult questions, students should eliminate as many incorrect answer choices as they can, and then make an educated guess among the remaining choices .
©2010TheCollegeBoard.VisittheCollegeBoardontheWeb:www.collegeboard.com.
20
Sample Questions for statistics
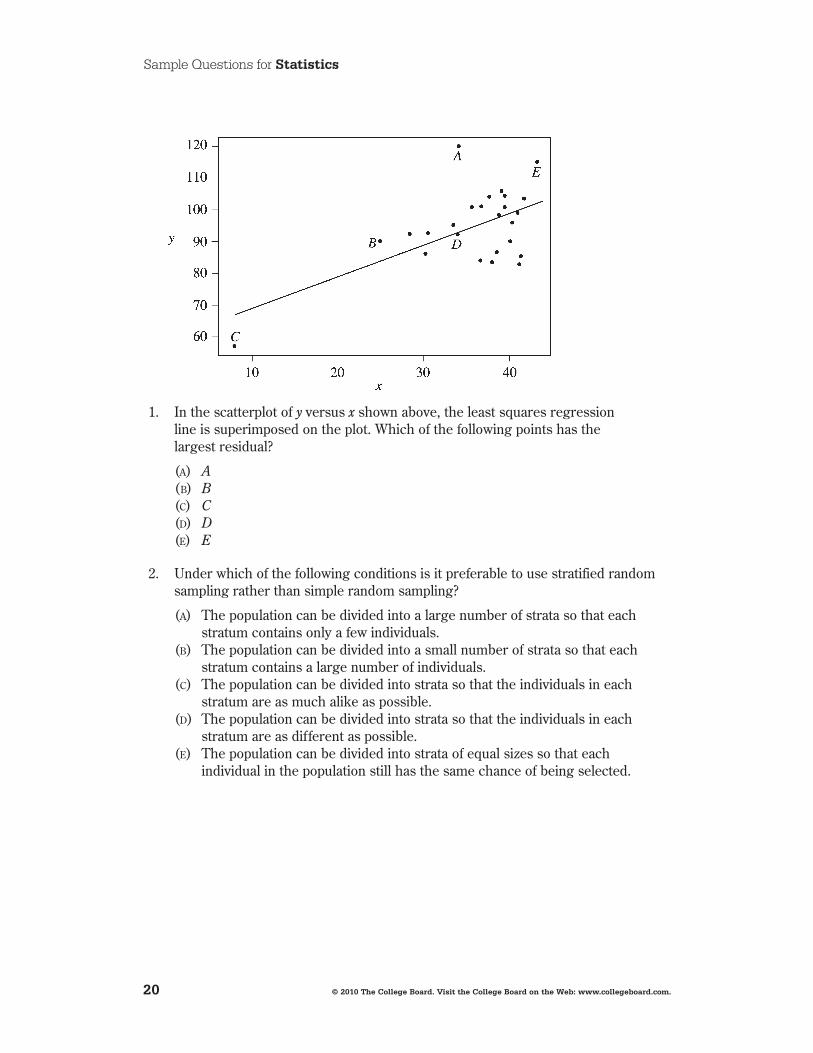
1 . In the scatterplot of y versus x shown above, the least squares regression line is superimposed on the plot . Which of the following points has the largest residual?
(a) A(b) B(c) C(d) D(e) E
2 . Under which of the following conditions is it preferable to use stratified random sampling rather than simple random sampling?
(a) The population can be divided into a large number of strata so that each stratum contains only a few individuals .
(b) The population can be divided into a small number of strata so that each stratum contains a large number of individuals .
(c) The population can be divided into strata so that the individuals in each stratum are as much alike as possible .
(d) The population can be divided into strata so that the individuals in each stratum are as different as possible .
(e) The population can be divided into strata of equal sizes so that each individual in the population still has the same chance of being selected .
©2010TheCollegeBoard.VisittheCollegeBoardontheWeb:www.collegeboard.com.
21
Sample Questions for statistics
3 . All bags entering a research facility are screened . Ninety-seven percent of the bags that contain forbidden material trigger an alarm . Fifteen percent of the bags that do not contain forbidden material also trigger the alarm . If 1 out of every 1,000 bags entering the building contains forbidden material, what is the probability that a bag that triggers the alarm will actually contain forbidden material?
(a) 0 .00097(b) 0 .00640(c) 0 .03000(d) 0 .14550(e) 0 .97000
4 . A candy company claims that 10 percent of its candies are blue . A random sample of 200 of these candies is taken, and 16 are found to be blue . Which of the following tests would be most appropriate for establishing whether the candy company needs to change its claim?
(a) Matched pairs t-test(b) One-sample proportion z-test(c) Two-sample t-test(d) Two-sample proportion z-test(e) Chi-square test of association
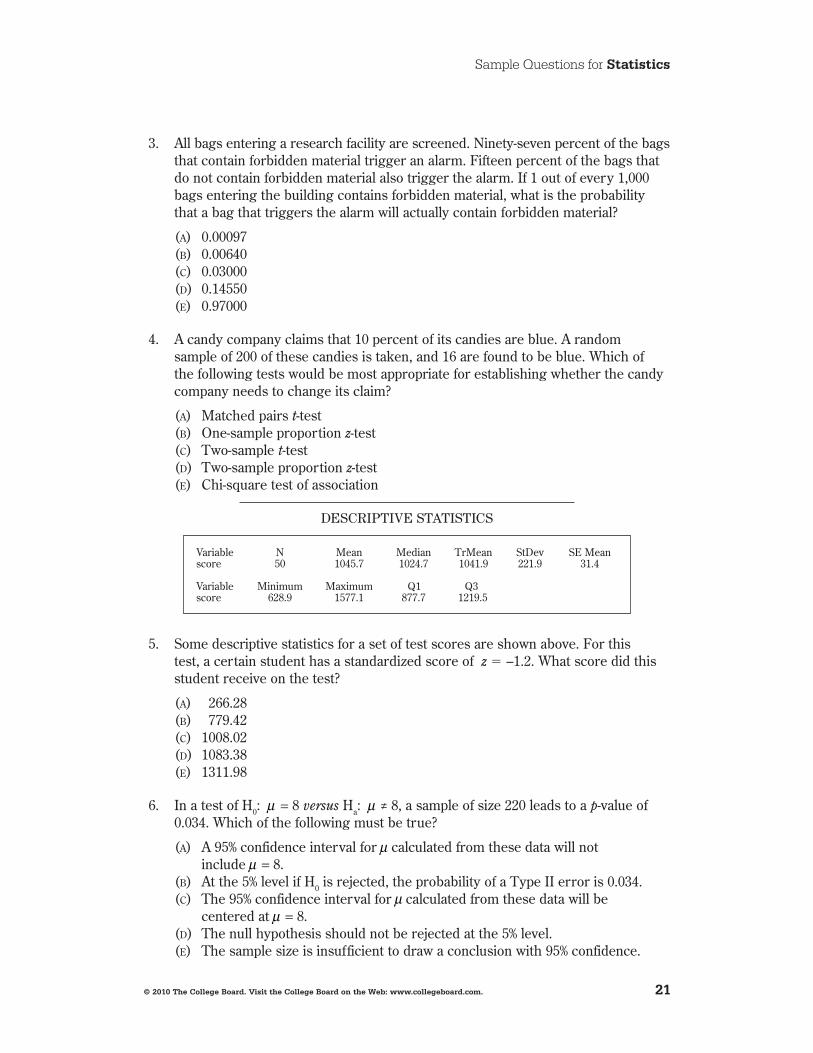
Descriptive statistics
Variable N Mean Median TrMean StDev SE Meanscore 50 1045 .7 1024 .7 1041 .9 221 .9 31 .4
Variable Minimum Maximum Q1 Q3score 628 .9 1577 .1 877 .7 1219 .5
5 . Some descriptive statistics for a set of test scores are shown above . For this test, a certain student has a standardized score of z = –1 .2 . What score did this student receive on the test?
(a) 266 .28(b) 779 .42(c) 1008 .02(d) 1083 .38(e) 1311 .98
6 . In a test of H0: μ = 8 versus Ha: μ ≠ 8, a sample of size 220 leads to a p-value of 0 .034 . Which of the following must be true?
(a) A 95% confidence interval for μ calculated from these data will not include μ = 8 .
(b) At the 5% level if H0 is rejected, the probability of a Type II error is 0 .034 .(c) The 95% confidence interval for μ calculated from these data will be
centered at μ = 8 .(d) The null hypothesis should not be rejected at the 5% level .(e) The sample size is insufficient to draw a conclusion with 95% confidence .
©2010TheCollegeBoard.VisittheCollegeBoardontheWeb:www.collegeboard.com.
22
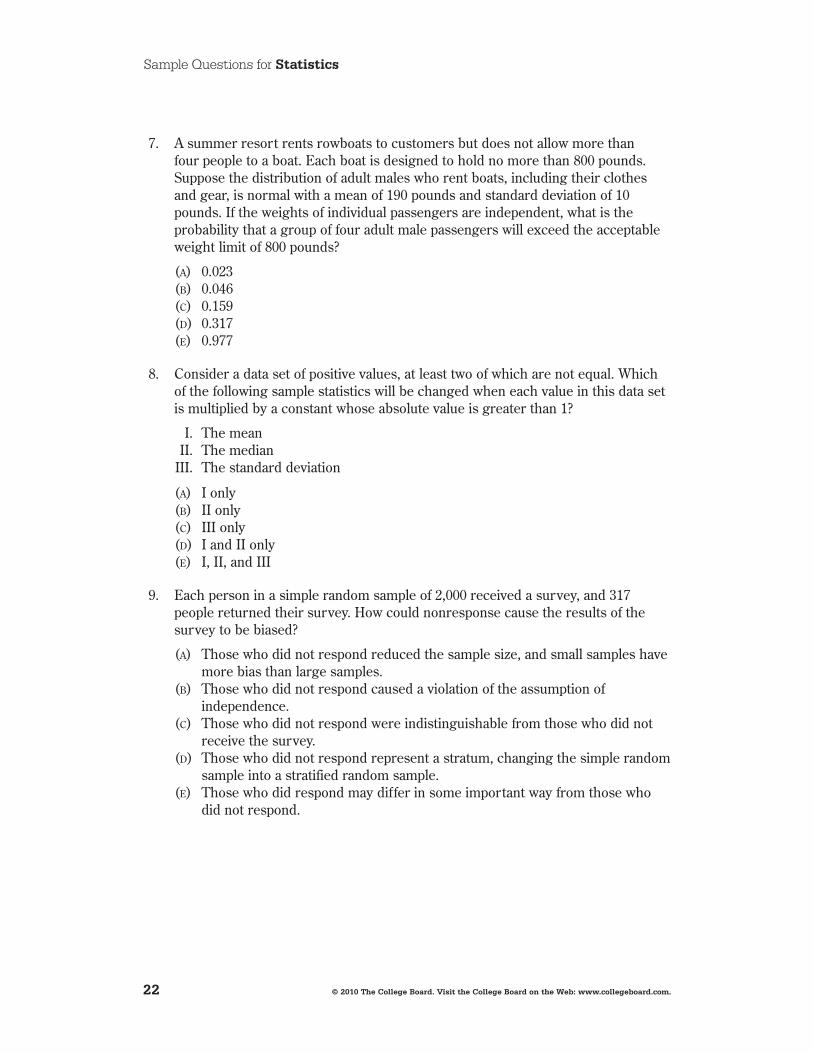
Sample Questions for statistics
7 . A summer resort rents rowboats to customers but does not allow more than four people to a boat . Each boat is designed to hold no more than 800 pounds . Suppose the distribution of adult males who rent boats, including their clothes and gear, is normal with a mean of 190 pounds and standard deviation of 10 pounds . If the weights of individual passengers are independent, what is the probability that a group of four adult male passengers will exceed the acceptable weight limit of 800 pounds?
(a) 0 .023(b) 0 .046(c) 0 .159(d) 0 .317(e) 0 .977
8 . Consider a data set of positive values, at least two of which are not equal . Which of the following sample statistics will be changed when each value in this data set is multiplied by a constant whose absolute value is greater than 1?
I . The mean II . The median III . The standard deviation
(a) I only(b) II only(c) III only(d) I and II only(e) I, II, and III
9 . Each person in a simple random sample of 2,000 received a survey, and 317 people returned their survey . How could nonresponse cause the results of the survey to be biased?
(a) Those who did not respond reduced the sample size, and small samples have more bias than large samples .
(b) Those who did not respond caused a violation of the assumption of independence .
(c) Those who did not respond were indistinguishable from those who did not receive the survey .
(d) Those who did not respond represent a stratum, changing the simple random sample into a stratified random sample .
(e) Those who did respond may differ in some important way from those who did not respond .
©2010TheCollegeBoard.VisittheCollegeBoardontheWeb:www.collegeboard.com.
23
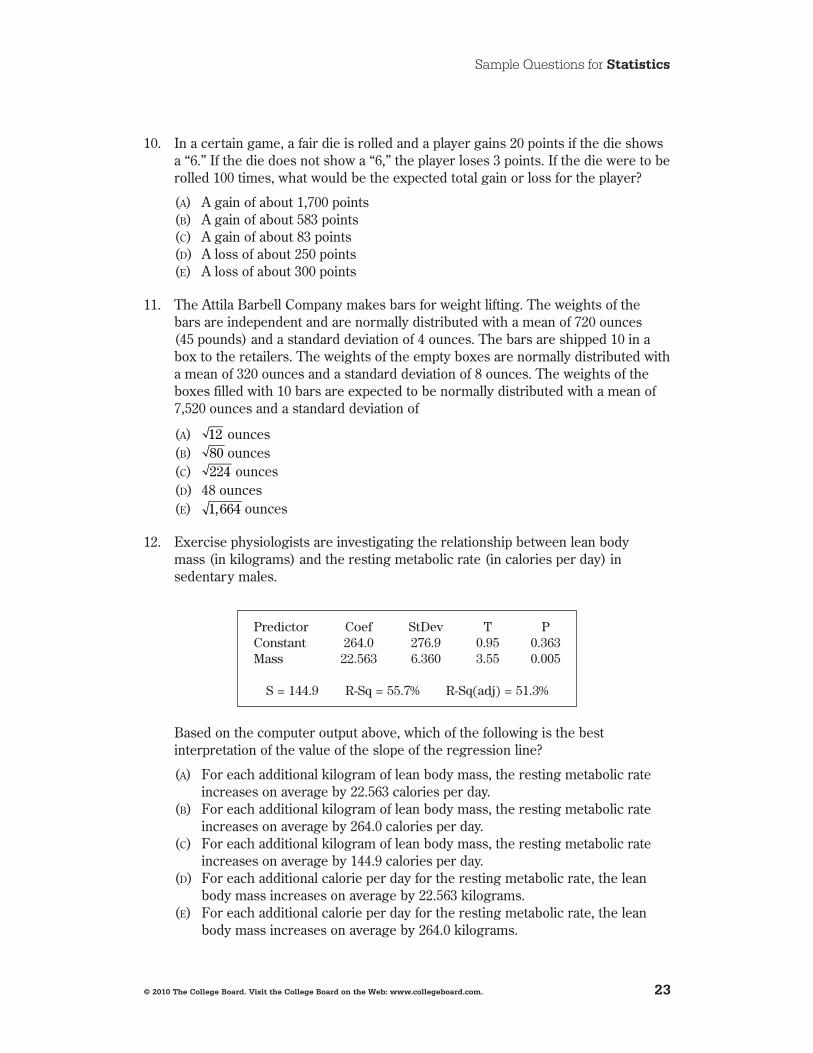
Sample Questions for statistics
10 . In a certain game, a fair die is rolled and a player gains 20 points if the die shows a “6 .” If the die does not show a “6,” the player loses 3 points . If the die were to be rolled 100 times, what would be the expected total gain or loss for the player?
(a) A gain of about 1,700 points(b) A gain of about 583 points(c) A gain of about 83 points(d) A loss of about 250 points(e) A loss of about 300 points
11 . The Attila Barbell Company makes bars for weight lifting . The weights of the bars are independent and are normally distributed with a mean of 720 ounces (45 pounds) and a standard deviation of 4 ounces . The bars are shipped 10 in a box to the retailers . The weights of the empty boxes are normally distributed with a mean of 320 ounces and a standard deviation of 8 ounces . The weights of the boxes filled with 10 bars are expected to be normally distributed with a mean of 7,520 ounces and a standard deviation of
(a) 12 ounces(b) 80 ounces(c) 224 ounces(d) 48 ounces(e) 1 664, ounces
12 . Exercise physiologists are investigating the relationship between lean body mass (in kilograms) and the resting metabolic rate (in calories per day) in sedentary males .
predictor coef stDev t pconstant 264.0 276.9 0.95 0.363Mass 22.563 6.360 3.55 0.005
s = 144.9 r-sq = 55.7% r-sq(adj) = 51.3%
Based on the computer output above, which of the following is the best interpretation of the value of the slope of the regression line?
(a) For each additional kilogram of lean body mass, the resting metabolic rate increases on average by 22 .563 calories per day .
(b) For each additional kilogram of lean body mass, the resting metabolic rate increases on average by 264 .0 calories per day .
(c) For each additional kilogram of lean body mass, the resting metabolic rate increases on average by 144 .9 calories per day .
(d) For each additional calorie per day for the resting metabolic rate, the lean body mass increases on average by 22 .563 kilograms .
(e) For each additional calorie per day for the resting metabolic rate, the lean body mass increases on average by 264 .0 kilograms .
©2010TheCollegeBoard.VisittheCollegeBoardontheWeb:www.collegeboard.com.
24
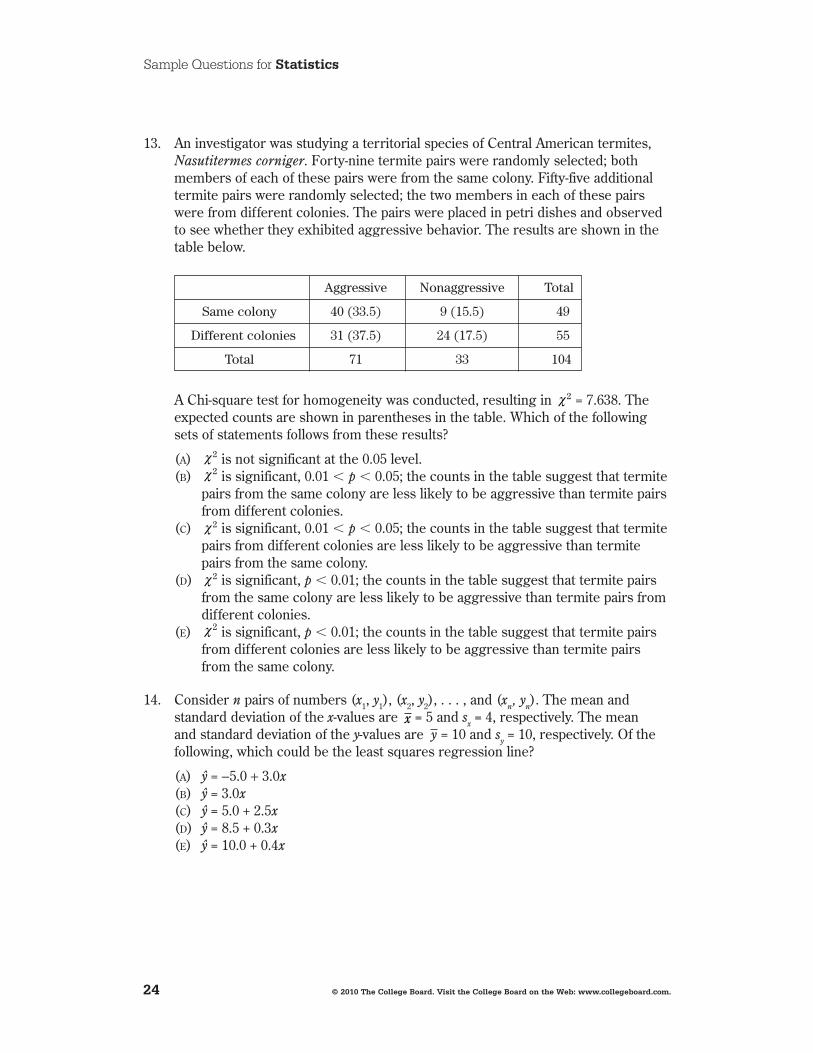
Sample Questions for statistics
13 . An investigator was studying a territorial species of Central American termites, Nasutitermes corniger . Forty-nine termite pairs were randomly selected; both members of each of these pairs were from the same colony . Fifty-five additional termite pairs were randomly selected; the two members in each of these pairs were from different colonies . The pairs were placed in petri dishes and observed to see whether they exhibited aggressive behavior . The results are shown in the table below .
aggressive Nonaggressive total
same colony 40 (33.5) 9 (15.5) 49
Different colonies 31 (37.5) 24 (17.5) 55
total 71 33 104
A Chi-square test for homogeneity was conducted, resulting in χ 2 = 7 .638 . The expected counts are shown in parentheses in the table . Which of the following sets of statements follows from these results?
(a) χ 2 is not significant at the 0 .05 level .(b) χ 2 is significant, 0 .01 < p < 0 .05; the counts in the table suggest that termite
pairs from the same colony are less likely to be aggressive than termite pairs from different colonies .
(c) χ 2 is significant, 0 .01 < p < 0 .05; the counts in the table suggest that termite pairs from different colonies are less likely to be aggressive than termite pairs from the same colony .
(d) χ 2 is significant, p < 0 .01; the counts in the table suggest that termite pairs from the same colony are less likely to be aggressive than termite pairs from different colonies .
(e) χ 2 is significant, p < 0 .01; the counts in the table suggest that termite pairs from different colonies are less likely to be aggressive than termite pairs from the same colony .
14 . Consider n pairs of numbers (x1, y1), (x2, y2), . . . , and (xn, yn) . The mean and standard deviation of the x-values are x = 5 and sx = 4, respectively . The mean and standard deviation of the y-values are y = 10 and sy = 10, respectively . Of the following, which could be the least squares regression line?
(a) y = -5 .0 + 3 .0x(b) y = 3 .0x(c) y = 5 .0 + 2 .5x(d) y = 8 .5 + 0 .3x(e) y = 10 .0 + 0 .4x
©2010TheCollegeBoard.VisittheCollegeBoardontheWeb:www.collegeboard.com.
25
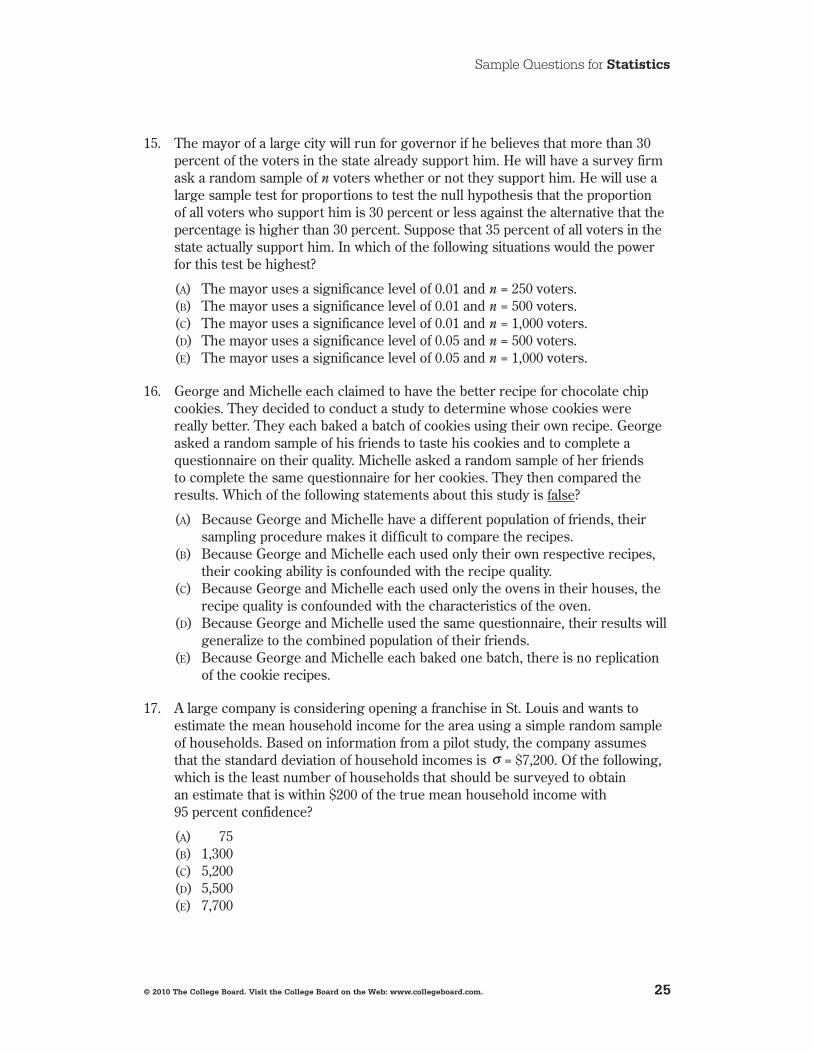
Sample Questions for statistics
15 . The mayor of a large city will run for governor if he believes that more than 30 percent of the voters in the state already support him . He will have a survey firm ask a random sample of n voters whether or not they support him . He will use a large sample test for proportions to test the null hypothesis that the proportion of all voters who support him is 30 percent or less against the alternative that the percentage is higher than 30 percent . Suppose that 35 percent of all voters in the state actually support him . In which of the following situations would the power for this test be highest?
(a) The mayor uses a significance level of 0 .01 and n = 250 voters .(b) The mayor uses a significance level of 0 .01 and n = 500 voters .(c) The mayor uses a significance level of 0 .01 and n = 1,000 voters .(d) The mayor uses a significance level of 0 .05 and n = 500 voters .(e) The mayor uses a significance level of 0 .05 and n = 1,000 voters .
16 . George and Michelle each claimed to have the better recipe for chocolate chip cookies . They decided to conduct a study to determine whose cookies were really better . They each baked a batch of cookies using their own recipe . George asked a random sample of his friends to taste his cookies and to complete a questionnaire on their quality . Michelle asked a random sample of her friends to complete the same questionnaire for her cookies . They then compared the results . Which of the following statements about this study is false?
(a) Because George and Michelle have a different population of friends, their sampling procedure makes it difficult to compare the recipes .
(b) Because George and Michelle each used only their own respective recipes, their cooking ability is confounded with the recipe quality .
(c) Because George and Michelle each used only the ovens in their houses, the recipe quality is confounded with the characteristics of the oven .
(d) Because George and Michelle used the same questionnaire, their results will generalize to the combined population of their friends .
(e) Because George and Michelle each baked one batch, there is no replication of the cookie recipes .
17 . A large company is considering opening a franchise in St . Louis and wants to estimate the mean household income for the area using a simple random sample of households . Based on information from a pilot study, the company assumes that the standard deviation of household incomes is σ = $7,200 . Of the following, which is the least number of households that should be surveyed to obtain an estimate that is within $200 of the true mean household income with 95 percent confidence?
(a) 1,375(b) 1,300(c) 5,200(d) 5,500(e) 7,700
©2010TheCollegeBoard.VisittheCollegeBoardontheWeb:www.collegeboard.com.
26
Sample Questions for statistics
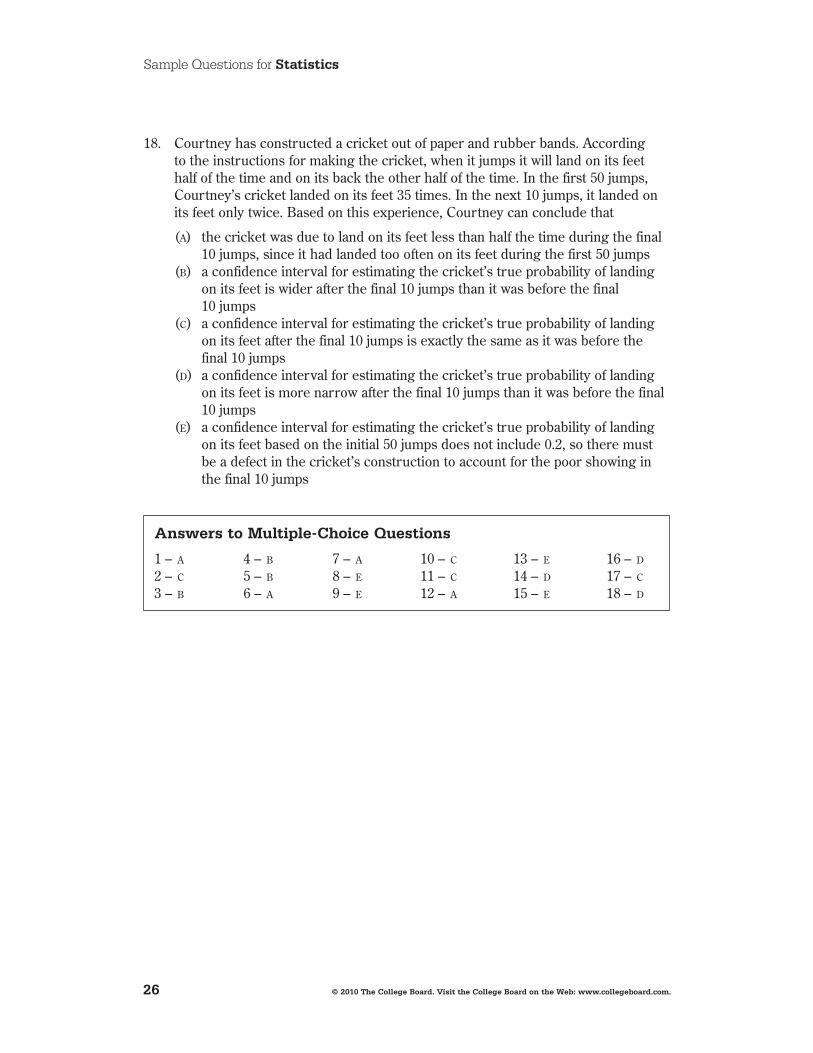
18 . Courtney has constructed a cricket out of paper and rubber bands . According to the instructions for making the cricket, when it jumps it will land on its feet half of the time and on its back the other half of the time . In the first 50 jumps, Courtney’s cricket landed on its feet 35 times . In the next 10 jumps, it landed on its feet only twice . Based on this experience, Courtney can conclude that
(a) the cricket was due to land on its feet less than half the time during the final 10 jumps, since it had landed too often on its feet during the first 50 jumps
(b) a confidence interval for estimating the cricket’s true probability of landing on its feet is wider after the final 10 jumps than it was before the final 10 jumps
(c) a confidence interval for estimating the cricket’s true probability of landing on its feet after the final 10 jumps is exactly the same as it was before the final 10 jumps
(d) a confidence interval for estimating the cricket’s true probability of landing on its feet is more narrow after the final 10 jumps than it was before the final 10 jumps
(e) a confidence interval for estimating the cricket’s true probability of landing on its feet based on the initial 50 jumps does not include 0 .2, so there must be a defect in the cricket’s construction to account for the poor showing in the final 10 jumps
answerstomultiple-ChoiceQuestions
1 – a 4 – b 7 – a 10 – c 13 – e 16 – d 2 – c 5 – b 8 – e 11 – c 14 – d 17 – c 3 – b 6 – a 9 – e 12 – a 15 – e 18 – d
©2010TheCollegeBoard.VisittheCollegeBoardontheWeb:www.collegeboard.com.
27
Sample Questions for statistics
Free-responseQuestionsIn the free-response section of the AP Statistics Exam, students are asked to answer five questions and complete an investigative task . Each question is designed to be answered in approximately 12 minutes . The longer investigative task is designed to be answered in approximately 30 minutes .
Statistics is a discipline in which clear and complete communication is an essential skill . The free-response questions on the AP Statistics Exam require students to use their analytical, organizational and communication skills to formulate cogent answers and provide students with an opportunity to:
• Relate two or more different content areas (i .e ., exploratory data analysis, experimental design and sampling, probability, and statistical inference) as they formulate a complete response or solution to a statistics or probability problem .
• Demonstrate their mastery of statistics in a response format that permits the students to determine how they will organize and present each response .
The purpose of the investigative task is not only to evaluate the student’s understanding in several content areas but also to assess his or her ability to integrate statistical ideas and apply them in a new context or in a nonroutine way .
scoringofFree-responseQuestionsThe evaluation of student responses on the free-response section of the AP Statistics Exam reflects the dual importance of statistical knowledge and good communication . The free-response questions and the investigative task are scored “holistically”; that is, each question’s response is evaluated as “a complete package .” With holistic scoring, after reading through the details of a student’s response, the scorer makes a judgment about the overall quality of the response . This is different from “analytic” scoring, where the individual components to be evaluated in a student’s response are specified in advance, and each component is given a value counting toward the overall score .
Holistic scoring is well suited for questions where the student is required to synthesize information and respond at least partially in written paragraphs, and for questions that could potentially generate multiple and diverse, but equally correct, responses . For example, an open-ended question may present data from a real-life study and ask the student not only to analyze the data but also to comment on how the study’s protocol might be improved . Comments on improving the protocol might focus on improving the sampling method, controlling confounding variables, or seeking more power by increasing the sample size . In this context, holistic scoring represents a recognition not only of the existence of multiple reasonable approaches to a statistical analysis, but a realization of the existence of a statistical synergy — i .e ., that a quality student response is more than just the sum of its parts .
©2010TheCollegeBoard.VisittheCollegeBoardontheWeb:www.collegeboard.com.
28
Sample Questions for statistics
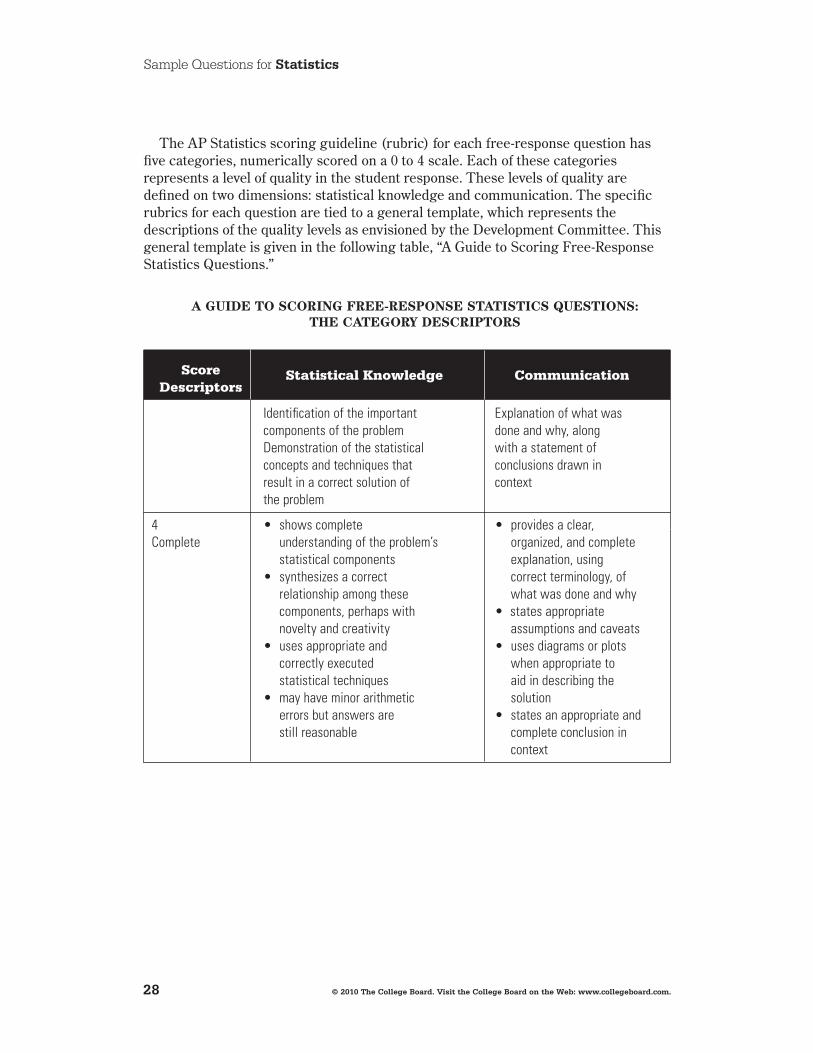
The AP Statistics scoring guideline (rubric) for each free-response question has five categories, numerically scored on a 0 to 4 scale . Each of these categories represents a level of quality in the student response . These levels of quality are defined on two dimensions: statistical knowledge and communication . The specific rubrics for each question are tied to a general template, which represents the descriptions of the quality levels as envisioned by the Development Committee . This general template is given in the following table, “A Guide to Scoring Free-Response Statistics Questions .”
A GUIDE TO SCORING FREE-RESPONSE STATISTICS QUESTIONS:THE CATEGORY DESCRIPTORS
Score Statistical Knowledge communication Descriptors
Identificationoftheimportant Explanationofwhatwas componentsoftheproblem doneandwhy,along Demonstrationofthestatistical withastatementof conceptsandtechniquesthat conclusionsdrawnin resultinacorrectsolutionof context theproblem
4 • showscomplete • providesaclear,Complete understandingoftheproblem’s organized,andcomplete statisticalcomponents explanation,using • synthesizesacorrect correctterminology,of relationshipamongthese whatwasdoneandwhy components,perhapswith • statesappropriate noveltyandcreativity assumptionsandcaveats • usesappropriateand • usesdiagramsorplots correctlyexecuted whenappropriateto statisticaltechniques aidindescribingthe • mayhaveminorarithmetic solution errorsbutanswersare • statesanappropriateand stillreasonable completeconclusionin context
©2010TheCollegeBoard.VisittheCollegeBoardontheWeb:www.collegeboard.com.
29
Sample Questions for statistics
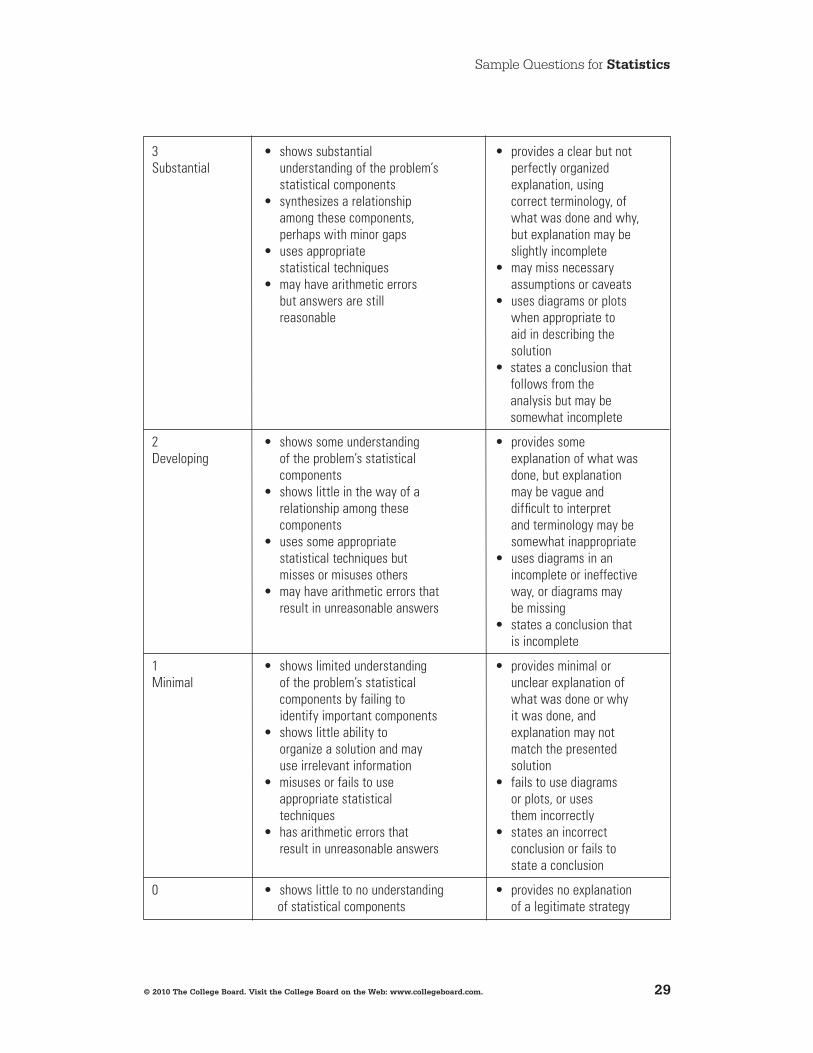
3 • showssubstantial • providesaclearbutnotSubstantial understandingoftheproblem’s perfectlyorganized statisticalcomponents explanation,using • synthesizesarelationship correctterminology,of amongthesecomponents, whatwasdoneandwhy, perhapswithminorgaps butexplanationmaybe • usesappropriate slightlyincomplete statisticaltechniques • maymissnecessary • mayhavearithmeticerrors assumptionsorcaveats butanswersarestill • usesdiagramsorplots reasonable whenappropriateto aidindescribingthe solution • statesaconclusionthat
followsfromtheanalysisbutmaybesomewhatincomplete
2 • showssomeunderstanding • providessomeDeveloping oftheproblem’sstatistical explanationofwhatwas components done,butexplanation • showslittleinthewayofa maybevagueand relationshipamongthese difficulttointerpret components andterminologymaybe • usessomeappropriate somewhatinappropriate statisticaltechniquesbut • usesdiagramsinan missesormisusesothers incompleteorineffective • mayhavearithmeticerrorsthat way,ordiagramsmay resultinunreasonableanswers bemissing • statesaconclusionthat isincomplete
1 • showslimitedunderstanding • providesminimalorMinimal oftheproblem’sstatistical unclearexplanationof componentsbyfailingto whatwasdoneorwhy identifyimportantcomponents itwasdone,and • showslittleabilityto explanationmaynot organizeasolutionandmay matchthepresented useirrelevantinformation solution • misusesorfailstouse • failstousediagrams appropriatestatistical orplots,oruses techniques themincorrectly • hasarithmeticerrorsthat • statesanincorrect resultinunreasonableanswers conclusionorfailsto stateaconclusion
0 • showslittletonounderstanding • providesnoexplanation ofstatisticalcomponents ofalegitimatestrategy
©2010TheCollegeBoard.VisittheCollegeBoardontheWeb:www.collegeboard.com.
30
Sample Questions for statistics
Some important points that students should remember when answering free-response questions on the AP Statistics Exam are given below .
1 . Read the questions carefully and answer them in context; for example, the results of a hypothesis test should always be followed by a conclusion in context, and a confidence interval should always be followed by an interpretation of the interval in context . Explanations and conclusions in context are always required for a complete answer .
2 . Know the vocabulary of statistics, and use that vocabulary correctly in all written responses .
3 . Remember to define all symbols . Specifically, remember to distinguish between population parameters and sample statistics .
4 . Remember to state and check all necessary assumptions when performing hypothesis tests and constructing interval estimates .
5 . Be able to interpret data displayed in a variety of ways, including graphs and computer outputs . Be able to represent data in a variety of forms and base sound statistical arguments on these representations .
AP Central contains free-response questions, scoring guidelines and selected student responses from past AP Statistics Exams . This is an excellent place to become more familiar with the content of past free-response questions and how they were scored .
The following questions are examples of free-response questions . These questions were administered as part of a previous year’s exam .
1 . The summary statistics for the number of inches of rainfall in Los Angeles for 117 years, beginning in 1877, are shown below .
N MeaN MeDiaN trMeaN stDev se MeaN
117 14.941 13.070 14.416 6.747 0.624
MiN MaX Q1 Q3
4.850 38.180 9.680 19.250
(a) Describe a procedure that uses these summary statistics to determine whether there are outliers .
(b) Are there outliers in these data? Justify your answer based on the procedure that you described in part (a) .(c) The news media reported that in a particular year, there were only
10 inches of rainfall . Use the information provided to comment on this reported statement .
©2010TheCollegeBoard.VisittheCollegeBoardontheWeb:www.collegeboard.com.
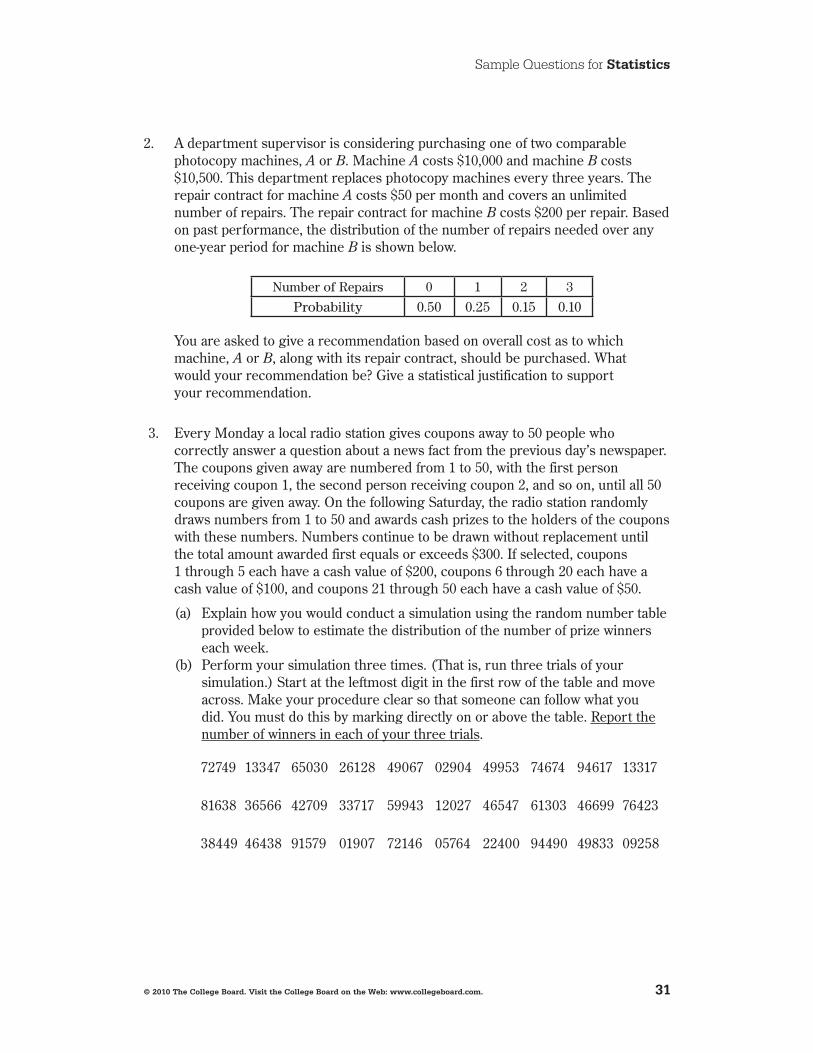
31
Sample Questions for statistics
2 . A department supervisor is considering purchasing one of two comparable photocopy machines, A or B . Machine A costs $10,000 and machine B costs $10,500 . This department replaces photocopy machines every three years . The repair contract for machine A costs $50 per month and covers an unlimited number of repairs . The repair contract for machine B costs $200 per repair . Based on past performance, the distribution of the number of repairs needed over any one-year period for machine B is shown below .
Number of repairs 0 1 2 3
probability 0.50 0.25 0.15 0.10
You are asked to give a recommendation based on overall cost as to which machine, A or B, along with its repair contract, should be purchased . What would your recommendation be? Give a statistical justification to support your recommendation .
3 . Every Monday a local radio station gives coupons away to 50 people who correctly answer a question about a news fact from the previous day’s newspaper . The coupons given away are numbered from 1 to 50, with the first person receiving coupon 1, the second person receiving coupon 2, and so on, until all 50 coupons are given away . On the following Saturday, the radio station randomly draws numbers from 1 to 50 and awards cash prizes to the holders of the coupons with these numbers . Numbers continue to be drawn without replacement until the total amount awarded first equals or exceeds $300 . If selected, coupons 1 through 5 each have a cash value of $200, coupons 6 through 20 each have a cash value of $100, and coupons 21 through 50 each have a cash value of $50 .
(a) Explain how you would conduct a simulation using the random number table provided below to estimate the distribution of the number of prize winners each week .
(b) Perform your simulation three times . (That is, run three trials of your simulation .) Start at the leftmost digit in the first row of the table and move across . Make your procedure clear so that someone can follow what you did . You must do this by marking directly on or above the table . Report the number of winners in each of your three trials .
72749 13347 65030 26128 49067 02904 49953 74674 94617 13317
81638 36566 42709 33717 59943 12027 46547 61303 46699 76423
38449 46438 91579 01907 72146 05764 22400 94490 49833 09258
©2010TheCollegeBoard.VisittheCollegeBoardontheWeb:www.collegeboard.com.
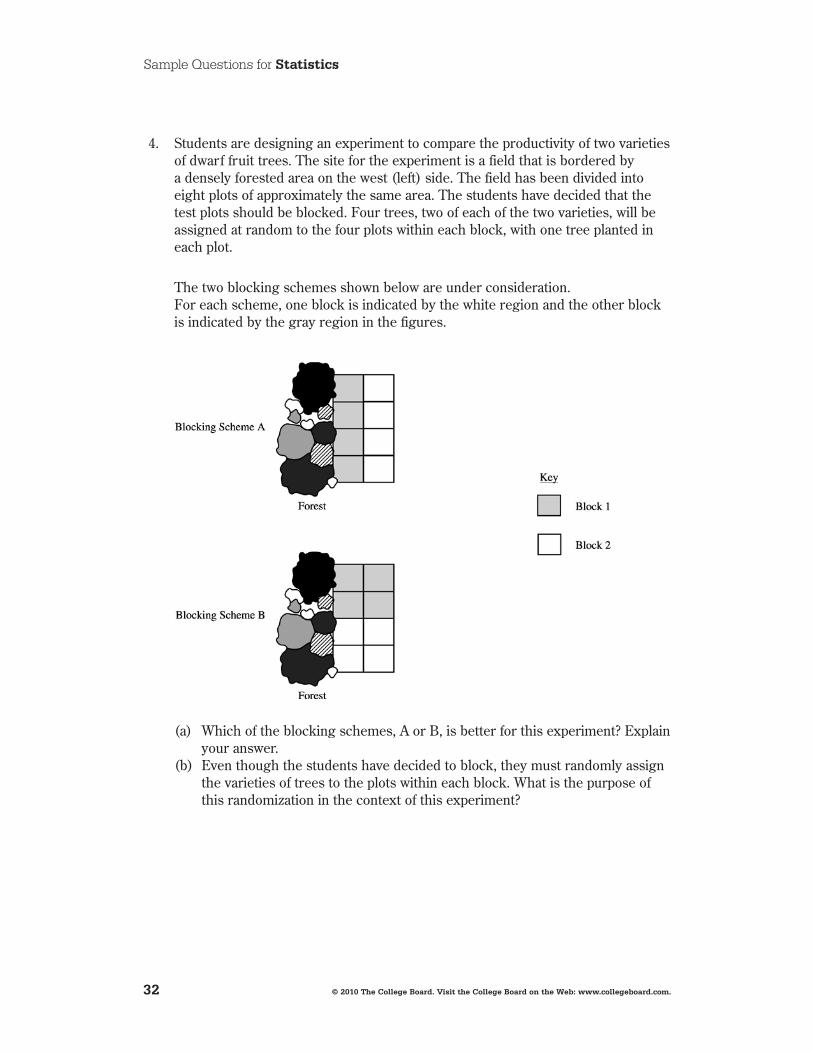
32
Sample Questions for statistics
4 . Students are designing an experiment to compare the productivity of two varieties of dwarf fruit trees . The site for the experiment is a field that is bordered by a densely forested area on the west (left) side . The field has been divided into eight plots of approximately the same area . The students have decided that the test plots should be blocked . Four trees, two of each of the two varieties, will be assigned at random to the four plots within each block, with one tree planted in each plot .
The two blocking schemes shown below are under consideration . For each scheme, one block is indicated by the white region and the other block is indicated by the gray region in the figures .
(a) Which of the blocking schemes, A or B, is better for this experiment? Explain your answer .
(b) Even though the students have decided to block, they must randomly assign the varieties of trees to the plots within each block . What is the purpose of this randomization in the context of this experiment?
©2010TheCollegeBoard.VisittheCollegeBoardontheWeb:www.collegeboard.com.
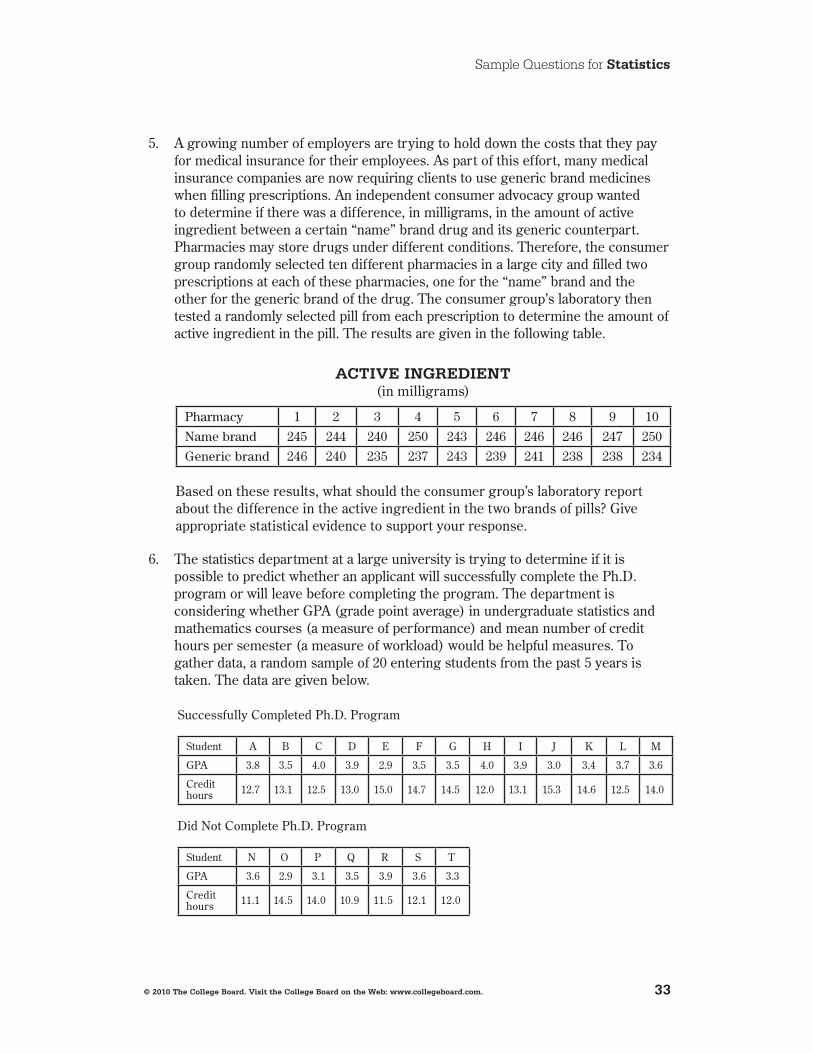
33
Sample Questions for statistics
5 . A growing number of employers are trying to hold down the costs that they pay for medical insurance for their employees . As part of this effort, many medical insurance companies are now requiring clients to use generic brand medicines when filling prescriptions . An independent consumer advocacy group wanted to determine if there was a difference, in milligrams, in the amount of active ingredient between a certain “name” brand drug and its generic counterpart . Pharmacies may store drugs under different conditions . Therefore, the consumer group randomly selected ten different pharmacies in a large city and filled two prescriptions at each of these pharmacies, one for the “name” brand and the other for the generic brand of the drug . The consumer group’s laboratory then tested a randomly selected pill from each prescription to determine the amount of active ingredient in the pill . The results are given in the following table .
aCTIVeInGredIenT(in milligrams)
pharmacy 1 2 3 4 5 6 7 8 9 10
Name brand 245 244 240 250 243 246 246 246 247 250
Generic brand 246 240 235 237 243 239 241 238 238 234 Based on these results, what should the consumer group’s laboratory report about the difference in the active ingredient in the two brands of pills? Give appropriate statistical evidence to support your response .
6 . The statistics department at a large university is trying to determine if it is possible to predict whether an applicant will successfully complete the Ph .D . program or will leave before completing the program . The department is considering whether GPA (grade point average) in undergraduate statistics and mathematics courses (a measure of performance) and mean number of credit hours per semester (a measure of workload) would be helpful measures . To gather data, a random sample of 20 entering students from the past 5 years is taken . The data are given below .
Successfully Completed Ph .D . Program
Student A B C D E F G H I J K L M
GPA 3 .8 3 .5 4 .0 3 .9 2 .9 3 .5 3 .5 4 .0 3 .9 3 .0 3 .4 3 .7 3 .6
Credit hours 12 .7 13 .1 12 .5 13 .0 15 .0 14 .7 14 .5 12 .0 13 .1 15 .3 14 .6 12 .5 14 .0
Did Not Complete Ph .D . Program
Student N O P Q R S T
GPA 3 .6 2 .9 3 .1 3 .5 3 .9 3 .6 3 .3
Credit hours 11 .1 14 .5 14 .0 10 .9 11 .5 12 .1 12 .0
©2010TheCollegeBoard.VisittheCollegeBoardontheWeb:www.collegeboard.com.
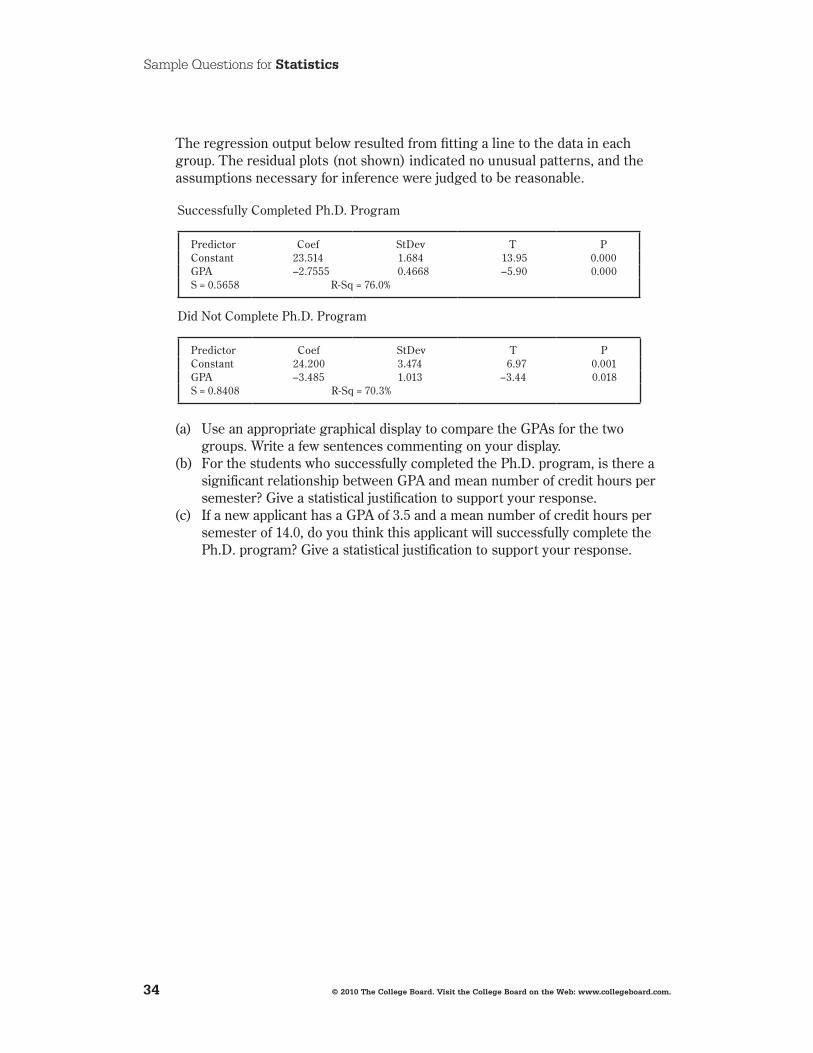
34
Sample Questions for statistics
The regression output below resulted from fitting a line to the data in each group . The residual plots (not shown) indicated no unusual patterns, and the assumptions necessary for inference were judged to be reasonable .
Successfully Completed Ph .D . Program
Predictor Coef StDev T PConstant 23 .514 1 .684 13 .95 0 .000GPA –2 .7555 0 .4668 –5 .90 0 .000S = 0 .5658 R-Sq = 76 .0%
Did Not Complete Ph .D . Program
Predictor Coef StDev T PConstant 24 .200 3 .474 6 .97 0 .001GPA –3 .485 1 .013 –3 .44 0 .018S = 0 .8408 R-Sq = 70 .3%
(a) Use an appropriate graphical display to compare the GPAs for the two groups . Write a few sentences commenting on your display .
(b) For the students who successfully completed the Ph .D . program, is there a significant relationship between GPA and mean number of credit hours per semester? Give a statistical justification to support your response .
(c) If a new applicant has a GPA of 3 .5 and a mean number of credit hours per semester of 14 .0, do you think this applicant will successfully complete the Ph .D . program? Give a statistical justification to support your response .
©2010TheCollegeBoard.VisittheCollegeBoardontheWeb:www.collegeboard.com.
35
52269-00003 AP Statistics Course Description 2009-10; Fonts: Century Old Style Regular, Century Old Style Italic, Century Old Style Bold, Serifa 45 Light, Serifa 65 Bold, Serifa 75 Black; Univers 47 Light Condensed, Univers 67 Bold Condensed • Dr1 12/5/07 RI60436 • D1rev 12/10/07 RI60436 • D2 2/7/08 RI60436 • D2rev 2/12/08 RI60436 • D3 3/3/08 RI60436 • CS4 1/20/10 mc • dr01 1/20/10 mc • dr01revs 2/1/10 mc • pdf 2/3/10 mc • pdf 2/19/10 mc • Drft03 3/26/10 jdb • PDF Drft03 3/30/10 jdb • Drft04 4/2/10 jdb • PDF Drft04 4/6/10 jdb • Preflight 04/13/10 ljg • 71328-82910 • dr01 04/20/10 ljg
54
Teacher Support
AP Central® (apcentral.collegeboard.com) You can fi nd the following Web resources at AP Central:
• AP Course Descriptions, information about the AP Course Audit, AP Exam questions and scoring guidelines, sample syllabi and feature articles.
• A searchable Institutes and Workshops database, providing information about professional development events.
• The Course Home Pages (apcentral.collegeboard.com/coursehomepages), which contain articles, teaching tips, activities, lab ideas and other course-specifi c content contributed by colleagues in the AP community.
• Moderated electronic discussion groups (EDGs) for each AP course, provided to facilitate the exchange of ideas and practices.
Additional ResourcesTeacher’s Guides and Course Descriptions may be downloaded free of charge from AP Central; printed copies may be purchased through the College Board Store(store.collegeboard.com).
Course Audit Resources. For those looking for information on developing syllabi, the AP Course Audit website offers a host of valuable resources. Each subject has a syllabus development guide that includes the guidelines reviewers use to evaluate syllabi as well as multiple samples of evidence for each requirement. Four sample syllabi written by AP teachers and college faculty who teach the equivalent course at colleges and universities are also available. Along with a syllabus self-evaluation checklist and an example textbook list, a set of curricular/resource requirements is provided for each course that outlines the expectations that college faculty nationwide have established for college-level courses. Visit www.collegeboard.com/apcourseaudit for more information and to download these free resources.
Released Exams. Periodically the AP Program releases a complete copy of each exam. In addition to providing the multiple-choice questions and answers, the publication describes the process of scoring the free-response questions and includes examples of students’ actual responses, the scoring standards and commentary that explains why the responses received the scores they did. Released Exams are available at the College Board Store (store.collegeboard.com).
Additional, free AP resources are available to help students, parents, AP Coordinators and high school and college faculty learn more about the AP Program and its courses and exams. Visit www.collegeboard.com/apfreepubs for details.
©2010TheCollegeBoard.VisittheCollegeBoardontheWeb:www.collegeboard.com.
52269-00003 AP Statistics Course Description 2009-10; Fonts: Century Old Style Regular, Century Old Style Italic, Century Old Style Bold, Serifa 45 Light, Serifa 65 Bold, Serifa 75 Black; Univers 47 Light Condensed, Univers 67 Bold Condensed • Dr1 12/5/07 RI60436 • D1rev 12/10/07 RI60436 • D2 2/7/08 RI60436 • D2rev 2/12/08 RI60436 • D3 3/3/08 RI60436 • CS4 1/20/10 mc • dr01 1/20/10 mc • dr01revs 2/1/10 mc • pdf 2/3/10 mc • pdf 2/19/10 mc • Drft03 3/26/10 jdb • PDF Drft03 3/30/10 jdb • PDF Drft04 4/6/10 jdb • Preflight 04/13/10 ljg
AP ServicesP.O. Box 6671Princeton, NJ 08541-6671609-771-7300888-225-5427 (toll free in the U.S. and Canada)610-290-8979 (Fax)E-mail: [email protected]
National Offi ce45 Columbus AvenueNew York, NY 10023-6992212-713-8000
AP Canada Offi ce2950 Douglas Street, Suite 550Victoria, BC, Canada V8T 4N4250-472-8561800-667-4548 (toll free in Canada only)E-mail: [email protected]
International ServicesServing all countries outside the U.S. and Canada
45 Columbus AvenueNew York, NY 10023-6992212-373-8738E-mail: [email protected]
Middle States Regional Offi ceServing Delaware, District of Columbia, Maryland,New Jersey, New York, Pennsylvania, Puerto Ricoand the U.S. Virgin Islands
Three Bala Plaza EastSuite 501Bala Cynwyd, PA 19004-1501610-227-2550866-392-3019610-227-2580 (Fax)E-mail: [email protected]
Midwestern Regional Offi ceServing Illinois, Indiana, Iowa, Kansas, Michigan,Minnesota, Missouri, Nebraska, North Dakota,Ohio, South Dakota, West Virginia and Wisconsin
6111 N. River Road, Suite 550Rosemont, IL 60018-5158866-392-4086847-653-4528 (Fax)E-mail: [email protected]
New England Regional Offi ceServing Connecticut, Maine, Massachusetts,New Hampshire, Rhode Island and Vermont
1601 Trapelo Road, Suite 12Waltham, MA 02451-1982866-392-4089781-663-2743 (Fax)E-mail: [email protected]
Southern Regional Offi ceServing Alabama, Florida, Georgia, Kentucky,Louisiana, Mississippi, North Carolina, SouthCarolina, Tennessee and Virginia
3700 Crestwood Parkway NW, Suite 700Duluth, GA 30096-7155866-392-4088770-225-4062 (Fax)E-mail: [email protected]
Southwestern Regional Offi ceServing Arkansas, New Mexico, Oklahomaand Texas
4330 Gaines Ranch Loop, Suite 200Austin, TX 78735-6735866-392-3017512-721-1841 (Fax)E-mail: [email protected]
Western Regional Offi ceServing Alaska, Arizona, California, Colorado,Hawaii, Idaho, Montana, Nevada, Oregon, Utah,Washington and Wyoming
2099 Gateway Place, Suite 550San Jose, CA 95110-1051866-392-4078408-367-1459 (Fax)E-mail: [email protected]
Contact Us

52269-00003 AP Statistics Course Description 2009-10; Fonts: Century Old Style Regular, Century Old Style Italic, Century Old Style Bold, Serifa 45 Light, Serifa 65 Bold, Serifa 75 Black; Univers 47 Light Condensed, Univers 67 Bold Condensed • Dr1 12/5/07 RI60436 • D1rev 12/10/07 RI60436 • D2 2/7/08 RI60436 • D2rev 2/12/08 RI60436 • D3 3/3/08 RI60436 • CS4 1/20/10 mc • dr01 1/20/10 mc • dr01revs 2/1/10 mc • pdf 2/3/10 mc • pdf 2/19/10 mc • Drft03 3/26/10 jdb • PDF Drft03 3/30/10 jdb • Drft04 4/2/10 jdb • PDF Drft04 4/6/10 jdb • Preflight 04/13/10 ljg
apcentral.collegeboard.com I.N. 090083307