ap biology population ecology population ecosystem community biosphere organism
TRANSCRIPT
AP Biology
Population Ecology
population
ecosystem
community
biosphere
organism
AP Biology
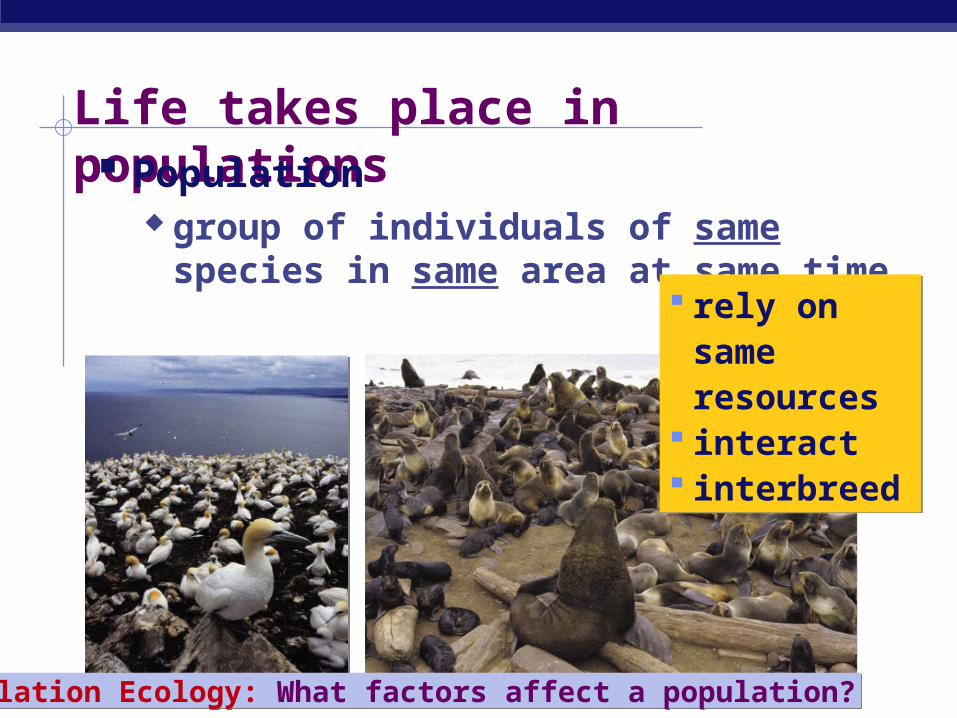
Life takes place in populations Population
group of individuals of same species in same area at same time
rely on same resources
interact interbreed
rely on same resources
interact interbreed
Population Ecology: What factors affect a population?Population Ecology: What factors affect a population?
AP Biology
Why Population Ecology? Scientific goal
understanding the factors that influence the size of populations general principles specific cases
Practical goal management of populations
increase population size endangered species
decrease population size pests
maintain population size fisheries management
maintain & maximize sustained yield
AP Biology
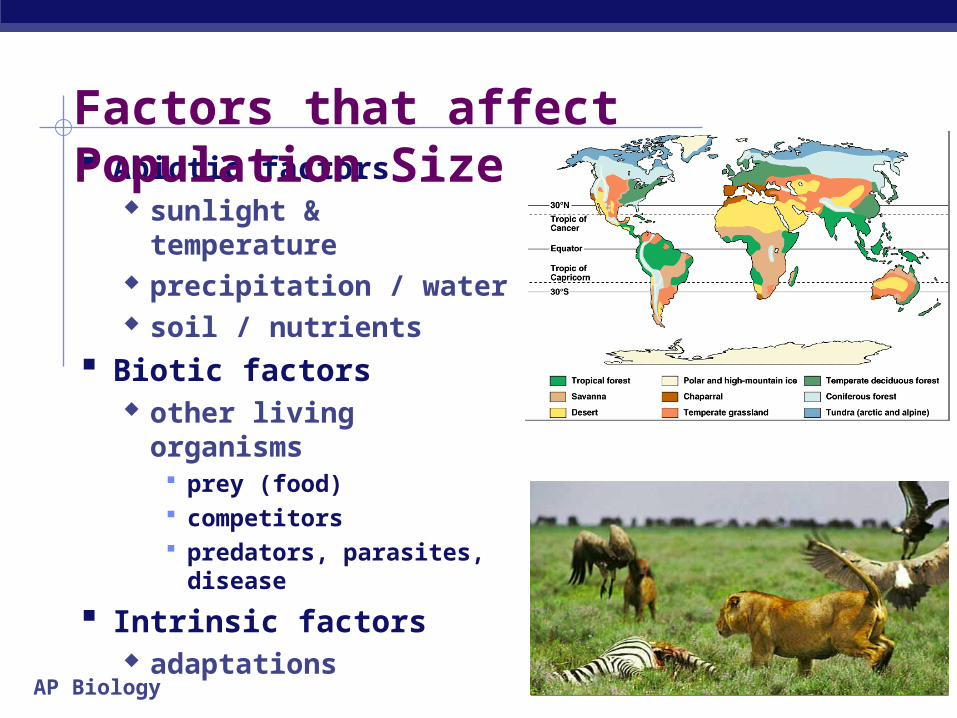
Abiotic factors sunlight & temperature precipitation / water soil / nutrients
Biotic factors other living organisms
prey (food) competitors predators, parasites,
disease
Intrinsic factors adaptations
Factors that affect Population Size
AP Biology
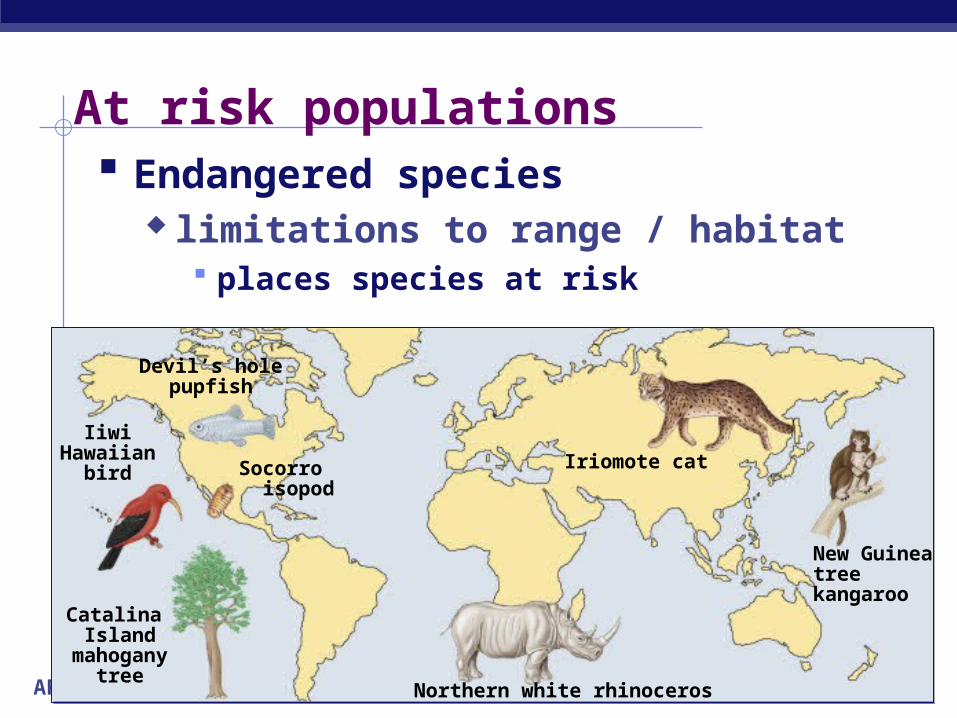
At risk populations Endangered species
limitations to range / habitat places species at risk
Socorro isopod
Devil’s holepupfish
Iriomote cat
Northern white rhinoceros
New Guineatree kangaroo
IiwiHawaiian
bird
Catalina Island
mahoganytree
AP Biology
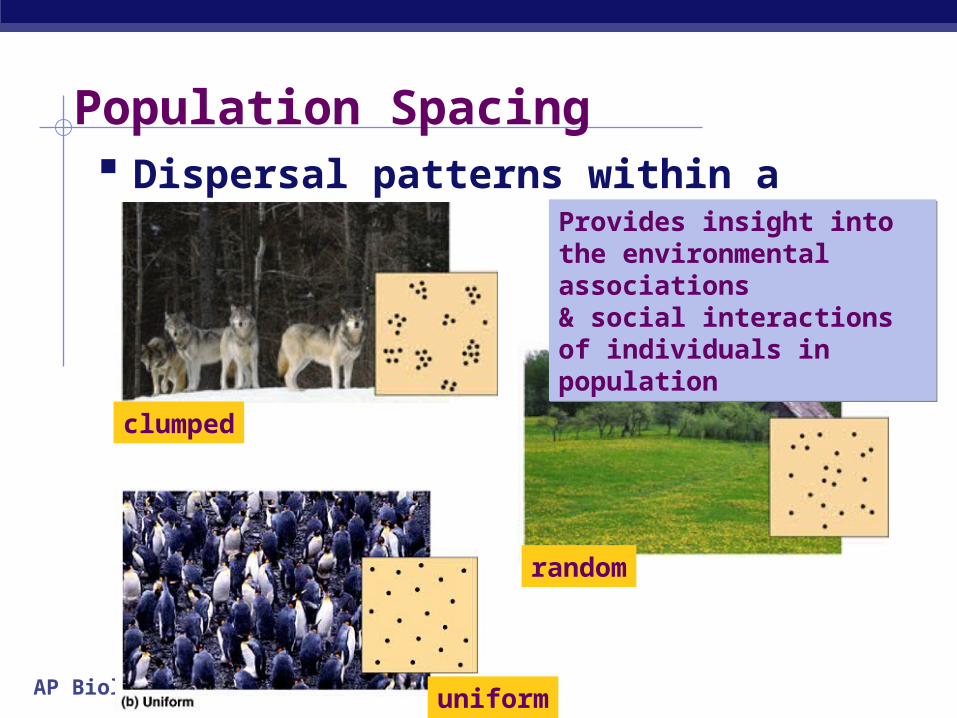
Population Spacing Dispersal patterns within a population
uniform
random
clumped
Provides insight into the environmental associations & social interactions of individuals in population
Provides insight into the environmental associations & social interactions of individuals in population
AP Biology
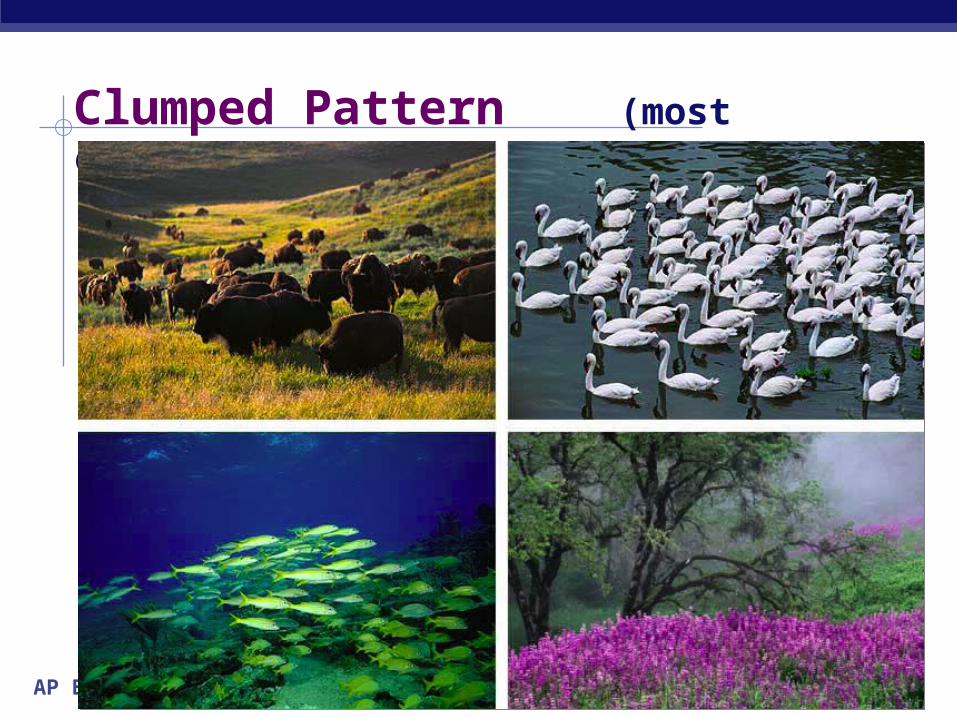
Clumped Pattern (most common)
AP Biology
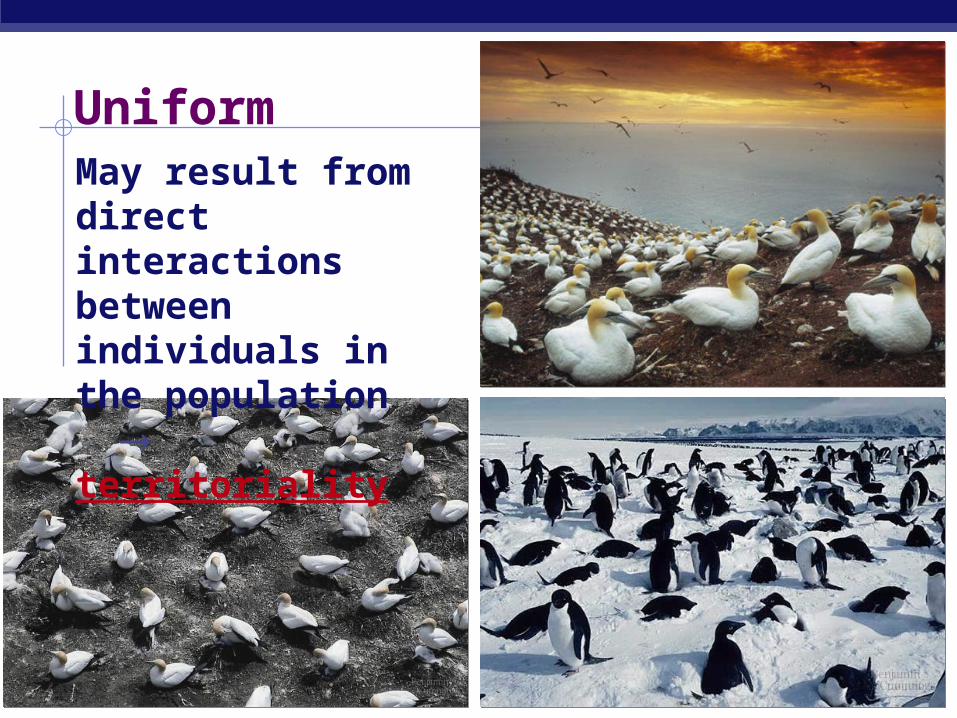
Uniform
Clumped patterns
May result from direct interactions between individuals in the population territoriality
AP Biology
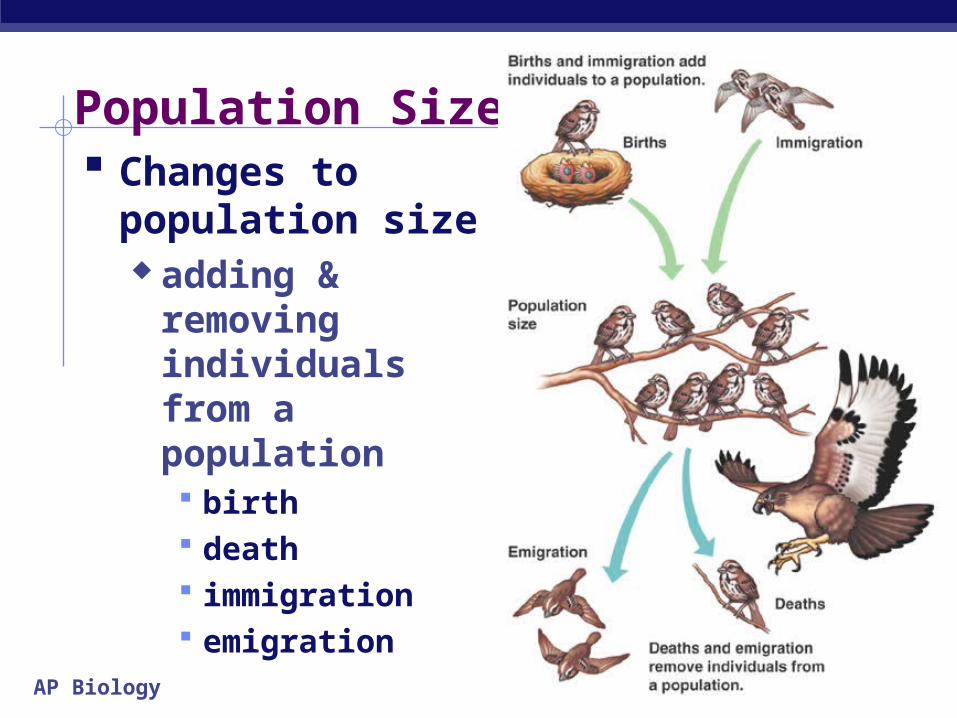
Population Size Changes to
population size adding & removing
individuals from a population birth death immigration emigration
AP Biology
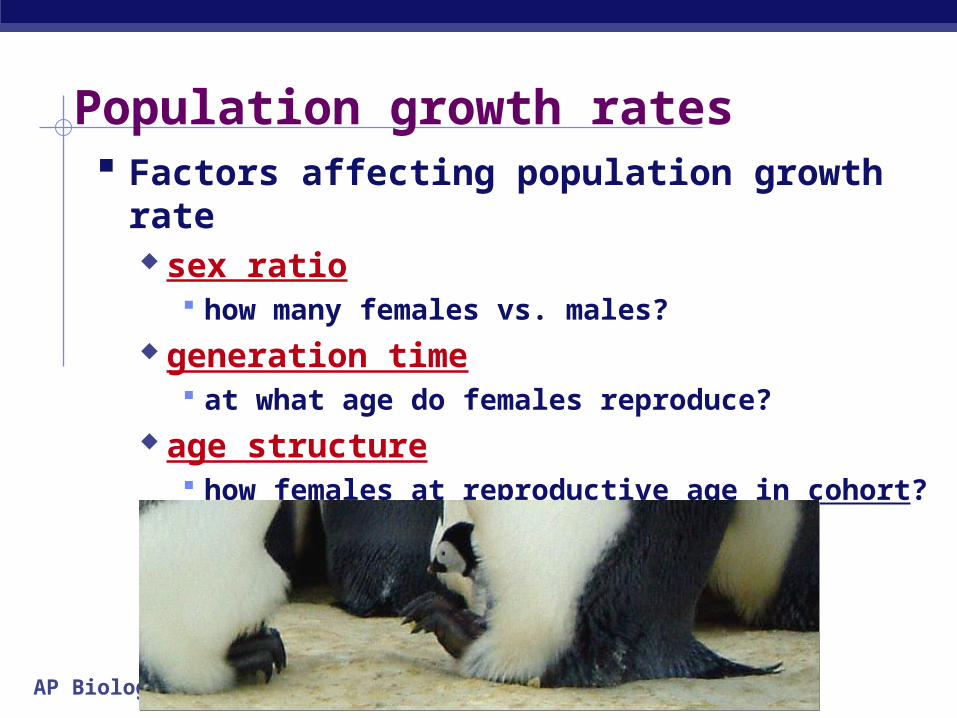
Population growth rates Factors affecting population growth rate
sex ratio how many females vs. males?
generation time at what age do females reproduce?
age structure how females at reproductive age in cohort?
AP Biology
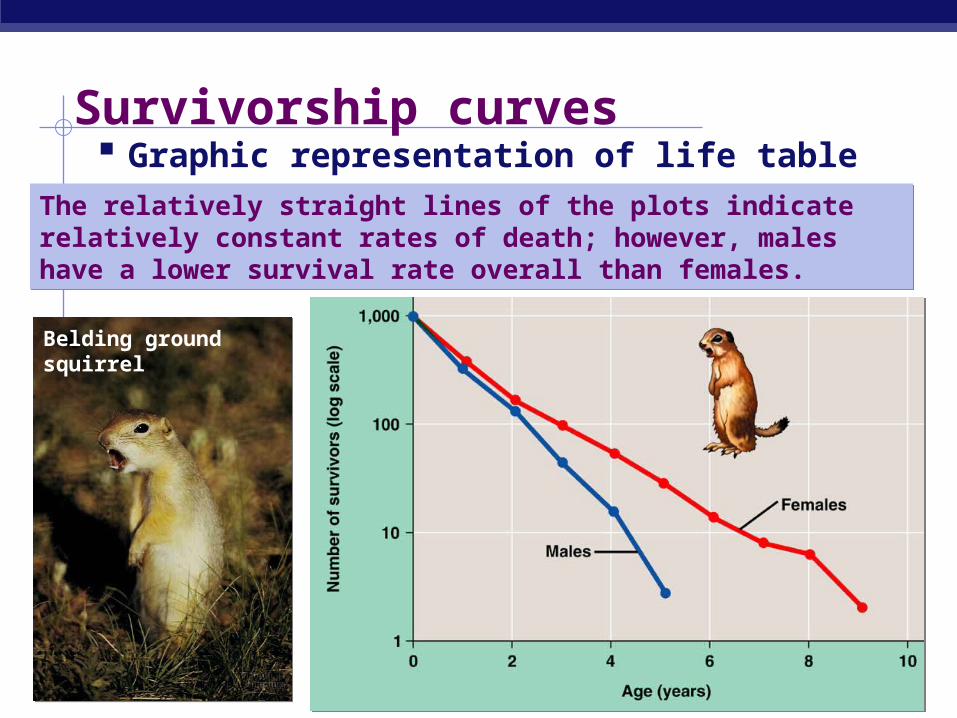
Survivorship curves Graphic representation of life table
Belding ground squirrel
The relatively straight lines of the plots indicate relatively constant rates of death; however, males have a lower survival rate overall than females.
The relatively straight lines of the plots indicate relatively constant rates of death; however, males have a lower survival rate overall than females.
AP Biology
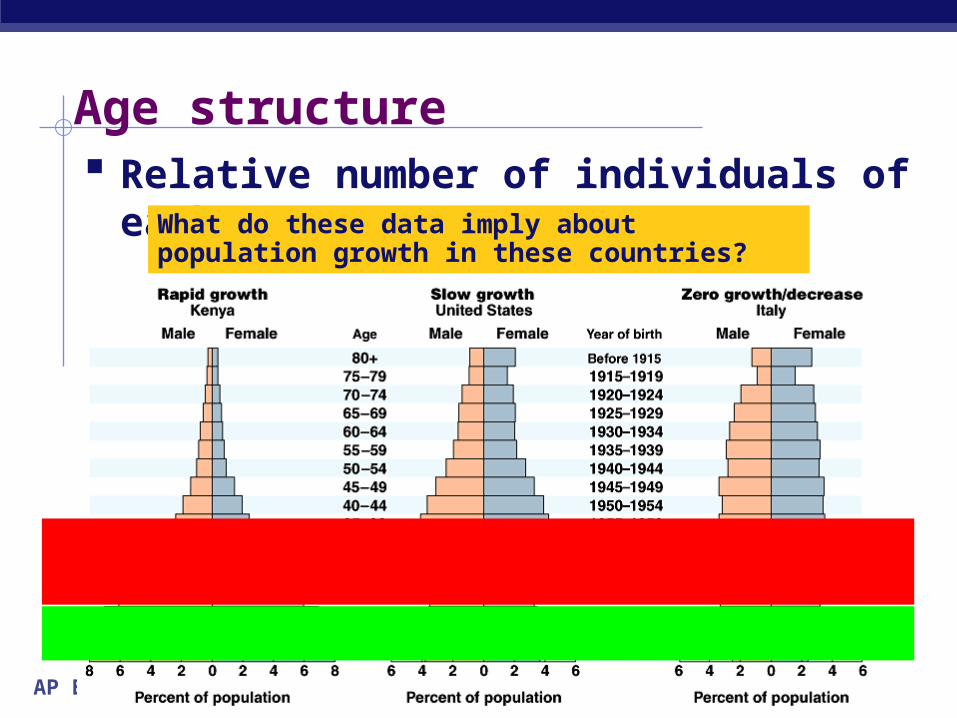
Age structure Relative number of individuals of each age
What do these data imply about population growth in these countries?
AP Biology
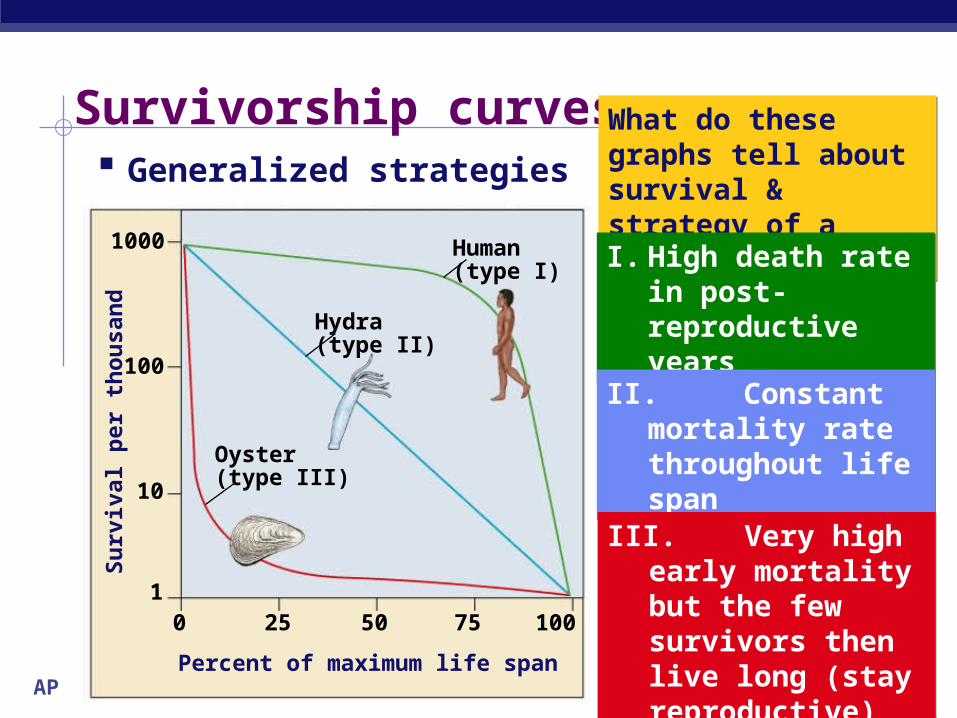
Survivorship curves Generalized strategies
What do these graphs tell about survival & strategy of a species?
What do these graphs tell about survival & strategy of a species?
0 25
1000
100
Human(type I)
Hydra(type II)
Oyster(type III)
10
150
Percent of maximum life span
10075
Su
rviv
al p
er
tho
us
and
I. High death rate in post-reproductive years
I. High death rate in post-reproductive years
II. Constant mortality rate throughout life span
II. Constant mortality rate throughout life span
III. Very high early mortality but the few survivors then live long (stay reproductive)
III. Very high early mortality but the few survivors then live long (stay reproductive)
AP Biology
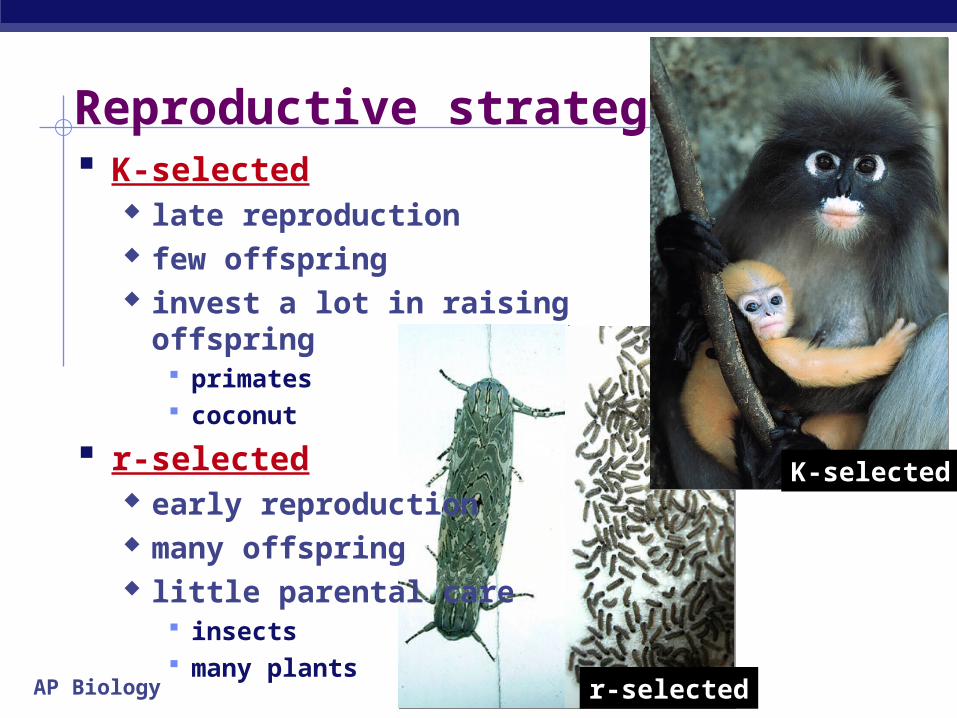
Reproductive strategies K-selected
late reproduction few offspring invest a lot in raising offspring
primates coconut
r-selected early reproduction many offspring little parental care
insects many plants
K-selected
r-selected
AP Biology
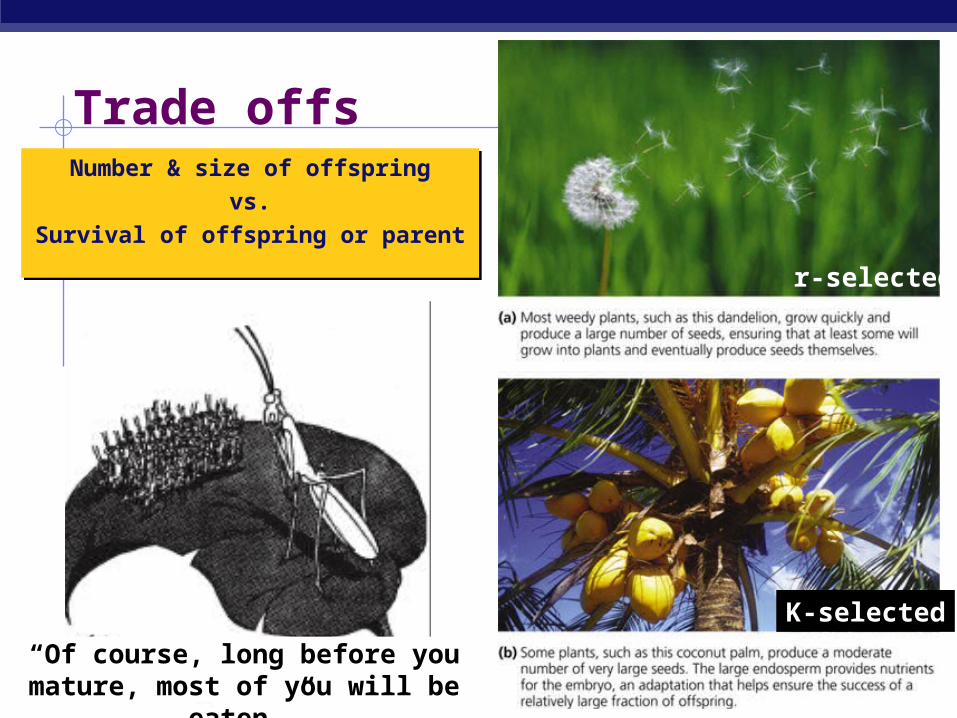
Trade offsNumber & size of offspring
vs.
Survival of offspring or parent
Number & size of offspring
vs.
Survival of offspring or parentr-selected
K-selected
“Of course, long before you mature, most of you will be eaten.”
AP Biology
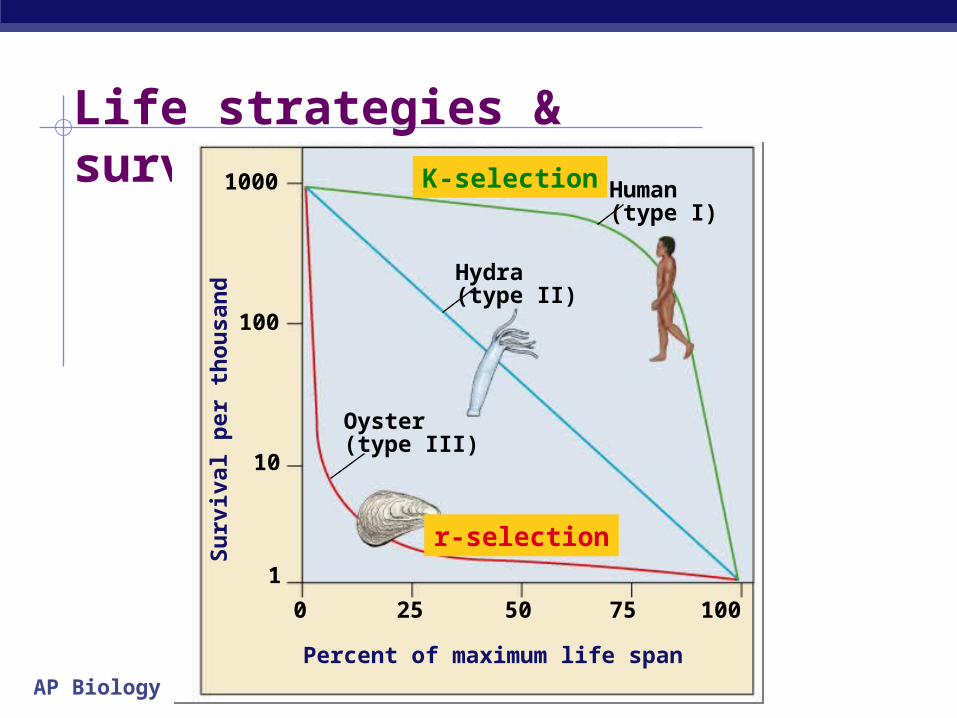
Life strategies & survivorship curves
0 25
1000
100
Human(type I)
Hydra(type II)
Oyster(type III)
10
1
50
Percent of maximum life span
10075
Su
rviv
al p
er
tho
us
and
K-selection
r-selection
AP Biology
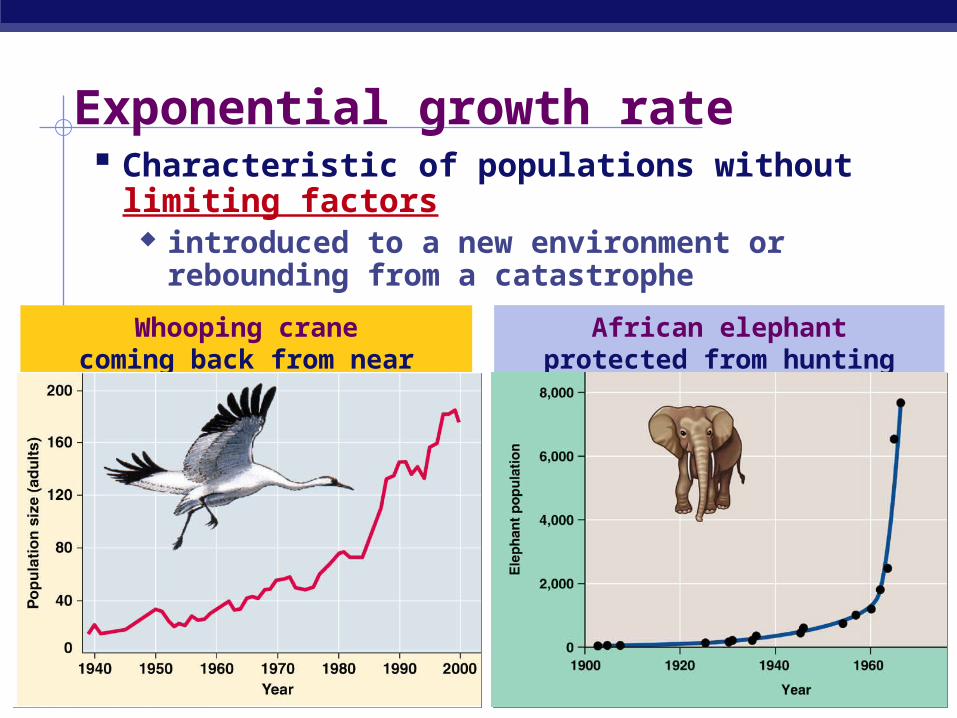
African elephantprotected from hunting
Whooping cranecoming back from near extinction
Exponential growth rate Characteristic of populations without
limiting factors introduced to a new environment or rebounding
from a catastrophe
AP Biology
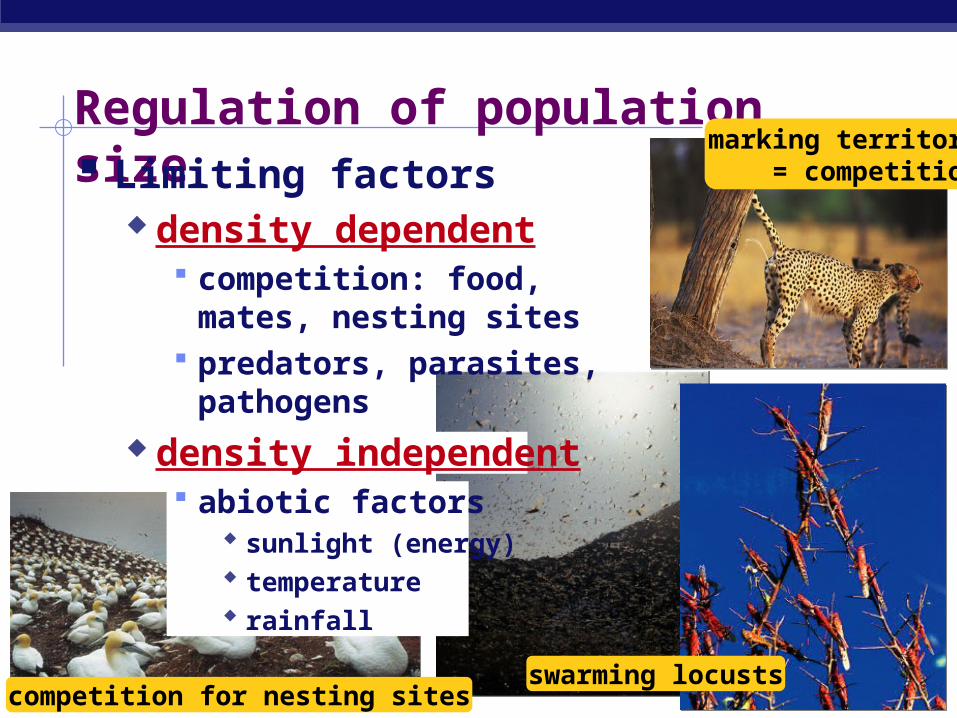
Regulation of population size Limiting factors
density dependent competition: food, mates,
nesting sites predators, parasites,
pathogens density independent
abiotic factors sunlight (energy) temperature rainfall
swarming locusts
marking territory= competition
competition for nesting sites
AP Biology
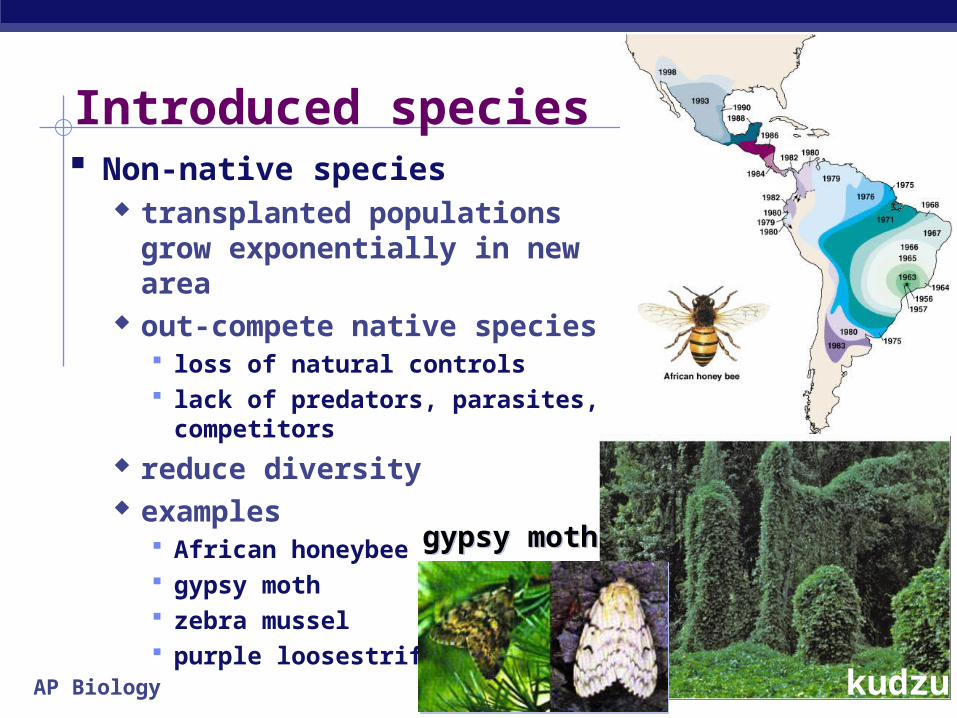
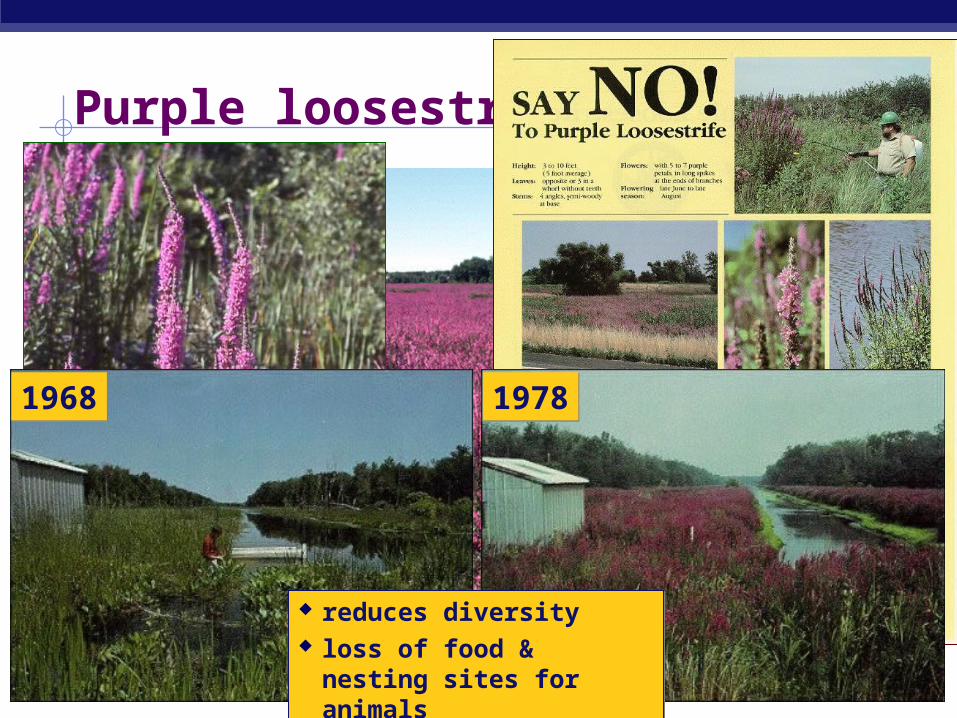
Introduced species Non-native species
transplanted populations grow exponentially in new area
out-compete native species loss of natural controls lack of predators, parasites,
competitors reduce diversity examples
African honeybee gypsy moth zebra mussel purple loosestrife
kudzu
gypsy mothgypsy moth
AP Biology
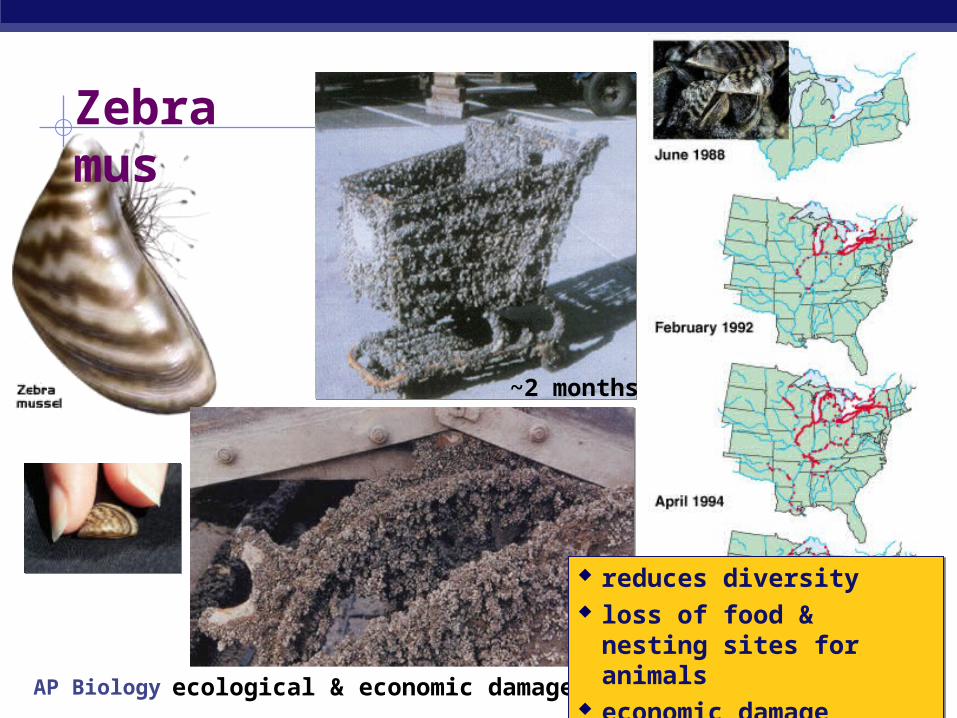
Zebra mussel
ecological & economic damage
~2 months
reduces diversity loss of food & nesting sites
for animals economic damage
reduces diversity loss of food & nesting sites
for animals economic damage
AP Biology
Purple loosestrife
19681968 19781978
reduces diversity loss of food & nesting sites
for animals
reduces diversity loss of food & nesting sites
for animals
AP Biology
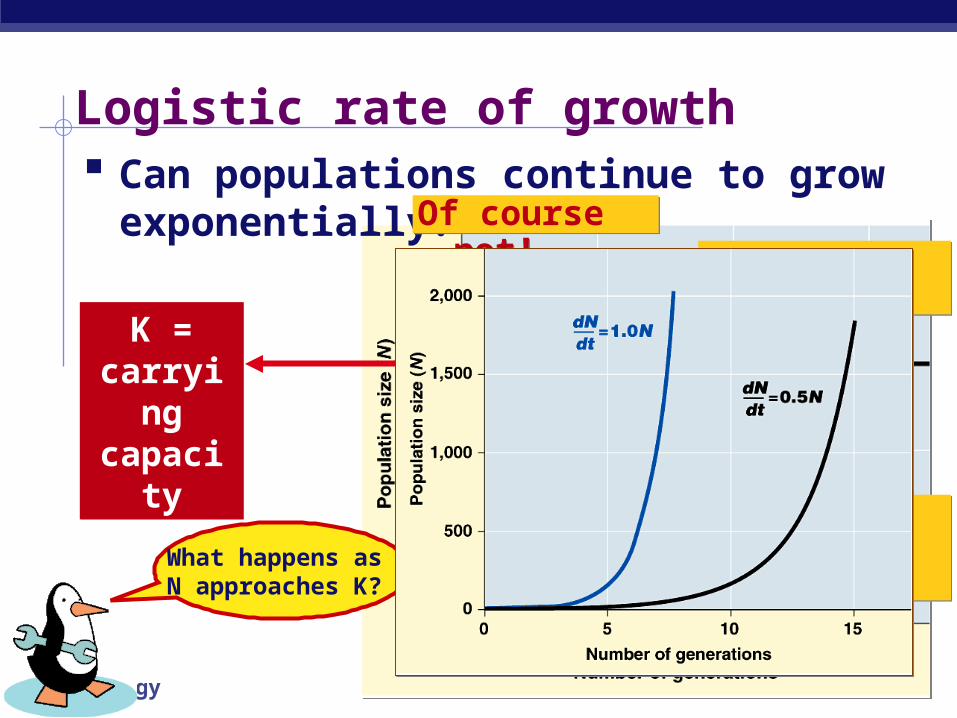
K =carryingcapacity
K =carryingcapacity
Logistic rate of growth Can populations continue to grow
exponentially? Of course not!Of course not!
effect of natural controlseffect of natural controls
no natural controlsno natural controls
What happens as N approaches K?
AP Biology
500
400
300
200
100
0200 10 30 5040 60
Time (days)
Nu
mb
er o
f cl
ado
cera
ns
(per
20
0 m
l)
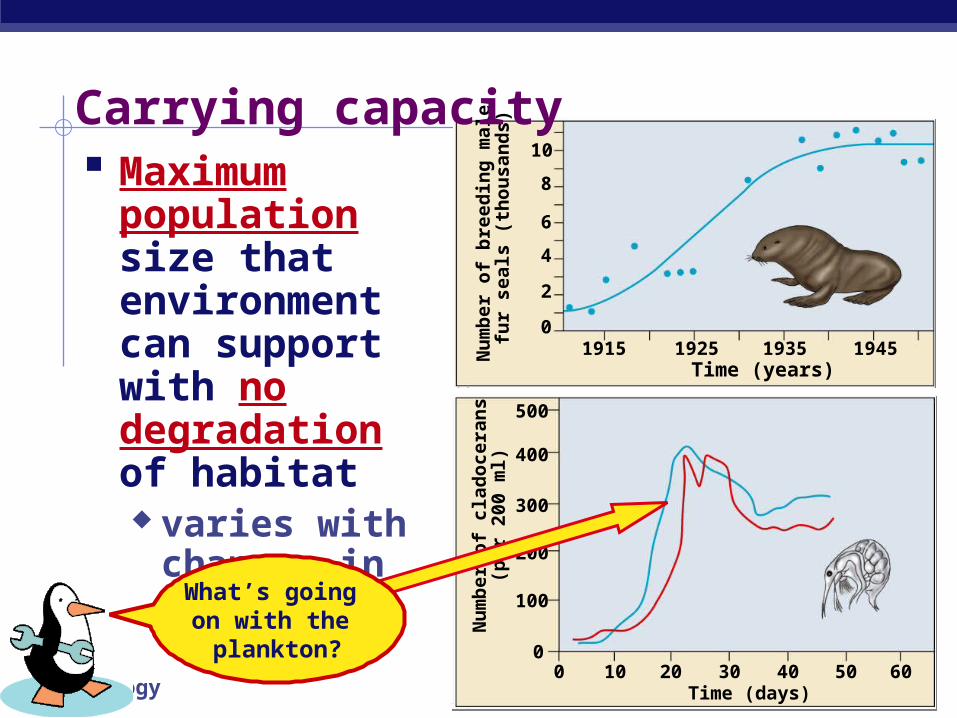
Maximum population size that environment can support with no degradation of habitat varies with
changes in resources
Time (years)1915 1925 1935 1945
10
8
6
4
2
0
Nu
mb
er o
f b
ree
din
g m
ale
fu
r se
als
(th
ou
san
ds)
Carrying capacity
What’s going on with the plankton?
AP Biology
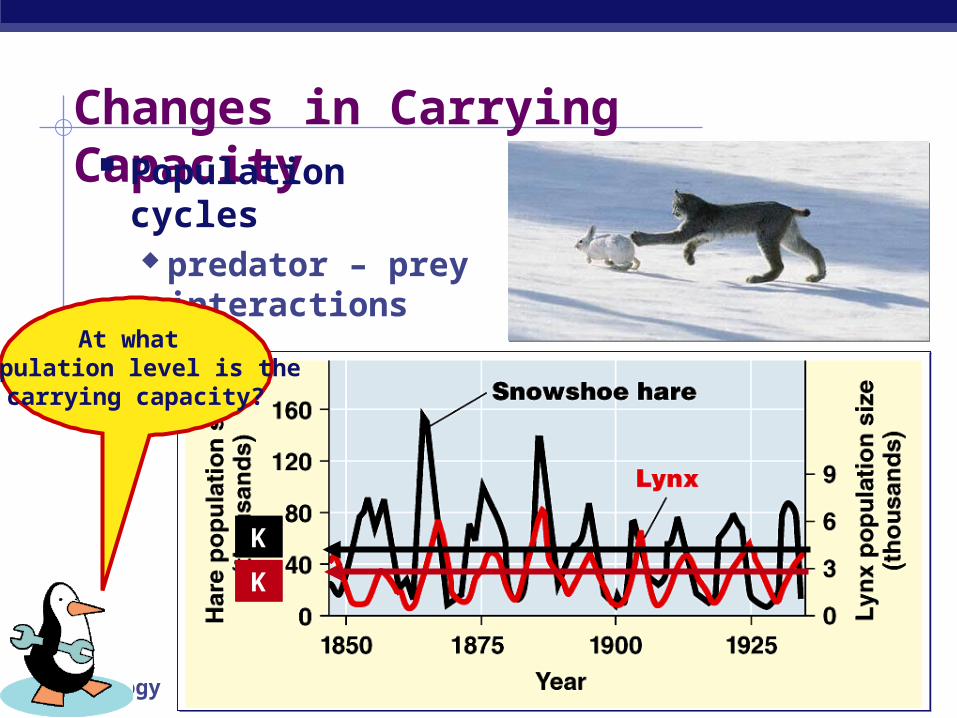
Changes in Carrying Capacity Population cycles
predator – prey interactions
At what population level is the
carrying capacity?
KK
KK
AP Biology
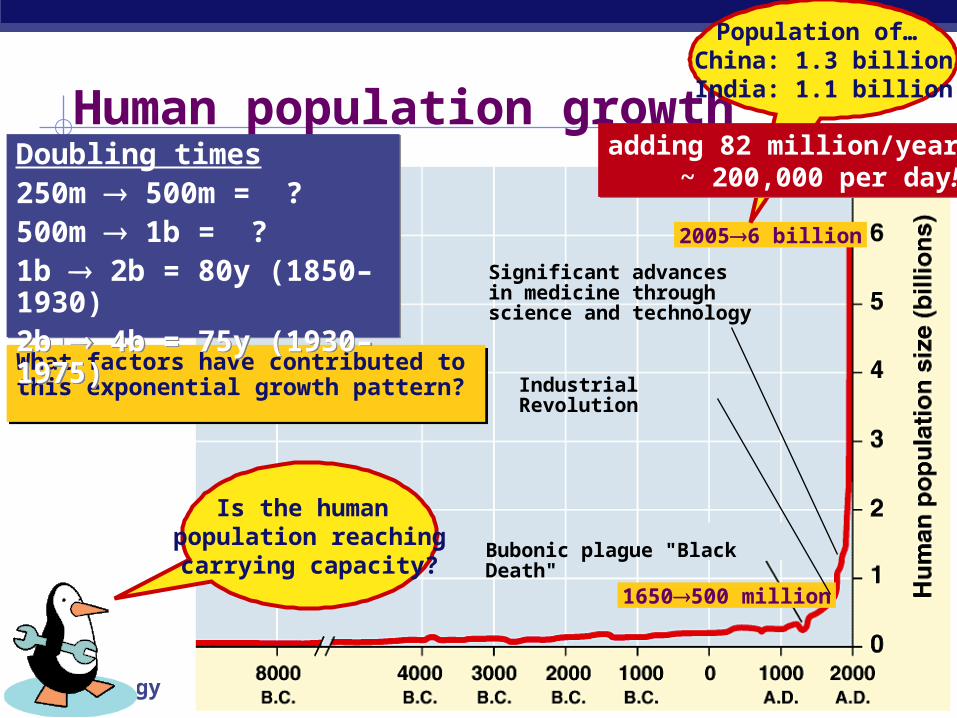
Human population growth
What factors have contributed to this exponential growth pattern? What factors have contributed to this exponential growth pattern?
1650500 million
20056 billion
Industrial Revolution
Significant advancesin medicine throughscience and technology
Bubonic plague "Black Death"
Population of… China: 1.3 billionIndia: 1.1 billion
adding 82 million/year~ 200,000 per day!
adding 82 million/year~ 200,000 per day!
Doubling times250m 500m = ?500m 1b = ?1b 2b = 80y (1850–1930)2b 4b = 75y (1930–1975)
Doubling times250m 500m = ?500m 1b = ?1b 2b = 80y (1850–1930)2b 4b = 75y (1930–1975)
Is the human population reachingcarrying capacity?
AP Biology
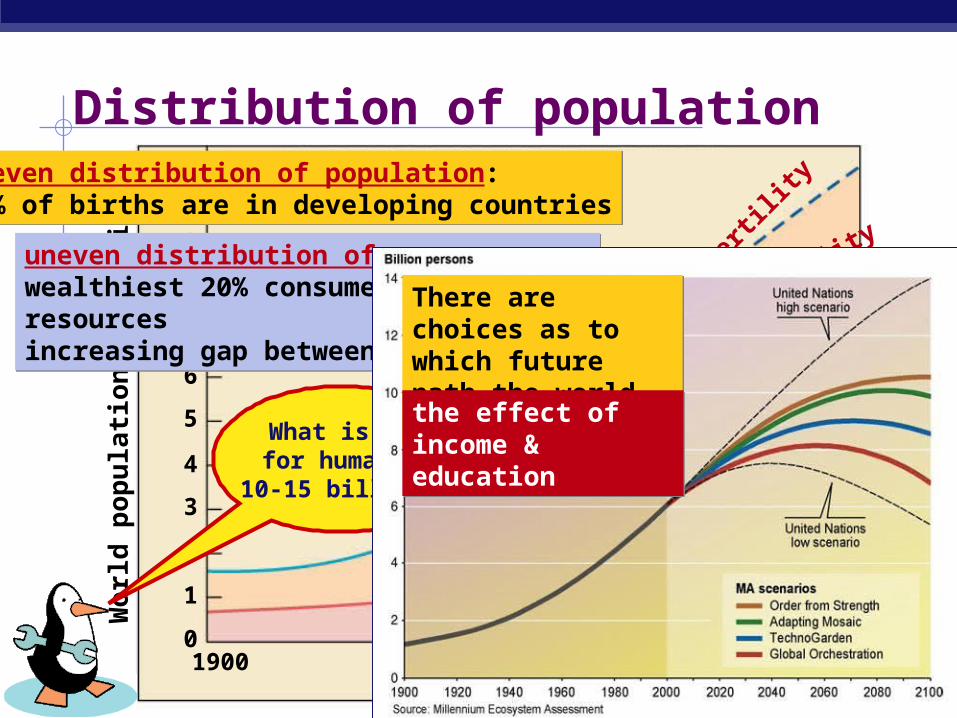
Distribution of population growth
1
2
3
Time19501900 2000
Developing countries
2050
4
5
6
7
8
9
10
11
0Developed countries
low fertility
Wo
rld
po
pu
lati
on
in b
illio
ns
World total
medium fertil
ity
high fe
rtilit
yuneven distribution of population:90% of births are in developing countriesuneven distribution of population:90% of births are in developing countries
uneven distribution of resources:wealthiest 20% consumes ~90% of resourcesincreasing gap between rich & poor
uneven distribution of resources:wealthiest 20% consumes ~90% of resourcesincreasing gap between rich & poor
What is K for humans?10-15 billion?
There are choices as to which future path the world takes…
There are choices as to which future path the world takes…
the effect of income & education the effect of income & education
AP Biology
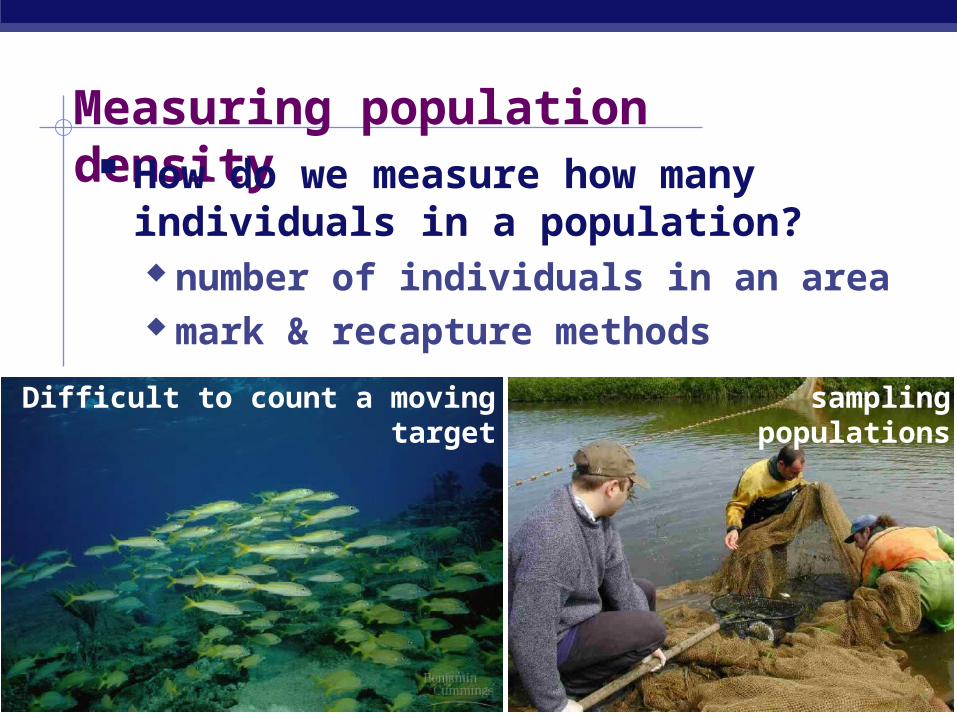
Difficult to count a moving target
Measuring population density How do we measure how many
individuals in a population? number of individuals in an area mark & recapture methods
sampling populations
AP Biology
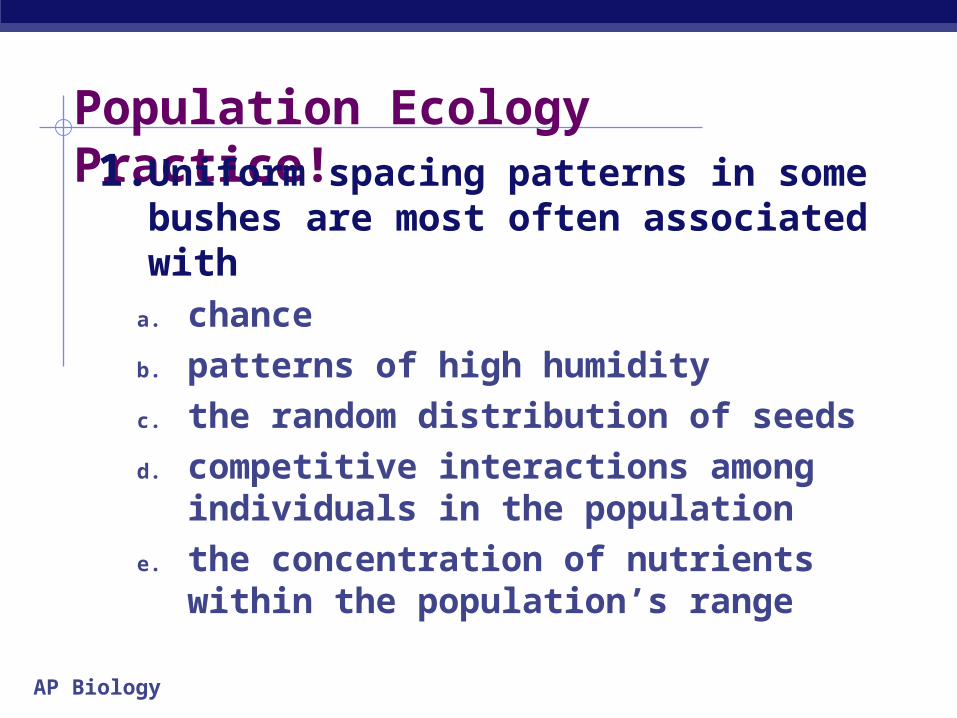
Population Ecology Practice!1. Uniform spacing patterns in some
bushes are most often associated witha. chance
b. patterns of high humidity
c. the random distribution of seeds
d. competitive interactions among individuals in the population
e. the concentration of nutrients within the population’s range
AP Biology
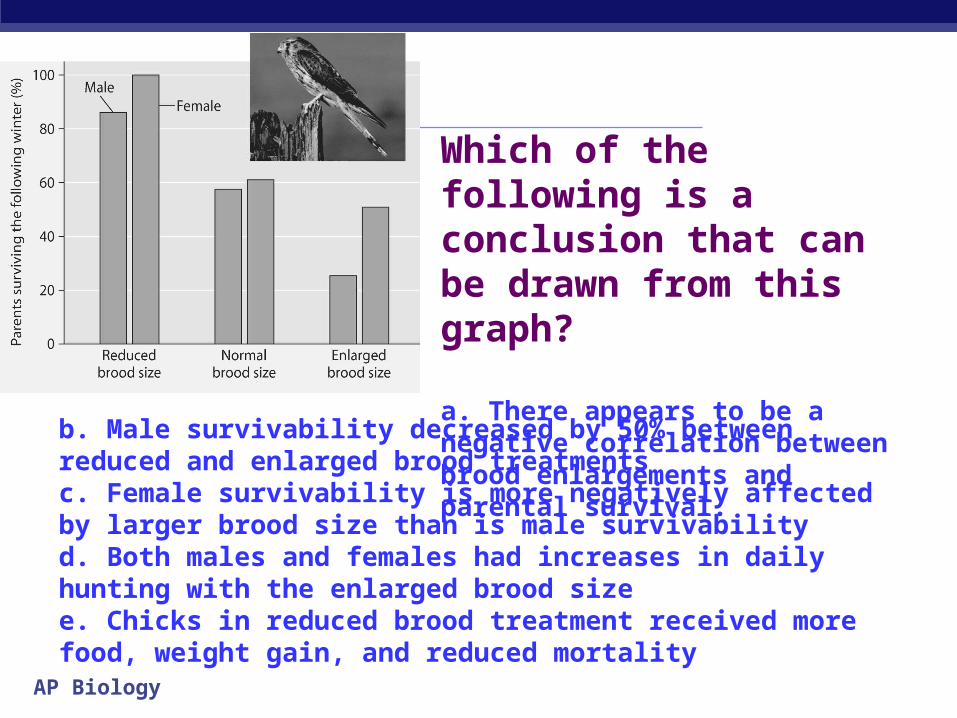
Which of the following is a conclusion that can be drawn from this graph?
a. There appears to be a negative correlation between brood enlargements and parental survival.
b. Male survivability decreased by 50% between reduced and enlarged brood treatmentsc. Female survivability is more negatively affected by larger brood size than is male survivabilityd. Both males and females had increases in daily hunting with the enlarged brood sizee. Chicks in reduced brood treatment received more food, weight gain, and reduced mortality
AP Biology
A population of ground squirrels has an annual per capita birth rate of 0.06 and an annual per capita death rate of 0.02. Estimate the number of individuals added to (or lost from) a population of 1,000 individuals in one year
a. 40 individuals added
b. 120 individuals added
c. 20 individuals lost
d. 400 individuals added
e. 20 individuals added