anritsu measurement guide
DESCRIPTION
Guia para medicion con equipos AnritsuTRANSCRIPT
Measurement Guide
Spectrum Analyzerfor Anritsu RF and Microwave Handheld Instruments
BTS Master™ Site Master™ Spectrum Master™ Cell Master™LMR Master
Spectrum Analyzer Included
S412E CW Generator Included with the S412E LMR Master
Interference Analyzer Option 25
Channel Scanner Option 27
Zero-Span IF Output Option 89
Gated Sweep Option 90
CW Generator Option 28
Coverage Mapping Option 431
AM/FM/PM Analyzer Option 509
NoteNot all instrument models offer every option. Please refer to the Technical Data Sheet of your instrument for available options.
Anritsu Company490 Jarvis DriveMorgan Hill, CA 95037-2809USAhttp://www.anritsu.com
Part Number: 10580-00231Revision: F
Published: April 2013Copyright 2013 Anritsu Company

TRADEMARK ACKNOWLEDGMENTSWindows is a registered trademarks of Microsoft Corporation. BTS Master, Site Master, Cell Master,LMR Master, and Spectrum Master are trademarks of Anritsu Company. Google Maps and GoogleEarth are trademarks of Google Inc.
NOTICEAnritsu Company has prepared this manual for use by Anritsu Company personnel and customers as aguide for the proper installation, operation and maintenance of Anritsu Company equipment andcomputer programs. The drawings, specifications, and information contained herein are the property ofAnritsu Company, and any unauthorized use or disclosure of these drawings, specifications, andinformation is prohibited; they shall not be reproduced, copied, or used in whole or in part as the basisfor manufacture or sale of the equipment or software programs without the prior written consent ofAnritsu Company.
UPDATESUpdates, if any, can be downloaded from the Anritsu Website at:http://www.anritsu.comFor the latest service and sales contact information in your area, please visit:http://www.anritsu.com/contact.asp
Spectrum Analyzer MG PN: 10580-00231 Rev. F Safety-1
Safety Symbols
To prevent the risk of personal injury or loss related to equipment malfunction, Anritsu Company uses the following symbols to indicate safety-related information. For your own safety, please read the information carefully before operating the equipment.
Symbols Used in Manuals
Safety Symbols Used on Equipment and in ManualsThe following safety symbols are used inside or on the equipment near operation locations to provide information about safety items and operation precautions. Ensure that you clearly understand the meanings of the symbols and take the necessary precautions before operating the equipment. Some or all of the following five symbols may or may not be used on all Anritsu equipment. In addition, there may be other labels attached to products that are not shown in the diagrams in this manual.
Danger
This indicates a risk from a very dangerous condition or procedure that could result in serious injury or death and possible loss related to equipment malfunction. Follow all precautions and procedures to minimize this risk.
Warning This indicates a risk from a hazardous condition or procedure that could result in light-to-severe injury or loss related to equipment malfunction. Follow all precautions and procedures to minimize this risk.
Caution
This indicates a risk from a hazardous procedure that could result in loss related to equipment malfunction. Follow all precautions and procedures to minimize this risk.
This indicates a prohibited operation. The prohibited operation is indicated symbolically in or near the barred circle.
This indicates a compulsory safety precaution. The required operation is indicated symbolically in or near the circle.
This indicates a warning or caution. The contents are indicated symbolically in or near the triangle.
This indicates a note. The contents are described in the box.
These indicate that the marked part should be recycled.
Safety-2 PN: 10580-00231 Rev. F Spectrum Analyzer MG
For Safety
Warning Always refer to the operation manual when working near locations at which the alert mark, shown on the left, is attached. If the operation, etc., is performed without heeding the advice in the operation manual, there is a risk of personal injury. In addition, the equipment performance may be reduced. Moreover, this alert mark is sometimes used with other marks and descriptions indicating other dangers.
Warning
When supplying power to this equipment, connect the accessory 3-pin power cord to a 3-pin grounded power outlet. If a grounded 3-pin outlet is not available, use a conversion adapter and ground the green wire, or connect the frame ground on the rear panel of the equipment to ground. If power is supplied without grounding the equipment, there is a risk of receiving a severe or fatal electric shock.
Warning
This equipment can not be repaired by the operator. Do not attempt to remove the equipment covers or to disassemble internal components. Only qualified service technicians with a knowledge of electrical fire and shock hazards should service this equipment. There are high-voltage parts in this equipment presenting a risk of severe injury or fatal electric shock to untrained personnel. In addition, there is a risk of damage to precision components.
Caution
Electrostatic Discharge (ESD) can damage the highly sensitive circuits in the instrument. ESD is most likely to occur as test devices are being connected to, or disconnected from, the instrument’s front and rear panel ports and connectors. You can protect the instrument and test devices by wearing a static-discharge wristband. Alternatively, you can ground yourself to discharge any static charge by touching the outer chassis of the grounded instrument before touching the instrument’s front and rear panel ports and connectors. Avoid touching the test port center conductors unless you are properly grounded and have eliminated the possibility of static discharge.
Repair of damage that is found to be caused by electrostatic discharge is not covered under warranty.
Warning This product is supplied with a rechargeable battery that could potentially leak hazardous compounds into the environment. These hazardous compounds present a risk of injury or loss due to exposure. Anritsu Company recommends removing the battery for long-term storage of the instrument and storing the battery in a leak-proof plastic container. Follow the environmental storage requirements specified in the product technical data sheet.
Spectrum Analyzer MG PN: 10580-00231 Rev. F Contents-1
Table of Contents
Chapter 1—General Information
1-1 Introduction . . . . . . . . . . . . . . . . . . . . . . . . . . . . . . . . . . . . . . . . . . . . . . . . . 1-1
1-2 Contacting Anritsu . . . . . . . . . . . . . . . . . . . . . . . . . . . . . . . . . . . . . . . . 1-1
1-3 Anritsu Service Centers . . . . . . . . . . . . . . . . . . . . . . . . . . . . . . . . . . . . . 1-1
1-4 Selecting a Measurement Mode . . . . . . . . . . . . . . . . . . . . . . . . . . . . . . . . 1-2
1-5 Connector Care . . . . . . . . . . . . . . . . . . . . . . . . . . . . . . . . . . . . . . . . . . . . . 1-2
Connecting Procedure. . . . . . . . . . . . . . . . . . . . . . . . . . . . . . . . . . . . . . 1-2
Disconnecting Procedure . . . . . . . . . . . . . . . . . . . . . . . . . . . . . . . . . . . 1-2
Connectors . . . . . . . . . . . . . . . . . . . . . . . . . . . . . . . . . . . . . . . . . . . . . . 1-3
Chapter 2—Spectrum Analyzer
2-1 Introduction . . . . . . . . . . . . . . . . . . . . . . . . . . . . . . . . . . . . . . . . . . . . . . . . . 2-1
2-2 General Measurement Setups . . . . . . . . . . . . . . . . . . . . . . . . . . . . . . . . . . 2-1
2-3 Making Spectrum Analyzer Measurements . . . . . . . . . . . . . . . . . . . . . . . . 2-2
Setting Bandwidth Parameters . . . . . . . . . . . . . . . . . . . . . . . . . . . . . . . 2-2
Setting Sweep Parameters . . . . . . . . . . . . . . . . . . . . . . . . . . . . . . . . . . 2-3
2-4 Resolution Bandwidth . . . . . . . . . . . . . . . . . . . . . . . . . . . . . . . . . . . . . . . . . 2-8
2-5 Video Bandwidth. . . . . . . . . . . . . . . . . . . . . . . . . . . . . . . . . . . . . . . . . . . . . 2-8
2-6 Sweep Limitations. . . . . . . . . . . . . . . . . . . . . . . . . . . . . . . . . . . . . . . . . . . . 2-9
2-7 Attenuator Functions. . . . . . . . . . . . . . . . . . . . . . . . . . . . . . . . . . . . . . . . . . 2-9
2-8 Preamplifier Operation . . . . . . . . . . . . . . . . . . . . . . . . . . . . . . . . . . . . . . . . 2-9
Preamplifier Measurement Example . . . . . . . . . . . . . . . . . . . . . . . . . . . 2-9
2-9 Field Measurements . . . . . . . . . . . . . . . . . . . . . . . . . . . . . . . . . . . . . . . 2-11
2-10 Field Strength . . . . . . . . . . . . . . . . . . . . . . . . . . . . . . . . . . . . . . . . . . . . . . 2-11
Antenna Calculations . . . . . . . . . . . . . . . . . . . . . . . . . . . . . . . . . . . . . 2-12
2-11 Occupied Bandwidth Measurement . . . . . . . . . . . . . . . . . . . . . . . . . . . . 2-13
2-12 Channel Power Measurement . . . . . . . . . . . . . . . . . . . . . . . . . . . . . . . . . 2-14
Channel Power Measurement for GSM . . . . . . . . . . . . . . . . . . . . . . . 2-15
2-13 Adjacent Channel Power Measurement . . . . . . . . . . . . . . . . . . . . . . . . . 2-16
2-14 Out-of-Band Spurious Emission Measurement . . . . . . . . . . . . . . . . . . . . 2-17
2-15 In-band/Out-of-Channel Measurements . . . . . . . . . . . . . . . . . . . . . . . . . 2-18
2-16 In-band Spurious Measurement . . . . . . . . . . . . . . . . . . . . . . . . . . . . . . . 2-19
2-17 AM/FM/SSB Demodulation . . . . . . . . . . . . . . . . . . . . . . . . . . . . . . . . . . 2-20
2-18 Carrier to Interference Ratio Measurement . . . . . . . . . . . . . . . . . . . . . . 2-21
2-19 Emission Mask . . . . . . . . . . . . . . . . . . . . . . . . . . . . . . . . . . . . . . . . . . . . . 2-24
Contents-2 PN: 10580-00231 Rev. F Spectrum Analyzer MG
Table of Contents (Continued)
2-20 Coverage Mapping . . . . . . . . . . . . . . . . . . . . . . . . . . . . . . . . . . . . . . . . . . 2-24
2-21 Spectrum Analyzer Menus . . . . . . . . . . . . . . . . . . . . . . . . . . . . . . . . . . . . 2-25
Main Menu Key Menus . . . . . . . . . . . . . . . . . . . . . . . . . . . . . . . . . . . . 2-25
Sweep Menus . . . . . . . . . . . . . . . . . . . . . . . . . . . . . . . . . . . . . . . . . . . 2-26
Measurement Menus . . . . . . . . . . . . . . . . . . . . . . . . . . . . . . . . . . . . . 2-27
Trace Menus . . . . . . . . . . . . . . . . . . . . . . . . . . . . . . . . . . . . . . . . . . . . 2-28
Limit Menus . . . . . . . . . . . . . . . . . . . . . . . . . . . . . . . . . . . . . . . . . . . . 2-29
System Menus . . . . . . . . . . . . . . . . . . . . . . . . . . . . . . . . . . . . . . . . . . 2-30
2-22 Freq (Frequency) Menu . . . . . . . . . . . . . . . . . . . . . . . . . . . . . . . . . . . . . 2-31
2-23 Amplitude Menu . . . . . . . . . . . . . . . . . . . . . . . . . . . . . . . . . . . . . . . . . . . . 2-33
Detection Menu . . . . . . . . . . . . . . . . . . . . . . . . . . . . . . . . . . . . . . . . . 2-34
2-24 Span Menu . . . . . . . . . . . . . . . . . . . . . . . . . . . . . . . . . . . . . . . . . . . . . . . 2-35
Span Menu (continued) . . . . . . . . . . . . . . . . . . . . . . . . . . . . . . . . . . . 2-36
2-25 Zero Span IF BW Menu . . . . . . . . . . . . . . . . . . . . . . . . . . . . . . . . . . . . . 2-37
2-26 Zero Span IF BW Menu (MS2723B/24B) . . . . . . . . . . . . . . . . . . . . . . . . 2-38
2-27 BW (Bandwidth) Menu . . . . . . . . . . . . . . . . . . . . . . . . . . . . . . . . . . . . . . 2-39
2-28 Marker Menu . . . . . . . . . . . . . . . . . . . . . . . . . . . . . . . . . . . . . . . . . . . . . . 2-40
More Peak Options Menu . . . . . . . . . . . . . . . . . . . . . . . . . . . . . . . . . 2-41
Marker 2/2 Menu . . . . . . . . . . . . . . . . . . . . . . . . . . . . . . . . . . . . . . . . . 2-42
2-29 Sweep Menu . . . . . . . . . . . . . . . . . . . . . . . . . . . . . . . . . . . . . . . . . . . . . . 2-43
Sweep Mode Menu . . . . . . . . . . . . . . . . . . . . . . . . . . . . . . . . . . . . . . 2-44
Trigger Menu . . . . . . . . . . . . . . . . . . . . . . . . . . . . . . . . . . . . . . . . . . . 2-45
Gate Setup Menu (Option 90) . . . . . . . . . . . . . . . . . . . . . . . . . . . . . . 2-46
2-30 Measure Menu . . . . . . . . . . . . . . . . . . . . . . . . . . . . . . . . . . . . . . . . . . . . 2-47
Field Strength Menu . . . . . . . . . . . . . . . . . . . . . . . . . . . . . . . . . . . . . 2-48
OCC BW Menu . . . . . . . . . . . . . . . . . . . . . . . . . . . . . . . . . . . . . . . . . 2-48
Channel Power Menu . . . . . . . . . . . . . . . . . . . . . . . . . . . . . . . . . . . . 2-49
ACPR Menu . . . . . . . . . . . . . . . . . . . . . . . . . . . . . . . . . . . . . . . . . . . . 2-50
AM/FM Demod Menu . . . . . . . . . . . . . . . . . . . . . . . . . . . . . . . . . . . . . 2-51
C/I Menu . . . . . . . . . . . . . . . . . . . . . . . . . . . . . . . . . . . . . . . . . . . . . . 2-52
Measure 2/2 Menu . . . . . . . . . . . . . . . . . . . . . . . . . . . . . . . . . . . . . . . 2-53
2-31 Trace Menu . . . . . . . . . . . . . . . . . . . . . . . . . . . . . . . . . . . . . . . . . . . . . . . 2-54
Trace A Ops Menu . . . . . . . . . . . . . . . . . . . . . . . . . . . . . . . . . . . . . . . 2-55
Trace B Ops Menu . . . . . . . . . . . . . . . . . . . . . . . . . . . . . . . . . . . . . . . 2-56
Trace C Ops Menu . . . . . . . . . . . . . . . . . . . . . . . . . . . . . . . . . . . . . . 2-57
Spectrum Analyzer MG PN: 10580-00231 Rev. F Contents-3
Table of Contents (Continued)
2-32 Limit Menu . . . . . . . . . . . . . . . . . . . . . . . . . . . . . . . . . . . . . . . . . . . . . . . 2-58
Edit Menu . . . . . . . . . . . . . . . . . . . . . . . . . . . . . . . . . . . . . . . . . . . . . 2-60
Edit Menu (continued) . . . . . . . . . . . . . . . . . . . . . . . . . . . . . . . . . . . . . 2-61
Limit Move Menu . . . . . . . . . . . . . . . . . . . . . . . . . . . . . . . . . . . . . . . . 2-62
Limit Envelope Menu . . . . . . . . . . . . . . . . . . . . . . . . . . . . . . . . . . . . . 2-63
Limit Advanced Menu . . . . . . . . . . . . . . . . . . . . . . . . . . . . . . . . . . . . 2-65
2-33 Application Options Menu . . . . . . . . . . . . . . . . . . . . . . . . . . . . . . . . . . . . 2-66
2-34 Other Menus. . . . . . . . . . . . . . . . . . . . . . . . . . . . . . . . . . . . . . . . . . . . . . . 2-66
Chapter 3—LMR Master CW Signal Generator
3-1 Introduction . . . . . . . . . . . . . . . . . . . . . . . . . . . . . . . . . . . . . . . . . . . . . . . . . 3-1
3-2 Procedure . . . . . . . . . . . . . . . . . . . . . . . . . . . . . . . . . . . . . . . . . . . . . . . . . . 3-2
Chapter 4—Interference Analyzer (Option 25)
4-1 Introduction . . . . . . . . . . . . . . . . . . . . . . . . . . . . . . . . . . . . . . . . . . . . . . . . . 4-1
4-2 General Measurement Setups . . . . . . . . . . . . . . . . . . . . . . . . . . . . . . . . . . 4-1
4-3 Spectrum . . . . . . . . . . . . . . . . . . . . . . . . . . . . . . . . . . . . . . . . . . . . . . . . . . 4-1
4-4 Spectrogram . . . . . . . . . . . . . . . . . . . . . . . . . . . . . . . . . . . . . . . . . . . . . . . 4-2
4-5 Signal Strength . . . . . . . . . . . . . . . . . . . . . . . . . . . . . . . . . . . . . . . . . . . . . 4-4
4-6 Received Signal Strength Indicator (RSSI) . . . . . . . . . . . . . . . . . . . . . . . . 4-5
4-7 Signal ID . . . . . . . . . . . . . . . . . . . . . . . . . . . . . . . . . . . . . . . . . . . . . . . . . . 4-6
4-8 Interference Mapping . . . . . . . . . . . . . . . . . . . . . . . . . . . . . . . . . . . . . . . . 4-9
Anritsu easyMap Tools . . . . . . . . . . . . . . . . . . . . . . . . . . . . . . . . . . . 4-11
Instrument Settings . . . . . . . . . . . . . . . . . . . . . . . . . . . . . . . . . . . . . . . 4-11
Locate the Interfering Signal . . . . . . . . . . . . . . . . . . . . . . . . . . . . . . . . 4-14
Save the Interference Information . . . . . . . . . . . . . . . . . . . . . . . . . . . 4-15
4-9 Interference Analyzer (IA) Menus . . . . . . . . . . . . . . . . . . . . . . . . . . . . . . 4-17
4-10 Freq (Frequency) Menu . . . . . . . . . . . . . . . . . . . . . . . . . . . . . . . . . . . . . 4-24
Span Menu . . . . . . . . . . . . . . . . . . . . . . . . . . . . . . . . . . . . . . . . . . . . 4-26
4-11 Amplitude Menu . . . . . . . . . . . . . . . . . . . . . . . . . . . . . . . . . . . . . . . . . . . 4-27
Detection Menu . . . . . . . . . . . . . . . . . . . . . . . . . . . . . . . . . . . . . . . . . 4-28
4-12 BW (Bandwidth) Menu . . . . . . . . . . . . . . . . . . . . . . . . . . . . . . . . . . . . . . 4-29
Contents-4 PN: 10580-00231 Rev. F Spectrum Analyzer MG
Table of Contents (Continued)
4-13 Measurements Menu . . . . . . . . . . . . . . . . . . . . . . . . . . . . . . . . . . . . . . . 4-30
Spectrum Menu . . . . . . . . . . . . . . . . . . . . . . . . . . . . . . . . . . . . . . . . . 4-31
Field Strength Menu . . . . . . . . . . . . . . . . . . . . . . . . . . . . . . . . . . . . . 4-32
OCC BW Menu . . . . . . . . . . . . . . . . . . . . . . . . . . . . . . . . . . . . . . . . . 4-32
Channel Power Menu . . . . . . . . . . . . . . . . . . . . . . . . . . . . . . . . . . . . 4-33
ACPR Menu . . . . . . . . . . . . . . . . . . . . . . . . . . . . . . . . . . . . . . . . . . . . 4-34
AM/FM Demod Menu . . . . . . . . . . . . . . . . . . . . . . . . . . . . . . . . . . . . . 4-35
C/I Menu . . . . . . . . . . . . . . . . . . . . . . . . . . . . . . . . . . . . . . . . . . . . . . 4-36
Measure 2/2 Menu . . . . . . . . . . . . . . . . . . . . . . . . . . . . . . . . . . . . . . . 4-37
Spectrogram Menu . . . . . . . . . . . . . . . . . . . . . . . . . . . . . . . . . . . . . . 4-38
Signal Strength Menu . . . . . . . . . . . . . . . . . . . . . . . . . . . . . . . . . . . . 4-39
RSSI Menu . . . . . . . . . . . . . . . . . . . . . . . . . . . . . . . . . . . . . . . . . . . . 4-40
Signal ID Menu . . . . . . . . . . . . . . . . . . . . . . . . . . . . . . . . . . . . . . . . . 4-41
Interference Mapping Menu . . . . . . . . . . . . . . . . . . . . . . . . . . . . . . . 4-42
Mapping Save/Recall Menu . . . . . . . . . . . . . . . . . . . . . . . . . . . . . . . . 4-43
4-14 Marker Menu . . . . . . . . . . . . . . . . . . . . . . . . . . . . . . . . . . . . . . . . . . . . . . 4-44
More Peak Options Menu . . . . . . . . . . . . . . . . . . . . . . . . . . . . . . . . . . 4-45
Marker 2/2 Menu . . . . . . . . . . . . . . . . . . . . . . . . . . . . . . . . . . . . . . . . . 4-46
4-15 Sweep Menu . . . . . . . . . . . . . . . . . . . . . . . . . . . . . . . . . . . . . . . . . . . . . 4-47
Sweep Mode Menu . . . . . . . . . . . . . . . . . . . . . . . . . . . . . . . . . . . . . . . 4-48
Trigger Menu . . . . . . . . . . . . . . . . . . . . . . . . . . . . . . . . . . . . . . . . . . . 4-49
Gate Setup Menu . . . . . . . . . . . . . . . . . . . . . . . . . . . . . . . . . . . . . . . . 4-50
4-16 Measure Menu . . . . . . . . . . . . . . . . . . . . . . . . . . . . . . . . . . . . . . . . . . . . . 4-51
4-17 Trace Menu . . . . . . . . . . . . . . . . . . . . . . . . . . . . . . . . . . . . . . . . . . . . . . . 4-52
Trace A Ops Menu . . . . . . . . . . . . . . . . . . . . . . . . . . . . . . . . . . . . . . . 4-53
Trace B Ops Menu . . . . . . . . . . . . . . . . . . . . . . . . . . . . . . . . . . . . . . . 4-54
Trace C Ops Menu . . . . . . . . . . . . . . . . . . . . . . . . . . . . . . . . . . . . . . . 4-55
4-18 Limit Menu . . . . . . . . . . . . . . . . . . . . . . . . . . . . . . . . . . . . . . . . . . . . . . . 4-56
Menu . . . . . . . . . . . . . . . . . . . . . . . . . . . . . . . . . . . . . . . . . . . . . . . . . . 4-57
Edit Menu . . . . . . . . . . . . . . . . . . . . . . . . . . . . . . . . . . . . . . . . . . . . . . 4-58
Edit Menu (continued) . . . . . . . . . . . . . . . . . . . . . . . . . . . . . . . . . . . . . 4-59
Limit Move Menu . . . . . . . . . . . . . . . . . . . . . . . . . . . . . . . . . . . . . . . . 4-60
Limit Envelope Menu . . . . . . . . . . . . . . . . . . . . . . . . . . . . . . . . . . . . . 4-61
Limit Advanced Menu . . . . . . . . . . . . . . . . . . . . . . . . . . . . . . . . . . . . 4-63
4-19 Application Options . . . . . . . . . . . . . . . . . . . . . . . . . . . . . . . . . . . . . . . . . 4-64
4-20 Other Menus . . . . . . . . . . . . . . . . . . . . . . . . . . . . . . . . . . . . . . . . . . . . . . . 4-64
Chapter 5—Channel Scanner (Option 27)
5-1 Introduction . . . . . . . . . . . . . . . . . . . . . . . . . . . . . . . . . . . . . . . . . . . . . . . . . 5-1
5-2 General Measurement Setups . . . . . . . . . . . . . . . . . . . . . . . . . . . . . . . . . . 5-1
5-3 Sample Procedure . . . . . . . . . . . . . . . . . . . . . . . . . . . . . . . . . . . . . . . . . . . 5-2
Spectrum Analyzer MG PN: 10580-00231 Rev. F Contents-5
Table of Contents (Continued)
5-4 Custom Setup Measurements . . . . . . . . . . . . . . . . . . . . . . . . . . . . . . . . . . 5-3
5-5 Custom Setup Example . . . . . . . . . . . . . . . . . . . . . . . . . . . . . . . . . . . . . . . 5-3
5-6 Script Master Measurement Setup . . . . . . . . . . . . . . . . . . . . . . . . . . . . . . 5-4
5-7 Channel Scanner (CHS) Menu Tree . . . . . . . . . . . . . . . . . . . . . . . . . . . . . 5-6
5-8 Scanner Menu . . . . . . . . . . . . . . . . . . . . . . . . . . . . . . . . . . . . . . . . . . . . . . 5-7
Channel Scan Menu . . . . . . . . . . . . . . . . . . . . . . . . . . . . . . . . . . . . . . . 5-8
Freq Scan Menu . . . . . . . . . . . . . . . . . . . . . . . . . . . . . . . . . . . . . . . . . . 5-9
Scan Script Master Menu . . . . . . . . . . . . . . . . . . . . . . . . . . . . . . . . . . 5-10
5-9 Amplitude Menu . . . . . . . . . . . . . . . . . . . . . . . . . . . . . . . . . . . . . . . . . . . . 5-11
5-10 Custom Scan Menu . . . . . . . . . . . . . . . . . . . . . . . . . . . . . . . . . . . . . . . . . 5-12
5-11 Measurements Menu . . . . . . . . . . . . . . . . . . . . . . . . . . . . . . . . . . . . . . . . 5-13
5-12 Sweep Menu. . . . . . . . . . . . . . . . . . . . . . . . . . . . . . . . . . . . . . . . . . . . . . . 5-15
5-13 Measure Menu . . . . . . . . . . . . . . . . . . . . . . . . . . . . . . . . . . . . . . . . . . . . . 5-15
5-14 Trace Menu. . . . . . . . . . . . . . . . . . . . . . . . . . . . . . . . . . . . . . . . . . . . . . . . 5-15
5-15 Limit Menu . . . . . . . . . . . . . . . . . . . . . . . . . . . . . . . . . . . . . . . . . . . . . . . . 5-15
5-16 Other Menus. . . . . . . . . . . . . . . . . . . . . . . . . . . . . . . . . . . . . . . . . . . . . . . 5-15
Chapter 6—CW Signal Generator (Option 28)
6-1 Introduction . . . . . . . . . . . . . . . . . . . . . . . . . . . . . . . . . . . . . . . . . . . . . . . . 6-1
Required Equipment . . . . . . . . . . . . . . . . . . . . . . . . . . . . . . . . . . . . . . . 6-1
6-2 Procedure . . . . . . . . . . . . . . . . . . . . . . . . . . . . . . . . . . . . . . . . . . . . . . . . . . 6-2
Chapter 7—Coverage Mapping (Option 431)
7-1 Introduction . . . . . . . . . . . . . . . . . . . . . . . . . . . . . . . . . . . . . . . . . . . . . . . . . 7-1
7-2 General Measurement Setups . . . . . . . . . . . . . . . . . . . . . . . . . . . . . . . . . . 7-1
7-3 Spectrum Analysis Settings . . . . . . . . . . . . . . . . . . . . . . . . . . . . . . . . . . . . 7-1
7-4 Coverage Mapping . . . . . . . . . . . . . . . . . . . . . . . . . . . . . . . . . . . . . . . . . 7-1
Anritsu easyMap Tools . . . . . . . . . . . . . . . . . . . . . . . . . . . . . . . . . . . . 7-3
Instrument Settings . . . . . . . . . . . . . . . . . . . . . . . . . . . . . . . . . . . . . . . . 7-5
Map the Signal Strength . . . . . . . . . . . . . . . . . . . . . . . . . . . . . . . . . . . 7-7
Save the Coverage Mapping Information . . . . . . . . . . . . . . . . . . . . . . . 7-8
7-5 Coverage Mapping Menus . . . . . . . . . . . . . . . . . . . . . . . . . . . . . . . . . . . 7-11
7-6 Coverage Mapping Menu . . . . . . . . . . . . . . . . . . . . . . . . . . . . . . . . . . . . . 7-16
Mapping Save/Recall Menu . . . . . . . . . . . . . . . . . . . . . . . . . . . . . . . . 7-17
Measurement Setup Menu . . . . . . . . . . . . . . . . . . . . . . . . . . . . . . . . . 7-18
Point Distance/Time Setup Menu . . . . . . . . . . . . . . . . . . . . . . . . . . . 7-19
Chapter 8—AM/FM/PM Analyzer (Option 509)
8-1 Introduction . . . . . . . . . . . . . . . . . . . . . . . . . . . . . . . . . . . . . . . . . . . . . . . . 8-1
Main Menu Keys in AM/FM/PM Analyzer mode: . . . . . . . . . . . . . . . . . 8-1
Contents-6 PN: 10580-00231 Rev. F Spectrum Analyzer MG
Table of Contents (Continued)
8-2 General Measurement Setup . . . . . . . . . . . . . . . . . . . . . . . . . . . . . . . . . . . 8-2
8-3 Example FM Demodulation Measurement . . . . . . . . . . . . . . . . . . . . . . . . . 8-4
8-4 AM/FM/PM Analyzer Menus . . . . . . . . . . . . . . . . . . . . . . . . . . . . . . . . . . 8-5
Map of Main Menus . . . . . . . . . . . . . . . . . . . . . . . . . . . . . . . . . . . . . . . 8-5
Map of Frequency Menus . . . . . . . . . . . . . . . . . . . . . . . . . . . . . . . . . . . 8-6
Map of Measurements Menus . . . . . . . . . . . . . . . . . . . . . . . . . . . . . . . 8-7
Map of Audio Demod Menus . . . . . . . . . . . . . . . . . . . . . . . . . . . . . . . . 8-8
8-5 RF Freq (Frequency) Menu . . . . . . . . . . . . . . . . . . . . . . . . . . . . . . . . . . . 8-9
8-6 RF Span Menu . . . . . . . . . . . . . . . . . . . . . . . . . . . . . . . . . . . . . . . . . . . . 8-10
8-7 (Signal) Standard List Menu . . . . . . . . . . . . . . . . . . . . . . . . . . . . . . . . . . 8-11
8-8 Amplitude Menu . . . . . . . . . . . . . . . . . . . . . . . . . . . . . . . . . . . . . . . . . . . 8-12
8-9 Setup Menu . . . . . . . . . . . . . . . . . . . . . . . . . . . . . . . . . . . . . . . . . . . . . . 8-13
8-10 Measurements Menu . . . . . . . . . . . . . . . . . . . . . . . . . . . . . . . . . . . . . . . 8-14
8-11 RF Spectrum Menu . . . . . . . . . . . . . . . . . . . . . . . . . . . . . . . . . . . . . . . . . 8-15
8-12 Audio Spectrum AM Menu . . . . . . . . . . . . . . . . . . . . . . . . . . . . . . . . . . . 8-16
8-13 Audio Waveform AM Menu . . . . . . . . . . . . . . . . . . . . . . . . . . . . . . . . . . . 8-17
8-14 Audio Spectrum FM Menu . . . . . . . . . . . . . . . . . . . . . . . . . . . . . . . . . . . 8-18
8-15 Audio Waveform FM Menu . . . . . . . . . . . . . . . . . . . . . . . . . . . . . . . . . . . 8-19
8-16 Audio Spectrum PM Menu . . . . . . . . . . . . . . . . . . . . . . . . . . . . . . . . . . . 8-20
8-17 Audio Waveform PM Menu . . . . . . . . . . . . . . . . . . . . . . . . . . . . . . . . . . . 8-21
8-18 Audio Demod AM Menu . . . . . . . . . . . . . . . . . . . . . . . . . . . . . . . . . . . . . 8-22
8-19 Audio Demod FM Menu . . . . . . . . . . . . . . . . . . . . . . . . . . . . . . . . . . . . . 8-23
8-20 Marker Menu . . . . . . . . . . . . . . . . . . . . . . . . . . . . . . . . . . . . . . . . . . . . . . 8-24
Appendix A—Error Messages
A-1 Introduction . . . . . . . . . . . . . . . . . . . . . . . . . . . . . . . . . . . . . . . . . . . . . . . . .A-1
A-2 Interference Analyzer Error Messages . . . . . . . . . . . . . . . . . . . . . . . . . . . .A-1
A-3 Channel Scanner Error Messages . . . . . . . . . . . . . . . . . . . . . . . . . . . . . . .A-2
Index
Spectrum Analyzer MG PN: 10580-00231 Rev. F 1-1
Chapter 1 — General Information
1-1 IntroductionThis Measurement Guide documents spectrum analysis, CW generation, interference analysis, channel scanner function, Zero-Span IF Output, Gated Sweep, Coverage Mapping, and AM/FM/PM analysis for Anritsu handheld instruments:
1-2 Contacting Anritsu To contact Anritsu, please visit:
http://www.anritsu.com/contact.asp
From here, you can select the latest sales, select service and support contact information in your country or region, provide online feedback, complete a “Talk to Anritsu” form to have your questions answered, or obtain other services offered by Anritsu.
Updated product information can be found on the Anritsu web site:
http://www.anritsu.com/
Search for the product model number. The latest documentation is on the product page under the Library tab.
1-3 Anritsu Service Centers For the latest service and sales information in your area, please visit the following URL:
http://www.anritsu.com/Contact.asp
and choose a country for regional contact information.
NoteNot all instrument models offer every option. Please refer to the Technical Data Sheet of your instrument for available options.
1-5 Connector Care General Information
1-2 PN: 10580-00231 Rev. F Spectrum Analyzer MG
1-4 Selecting a Measurement Mode Press Shift and then the Mode (9) button to open the Mode Selector dialog box. Highlight the desired measurement mode and press Enter. Some Anritsu handheld instruments have a Menu button, which also displays icons of installed measurement modes. Refer to your instrument User Guide for additional information.
1-5 Connector Care The connectors on your instrument are described in the User Guide.
Visually inspect connectors for general wear, for cleanliness, and for damage such as bent pins or connector rings. Repair or replace damaged connectors immediately. Dirty connectors can limit the accuracy of your measurements. Damaged connectors can damage the instrument. Connection of cables carrying an electrostatic potential, excess power, or excess voltage can damage the connector or the instrument or both. Connection of cables with inadequate torque settings can affect measurement accuracy. Over torquing connectors can damage the cable, the connector, the instrument, or all of these items.
Connecting Procedure
1. Carefully align the connectors.
The male connector center pin must slip concentrically into the contact fingers of the female connector.
2. Push connectors straight together. Do not twist or screw them together.
3. To tighten, turn the connector nut, not the connector body. Major damage can occur to the center conductor and to the outer conductor if the connector body is twisted.
4. If you use a torque wrench, then initially tighten by hand so that approximately 1/8 turn or 45 degrees of rotation remains for the final tightening with the torque wrench.
Relieve any side pressure on the connection (such as from long or heavy cables) in order to assure consistent torque. Use an open-end wrench to keep the connector body from turning while tightening with the torque wrench.
Do not over torque the connector.
Disconnecting Procedure
1. If a wrench is needed, then use an open-end wrench to keep the connector body from turning while loosening with a second wrench.
2. Complete the disconnection by hand, turning only the connector nut.
3. Pull the connectors straight apart without twisting or bending.
General Information 1-5 Connector Care
Spectrum Analyzer MG PN: 10580-00231 Rev. F 1-3
Connectors
The following torque specifications may apply to the connectors on your instrument. To prevent damage to your instrument, do not use pliers or a plain wrench to tighten the Type-N connector. Do not overtighten the connector.
Type-N
The recommended torque is 12 lbf·in to 15 lbf·in (1.36 N·m to 1.70 N·m).
Type-K
The recommended torque is 8 lbf·in (0.9 N·m or 90 N·cm).
Type SMA
The recommended torque is 8 lbf·in (0.9 N·m or 90 N·cm).

1-5 Connector Care General Information
1-4 PN: 10580-00231 Rev. F Spectrum Analyzer MG
Spectrum Analyzer MG PN: 10580-00231 Rev. F 2-1
Chapter 2 — Spectrum Analyzer
2-1 Introduction Spectrum analyzer measurements include the use of additional functions beyond frequency, span, amplitude, and marker functions. Section 2-2 and Section 2-3 explain setup procedures and settings for making spectrum analyzer measurements. Section 2-4 through Section 2-8 focus on resolution bandwidth, video bandwidth, sweep, and attenuator functions. Section 2-9 through Section 2-18 cover field measurements including brief examples demonstrating field strength, occupied bandwidth, channel power, adjacent channel power ratio, and carrier to interference ratio (C/I) tests. Finally, Section 2-21 though Section 2-34 detail the submenus available in Spectrum Analyzer mode.
2-2 General Measurement Setups Please refer to your instrument User Guide for setting up frequency, span, amplitude, GPS, limit lines, markers, and file management.
In most cases, information and parameters can be entered through the keypad, the directional arrows, or the rotary knob. The numerical keypad enters the information directly. The Up and Down arrow keys change a frequency parameter by the value entered through the Freq Step submenu key (default value is 1 MHz). The Left and Right arrow keys change the frequency parameter by one graticule, that is, one-tenth of the total span. The rotary knob changes the frequency parameter by one pixel per step. The screen has 551 pixels across its width. Choose whichever method is most convenient to enter the required information.
2-3 Making Spectrum Analyzer Measurements Spectrum Analyzer
2-2 PN: 10580-00231 Rev. F Spectrum Analyzer MG
2-3 Making Spectrum Analyzer Measurements
Required Equipment
• Optionally, an antenna that is appropriate for the frequency range to be measured
Required Setup
• Place the instrument in Spectrum Analyzer mode.
• Connect the input signal or antenna to the RF In test port.
Setting Bandwidth Parameters
Both resolution bandwidth (RBW) and video bandwidth (VBW) can be coupled to the frequency span automatically or manually set. When set to Auto RBW, RBW adjusts automatically in proportion to the frequency span. The default ratio of the span width to the resolution bandwidth is 300:1, and can be changed as follows:
1. Press the BW main menu key.
2. Press the Span/RBW submenu key. The current Span/RBW ratio is shown as part of the submenu key label. Change the value using the keypad, the directional arrows, or the rotary knob and then press Enter.
When auto-coupling between the span and RBW is selected (for example, the Auto RBW submenu key is toggled to “On”), this is indicated on the left side of the display with the RBW label and underneath it one to three digits followed by the frequency units. This represents the resolution bandwidth value. If manual RBW is selected (for example, the Auto RBW submenu key is toggled “Off”), the label and value turn red and a ‘#’ symbol is shown in front of the RBW label. Adjust resolution bandwidth independently of the span. If an unavailable resolution bandwidth is entered, then the instrument selects the next higher resolution bandwidth. If a value greater than the widest RBW is entered, then the widest RBW will be selected.
VBW can be set two ways – manually or by auto coupling. Auto coupling of the VBW links the video bandwidth to the resolution bandwidth, so that VBW varies in proportion to RBW. Auto coupling is indicated on the left side of the display with the VBW label and underneath it one to three digits and the frequency units; this represents the video bandwidth value. If manual VBW coupling is selected, the label and value turn red and the “#” symbol is shown in front of VBW on the left side of the display. Adjust video bandwidth independently of the RBW. If a non-existent video bandwidth is entered, then the instrument will select the next higher video bandwidth. If a value greater than the widest VBW is entered, then the widest VBW will be selected.
The ratio of the resolution bandwidth to the video bandwidth can be changed by pressing the BW main menu key, the RBW/VBW submenu key, and then using the keypad, the directional arrows, or the rotary knob to set the ratio. By default, the RBW/VBW ratio is set to 3. The current value of the ratio is shown as part of the submenu key label.
1. Press the BW main menu key.
2. Press the RBW/VBW submenu key. The current RBW/VBW ratio is shown as part of the submenu key label. Enter the desired value.
Spectrum Analyzer 2-3 Making Spectrum Analyzer Measurements
Spectrum Analyzer MG PN: 10580-00231 Rev. F 2-3
Setting Sweep Parameters
To set the sweep parameters, press the Shift key and then the Sweep (3) key.
Single/Continuous
When this submenu key is pressed the instrument toggles between single sweep and continuous sweep. In single sweep mode, after the sweep the instrument waits in Hold mode until the Manual Trigger submenu key is pressed or another triggering mode is selected.
Sweep Mode
Several sweep modes are available on the instrument. Press the Sweep Mode submenu keys to select between Fast (default), Performance or No FFT. The Show Help submenu key displays a table detailing the trade-off between sweep speed and performance of the sweep mode options.
Detection
Several detection methods tailor the performance of the instrument to meet specific measurement requirements. In general, there are more measurement points across the screen than display points. The various detection methods are different ways of dealing with how measurement point data is shown at each display point.
Peak: This method causes the largest measurement point to be shown for each display point, and assures that a narrow peak is not missed.
RMS: This method performs a root-mean-square calculation of all the measurement points in each display point, and is particularly useful in displaying the average value of noise.
Negative: This method causes the smallest measurement point to be shown for each display point. Typically this mode is used to help detect small discrete signals in the presence of nearly equal values of noise. The display points that contain only noise will tend to show lower amplitudes than those that contain discrete signals.
Sample: This is the fastest detection method because for each display point, only one frequency point is measured. Use this method when speed is of paramount importance and the possibility of missing a narrow peak is not important.
Quasi-peak: When this selection is made resolution bandwidths and video bandwidths of 200 Hz, 9 kHz, and 120 kHz are available. This detection method is designed to meet CISPR requirements.
Trigger Type
To select a specific type of triggering in zero span, press the Trigger Type submenu key. Selections are:
Free Run: The default trigger type is “Free Run”, in which the instrument begins another sweep as soon as one is finished.
NoteFast is the default sweep mode for instruments that have received the New Instrument calibration from Anritsu.
2-3 Making Spectrum Analyzer Measurements Spectrum Analyzer
2-4 PN: 10580-00231 Rev. F Spectrum Analyzer MG
External: A TTL signal applied to the External Trigger BNC input connector causes a single sweep to occur. This mode is used in zero span, and triggering occurs on the rising edge of the signal. After the sweep is complete, the resultant trace is displayed until the next trigger signal arrives.
Video: This mode is used in zero span to set the power level at which a sweep is initiated. The power level can be set from –130 dBm to +30 dBm. Trigger is based on the measured signal level. The sweep triggers when the signal level crosses the trigger level with a positive slope. If no signal crosses the trigger level, the last trace on the screen, before video triggering was selected, will be displayed. To change the video triggering level use the rotary knob, enter the desired amplitude with the keypad, or use the Left/Right arrows to change the setting by 1 dB or the Up/Down arrows to change the setting by 10 dB.
Change Trigger Position: This submenu key is used in conjunction with video triggering to set the horizontal position on the display where a signal that meets the video triggering criterion will be placed. The value can be from 0 % to 100 %. Zero percent places the triggering event at the left edge of the screen while 100 % places the triggering at the right edge of the screen. When the trigger position is any value other than 0 %, the portion of the trace before the trigger event is displayed very quickly because the trace data is stored in memory. The portion of the trace after the trigger point is painted on the screen at the normal rate as the signal is swept.
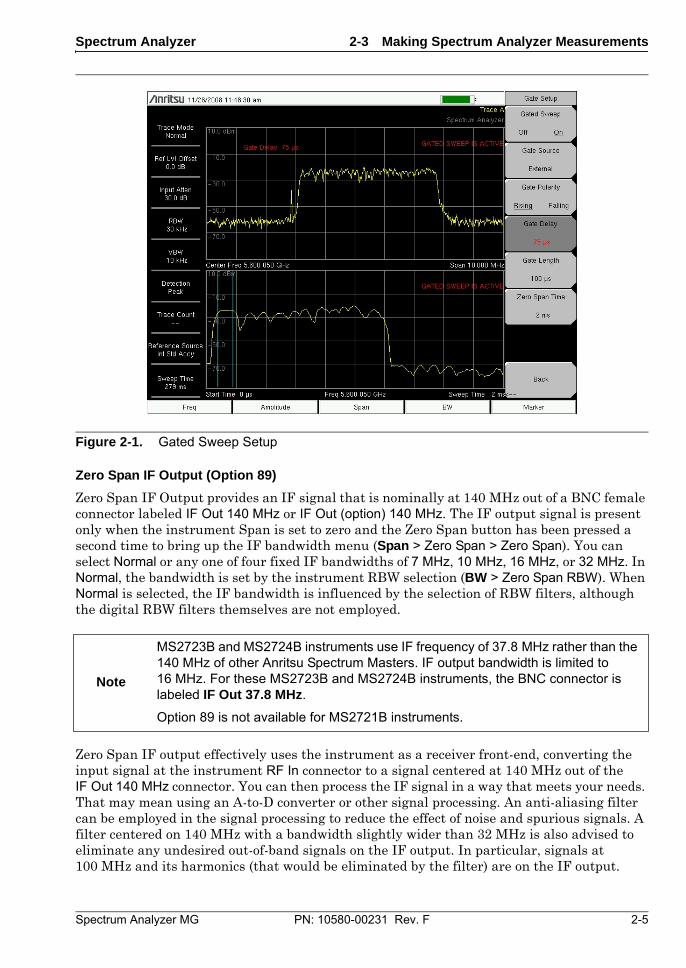
Gated Sweep Setup (Option 90 Only): The Gated Sweep function allows you to view a signal in time and frequency domain. Pressing the Gated Sweep Setup splits the screen into two graphic displays, frequency domain (top) and time domain (bottom). In addition, the Gate Setup menu is listed for setting up the parameters for Gated Sweep: gate polarity, gate delay, gate length, and zero span time. In reference to the time domain display, zero time span is the time set for the full horizontal length of the screen, the gate delay sets the left vertical blue line or start of the gate sweep, and the gate length sets the right vertical blue line or end of the gate sweep. The gated sweep signal is displayed in frequency domain on the top graphic display.
NoteScreen captured images are provided as examples. The image and measurement details shown on your instrument may differ from the examples in this user guide.
Spectrum Analyzer 2-3 Making Spectrum Analyzer Measurements
Spectrum Analyzer MG PN: 10580-00231 Rev. F 2-5
Zero Span IF Output (Option 89)
Zero Span IF Output provides an IF signal that is nominally at 140 MHz out of a BNC female connector labeled IF Out 140 MHz or IF Out (option) 140 MHz. The IF output signal is present only when the instrument Span is set to zero and the Zero Span button has been pressed a second time to bring up the IF bandwidth menu (Span > Zero Span > Zero Span). You can select Normal or any one of four fixed IF bandwidths of 7 MHz, 10 MHz, 16 MHz, or 32 MHz. In Normal, the bandwidth is set by the instrument RBW selection (BW > Zero Span RBW). When Normal is selected, the IF bandwidth is influenced by the selection of RBW filters, although the digital RBW filters themselves are not employed.
Zero Span IF output effectively uses the instrument as a receiver front-end, converting the input signal at the instrument RF In connector to a signal centered at 140 MHz out of the IF Out 140 MHz connector. You can then process the IF signal in a way that meets your needs. That may mean using an A-to-D converter or other signal processing. An anti-aliasing filter can be employed in the signal processing to reduce the effect of noise and spurious signals. A filter centered on 140 MHz with a bandwidth slightly wider than 32 MHz is also advised to eliminate any undesired out-of-band signals on the IF output. In particular, signals at 100 MHz and its harmonics (that would be eliminated by the filter) are on the IF output.
Figure 2-1. Gated Sweep Setup
Note
MS2723B and MS2724B instruments use IF frequency of 37.8 MHz rather than the 140 MHz of other Anritsu Spectrum Masters. IF output bandwidth is limited to 16 MHz. For these MS2723B and MS2724B instruments, the BNC connector is labeled IF Out 37.8 MHz.
Option 89 is not available for MS2721B instruments.
2-3 Making Spectrum Analyzer Measurements Spectrum Analyzer
2-6 PN: 10580-00231 Rev. F Spectrum Analyzer MG
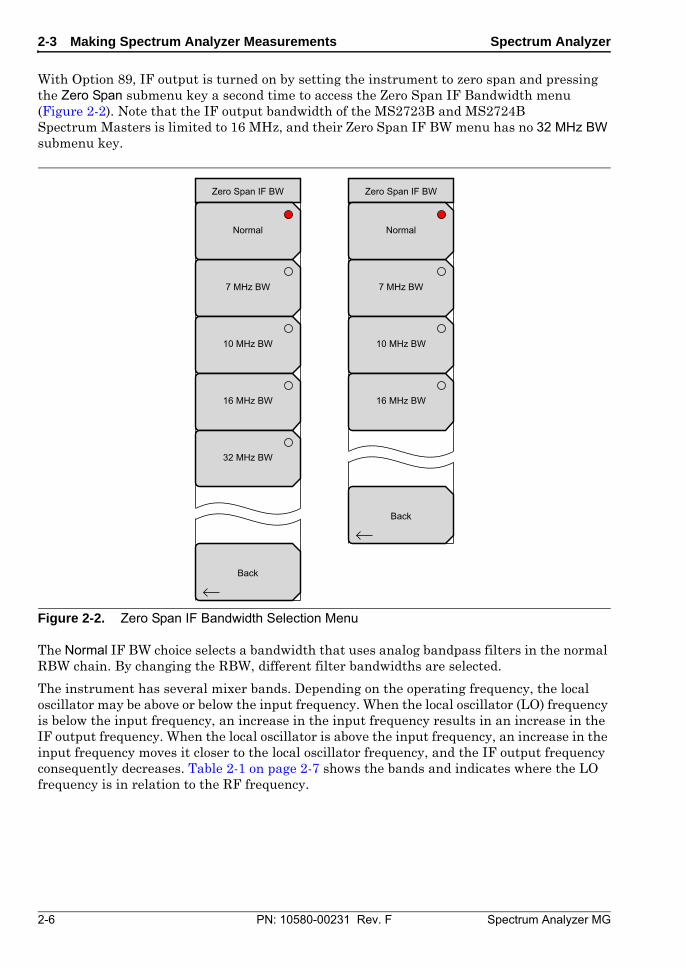
With Option 89, IF output is turned on by setting the instrument to zero span and pressing the Zero Span submenu key a second time to access the Zero Span IF Bandwidth menu (Figure 2-2). Note that the IF output bandwidth of the MS2723B and MS2724B Spectrum Masters is limited to 16 MHz, and their Zero Span IF BW menu has no 32 MHz BW submenu key.
The Normal IF BW choice selects a bandwidth that uses analog bandpass filters in the normal RBW chain. By changing the RBW, different filter bandwidths are selected.
The instrument has several mixer bands. Depending on the operating frequency, the local oscillator may be above or below the input frequency. When the local oscillator (LO) frequency is below the input frequency, an increase in the input frequency results in an increase in the IF output frequency. When the local oscillator is above the input frequency, an increase in the input frequency moves it closer to the local oscillator frequency, and the IF output frequency consequently decreases. Table 2-1 on page 2-7 shows the bands and indicates where the LO frequency is in relation to the RF frequency.
Figure 2-2. Zero Span IF Bandwidth Selection Menu
Zero Span IF BW
Back
7 MHz BW
10 MHz BW
16 MHz BW
32 MHz BW
Normal
Zero Span IF BW
Back
7 MHz BW
10 MHz BW
16 MHz BW
Normal
Spectrum Analyzer 2-3 Making Spectrum Analyzer Measurements
Spectrum Analyzer MG PN: 10580-00231 Rev. F 2-7
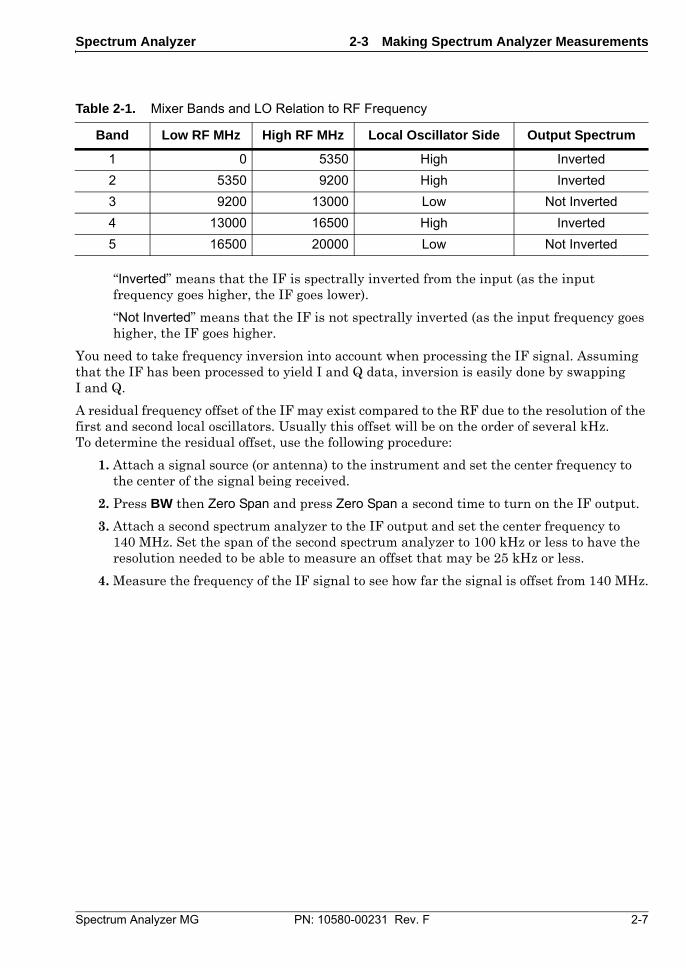
“Inverted” means that the IF is spectrally inverted from the input (as the input frequency goes higher, the IF goes lower).
“Not Inverted” means that the IF is not spectrally inverted (as the input frequency goes higher, the IF goes higher.
You need to take frequency inversion into account when processing the IF signal. Assuming that the IF has been processed to yield I and Q data, inversion is easily done by swapping I and Q.
A residual frequency offset of the IF may exist compared to the RF due to the resolution of the first and second local oscillators. Usually this offset will be on the order of several kHz. To determine the residual offset, use the following procedure:
1. Attach a signal source (or antenna) to the instrument and set the center frequency to the center of the signal being received.
2. Press BW then Zero Span and press Zero Span a second time to turn on the IF output.
3. Attach a second spectrum analyzer to the IF output and set the center frequency to 140 MHz. Set the span of the second spectrum analyzer to 100 kHz or less to have the resolution needed to be able to measure an offset that may be 25 kHz or less.
4. Measure the frequency of the IF signal to see how far the signal is offset from 140 MHz.
Table 2-1. Mixer Bands and LO Relation to RF Frequency
Band Low RF MHz High RF MHz Local Oscillator Side Output Spectrum
1 0 5350 High Inverted
2 5350 9200 High Inverted
3 9200 13000 Low Not Inverted
4 13000 16500 High Inverted
5 16500 20000 Low Not Inverted
2-4 Resolution Bandwidth Spectrum Analyzer
2-8 PN: 10580-00231 Rev. F Spectrum Analyzer MG
2-4 Resolution Bandwidth Resolution Bandwidth (RBW) determines frequency selectivity. The spectrum analyzer traces the shape of the RBW filter as it tunes past a signal. The choice of resolution bandwidth depends on several factors. Filters take time to settle. The output of the filter will take some time to settle to the correct value, so that it can be measured. The narrower the filter bandwidth (resolution bandwidth) the longer the settling time needs to be, and therefore, the slower the sweep speed.
The choice of resolution bandwidth will depend upon the signal being measured. If two closely-spaced signals are to be measured individually, then a narrow bandwidth is required. If a wider bandwidth is used, then the energy of both signals will be included in the measurement. Thus, the wider bandwidth does not have the ability to look at frequencies selectively, but instead simultaneously measures all signals falling within the resolution bandwidth. Therefore, a broadband measurement would include all signals and noise within the measurement bandwidth into a single measurement.
On the other hand, a narrow-band measurement will separate the frequency components, resulting in a measurement that includes separate peaks for each signal. There are advantages to each. The ultimate decision will depend upon the type of measurement required.
There is always some amount of noise present in a measurement. Noise is often broadband in nature; that is, it exists at a broad range of frequencies. If the noise is included in the measurement, the measured value could be in error (too large) depending upon the noise level. With a wide bandwidth, more noise is included in the measurement. With a narrow bandwidth, less noise enters the resolution bandwidth filter, and the measurement is more accurate. If the resolution bandwidth is narrower, the noise floor will drop on the spectrum analyzer display. As the measured noise level drops, smaller signals that were previously obscured by the noise can now be measured.
2-5 Video Bandwidth Spectrum analyzers typically use another type of filtering after the detector called video filtering. This filter also affects the noise on the display but in a different manner than the resolution bandwidth. In video filtering, the average level of the noise remains the same, but the variation in the noise is reduced. Hence, the effect of video filtering is a “smoothing” of the signal noise. The resultant effect on the analyzer’s display is that the noise floor compresses into a thinner trace, while the position of the trace remains the same.
Changing the video bandwidth (VBW) does not improve sensitivity, but it does improve discernability and repeatability when making low-level measurements. As a general rule of thumb, most field spectrum analyzer measurements are made at a video bandwidth that is a factor of 10 to 100 less than the resolution bandwidth. This ratio can be specified in the BW main menu. Using this ratio, with a resolution bandwidth of 30 kHz, typically, the video bandwidth is set between 300 Hz to 3 kHz, although it can be set anywhere from 1 Hz to 3 MHz.
Spectrum Analyzer 2-6 Sweep Limitations
Spectrum Analyzer MG PN: 10580-00231 Rev. F 2-9
2-6 Sweep Limitations With some spectrum analyzers, the user has control over sweep time (the elapsed time of each sweep, sometimes called scan time). An analyzer cannot be swept arbitrarily fast while maintaining its specified accuracy, but will have a sweep rate limitation depending upon the resolution bandwidth, video bandwidth, and frequency range selected. The sweep rate is not usually chosen by the user but is determined by the frequency range swept divided by the sweep time. The limitation on sweep rate comes from the settling or response time of the resolution and video bandwidth filters. If an analyzer is swept too quickly, the filters do not have time to respond, and the measurement is inaccurate. Under such conditions, the analyzer display tends to have a “smeared” look to it, with the spectral lines being wider than normal and shifted to the right and at a lower amplitude than is correct.
Fortunately, the Anritsu products are designed to relieve the user from having to calculate the sweep speed or experiment to discover a sweep speed that yields accurate results. When changing the RBW and VBW, the sweep speed automatically changes to the fastest sweep speed that will yield accurate results. The sweep speed will be faster for a wide RBW or VBW and slower for a narrow RBW or VBW. The sweep speed can also be changed manually, by pressing the Sweep key and selecting the Min Sweep Time submenu key. Enter a sweep time from 10 µs to 600 seconds. If the minimum sweep time entered by the user is less than the value needed to assure accurate results, the value that delivers accurate results will be used. Regardless of the minimum sweep time setting, the instrument will never sweep faster than the RBW and VBW settings will allow. The instrument is designed to ensure that no uncalibrated measurement conditions will occur.
2-7 Attenuator Functions The Spectrum Analyzer includes a step attenuator at the RF input. This attenuator is used to reduce large signals to levels that make best use of the analyzer’s dynamic range. Normally, the input attenuation automatically adjusts as a function of Reference Level. In the Amplitude menu, the Attn Lvl submenu allows manual setting of the attenuator. In Auto Atten mode, as the reference level is increased, the attenuation is increased. In Manual mode, the input attenuation can be adjusted using the keypad, the Up/Down arrow keys, or the rotary knob.
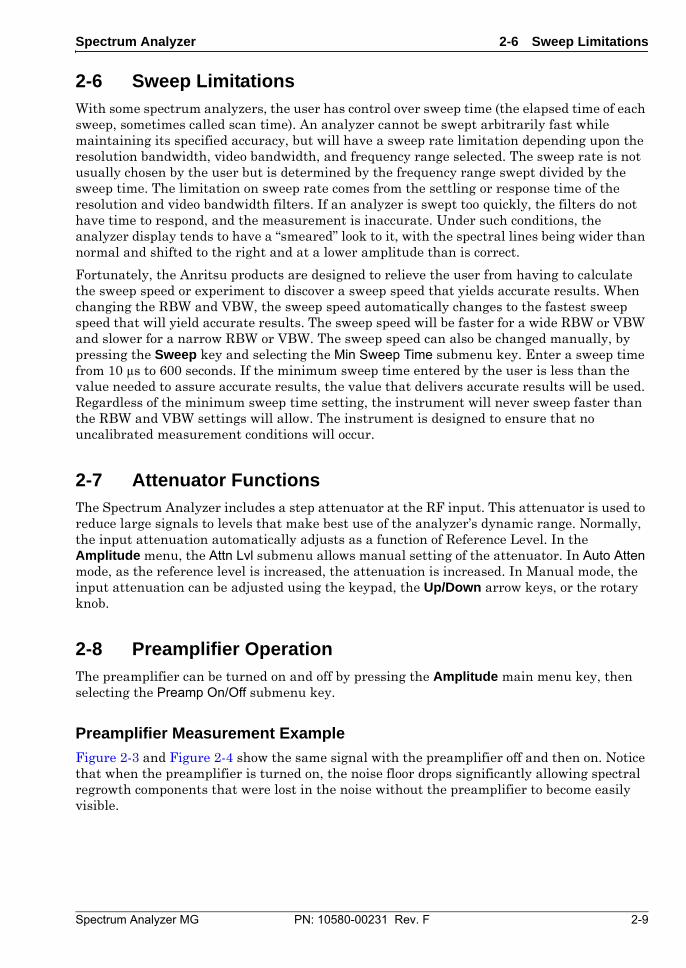
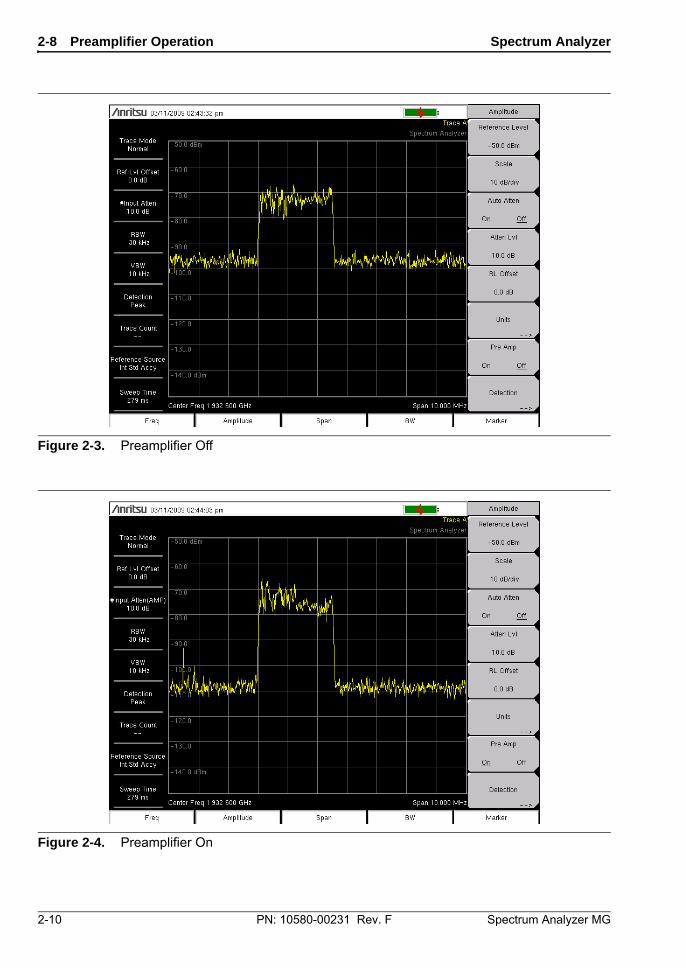
2-8 Preamplifier Operation The preamplifier can be turned on and off by pressing the Amplitude main menu key, then selecting the Preamp On/Off submenu key.
Preamplifier Measurement Example
Figure 2-3 and Figure 2-4 show the same signal with the preamplifier off and then on. Notice that when the preamplifier is turned on, the noise floor drops significantly allowing spectral regrowth components that were lost in the noise without the preamplifier to become easily visible.
2-8 Preamplifier Operation Spectrum Analyzer
2-10 PN: 10580-00231 Rev. F Spectrum Analyzer MG
Figure 2-3. Preamplifier Off
Figure 2-4. Preamplifier On
Spectrum Analyzer 2-9 Field Measurements
Spectrum Analyzer MG PN: 10580-00231 Rev. F 2-11
2-9 Field Measurements In Spectrum Analyzer mode, smart one-button measurements are built-in for field strength, occupied bandwidth, channel power, adjacent channel power ratio, and carrier to interference ratio (C/I) tests. In addition, AM/FM/SSB demodulation is available to aid in the identification of interfering signals. This section presents brief examples demonstrating the use of these measurements.
2-10 Field Strength
Required Equipment
Portable Antenna for which antenna factors or antenna gain and bandwidth data are available.
Procedure
1. Press the Shift key then the Measure key. Press the Field Strength submenu key followed by pressing the On Off submenu key so that On is underlined.
2. Press the Antenna submenu key and use the Up/Down arrow keys or the rotary knob to select the desired antenna. Press the Enter key to select.
3. Connect the antenna to the RF In port.
4. Press the Freq main menu key, press the Center Freq submenu key, and enter the center frequency.
5. Press the Span main menu key. Set the span wide enough to include the primary channel bandwidth and upper and lower channel bandwidths. At least a portion of the span has to include a frequency within the antenna’s specified range.
6. Press the BW main menu key and verify that RBW Auto and VBW Auto are On.
7. To change the units of measurement, press the Amplitude main menu key, then press the Units submenu key and press dBm/m2, dBV/m, dBmV/m, dBµV/m, Volt/m, Watt/m2, dBw/m2, A/m, dBA/m, or Watt/cm2. The instrument automatically adjusts the measurement by the antenna factors selected. Marker values will be displayed in the same units as selected for amplitude.
NoteSelect an antenna from the standard list available or use the Antenna Editor feature of Anritsu Master Software Tools to define a custom antenna and upload the antenna information to the antenna list.

2-10 Field Strength Spectrum Analyzer
2-12 PN: 10580-00231 Rev. F Spectrum Analyzer MG
Antenna Calculations
The following is a list of various antenna calculations should you find it necessary to convert from one parameter to another:
Conversion of signal levels from watts to volts in a 50 ohm system:
P = V2/R
where:
P = power in Watts V = voltage level in Volts R = resistance in ohms
Note that 1mW = 10–3 W and 1 µV = 10–6 V.
For power in dBm, and voltage in dB (µV):
VdB(µV) = P(dBm) + 107 dB
Power density to field strength:
An alternate measure of field strength is power density:
Pd = E2 / 120π
where:
E = field strength in V/m Pd = Power density in W/m2
Power density at a point:
Pd = PtGt / (4πr2)
This equation is only valid in the far field, where electric and magnetic fields are related by the characteristic impedance of free space:
where:
Pd = power density in W/m Pt = power transmitted in Watts Gr = gain of transmitting antenna r = distance from the antenna in meters
Spectrum Analyzer 2-11 Occupied Bandwidth Measurement
Spectrum Analyzer MG PN: 10580-00231 Rev. F 2-13
2-11 Occupied Bandwidth Measurement Occupied bandwidth (OBW) is a common measurement performed on radio transmitters. This measurement calculates the bandwidth containing the total integrated power occupied in a given signal bandwidth. There are two different methods of calculation depending upon the technique used to modulate the carrier.
• % Integrated Power Method: The occupied frequency bandwidth is calculated as the bandwidth containing the specified percentage of the transmitted power.
• > dBc Method: The occupied frequency bandwidth is defined as the bandwidth between the upper and lower frequency points at which the signal level is a desired number of dB below the peak carrier level.
Required Equipment
• Test Port Extension Cable, Anritsu part number 15NNF50-1.5C
• 30 dB, 50 Watt, bi-directional, DC –18 GHz, N(m) – N(f), Attenuator, Anritsu 42N50A-30 (required if the power level being measured is > +30 dBm)
Procedure
1. Using the test port extension cable and the 30 dB, 50 watt, bi-directional attenuator (if needed) connect the RF In port to the appropriate transmitter test port or signal source.
2. Press the Freq main menu key followed by the Center Freq submenu key and enter the center frequency using the keypad, the arrow keys, or the rotary knob. If entering a frequency using the keypad, the submenu key labels change to GHz, MHz, kHz, and Hz. Press the appropriate units key. Pressing the Enter key has the same affect as the MHz submenu key.
3. If an attenuator was connected in Step 1, then press the Amplitude main menu key and press the RL Offset submenu key and set the reference level offset to –30 dB to compensate for the loss in the attenuator.
4. Press the Amplitude main menu key then press the Reference Level submenu key to set the appropriate reference level.
5. Press the Atten Lvl submenu key to set the input attenuation level or leave Auto Atten set to On.
6. Press the BW main menu key to set the resolution bandwidth and video bandwidth if desired.
7. Press the Shift key then the Measure (4) key followed by the OCC BW submenu key. Choose the measurement method (% Int Pwr or > dBc) by pressing the Method submenu key. The selected method is underlined.
8. Press the dBc or % submenu keys to adjust the settings as needed. Common values are 99 % and 30 dBc.
9. Press the On/Off submenu key to start the measurement. An information box will appear below the graph while occupied bandwidth measurement is on.
2-12 Channel Power Measurement Spectrum Analyzer
2-14 PN: 10580-00231 Rev. F Spectrum Analyzer MG
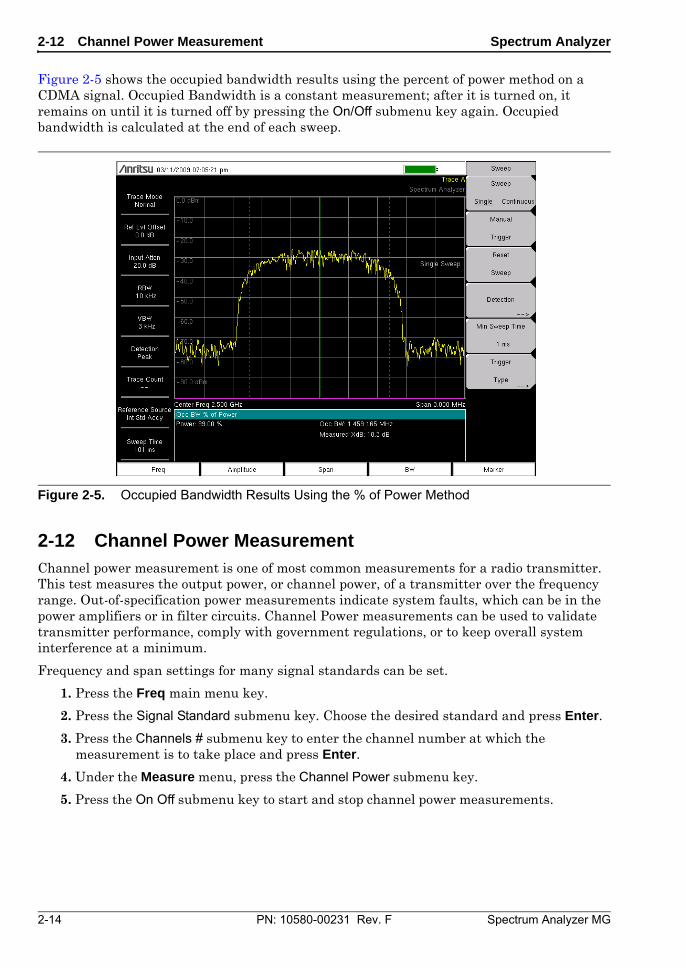
Figure 2-5 shows the occupied bandwidth results using the percent of power method on a CDMA signal. Occupied Bandwidth is a constant measurement; after it is turned on, it remains on until it is turned off by pressing the On/Off submenu key again. Occupied bandwidth is calculated at the end of each sweep.
2-12 Channel Power Measurement Channel power measurement is one of most common measurements for a radio transmitter. This test measures the output power, or channel power, of a transmitter over the frequency range. Out-of-specification power measurements indicate system faults, which can be in the power amplifiers or in filter circuits. Channel Power measurements can be used to validate transmitter performance, comply with government regulations, or to keep overall system interference at a minimum.
Frequency and span settings for many signal standards can be set.
1. Press the Freq main menu key.
2. Press the Signal Standard submenu key. Choose the desired standard and press Enter.
3. Press the Channels # submenu key to enter the channel number at which the measurement is to take place and press Enter.
4. Under the Measure menu, press the Channel Power submenu key.
5. Press the On Off submenu key to start and stop channel power measurements.
Figure 2-5. Occupied Bandwidth Results Using the % of Power Method
Spectrum Analyzer 2-12 Channel Power Measurement
Spectrum Analyzer MG PN: 10580-00231 Rev. F 2-15
Channel Power Measurement for GSM
Global Systems for Mobile (GSM) communication is a globally accepted standard for digital cellular communication. There are a number of frequency bands allocated to GSM mobile phones that use a combination of Frequency Division Multiple Access (FDMA) and Time Division Multiple Access (TDMA). Within each band are approximately one hundred available carrier frequencies on 200 kHz spacing (FDMA), and each carrier is broken up into time-slots so as to support eight separate conversations (TDMA). GSM uses the Gaussian Minimum Shift Keying (GMSK) modulation method.
Required Equipment
• Test Port extension cable, Anritsu 15NNF50-1.5C
Procedure
1. Using the test port extension cable, connect the signal source to the RF In test port.
2. Press the Amplitude main menu key and press the Reference Level submenu key to set the reference level to –20 dBm. Adjust the values given in this procedure to match your measurement conditions.
3. Press the Scale submenu key and set the scale to 10 dB/div.
4. Press the BW main menu key and verify that RBW Auto and VBW Auto are On.
5. Press the Freq main menu key followed by the Signal Standard submenu key. Scroll through the dialog box using the rotary knob or Up/Down arrow keys to highlight the GSM 900 - Downlink standard for the measurement and press Enter.
6. Press the Channel# submenu key and enter the channel number using the keypad, the arrow keys, or the rotary knob. For this example, select Channel 60.
7. Press the Shift key then the Measure (4) key and press the Channel Power submenu key.
8. Press the Center Freq submenu key and verify that the center frequency is set to that of the GSM signal, in this case 947.0 MHz.
9. Press the Int BW submenu key and enter 200 kHz for the integration bandwidth, or set the integration bandwidth appropriate for the particular application.
10. Press the Span submenu key and enter 600 kHz as the channel span, or set the channel span to a value appropriate for the particular application.
11. Make the measurement by pressing the Measure (4) key, press the Channel Power submenu key, then press On. The measurement results are displayed in the message area.
NoteChannel Power is a constant measurement. After it is turned on, it will remain on until it is turned off by pressing the On/Off submenu key again.
2-13 Adjacent Channel Power Measurement Spectrum Analyzer
2-16 PN: 10580-00231 Rev. F Spectrum Analyzer MG
2-13 Adjacent Channel Power Measurement Required Equipment
• 30 dB, 50 watt, Bi-Directional, DC–18 GHz, N(m)–N(f) Attenuator, Anritsu Part Number 42N50A-30 (if required for the power level being measured)
• Test Port extension cable, Anritsu Part Number 15NNF50-1.5C
Procedure
1. Using the test port extension cable and 30 dB attenuator, connect the signal source to the input of the attenuator, and connect the output of the attenuator to the RF In test port.
2. If an attenuator was connected in Step 1, press the RL Offset submenu key and set the reference level offset to –30 dB to compensate for the loss of the attenuator.
3. Press the Amplitude main menu key and press the Reference Level submenu key to set the reference level to 60 dBm.
4. Press the Atten Lvl submenu key to set the input attenuation level needed for the measurement. This value depends on the input power level and any external attenuator. Enter an attenuation level to achieve roughly –40 dBm at the input mixer.
5. Press the BW main menu key and verify that RBW Auto and VBW Auto are On.
6. There are two ways to set the measurement parameters. If the signal standard and channel are known, press the Freq main menu key and set the signal standard and press Channel submenu key for the signal to be measured, then skip to Step 12. If the signal standard and channel are not known, follow the procedure in Step 7 through Step 11.
7. Press the Freq main menu key, press the Center Freq submenu key, and enter the desired center frequency.
8. Press the Shift key then the Measure (4) key and press the ACPR submenu key.
9. Press the Main Ch BW submenu key, and enter the main channel bandwidth.
10. Press the Adj Ch BW submenu key, and enter the adjacent channel bandwidth.
11. Press the Ch Spacing submenu key, and enter the channel spacing.
12. Make the measurement by pressing the On/Off submenu key. The detection method is automatically changed to RMS Average.
Solid vertical lines are drawn on the display to indicate the main channel. Dashed vertical lines define the adjacent channels. The SPA will display the measurement results in the message area.
NoteAdjacent Channel Power Ratio is a constant measurement. After it is turned on, it will remain on until it is turned off by pressing the On/Off submenu key again.
Spectrum Analyzer 2-14 Out-of-Band Spurious Emission Measurement
Spectrum Analyzer MG PN: 10580-00231 Rev. F 2-17
2-14 Out-of-Band Spurious Emission Measurement Required Equipment
• Test Port extension cable, Anritsu 15NNF50-1.5C
Procedure
1. Using the test port extension cable, connect the signal source to the RF In test port.
2. Press the Freq main menu key, press the Center Freq submenu key, and enter the center frequency.
3. Press the Span main menu key. Set the span wide enough to include the primary channel bandwidth and upper and lower channel bandwidths.
4. Press the Amplitude main menu key, then press the Reference Level submenu key and set the reference level to –20 dBm.
5. Press the Auto Atten submenu key set the attenuation to On.
6. Press the BW main menu key, then use the RBW and VBW submenu keys to set the resolution bandwidth to 3 kHz and the video bandwidth to 300 Hz.
7. Press the Marker main menu key and press the Marker 123456 submenu key to select Marker 1. The underlined number indicates the active marker.
8. Press the On/Off submenu key to activate the marker. Use the arrow keys, the keypad and the knob to move the marker over one of the spurs. To use the corresponding delta marker, press the Delta submenu key so that On is underlined. Use the arrow keys or rotary knob to move the delta marker to the desired frequency and press Enter.
9. Compare the value of the marker to the specified allowable level of out-of-band spurious emissions for the corresponding channel transmit frequency.
2-15 In-band/Out-of-Channel Measurements Spectrum Analyzer
2-18 PN: 10580-00231 Rev. F Spectrum Analyzer MG
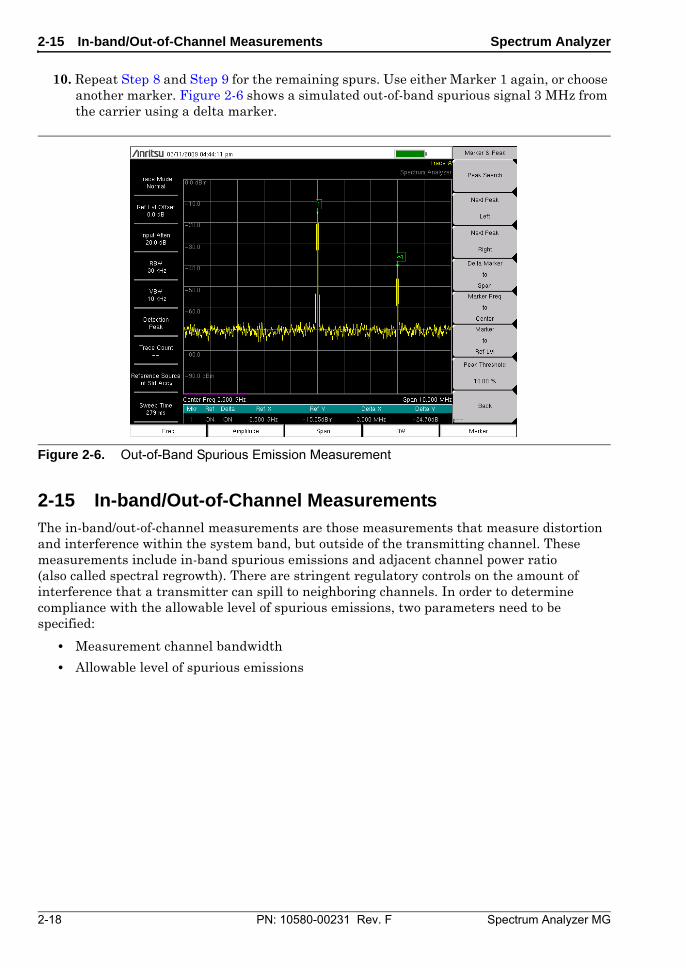
10. Repeat Step 8 and Step 9 for the remaining spurs. Use either Marker 1 again, or choose another marker. Figure 2-6 shows a simulated out-of-band spurious signal 3 MHz from the carrier using a delta marker.
2-15 In-band/Out-of-Channel Measurements The in-band/out-of-channel measurements are those measurements that measure distortion and interference within the system band, but outside of the transmitting channel. These measurements include in-band spurious emissions and adjacent channel power ratio (also called spectral regrowth). There are stringent regulatory controls on the amount of interference that a transmitter can spill to neighboring channels. In order to determine compliance with the allowable level of spurious emissions, two parameters need to be specified:
• Measurement channel bandwidth
• Allowable level of spurious emissions
Figure 2-6. Out-of-Band Spurious Emission Measurement
Spectrum Analyzer 2-16 In-band Spurious Measurement
Spectrum Analyzer MG PN: 10580-00231 Rev. F 2-19
2-16 In-band Spurious Measurement Required Equipment
• 30 dB, 50 watt, Bi-Directional, DC–18 GHz, N(m)–N(f), Attenuator, Anritsu 42N50A-30
• Test Port extension cable, Anritsu 15NNF50-1.5C
Procedure
1. Using the test port extension cable and 30 dB, 50 watt, (Bi-directional) attenuator, connect the RF In port to the appropriate transmit test port.
2. Press the Freq main menu key, press the Center Freq submenu key, and enter the center frequency.
3. Press the Span main menu key. Set the span wide enough to include the primary channel bandwidth and upper and lower channel bandwidths.
4. Press the Amplitude main menu key and then press the Reference Level submenu key to set the reference level to –20 dBm.
5. Press the RL Offset submenu key to set the reference level offset to –30 dB to compensate for the loss of the attenuator
6. Press the Auto Atten submenu key and set the attenuation to On.
7. Press the BW main menu key and use the RBW and VBW submenu keys to set the resolution bandwidth to 10 kHz and the video bandwidth to 300 Hz.
8. Press the Marker main menu key and press the Marker 123456 submenu key to select Marker 1. The underlined number indicates the active marker.
9. Press the On/Off submenu key and use the arrow keys, the keypad and the knob to move the marker over one of the spurs.
10. Compare the value of the marker to the specified allowable level of in-band/out-of-channel spurious emissions for the corresponding channel transmit frequency.
11. Repeat Step 9 and Step 10 for the remaining spurs. Use either Marker 1 again, or choose another marker.
2-17 AM/FM/SSB Demodulation Spectrum Analyzer
2-20 PN: 10580-00231 Rev. F Spectrum Analyzer MG
2-17 AM/FM/SSB Demodulation The built-in demodulator for AM, narrowband FM, wideband FM and single sideband (selectable USB and LSB) allows a technician to hear an interfering signal. The demodulated signal can be heard using either the built-in speaker, or through a monaural headset connected to the 2.5 mm jack on the connector panel.
Procedure
1. Press the Shift key followed by the Measure (4) key and the AM/FM Demod submenu key.
2. Press the Demod Type submenu key and select FM Wide Band, FM Narrow Band, AM, USB, or LSB to match the modulation format of the signal.
3. Press the Back submenu key.
4. Press the Demod Freq submenu key and use the keypad or rotary knob to enter the center frequency of the signal to be demodulated. For USB and LSB signals, fine tune the signal by adjusting the Beat Freq Osc. By default the BFO frequency is set to zero, meaning that the re-injected carrier is exactly at the demodulation frequency. The Beat Freq Osc submenu key allows adjustment of the beat frequency oscillator to fine tune the signal through a span of ±10000 Hz.
5. Press the On/Off submenu key to enable the measurement.
6. Press the Volume submenu key and use the Up/Down arrow keys or rotary knob to change the audio volume from 0 % to 100 %. For most headsets a volume of 40 % is adequate.
7. The Demod Time submenu key sets the time the unit will demodulate the signal. Enter a value from 100 ms to 500 seconds.
Spectrum Analyzer 2-18 Carrier to Interference Ratio Measurement
Spectrum Analyzer MG PN: 10580-00231 Rev. F 2-21
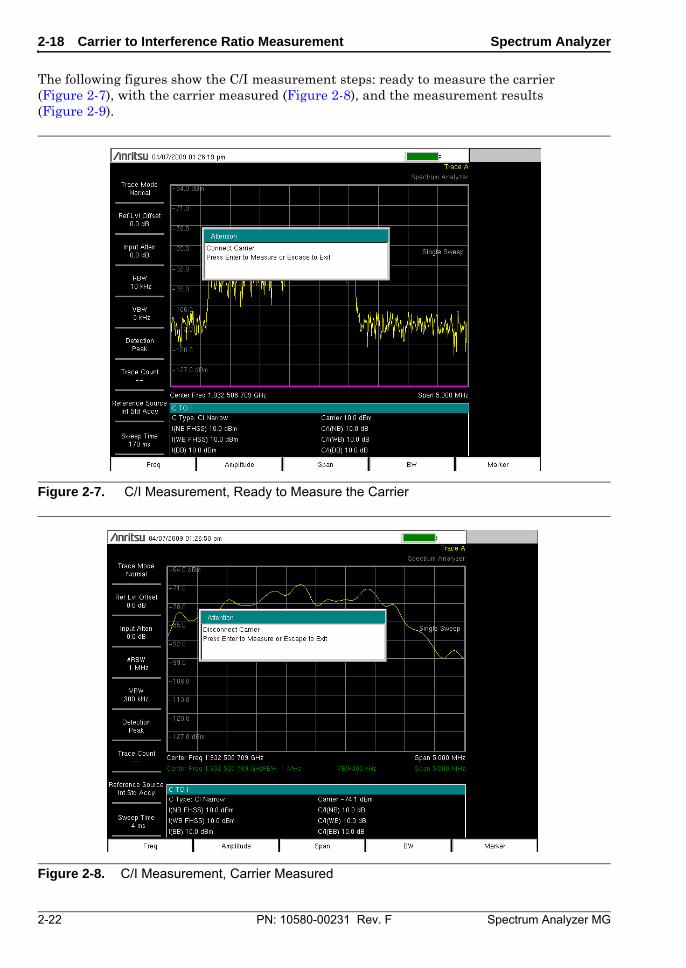
2-18 Carrier to Interference Ratio Measurement Carrier to Interference Ratio (C/I) Measurement is a two-step process, first measuring the carrier level and then, with the carrier turned off, measuring the remaining signals and noise in the band of interest. After the two measurements are complete, the ratio of the carrier level to the noise plus interference is displayed using three assumptions:
• The interferer is a narrowband frequency hopping signal (NB FHSS)
• The interferer is a wideband frequency hopping signal (WB FHSS)
• The interferer is a broadband signal (BB).
The primary application for this type of measurement is determining the magnitude of interference problems for 802.11b, 802.11g and 802.11a access points (hot spots).
Procedure
1. Press the Freq main menu key followed by the Signal Standard submenu key. Select the appropriate signal standard based on the signal to be measured and press Enter.
2. Press the Channel submenu key, select the operating channel of the access point being measured and press Enter.
3. Press the Shift key followed by the Measure (4) key and the C/I submenu key.
4. Press the Center Freq submenu key and enter the desired frequency, unless a Signal Standard and Channel have already been selected in the Frequency menu.
5. If needed, press the Span submenu key and set an appropriate span width for the signal to be measured.
6. If the signal environment includes slow frequency hopping signals, such as cordless telephones, press the Min Sweep Time submenu key to set a sweep time of one second or more to give a good chance of capturing instances of the interfering signal.
7. Press the On/Off submenu key and follow the on-screen prompts to complete the measurement.
8. After the measurement is complete, the measurement box gives results for the three different signal types. Some measurement results may show as Error, and this is to be expected.
NoteAccess to the transmitter is required to complete this procedure as the transmitted carrier must be turned off for the second portion of the measurement.
2-18 Carrier to Interference Ratio Measurement Spectrum Analyzer
2-22 PN: 10580-00231 Rev. F Spectrum Analyzer MG
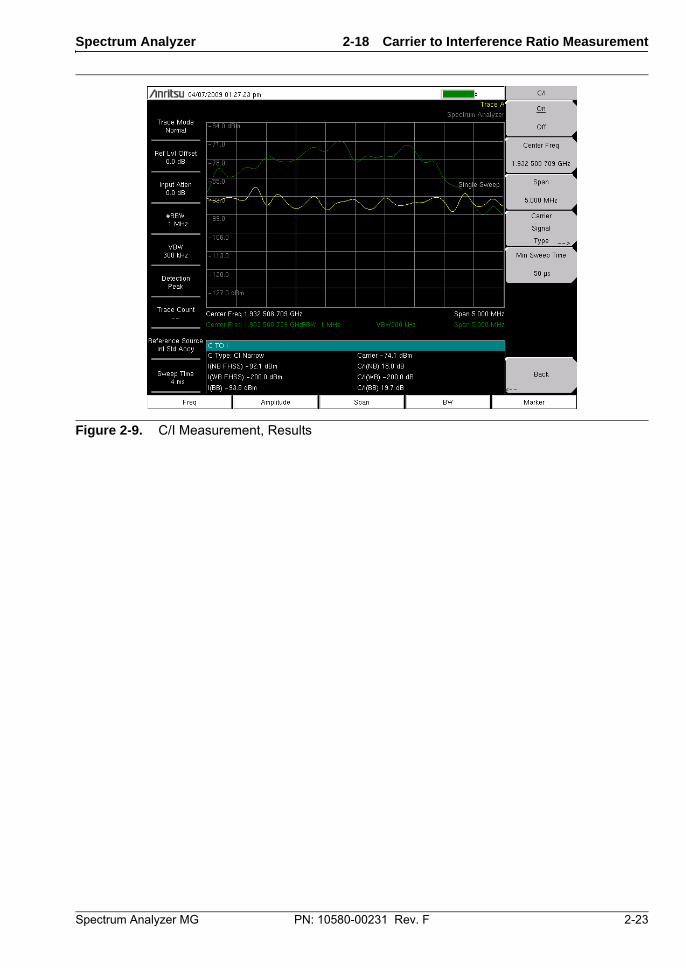
The following figures show the C/I measurement steps: ready to measure the carrier (Figure 2-7), with the carrier measured (Figure 2-8), and the measurement results (Figure 2-9).
Figure 2-7. C/I Measurement, Ready to Measure the Carrier
Figure 2-8. C/I Measurement, Carrier Measured
Spectrum Analyzer 2-18 Carrier to Interference Ratio Measurement
Spectrum Analyzer MG PN: 10580-00231 Rev. F 2-23
Figure 2-9. C/I Measurement, Results
2-19 Emission Mask Spectrum Analyzer
2-24 PN: 10580-00231 Rev. F Spectrum Analyzer MG
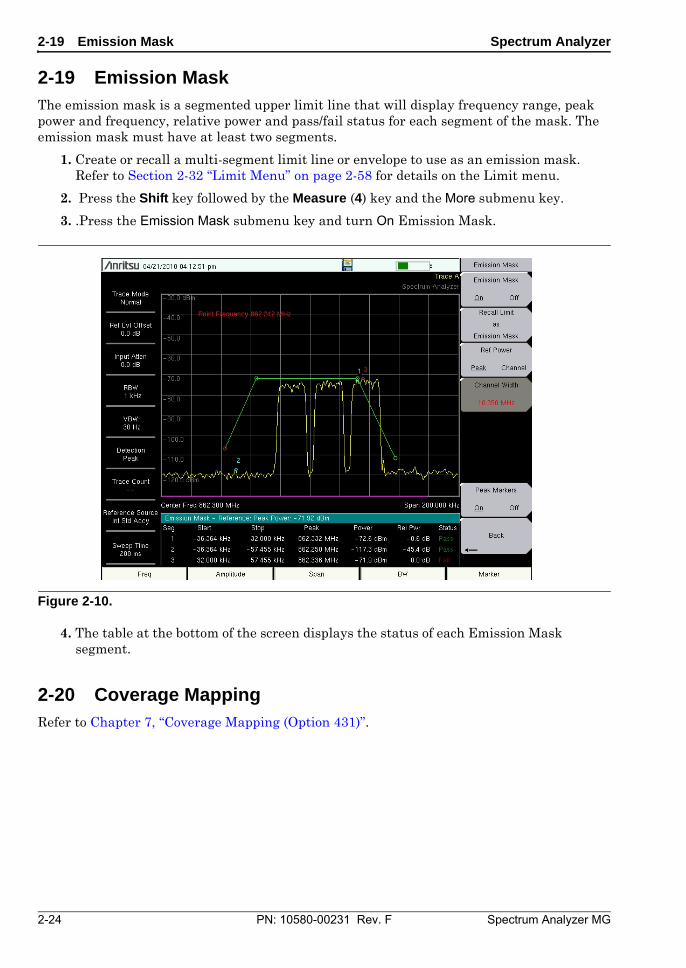
2-19 Emission Mask The emission mask is a segmented upper limit line that will display frequency range, peak power and frequency, relative power and pass/fail status for each segment of the mask. The emission mask must have at least two segments.
1. Create or recall a multi-segment limit line or envelope to use as an emission mask. Refer to Section 2-32 “Limit Menu” on page 2-58 for details on the Limit menu.
2. Press the Shift key followed by the Measure (4) key and the More submenu key.
3. .Press the Emission Mask submenu key and turn On Emission Mask.
4. The table at the bottom of the screen displays the status of each Emission Mask segment.
2-20 Coverage Mapping Refer to Chapter 7, “Coverage Mapping (Option 431)”.
Figure 2-10.
Spectrum Analyzer 2-21 Spectrum Analyzer Menus
Spectrum Analyzer MG PN: 10580-00231 Rev. F 2-25
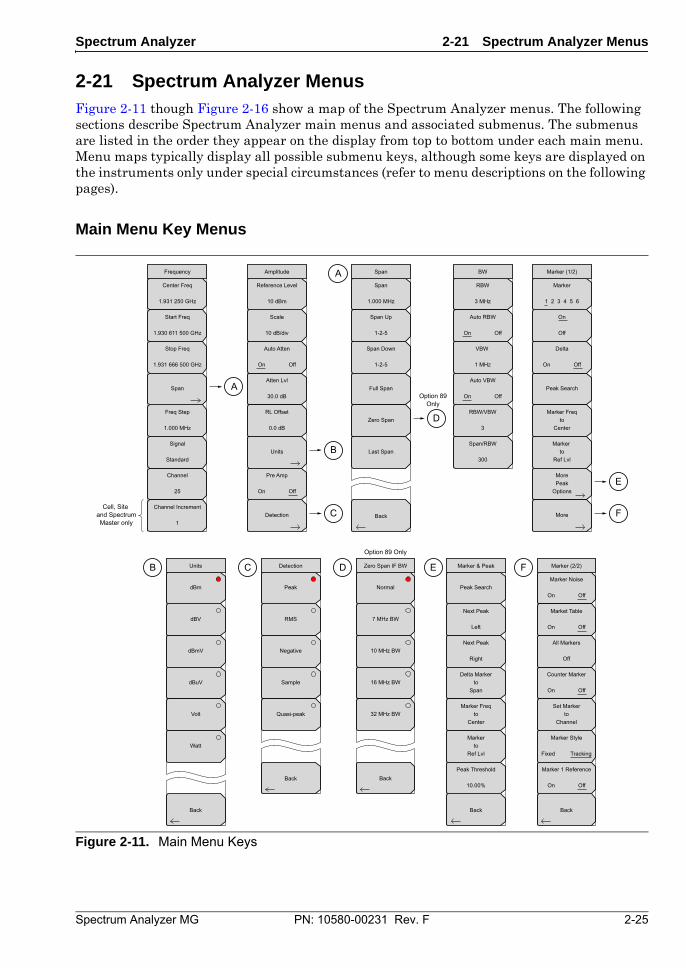
2-21 Spectrum Analyzer Menus Figure 2-11 though Figure 2-16 show a map of the Spectrum Analyzer menus. The following sections describe Spectrum Analyzer main menus and associated submenus. The submenus are listed in the order they appear on the display from top to bottom under each main menu. Menu maps typically display all possible submenu keys, although some keys are displayed on the instruments only under special circumstances (refer to menu descriptions on the following pages).
Main Menu Key Menus
Figure 2-11. Main Menu Keys
Amplitude
Units
Scale
10 dB/div
Atten Lvl
30.0 dB
RL Offset
0.0 dB
Reference Level
10 dBm
Frequency
Center Freq
1.931 250 GHz
Start Freq
1.930 611 500 GHz
Stop Freq
1.931 666 500 GHz
Freq Step
1.000 MHz
Channel
25
Signal
Standard
Channel Increment
1
Back
A
A
B
C
D
F
E
Units
Span
Detection
Auto Atten
On Off
Pre Amp
On Off
dBV
dBmV
dBuV
Volt
Watt
dBm
Detection
Back
RMS
Negative
Sample
Quasi-peak
Peak
CB
Marker (1/2)
Marker & Peak
On
Off
Peak Search
Marker Freqto
Center
Marker to
Ref Lvl
Marker
1 2 3 4 5 6
BW
RBW
3 MHz
VBW
1 MHz
RBW/VBW
3
Span/RBW
300
Back Back
MorePeak
Options
More
Delta
On Off
Marker (2/2)
Marker Noise
On Off
Market Table
On Off
Counter Marker
On Off
Marker Style
Fixed Tracking
Marker 1 Reference
On Off
Auto RBW
On Off
Auto VBW
On Off
Next Peak
Left
Next Peak
Right
Delta Markerto
Span
All Markers
Off
Set Markerto
Channel
Marker Freqto
Center
Markerto
Ref Lvl
Peak Threshold
10.00%
Peak Search
FE
Option 89 Only
D
Back
Span
Span
1.000 MHz
Span Up
1-2-5
Span Down
1-2-5
Full Span
Zero Span
Last Span
Option 89Only
Cell, Site and SpectrumMaster only
Zero Span IF BW
Back
7 MHz BW
10 MHz BW
16 MHz BW
32 MHz BW
Normal

2-21 Spectrum Analyzer Menus Spectrum Analyzer
2-26 PN: 10580-00231 Rev. F Spectrum Analyzer MG
Sweep Menus
Figure 2-12. Sweep Submenu Keys
Trigger
Sweep
Reset
Sweep
Min Sweep Time
50 ms
Back
Detection
Trigger
Type
Gated Sweep
Setup
Option 90 Only
Sweep
Single Continuous
External
Video
ChangeTriggerPosition
Manual
Trigger
Free
Run
Detection
Back
RMS
Negative
Sample
Quasi-peak
Peak
Sweep Mode
Back
Performance
No FFT
Show Help
Fast
Gated Sweep
On Off
Gate Polarity
Rising Falling
Gated Sweep
Back
Gate Source
External
Gate Delay
0 us
Gate Length
500 us
Zero Span Time
300 ms
Sweep Mode
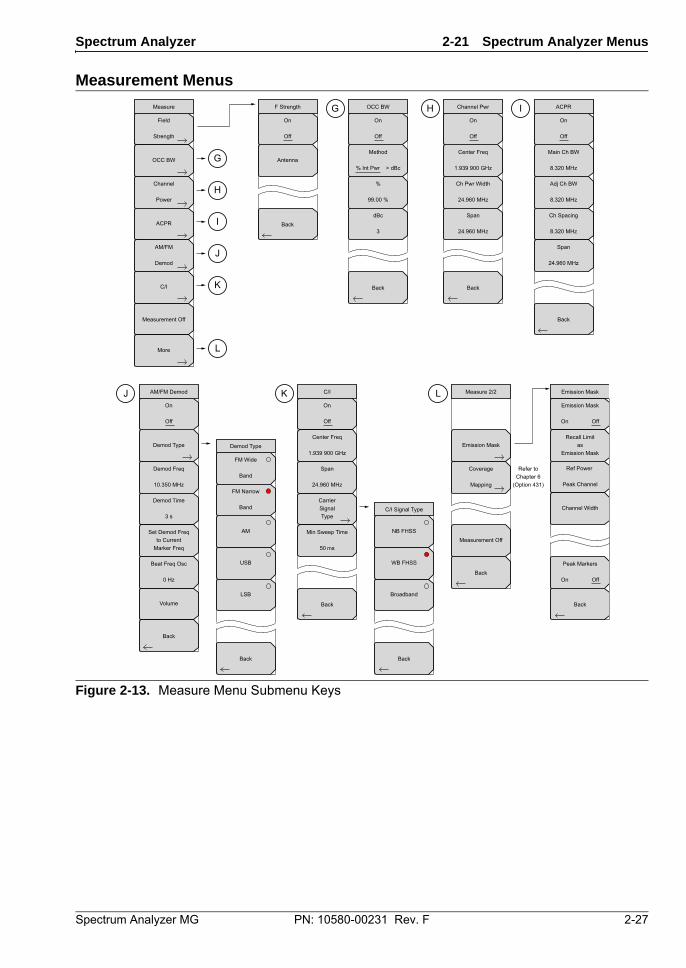
Spectrum Analyzer 2-21 Spectrum Analyzer Menus
Spectrum Analyzer MG PN: 10580-00231 Rev. F 2-27
Measurement Menus
Figure 2-13. Measure Menu Submenu Keys
FM Wide
Band
AM
USB
LSB
FM Narrow
Band
Measurement Off
Measure F Strength
Field
Strength
GOCC BW
HChannel
Power
IACPR
JAM/FM
Demod
KC/I
Demod Type Emission Mask
Coverage
Mapping
LMore
Back
Antenna
%
99.00 %
dBc
3
Method
% Int Pwr > dBc
On
Off
J AM/FM Demod K C/I L Measure 2/2
Demod Type
Demod Freq
10.350 MHz
Demod Time
3 s
Volume
Set Demod Freqto Current
Marker Freq
Beat Freq Osc
0 Hz
G OCC BW
Back
Back
NB FHSS
Broadband
WB FHSS
CarrierSignalType
C/I Signal Type
Back
Back
Back
Back
On
Off
On
Off
On
Off
Center Freq
1.939 900 GHz
Measurement Off
Emission Mask
On Off
Peak Markers
On Off
Emission Mask
Back
Recall Limitas
Emission Mask
Ref Power
Peak Channel
Channel Width
Span
24.960 MHz
Min Sweep Time
50 ms
Ch Pwr Width
24.960 MHz
Span
24.960 MHz
Center Freq
1.939 900 GHz
H Channel Pwr
Back
On
Off
Adj Ch BW
8.320 MHz
Ch Spacing
8.320 MHz
Span
24.960 MHz
Main Ch BW
8.320 MHz
I ACPR
Back
On
Off
Refer toChapter 6
(Option 431)
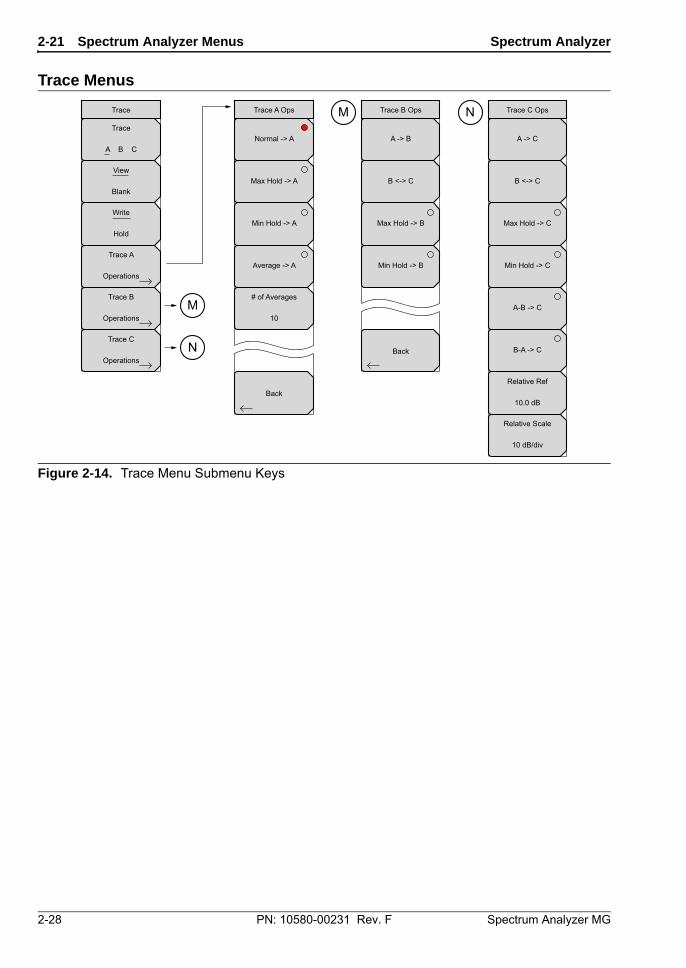
2-21 Spectrum Analyzer Menus Spectrum Analyzer
2-28 PN: 10580-00231 Rev. F Spectrum Analyzer MG
Trace Menus
Figure 2-14. Trace Menu Submenu Keys
Trace Trace A Ops
Back
BackN
M
Trace A
Operations
Trace B
Operations
Trace C
Operations
View
Blank
Normal -> A
Max Hold -> A
Min Hold -> A
Average -> A
# of Averages
10
Trace B OpsM
A -> B
B <-> C
Max Hold -> B
Min Hold -> B
NTrace
A B C
Trace C Ops
A -> C
B <-> C
Max Hold -> C
Min Hold -> C
A-B -> C
B-A -> C
Relative Ref
10.0 dB
Relative Scale
10 dB/div
Write
Hold

Spectrum Analyzer 2-21 Spectrum Analyzer Menus
Spectrum Analyzer MG PN: 10580-00231 Rev. F 2-29
Limit Menus
Figure 2-15. Limit Menu Submenu Keys
Limit Edit
Back
Back
Upper Shape
Square Slope
Set Default Limit
O
P
Q
Limit Edit
Limit Move
Limit Envelope
Limit Advanced
On
Off
Frequency
1.964 718 182 GHz
Amplitude
-75.0 dBm
Add
Point
Add
Vertical
Delete
Point
NextPointLeft
NextPointRight
Limit MoveOMove Limitto Current
Center Freq
Move Limit
0.0 dB
Move Limit
0 Hz
Move Limit
to Marker 1
Offset from Marker 1
10.0 dB
Limit Envelope
Back
P
Create Envelope
Update
Envelope Amplitude
Upper Points
21
Upper Offset
3.0 dB
Limit Alarm
On Off
Limit
Upper Lower
Limit Line Type
Absolute Relative
Limit Advanced
Back
Q
Save
Limit
Recall
Limit
Limit Mirror
Off On
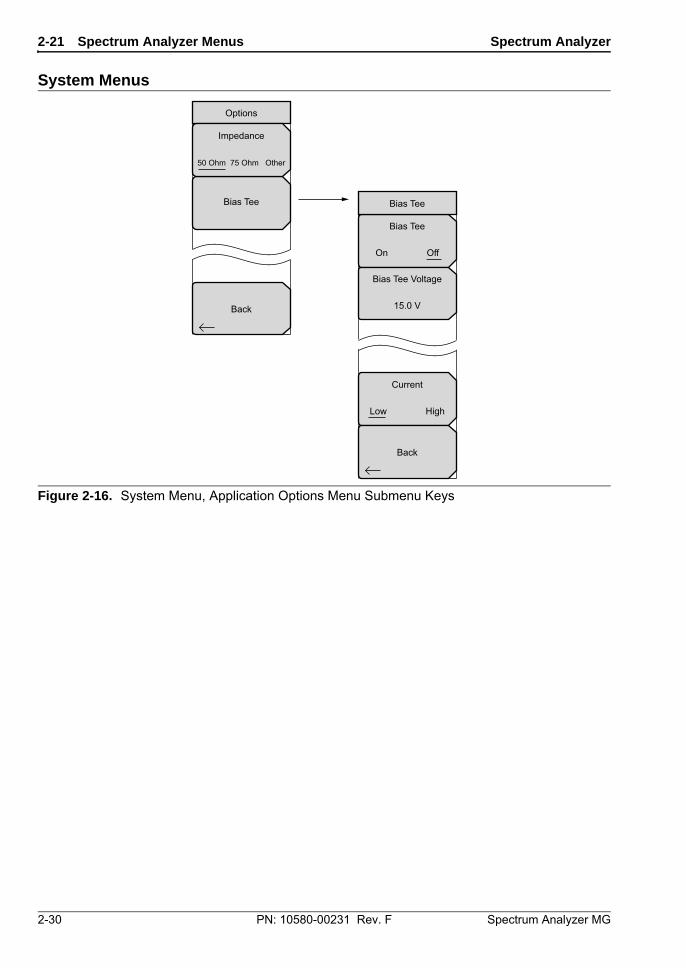
2-21 Spectrum Analyzer Menus Spectrum Analyzer
2-30 PN: 10580-00231 Rev. F Spectrum Analyzer MG
System Menus
Figure 2-16. System Menu, Application Options Menu Submenu Keys
Options
Bias Tee
Impedance
50 Ohm 75 Ohm Other
Bias Tee
On Off
Current
Low High
Bias Tee
Back
Bias Tee Voltage
15.0 VBack
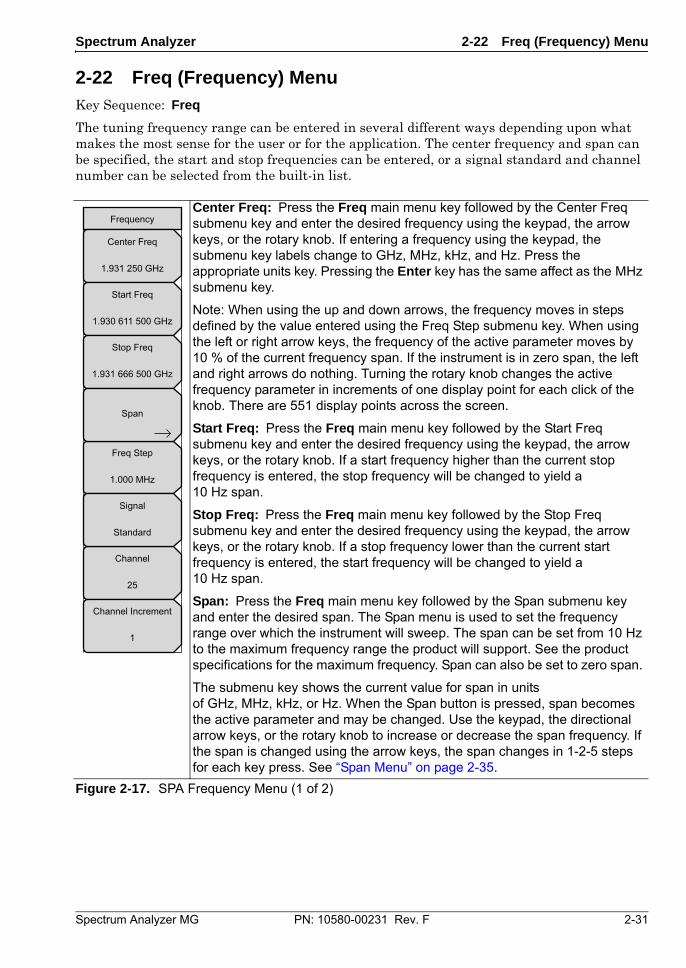
Spectrum Analyzer 2-22 Freq (Frequency) Menu
Spectrum Analyzer MG PN: 10580-00231 Rev. F 2-31
2-22 Freq (Frequency) Menu Key Sequence: Freq
The tuning frequency range can be entered in several different ways depending upon what makes the most sense for the user or for the application. The center frequency and span can be specified, the start and stop frequencies can be entered, or a signal standard and channel number can be selected from the built-in list.
Center Freq: Press the Freq main menu key followed by the Center Freq submenu key and enter the desired frequency using the keypad, the arrow keys, or the rotary knob. If entering a frequency using the keypad, the submenu key labels change to GHz, MHz, kHz, and Hz. Press the appropriate units key. Pressing the Enter key has the same affect as the MHz submenu key.
Note: When using the up and down arrows, the frequency moves in steps defined by the value entered using the Freq Step submenu key. When using the left or right arrow keys, the frequency of the active parameter moves by 10 % of the current frequency span. If the instrument is in zero span, the left and right arrows do nothing. Turning the rotary knob changes the active frequency parameter in increments of one display point for each click of the knob. There are 551 display points across the screen.
Start Freq: Press the Freq main menu key followed by the Start Freq submenu key and enter the desired frequency using the keypad, the arrow keys, or the rotary knob. If a start frequency higher than the current stop frequency is entered, the stop frequency will be changed to yield a 10 Hz span.
Stop Freq: Press the Freq main menu key followed by the Stop Freq submenu key and enter the desired frequency using the keypad, the arrow keys, or the rotary knob. If a stop frequency lower than the current start frequency is entered, the start frequency will be changed to yield a 10 Hz span.
Span: Press the Freq main menu key followed by the Span submenu key and enter the desired span. The Span menu is used to set the frequency range over which the instrument will sweep. The span can be set from 10 Hz to the maximum frequency range the product will support. See the product specifications for the maximum frequency. Span can also be set to zero span.
The submenu key shows the current value for span in units of GHz, MHz, kHz, or Hz. When the Span button is pressed, span becomes the active parameter and may be changed. Use the keypad, the directional arrow keys, or the rotary knob to increase or decrease the span frequency. If the span is changed using the arrow keys, the span changes in 1-2-5 steps for each key press. See “Span Menu” on page 2-35.
Figure 2-17. SPA Frequency Menu (1 of 2)
Frequency
Center Freq
1.931 250 GHz
Start Freq
1.930 611 500 GHz
Stop Freq
1.931 666 500 GHz
Freq Step
1.000 MHz
Channel
25
Signal
Standard
Channel Increment
1
Span
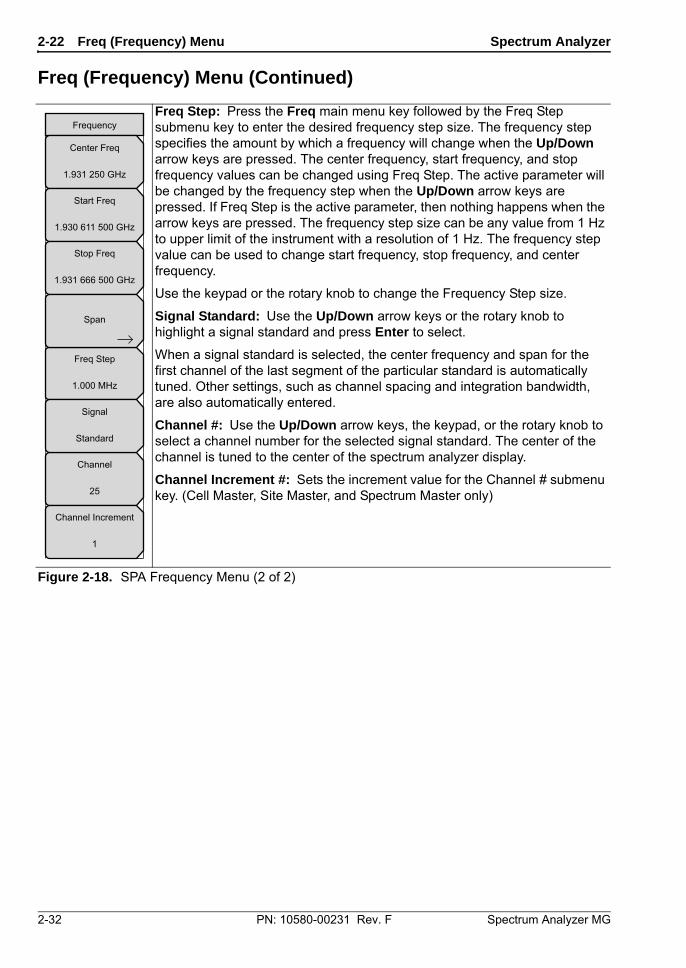
2-22 Freq (Frequency) Menu Spectrum Analyzer
2-32 PN: 10580-00231 Rev. F Spectrum Analyzer MG
Freq (Frequency) Menu (Continued)
Freq Step: Press the Freq main menu key followed by the Freq Step submenu key to enter the desired frequency step size. The frequency step specifies the amount by which a frequency will change when the Up/Down arrow keys are pressed. The center frequency, start frequency, and stop frequency values can be changed using Freq Step. The active parameter will be changed by the frequency step when the Up/Down arrow keys are pressed. If Freq Step is the active parameter, then nothing happens when the arrow keys are pressed. The frequency step size can be any value from 1 Hz to upper limit of the instrument with a resolution of 1 Hz. The frequency step value can be used to change start frequency, stop frequency, and center frequency.
Use the keypad or the rotary knob to change the Frequency Step size.
Signal Standard: Use the Up/Down arrow keys or the rotary knob to highlight a signal standard and press Enter to select.
When a signal standard is selected, the center frequency and span for the first channel of the last segment of the particular standard is automatically tuned. Other settings, such as channel spacing and integration bandwidth, are also automatically entered.
Channel #: Use the Up/Down arrow keys, the keypad, or the rotary knob to select a channel number for the selected signal standard. The center of the channel is tuned to the center of the spectrum analyzer display.
Channel Increment #: Sets the increment value for the Channel # submenu key. (Cell Master, Site Master, and Spectrum Master only)
Figure 2-18. SPA Frequency Menu (2 of 2)
Frequency
Center Freq
1.931 250 GHz
Start Freq
1.930 611 500 GHz
Stop Freq
1.931 666 500 GHz
Freq Step
1.000 MHz
Channel
25
Signal
Standard
Channel Increment
1
Span
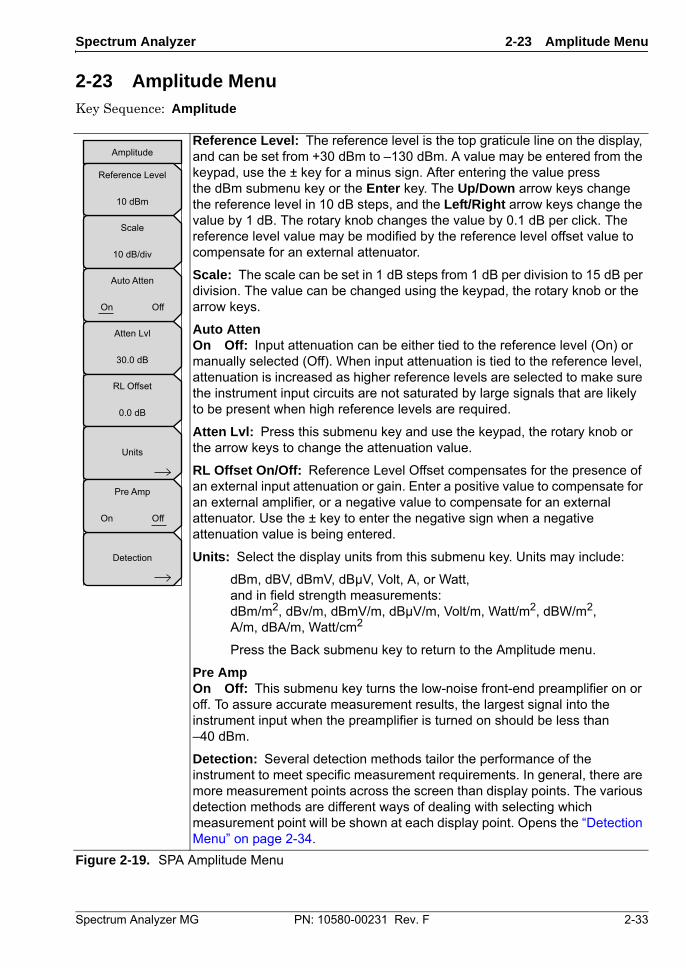
Spectrum Analyzer 2-23 Amplitude Menu
Spectrum Analyzer MG PN: 10580-00231 Rev. F 2-33
2-23 Amplitude Menu Key Sequence: Amplitude
Reference Level: The reference level is the top graticule line on the display, and can be set from +30 dBm to –130 dBm. A value may be entered from the keypad, use the ± key for a minus sign. After entering the value press the dBm submenu key or the Enter key. The Up/Down arrow keys change the reference level in 10 dB steps, and the Left/Right arrow keys change the value by 1 dB. The rotary knob changes the value by 0.1 dB per click. The reference level value may be modified by the reference level offset value to compensate for an external attenuator.
Scale: The scale can be set in 1 dB steps from 1 dB per division to 15 dB per division. The value can be changed using the keypad, the rotary knob or the arrow keys.
Auto AttenOn Off: Input attenuation can be either tied to the reference level (On) or manually selected (Off). When input attenuation is tied to the reference level, attenuation is increased as higher reference levels are selected to make sure the instrument input circuits are not saturated by large signals that are likely to be present when high reference levels are required.
Atten Lvl: Press this submenu key and use the keypad, the rotary knob or the arrow keys to change the attenuation value.
RL Offset On/Off: Reference Level Offset compensates for the presence of an external input attenuation or gain. Enter a positive value to compensate for an external amplifier, or a negative value to compensate for an external attenuator. Use the ± key to enter the negative sign when a negative attenuation value is being entered.
Units: Select the display units from this submenu key. Units may include:
dBm, dBV, dBmV, dBµV, Volt, A, or Watt,and in field strength measurements: dBm/m2, dBv/m, dBmV/m, dBµV/m, Volt/m, Watt/m2, dBW/m2, A/m, dBA/m, Watt/cm2
Press the Back submenu key to return to the Amplitude menu.
Pre AmpOn Off: This submenu key turns the low-noise front-end preamplifier on or off. To assure accurate measurement results, the largest signal into the instrument input when the preamplifier is turned on should be less than –40 dBm.
Detection: Several detection methods tailor the performance of the instrument to meet specific measurement requirements. In general, there are more measurement points across the screen than display points. The various detection methods are different ways of dealing with selecting which measurement point will be shown at each display point. Opens the “Detection Menu” on page 2-34.
Figure 2-19. SPA Amplitude Menu
Amplitude
Scale
10 dB/div
Atten Lvl
30.0 dB
RL Offset
0.0 dB
Reference Level
10 dBm
Units
Detection
Auto Atten
On Off
Pre Amp
On Off
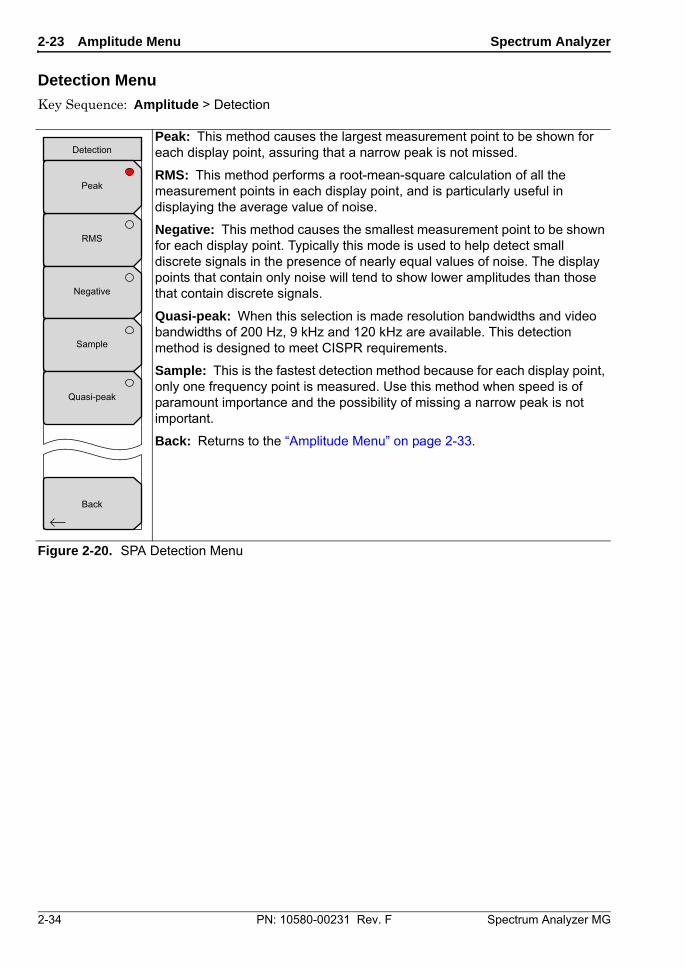
2-23 Amplitude Menu Spectrum Analyzer
2-34 PN: 10580-00231 Rev. F Spectrum Analyzer MG
Detection Menu
Key Sequence: Amplitude > Detection
Peak: This method causes the largest measurement point to be shown for each display point, assuring that a narrow peak is not missed.
RMS: This method performs a root-mean-square calculation of all the measurement points in each display point, and is particularly useful in displaying the average value of noise.
Negative: This method causes the smallest measurement point to be shown for each display point. Typically this mode is used to help detect small discrete signals in the presence of nearly equal values of noise. The display points that contain only noise will tend to show lower amplitudes than those that contain discrete signals.
Quasi-peak: When this selection is made resolution bandwidths and video bandwidths of 200 Hz, 9 kHz and 120 kHz are available. This detection method is designed to meet CISPR requirements.
Sample: This is the fastest detection method because for each display point, only one frequency point is measured. Use this method when speed is of paramount importance and the possibility of missing a narrow peak is not important.
Back: Returns to the “Amplitude Menu” on page 2-33.
Figure 2-20. SPA Detection Menu
Detection
Back
RMS
Negative
Sample
Quasi-peak
Peak
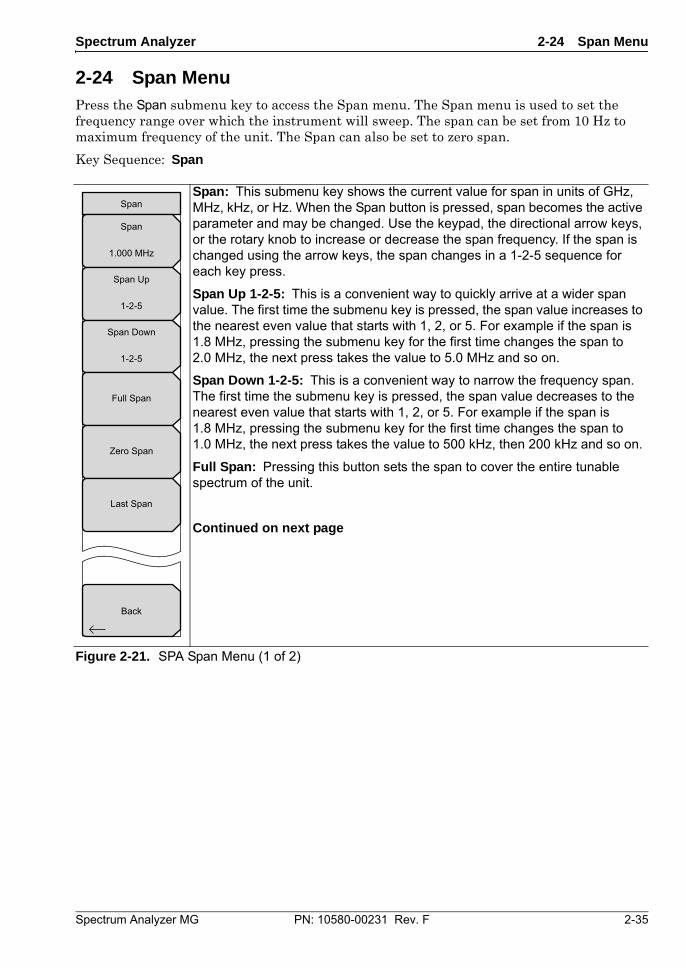
Spectrum Analyzer 2-24 Span Menu
Spectrum Analyzer MG PN: 10580-00231 Rev. F 2-35
2-24 Span Menu Press the Span submenu key to access the Span menu. The Span menu is used to set the frequency range over which the instrument will sweep. The span can be set from 10 Hz to maximum frequency of the unit. The Span can also be set to zero span.
Key Sequence: Span
Span: This submenu key shows the current value for span in units of GHz, MHz, kHz, or Hz. When the Span button is pressed, span becomes the active parameter and may be changed. Use the keypad, the directional arrow keys, or the rotary knob to increase or decrease the span frequency. If the span is changed using the arrow keys, the span changes in a 1-2-5 sequence for each key press.
Span Up 1-2-5: This is a convenient way to quickly arrive at a wider span value. The first time the submenu key is pressed, the span value increases to the nearest even value that starts with 1, 2, or 5. For example if the span is 1.8 MHz, pressing the submenu key for the first time changes the span to 2.0 MHz, the next press takes the value to 5.0 MHz and so on.
Span Down 1-2-5: This is a convenient way to narrow the frequency span. The first time the submenu key is pressed, the span value decreases to the nearest even value that starts with 1, 2, or 5. For example if the span is 1.8 MHz, pressing the submenu key for the first time changes the span to 1.0 MHz, the next press takes the value to 500 kHz, then 200 kHz and so on.
Full Span: Pressing this button sets the span to cover the entire tunable spectrum of the unit.
Continued on next page
Figure 2-21. SPA Span Menu (1 of 2)
Back
Span
Span
1.000 MHz
Span Up
1-2-5
Span Down
1-2-5
Full Span
Zero Span
Last Span
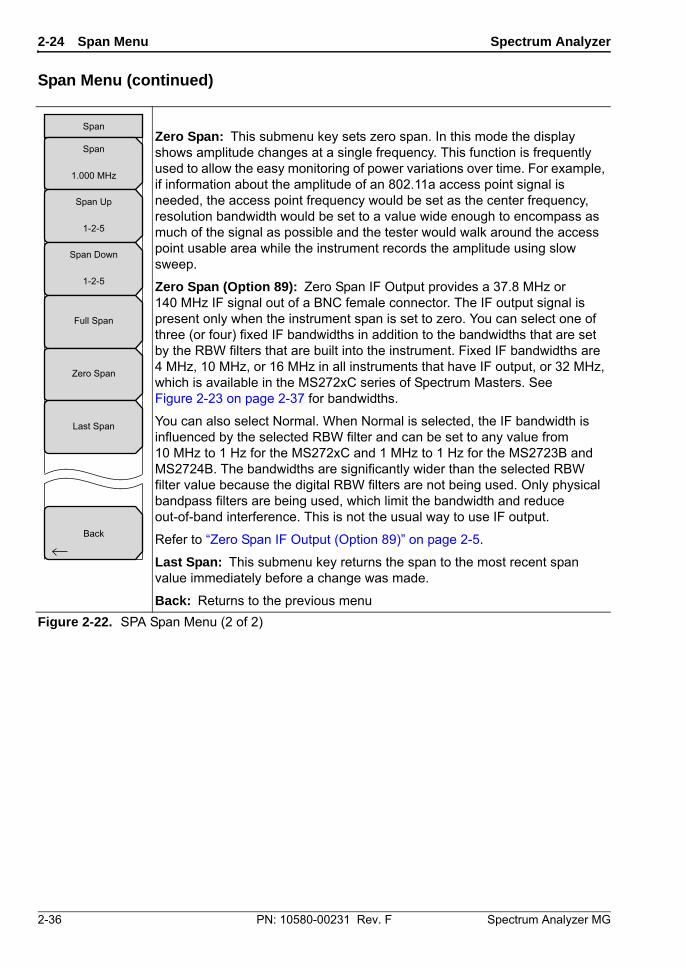
2-24 Span Menu Spectrum Analyzer
2-36 PN: 10580-00231 Rev. F Spectrum Analyzer MG
Span Menu (continued)
Zero Span: This submenu key sets zero span. In this mode the display shows amplitude changes at a single frequency. This function is frequently used to allow the easy monitoring of power variations over time. For example, if information about the amplitude of an 802.11a access point signal is needed, the access point frequency would be set as the center frequency, resolution bandwidth would be set to a value wide enough to encompass as much of the signal as possible and the tester would walk around the access point usable area while the instrument records the amplitude using slow sweep.
Zero Span (Option 89): Zero Span IF Output provides a 37.8 MHz or 140 MHz IF signal out of a BNC female connector. The IF output signal is present only when the instrument span is set to zero. You can select one of three (or four) fixed IF bandwidths in addition to the bandwidths that are set by the RBW filters that are built into the instrument. Fixed IF bandwidths are 4 MHz, 10 MHz, or 16 MHz in all instruments that have IF output, or 32 MHz, which is available in the MS272xC series of Spectrum Masters. See Figure 2-23 on page 2-37 for bandwidths.
You can also select Normal. When Normal is selected, the IF bandwidth is influenced by the selected RBW filter and can be set to any value from 10 MHz to 1 Hz for the MS272xC and 1 MHz to 1 Hz for the MS2723B and MS2724B. The bandwidths are significantly wider than the selected RBW filter value because the digital RBW filters are not being used. Only physical bandpass filters are being used, which limit the bandwidth and reduce out-of-band interference. This is not the usual way to use IF output.
Refer to “Zero Span IF Output (Option 89)” on page 2-5.
Last Span: This submenu key returns the span to the most recent span value immediately before a change was made.
Back: Returns to the previous menu
Figure 2-22. SPA Span Menu (2 of 2)
Back
Span
Span
1.000 MHz
Span Up
1-2-5
Span Down
1-2-5
Full Span
Zero Span
Last Span
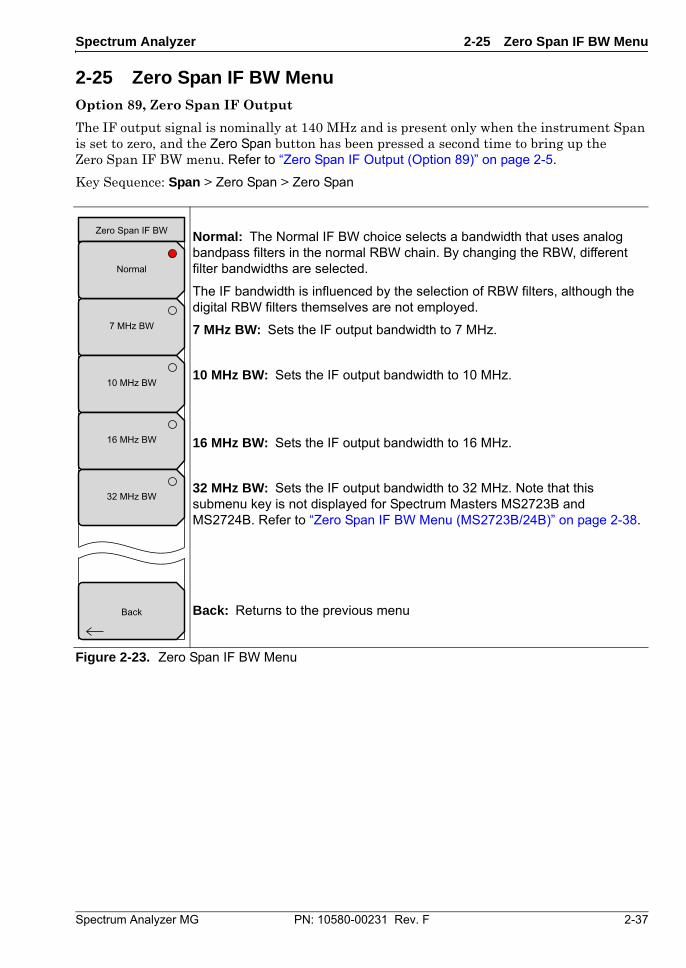
Spectrum Analyzer 2-25 Zero Span IF BW Menu
Spectrum Analyzer MG PN: 10580-00231 Rev. F 2-37
2-25 Zero Span IF BW Menu Option 89, Zero Span IF Output
The IF output signal is nominally at 140 MHz and is present only when the instrument Span is set to zero, and the Zero Span button has been pressed a second time to bring up the Zero Span IF BW menu. Refer to “Zero Span IF Output (Option 89)” on page 2-5.
Key Sequence: Span > Zero Span > Zero Span
Normal: The Normal IF BW choice selects a bandwidth that uses analog bandpass filters in the normal RBW chain. By changing the RBW, different filter bandwidths are selected.
The IF bandwidth is influenced by the selection of RBW filters, although the digital RBW filters themselves are not employed.
7 MHz BW: Sets the IF output bandwidth to 7 MHz.
10 MHz BW: Sets the IF output bandwidth to 10 MHz.
16 MHz BW: Sets the IF output bandwidth to 16 MHz.
32 MHz BW: Sets the IF output bandwidth to 32 MHz. Note that this submenu key is not displayed for Spectrum Masters MS2723B and MS2724B. Refer to “Zero Span IF BW Menu (MS2723B/24B)” on page 2-38.
Back: Returns to the previous menu
Figure 2-23. Zero Span IF BW Menu
Zero Span IF BW
Back
7 MHz BW
10 MHz BW
16 MHz BW
32 MHz BW
Normal
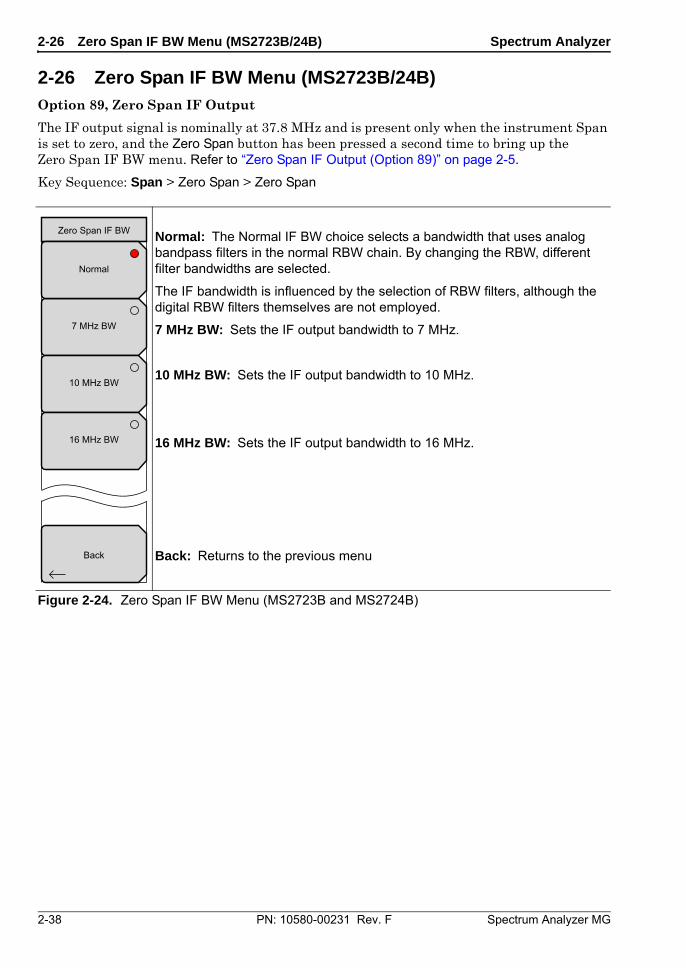
2-26 Zero Span IF BW Menu (MS2723B/24B) Spectrum Analyzer
2-38 PN: 10580-00231 Rev. F Spectrum Analyzer MG
2-26 Zero Span IF BW Menu (MS2723B/24B) Option 89, Zero Span IF Output
The IF output signal is nominally at 37.8 MHz and is present only when the instrument Span is set to zero, and the Zero Span button has been pressed a second time to bring up the Zero Span IF BW menu. Refer to “Zero Span IF Output (Option 89)” on page 2-5.
Key Sequence: Span > Zero Span > Zero Span
Normal: The Normal IF BW choice selects a bandwidth that uses analog bandpass filters in the normal RBW chain. By changing the RBW, different filter bandwidths are selected.
The IF bandwidth is influenced by the selection of RBW filters, although the digital RBW filters themselves are not employed.
7 MHz BW: Sets the IF output bandwidth to 7 MHz.
10 MHz BW: Sets the IF output bandwidth to 10 MHz.
16 MHz BW: Sets the IF output bandwidth to 16 MHz.
Back: Returns to the previous menu
Figure 2-24. Zero Span IF BW Menu (MS2723B and MS2724B)
Zero Span IF BW
Back
7 MHz BW
10 MHz BW
16 MHz BW
Normal
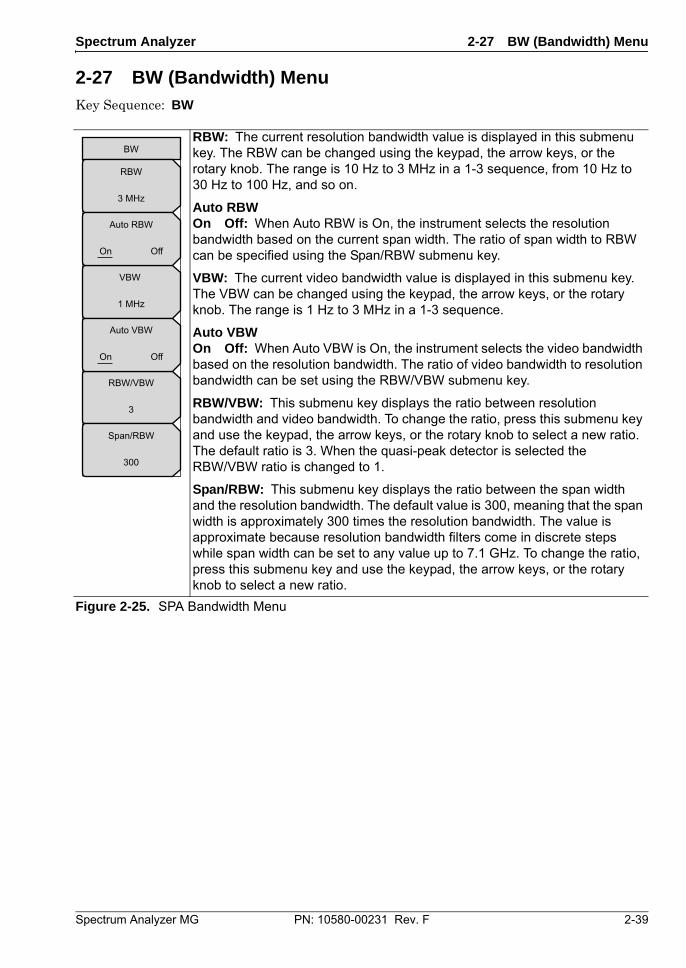
Spectrum Analyzer 2-27 BW (Bandwidth) Menu
Spectrum Analyzer MG PN: 10580-00231 Rev. F 2-39
2-27 BW (Bandwidth) Menu Key Sequence: BW
RBW: The current resolution bandwidth value is displayed in this submenu key. The RBW can be changed using the keypad, the arrow keys, or the rotary knob. The range is 10 Hz to 3 MHz in a 1-3 sequence, from 10 Hz to 30 Hz to 100 Hz, and so on.
Auto RBWOn Off: When Auto RBW is On, the instrument selects the resolution bandwidth based on the current span width. The ratio of span width to RBW can be specified using the Span/RBW submenu key.
VBW: The current video bandwidth value is displayed in this submenu key. The VBW can be changed using the keypad, the arrow keys, or the rotary knob. The range is 1 Hz to 3 MHz in a 1-3 sequence.
Auto VBWOn Off: When Auto VBW is On, the instrument selects the video bandwidth based on the resolution bandwidth. The ratio of video bandwidth to resolution bandwidth can be set using the RBW/VBW submenu key.
RBW/VBW: This submenu key displays the ratio between resolution bandwidth and video bandwidth. To change the ratio, press this submenu key and use the keypad, the arrow keys, or the rotary knob to select a new ratio. The default ratio is 3. When the quasi-peak detector is selected the RBW/VBW ratio is changed to 1.
Span/RBW: This submenu key displays the ratio between the span width and the resolution bandwidth. The default value is 300, meaning that the span width is approximately 300 times the resolution bandwidth. The value is approximate because resolution bandwidth filters come in discrete steps while span width can be set to any value up to 7.1 GHz. To change the ratio, press this submenu key and use the keypad, the arrow keys, or the rotary knob to select a new ratio.
Figure 2-25. SPA Bandwidth Menu
BW
RBW
3 MHz
VBW
1 MHz
RBW/VBW
3
Span/RBW
300
Auto RBW
On Off
Auto VBW
On Off
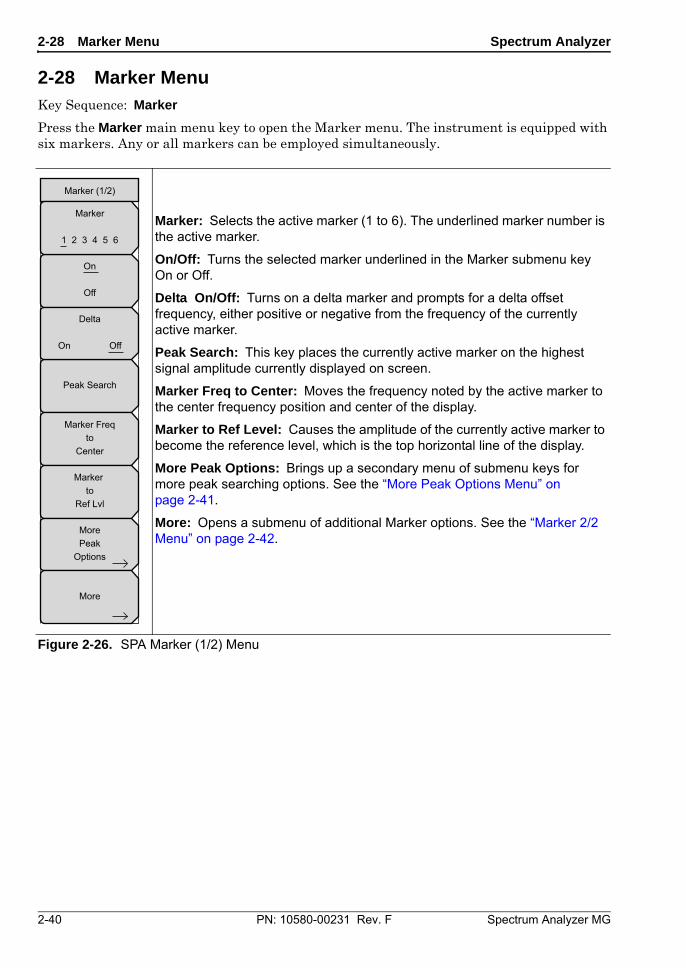
2-28 Marker Menu Spectrum Analyzer
2-40 PN: 10580-00231 Rev. F Spectrum Analyzer MG
2-28 Marker Menu Key Sequence: Marker
Press the Marker main menu key to open the Marker menu. The instrument is equipped with six markers. Any or all markers can be employed simultaneously.
Marker: Selects the active marker (1 to 6). The underlined marker number is the active marker.
On/Off: Turns the selected marker underlined in the Marker submenu key On or Off.
Delta On/Off: Turns on a delta marker and prompts for a delta offset frequency, either positive or negative from the frequency of the currently active marker.
Peak Search: This key places the currently active marker on the highest signal amplitude currently displayed on screen.
Marker Freq to Center: Moves the frequency noted by the active marker to the center frequency position and center of the display.
Marker to Ref Level: Causes the amplitude of the currently active marker to become the reference level, which is the top horizontal line of the display.
More Peak Options: Brings up a secondary menu of submenu keys for more peak searching options. See the “More Peak Options Menu” on page 2-41.
More: Opens a submenu of additional Marker options. See the “Marker 2/2 Menu” on page 2-42.
Figure 2-26. SPA Marker (1/2) Menu
Marker (1/2)
On
Off
Peak Search
Marker Freqto
Center
Marker to
Ref Lvl
Marker
1 2 3 4 5 6
MorePeak
Options
More
Delta
On Off
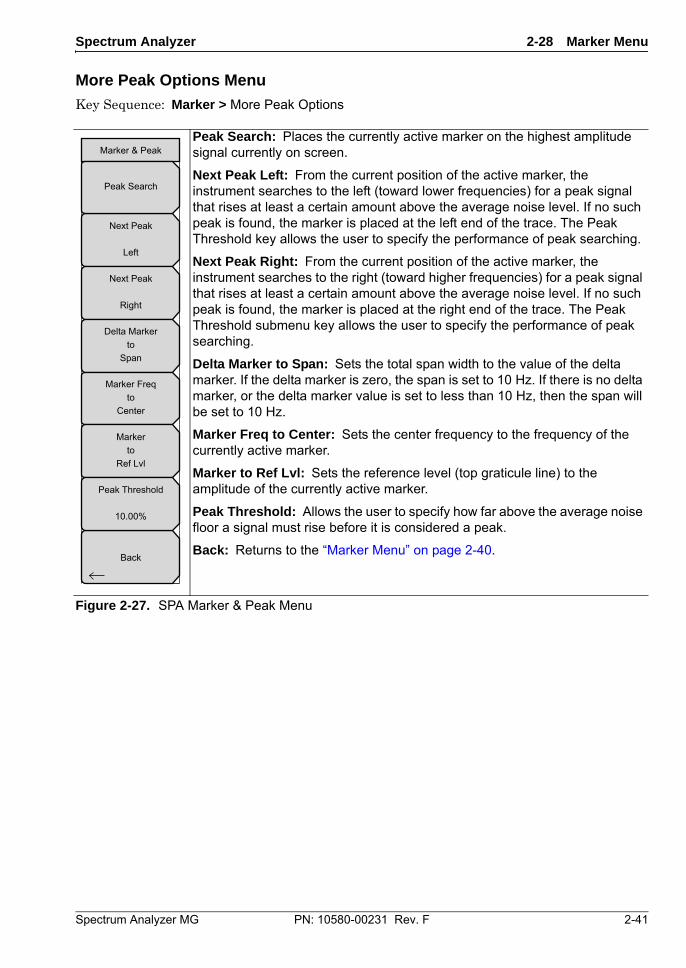
Spectrum Analyzer 2-28 Marker Menu
Spectrum Analyzer MG PN: 10580-00231 Rev. F 2-41
More Peak Options Menu
Key Sequence: Marker > More Peak Options
Peak Search: Places the currently active marker on the highest amplitude signal currently on screen.
Next Peak Left: From the current position of the active marker, the instrument searches to the left (toward lower frequencies) for a peak signal that rises at least a certain amount above the average noise level. If no such peak is found, the marker is placed at the left end of the trace. The Peak Threshold key allows the user to specify the performance of peak searching.
Next Peak Right: From the current position of the active marker, the instrument searches to the right (toward higher frequencies) for a peak signal that rises at least a certain amount above the average noise level. If no such peak is found, the marker is placed at the right end of the trace. The Peak Threshold submenu key allows the user to specify the performance of peak searching.
Delta Marker to Span: Sets the total span width to the value of the delta marker. If the delta marker is zero, the span is set to 10 Hz. If there is no delta marker, or the delta marker value is set to less than 10 Hz, then the span will be set to 10 Hz.
Marker Freq to Center: Sets the center frequency to the frequency of the currently active marker.
Marker to Ref Lvl: Sets the reference level (top graticule line) to the amplitude of the currently active marker.
Peak Threshold: Allows the user to specify how far above the average noise floor a signal must rise before it is considered a peak.
Back: Returns to the “Marker Menu” on page 2-40.
Figure 2-27. SPA Marker & Peak Menu
Marker & Peak
Back
Next Peak
Left
Next Peak
Right
Delta Markerto
Span
Marker Freqto
Center
Markerto
Ref Lvl
Peak Threshold
10.00%
Peak Search
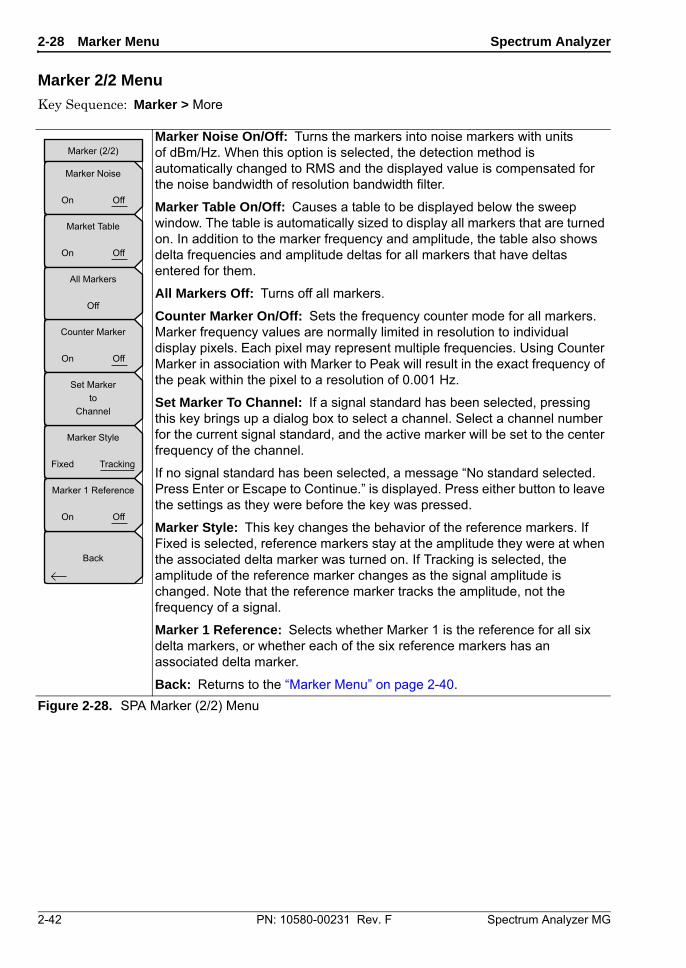
2-28 Marker Menu Spectrum Analyzer
2-42 PN: 10580-00231 Rev. F Spectrum Analyzer MG
Marker 2/2 Menu
Key Sequence: Marker > More
Marker Noise On/Off: Turns the markers into noise markers with units of dBm/Hz. When this option is selected, the detection method is automatically changed to RMS and the displayed value is compensated for the noise bandwidth of resolution bandwidth filter.
Marker Table On/Off: Causes a table to be displayed below the sweep window. The table is automatically sized to display all markers that are turned on. In addition to the marker frequency and amplitude, the table also shows delta frequencies and amplitude deltas for all markers that have deltas entered for them.
All Markers Off: Turns off all markers.
Counter Marker On/Off: Sets the frequency counter mode for all markers. Marker frequency values are normally limited in resolution to individual display pixels. Each pixel may represent multiple frequencies. Using Counter Marker in association with Marker to Peak will result in the exact frequency of the peak within the pixel to a resolution of 0.001 Hz.
Set Marker To Channel: If a signal standard has been selected, pressing this key brings up a dialog box to select a channel. Select a channel number for the current signal standard, and the active marker will be set to the center frequency of the channel.
If no signal standard has been selected, a message “No standard selected. Press Enter or Escape to Continue.” is displayed. Press either button to leave the settings as they were before the key was pressed.
Marker Style: This key changes the behavior of the reference markers. If Fixed is selected, reference markers stay at the amplitude they were at when the associated delta marker was turned on. If Tracking is selected, the amplitude of the reference marker changes as the signal amplitude is changed. Note that the reference marker tracks the amplitude, not the frequency of a signal.
Marker 1 Reference: Selects whether Marker 1 is the reference for all six delta markers, or whether each of the six reference markers has an associated delta marker.
Back: Returns to the “Marker Menu” on page 2-40.
Figure 2-28. SPA Marker (2/2) Menu
Back
Marker (2/2)
Marker Noise
On Off
Market Table
On Off
Counter Marker
On Off
Marker Style
Fixed Tracking
Marker 1 Reference
On Off
All Markers
Off
Set Markerto
Channel
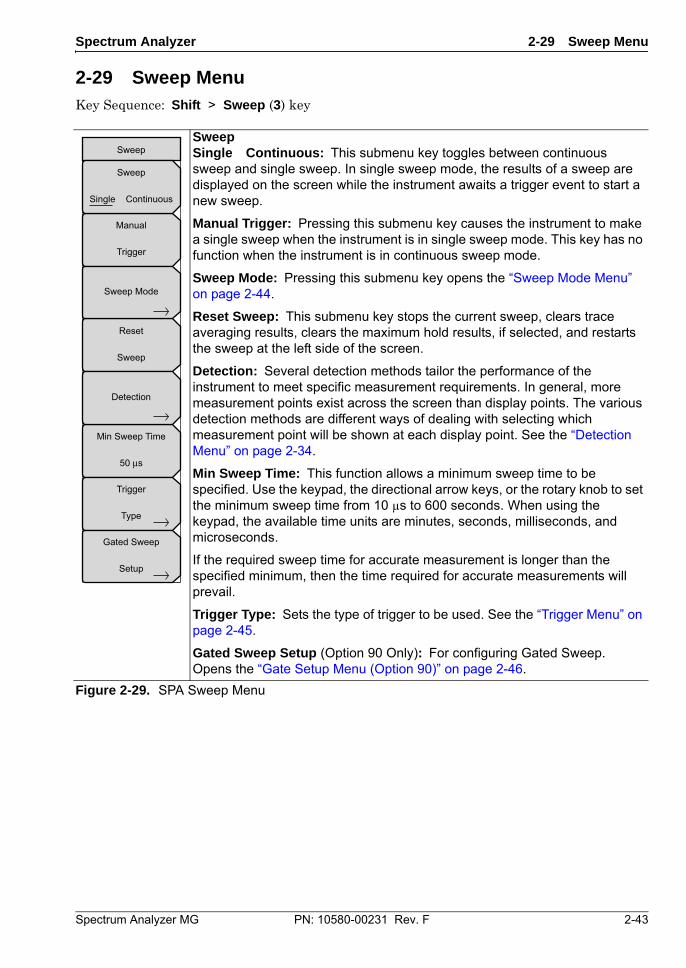
Spectrum Analyzer 2-29 Sweep Menu
Spectrum Analyzer MG PN: 10580-00231 Rev. F 2-43
2-29 Sweep Menu Key Sequence: Shift > Sweep (3) key
SweepSingle Continuous: This submenu key toggles between continuous sweep and single sweep. In single sweep mode, the results of a sweep are displayed on the screen while the instrument awaits a trigger event to start a new sweep.
Manual Trigger: Pressing this submenu key causes the instrument to make a single sweep when the instrument is in single sweep mode. This key has no function when the instrument is in continuous sweep mode.
Sweep Mode: Pressing this submenu key opens the “Sweep Mode Menu” on page 2-44.
Reset Sweep: This submenu key stops the current sweep, clears trace averaging results, clears the maximum hold results, if selected, and restarts the sweep at the left side of the screen.
Detection: Several detection methods tailor the performance of the instrument to meet specific measurement requirements. In general, more measurement points exist across the screen than display points. The various detection methods are different ways of dealing with selecting which measurement point will be shown at each display point. See the “Detection Menu” on page 2-34.
Min Sweep Time: This function allows a minimum sweep time to be specified. Use the keypad, the directional arrow keys, or the rotary knob to set the minimum sweep time from 10 µs to 600 seconds. When using the keypad, the available time units are minutes, seconds, milliseconds, and microseconds.
If the required sweep time for accurate measurement is longer than the specified minimum, then the time required for accurate measurements will prevail.
Trigger Type: Sets the type of trigger to be used. See the “Trigger Menu” on page 2-45.
Gated Sweep Setup (Option 90 Only): For configuring Gated Sweep. Opens the “Gate Setup Menu (Option 90)” on page 2-46.
Figure 2-29. SPA Sweep Menu
Sweep
Reset
Sweep
Manual
Trigger
Min Sweep Time
50 s
Detection
Trigger
Type
Gated Sweep
Setup
Sweep
Single Continuous
Sweep Mode
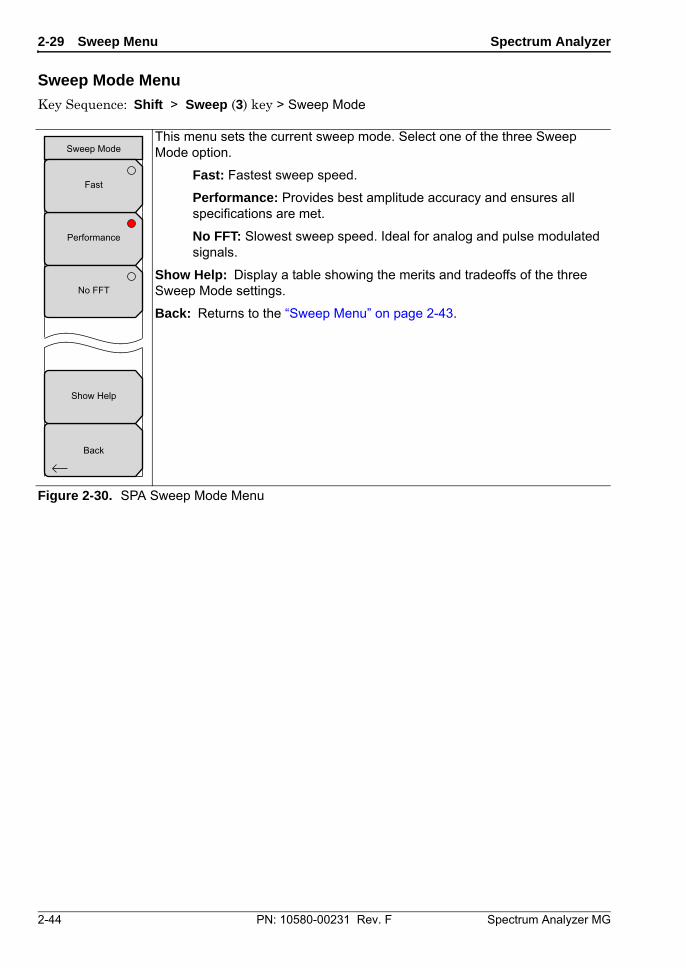
2-29 Sweep Menu Spectrum Analyzer
2-44 PN: 10580-00231 Rev. F Spectrum Analyzer MG
Sweep Mode Menu
Key Sequence: Shift > Sweep (3) key > Sweep Mode
This menu sets the current sweep mode. Select one of the three Sweep Mode option.
Fast: Fastest sweep speed.
Performance: Provides best amplitude accuracy and ensures all specifications are met.
No FFT: Slowest sweep speed. Ideal for analog and pulse modulated signals.
Show Help: Display a table showing the merits and tradeoffs of the three Sweep Mode settings.
Back: Returns to the “Sweep Menu” on page 2-43.
Figure 2-30. SPA Sweep Mode Menu
Sweep Mode
Back
Performance
No FFT
Show Help
Fast
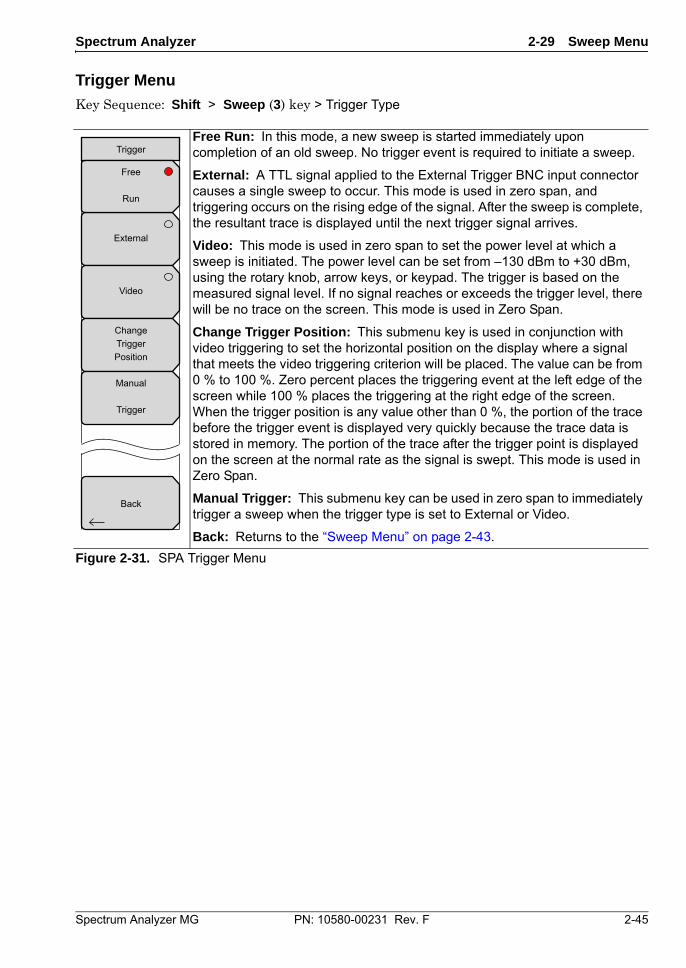
Spectrum Analyzer 2-29 Sweep Menu
Spectrum Analyzer MG PN: 10580-00231 Rev. F 2-45
Trigger Menu
Key Sequence: Shift > Sweep (3) key > Trigger Type
Free Run: In this mode, a new sweep is started immediately upon completion of an old sweep. No trigger event is required to initiate a sweep.
External: A TTL signal applied to the External Trigger BNC input connector causes a single sweep to occur. This mode is used in zero span, and triggering occurs on the rising edge of the signal. After the sweep is complete, the resultant trace is displayed until the next trigger signal arrives.
Video: This mode is used in zero span to set the power level at which a sweep is initiated. The power level can be set from –130 dBm to +30 dBm, using the rotary knob, arrow keys, or keypad. The trigger is based on the measured signal level. If no signal reaches or exceeds the trigger level, there will be no trace on the screen. This mode is used in Zero Span.
Change Trigger Position: This submenu key is used in conjunction with video triggering to set the horizontal position on the display where a signal that meets the video triggering criterion will be placed. The value can be from 0 % to 100 %. Zero percent places the triggering event at the left edge of the screen while 100 % places the triggering at the right edge of the screen. When the trigger position is any value other than 0 %, the portion of the trace before the trigger event is displayed very quickly because the trace data is stored in memory. The portion of the trace after the trigger point is displayed on the screen at the normal rate as the signal is swept. This mode is used in Zero Span.
Manual Trigger: This submenu key can be used in zero span to immediately trigger a sweep when the trigger type is set to External or Video.
Back: Returns to the “Sweep Menu” on page 2-43.
Figure 2-31. SPA Trigger Menu
Trigger
Back
External
Video
ChangeTriggerPosition
Manual
Trigger
Free
Run
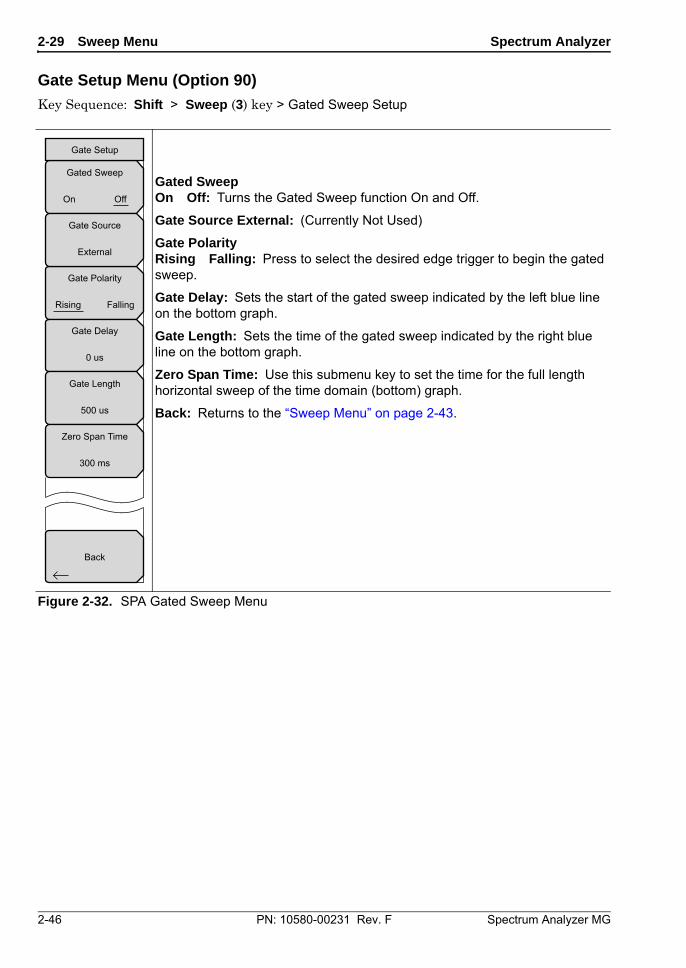
2-29 Sweep Menu Spectrum Analyzer
2-46 PN: 10580-00231 Rev. F Spectrum Analyzer MG
Gate Setup Menu (Option 90)
Key Sequence: Shift > Sweep (3) key > Gated Sweep Setup
Gated SweepOn Off: Turns the Gated Sweep function On and Off.
Gate Source External: (Currently Not Used)
Gate PolarityRising Falling: Press to select the desired edge trigger to begin the gated sweep.
Gate Delay: Sets the start of the gated sweep indicated by the left blue line on the bottom graph.
Gate Length: Sets the time of the gated sweep indicated by the right blue line on the bottom graph.
Zero Span Time: Use this submenu key to set the time for the full length horizontal sweep of the time domain (bottom) graph.
Back: Returns to the “Sweep Menu” on page 2-43.
Figure 2-32. SPA Gated Sweep Menu
Gated Sweep
On Off
Gate Polarity
Rising Falling
Gate Setup
Back
Gate Source
External
Gate Delay
0 us
Gate Length
500 us
Zero Span Time
300 ms
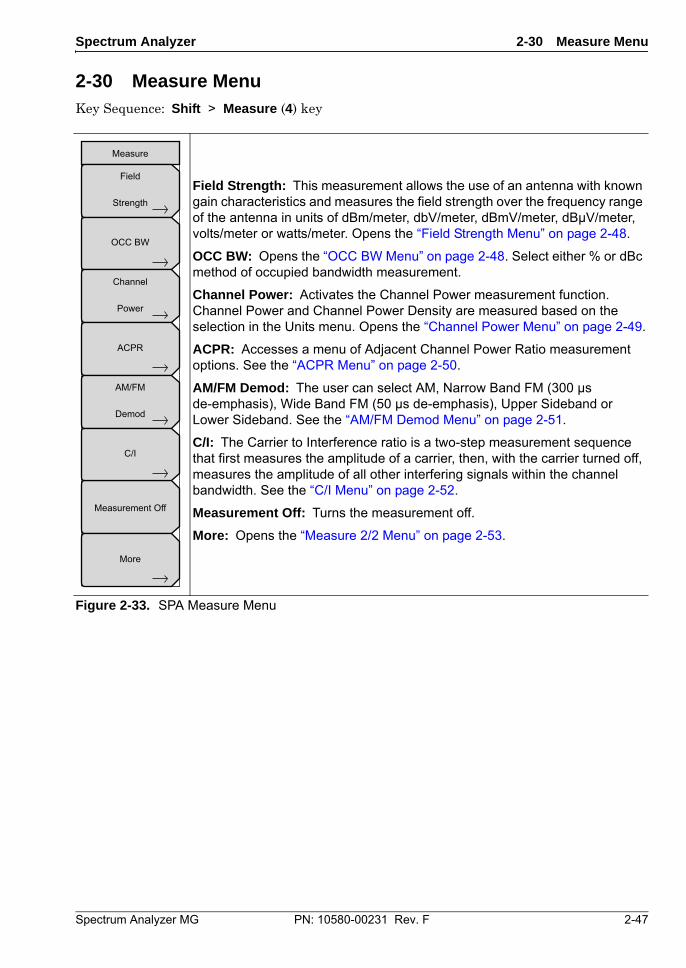
Spectrum Analyzer 2-30 Measure Menu
Spectrum Analyzer MG PN: 10580-00231 Rev. F 2-47
2-30 Measure Menu Key Sequence: Shift > Measure (4) key
Field Strength: This measurement allows the use of an antenna with known gain characteristics and measures the field strength over the frequency range of the antenna in units of dBm/meter, dbV/meter, dBmV/meter, dBµV/meter, volts/meter or watts/meter. Opens the “Field Strength Menu” on page 2-48.
OCC BW: Opens the “OCC BW Menu” on page 2-48. Select either % or dBc method of occupied bandwidth measurement.
Channel Power: Activates the Channel Power measurement function. Channel Power and Channel Power Density are measured based on the selection in the Units menu. Opens the “Channel Power Menu” on page 2-49.
ACPR: Accesses a menu of Adjacent Channel Power Ratio measurement options. See the “ACPR Menu” on page 2-50.
AM/FM Demod: The user can select AM, Narrow Band FM (300 µs de-emphasis), Wide Band FM (50 µs de-emphasis), Upper Sideband or Lower Sideband. See the “AM/FM Demod Menu” on page 2-51.
C/I: The Carrier to Interference ratio is a two-step measurement sequence that first measures the amplitude of a carrier, then, with the carrier turned off, measures the amplitude of all other interfering signals within the channel bandwidth. See the “C/I Menu” on page 2-52.
Measurement Off: Turns the measurement off.
More: Opens the “Measure 2/2 Menu” on page 2-53.
Figure 2-33. SPA Measure Menu
Measurement Off
Measure
Field
Strength
OCC BW
Channel
Power
ACPR
AM/FM
Demod
C/I
More
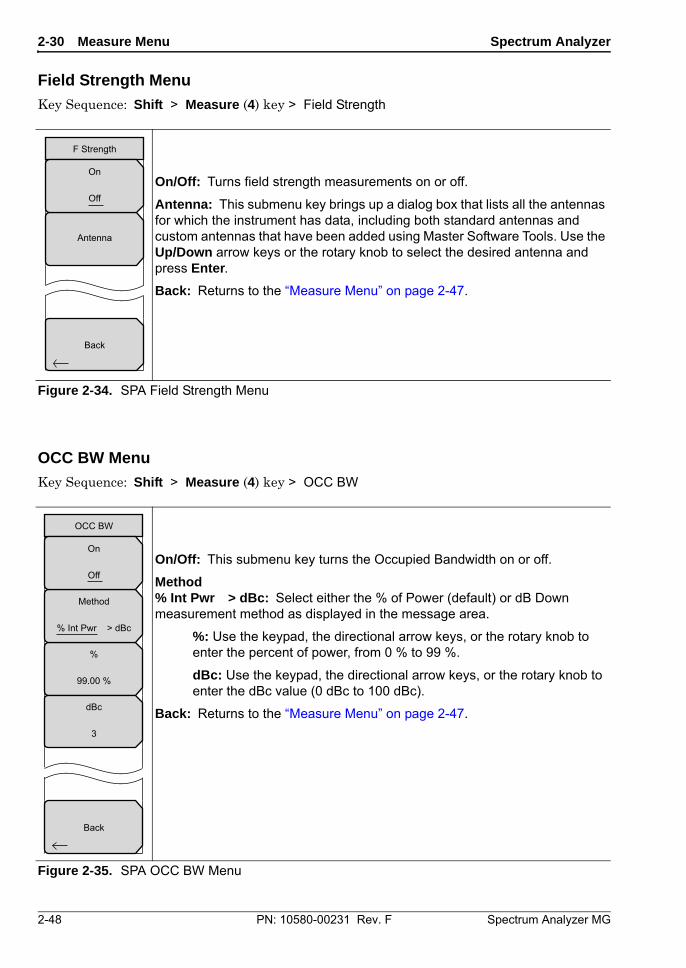
2-30 Measure Menu Spectrum Analyzer
2-48 PN: 10580-00231 Rev. F Spectrum Analyzer MG
Field Strength Menu
Key Sequence: Shift > Measure (4) key > Field Strength
OCC BW Menu
Key Sequence: Shift > Measure (4) key > OCC BW
On/Off: Turns field strength measurements on or off.
Antenna: This submenu key brings up a dialog box that lists all the antennas for which the instrument has data, including both standard antennas and custom antennas that have been added using Master Software Tools. Use the Up/Down arrow keys or the rotary knob to select the desired antenna and press Enter.
Back: Returns to the “Measure Menu” on page 2-47.
Figure 2-34. SPA Field Strength Menu
On/Off: This submenu key turns the Occupied Bandwidth on or off.
Method% Int Pwr > dBc: Select either the % of Power (default) or dB Down measurement method as displayed in the message area.
%: Use the keypad, the directional arrow keys, or the rotary knob to enter the percent of power, from 0 % to 99 %.
dBc: Use the keypad, the directional arrow keys, or the rotary knob to enter the dBc value (0 dBc to 100 dBc).
Back: Returns to the “Measure Menu” on page 2-47.
Figure 2-35. SPA OCC BW Menu
F Strength
Back
Antenna
On
Off
%
99.00 %
dBc
3
Method
% Int Pwr > dBc
OCC BW
Back
On
Off
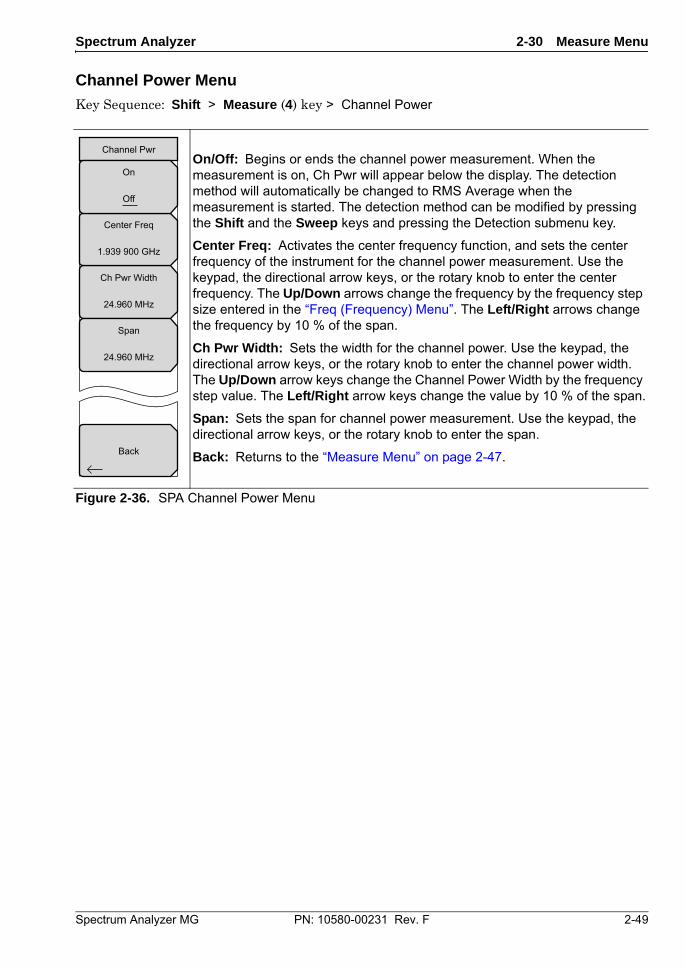
Spectrum Analyzer 2-30 Measure Menu
Spectrum Analyzer MG PN: 10580-00231 Rev. F 2-49
Channel Power Menu
Key Sequence: Shift > Measure (4) key > Channel Power
On/Off: Begins or ends the channel power measurement. When the measurement is on, Ch Pwr will appear below the display. The detection method will automatically be changed to RMS Average when the measurement is started. The detection method can be modified by pressing the Shift and the Sweep keys and pressing the Detection submenu key.
Center Freq: Activates the center frequency function, and sets the center frequency of the instrument for the channel power measurement. Use the keypad, the directional arrow keys, or the rotary knob to enter the center frequency. The Up/Down arrows change the frequency by the frequency step size entered in the “Freq (Frequency) Menu”. The Left/Right arrows change the frequency by 10 % of the span.
Ch Pwr Width: Sets the width for the channel power. Use the keypad, the directional arrow keys, or the rotary knob to enter the channel power width. The Up/Down arrow keys change the Channel Power Width by the frequency step value. The Left/Right arrow keys change the value by 10 % of the span.
Span: Sets the span for channel power measurement. Use the keypad, the directional arrow keys, or the rotary knob to enter the span.
Back: Returns to the “Measure Menu” on page 2-47.
Figure 2-36. SPA Channel Power Menu
Ch Pwr Width
24.960 MHz
Span
24.960 MHz
Center Freq
1.939 900 GHz
Channel Pwr
Back
On
Off
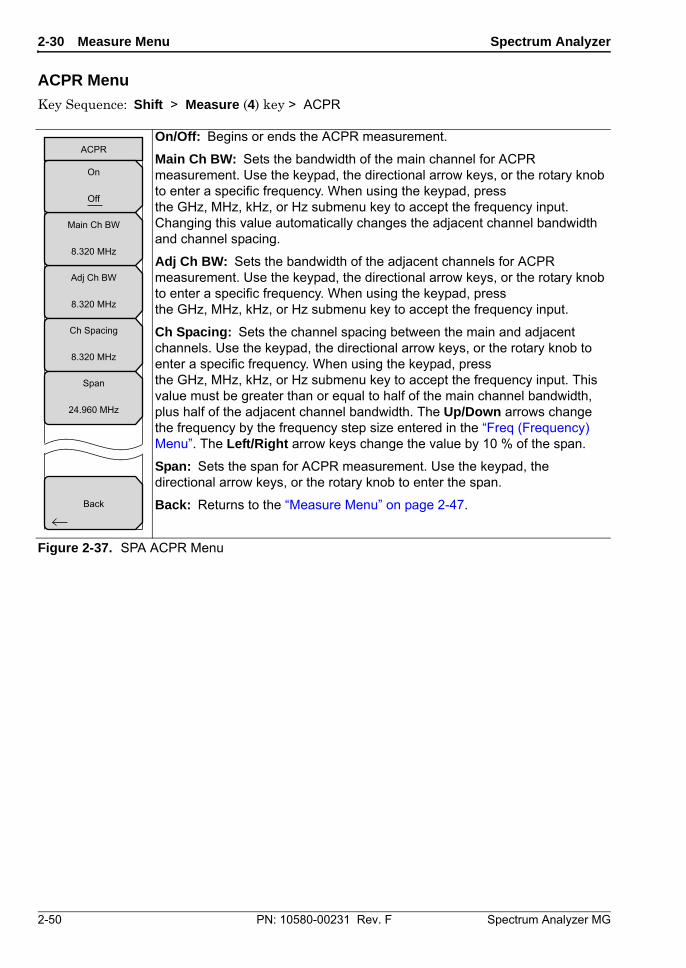
2-30 Measure Menu Spectrum Analyzer
2-50 PN: 10580-00231 Rev. F Spectrum Analyzer MG
ACPR Menu
Key Sequence: Shift > Measure (4) key > ACPR
On/Off: Begins or ends the ACPR measurement.
Main Ch BW: Sets the bandwidth of the main channel for ACPR measurement. Use the keypad, the directional arrow keys, or the rotary knob to enter a specific frequency. When using the keypad, press the GHz, MHz, kHz, or Hz submenu key to accept the frequency input. Changing this value automatically changes the adjacent channel bandwidth and channel spacing.
Adj Ch BW: Sets the bandwidth of the adjacent channels for ACPR measurement. Use the keypad, the directional arrow keys, or the rotary knob to enter a specific frequency. When using the keypad, press the GHz, MHz, kHz, or Hz submenu key to accept the frequency input.
Ch Spacing: Sets the channel spacing between the main and adjacent channels. Use the keypad, the directional arrow keys, or the rotary knob to enter a specific frequency. When using the keypad, press the GHz, MHz, kHz, or Hz submenu key to accept the frequency input. This value must be greater than or equal to half of the main channel bandwidth, plus half of the adjacent channel bandwidth. The Up/Down arrows change the frequency by the frequency step size entered in the “Freq (Frequency) Menu”. The Left/Right arrow keys change the value by 10 % of the span.
Span: Sets the span for ACPR measurement. Use the keypad, the directional arrow keys, or the rotary knob to enter the span.
Back: Returns to the “Measure Menu” on page 2-47.
Figure 2-37. SPA ACPR Menu
Adj Ch BW
8.320 MHz
Ch Spacing
8.320 MHz
Span
24.960 MHz
Main Ch BW
8.320 MHz
ACPR
Back
On
Off
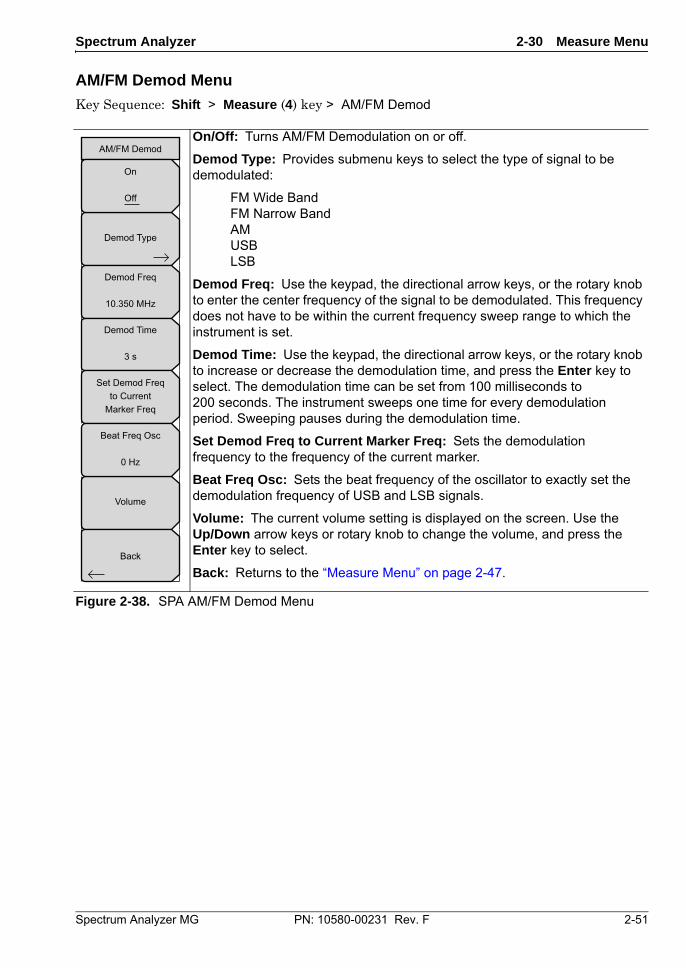
Spectrum Analyzer 2-30 Measure Menu
Spectrum Analyzer MG PN: 10580-00231 Rev. F 2-51
AM/FM Demod Menu
Key Sequence: Shift > Measure (4) key > AM/FM Demod
On/Off: Turns AM/FM Demodulation on or off.
Demod Type: Provides submenu keys to select the type of signal to be demodulated:
FM Wide BandFM Narrow BandAMUSBLSB
Demod Freq: Use the keypad, the directional arrow keys, or the rotary knob to enter the center frequency of the signal to be demodulated. This frequency does not have to be within the current frequency sweep range to which the instrument is set.
Demod Time: Use the keypad, the directional arrow keys, or the rotary knob to increase or decrease the demodulation time, and press the Enter key to select. The demodulation time can be set from 100 milliseconds to 200 seconds. The instrument sweeps one time for every demodulation period. Sweeping pauses during the demodulation time.
Set Demod Freq to Current Marker Freq: Sets the demodulation frequency to the frequency of the current marker.
Beat Freq Osc: Sets the beat frequency of the oscillator to exactly set the demodulation frequency of USB and LSB signals.
Volume: The current volume setting is displayed on the screen. Use the Up/Down arrow keys or rotary knob to change the volume, and press the Enter key to select.
Back: Returns to the “Measure Menu” on page 2-47.
Figure 2-38. SPA AM/FM Demod Menu
Demod Type
AM/FM Demod
Demod Freq
10.350 MHz
Demod Time
3 s
Volume
Set Demod Freqto Current
Marker Freq
Beat Freq Osc
0 Hz
Back
On
Off
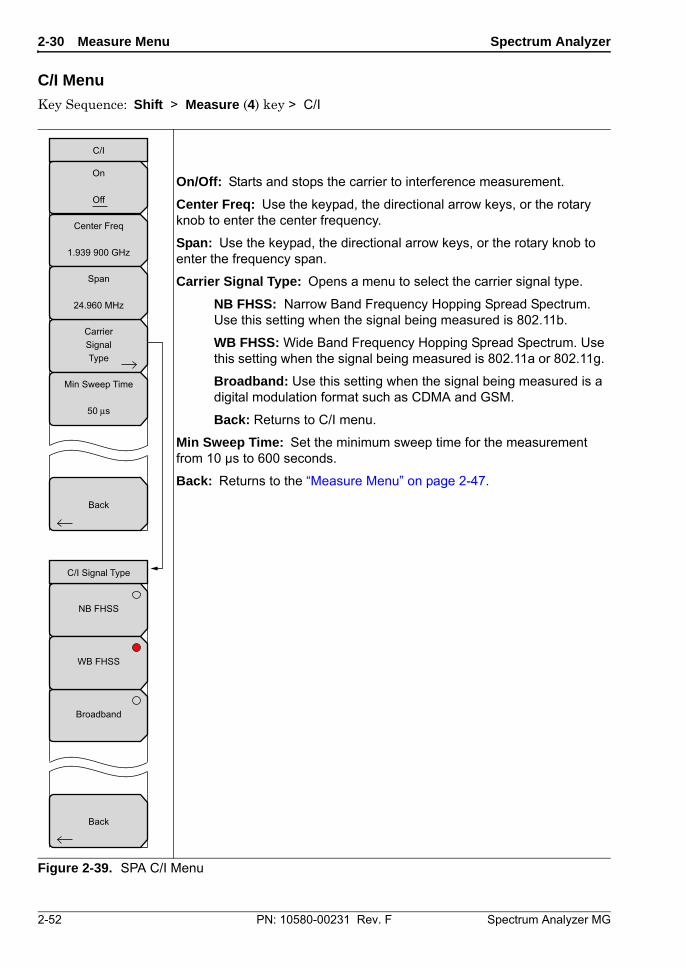
2-30 Measure Menu Spectrum Analyzer
2-52 PN: 10580-00231 Rev. F Spectrum Analyzer MG
C/I Menu
Key Sequence: Shift > Measure (4) key > C/I
On/Off: Starts and stops the carrier to interference measurement.
Center Freq: Use the keypad, the directional arrow keys, or the rotary knob to enter the center frequency.
Span: Use the keypad, the directional arrow keys, or the rotary knob to enter the frequency span.
Carrier Signal Type: Opens a menu to select the carrier signal type.
NB FHSS: Narrow Band Frequency Hopping Spread Spectrum. Use this setting when the signal being measured is 802.11b.
WB FHSS: Wide Band Frequency Hopping Spread Spectrum. Use this setting when the signal being measured is 802.11a or 802.11g.
Broadband: Use this setting when the signal being measured is a digital modulation format such as CDMA and GSM.
Back: Returns to C/I menu.
Min Sweep Time: Set the minimum sweep time for the measurement from 10 µs to 600 seconds.
Back: Returns to the “Measure Menu” on page 2-47.
Figure 2-39. SPA C/I Menu
C/I
CarrierSignalType
Back
On
Off
Center Freq
1.939 900 GHz
Span
24.960 MHz
Min Sweep Time
50 s
NB FHSS
Broadband
WB FHSS
C/I Signal Type
Back
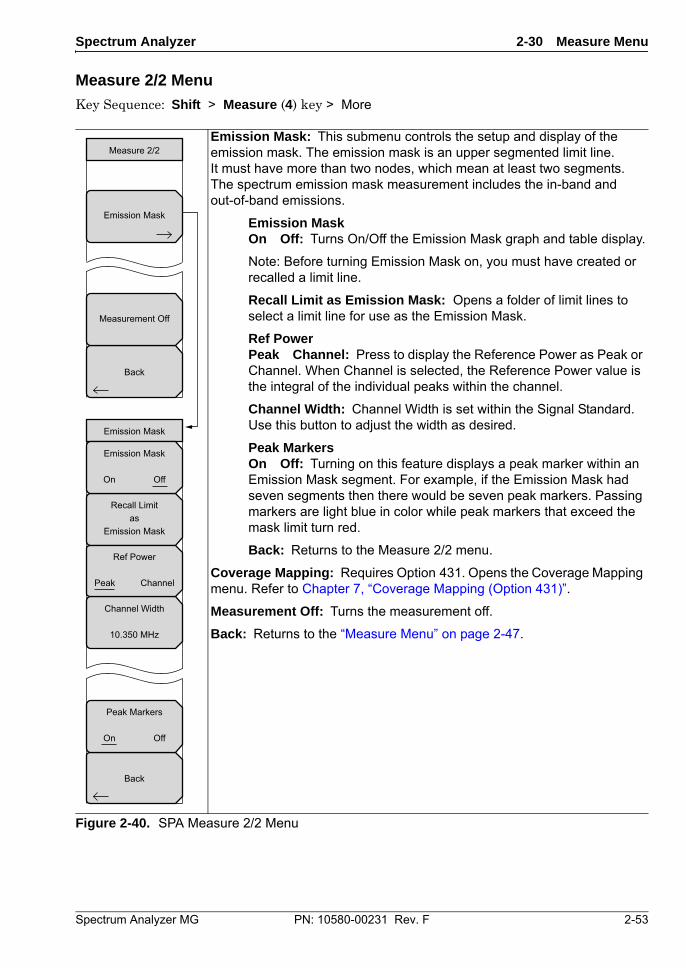
Spectrum Analyzer 2-30 Measure Menu
Spectrum Analyzer MG PN: 10580-00231 Rev. F 2-53
Measure 2/2 Menu
Key Sequence: Shift > Measure (4) key > More
Emission Mask: This submenu controls the setup and display of the emission mask. The emission mask is an upper segmented limit line. It must have more than two nodes, which mean at least two segments. The spectrum emission mask measurement includes the in-band and out-of-band emissions.
Emission MaskOn Off: Turns On/Off the Emission Mask graph and table display.
Note: Before turning Emission Mask on, you must have created or recalled a limit line.
Recall Limit as Emission Mask: Opens a folder of limit lines to select a limit line for use as the Emission Mask.
Ref PowerPeak Channel: Press to display the Reference Power as Peak or Channel. When Channel is selected, the Reference Power value is the integral of the individual peaks within the channel.
Channel Width: Channel Width is set within the Signal Standard. Use this button to adjust the width as desired.
Peak MarkersOn Off: Turning on this feature displays a peak marker within an Emission Mask segment. For example, if the Emission Mask had seven segments then there would be seven peak markers. Passing markers are light blue in color while peak markers that exceed the mask limit turn red.
Back: Returns to the Measure 2/2 menu.
Coverage Mapping: Requires Option 431. Opens the Coverage Mapping menu. Refer to Chapter 7, “Coverage Mapping (Option 431)”.
Measurement Off: Turns the measurement off.
Back: Returns to the “Measure Menu” on page 2-47.
Figure 2-40. SPA Measure 2/2 Menu
Emission Mask
Measure 2/2
Back
Measurement Off
Recall Limitas
Emission Mask
Channel Width
10.350 MHz
Emission Mask
Back
Emission Mask
On Off
Peak Markers
On Off
Ref Power
Peak Channel
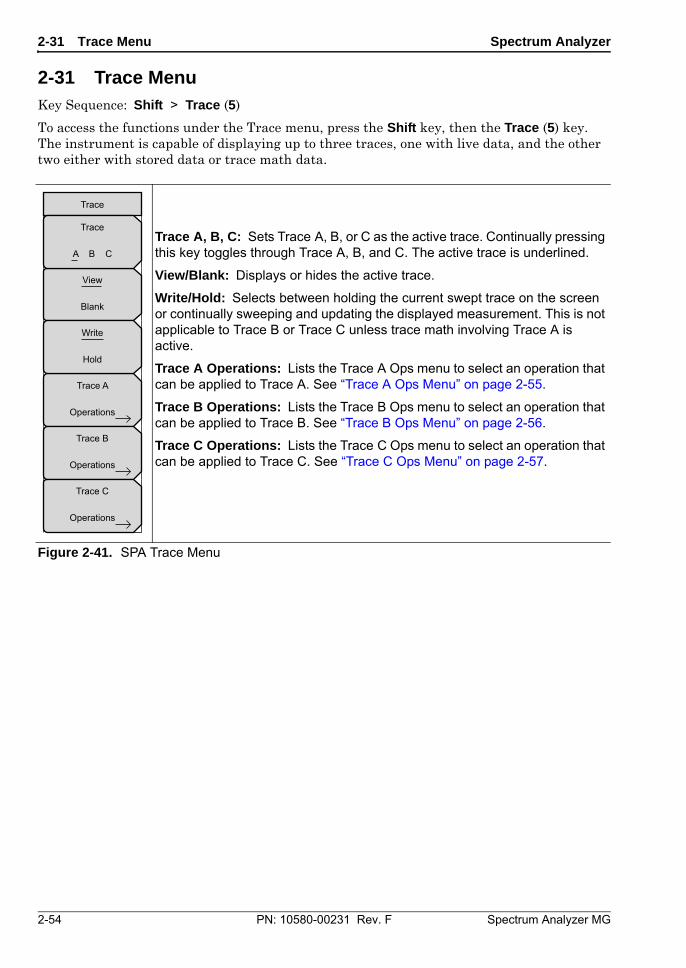
2-31 Trace Menu Spectrum Analyzer
2-54 PN: 10580-00231 Rev. F Spectrum Analyzer MG
2-31 Trace Menu Key Sequence: Shift > Trace (5)
To access the functions under the Trace menu, press the Shift key, then the Trace (5) key. The instrument is capable of displaying up to three traces, one with live data, and the other two either with stored data or trace math data.
Trace A, B, C: Sets Trace A, B, or C as the active trace. Continually pressing this key toggles through Trace A, B, and C. The active trace is underlined.
View/Blank: Displays or hides the active trace.
Write/Hold: Selects between holding the current swept trace on the screen or continually sweeping and updating the displayed measurement. This is not applicable to Trace B or Trace C unless trace math involving Trace A is active.
Trace A Operations: Lists the Trace A Ops menu to select an operation that can be applied to Trace A. See “Trace A Ops Menu” on page 2-55.
Trace B Operations: Lists the Trace B Ops menu to select an operation that can be applied to Trace B. See “Trace B Ops Menu” on page 2-56.
Trace C Operations: Lists the Trace C Ops menu to select an operation that can be applied to Trace C. See “Trace C Ops Menu” on page 2-57.
Figure 2-41. SPA Trace Menu
Trace
Trace A
Operations
Trace B
Operations
Trace C
Operations
View
Blank
Trace
A B C
Write
Hold
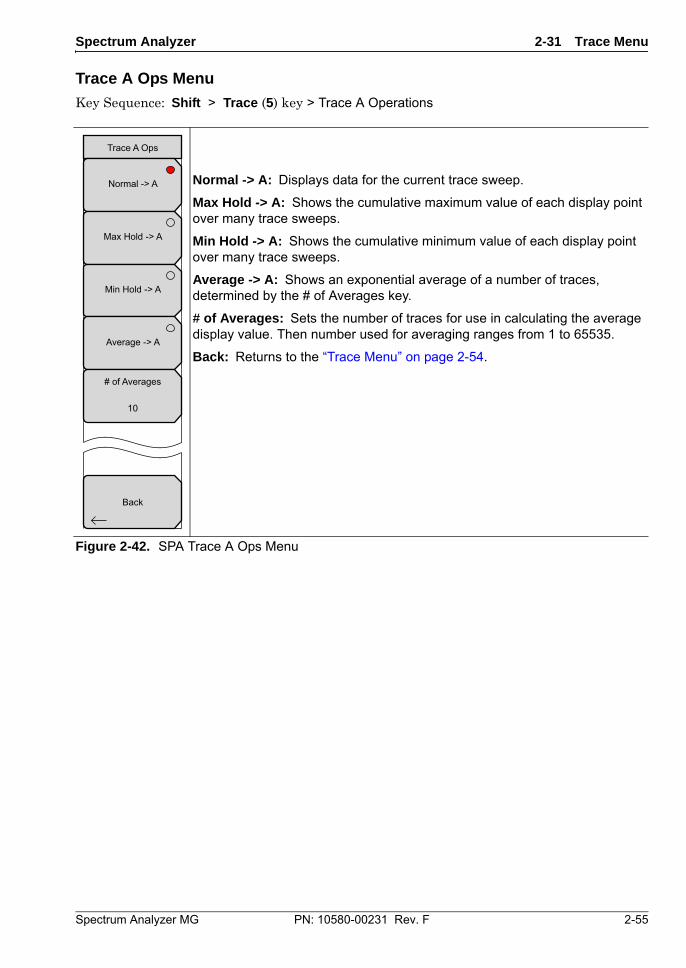
Spectrum Analyzer 2-31 Trace Menu
Spectrum Analyzer MG PN: 10580-00231 Rev. F 2-55
Trace A Ops Menu
Key Sequence: Shift > Trace (5) key > Trace A Operations
Normal -> A: Displays data for the current trace sweep.
Max Hold -> A: Shows the cumulative maximum value of each display point over many trace sweeps.
Min Hold -> A: Shows the cumulative minimum value of each display point over many trace sweeps.
Average -> A: Shows an exponential average of a number of traces, determined by the # of Averages key.
# of Averages: Sets the number of traces for use in calculating the average display value. Then number used for averaging ranges from 1 to 65535.
Back: Returns to the “Trace Menu” on page 2-54.
Figure 2-42. SPA Trace A Ops Menu
Trace A Ops
Back
Normal -> A
Max Hold -> A
Min Hold -> A
Average -> A
# of Averages
10
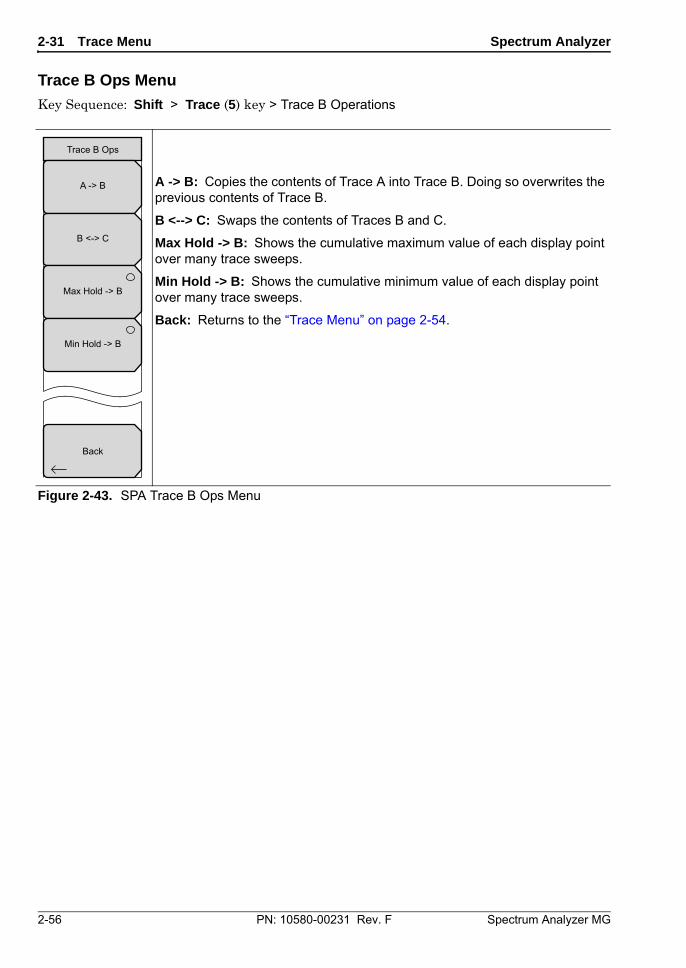
2-31 Trace Menu Spectrum Analyzer
2-56 PN: 10580-00231 Rev. F Spectrum Analyzer MG
Trace B Ops Menu
Key Sequence: Shift > Trace (5) key > Trace B Operations
A -> B: Copies the contents of Trace A into Trace B. Doing so overwrites the previous contents of Trace B.
B <--> C: Swaps the contents of Traces B and C.
Max Hold -> B: Shows the cumulative maximum value of each display point over many trace sweeps.
Min Hold -> B: Shows the cumulative minimum value of each display point over many trace sweeps.
Back: Returns to the “Trace Menu” on page 2-54.
Figure 2-43. SPA Trace B Ops Menu
Back
Trace B Ops
A -> B
B <-> C
Max Hold -> B
Min Hold -> B
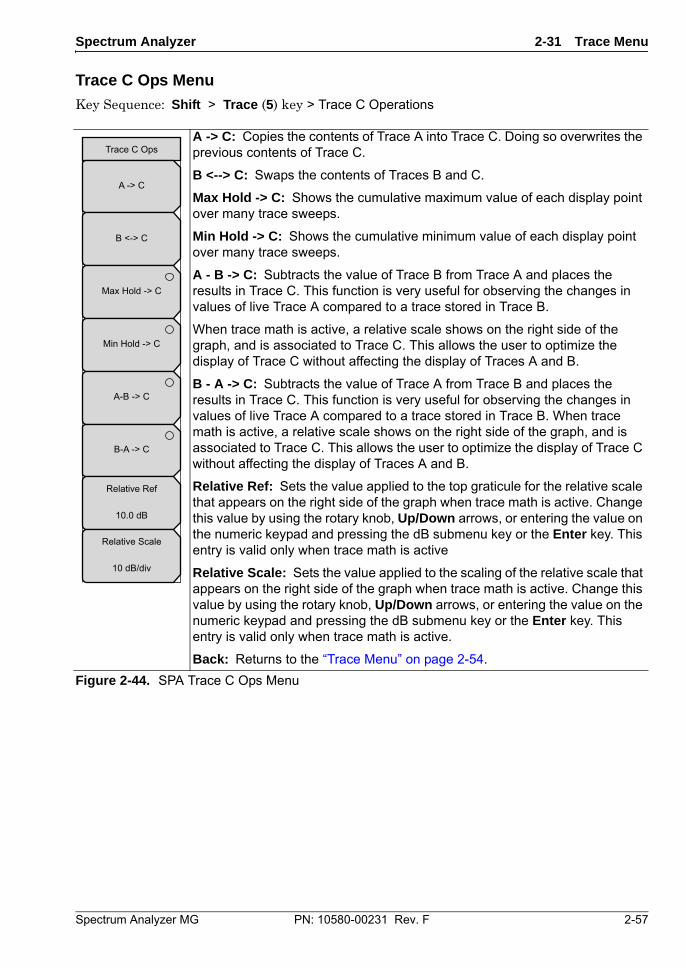
Spectrum Analyzer 2-31 Trace Menu
Spectrum Analyzer MG PN: 10580-00231 Rev. F 2-57
Trace C Ops Menu
Key Sequence: Shift > Trace (5) key > Trace C Operations
A -> C: Copies the contents of Trace A into Trace C. Doing so overwrites the previous contents of Trace C.
B <--> C: Swaps the contents of Traces B and C.
Max Hold -> C: Shows the cumulative maximum value of each display point over many trace sweeps.
Min Hold -> C: Shows the cumulative minimum value of each display point over many trace sweeps.
A - B -> C: Subtracts the value of Trace B from Trace A and places the results in Trace C. This function is very useful for observing the changes in values of live Trace A compared to a trace stored in Trace B.
When trace math is active, a relative scale shows on the right side of the graph, and is associated to Trace C. This allows the user to optimize the display of Trace C without affecting the display of Traces A and B.
B - A -> C: Subtracts the value of Trace A from Trace B and places the results in Trace C. This function is very useful for observing the changes in values of live Trace A compared to a trace stored in Trace B. When trace math is active, a relative scale shows on the right side of the graph, and is associated to Trace C. This allows the user to optimize the display of Trace C without affecting the display of Traces A and B.
Relative Ref: Sets the value applied to the top graticule for the relative scale that appears on the right side of the graph when trace math is active. Change this value by using the rotary knob, Up/Down arrows, or entering the value on the numeric keypad and pressing the dB submenu key or the Enter key. This entry is valid only when trace math is active
Relative Scale: Sets the value applied to the scaling of the relative scale that appears on the right side of the graph when trace math is active. Change this value by using the rotary knob, Up/Down arrows, or entering the value on the numeric keypad and pressing the dB submenu key or the Enter key. This entry is valid only when trace math is active.
Back: Returns to the “Trace Menu” on page 2-54.
Figure 2-44. SPA Trace C Ops Menu
Trace C Ops
A -> C
B <-> C
Max Hold -> C
Min Hold -> C
A-B -> C
B-A -> C
Relative Ref
10.0 dB
Relative Scale
10 dB/div
2-32 Limit Menu Spectrum Analyzer
2-58 PN: 10580-00231 Rev. F Spectrum Analyzer MG
2-32 Limit Menu Key Sequence: Shift > Limit (6) key
The Limit menu keys are shown in the following figures.
Two types of limit lines can be specified, lower limit lines and upper limit lines. Limit lines can be used for visual reference only, or for pass/fail criteria using the limit alarm (Figure 2-45). Limit alarm failures are reported whenever a signal is above the upper limit line or below the lower limit line. By using save-on-event, a signal that causes a limit alarm can be automatically saved. See the User Guide for details.
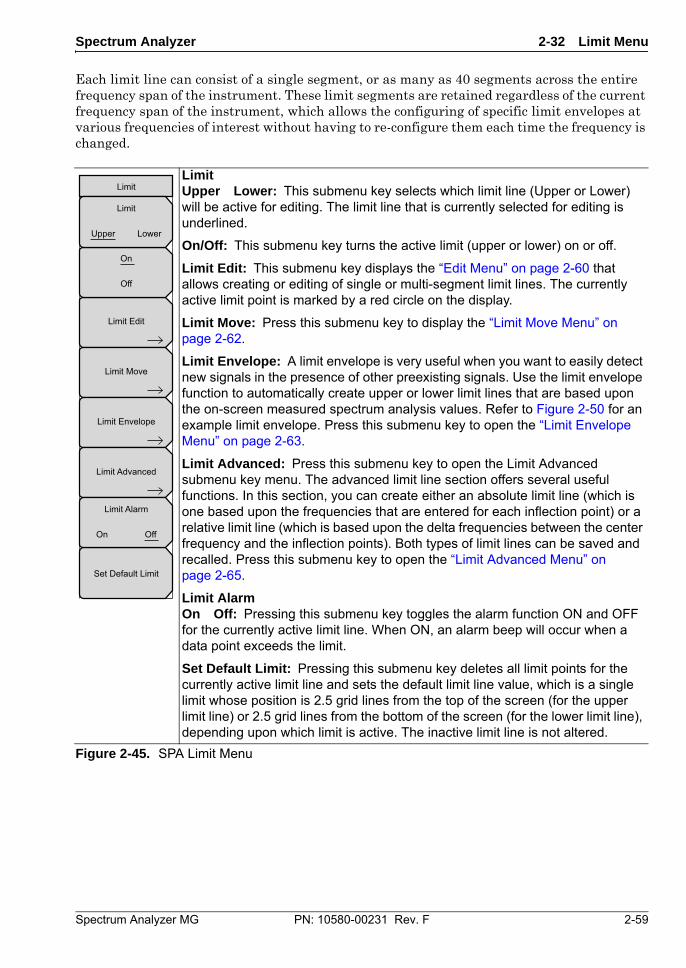
Spectrum Analyzer 2-32 Limit Menu
Spectrum Analyzer MG PN: 10580-00231 Rev. F 2-59
Each limit line can consist of a single segment, or as many as 40 segments across the entire frequency span of the instrument. These limit segments are retained regardless of the current frequency span of the instrument, which allows the configuring of specific limit envelopes at various frequencies of interest without having to re-configure them each time the frequency is changed.
LimitUpper Lower: This submenu key selects which limit line (Upper or Lower) will be active for editing. The limit line that is currently selected for editing is underlined.
On/Off: This submenu key turns the active limit (upper or lower) on or off.
Limit Edit: This submenu key displays the “Edit Menu” on page 2-60 that allows creating or editing of single or multi-segment limit lines. The currently active limit point is marked by a red circle on the display.
Limit Move: Press this submenu key to display the “Limit Move Menu” on page 2-62.
Limit Envelope: A limit envelope is very useful when you want to easily detect new signals in the presence of other preexisting signals. Use the limit envelope function to automatically create upper or lower limit lines that are based upon the on-screen measured spectrum analysis values. Refer to Figure 2-50 for an example limit envelope. Press this submenu key to open the “Limit Envelope Menu” on page 2-63.
Limit Advanced: Press this submenu key to open the Limit Advanced submenu key menu. The advanced limit line section offers several useful functions. In this section, you can create either an absolute limit line (which is one based upon the frequencies that are entered for each inflection point) or a relative limit line (which is based upon the delta frequencies between the center frequency and the inflection points). Both types of limit lines can be saved and recalled. Press this submenu key to open the “Limit Advanced Menu” on page 2-65.
Limit AlarmOn Off: Pressing this submenu key toggles the alarm function ON and OFF for the currently active limit line. When ON, an alarm beep will occur when a data point exceeds the limit.
Set Default Limit: Pressing this submenu key deletes all limit points for the currently active limit line and sets the default limit line value, which is a single limit whose position is 2.5 grid lines from the top of the screen (for the upper limit line) or 2.5 grid lines from the bottom of the screen (for the lower limit line), depending upon which limit is active. The inactive limit line is not altered.
Figure 2-45. SPA Limit Menu
Limit
Set Default Limit
Limit Edit
Limit Move
Limit Envelope
Limit Advanced
On
Off
Limit Alarm
On Off
Limit
Upper Lower
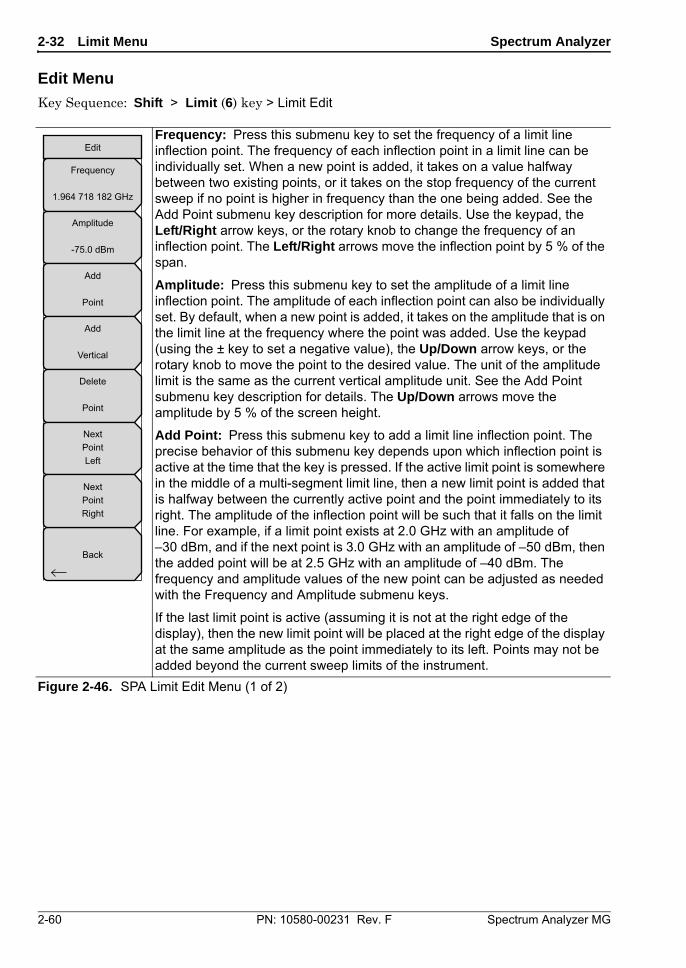
2-32 Limit Menu Spectrum Analyzer
2-60 PN: 10580-00231 Rev. F Spectrum Analyzer MG
Edit Menu
Key Sequence: Shift > Limit (6) key > Limit Edit
Frequency: Press this submenu key to set the frequency of a limit line inflection point. The frequency of each inflection point in a limit line can be individually set. When a new point is added, it takes on a value halfway between two existing points, or it takes on the stop frequency of the current sweep if no point is higher in frequency than the one being added. See the Add Point submenu key description for more details. Use the keypad, the Left/Right arrow keys, or the rotary knob to change the frequency of an inflection point. The Left/Right arrows move the inflection point by 5 % of the span.
Amplitude: Press this submenu key to set the amplitude of a limit line inflection point. The amplitude of each inflection point can also be individually set. By default, when a new point is added, it takes on the amplitude that is on the limit line at the frequency where the point was added. Use the keypad (using the ± key to set a negative value), the Up/Down arrow keys, or the rotary knob to move the point to the desired value. The unit of the amplitude limit is the same as the current vertical amplitude unit. See the Add Point submenu key description for details. The Up/Down arrows move the amplitude by 5 % of the screen height.
Add Point: Press this submenu key to add a limit line inflection point. The precise behavior of this submenu key depends upon which inflection point is active at the time that the key is pressed. If the active limit point is somewhere in the middle of a multi-segment limit line, then a new limit point is added that is halfway between the currently active point and the point immediately to its right. The amplitude of the inflection point will be such that it falls on the limit line. For example, if a limit point exists at 2.0 GHz with an amplitude of –30 dBm, and if the next point is 3.0 GHz with an amplitude of –50 dBm, then the added point will be at 2.5 GHz with an amplitude of –40 dBm. The frequency and amplitude values of the new point can be adjusted as needed with the Frequency and Amplitude submenu keys.
If the last limit point is active (assuming it is not at the right edge of the display), then the new limit point will be placed at the right edge of the display at the same amplitude as the point immediately to its left. Points may not be added beyond the current sweep limits of the instrument.
Figure 2-46. SPA Limit Edit Menu (1 of 2)
Edit
Back
Frequency
1.964 718 182 GHz
Amplitude
-75.0 dBm
Add
Point
Add
Vertical
Delete
Point
NextPointLeft
NextPointRight
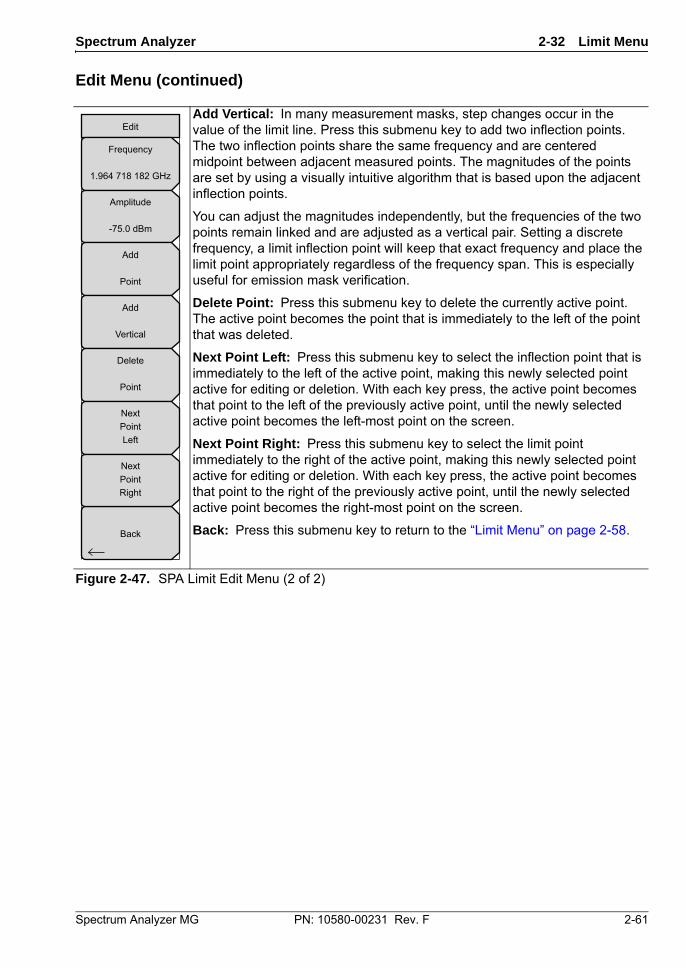
Spectrum Analyzer 2-32 Limit Menu
Spectrum Analyzer MG PN: 10580-00231 Rev. F 2-61
Edit Menu (continued)
Add Vertical: In many measurement masks, step changes occur in the value of the limit line. Press this submenu key to add two inflection points. The two inflection points share the same frequency and are centered midpoint between adjacent measured points. The magnitudes of the points are set by using a visually intuitive algorithm that is based upon the adjacent inflection points.
You can adjust the magnitudes independently, but the frequencies of the two points remain linked and are adjusted as a vertical pair. Setting a discrete frequency, a limit inflection point will keep that exact frequency and place the limit point appropriately regardless of the frequency span. This is especially useful for emission mask verification.
Delete Point: Press this submenu key to delete the currently active point. The active point becomes the point that is immediately to the left of the point that was deleted.
Next Point Left: Press this submenu key to select the inflection point that is immediately to the left of the active point, making this newly selected point active for editing or deletion. With each key press, the active point becomes that point to the left of the previously active point, until the newly selected active point becomes the left-most point on the screen.
Next Point Right: Press this submenu key to select the limit point immediately to the right of the active point, making this newly selected point active for editing or deletion. With each key press, the active point becomes that point to the right of the previously active point, until the newly selected active point becomes the right-most point on the screen.
Back: Press this submenu key to return to the “Limit Menu” on page 2-58.
Figure 2-47. SPA Limit Edit Menu (2 of 2)
Edit
Back
Frequency
1.964 718 182 GHz
Amplitude
-75.0 dBm
Add
Point
Add
Vertical
Delete
Point
NextPointLeft
NextPointRight
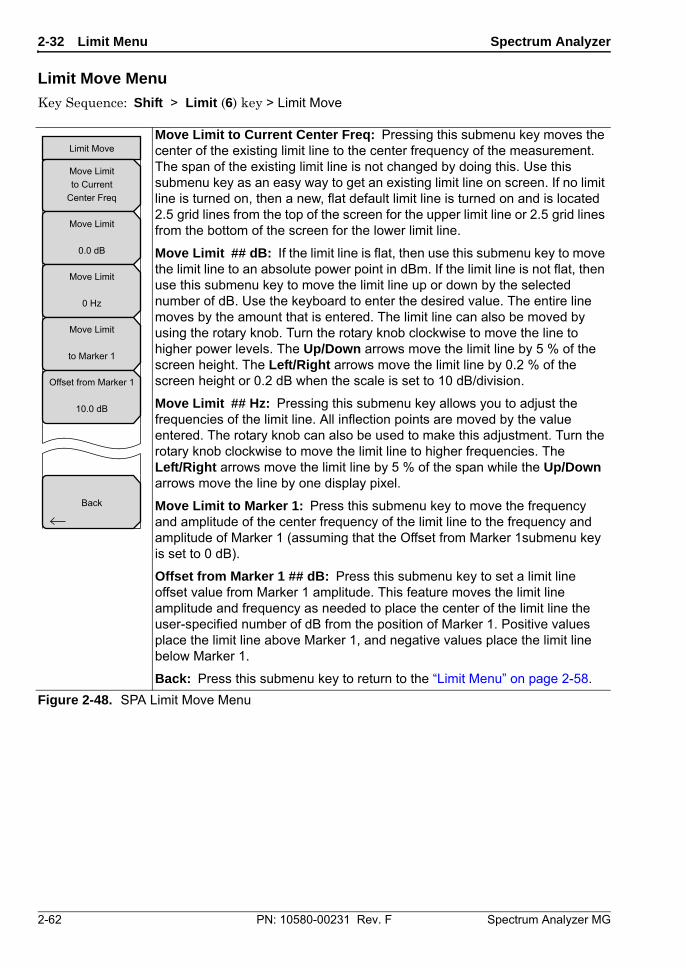
2-32 Limit Menu Spectrum Analyzer
2-62 PN: 10580-00231 Rev. F Spectrum Analyzer MG
Limit Move Menu
Key Sequence: Shift > Limit (6) key > Limit Move
Move Limit to Current Center Freq: Pressing this submenu key moves the center of the existing limit line to the center frequency of the measurement. The span of the existing limit line is not changed by doing this. Use this submenu key as an easy way to get an existing limit line on screen. If no limit line is turned on, then a new, flat default limit line is turned on and is located 2.5 grid lines from the top of the screen for the upper limit line or 2.5 grid lines from the bottom of the screen for the lower limit line.
Move Limit ## dB: If the limit line is flat, then use this submenu key to move the limit line to an absolute power point in dBm. If the limit line is not flat, then use this submenu key to move the limit line up or down by the selected number of dB. Use the keyboard to enter the desired value. The entire line moves by the amount that is entered. The limit line can also be moved by using the rotary knob. Turn the rotary knob clockwise to move the line to higher power levels. The Up/Down arrows move the limit line by 5 % of the screen height. The Left/Right arrows move the limit line by 0.2 % of the screen height or 0.2 dB when the scale is set to 10 dB/division.
Move Limit ## Hz: Pressing this submenu key allows you to adjust the frequencies of the limit line. All inflection points are moved by the value entered. The rotary knob can also be used to make this adjustment. Turn the rotary knob clockwise to move the limit line to higher frequencies. The Left/Right arrows move the limit line by 5 % of the span while the Up/Down arrows move the line by one display pixel.
Move Limit to Marker 1: Press this submenu key to move the frequency and amplitude of the center frequency of the limit line to the frequency and amplitude of Marker 1 (assuming that the Offset from Marker 1submenu key is set to 0 dB).
Offset from Marker 1 ## dB: Press this submenu key to set a limit line offset value from Marker 1 amplitude. This feature moves the limit line amplitude and frequency as needed to place the center of the limit line the user-specified number of dB from the position of Marker 1. Positive values place the limit line above Marker 1, and negative values place the limit line below Marker 1.
Back: Press this submenu key to return to the “Limit Menu” on page 2-58.
Figure 2-48. SPA Limit Move Menu
Back
Limit Move
Move Limitto Current
Center Freq
Move Limit
0.0 dB
Move Limit
0 Hz
Move Limit
to Marker 1
Offset from Marker 1
10.0 dB
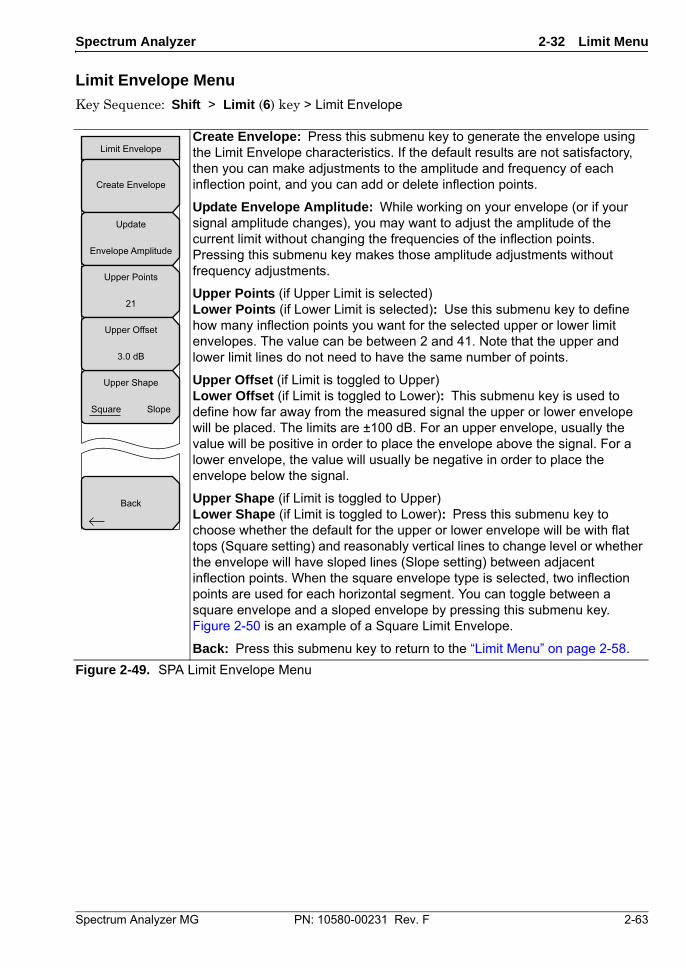
Spectrum Analyzer 2-32 Limit Menu
Spectrum Analyzer MG PN: 10580-00231 Rev. F 2-63
Limit Envelope Menu
Key Sequence: Shift > Limit (6) key > Limit Envelope
Create Envelope: Press this submenu key to generate the envelope using the Limit Envelope characteristics. If the default results are not satisfactory, then you can make adjustments to the amplitude and frequency of each inflection point, and you can add or delete inflection points.
Update Envelope Amplitude: While working on your envelope (or if your signal amplitude changes), you may want to adjust the amplitude of the current limit without changing the frequencies of the inflection points. Pressing this submenu key makes those amplitude adjustments without frequency adjustments.
Upper Points (if Upper Limit is selected)Lower Points (if Lower Limit is selected): Use this submenu key to define how many inflection points you want for the selected upper or lower limit envelopes. The value can be between 2 and 41. Note that the upper and lower limit lines do not need to have the same number of points.
Upper Offset (if Limit is toggled to Upper)Lower Offset (if Limit is toggled to Lower): This submenu key is used to define how far away from the measured signal the upper or lower envelope will be placed. The limits are ±100 dB. For an upper envelope, usually the value will be positive in order to place the envelope above the signal. For a lower envelope, the value will usually be negative in order to place the envelope below the signal.
Upper Shape (if Limit is toggled to Upper)Lower Shape (if Limit is toggled to Lower): Press this submenu key to choose whether the default for the upper or lower envelope will be with flat tops (Square setting) and reasonably vertical lines to change level or whether the envelope will have sloped lines (Slope setting) between adjacent inflection points. When the square envelope type is selected, two inflection points are used for each horizontal segment. You can toggle between a square envelope and a sloped envelope by pressing this submenu key. Figure 2-50 is an example of a Square Limit Envelope.
Back: Press this submenu key to return to the “Limit Menu” on page 2-58.
Figure 2-49. SPA Limit Envelope Menu
Upper Shape
Square Slope
Limit Envelope
Back
Create Envelope
Update
Envelope Amplitude
Upper Points
21
Upper Offset
3.0 dB
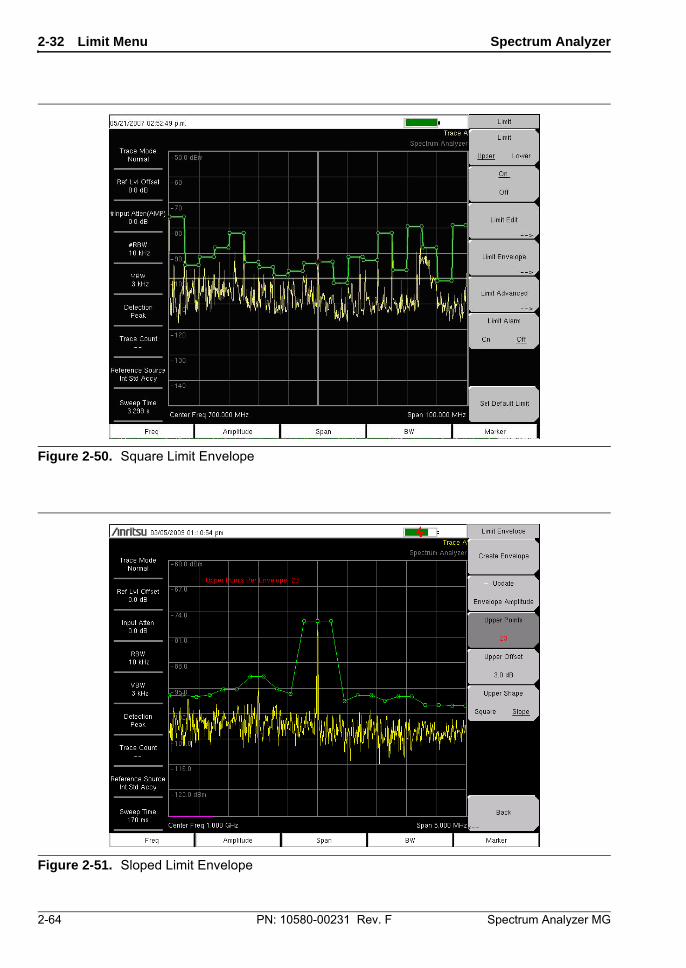
2-32 Limit Menu Spectrum Analyzer
2-64 PN: 10580-00231 Rev. F Spectrum Analyzer MG
Figure 2-50. Square Limit Envelope
Figure 2-51. Sloped Limit Envelope
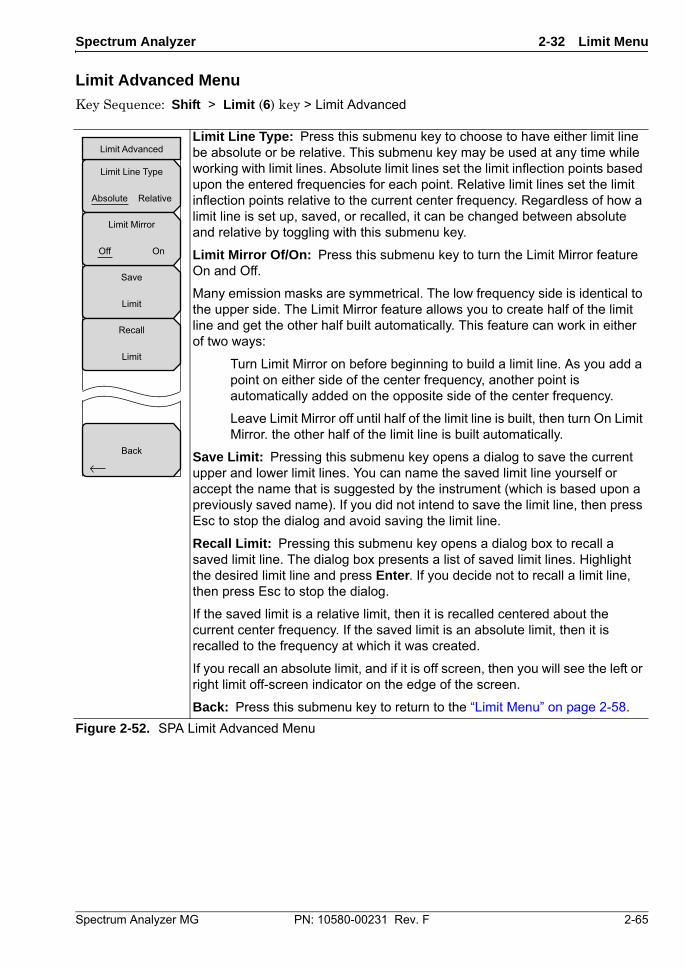
Spectrum Analyzer 2-32 Limit Menu
Spectrum Analyzer MG PN: 10580-00231 Rev. F 2-65
Limit Advanced Menu
Key Sequence: Shift > Limit (6) key > Limit Advanced
Limit Line Type: Press this submenu key to choose to have either limit line be absolute or be relative. This submenu key may be used at any time while working with limit lines. Absolute limit lines set the limit inflection points based upon the entered frequencies for each point. Relative limit lines set the limit inflection points relative to the current center frequency. Regardless of how a limit line is set up, saved, or recalled, it can be changed between absolute and relative by toggling with this submenu key.
Limit Mirror Of/On: Press this submenu key to turn the Limit Mirror feature On and Off.
Many emission masks are symmetrical. The low frequency side is identical to the upper side. The Limit Mirror feature allows you to create half of the limit line and get the other half built automatically. This feature can work in either of two ways:
Turn Limit Mirror on before beginning to build a limit line. As you add a point on either side of the center frequency, another point is automatically added on the opposite side of the center frequency.
Leave Limit Mirror off until half of the limit line is built, then turn On Limit Mirror. the other half of the limit line is built automatically.
Save Limit: Pressing this submenu key opens a dialog to save the current upper and lower limit lines. You can name the saved limit line yourself or accept the name that is suggested by the instrument (which is based upon a previously saved name). If you did not intend to save the limit line, then press Esc to stop the dialog and avoid saving the limit line.
Recall Limit: Pressing this submenu key opens a dialog box to recall a saved limit line. The dialog box presents a list of saved limit lines. Highlight the desired limit line and press Enter. If you decide not to recall a limit line, then press Esc to stop the dialog.
If the saved limit is a relative limit, then it is recalled centered about the current center frequency. If the saved limit is an absolute limit, then it is recalled to the frequency at which it was created.
If you recall an absolute limit, and if it is off screen, then you will see the left or right limit off-screen indicator on the edge of the screen.
Back: Press this submenu key to return to the “Limit Menu” on page 2-58.
Figure 2-52. SPA Limit Advanced Menu
Limit Line Type
Absolute Relative
Limit Advanced
Back
Save
Limit
Recall
Limit
Limit Mirror
Off On
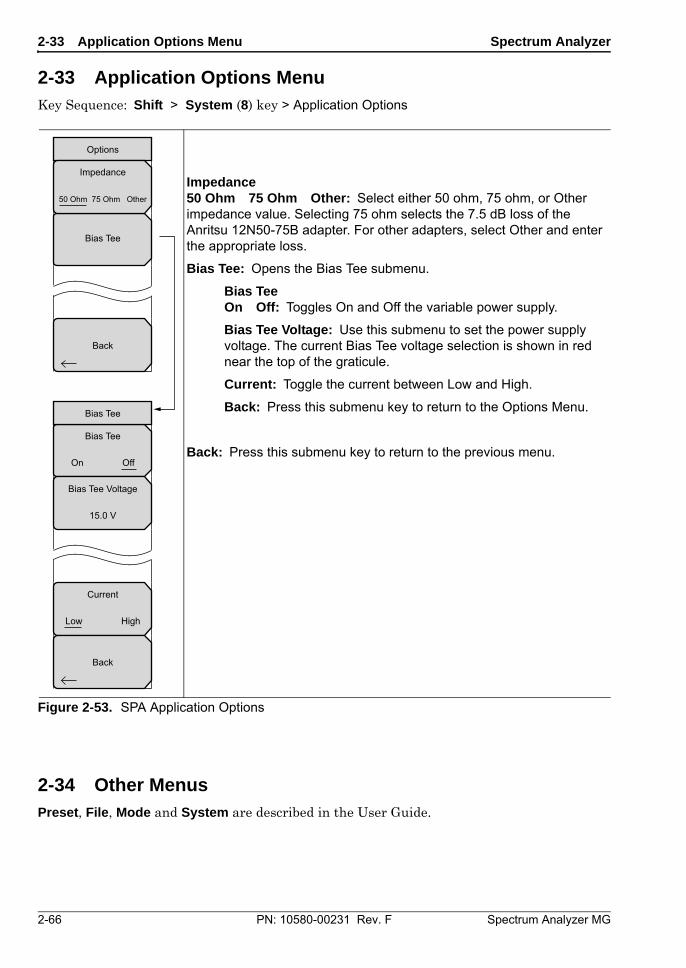
2-33 Application Options Menu Spectrum Analyzer
2-66 PN: 10580-00231 Rev. F Spectrum Analyzer MG
2-33 Application Options Menu Key Sequence: Shift > System (8) key > Application Options
2-34 Other MenusPreset, File, Mode and System are described in the User Guide.
Impedance50 Ohm 75 Ohm Other: Select either 50 ohm, 75 ohm, or Other impedance value. Selecting 75 ohm selects the 7.5 dB loss of the Anritsu 12N50-75B adapter. For other adapters, select Other and enter the appropriate loss.
Bias Tee: Opens the Bias Tee submenu.
Bias TeeOn Off: Toggles On and Off the variable power supply.
Bias Tee Voltage: Use this submenu to set the power supply voltage. The current Bias Tee voltage selection is shown in red near the top of the graticule.
Current: Toggle the current between Low and High.
Back: Press this submenu key to return to the Options Menu.
Back: Press this submenu key to return to the previous menu.
Figure 2-53. SPA Application Options
Options
Bias Tee
Impedance
50 Ohm 75 Ohm Other
Bias Tee
On Off
Current
Low High
Bias Tee
Back
Bias Tee Voltage
15.0 V
Back
Spectrum Analyzer MG PN: 10580-00231 Rev. F 3-1
Chapter 3 — LMR Master CW Signal Generator
3-1 IntroductionThis chapter presents information on the operation of the LMR Master S412E CW Signal Generator.
The CW Signal Generator provides a continuous wave (CW) signal from the Signal Generator Out port of the instrument.
NoteThe information in this chapter ONLY applies to the LMR Master S412E.
Instruments with Option 28, CW Generator should refer to Chapter 6.
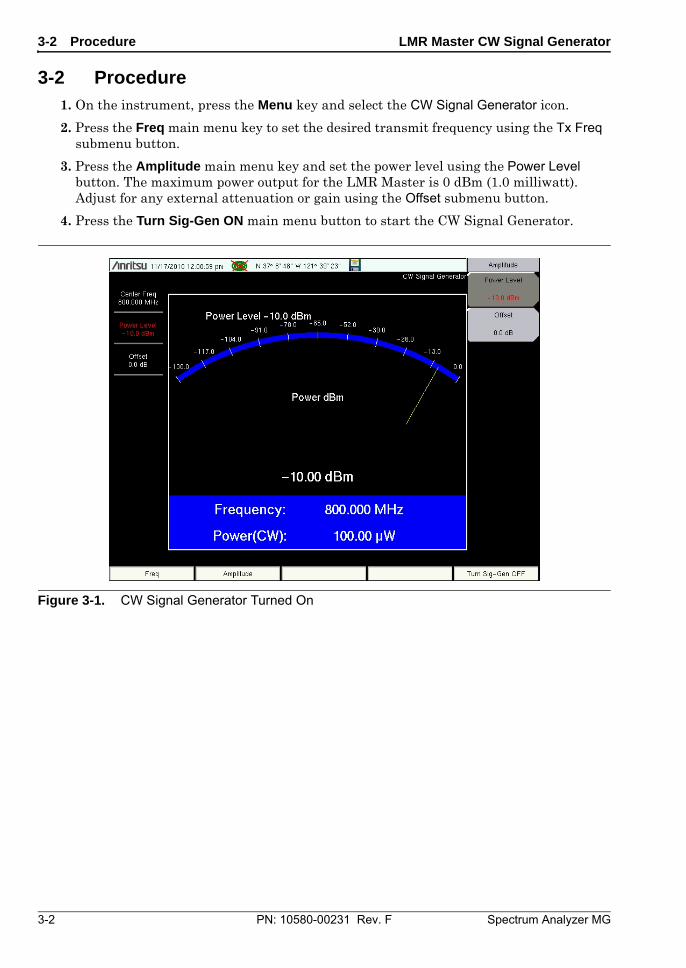
3-2 Procedure LMR Master CW Signal Generator
3-2 PN: 10580-00231 Rev. F Spectrum Analyzer MG
3-2 Procedure1. On the instrument, press the Menu key and select the CW Signal Generator icon.
2. Press the Freq main menu key to set the desired transmit frequency using the Tx Freq submenu button.
3. Press the Amplitude main menu key and set the power level using the Power Level button. The maximum power output for the LMR Master is 0 dBm (1.0 milliwatt). Adjust for any external attenuation or gain using the Offset submenu button.
4. Press the Turn Sig-Gen ON main menu button to start the CW Signal Generator.
Figure 3-1. CW Signal Generator Turned On
Spectrum Analyzer MG PN: 10580-00231 Rev. F 4-1
Chapter 4 — Interference Analyzer (Option 25)
4-1 IntroductionMany wireless networks operate in complicated signal environments. Three or four base station antennas may be located on the same tower, and can create interference problems, which can affect system capacity and coverage.
The Interference Analyzer (option 25) adds five measurement capabilities to the spectrum analyzer:
• Section 4-4 “Spectrogram” on page 4-2
• Section 4-5 “Signal Strength” on page 4-4
• Section 4-6 “Received Signal Strength Indicator (RSSI)” on page 4-5
• Section 4-7 “Signal ID” on page 4-6
• Section 4-8 “Interference Mapping” on page 4-9
The instrument also has a spectrum mode which displays signals in a traditional spectrumanalyzer view.
4-2 General Measurement Setups Please refer to your User Guide for selecting the Interference Analysis mode, setting up frequency, span, amplitude, GPS, limit lines, markers, and file management.
4-3 SpectrumIn Spectrum Analyzer mode, smart one-button measurements are built-in for field strength, occupied bandwidth, channel power, adjacent channel power ratio, and carrier to interference ratio (C/I) tests. In addition, AM/FM/SSB demodulation is available to aid in the identification of interfering signals. This section presents brief examples demonstrating the use of these measurements.
Press the Measurements main menu key followed by the Spectrum submenu key. Refer to “Field Measurements” on page 2-11 for further spectrum measurement procedures.
NoteSet the instrument to Interference Analyzer mode for all the measurements in this chapter.
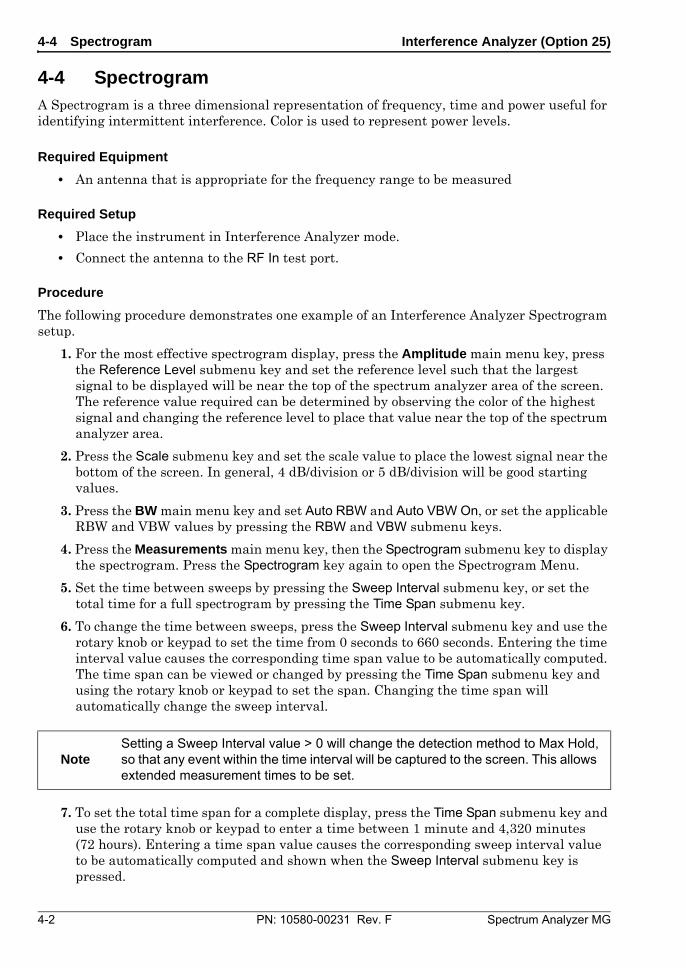
4-4 Spectrogram Interference Analyzer (Option 25)
4-2 PN: 10580-00231 Rev. F Spectrum Analyzer MG
4-4 Spectrogram A Spectrogram is a three dimensional representation of frequency, time and power useful for identifying intermittent interference. Color is used to represent power levels.
Required Equipment
• An antenna that is appropriate for the frequency range to be measured
Required Setup
• Place the instrument in Interference Analyzer mode.
• Connect the antenna to the RF In test port.
Procedure
The following procedure demonstrates one example of an Interference Analyzer Spectrogram setup.
1. For the most effective spectrogram display, press the Amplitude main menu key, press the Reference Level submenu key and set the reference level such that the largest signal to be displayed will be near the top of the spectrum analyzer area of the screen. The reference value required can be determined by observing the color of the highest signal and changing the reference level to place that value near the top of the spectrum analyzer area.
2. Press the Scale submenu key and set the scale value to place the lowest signal near the bottom of the screen. In general, 4 dB/division or 5 dB/division will be good starting values.
3. Press the BW main menu key and set Auto RBW and Auto VBW On, or set the applicable RBW and VBW values by pressing the RBW and VBW submenu keys.
4. Press the Measurements main menu key, then the Spectrogram submenu key to display the spectrogram. Press the Spectrogram key again to open the Spectrogram Menu.
5. Set the time between sweeps by pressing the Sweep Interval submenu key, or set the total time for a full spectrogram by pressing the Time Span submenu key.
6. To change the time between sweeps, press the Sweep Interval submenu key and use the rotary knob or keypad to set the time from 0 seconds to 660 seconds. Entering the time interval value causes the corresponding time span value to be automatically computed. The time span can be viewed or changed by pressing the Time Span submenu key and using the rotary knob or keypad to set the span. Changing the time span will automatically change the sweep interval.
7. To set the total time span for a complete display, press the Time Span submenu key and use the rotary knob or keypad to enter a time between 1 minute and 4,320 minutes (72 hours). Entering a time span value causes the corresponding sweep interval value to be automatically computed and shown when the Sweep Interval submenu key is pressed.
NoteSetting a Sweep Interval value > 0 will change the detection method to Max Hold, so that any event within the time interval will be captured to the screen. This allows extended measurement times to be set.
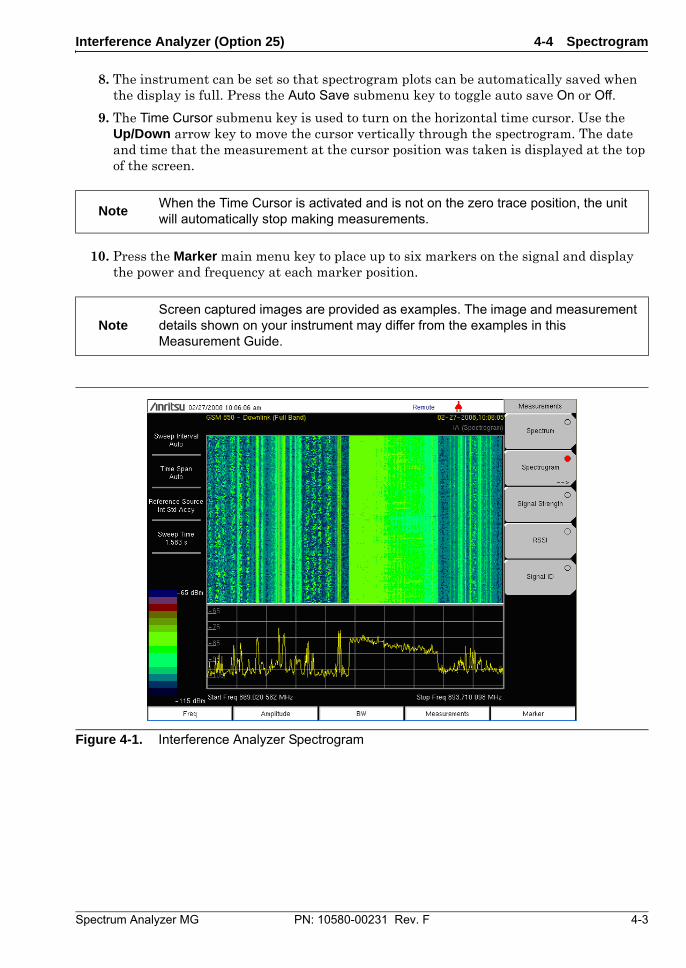
Interference Analyzer (Option 25) 4-4 Spectrogram
Spectrum Analyzer MG PN: 10580-00231 Rev. F 4-3
8. The instrument can be set so that spectrogram plots can be automatically saved when the display is full. Press the Auto Save submenu key to toggle auto save On or Off.
9. The Time Cursor submenu key is used to turn on the horizontal time cursor. Use the Up/Down arrow key to move the cursor vertically through the spectrogram. The date and time that the measurement at the cursor position was taken is displayed at the top of the screen.
10. Press the Marker main menu key to place up to six markers on the signal and display the power and frequency at each marker position.
NoteWhen the Time Cursor is activated and is not on the zero trace position, the unit will automatically stop making measurements.
NoteScreen captured images are provided as examples. The image and measurement details shown on your instrument may differ from the examples in this Measurement Guide.
Figure 4-1. Interference Analyzer Spectrogram
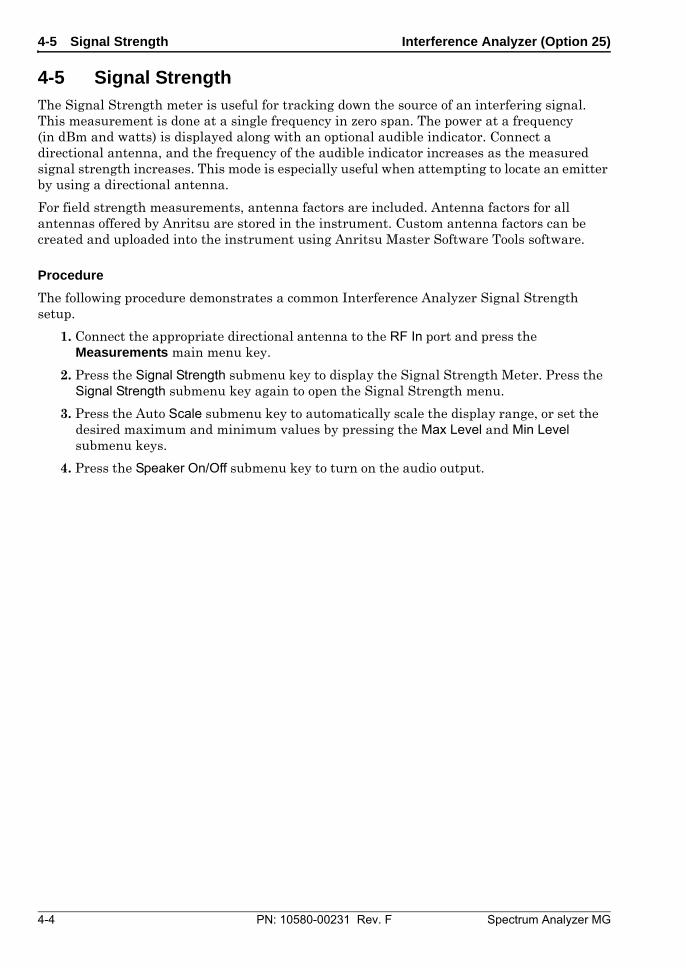
4-5 Signal Strength Interference Analyzer (Option 25)
4-4 PN: 10580-00231 Rev. F Spectrum Analyzer MG
4-5 Signal Strength The Signal Strength meter is useful for tracking down the source of an interfering signal. This measurement is done at a single frequency in zero span. The power at a frequency (in dBm and watts) is displayed along with an optional audible indicator. Connect a directional antenna, and the frequency of the audible indicator increases as the measured signal strength increases. This mode is especially useful when attempting to locate an emitter by using a directional antenna.
For field strength measurements, antenna factors are included. Antenna factors for all antennas offered by Anritsu are stored in the instrument. Custom antenna factors can be created and uploaded into the instrument using Anritsu Master Software Tools software.
Procedure
The following procedure demonstrates a common Interference Analyzer Signal Strength setup.
1. Connect the appropriate directional antenna to the RF In port and press the Measurements main menu key.
2. Press the Signal Strength submenu key to display the Signal Strength Meter. Press the Signal Strength submenu key again to open the Signal Strength menu.
3. Press the Auto Scale submenu key to automatically scale the display range, or set the desired maximum and minimum values by pressing the Max Level and Min Level submenu keys.
4. Press the Speaker On/Off submenu key to turn on the audio output.
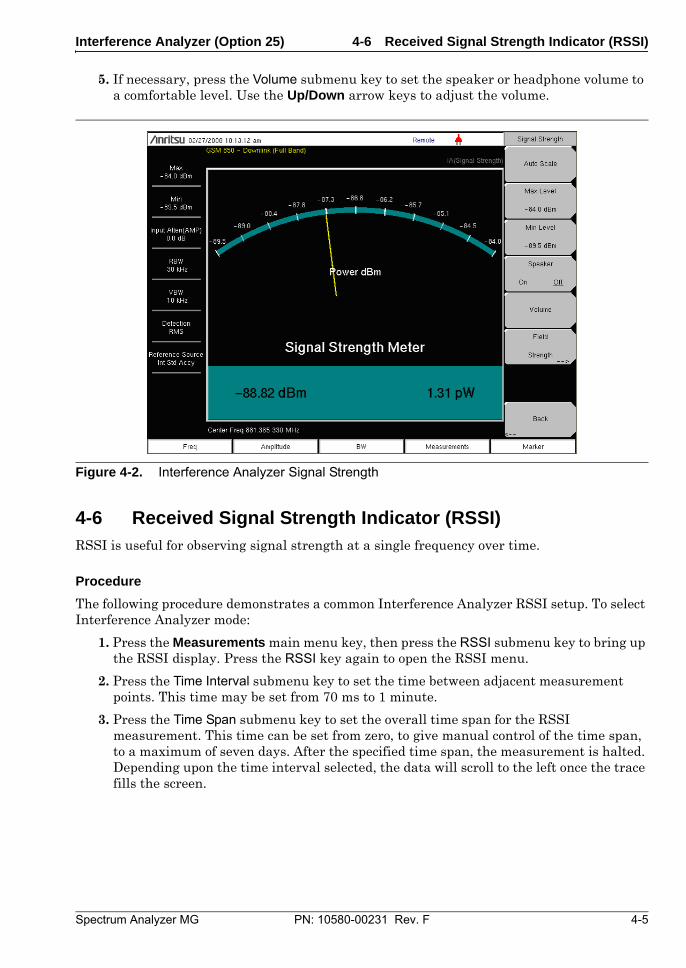
Interference Analyzer (Option 25) 4-6 Received Signal Strength Indicator (RSSI)
Spectrum Analyzer MG PN: 10580-00231 Rev. F 4-5
5. If necessary, press the Volume submenu key to set the speaker or headphone volume to a comfortable level. Use the Up/Down arrow keys to adjust the volume.
4-6 Received Signal Strength Indicator (RSSI) RSSI is useful for observing signal strength at a single frequency over time.
Procedure
The following procedure demonstrates a common Interference Analyzer RSSI setup. To select Interference Analyzer mode:
1. Press the Measurements main menu key, then press the RSSI submenu key to bring up the RSSI display. Press the RSSI key again to open the RSSI menu.
2. Press the Time Interval submenu key to set the time between adjacent measurement points. This time may be set from 70 ms to 1 minute.
3. Press the Time Span submenu key to set the overall time span for the RSSI measurement. This time can be set from zero, to give manual control of the time span, to a maximum of seven days. After the specified time span, the measurement is halted. Depending upon the time interval selected, the data will scroll to the left once the trace fills the screen.
Figure 4-2. Interference Analyzer Signal Strength
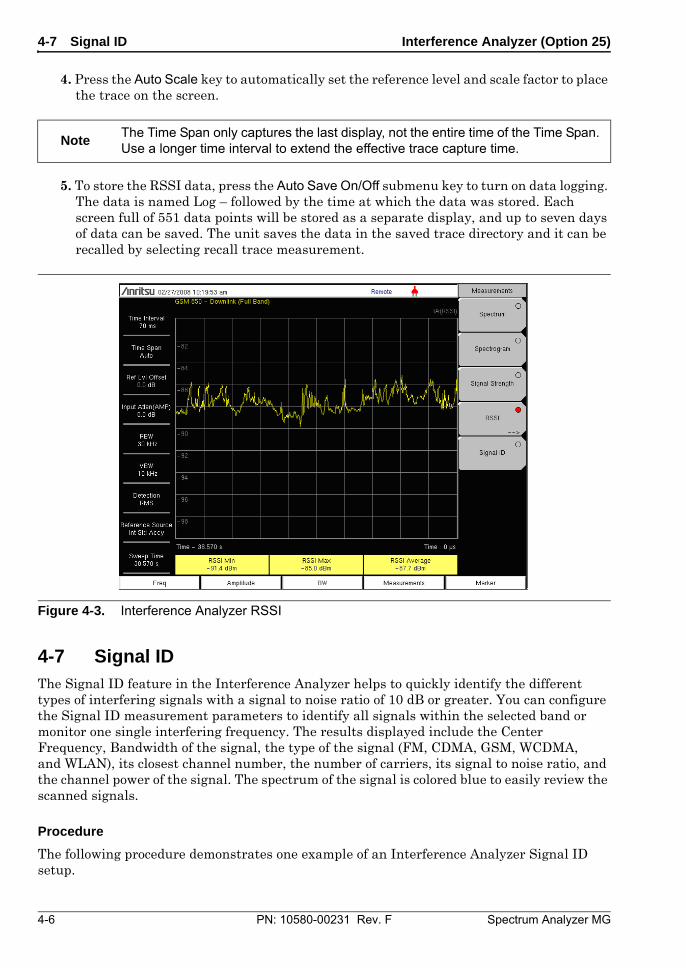
4-7 Signal ID Interference Analyzer (Option 25)
4-6 PN: 10580-00231 Rev. F Spectrum Analyzer MG
4. Press the Auto Scale key to automatically set the reference level and scale factor to place the trace on the screen.
5. To store the RSSI data, press the Auto Save On/Off submenu key to turn on data logging. The data is named Log – followed by the time at which the data was stored. Each screen full of 551 data points will be stored as a separate display, and up to seven days of data can be saved. The unit saves the data in the saved trace directory and it can be recalled by selecting recall trace measurement.
4-7 Signal ID The Signal ID feature in the Interference Analyzer helps to quickly identify the different types of interfering signals with a signal to noise ratio of 10 dB or greater. You can configure the Signal ID measurement parameters to identify all signals within the selected band or monitor one single interfering frequency. The results displayed include the Center Frequency, Bandwidth of the signal, the type of the signal (FM, CDMA, GSM, WCDMA, and WLAN), its closest channel number, the number of carriers, its signal to noise ratio, and the channel power of the signal. The spectrum of the signal is colored blue to easily review the scanned signals.
Procedure
The following procedure demonstrates one example of an Interference Analyzer Signal ID setup.
NoteThe Time Span only captures the last display, not the entire time of the Time Span. Use a longer time interval to extend the effective trace capture time.
Figure 4-3. Interference Analyzer RSSI
Interference Analyzer (Option 25) 4-7 Signal ID
Spectrum Analyzer MG PN: 10580-00231 Rev. F 4-7
1. For the most effective signal ID display, press the Amplitude main menu key followed by pressing the Reference Level submenu key. Set the reference level such that the largest signal to be displayed will be near the top of the graph area of the screen. The reference value required can be determined by observing the peak of the highest signal and changing the reference level to place that value near the top of the graph display.
2. Press the Scale submenu key and set the scale value to place the lowest signal near the bottom of the screen. In general, 4 dB/division or 5 dB/division will be good starting values.
3. Press the BW main menu key and set Auto RBW and Auto VBW On, or set the applicable RBW and VBW values by selecting the RBW and VBW submenu keys.
4. Press the Measurements main menu key
5. Press the Signal ID submenu key to activate the measurement. Press Signal ID again to list the Signal ID menu and to set up the Signal ID test parameters. Set up these parameters as desired – Scan Type, Scan Freq, Continuous Monitoring, Single Sweep and Review.
To view the Signal ID data of a single frequency.
1. In the Signal ID menu, press the Scan Type submenu key so that All is selected (underlined).
2. Press the Single Sweep and Review submenu key. A center frequency and its accompanying data are highlighted in the table below the graph. In the graph, a dotted red line marks the center frequency and the band of blue is the associated bandwidth. Scroll to the desired center frequency in the table and the red dotted line and band of blue will track accordingly.
3. Press the Scan Type submenu key so that Freq is selected. The center frequency that was in the table selected is entered as the Scan Freq submenu key frequency automatically. Now, instead of sweeping across the whole span, the measurement will only identify the selected frequency and will display its Channel Power as well.
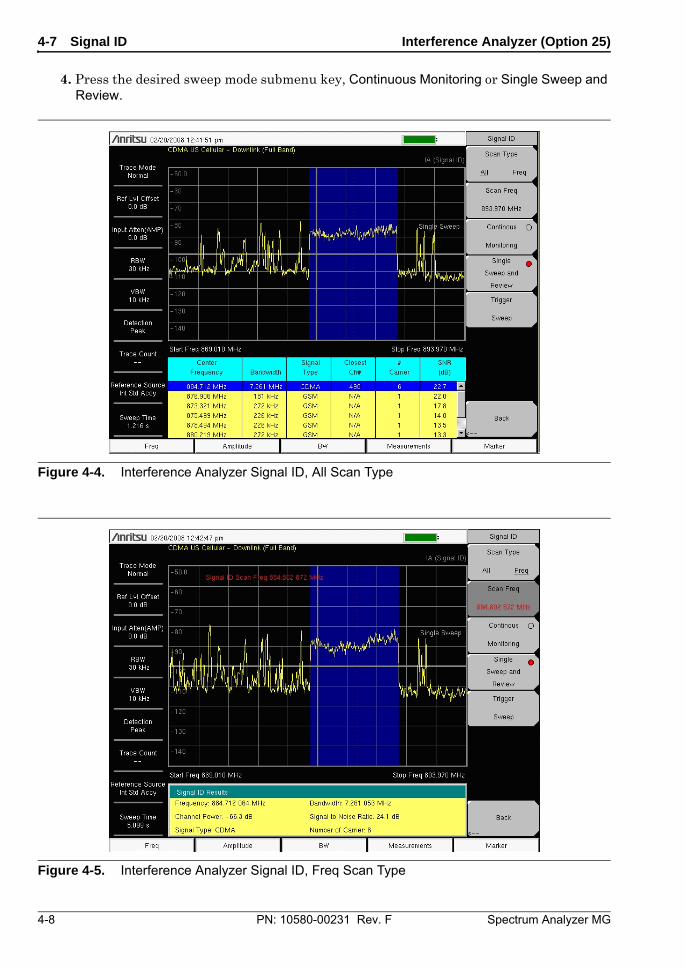
4-7 Signal ID Interference Analyzer (Option 25)
4-8 PN: 10580-00231 Rev. F Spectrum Analyzer MG
4. Press the desired sweep mode submenu key, Continuous Monitoring or Single Sweep and Review.
Figure 4-4. Interference Analyzer Signal ID, All Scan Type
Figure 4-5. Interference Analyzer Signal ID, Freq Scan Type
Interference Analyzer (Option 25) 4-8 Interference Mapping
Spectrum Analyzer MG PN: 10580-00231 Rev. F 4-9
4-8 Interference Mapping
Interference Mapping assists in quickly identifying the location of an interfering signal using a directional antenna and a GeoEmbedded map created using Anritsu easyMap Tools software.
The easyMap Tools program creates special maps compatible with the Anritsu handheld instruments. The software imports maps from any map provider and creates files with or without GPS information. The files will have a .map extension. Anritsu easyMap Tools is shipped with the instrument on a CD and is also available from the Anritsu web site (www.anritsu.com).
Note
Interference Mapping requires Option 31, GPS.
Interference Mapping is available only in the following instruments:S3x2E, S412E, MS271xE, MS272xC, and MT821xE.
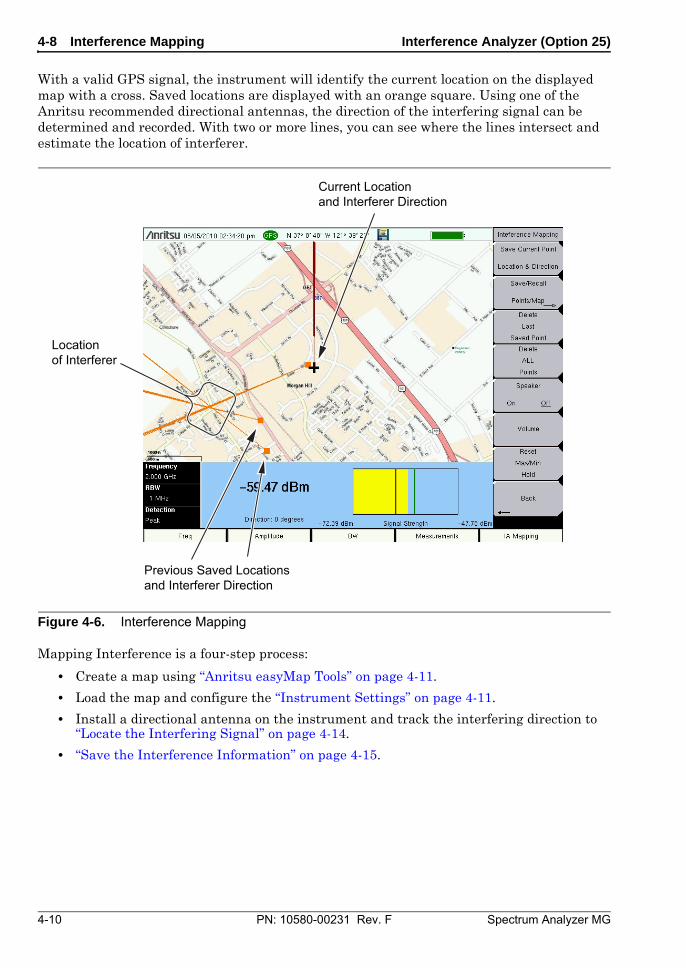
4-8 Interference Mapping Interference Analyzer (Option 25)
4-10 PN: 10580-00231 Rev. F Spectrum Analyzer MG
With a valid GPS signal, the instrument will identify the current location on the displayed map with a cross. Saved locations are displayed with an orange square. Using one of the Anritsu recommended directional antennas, the direction of the interfering signal can be determined and recorded. With two or more lines, you can see where the lines intersect and estimate the location of interferer.
Mapping Interference is a four-step process:
• Create a map using “Anritsu easyMap Tools” on page 4-11.
• Load the map and configure the “Instrument Settings” on page 4-11.
• Install a directional antenna on the instrument and track the interfering direction to “Locate the Interfering Signal” on page 4-14.
• “Save the Interference Information” on page 4-15.
Figure 4-6. Interference Mapping
Location of Interferer
Current Locationand Interferer Direction
Previous Saved Locationsand Interferer Direction
Interference Analyzer (Option 25) 4-8 Interference Mapping
Spectrum Analyzer MG PN: 10580-00231 Rev. F 4-11
Anritsu easyMap Tools
Anritsu easyMap Tools allows you to capture maps of any location and create Anritsu Map Files. These Anritsu Map Files are used for Coverage Mapping and Interference Mapping (Chapter 4).
The maps are viewed on the Anritsu instrument during coverage mapping. Two Anritsu Map Files formats are available:
• legacy .map map files
The MAP files cannot be panned or zoomed, but they work with legacy firmware.
• .azm map files (not currently compatible with Coverage Mapping)
The AZM files provide the information that is required to pan and zoom maps on the spectrum analyzer instrument.
Download easyMap Tools from the Anritsu web site (www.anritsu.com). Additional information about easyMap Tools is available in the software Help.
Outdoor Maps
Type an address in easyMap Tools and capturing the map with GPS data.
Indoor Map
In easyMap Tools, open a bitmapped image (JPEG, GIF, TIFF, or PNG) of the floor plan for indoor mapping. The image size should be close to 666 pixels x 420 pixels (~1.6:1 ratio).
Instrument Settings
Setup
1. Create the appropriate map with Anritsu easyMap Tools. Refer to “Anritsu easyMap Tools” on page 4-11.
2. Open up the Interference Analyzer by pressing the Menu key and selecting the Interference Analyzer icon or press Shift then Mode (9), highlight Interference Analysis and press Enter.
3. Press the Measurements main menu key then press the Interference Mapping submenu key twice to display the Interference Mapping menu.
4. Turn on GPS.
a. Press Shift then System (8).
b. Press the GPS submenu key.
c. Connect a GPS antenna to the SMA connector.
NoteFor best results, the coverage map should extended beyond estimated location of bearing readings and have the general location of the interferer centered in the map.
Note A USB flash drive is required to transfer maps to the instrument.
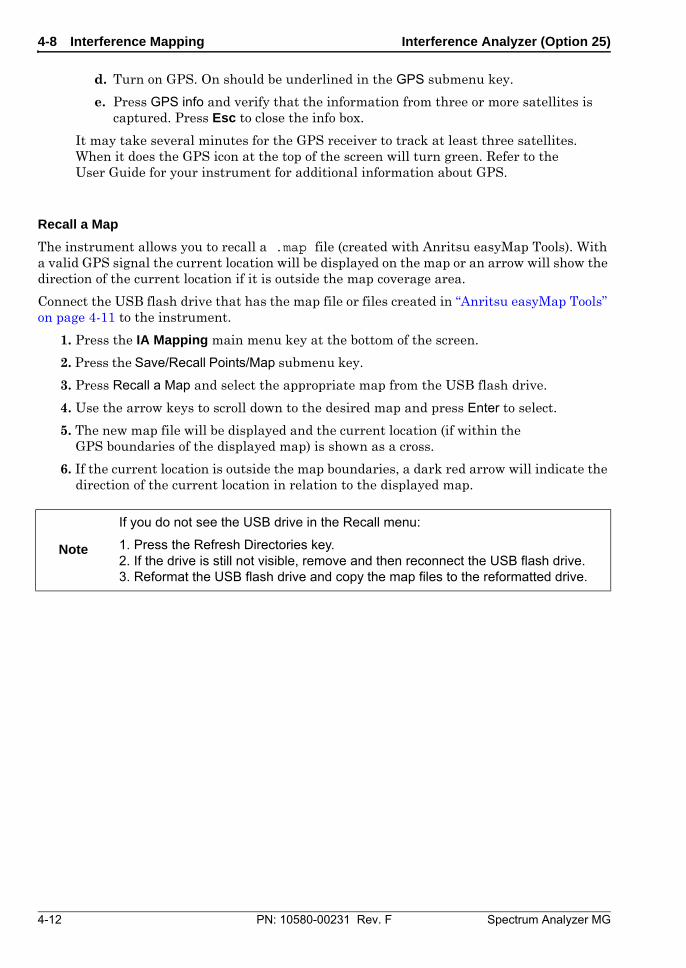
4-8 Interference Mapping Interference Analyzer (Option 25)
4-12 PN: 10580-00231 Rev. F Spectrum Analyzer MG
d. Turn on GPS. On should be underlined in the GPS submenu key.
e. Press GPS info and verify that the information from three or more satellites is captured. Press Esc to close the info box.
It may take several minutes for the GPS receiver to track at least three satellites. When it does the GPS icon at the top of the screen will turn green. Refer to the User Guide for your instrument for additional information about GPS.
Recall a Map
The instrument allows you to recall a .map file (created with Anritsu easyMap Tools). With a valid GPS signal the current location will be displayed on the map or an arrow will show the direction of the current location if it is outside the map coverage area.
Connect the USB flash drive that has the map file or files created in “Anritsu easyMap Tools” on page 4-11 to the instrument.
1. Press the IA Mapping main menu key at the bottom of the screen.
2. Press the Save/Recall Points/Map submenu key.
3. Press Recall a Map and select the appropriate map from the USB flash drive.
4. Use the arrow keys to scroll down to the desired map and press Enter to select.
5. The new map file will be displayed and the current location (if within the GPS boundaries of the displayed map) is shown as a cross.
6. If the current location is outside the map boundaries, a dark red arrow will indicate the direction of the current location in relation to the displayed map.
Note
If you do not see the USB drive in the Recall menu:
1. Press the Refresh Directories key. 2. If the drive is still not visible, remove and then reconnect the USB flash drive. 3. Reformat the USB flash drive and copy the map files to the reformatted drive.
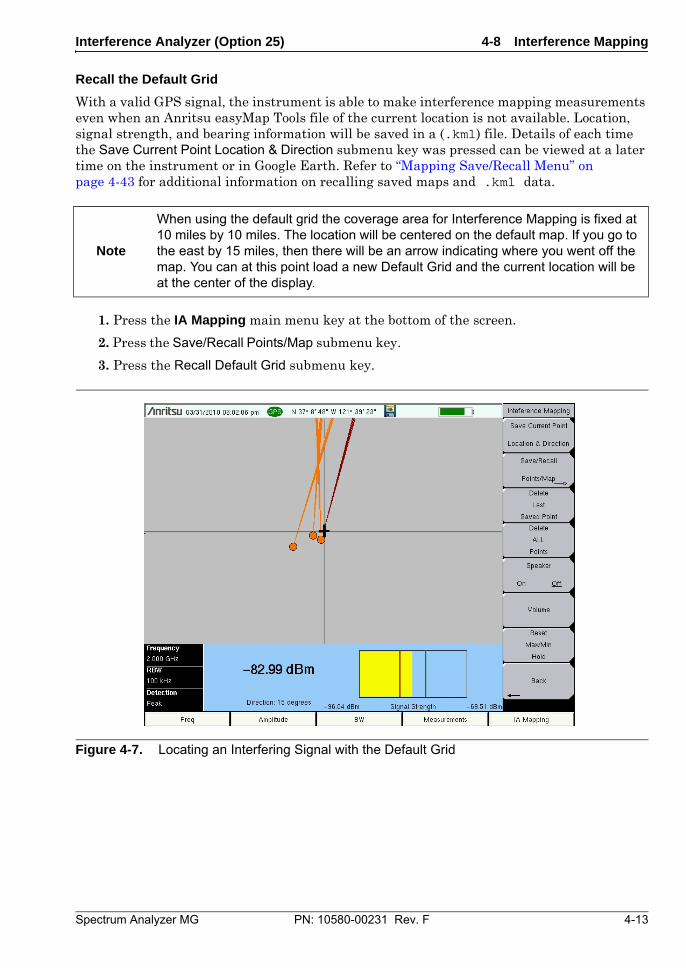
Interference Analyzer (Option 25) 4-8 Interference Mapping
Spectrum Analyzer MG PN: 10580-00231 Rev. F 4-13
Recall the Default Grid
With a valid GPS signal, the instrument is able to make interference mapping measurements even when an Anritsu easyMap Tools file of the current location is not available. Location, signal strength, and bearing information will be saved in a (.kml) file. Details of each time the Save Current Point Location & Direction submenu key was pressed can be viewed at a later time on the instrument or in Google Earth. Refer to “Mapping Save/Recall Menu” on page 4-43 for additional information on recalling saved maps and .kml data.
1. Press the IA Mapping main menu key at the bottom of the screen.
2. Press the Save/Recall Points/Map submenu key.
3. Press the Recall Default Grid submenu key.
Note
When using the default grid the coverage area for Interference Mapping is fixed at 10 miles by 10 miles. The location will be centered on the default map. If you go to the east by 15 miles, then there will be an arrow indicating where you went off the map. You can at this point load a new Default Grid and the current location will be at the center of the display.
Figure 4-7. Locating an Interfering Signal with the Default Grid
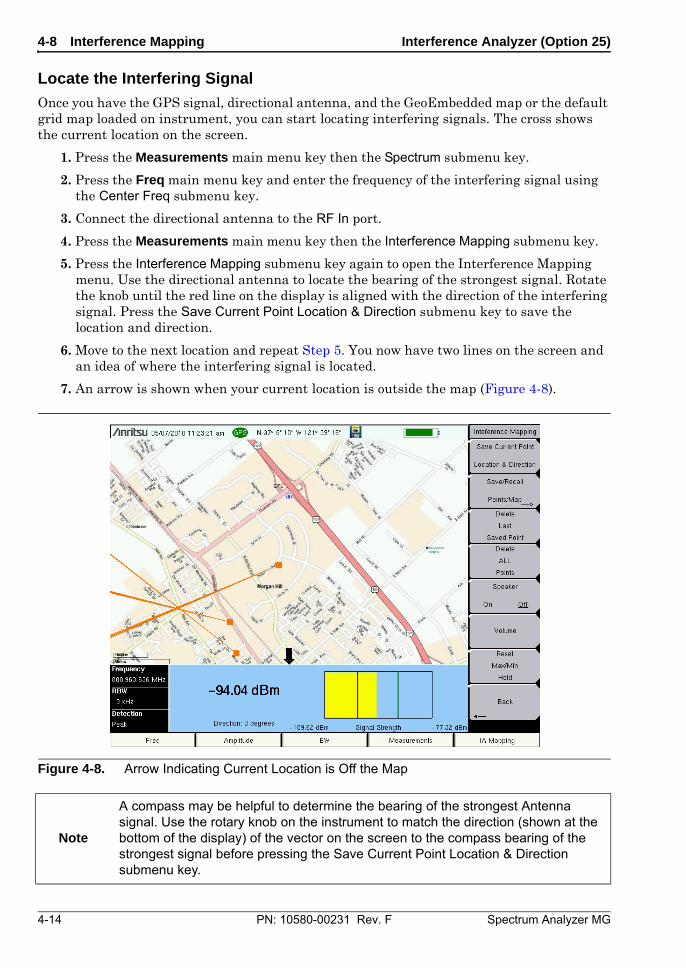
4-8 Interference Mapping Interference Analyzer (Option 25)
4-14 PN: 10580-00231 Rev. F Spectrum Analyzer MG
Locate the Interfering Signal
Once you have the GPS signal, directional antenna, and the GeoEmbedded map or the default grid map loaded on instrument, you can start locating interfering signals. The cross shows the current location on the screen.
1. Press the Measurements main menu key then the Spectrum submenu key.
2. Press the Freq main menu key and enter the frequency of the interfering signal using the Center Freq submenu key.
3. Connect the directional antenna to the RF In port.
4. Press the Measurements main menu key then the Interference Mapping submenu key.
5. Press the Interference Mapping submenu key again to open the Interference Mapping menu. Use the directional antenna to locate the bearing of the strongest signal. Rotate the knob until the red line on the display is aligned with the direction of the interfering signal. Press the Save Current Point Location & Direction submenu key to save the location and direction.
6. Move to the next location and repeat Step 5. You now have two lines on the screen and an idea of where the interfering signal is located.
7. An arrow is shown when your current location is outside the map (Figure 4-8).
Figure 4-8. Arrow Indicating Current Location is Off the Map
Note
A compass may be helpful to determine the bearing of the strongest Antenna signal. Use the rotary knob on the instrument to match the direction (shown at the bottom of the display) of the vector on the screen to the compass bearing of the strongest signal before pressing the Save Current Point Location & Direction submenu key.
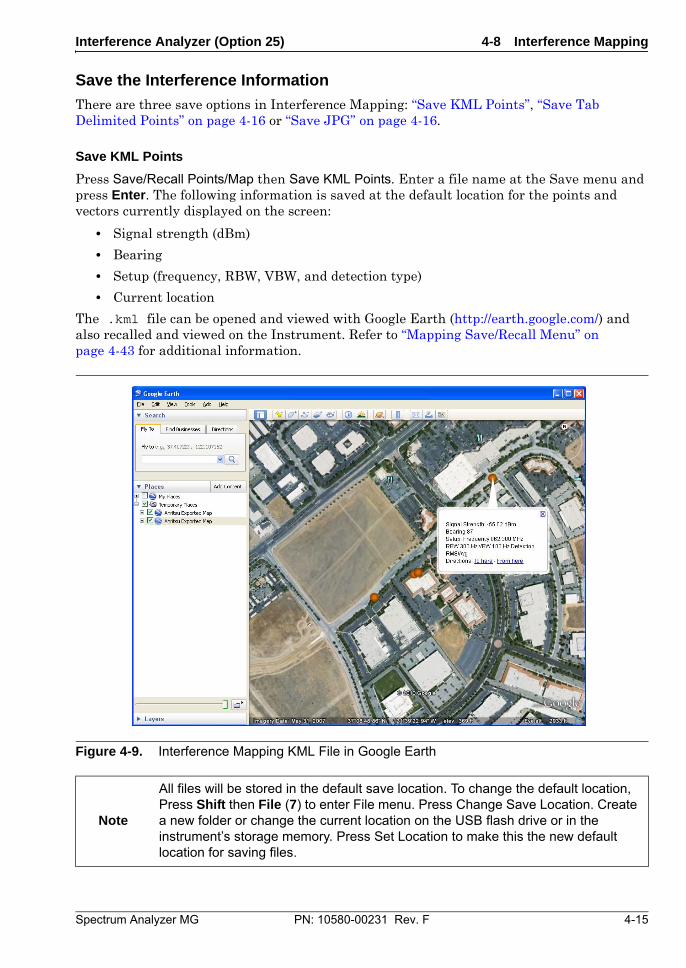
Interference Analyzer (Option 25) 4-8 Interference Mapping
Spectrum Analyzer MG PN: 10580-00231 Rev. F 4-15
Save the Interference Information
There are three save options in Interference Mapping: “Save KML Points”, “Save Tab Delimited Points” on page 4-16 or “Save JPG” on page 4-16.
Save KML Points
Press Save/Recall Points/Map then Save KML Points. Enter a file name at the Save menu and press Enter. The following information is saved at the default location for the points and vectors currently displayed on the screen:
• Signal strength (dBm)
• Bearing
• Setup (frequency, RBW, VBW, and detection type)
• Current location
The .kml file can be opened and viewed with Google Earth (http://earth.google.com/) and also recalled and viewed on the Instrument. Refer to “Mapping Save/Recall Menu” on page 4-43 for additional information.
Figure 4-9. Interference Mapping KML File in Google Earth
Note
All files will be stored in the default save location. To change the default location, Press Shift then File (7) to enter File menu. Press Change Save Location. Create a new folder or change the current location on the USB flash drive or in the instrument’s storage memory. Press Set Location to make this the new default location for saving files.
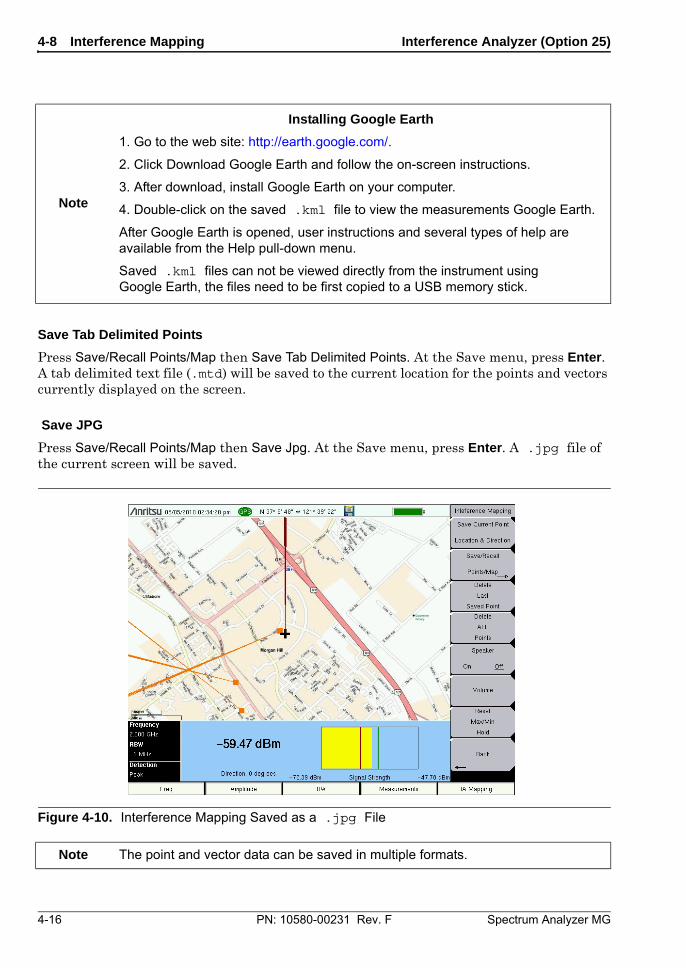
4-8 Interference Mapping Interference Analyzer (Option 25)
4-16 PN: 10580-00231 Rev. F Spectrum Analyzer MG
Save Tab Delimited Points
Press Save/Recall Points/Map then Save Tab Delimited Points. At the Save menu, press Enter. A tab delimited text file (.mtd) will be saved to the current location for the points and vectors currently displayed on the screen.
Save JPG
Press Save/Recall Points/Map then Save Jpg. At the Save menu, press Enter. A .jpg file of the current screen will be saved.
Note
Installing Google Earth
1. Go to the web site: http://earth.google.com/.
2. Click Download Google Earth and follow the on-screen instructions.
3. After download, install Google Earth on your computer.
4. Double-click on the saved .kml file to view the measurements Google Earth.
After Google Earth is opened, user instructions and several types of help are available from the Help pull-down menu.
Saved .kml files can not be viewed directly from the instrument using Google Earth, the files need to be first copied to a USB memory stick.
Figure 4-10. Interference Mapping Saved as a .jpg File
Note The point and vector data can be saved in multiple formats.
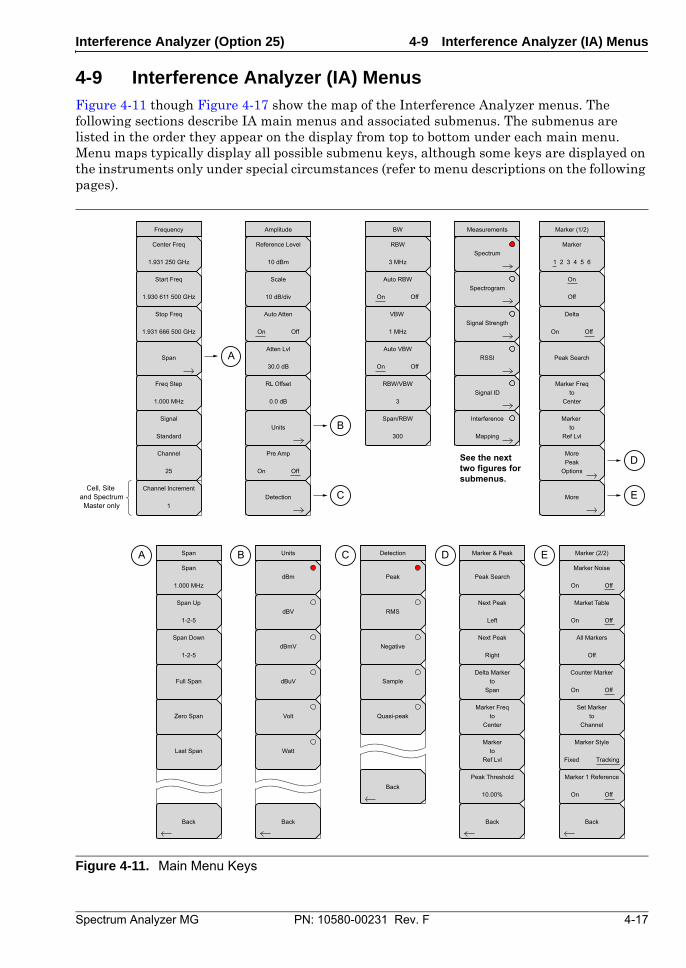
Interference Analyzer (Option 25) 4-9 Interference Analyzer (IA) Menus
Spectrum Analyzer MG PN: 10580-00231 Rev. F 4-17
4-9 Interference Analyzer (IA) Menus Figure 4-11 though Figure 4-17 show the map of the Interference Analyzer menus. The following sections describe IA main menus and associated submenus. The submenus are listed in the order they appear on the display from top to bottom under each main menu. Menu maps typically display all possible submenu keys, although some keys are displayed on the instruments only under special circumstances (refer to menu descriptions on the following pages).
Figure 4-11. Main Menu Keys
Amplitude
Units
Scale
10 dB/div
Atten Lvl
30.0 dB
RL Offset
0.0 dB
Reference Level
10 dBm
Frequency
Center Freq
1.931 250 GHz
Start Freq
1.930 611 500 GHz
Stop Freq
1.931 666 500 GHz
Freq Step
1.000 MHz
Channel
25
Signal
Standard
Back
A
A
B
C E
D
Units
Span
Detection
Auto Atten
On Off
Pre Amp
On Off
dBV
dBmV
dBuV
Volt
Watt
dBm
Detection
Back
RMS
Negative
Sample
Quasi-peak
Peak
CB
Marker (1/2)
Marker & Peak
On
Off
Peak Search
Marker Freqto
Center
Marker to
Ref Lvl
Marker
1 2 3 4 5 6
BW
RBW
3 MHz
VBW
1 MHz
RBW/VBW
3
Span/RBW
300
Back Back
MorePeak
Options
More
Delta
On Off
Marker (2/2)
Marker Noise
On Off
Market Table
On Off
Counter Marker
On Off
Marker Style
Fixed Tracking
Marker 1 Reference
On Off
Auto RBW
On Off
Auto VBW
On Off
Next Peak
Left
Next Peak
Right
Delta Markerto
Span
All Markers
Off
Set Markerto
Channel
Marker Freqto
Center
Markerto
Ref Lvl
Peak Threshold
10.00%
Peak Search
ED
Back
Span
Span
1.000 MHz
Span Up
1-2-5
Span Down
1-2-5
Full Span
Zero Span
Last Span
Measurements
Spectrum
Spectrogram
Signal Strength
RSSI
Signal ID
See the next two figures forsubmenus.
Interference
Mapping
Channel Increment
1
Cell, Site and SpectrumMaster only
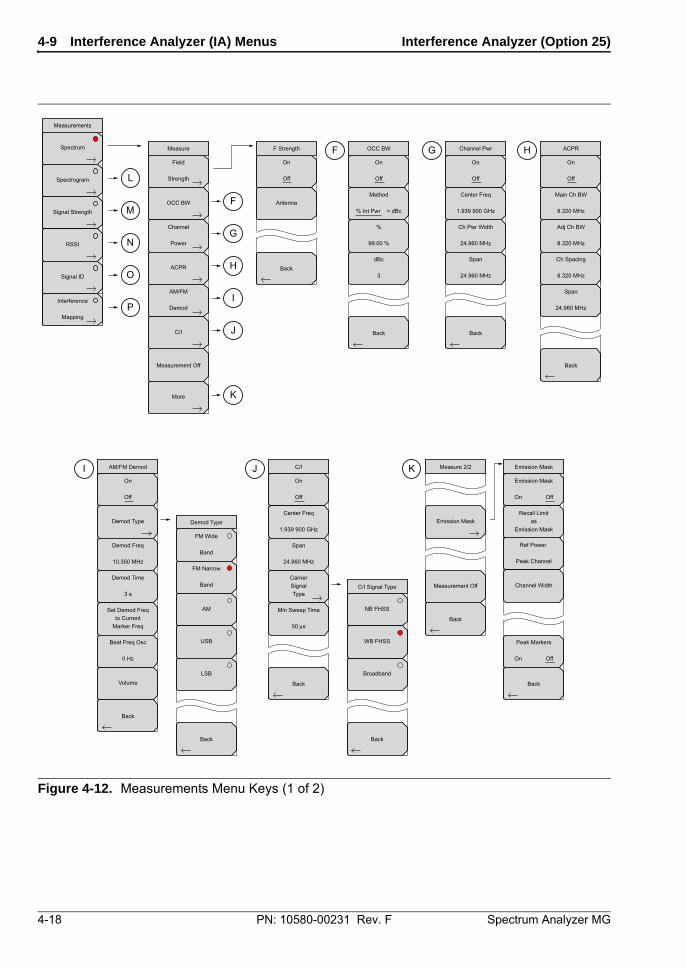
4-9 Interference Analyzer (IA) Menus Interference Analyzer (Option 25)
4-18 PN: 10580-00231 Rev. F Spectrum Analyzer MG
Figure 4-12. Measurements Menu Keys (1 of 2)
L
M
N
O
Measurements
Spectrum
Spectrogram
Signal Strength
RSSI
Signal ID
PInterference
Mapping
FM Wide
Band
AM
USB
LSB
FM Narrow
Band
Measurement Off
Measure F Strength
Field
Strength
FOCC BW
GChannel
Power
HACPR
IAM/FM
Demod
JC/I
Demod Type Emission Mask
KMore
Back
Antenna
%
99.00 %
dBc
3
Method
% Int Pwr > dBc
On
Off
I AM/FM Demod J C/I K Measure 2/2
Demod Type
Demod Freq
10.350 MHz
Demod Time
3 s
Volume
Set Demod Freqto Current
Marker Freq
Beat Freq Osc
0 Hz
F OCC BW
Back
Back
NB FHSS
Broadband
WB FHSS
CarrierSignalType
C/I Signal Type
Back
Back
Back
Back
On
Off
On
Off
On
Off
Center Freq
1.939 900 GHz
Measurement Off
Emission Mask
On Off
Peak Markers
On Off
Emission Mask
Back
Recall Limitas
Emission Mask
Ref Power
Peak Channel
Channel Width
Span
24.960 MHz
Min Sweep Time
50 s
Ch Pwr Width
24.960 MHz
Span
24.960 MHz
Center Freq
1.939 900 GHz
G Channel Pwr
Back
On
Off
Adj Ch BW
8.320 MHz
Ch Spacing
8.320 MHz
Span
24.960 MHz
Main Ch BW
8.320 MHz
H ACPR
Back
On
Off

Interference Analyzer (Option 25) 4-9 Interference Analyzer (IA) Menus
Spectrum Analyzer MG PN: 10580-00231 Rev. F 4-19
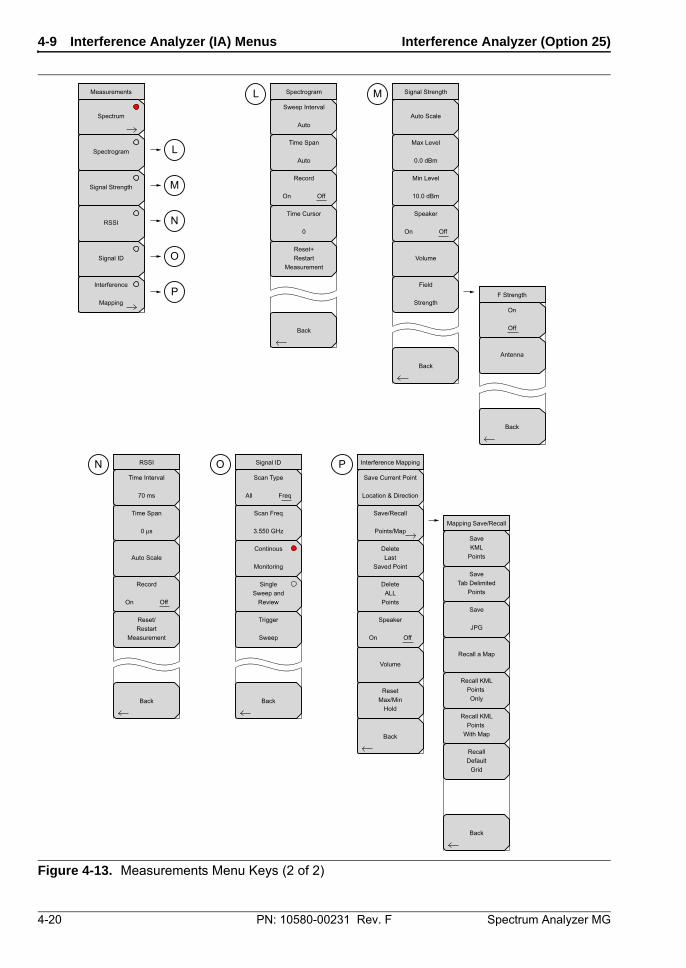
4-9 Interference Analyzer (IA) Menus Interference Analyzer (Option 25)
4-20 PN: 10580-00231 Rev. F Spectrum Analyzer MG
Figure 4-13. Measurements Menu Keys (2 of 2)
SingleSweep and
Review
Continous
Monitoring
Record
On Off
L Spectrogram
Back
Sweep Interval
Auto
Time Span
Auto
Time Cursor
0
Reset+Restart
Measurement
Record
On Off
N RSSI
Back
Time Interval
70 ms
Time Span
0 s
Auto Scale
Reset/Restart
Measurement
Scan Type
All Freq
O Signal ID
Back
Scan Freq
3.550 GHz
Trigger
Sweep
DeleteALL
Points
DeleteLast
Saved Point
ResetMax/Min
Hold
P Interference Mapping
Back
Save Current Point
Location & Direction
Speaker
On Off
M Signal Strength
Back
Auto Scale
Max Level
0.0 dBm
Min Level
10.0 dBm
Volume
Speaker
On Off
Volume
Field
Strength
L
M
N
O
Measurements
Spectrum
Spectrogram
Signal Strength
RSSI
Signal ID
F Strength
Back
Antenna
On
Off
PInterference
Mapping
Save/Recall
Points/Map
Recall KMLPoints Only
Recall KMLPoints
With Map
RecallDefault
Grid
Recall a Map
Mapping Save/Recall
Back
SaveKML
Points
SaveTab Delimited
Points
Save
JPG
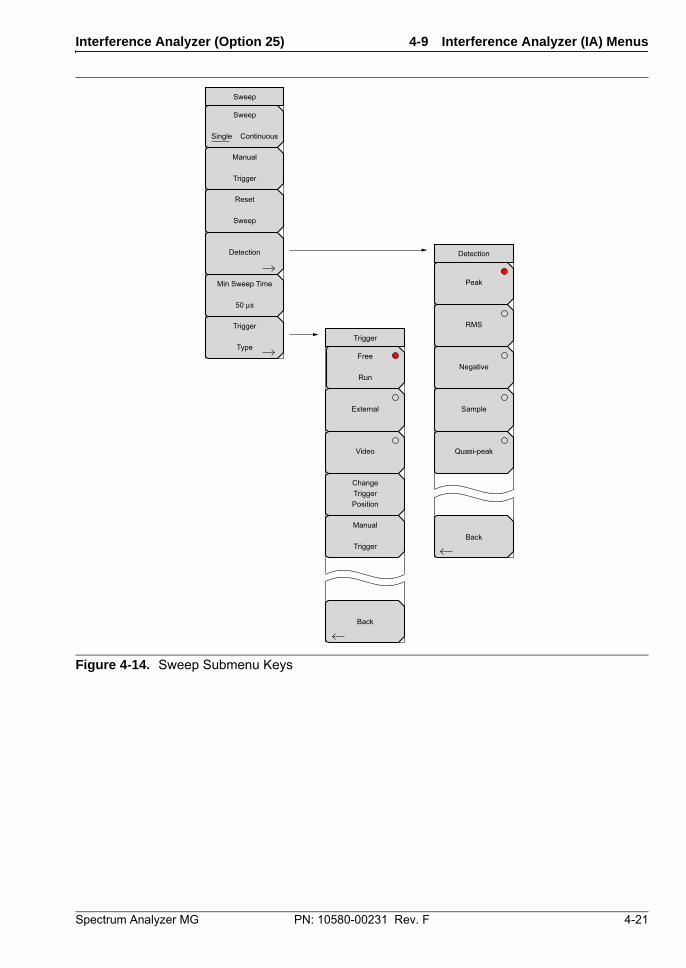
Interference Analyzer (Option 25) 4-9 Interference Analyzer (IA) Menus
Spectrum Analyzer MG PN: 10580-00231 Rev. F 4-21
Figure 4-14. Sweep Submenu Keys
Trigger
Sweep
Manual
Trigger
Reset
Sweep
Min Sweep Time
50 s
Back
Detection
Trigger
Type
Sweep
Single Continuous
External
Video
ChangeTriggerPosition
Manual
Trigger
Free
Run
Detection
Back
RMS
Negative
Sample
Quasi-peak
Peak
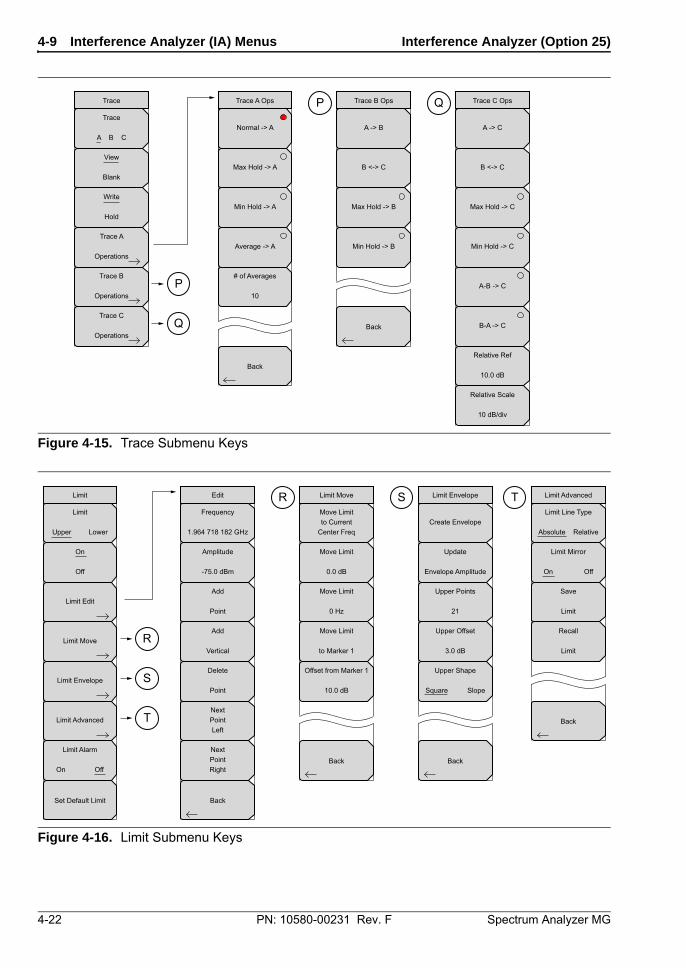
4-9 Interference Analyzer (IA) Menus Interference Analyzer (Option 25)
4-22 PN: 10580-00231 Rev. F Spectrum Analyzer MG
Figure 4-15. Trace Submenu Keys
Figure 4-16. Limit Submenu Keys
Trace Trace A Ops
Back
BackQ
P
Trace A
Operations
Trace B
Operations
Trace C
Operations
View
Blank
Normal -> A
Max Hold -> A
Min Hold -> A
Average -> A
# of Averages
10
Trace B OpsP
A -> B
B <-> C
Max Hold -> B
Min Hold -> B
QTrace
A B C
Trace C Ops
A -> C
B <-> C
Max Hold -> C
Min Hold -> C
A-B -> C
B-A -> C
Relative Ref
10.0 dB
Relative Scale
10 dB/div
Write
Hold
Limit Edit
Back
Back
Upper Shape
Square Slope
Set Default Limit
R
S
T
Limit Edit
Limit Move
Limit Envelope
Limit Advanced
On
Off
Frequency
1.964 718 182 GHz
Amplitude
-75.0 dBm
Add
Point
Add
Vertical
Delete
Point
NextPointLeft
NextPointRight
Limit MoveRMove Limitto Current
Center Freq
Move Limit
0.0 dB
Move Limit
0 Hz
Move Limit
to Marker 1
Offset from Marker 1
10.0 dB
Limit Envelope
Back
S
Create Envelope
Update
Envelope Amplitude
Upper Points
21
Upper Offset
3.0 dB
Limit Alarm
On Off
Limit
Upper Lower
Limit Line Type
Absolute Relative
Limit Advanced
Back
T
Save
Limit
Recall
Limit
Limit Mirror
On Off
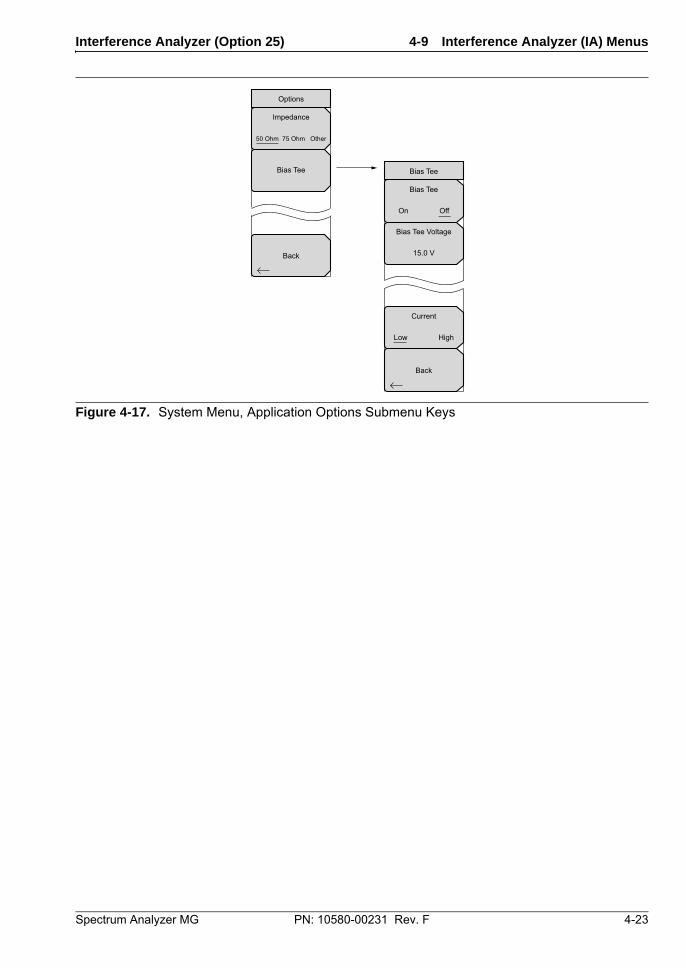
Interference Analyzer (Option 25) 4-9 Interference Analyzer (IA) Menus
Spectrum Analyzer MG PN: 10580-00231 Rev. F 4-23
Figure 4-17. System Menu, Application Options Submenu Keys
Options
Bias Tee
Impedance
50 Ohm 75 Ohm Other
Bias Tee
On Off
Current
Low High
Bias Tee
Back
Bias Tee Voltage
15.0 VBack
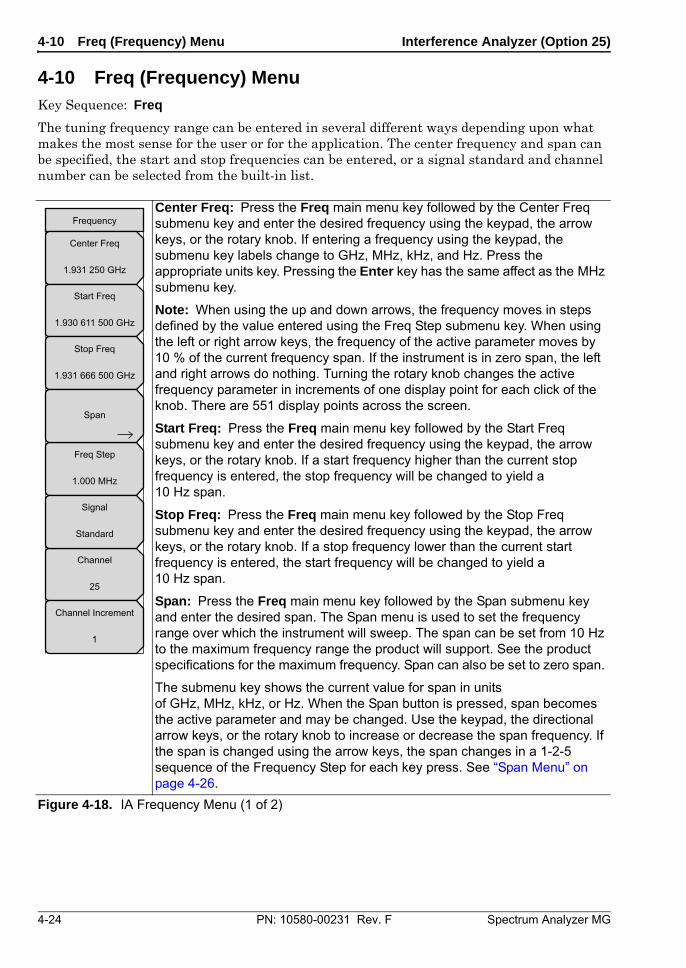
4-10 Freq (Frequency) Menu Interference Analyzer (Option 25)
4-24 PN: 10580-00231 Rev. F Spectrum Analyzer MG
4-10 Freq (Frequency) Menu Key Sequence: Freq
The tuning frequency range can be entered in several different ways depending upon what makes the most sense for the user or for the application. The center frequency and span can be specified, the start and stop frequencies can be entered, or a signal standard and channel number can be selected from the built-in list.
Center Freq: Press the Freq main menu key followed by the Center Freq submenu key and enter the desired frequency using the keypad, the arrow keys, or the rotary knob. If entering a frequency using the keypad, the submenu key labels change to GHz, MHz, kHz, and Hz. Press the appropriate units key. Pressing the Enter key has the same affect as the MHz submenu key.
Note: When using the up and down arrows, the frequency moves in steps defined by the value entered using the Freq Step submenu key. When using the left or right arrow keys, the frequency of the active parameter moves by 10 % of the current frequency span. If the instrument is in zero span, the left and right arrows do nothing. Turning the rotary knob changes the active frequency parameter in increments of one display point for each click of the knob. There are 551 display points across the screen.
Start Freq: Press the Freq main menu key followed by the Start Freq submenu key and enter the desired frequency using the keypad, the arrow keys, or the rotary knob. If a start frequency higher than the current stop frequency is entered, the stop frequency will be changed to yield a 10 Hz span.
Stop Freq: Press the Freq main menu key followed by the Stop Freq submenu key and enter the desired frequency using the keypad, the arrow keys, or the rotary knob. If a stop frequency lower than the current start frequency is entered, the start frequency will be changed to yield a 10 Hz span.
Span: Press the Freq main menu key followed by the Span submenu key and enter the desired span. The Span menu is used to set the frequency range over which the instrument will sweep. The span can be set from 10 Hz to the maximum frequency range the product will support. See the product specifications for the maximum frequency. Span can also be set to zero span.
The submenu key shows the current value for span in units of GHz, MHz, kHz, or Hz. When the Span button is pressed, span becomes the active parameter and may be changed. Use the keypad, the directional arrow keys, or the rotary knob to increase or decrease the span frequency. If the span is changed using the arrow keys, the span changes in a 1-2-5 sequence of the Frequency Step for each key press. See “Span Menu” on page 4-26.
Figure 4-18. IA Frequency Menu (1 of 2)
Frequency
Center Freq
1.931 250 GHz
Start Freq
1.930 611 500 GHz
Stop Freq
1.931 666 500 GHz
Freq Step
1.000 MHz
Channel
25
Signal
Standard
Channel Increment
1
Span
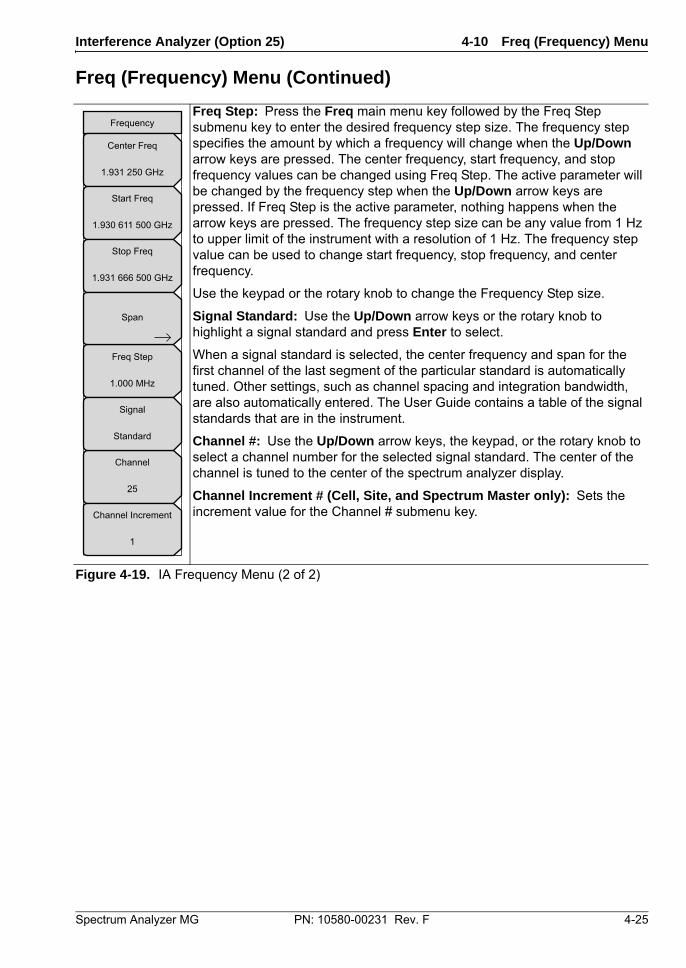
Interference Analyzer (Option 25) 4-10 Freq (Frequency) Menu
Spectrum Analyzer MG PN: 10580-00231 Rev. F 4-25
Freq (Frequency) Menu (Continued)
Freq Step: Press the Freq main menu key followed by the Freq Step submenu key to enter the desired frequency step size. The frequency step specifies the amount by which a frequency will change when the Up/Down arrow keys are pressed. The center frequency, start frequency, and stop frequency values can be changed using Freq Step. The active parameter will be changed by the frequency step when the Up/Down arrow keys are pressed. If Freq Step is the active parameter, nothing happens when the arrow keys are pressed. The frequency step size can be any value from 1 Hz to upper limit of the instrument with a resolution of 1 Hz. The frequency step value can be used to change start frequency, stop frequency, and center frequency.
Use the keypad or the rotary knob to change the Frequency Step size.
Signal Standard: Use the Up/Down arrow keys or the rotary knob to highlight a signal standard and press Enter to select.
When a signal standard is selected, the center frequency and span for the first channel of the last segment of the particular standard is automatically tuned. Other settings, such as channel spacing and integration bandwidth, are also automatically entered. The User Guide contains a table of the signal standards that are in the instrument.
Channel #: Use the Up/Down arrow keys, the keypad, or the rotary knob to select a channel number for the selected signal standard. The center of the channel is tuned to the center of the spectrum analyzer display.
Channel Increment # (Cell, Site, and Spectrum Master only): Sets the increment value for the Channel # submenu key.
Figure 4-19. IA Frequency Menu (2 of 2)
Frequency
Center Freq
1.931 250 GHz
Start Freq
1.930 611 500 GHz
Stop Freq
1.931 666 500 GHz
Freq Step
1.000 MHz
Channel
25
Signal
Standard
Channel Increment
1
Span
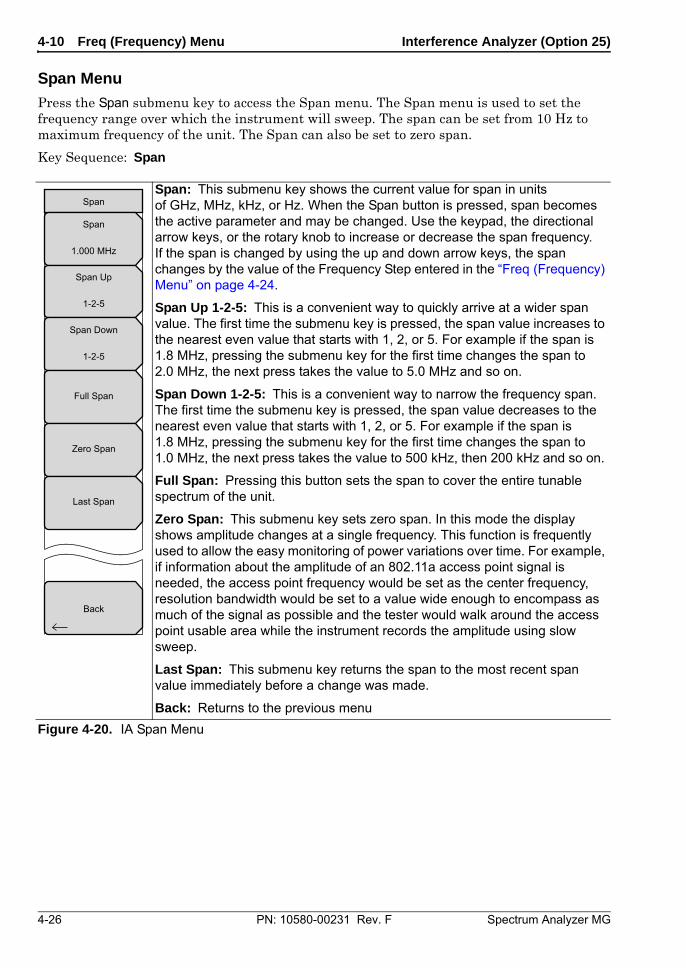
4-10 Freq (Frequency) Menu Interference Analyzer (Option 25)
4-26 PN: 10580-00231 Rev. F Spectrum Analyzer MG
Span Menu
Press the Span submenu key to access the Span menu. The Span menu is used to set the frequency range over which the instrument will sweep. The span can be set from 10 Hz to maximum frequency of the unit. The Span can also be set to zero span.
Key Sequence: Span
Span: This submenu key shows the current value for span in units of GHz, MHz, kHz, or Hz. When the Span button is pressed, span becomes the active parameter and may be changed. Use the keypad, the directional arrow keys, or the rotary knob to increase or decrease the span frequency. If the span is changed by using the up and down arrow keys, the span changes by the value of the Frequency Step entered in the “Freq (Frequency) Menu” on page 4-24.
Span Up 1-2-5: This is a convenient way to quickly arrive at a wider span value. The first time the submenu key is pressed, the span value increases to the nearest even value that starts with 1, 2, or 5. For example if the span is 1.8 MHz, pressing the submenu key for the first time changes the span to 2.0 MHz, the next press takes the value to 5.0 MHz and so on.
Span Down 1-2-5: This is a convenient way to narrow the frequency span. The first time the submenu key is pressed, the span value decreases to the nearest even value that starts with 1, 2, or 5. For example if the span is 1.8 MHz, pressing the submenu key for the first time changes the span to 1.0 MHz, the next press takes the value to 500 kHz, then 200 kHz and so on.
Full Span: Pressing this button sets the span to cover the entire tunable spectrum of the unit.
Zero Span: This submenu key sets zero span. In this mode the display shows amplitude changes at a single frequency. This function is frequently used to allow the easy monitoring of power variations over time. For example, if information about the amplitude of an 802.11a access point signal is needed, the access point frequency would be set as the center frequency, resolution bandwidth would be set to a value wide enough to encompass as much of the signal as possible and the tester would walk around the access point usable area while the instrument records the amplitude using slow sweep.
Last Span: This submenu key returns the span to the most recent span value immediately before a change was made.
Back: Returns to the previous menu
Figure 4-20. IA Span Menu
Back
Span
Span
1.000 MHz
Span Up
1-2-5
Span Down
1-2-5
Full Span
Zero Span
Last Span
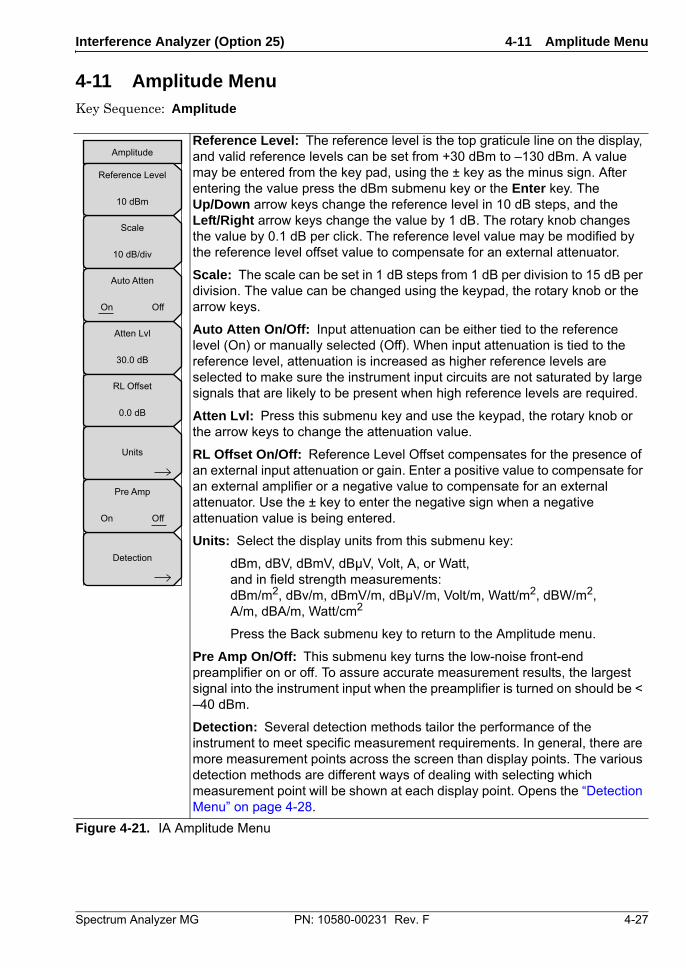
Interference Analyzer (Option 25) 4-11 Amplitude Menu
Spectrum Analyzer MG PN: 10580-00231 Rev. F 4-27
4-11 Amplitude Menu Key Sequence: Amplitude
Reference Level: The reference level is the top graticule line on the display, and valid reference levels can be set from +30 dBm to –130 dBm. A value may be entered from the key pad, using the ± key as the minus sign. After entering the value press the dBm submenu key or the Enter key. The Up/Down arrow keys change the reference level in 10 dB steps, and the Left/Right arrow keys change the value by 1 dB. The rotary knob changes the value by 0.1 dB per click. The reference level value may be modified by the reference level offset value to compensate for an external attenuator.
Scale: The scale can be set in 1 dB steps from 1 dB per division to 15 dB per division. The value can be changed using the keypad, the rotary knob or the arrow keys.
Auto Atten On/Off: Input attenuation can be either tied to the reference level (On) or manually selected (Off). When input attenuation is tied to the reference level, attenuation is increased as higher reference levels are selected to make sure the instrument input circuits are not saturated by large signals that are likely to be present when high reference levels are required.
Atten Lvl: Press this submenu key and use the keypad, the rotary knob or the arrow keys to change the attenuation value.
RL Offset On/Off: Reference Level Offset compensates for the presence of an external input attenuation or gain. Enter a positive value to compensate for an external amplifier or a negative value to compensate for an external attenuator. Use the ± key to enter the negative sign when a negative attenuation value is being entered.
Units: Select the display units from this submenu key:
dBm, dBV, dBmV, dBµV, Volt, A, or Watt,and in field strength measurements: dBm/m2, dBv/m, dBmV/m, dBµV/m, Volt/m, Watt/m2, dBW/m2, A/m, dBA/m, Watt/cm2
Press the Back submenu key to return to the Amplitude menu.
Pre Amp On/Off: This submenu key turns the low-noise front-end preamplifier on or off. To assure accurate measurement results, the largest signal into the instrument input when the preamplifier is turned on should be < –40 dBm.
Detection: Several detection methods tailor the performance of the instrument to meet specific measurement requirements. In general, there are more measurement points across the screen than display points. The various detection methods are different ways of dealing with selecting which measurement point will be shown at each display point. Opens the “Detection Menu” on page 4-28.
Figure 4-21. IA Amplitude Menu
Amplitude
Scale
10 dB/div
Atten Lvl
30.0 dB
RL Offset
0.0 dB
Reference Level
10 dBm
Units
Detection
Auto Atten
On Off
Pre Amp
On Off
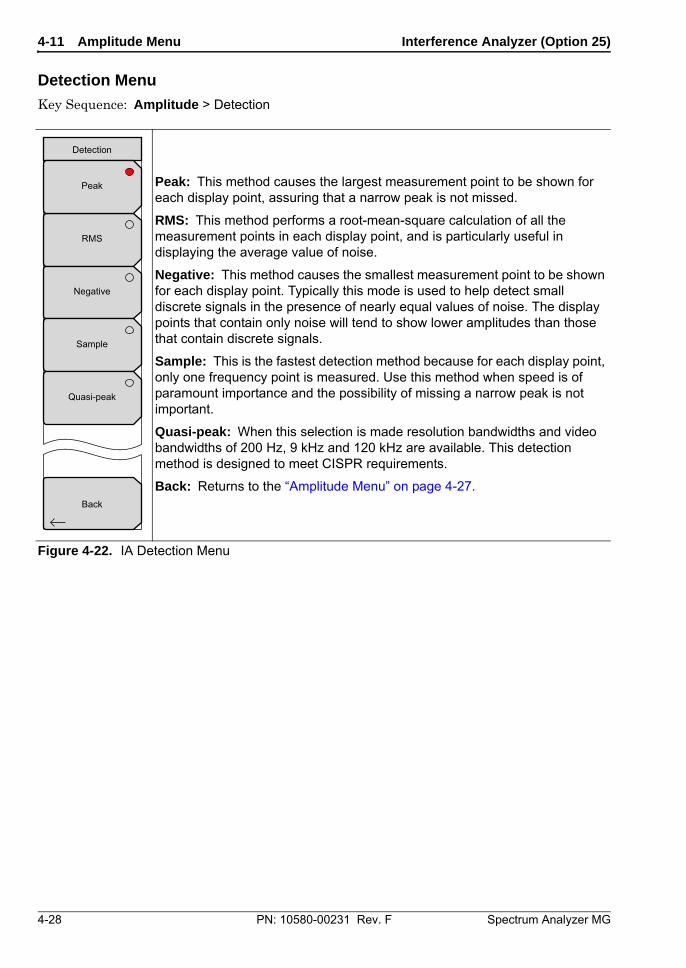
4-11 Amplitude Menu Interference Analyzer (Option 25)
4-28 PN: 10580-00231 Rev. F Spectrum Analyzer MG
Detection Menu
Key Sequence: Amplitude > Detection
Peak: This method causes the largest measurement point to be shown for each display point, assuring that a narrow peak is not missed.
RMS: This method performs a root-mean-square calculation of all the measurement points in each display point, and is particularly useful in displaying the average value of noise.
Negative: This method causes the smallest measurement point to be shown for each display point. Typically this mode is used to help detect small discrete signals in the presence of nearly equal values of noise. The display points that contain only noise will tend to show lower amplitudes than those that contain discrete signals.
Sample: This is the fastest detection method because for each display point, only one frequency point is measured. Use this method when speed is of paramount importance and the possibility of missing a narrow peak is not important.
Quasi-peak: When this selection is made resolution bandwidths and video bandwidths of 200 Hz, 9 kHz and 120 kHz are available. This detection method is designed to meet CISPR requirements.
Back: Returns to the “Amplitude Menu” on page 4-27.
Figure 4-22. IA Detection Menu
Detection
Back
RMS
Negative
Sample
Quasi-peak
Peak
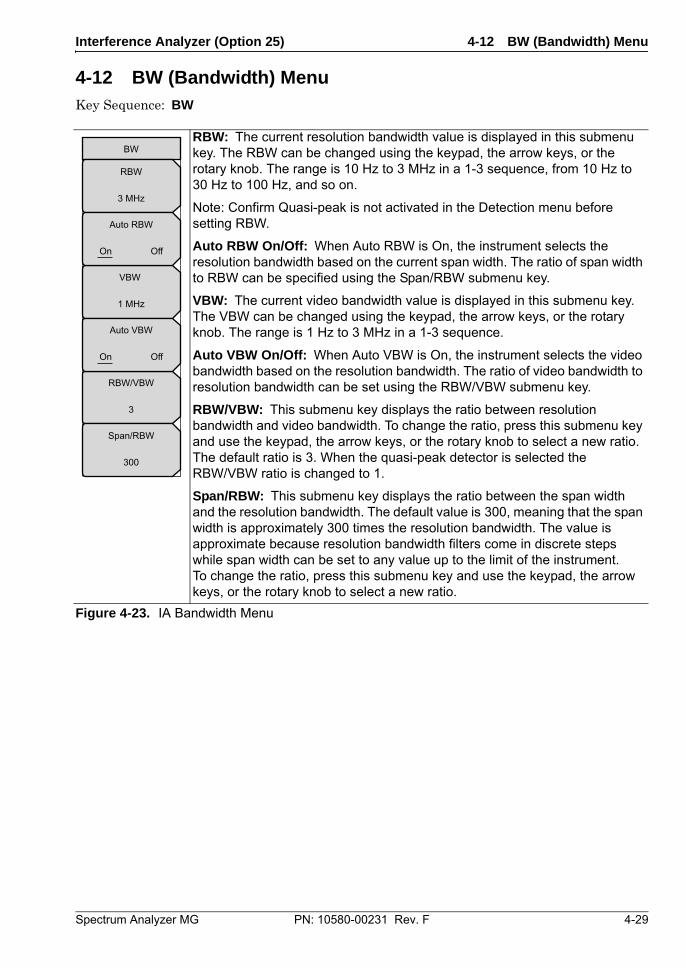
Interference Analyzer (Option 25) 4-12 BW (Bandwidth) Menu
Spectrum Analyzer MG PN: 10580-00231 Rev. F 4-29
4-12 BW (Bandwidth) Menu Key Sequence: BW
RBW: The current resolution bandwidth value is displayed in this submenu key. The RBW can be changed using the keypad, the arrow keys, or the rotary knob. The range is 10 Hz to 3 MHz in a 1-3 sequence, from 10 Hz to 30 Hz to 100 Hz, and so on.
Note: Confirm Quasi-peak is not activated in the Detection menu before setting RBW.
Auto RBW On/Off: When Auto RBW is On, the instrument selects the resolution bandwidth based on the current span width. The ratio of span width to RBW can be specified using the Span/RBW submenu key.
VBW: The current video bandwidth value is displayed in this submenu key. The VBW can be changed using the keypad, the arrow keys, or the rotary knob. The range is 1 Hz to 3 MHz in a 1-3 sequence.
Auto VBW On/Off: When Auto VBW is On, the instrument selects the video bandwidth based on the resolution bandwidth. The ratio of video bandwidth to resolution bandwidth can be set using the RBW/VBW submenu key.
RBW/VBW: This submenu key displays the ratio between resolution bandwidth and video bandwidth. To change the ratio, press this submenu key and use the keypad, the arrow keys, or the rotary knob to select a new ratio. The default ratio is 3. When the quasi-peak detector is selected the RBW/VBW ratio is changed to 1.
Span/RBW: This submenu key displays the ratio between the span width and the resolution bandwidth. The default value is 300, meaning that the span width is approximately 300 times the resolution bandwidth. The value is approximate because resolution bandwidth filters come in discrete steps while span width can be set to any value up to the limit of the instrument. To change the ratio, press this submenu key and use the keypad, the arrow keys, or the rotary knob to select a new ratio.
Figure 4-23. IA Bandwidth Menu
BW
RBW
3 MHz
VBW
1 MHz
RBW/VBW
3
Span/RBW
300
Auto RBW
On Off
Auto VBW
On Off
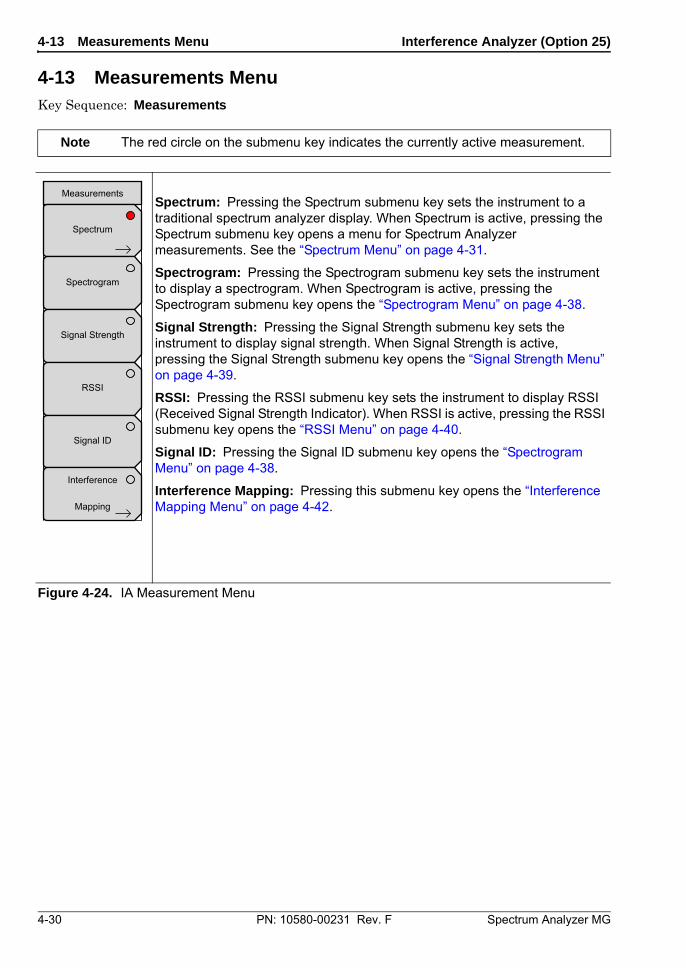
4-13 Measurements Menu Interference Analyzer (Option 25)
4-30 PN: 10580-00231 Rev. F Spectrum Analyzer MG
4-13 Measurements Menu Key Sequence: Measurements
Note The red circle on the submenu key indicates the currently active measurement.
Spectrum: Pressing the Spectrum submenu key sets the instrument to a traditional spectrum analyzer display. When Spectrum is active, pressing the Spectrum submenu key opens a menu for Spectrum Analyzer measurements. See the “Spectrum Menu” on page 4-31.
Spectrogram: Pressing the Spectrogram submenu key sets the instrument to display a spectrogram. When Spectrogram is active, pressing the Spectrogram submenu key opens the “Spectrogram Menu” on page 4-38.
Signal Strength: Pressing the Signal Strength submenu key sets the instrument to display signal strength. When Signal Strength is active, pressing the Signal Strength submenu key opens the “Signal Strength Menu” on page 4-39.
RSSI: Pressing the RSSI submenu key sets the instrument to display RSSI (Received Signal Strength Indicator). When RSSI is active, pressing the RSSI submenu key opens the “RSSI Menu” on page 4-40.
Signal ID: Pressing the Signal ID submenu key opens the “Spectrogram Menu” on page 4-38.
Interference Mapping: Pressing this submenu key opens the “Interference Mapping Menu” on page 4-42.
Figure 4-24. IA Measurement Menu
Measurements
Spectrum
Spectrogram
Signal Strength
RSSI
Signal ID
Interference
Mapping
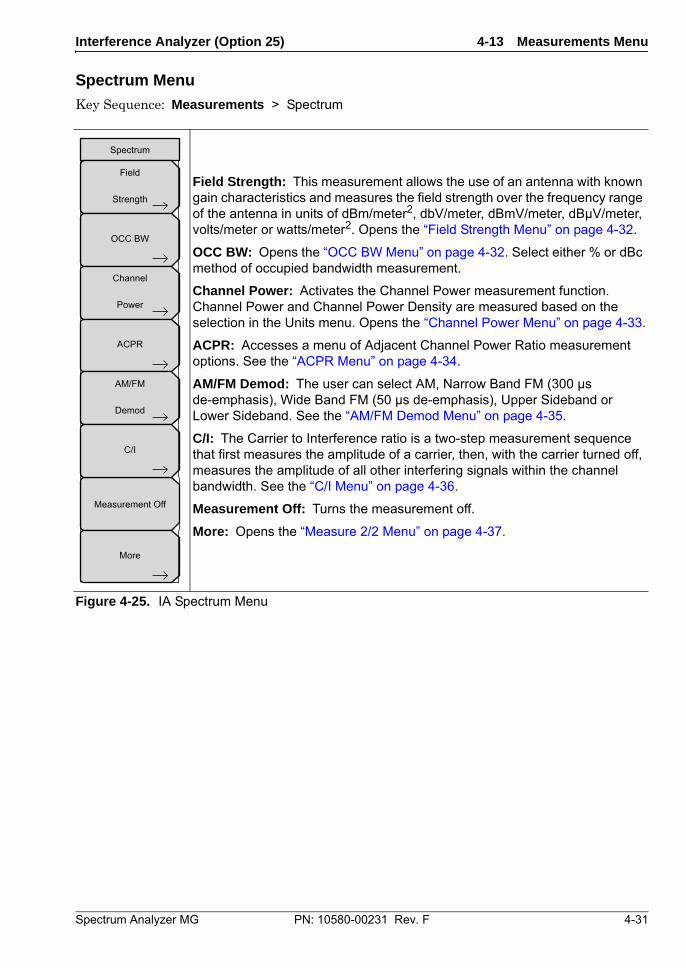
Interference Analyzer (Option 25) 4-13 Measurements Menu
Spectrum Analyzer MG PN: 10580-00231 Rev. F 4-31
Spectrum Menu
Key Sequence: Measurements > Spectrum
Field Strength: This measurement allows the use of an antenna with known gain characteristics and measures the field strength over the frequency range of the antenna in units of dBm/meter2, dbV/meter, dBmV/meter, dBµV/meter, volts/meter or watts/meter2. Opens the “Field Strength Menu” on page 4-32.
OCC BW: Opens the “OCC BW Menu” on page 4-32. Select either % or dBc method of occupied bandwidth measurement.
Channel Power: Activates the Channel Power measurement function. Channel Power and Channel Power Density are measured based on the selection in the Units menu. Opens the “Channel Power Menu” on page 4-33.
ACPR: Accesses a menu of Adjacent Channel Power Ratio measurement options. See the “ACPR Menu” on page 4-34.
AM/FM Demod: The user can select AM, Narrow Band FM (300 µs de-emphasis), Wide Band FM (50 µs de-emphasis), Upper Sideband or Lower Sideband. See the “AM/FM Demod Menu” on page 4-35.
C/I: The Carrier to Interference ratio is a two-step measurement sequence that first measures the amplitude of a carrier, then, with the carrier turned off, measures the amplitude of all other interfering signals within the channel bandwidth. See the “C/I Menu” on page 4-36.
Measurement Off: Turns the measurement off.
More: Opens the “Measure 2/2 Menu” on page 4-37.
Figure 4-25. IA Spectrum Menu
Measurement Off
Spectrum
Field
Strength
OCC BW
Channel
Power
ACPR
AM/FM
Demod
C/I
More

4-13 Measurements Menu Interference Analyzer (Option 25)
4-32 PN: 10580-00231 Rev. F Spectrum Analyzer MG
Field Strength Menu
Key Sequence: Measurements > Spectrum > Field Strength
OCC BW Menu
Key Sequence: Measurements > Spectrum > OCC BW
On/Off: Turns field strength measurements on or off.
Antenna: This submenu key brings up a dialog box that lists all the antennas for which the instrument has data, including both standard antennas and custom antennas that have been added using Master Software Tools. Use the Up/Down arrow keys or the rotary knob to select the desired antenna and press Enter.
Back: Returns to the “Spectrum Menu” on page 4-31.
Figure 4-26. IA Field Strength Menu
On/Off: This submenu key turns the Occupied Bandwidth on or off.
Method: Select either the % of Power (default) or dB Down measurement method as displayed in the message area.
% Int Pwr: Use the keypad, the directional arrow keys, or the rotary knob to enter the percent of power, from 0 % to 99 %.
> dBc: Use the keypad, the directional arrow keys, or the rotary knob to enter the dBc value (0 dBc to 100 dBc).
Back: Returns to the “Spectrum Menu” on page 4-31.
Figure 4-27. IA OCC BW Menu
F Strength
Back
Antenna
On
Off
%
99.00 %
dBc
3
Method
% Int Pwr > dBc
OCC BW
On
Off
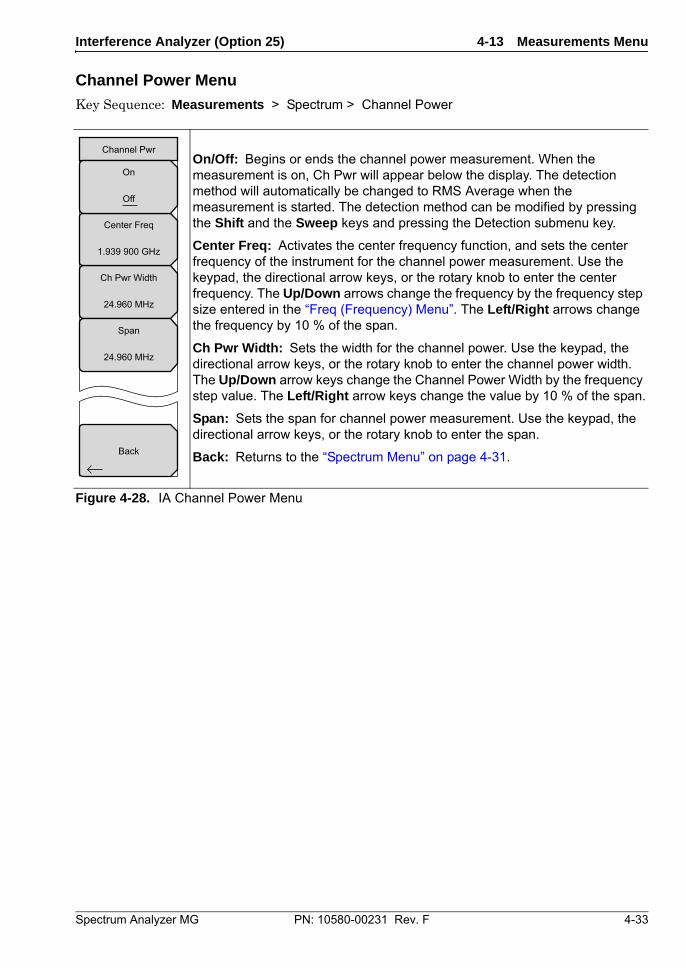
Interference Analyzer (Option 25) 4-13 Measurements Menu
Spectrum Analyzer MG PN: 10580-00231 Rev. F 4-33
Channel Power Menu
Key Sequence: Measurements > Spectrum > Channel Power
On/Off: Begins or ends the channel power measurement. When the measurement is on, Ch Pwr will appear below the display. The detection method will automatically be changed to RMS Average when the measurement is started. The detection method can be modified by pressing the Shift and the Sweep keys and pressing the Detection submenu key.
Center Freq: Activates the center frequency function, and sets the center frequency of the instrument for the channel power measurement. Use the keypad, the directional arrow keys, or the rotary knob to enter the center frequency. The Up/Down arrows change the frequency by the frequency step size entered in the “Freq (Frequency) Menu”. The Left/Right arrows change the frequency by 10 % of the span.
Ch Pwr Width: Sets the width for the channel power. Use the keypad, the directional arrow keys, or the rotary knob to enter the channel power width. The Up/Down arrow keys change the Channel Power Width by the frequency step value. The Left/Right arrow keys change the value by 10 % of the span.
Span: Sets the span for channel power measurement. Use the keypad, the directional arrow keys, or the rotary knob to enter the span.
Back: Returns to the “Spectrum Menu” on page 4-31.
Figure 4-28. IA Channel Power Menu
Ch Pwr Width
24.960 MHz
Span
24.960 MHz
Center Freq
1.939 900 GHz
Channel Pwr
Back
On
Off
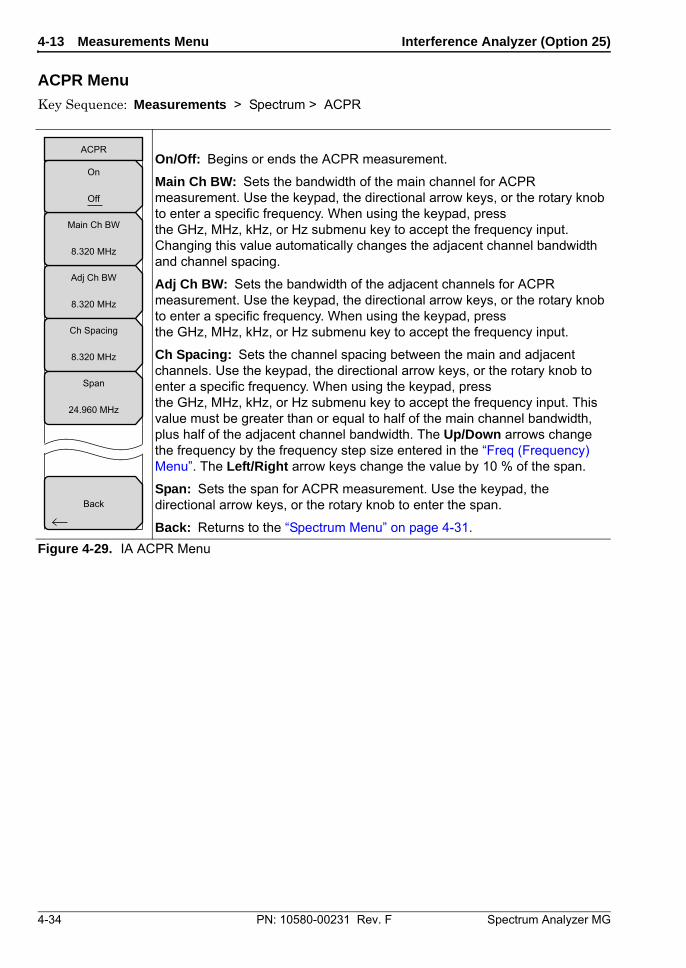
4-13 Measurements Menu Interference Analyzer (Option 25)
4-34 PN: 10580-00231 Rev. F Spectrum Analyzer MG
ACPR Menu
Key Sequence: Measurements > Spectrum > ACPR
On/Off: Begins or ends the ACPR measurement.
Main Ch BW: Sets the bandwidth of the main channel for ACPR measurement. Use the keypad, the directional arrow keys, or the rotary knob to enter a specific frequency. When using the keypad, press the GHz, MHz, kHz, or Hz submenu key to accept the frequency input. Changing this value automatically changes the adjacent channel bandwidth and channel spacing.
Adj Ch BW: Sets the bandwidth of the adjacent channels for ACPR measurement. Use the keypad, the directional arrow keys, or the rotary knob to enter a specific frequency. When using the keypad, press the GHz, MHz, kHz, or Hz submenu key to accept the frequency input.
Ch Spacing: Sets the channel spacing between the main and adjacent channels. Use the keypad, the directional arrow keys, or the rotary knob to enter a specific frequency. When using the keypad, press the GHz, MHz, kHz, or Hz submenu key to accept the frequency input. This value must be greater than or equal to half of the main channel bandwidth, plus half of the adjacent channel bandwidth. The Up/Down arrows change the frequency by the frequency step size entered in the “Freq (Frequency) Menu”. The Left/Right arrow keys change the value by 10 % of the span.
Span: Sets the span for ACPR measurement. Use the keypad, the directional arrow keys, or the rotary knob to enter the span.
Back: Returns to the “Spectrum Menu” on page 4-31.
Figure 4-29. IA ACPR Menu
Adj Ch BW
8.320 MHz
Ch Spacing
8.320 MHz
Span
24.960 MHz
Main Ch BW
8.320 MHz
ACPR
Back
On
Off
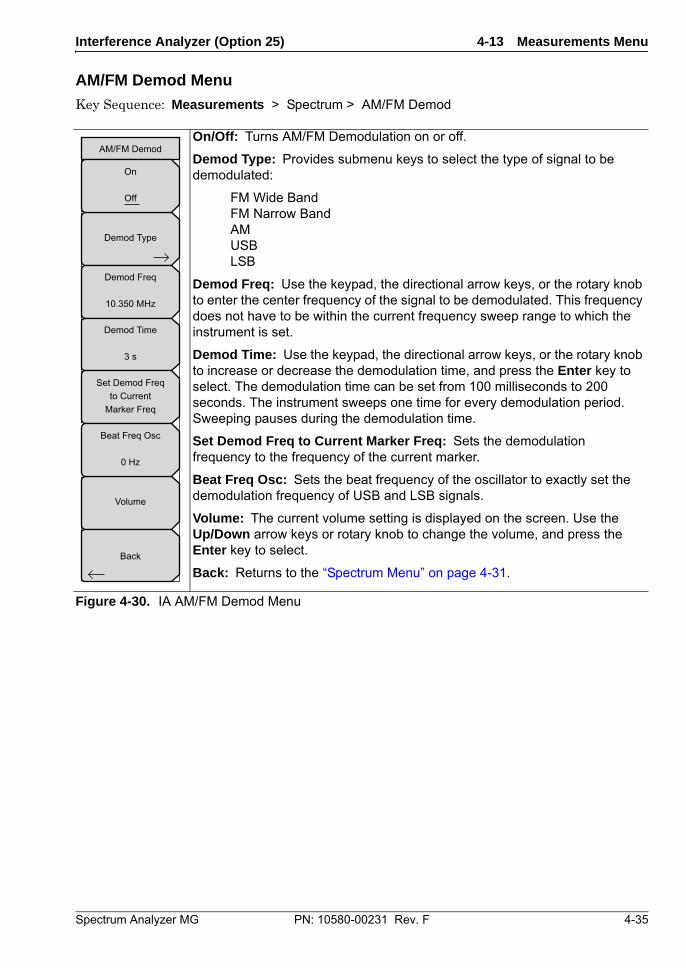
Interference Analyzer (Option 25) 4-13 Measurements Menu
Spectrum Analyzer MG PN: 10580-00231 Rev. F 4-35
AM/FM Demod Menu
Key Sequence: Measurements > Spectrum > AM/FM Demod
On/Off: Turns AM/FM Demodulation on or off.
Demod Type: Provides submenu keys to select the type of signal to be demodulated:
FM Wide BandFM Narrow BandAMUSBLSB
Demod Freq: Use the keypad, the directional arrow keys, or the rotary knob to enter the center frequency of the signal to be demodulated. This frequency does not have to be within the current frequency sweep range to which the instrument is set.
Demod Time: Use the keypad, the directional arrow keys, or the rotary knob to increase or decrease the demodulation time, and press the Enter key to select. The demodulation time can be set from 100 milliseconds to 200 seconds. The instrument sweeps one time for every demodulation period. Sweeping pauses during the demodulation time.
Set Demod Freq to Current Marker Freq: Sets the demodulation frequency to the frequency of the current marker.
Beat Freq Osc: Sets the beat frequency of the oscillator to exactly set the demodulation frequency of USB and LSB signals.
Volume: The current volume setting is displayed on the screen. Use the Up/Down arrow keys or rotary knob to change the volume, and press the Enter key to select.
Back: Returns to the “Spectrum Menu” on page 4-31.
Figure 4-30. IA AM/FM Demod Menu
Demod Type
AM/FM Demod
Demod Freq
10.350 MHz
Demod Time
3 s
Volume
Set Demod Freqto Current
Marker Freq
Beat Freq Osc
0 Hz
Back
On
Off
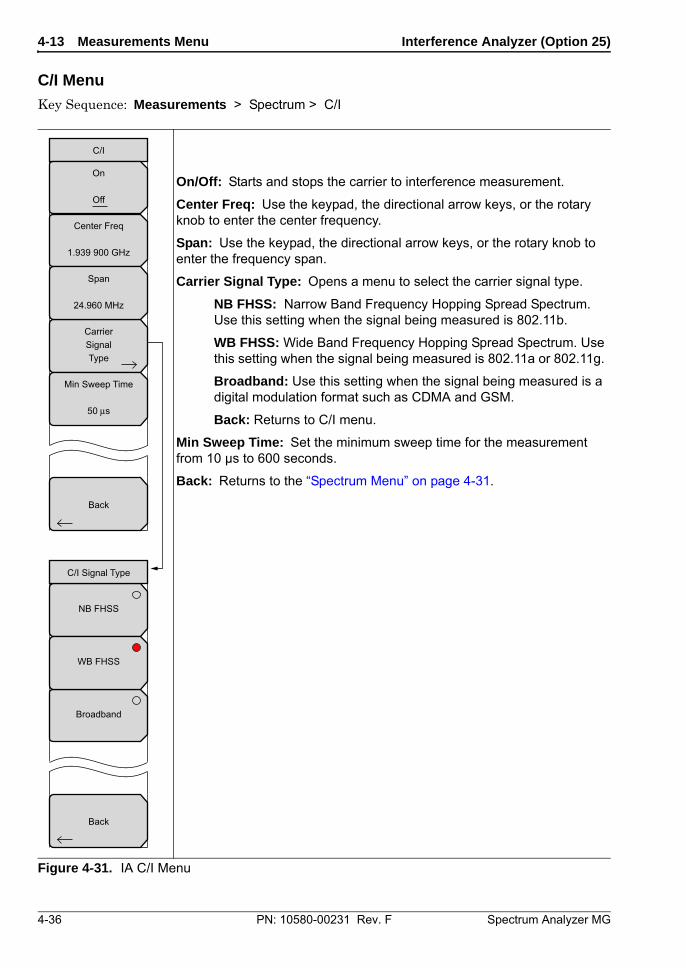
4-13 Measurements Menu Interference Analyzer (Option 25)
4-36 PN: 10580-00231 Rev. F Spectrum Analyzer MG
C/I Menu
Key Sequence: Measurements > Spectrum > C/I
On/Off: Starts and stops the carrier to interference measurement.
Center Freq: Use the keypad, the directional arrow keys, or the rotary knob to enter the center frequency.
Span: Use the keypad, the directional arrow keys, or the rotary knob to enter the frequency span.
Carrier Signal Type: Opens a menu to select the carrier signal type.
NB FHSS: Narrow Band Frequency Hopping Spread Spectrum. Use this setting when the signal being measured is 802.11b.
WB FHSS: Wide Band Frequency Hopping Spread Spectrum. Use this setting when the signal being measured is 802.11a or 802.11g.
Broadband: Use this setting when the signal being measured is a digital modulation format such as CDMA and GSM.
Back: Returns to C/I menu.
Min Sweep Time: Set the minimum sweep time for the measurement from 10 μs to 600 seconds.
Back: Returns to the “Spectrum Menu” on page 4-31.
Figure 4-31. IA C/I Menu
C/I
CarrierSignalType
Back
On
Off
Center Freq
1.939 900 GHz
Span
24.960 MHz
Min Sweep Time
50 s
NB FHSS
Broadband
WB FHSS
C/I Signal Type
Back
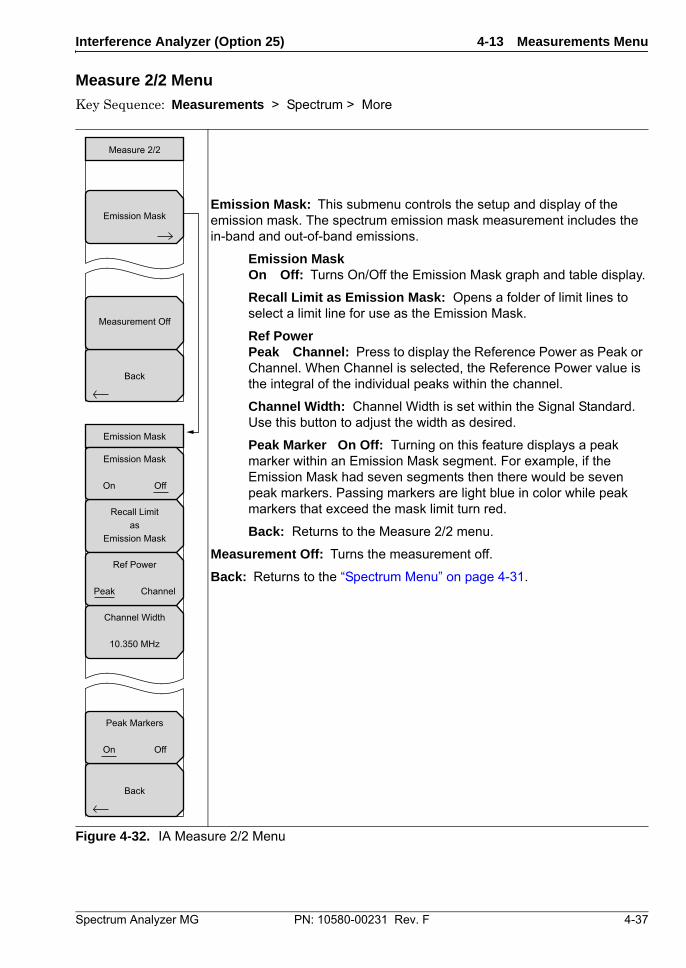
Interference Analyzer (Option 25) 4-13 Measurements Menu
Spectrum Analyzer MG PN: 10580-00231 Rev. F 4-37
Measure 2/2 Menu
Key Sequence: Measurements > Spectrum > More
Emission Mask: This submenu controls the setup and display of the emission mask. The spectrum emission mask measurement includes the in-band and out-of-band emissions.
Emission MaskOn Off: Turns On/Off the Emission Mask graph and table display.
Recall Limit as Emission Mask: Opens a folder of limit lines to select a limit line for use as the Emission Mask.
Ref PowerPeak Channel: Press to display the Reference Power as Peak or Channel. When Channel is selected, the Reference Power value is the integral of the individual peaks within the channel.
Channel Width: Channel Width is set within the Signal Standard. Use this button to adjust the width as desired.
Peak Marker On Off: Turning on this feature displays a peak marker within an Emission Mask segment. For example, if the Emission Mask had seven segments then there would be seven peak markers. Passing markers are light blue in color while peak markers that exceed the mask limit turn red.
Back: Returns to the Measure 2/2 menu.
Measurement Off: Turns the measurement off.
Back: Returns to the “Spectrum Menu” on page 4-31.
Figure 4-32. IA Measure 2/2 Menu
Emission Mask
Measure 2/2
Back
Measurement Off
Recall Limitas
Emission Mask
Channel Width
10.350 MHz
Emission Mask
Back
Emission Mask
On Off
Peak Markers
On Off
Ref Power
Peak Channel
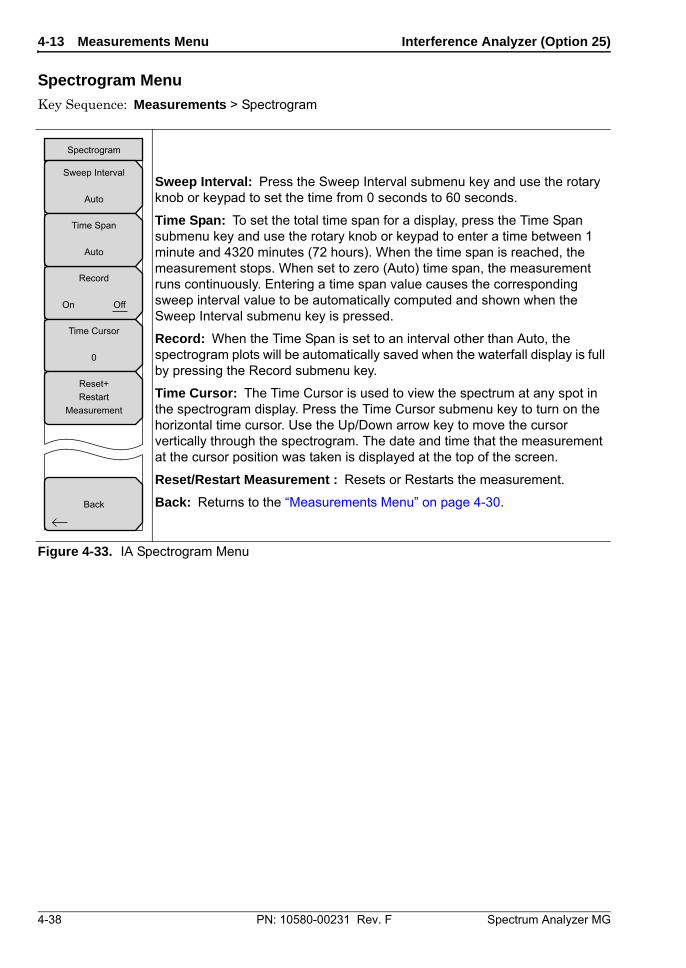
4-13 Measurements Menu Interference Analyzer (Option 25)
4-38 PN: 10580-00231 Rev. F Spectrum Analyzer MG
Spectrogram Menu
Key Sequence: Measurements > Spectrogram
Sweep Interval: Press the Sweep Interval submenu key and use the rotary knob or keypad to set the time from 0 seconds to 60 seconds.
Time Span: To set the total time span for a display, press the Time Span submenu key and use the rotary knob or keypad to enter a time between 1 minute and 4320 minutes (72 hours). When the time span is reached, the measurement stops. When set to zero (Auto) time span, the measurement runs continuously. Entering a time span value causes the corresponding sweep interval value to be automatically computed and shown when the Sweep Interval submenu key is pressed.
Record: When the Time Span is set to an interval other than Auto, the spectrogram plots will be automatically saved when the waterfall display is full by pressing the Record submenu key.
Time Cursor: The Time Cursor is used to view the spectrum at any spot in the spectrogram display. Press the Time Cursor submenu key to turn on the horizontal time cursor. Use the Up/Down arrow key to move the cursor vertically through the spectrogram. The date and time that the measurement at the cursor position was taken is displayed at the top of the screen.
Reset/Restart Measurement : Resets or Restarts the measurement.
Back: Returns to the “Measurements Menu” on page 4-30.
Figure 4-33. IA Spectrogram Menu
Record
On Off
Spectrogram
Back
Sweep Interval
Auto
Time Span
Auto
Time Cursor
0
Reset+Restart
Measurement
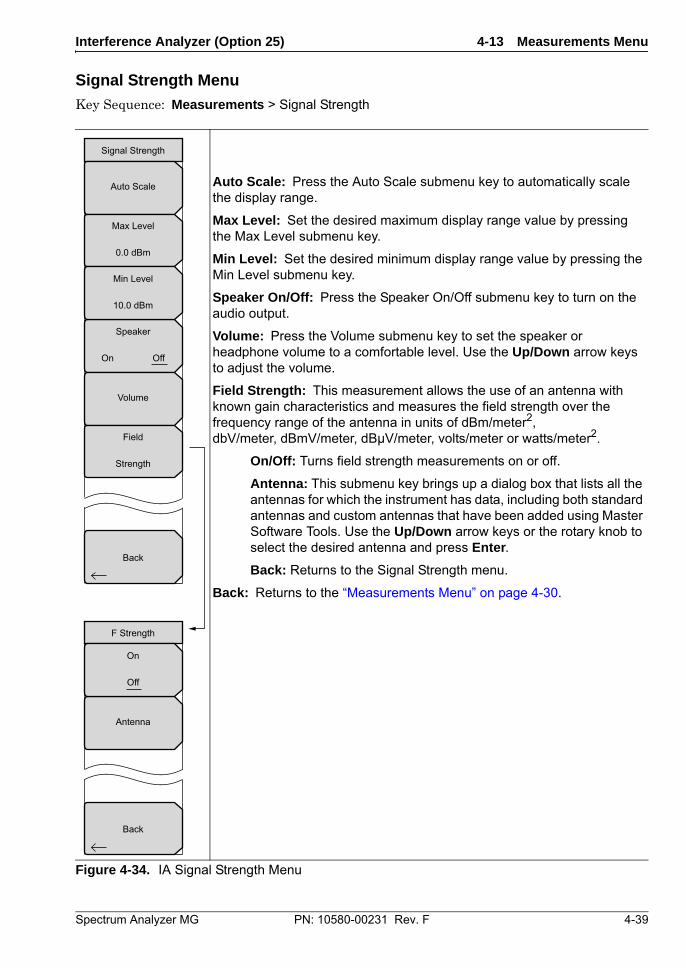
Interference Analyzer (Option 25) 4-13 Measurements Menu
Spectrum Analyzer MG PN: 10580-00231 Rev. F 4-39
Signal Strength Menu
Key Sequence: Measurements > Signal Strength
Auto Scale: Press the Auto Scale submenu key to automatically scale the display range.
Max Level: Set the desired maximum display range value by pressing the Max Level submenu key.
Min Level: Set the desired minimum display range value by pressing the Min Level submenu key.
Speaker On/Off: Press the Speaker On/Off submenu key to turn on the audio output.
Volume: Press the Volume submenu key to set the speaker or headphone volume to a comfortable level. Use the Up/Down arrow keys to adjust the volume.
Field Strength: This measurement allows the use of an antenna with known gain characteristics and measures the field strength over the frequency range of the antenna in units of dBm/meter2, dbV/meter, dBmV/meter, dBµV/meter, volts/meter or watts/meter2.
On/Off: Turns field strength measurements on or off.
Antenna: This submenu key brings up a dialog box that lists all the antennas for which the instrument has data, including both standard antennas and custom antennas that have been added using Master Software Tools. Use the Up/Down arrow keys or the rotary knob to select the desired antenna and press Enter.
Back: Returns to the Signal Strength menu.
Back: Returns to the “Measurements Menu” on page 4-30.
Figure 4-34. IA Signal Strength Menu
Speaker
On Off
Signal Strength
Back
Auto Scale
Max Level
0.0 dBm
Min Level
10.0 dBm
Volume
Field
Strength
F Strength
Back
Antenna
On
Off
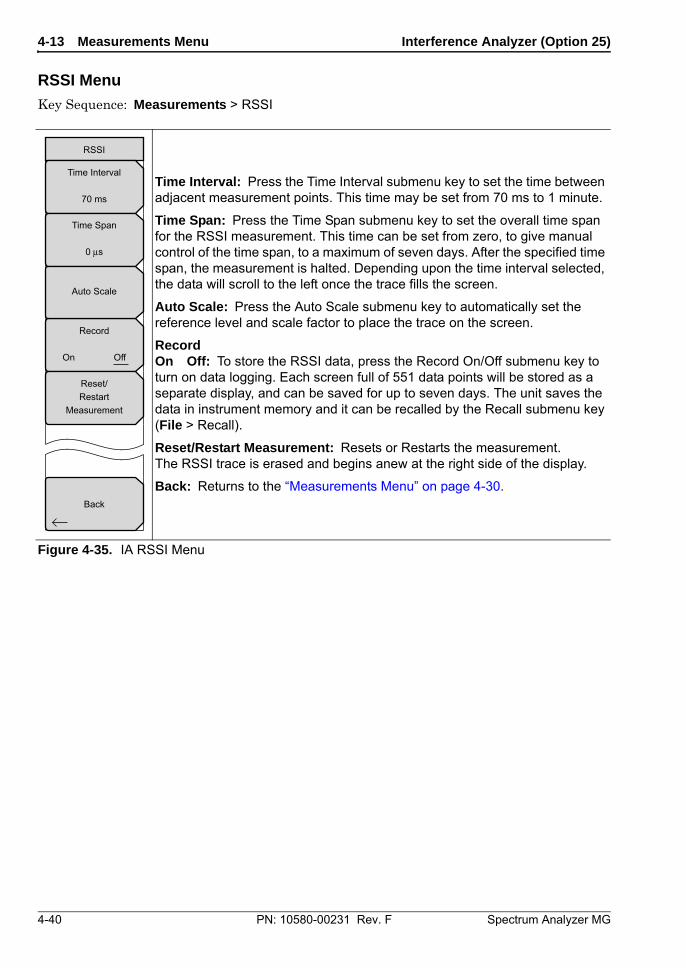
4-13 Measurements Menu Interference Analyzer (Option 25)
4-40 PN: 10580-00231 Rev. F Spectrum Analyzer MG
RSSI Menu
Key Sequence: Measurements > RSSI
Time Interval: Press the Time Interval submenu key to set the time between adjacent measurement points. This time may be set from 70 ms to 1 minute.
Time Span: Press the Time Span submenu key to set the overall time span for the RSSI measurement. This time can be set from zero, to give manual control of the time span, to a maximum of seven days. After the specified time span, the measurement is halted. Depending upon the time interval selected, the data will scroll to the left once the trace fills the screen.
Auto Scale: Press the Auto Scale submenu key to automatically set the reference level and scale factor to place the trace on the screen.
RecordOn Off: To store the RSSI data, press the Record On/Off submenu key to turn on data logging. Each screen full of 551 data points will be stored as a separate display, and can be saved for up to seven days. The unit saves the data in instrument memory and it can be recalled by the Recall submenu key (File > Recall).
Reset/Restart Measurement: Resets or Restarts the measurement. The RSSI trace is erased and begins anew at the right side of the display.
Back: Returns to the “Measurements Menu” on page 4-30.
Figure 4-35. IA RSSI Menu
Record
On Off
RSSI
Back
Time Interval
70 ms
Time Span
0 s
Auto Scale
Reset/Restart
Measurement
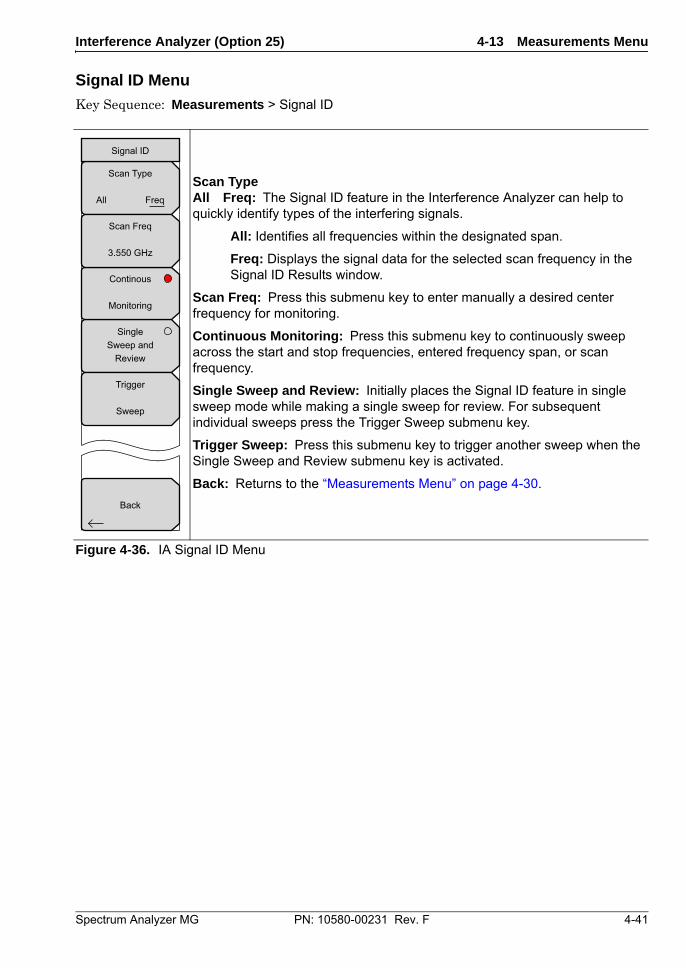
Interference Analyzer (Option 25) 4-13 Measurements Menu
Spectrum Analyzer MG PN: 10580-00231 Rev. F 4-41
Signal ID Menu
Key Sequence: Measurements > Signal ID
Scan TypeAll Freq: The Signal ID feature in the Interference Analyzer can help to quickly identify types of the interfering signals.
All: Identifies all frequencies within the designated span.
Freq: Displays the signal data for the selected scan frequency in the Signal ID Results window.
Scan Freq: Press this submenu key to enter manually a desired center frequency for monitoring.
Continuous Monitoring: Press this submenu key to continuously sweep across the start and stop frequencies, entered frequency span, or scan frequency.
Single Sweep and Review: Initially places the Signal ID feature in single sweep mode while making a single sweep for review. For subsequent individual sweeps press the Trigger Sweep submenu key.
Trigger Sweep: Press this submenu key to trigger another sweep when the Single Sweep and Review submenu key is activated.
Back: Returns to the “Measurements Menu” on page 4-30.
Figure 4-36. IA Signal ID Menu
SingleSweep and
Review
Continous
Monitoring
Scan Type
All Freq
Signal ID
Back
Scan Freq
3.550 GHz
Trigger
Sweep

4-13 Measurements Menu Interference Analyzer (Option 25)
4-42 PN: 10580-00231 Rev. F Spectrum Analyzer MG
Interference Mapping Menu
Key Sequence: Measurements > Interference Mapping
Save Current Point Location & Direction: Pressing this button saves the location and direction of the current point and direction setup on the screen. The direction is indicated by the dark red line. This can be rotated around the current location with the rotary knob.
Save Current Point Location & Direction: Opens the “Mapping Save/Recall Menu” on page 4-43.
Delete Last Saved Point: This deletes the last saved point and direction from the screen.
Delete All Points: Clears the screen of all the points and directions currently displayed.
SpeakerOn Off: Sounds a tone based on received signal strength. Off mutes the speaker.
Volume: Adjust the volume when the Speaker submenu key is On.
Reset Max/Min Hold: The lower and upper limit in the graph are adjusted and updated continuously to display the highest and lowest values. Press this button to reset the Max and Min values.
Back: Returns to the “Measurements Menu” on page 4-30.
Figure 4-37. IA Interference Mapping Menu
DeleteALL
Points
DeleteLast
Saved Point
ResetMax/Min
Hold
Interference Mapping
Back
Save Current Point
Location & Direction
Speaker
On Off
Volume
Save/Recall
Points/Map
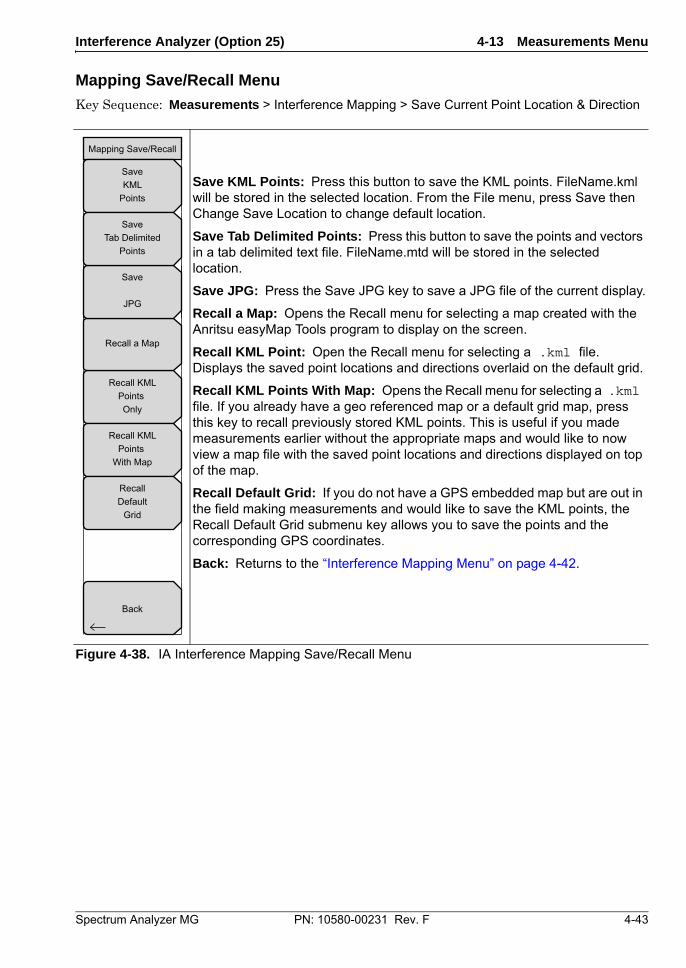
Interference Analyzer (Option 25) 4-13 Measurements Menu
Spectrum Analyzer MG PN: 10580-00231 Rev. F 4-43
Mapping Save/Recall Menu
Key Sequence: Measurements > Interference Mapping > Save Current Point Location & Direction
Save KML Points: Press this button to save the KML points. FileName.kml will be stored in the selected location. From the File menu, press Save then Change Save Location to change default location.
Save Tab Delimited Points: Press this button to save the points and vectors in a tab delimited text file. FileName.mtd will be stored in the selected location.
Save JPG: Press the Save JPG key to save a JPG file of the current display.
Recall a Map: Opens the Recall menu for selecting a map created with the Anritsu easyMap Tools program to display on the screen.
Recall KML Point: Open the Recall menu for selecting a .kml file. Displays the saved point locations and directions overlaid on the default grid.
Recall KML Points With Map: Opens the Recall menu for selecting a .kml file. If you already have a geo referenced map or a default grid map, press this key to recall previously stored KML points. This is useful if you made measurements earlier without the appropriate maps and would like to now view a map file with the saved point locations and directions displayed on top of the map.
Recall Default Grid: If you do not have a GPS embedded map but are out in the field making measurements and would like to save the KML points, the Recall Default Grid submenu key allows you to save the points and the corresponding GPS coordinates.
Back: Returns to the “Interference Mapping Menu” on page 4-42.
Figure 4-38. IA Interference Mapping Save/Recall Menu
Recall KMLPoints Only
Recall KMLPoints
With Map
RecallDefault
Grid
Recall a Map
Mapping Save/Recall
Back
SaveKML
Points
Save
JPG
SaveTab Delimited
Points
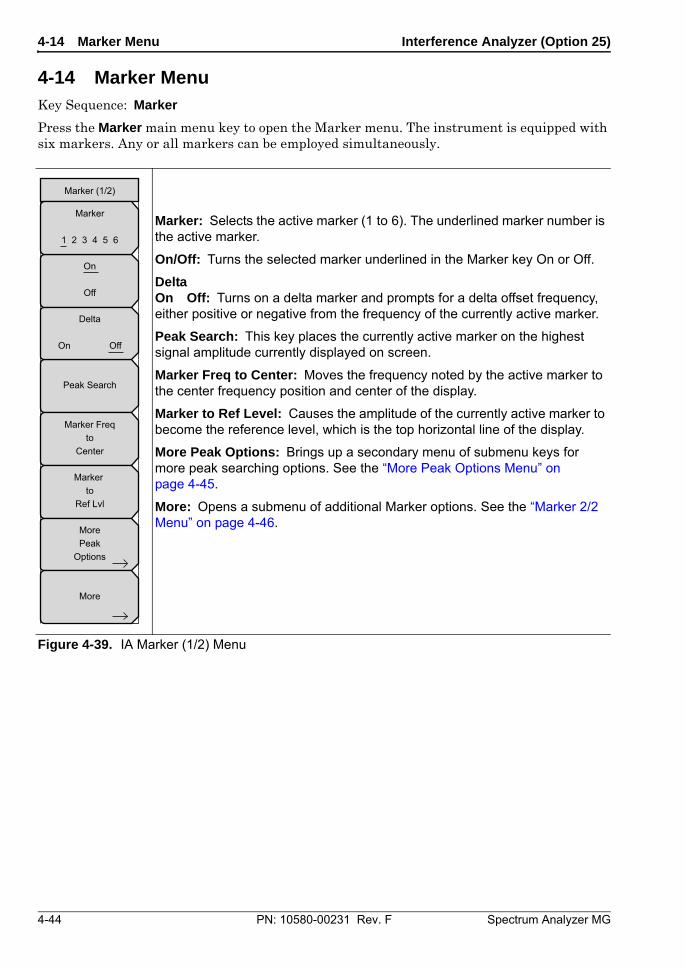
4-14 Marker Menu Interference Analyzer (Option 25)
4-44 PN: 10580-00231 Rev. F Spectrum Analyzer MG
4-14 Marker Menu Key Sequence: Marker
Press the Marker main menu key to open the Marker menu. The instrument is equipped with six markers. Any or all markers can be employed simultaneously.
Marker: Selects the active marker (1 to 6). The underlined marker number is the active marker.
On/Off: Turns the selected marker underlined in the Marker key On or Off.
DeltaOn Off: Turns on a delta marker and prompts for a delta offset frequency, either positive or negative from the frequency of the currently active marker.
Peak Search: This key places the currently active marker on the highest signal amplitude currently displayed on screen.
Marker Freq to Center: Moves the frequency noted by the active marker to the center frequency position and center of the display.
Marker to Ref Level: Causes the amplitude of the currently active marker to become the reference level, which is the top horizontal line of the display.
More Peak Options: Brings up a secondary menu of submenu keys for more peak searching options. See the “More Peak Options Menu” on page 4-45.
More: Opens a submenu of additional Marker options. See the “Marker 2/2 Menu” on page 4-46.
Figure 4-39. IA Marker (1/2) Menu
Marker (1/2)
On
Off
Peak Search
Marker Freqto
Center
Marker to
Ref Lvl
Marker
1 2 3 4 5 6
MorePeak
Options
More
Delta
On Off
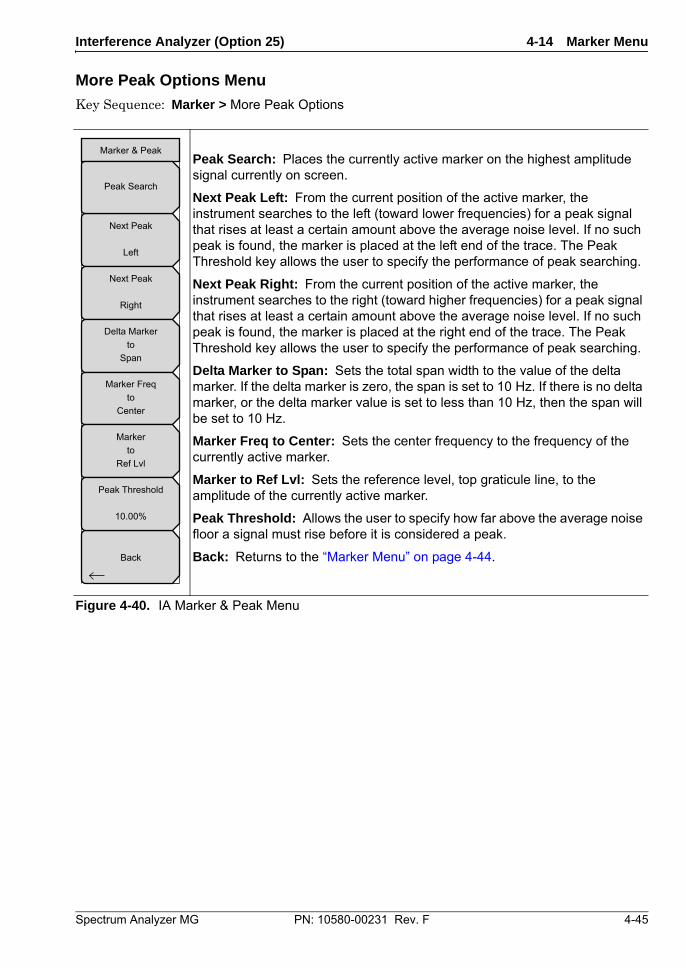
Interference Analyzer (Option 25) 4-14 Marker Menu
Spectrum Analyzer MG PN: 10580-00231 Rev. F 4-45
More Peak Options Menu
Key Sequence: Marker > More Peak Options
Peak Search: Places the currently active marker on the highest amplitude signal currently on screen.
Next Peak Left: From the current position of the active marker, the instrument searches to the left (toward lower frequencies) for a peak signal that rises at least a certain amount above the average noise level. If no such peak is found, the marker is placed at the left end of the trace. The Peak Threshold key allows the user to specify the performance of peak searching.
Next Peak Right: From the current position of the active marker, the instrument searches to the right (toward higher frequencies) for a peak signal that rises at least a certain amount above the average noise level. If no such peak is found, the marker is placed at the right end of the trace. The Peak Threshold key allows the user to specify the performance of peak searching.
Delta Marker to Span: Sets the total span width to the value of the delta marker. If the delta marker is zero, the span is set to 10 Hz. If there is no delta marker, or the delta marker value is set to less than 10 Hz, then the span will be set to 10 Hz.
Marker Freq to Center: Sets the center frequency to the frequency of the currently active marker.
Marker to Ref Lvl: Sets the reference level, top graticule line, to the amplitude of the currently active marker.
Peak Threshold: Allows the user to specify how far above the average noise floor a signal must rise before it is considered a peak.
Back: Returns to the “Marker Menu” on page 4-44.
Figure 4-40. IA Marker & Peak Menu
Marker & Peak
Back
Next Peak
Left
Next Peak
Right
Delta Markerto
Span
Marker Freqto
Center
Markerto
Ref Lvl
Peak Threshold
10.00%
Peak Search
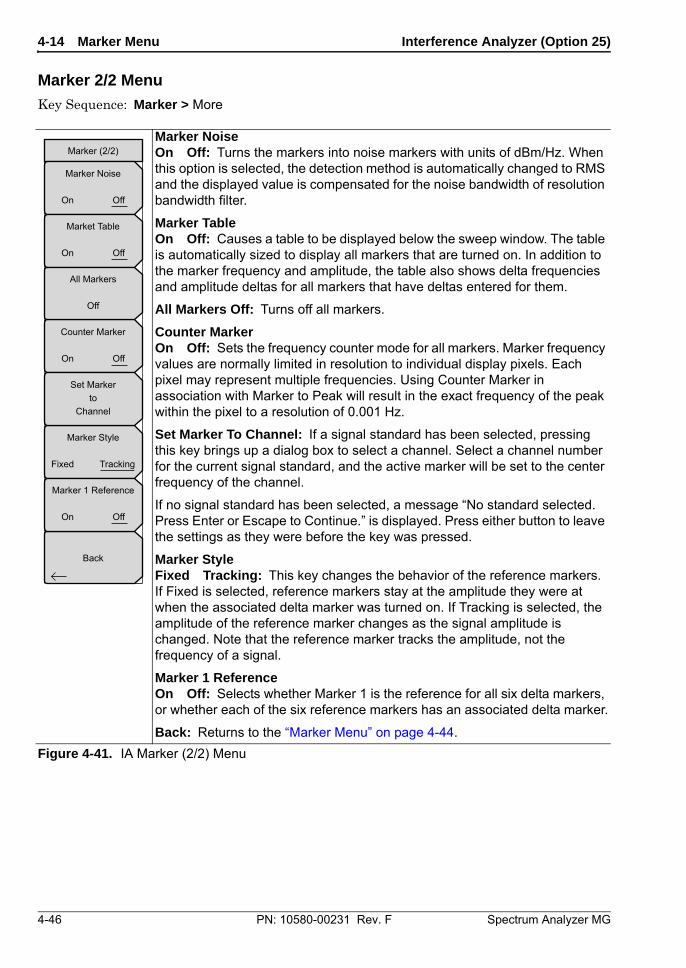
4-14 Marker Menu Interference Analyzer (Option 25)
4-46 PN: 10580-00231 Rev. F Spectrum Analyzer MG
Marker 2/2 Menu
Key Sequence: Marker > More
Marker NoiseOn Off: Turns the markers into noise markers with units of dBm/Hz. When this option is selected, the detection method is automatically changed to RMS and the displayed value is compensated for the noise bandwidth of resolution bandwidth filter.
Marker TableOn Off: Causes a table to be displayed below the sweep window. The table is automatically sized to display all markers that are turned on. In addition to the marker frequency and amplitude, the table also shows delta frequencies and amplitude deltas for all markers that have deltas entered for them.
All Markers Off: Turns off all markers.
Counter MarkerOn Off: Sets the frequency counter mode for all markers. Marker frequency values are normally limited in resolution to individual display pixels. Each pixel may represent multiple frequencies. Using Counter Marker in association with Marker to Peak will result in the exact frequency of the peak within the pixel to a resolution of 0.001 Hz.
Set Marker To Channel: If a signal standard has been selected, pressing this key brings up a dialog box to select a channel. Select a channel number for the current signal standard, and the active marker will be set to the center frequency of the channel.
If no signal standard has been selected, a message “No standard selected. Press Enter or Escape to Continue.” is displayed. Press either button to leave the settings as they were before the key was pressed.
Marker StyleFixed Tracking: This key changes the behavior of the reference markers. If Fixed is selected, reference markers stay at the amplitude they were at when the associated delta marker was turned on. If Tracking is selected, the amplitude of the reference marker changes as the signal amplitude is changed. Note that the reference marker tracks the amplitude, not the frequency of a signal.
Marker 1 ReferenceOn Off: Selects whether Marker 1 is the reference for all six delta markers, or whether each of the six reference markers has an associated delta marker.
Back: Returns to the “Marker Menu” on page 4-44.
Figure 4-41. IA Marker (2/2) Menu
Back
Marker (2/2)
Marker Noise
On Off
Market Table
On Off
Counter Marker
On Off
Marker Style
Fixed Tracking
Marker 1 Reference
On Off
All Markers
Off
Set Markerto
Channel

Interference Analyzer (Option 25) 4-15 Sweep Menu
Spectrum Analyzer MG PN: 10580-00231 Rev. F 4-47
4-15 Sweep Menu Key Sequence: Shift > Sweep (3) key
Sweep Single/Continuous: This submenu key toggles between continuous sweep and single sweep. In single sweep mode, the results of a sweep are displayed on the screen while the instrument awaits a trigger event to start a new sweep.
Manual Trigger: Pressing this submenu key causes the instrument to make a single sweep when the instrument is in single sweep mode. This key has no function when the instrument is in continuous sweep mode.
Sweep Mode: Pressing this submenu key opens the “Sweep Mode Menu” on page 4-48.
Reset Sweep: This submenu key stops the current sweep, clears trace averaging results, clears the maximum hold results, if selected, and restarts the sweep at the left side of the screen.
Detection: Several detection methods tailor the performance of the instrument to meet specific measurement requirements. In general, more measurement points exist across the screen than display points. The various detection methods are different ways of dealing with selecting which measurement point will be shown at each display point. See the “Detection Menu” on page 4-28.
Min Sweep Time: This function allows a minimum sweep time to be specified. Use the keypad, the directional arrow keys, or the rotary knob to set the minimum sweep time from 10 μs to 600 seconds. When using the keypad, the available time units are minutes, seconds, milliseconds and microseconds.
If the required sweep time for accurate measurement is longer than the specified minimum, then the time required for accurate measurements will prevail.
Trigger Type: Sets the type of trigger to be used. See the “Trigger Menu” on page 4-49.
Gated Sweep Setup (Option 90 Only): For configuring Gated Sweep. Opens the “Gate Setup Menu” on page 4-50.
Figure 4-42. IA Sweep Menu
Sweep
Reset
Sweep
Manual
Trigger
Min Sweep Time
50 s
Detection
Trigger
Type
Gated Sweep
Setup
Sweep
Single Continuous
Sweep Mode
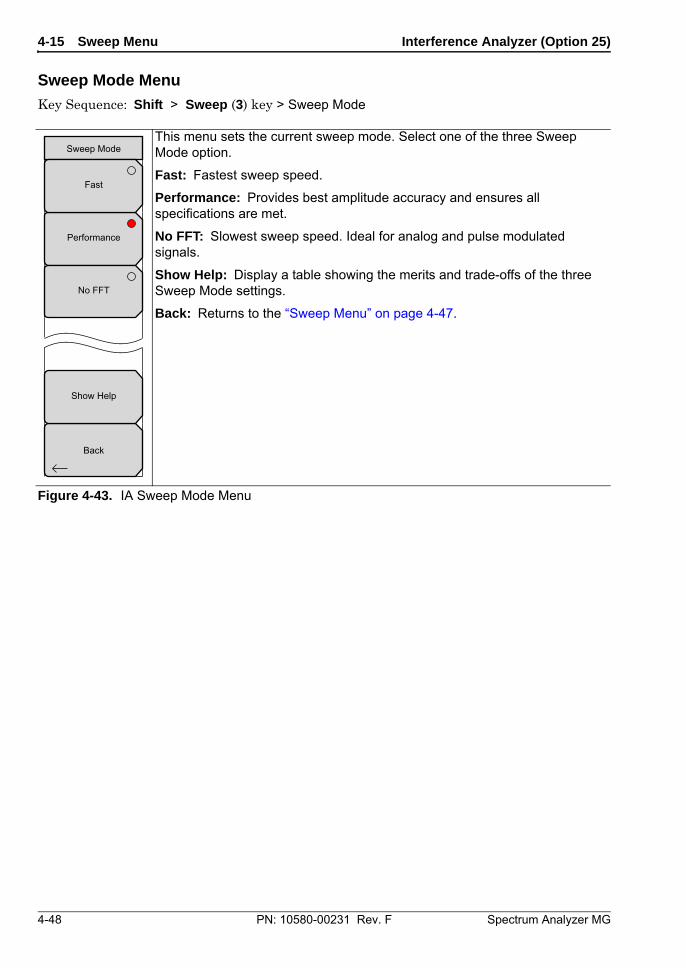
4-15 Sweep Menu Interference Analyzer (Option 25)
4-48 PN: 10580-00231 Rev. F Spectrum Analyzer MG
Sweep Mode Menu
Key Sequence: Shift > Sweep (3) key > Sweep Mode
This menu sets the current sweep mode. Select one of the three Sweep Mode option.
Fast: Fastest sweep speed.
Performance: Provides best amplitude accuracy and ensures all specifications are met.
No FFT: Slowest sweep speed. Ideal for analog and pulse modulated signals.
Show Help: Display a table showing the merits and trade-offs of the three Sweep Mode settings.
Back: Returns to the “Sweep Menu” on page 4-47.
Figure 4-43. IA Sweep Mode Menu
Sweep Mode
Back
Performance
No FFT
Show Help
Fast
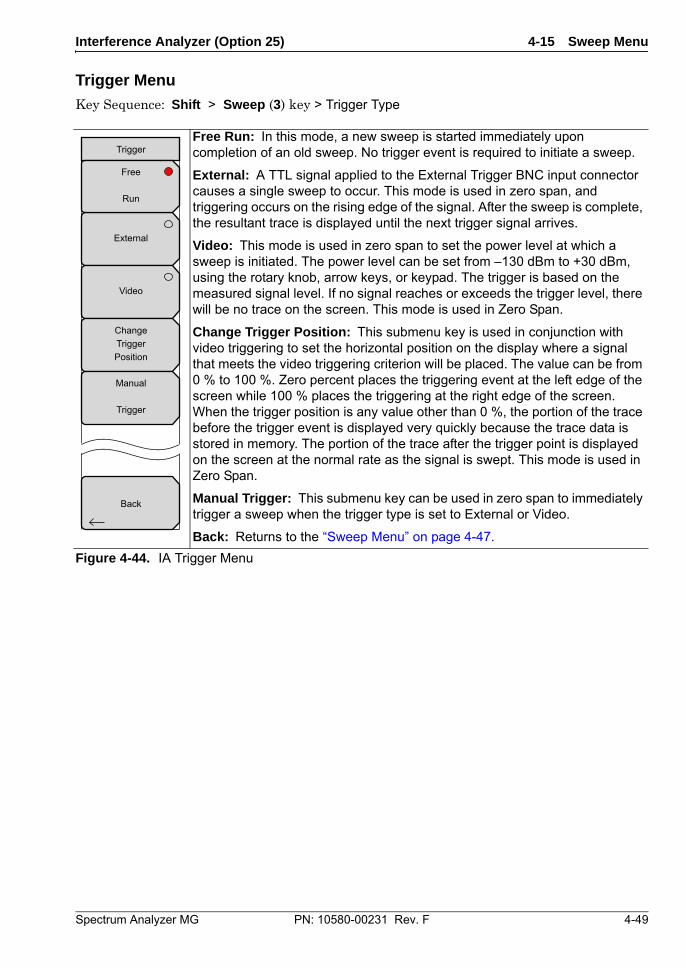
Interference Analyzer (Option 25) 4-15 Sweep Menu
Spectrum Analyzer MG PN: 10580-00231 Rev. F 4-49
Trigger Menu
Key Sequence: Shift > Sweep (3) key > Trigger Type
Free Run: In this mode, a new sweep is started immediately upon completion of an old sweep. No trigger event is required to initiate a sweep.
External: A TTL signal applied to the External Trigger BNC input connector causes a single sweep to occur. This mode is used in zero span, and triggering occurs on the rising edge of the signal. After the sweep is complete, the resultant trace is displayed until the next trigger signal arrives.
Video: This mode is used in zero span to set the power level at which a sweep is initiated. The power level can be set from –130 dBm to +30 dBm, using the rotary knob, arrow keys, or keypad. The trigger is based on the measured signal level. If no signal reaches or exceeds the trigger level, there will be no trace on the screen. This mode is used in Zero Span.
Change Trigger Position: This submenu key is used in conjunction with video triggering to set the horizontal position on the display where a signal that meets the video triggering criterion will be placed. The value can be from 0 % to 100 %. Zero percent places the triggering event at the left edge of the screen while 100 % places the triggering at the right edge of the screen. When the trigger position is any value other than 0 %, the portion of the trace before the trigger event is displayed very quickly because the trace data is stored in memory. The portion of the trace after the trigger point is displayed on the screen at the normal rate as the signal is swept. This mode is used in Zero Span.
Manual Trigger: This submenu key can be used in zero span to immediately trigger a sweep when the trigger type is set to External or Video.
Back: Returns to the “Sweep Menu” on page 4-47.
Figure 4-44. IA Trigger Menu
Trigger
Back
External
Video
ChangeTriggerPosition
Manual
Trigger
Free
Run
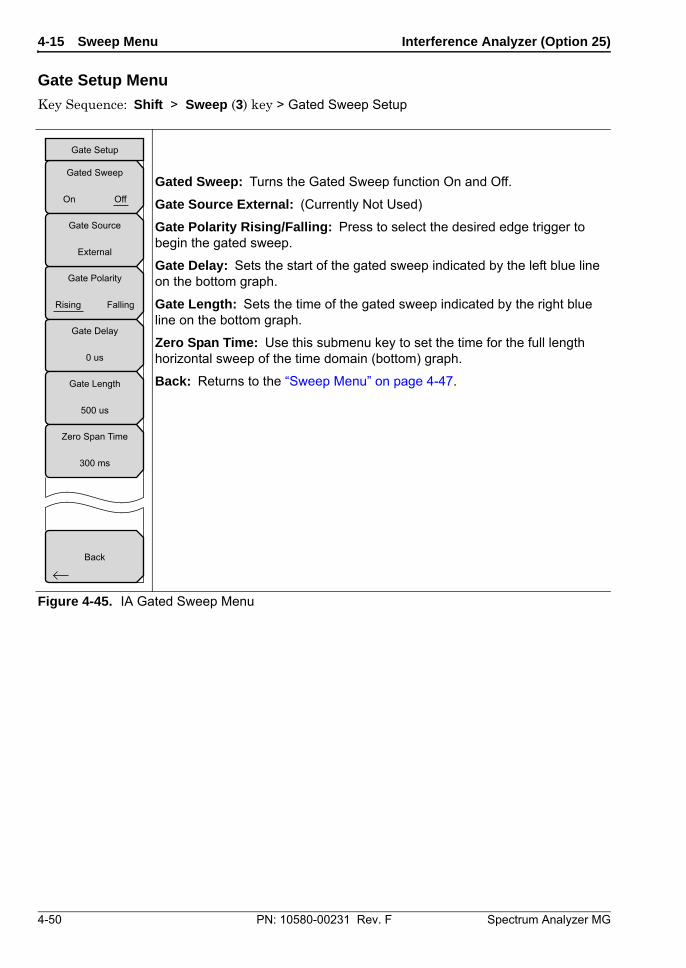
4-15 Sweep Menu Interference Analyzer (Option 25)
4-50 PN: 10580-00231 Rev. F Spectrum Analyzer MG
Gate Setup Menu
Key Sequence: Shift > Sweep (3) key > Gated Sweep Setup
Gated Sweep: Turns the Gated Sweep function On and Off.
Gate Source External: (Currently Not Used)
Gate Polarity Rising/Falling: Press to select the desired edge trigger to begin the gated sweep.
Gate Delay: Sets the start of the gated sweep indicated by the left blue line on the bottom graph.
Gate Length: Sets the time of the gated sweep indicated by the right blue line on the bottom graph.
Zero Span Time: Use this submenu key to set the time for the full length horizontal sweep of the time domain (bottom) graph.
Back: Returns to the “Sweep Menu” on page 4-47.
Figure 4-45. IA Gated Sweep Menu
Gated Sweep
On Off
Gate Polarity
Rising Falling
Gate Setup
Back
Gate Source
External
Gate Delay
0 us
Gate Length
500 us
Zero Span Time
300 ms
Interference Analyzer (Option 25) 4-16 Measure Menu
Spectrum Analyzer MG PN: 10580-00231 Rev. F 4-51
4-16 Measure MenuKey Sequence: Shift > Measure (4)
Pressing the Measure key opens the “Spectrum Menu” on page 4-31.
NoteThis menu is active only when making Spectrum measurements. It is not operational in Spectrogram, Signal Strength, RSSI, Signal ID, or Interference Mapping measurements.
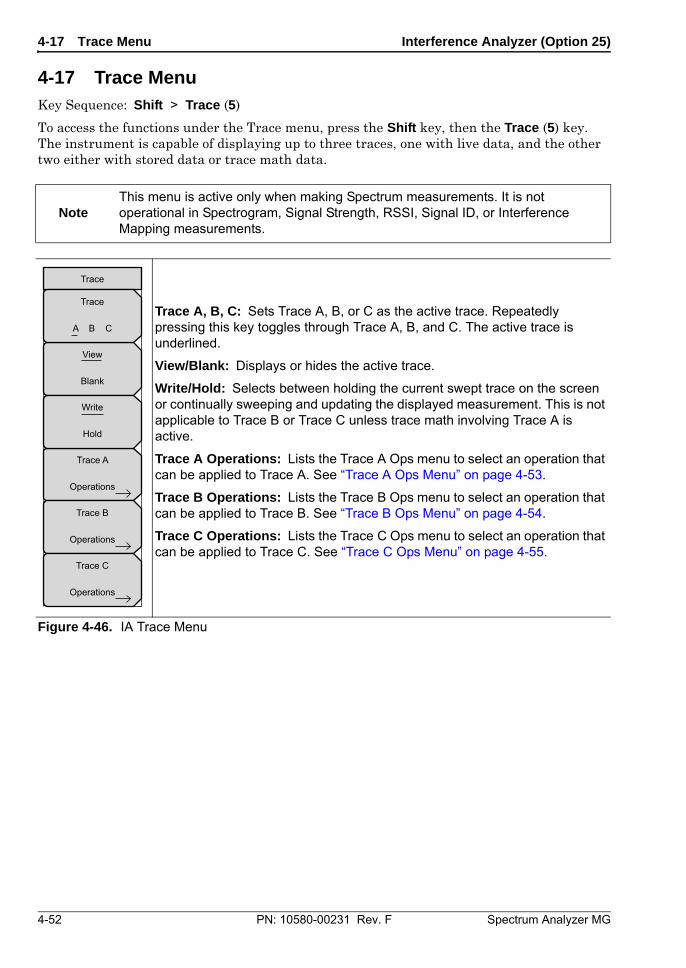
4-17 Trace Menu Interference Analyzer (Option 25)
4-52 PN: 10580-00231 Rev. F Spectrum Analyzer MG
4-17 Trace Menu Key Sequence: Shift > Trace (5)
To access the functions under the Trace menu, press the Shift key, then the Trace (5) key. The instrument is capable of displaying up to three traces, one with live data, and the other two either with stored data or trace math data.
NoteThis menu is active only when making Spectrum measurements. It is not operational in Spectrogram, Signal Strength, RSSI, Signal ID, or Interference Mapping measurements.
Trace A, B, C: Sets Trace A, B, or C as the active trace. Repeatedly pressing this key toggles through Trace A, B, and C. The active trace is underlined.
View/Blank: Displays or hides the active trace.
Write/Hold: Selects between holding the current swept trace on the screen or continually sweeping and updating the displayed measurement. This is not applicable to Trace B or Trace C unless trace math involving Trace A is active.
Trace A Operations: Lists the Trace A Ops menu to select an operation that can be applied to Trace A. See “Trace A Ops Menu” on page 4-53.
Trace B Operations: Lists the Trace B Ops menu to select an operation that can be applied to Trace B. See “Trace B Ops Menu” on page 4-54.
Trace C Operations: Lists the Trace C Ops menu to select an operation that can be applied to Trace C. See “Trace C Ops Menu” on page 4-55.
Figure 4-46. IA Trace Menu
Trace
Trace A
Operations
Trace B
Operations
Trace C
Operations
View
Blank
Trace
A B C
Write
Hold
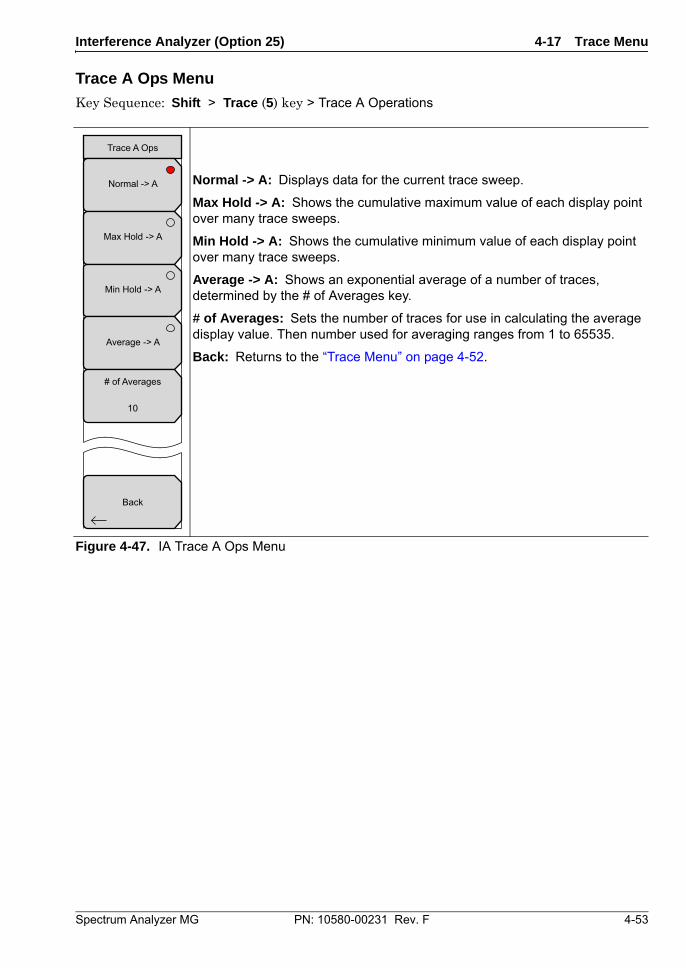
Interference Analyzer (Option 25) 4-17 Trace Menu
Spectrum Analyzer MG PN: 10580-00231 Rev. F 4-53
Trace A Ops Menu
Key Sequence: Shift > Trace (5) key > Trace A Operations
Normal -> A: Displays data for the current trace sweep.
Max Hold -> A: Shows the cumulative maximum value of each display point over many trace sweeps.
Min Hold -> A: Shows the cumulative minimum value of each display point over many trace sweeps.
Average -> A: Shows an exponential average of a number of traces, determined by the # of Averages key.
# of Averages: Sets the number of traces for use in calculating the average display value. Then number used for averaging ranges from 1 to 65535.
Back: Returns to the “Trace Menu” on page 4-52.
Figure 4-47. IA Trace A Ops Menu
Trace A Ops
Back
Normal -> A
Max Hold -> A
Min Hold -> A
Average -> A
# of Averages
10
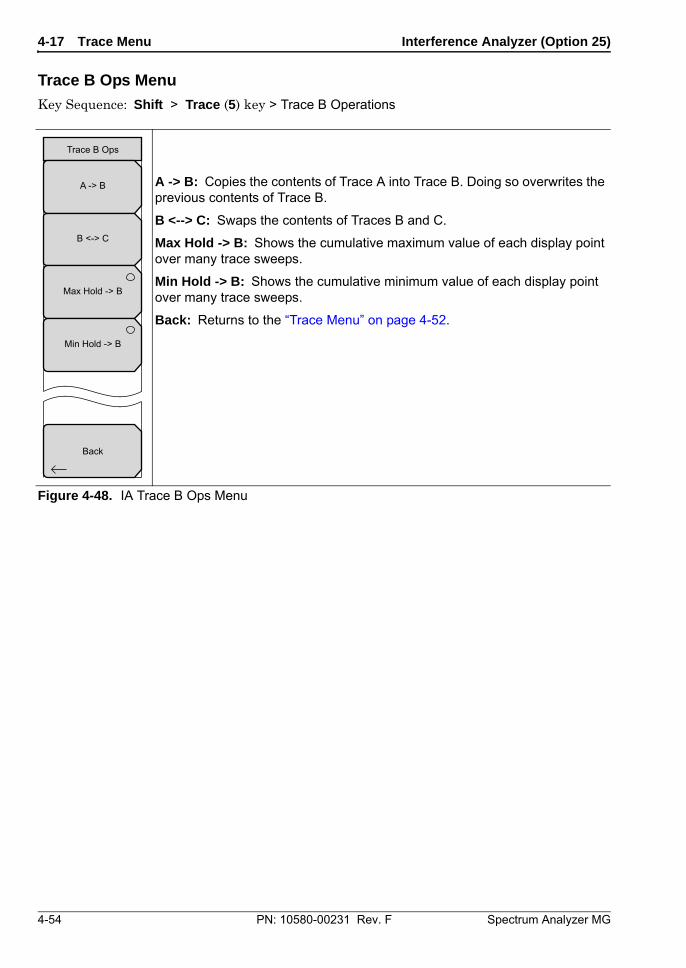
4-17 Trace Menu Interference Analyzer (Option 25)
4-54 PN: 10580-00231 Rev. F Spectrum Analyzer MG
Trace B Ops Menu
Key Sequence: Shift > Trace (5) key > Trace B Operations
A -> B: Copies the contents of Trace A into Trace B. Doing so overwrites the previous contents of Trace B.
B <--> C: Swaps the contents of Traces B and C.
Max Hold -> B: Shows the cumulative maximum value of each display point over many trace sweeps.
Min Hold -> B: Shows the cumulative minimum value of each display point over many trace sweeps.
Back: Returns to the “Trace Menu” on page 4-52.
Figure 4-48. IA Trace B Ops Menu
Back
Trace B Ops
A -> B
B <-> C
Max Hold -> B
Min Hold -> B
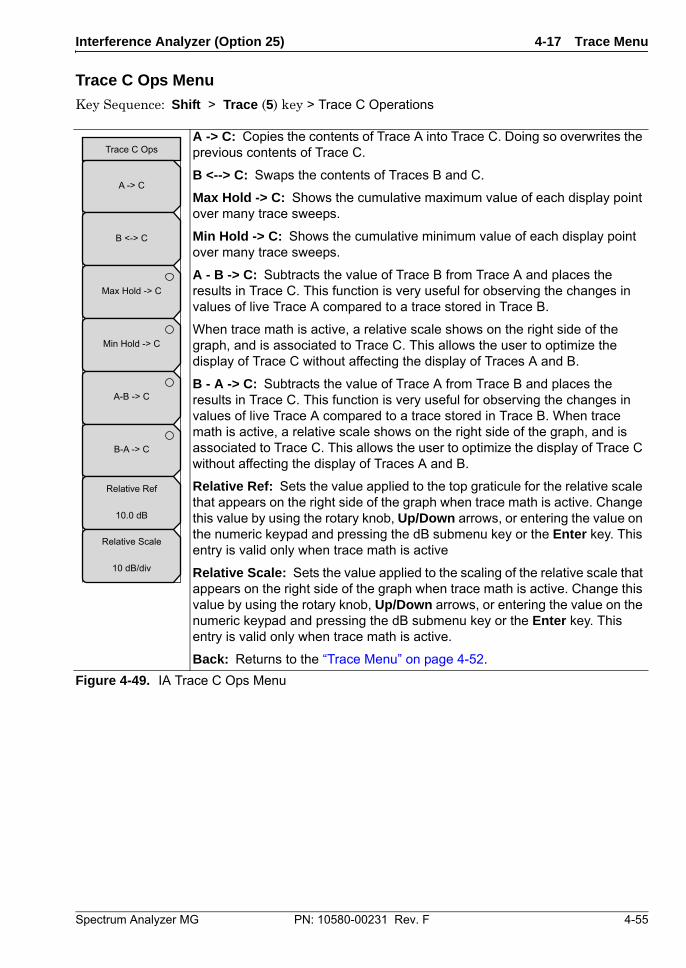
Interference Analyzer (Option 25) 4-17 Trace Menu
Spectrum Analyzer MG PN: 10580-00231 Rev. F 4-55
Trace C Ops Menu
Key Sequence: Shift > Trace (5) key > Trace C Operations
A -> C: Copies the contents of Trace A into Trace C. Doing so overwrites the previous contents of Trace C.
B <--> C: Swaps the contents of Traces B and C.
Max Hold -> C: Shows the cumulative maximum value of each display point over many trace sweeps.
Min Hold -> C: Shows the cumulative minimum value of each display point over many trace sweeps.
A - B -> C: Subtracts the value of Trace B from Trace A and places the results in Trace C. This function is very useful for observing the changes in values of live Trace A compared to a trace stored in Trace B.
When trace math is active, a relative scale shows on the right side of the graph, and is associated to Trace C. This allows the user to optimize the display of Trace C without affecting the display of Traces A and B.
B - A -> C: Subtracts the value of Trace A from Trace B and places the results in Trace C. This function is very useful for observing the changes in values of live Trace A compared to a trace stored in Trace B. When trace math is active, a relative scale shows on the right side of the graph, and is associated to Trace C. This allows the user to optimize the display of Trace C without affecting the display of Traces A and B.
Relative Ref: Sets the value applied to the top graticule for the relative scale that appears on the right side of the graph when trace math is active. Change this value by using the rotary knob, Up/Down arrows, or entering the value on the numeric keypad and pressing the dB submenu key or the Enter key. This entry is valid only when trace math is active
Relative Scale: Sets the value applied to the scaling of the relative scale that appears on the right side of the graph when trace math is active. Change this value by using the rotary knob, Up/Down arrows, or entering the value on the numeric keypad and pressing the dB submenu key or the Enter key. This entry is valid only when trace math is active.
Back: Returns to the “Trace Menu” on page 4-52.
Figure 4-49. IA Trace C Ops Menu
Trace C Ops
A -> C
B <-> C
Max Hold -> C
Min Hold -> C
A-B -> C
B-A -> C
Relative Ref
10.0 dB
Relative Scale
10 dB/div
4-18 Limit Menu Interference Analyzer (Option 25)
4-56 PN: 10580-00231 Rev. F Spectrum Analyzer MG
4-18 Limit Menu Key Sequence: Shift > Limit (6) key
Two types of limit lines can be specified, lower limit lines and upper limit lines. Limit lines can be used for visual reference only, or for pass/fail criteria using the limit alarm (Figure 4-50). Limit alarm failures are reported whenever a signal is above the upper limit line or below the lower limit line. By using save-on-event, a signal that causes a limit alarm can be automatically saved. See your User Guide for details.
Each limit line can consist of a single segment, or as many as 40 segments across the entire frequency span of the instrument. These limit segments are retained regardless of the current frequency span of the instrument, which allows the configuring of specific limit envelopes at various frequencies of interest without having to re-configure them each time the frequency is changed.
NoteThis menu is active only when making Spectrum measurements. It is not operational in Spectrogram, Signal Strength, RSSI, Signal ID, or Interference Mapping measurements.
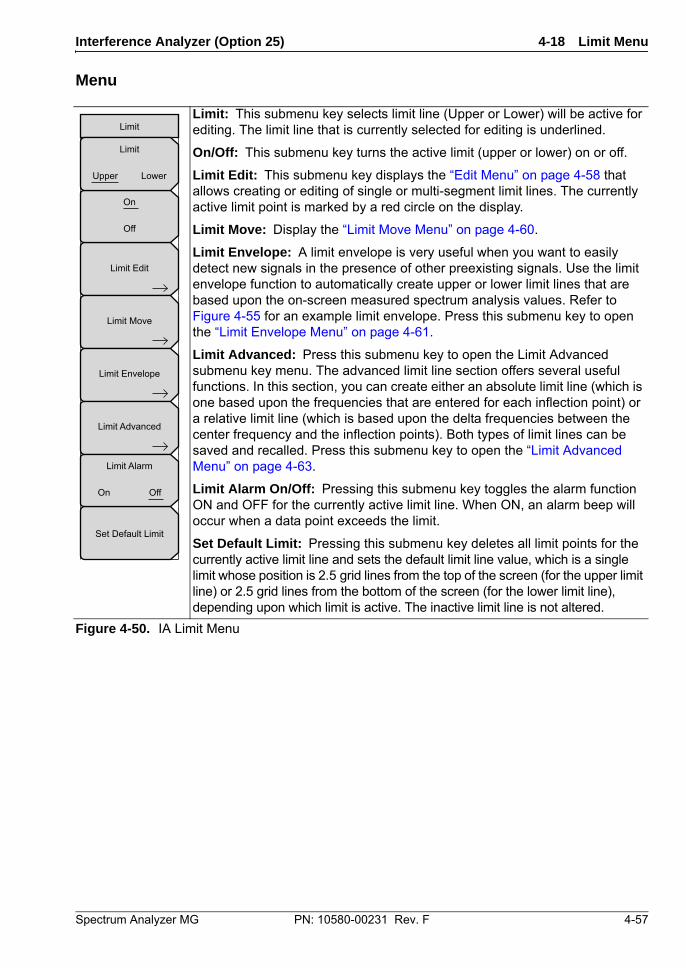
Interference Analyzer (Option 25) 4-18 Limit Menu
Spectrum Analyzer MG PN: 10580-00231 Rev. F 4-57
Menu
Limit: This submenu key selects limit line (Upper or Lower) will be active for editing. The limit line that is currently selected for editing is underlined.
On/Off: This submenu key turns the active limit (upper or lower) on or off.
Limit Edit: This submenu key displays the “Edit Menu” on page 4-58 that allows creating or editing of single or multi-segment limit lines. The currently active limit point is marked by a red circle on the display.
Limit Move: Display the “Limit Move Menu” on page 4-60.
Limit Envelope: A limit envelope is very useful when you want to easily detect new signals in the presence of other preexisting signals. Use the limit envelope function to automatically create upper or lower limit lines that are based upon the on-screen measured spectrum analysis values. Refer to Figure 4-55 for an example limit envelope. Press this submenu key to open the “Limit Envelope Menu” on page 4-61.
Limit Advanced: Press this submenu key to open the Limit Advanced submenu key menu. The advanced limit line section offers several useful functions. In this section, you can create either an absolute limit line (which is one based upon the frequencies that are entered for each inflection point) or a relative limit line (which is based upon the delta frequencies between the center frequency and the inflection points). Both types of limit lines can be saved and recalled. Press this submenu key to open the “Limit Advanced Menu” on page 4-63.
Limit Alarm On/Off: Pressing this submenu key toggles the alarm function ON and OFF for the currently active limit line. When ON, an alarm beep will occur when a data point exceeds the limit.
Set Default Limit: Pressing this submenu key deletes all limit points for the currently active limit line and sets the default limit line value, which is a single limit whose position is 2.5 grid lines from the top of the screen (for the upper limit line) or 2.5 grid lines from the bottom of the screen (for the lower limit line), depending upon which limit is active. The inactive limit line is not altered.
Figure 4-50. IA Limit Menu
Limit
Set Default Limit
Limit Edit
Limit Move
Limit Envelope
Limit Advanced
On
Off
Limit Alarm
On Off
Limit
Upper Lower
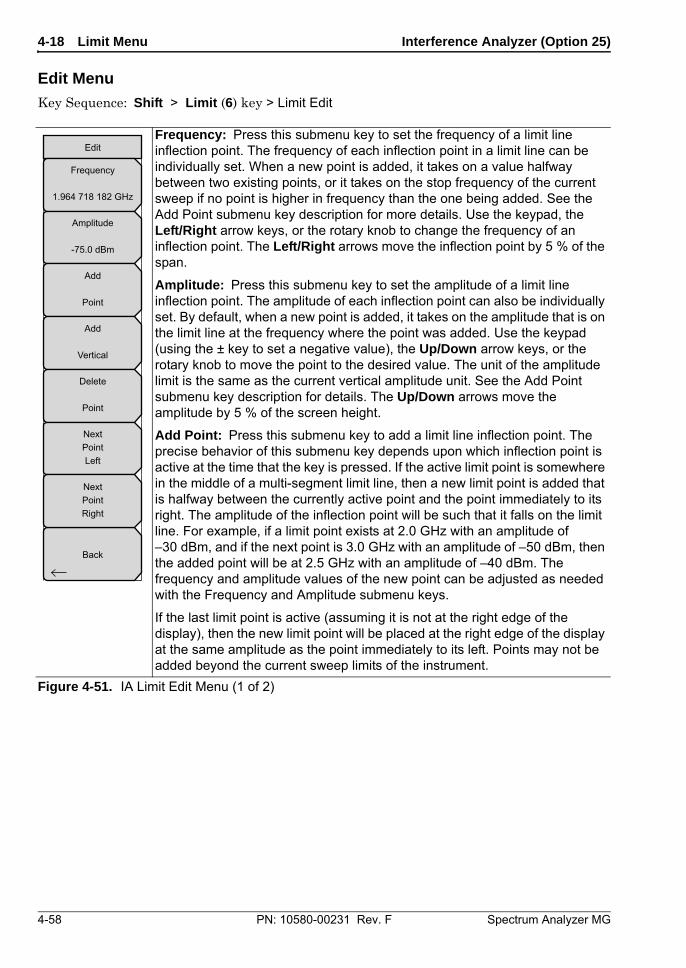
4-18 Limit Menu Interference Analyzer (Option 25)
4-58 PN: 10580-00231 Rev. F Spectrum Analyzer MG
Edit Menu
Key Sequence: Shift > Limit (6) key > Limit Edit
Frequency: Press this submenu key to set the frequency of a limit line inflection point. The frequency of each inflection point in a limit line can be individually set. When a new point is added, it takes on a value halfway between two existing points, or it takes on the stop frequency of the current sweep if no point is higher in frequency than the one being added. See the Add Point submenu key description for more details. Use the keypad, the Left/Right arrow keys, or the rotary knob to change the frequency of an inflection point. The Left/Right arrows move the inflection point by 5 % of the span.
Amplitude: Press this submenu key to set the amplitude of a limit line inflection point. The amplitude of each inflection point can also be individually set. By default, when a new point is added, it takes on the amplitude that is on the limit line at the frequency where the point was added. Use the keypad (using the ± key to set a negative value), the Up/Down arrow keys, or the rotary knob to move the point to the desired value. The unit of the amplitude limit is the same as the current vertical amplitude unit. See the Add Point submenu key description for details. The Up/Down arrows move the amplitude by 5 % of the screen height.
Add Point: Press this submenu key to add a limit line inflection point. The precise behavior of this submenu key depends upon which inflection point is active at the time that the key is pressed. If the active limit point is somewhere in the middle of a multi-segment limit line, then a new limit point is added that is halfway between the currently active point and the point immediately to its right. The amplitude of the inflection point will be such that it falls on the limit line. For example, if a limit point exists at 2.0 GHz with an amplitude of –30 dBm, and if the next point is 3.0 GHz with an amplitude of –50 dBm, then the added point will be at 2.5 GHz with an amplitude of –40 dBm. The frequency and amplitude values of the new point can be adjusted as needed with the Frequency and Amplitude submenu keys.
If the last limit point is active (assuming it is not at the right edge of the display), then the new limit point will be placed at the right edge of the display at the same amplitude as the point immediately to its left. Points may not be added beyond the current sweep limits of the instrument.
Figure 4-51. IA Limit Edit Menu (1 of 2)
Edit
Back
Frequency
1.964 718 182 GHz
Amplitude
-75.0 dBm
Add
Point
Add
Vertical
Delete
Point
NextPointLeft
NextPointRight
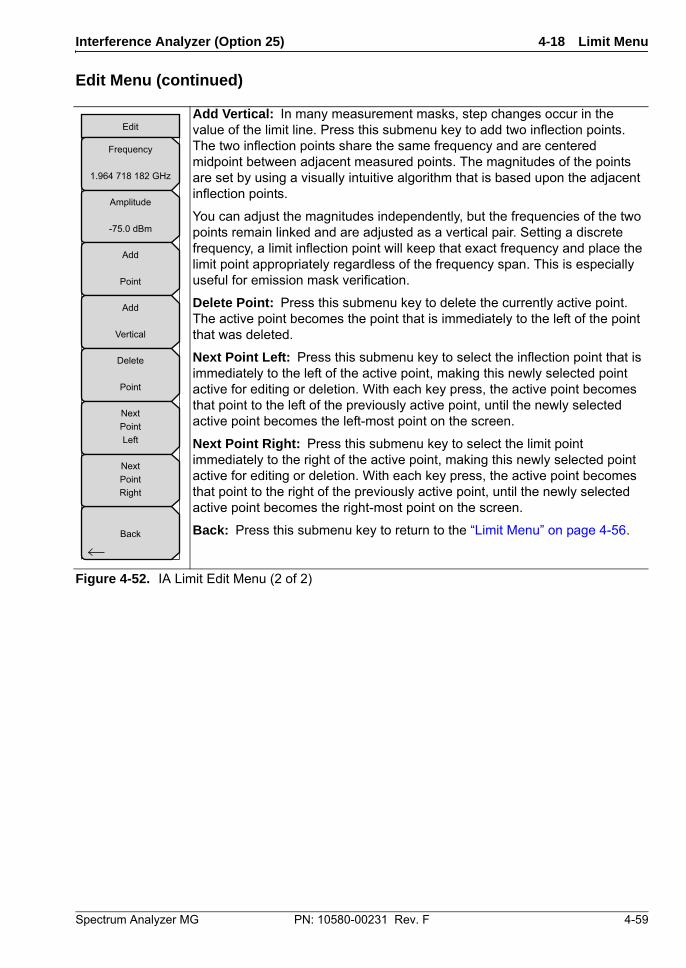
Interference Analyzer (Option 25) 4-18 Limit Menu
Spectrum Analyzer MG PN: 10580-00231 Rev. F 4-59
Edit Menu (continued)
Add Vertical: In many measurement masks, step changes occur in the value of the limit line. Press this submenu key to add two inflection points. The two inflection points share the same frequency and are centered midpoint between adjacent measured points. The magnitudes of the points are set by using a visually intuitive algorithm that is based upon the adjacent inflection points.
You can adjust the magnitudes independently, but the frequencies of the two points remain linked and are adjusted as a vertical pair. Setting a discrete frequency, a limit inflection point will keep that exact frequency and place the limit point appropriately regardless of the frequency span. This is especially useful for emission mask verification.
Delete Point: Press this submenu key to delete the currently active point. The active point becomes the point that is immediately to the left of the point that was deleted.
Next Point Left: Press this submenu key to select the inflection point that is immediately to the left of the active point, making this newly selected point active for editing or deletion. With each key press, the active point becomes that point to the left of the previously active point, until the newly selected active point becomes the left-most point on the screen.
Next Point Right: Press this submenu key to select the limit point immediately to the right of the active point, making this newly selected point active for editing or deletion. With each key press, the active point becomes that point to the right of the previously active point, until the newly selected active point becomes the right-most point on the screen.
Back: Press this submenu key to return to the “Limit Menu” on page 4-56.
Figure 4-52. IA Limit Edit Menu (2 of 2)
Edit
Back
Frequency
1.964 718 182 GHz
Amplitude
-75.0 dBm
Add
Point
Add
Vertical
Delete
Point
NextPointLeft
NextPointRight
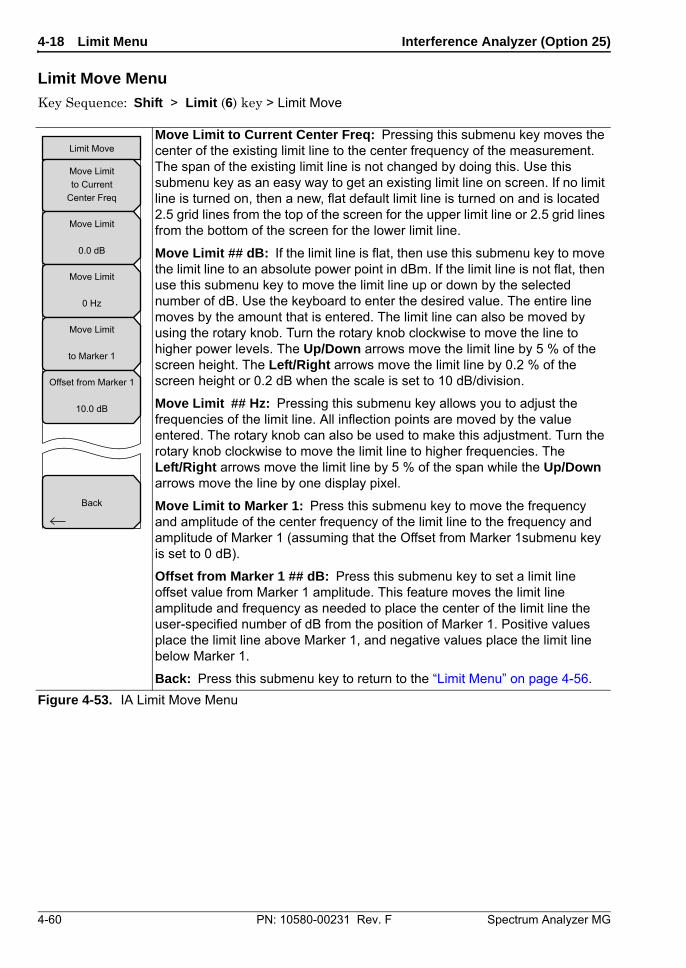
4-18 Limit Menu Interference Analyzer (Option 25)
4-60 PN: 10580-00231 Rev. F Spectrum Analyzer MG
Limit Move Menu
Key Sequence: Shift > Limit (6) key > Limit Move
Move Limit to Current Center Freq: Pressing this submenu key moves the center of the existing limit line to the center frequency of the measurement. The span of the existing limit line is not changed by doing this. Use this submenu key as an easy way to get an existing limit line on screen. If no limit line is turned on, then a new, flat default limit line is turned on and is located 2.5 grid lines from the top of the screen for the upper limit line or 2.5 grid lines from the bottom of the screen for the lower limit line.
Move Limit ## dB: If the limit line is flat, then use this submenu key to move the limit line to an absolute power point in dBm. If the limit line is not flat, then use this submenu key to move the limit line up or down by the selected number of dB. Use the keyboard to enter the desired value. The entire line moves by the amount that is entered. The limit line can also be moved by using the rotary knob. Turn the rotary knob clockwise to move the line to higher power levels. The Up/Down arrows move the limit line by 5 % of the screen height. The Left/Right arrows move the limit line by 0.2 % of the screen height or 0.2 dB when the scale is set to 10 dB/division.
Move Limit ## Hz: Pressing this submenu key allows you to adjust the frequencies of the limit line. All inflection points are moved by the value entered. The rotary knob can also be used to make this adjustment. Turn the rotary knob clockwise to move the limit line to higher frequencies. The Left/Right arrows move the limit line by 5 % of the span while the Up/Down arrows move the line by one display pixel.
Move Limit to Marker 1: Press this submenu key to move the frequency and amplitude of the center frequency of the limit line to the frequency and amplitude of Marker 1 (assuming that the Offset from Marker 1submenu key is set to 0 dB).
Offset from Marker 1 ## dB: Press this submenu key to set a limit line offset value from Marker 1 amplitude. This feature moves the limit line amplitude and frequency as needed to place the center of the limit line the user-specified number of dB from the position of Marker 1. Positive values place the limit line above Marker 1, and negative values place the limit line below Marker 1.
Back: Press this submenu key to return to the “Limit Menu” on page 4-56.
Figure 4-53. IA Limit Move Menu
Back
Limit Move
Move Limitto Current
Center Freq
Move Limit
0.0 dB
Move Limit
0 Hz
Move Limit
to Marker 1
Offset from Marker 1
10.0 dB
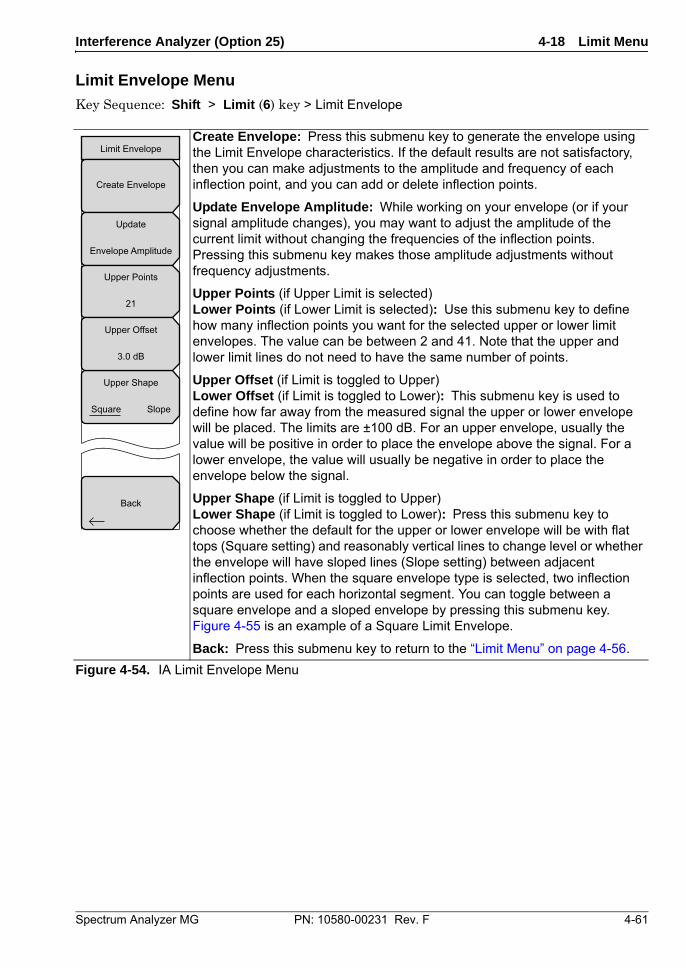
Interference Analyzer (Option 25) 4-18 Limit Menu
Spectrum Analyzer MG PN: 10580-00231 Rev. F 4-61
Limit Envelope Menu
Key Sequence: Shift > Limit (6) key > Limit Envelope
Create Envelope: Press this submenu key to generate the envelope using the Limit Envelope characteristics. If the default results are not satisfactory, then you can make adjustments to the amplitude and frequency of each inflection point, and you can add or delete inflection points.
Update Envelope Amplitude: While working on your envelope (or if your signal amplitude changes), you may want to adjust the amplitude of the current limit without changing the frequencies of the inflection points. Pressing this submenu key makes those amplitude adjustments without frequency adjustments.
Upper Points (if Upper Limit is selected)Lower Points (if Lower Limit is selected): Use this submenu key to define how many inflection points you want for the selected upper or lower limit envelopes. The value can be between 2 and 41. Note that the upper and lower limit lines do not need to have the same number of points.
Upper Offset (if Limit is toggled to Upper)Lower Offset (if Limit is toggled to Lower): This submenu key is used to define how far away from the measured signal the upper or lower envelope will be placed. The limits are ±100 dB. For an upper envelope, usually the value will be positive in order to place the envelope above the signal. For a lower envelope, the value will usually be negative in order to place the envelope below the signal.
Upper Shape (if Limit is toggled to Upper)Lower Shape (if Limit is toggled to Lower): Press this submenu key to choose whether the default for the upper or lower envelope will be with flat tops (Square setting) and reasonably vertical lines to change level or whether the envelope will have sloped lines (Slope setting) between adjacent inflection points. When the square envelope type is selected, two inflection points are used for each horizontal segment. You can toggle between a square envelope and a sloped envelope by pressing this submenu key. Figure 4-55 is an example of a Square Limit Envelope.
Back: Press this submenu key to return to the “Limit Menu” on page 4-56.
Figure 4-54. IA Limit Envelope Menu
Upper Shape
Square Slope
Limit Envelope
Back
Create Envelope
Update
Envelope Amplitude
Upper Points
21
Upper Offset
3.0 dB
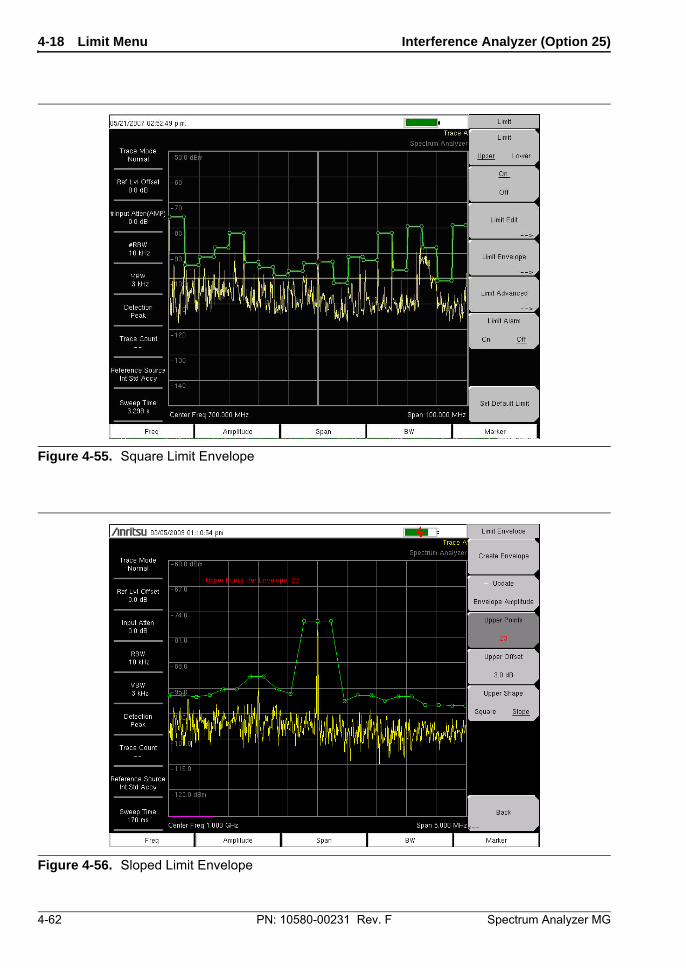
4-18 Limit Menu Interference Analyzer (Option 25)
4-62 PN: 10580-00231 Rev. F Spectrum Analyzer MG
Figure 4-55. Square Limit Envelope
Figure 4-56. Sloped Limit Envelope

Interference Analyzer (Option 25) 4-18 Limit Menu
Spectrum Analyzer MG PN: 10580-00231 Rev. F 4-63
Limit Advanced Menu
Key Sequence: Shift > Limit (6) key > Limit Advanced
Limit Line Type: Press this submenu key to choose to have either limit line be absolute or be relative. This submenu key may be used at any time while working with limit lines. Absolute limit lines set the limit inflection points based upon the entered frequencies for each point. Relative limit lines set the limit inflection points relative to the current center frequency. Regardless of how a limit line is set up, saved, or recalled, it can be changed between absolute and relative by toggling with this submenu key.
Limit Mirror On/Off: Press this submenu key to turn the Limit Mirror feature On and Off.
Many emission masks are symmetrical. The low frequency side is identical to the upper side. The Limit Mirror feature allows you to create half of the limit line and get the other half built automatically. This feature can work in either of two ways:
Turn Limit Mirror on before beginning to build a limit line. As you add a point on either side of the center frequency, another point is automatically added on the opposite side of the center frequency.
Leave Limit Mirror off until half of the limit line is built, then turn On Limit Mirror. the other half of the limit line is built automatically.
Save Limit: Pressing this submenu key opens a dialog to save the current upper and lower limit lines. You can name the saved limit line yourself or accept the name that is suggested by the instrument (which is based upon a previously saved name). If you did not intend to save the limit line, then press Esc to stop the dialog and avoid saving the limit line.
Recall Limit: Pressing this submenu key opens a dialog box to recall a saved limit line. The dialog box presents a list of saved limit lines. Highlight the desired limit line and press Enter. If you decide not to recall a limit line, then press Esc to stop the dialog.
If the saved limit is a relative limit, then it is recalled centered about the current center frequency. If the saved limit is an absolute limit, then it is recalled to the frequency at which it was created.
If you recall an absolute limit, and if it is off screen, then you will see the left or right limit off-screen indicator on the edge of the screen.
Back: Press this submenu key to return to the “Limit Menu” on page 4-56.
Figure 4-57. IA Limit Advanced Menu
Limit Line Type
Absolute Relative
Limit Advanced
Back
Save
Limit
Recall
Limit
Limit Mirror
Off On
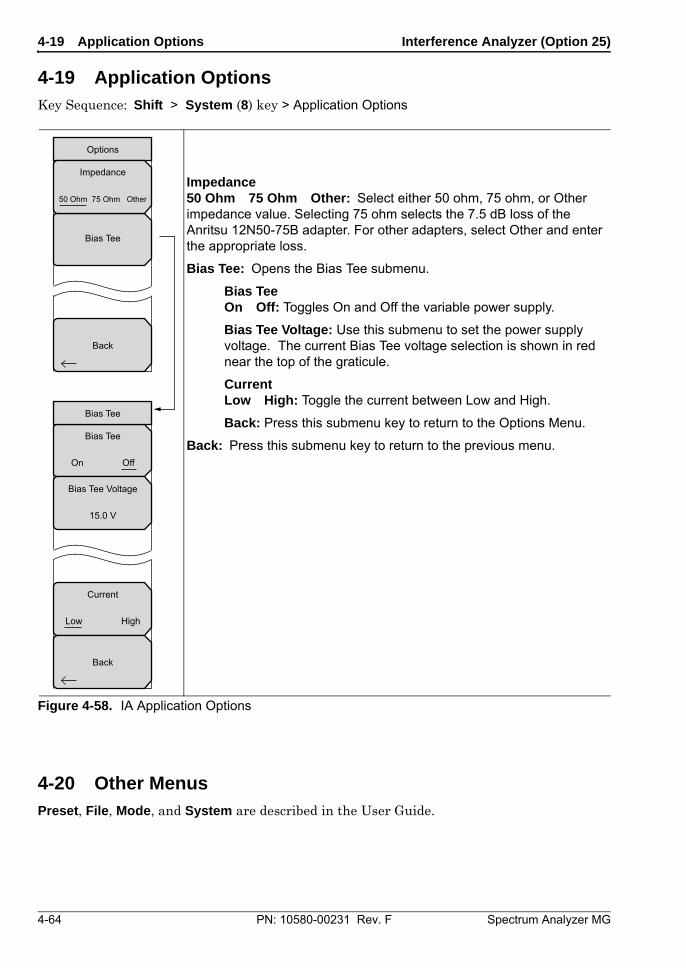
4-19 Application Options Interference Analyzer (Option 25)
4-64 PN: 10580-00231 Rev. F Spectrum Analyzer MG
4-19 Application Options Key Sequence: Shift > System (8) key > Application Options
4-20 Other MenusPreset, File, Mode, and System are described in the User Guide.
Impedance50 Ohm 75 Ohm Other: Select either 50 ohm, 75 ohm, or Other impedance value. Selecting 75 ohm selects the 7.5 dB loss of the Anritsu 12N50-75B adapter. For other adapters, select Other and enter the appropriate loss.
Bias Tee: Opens the Bias Tee submenu.
Bias TeeOn Off: Toggles On and Off the variable power supply.
Bias Tee Voltage: Use this submenu to set the power supply voltage. The current Bias Tee voltage selection is shown in red near the top of the graticule.
CurrentLow High: Toggle the current between Low and High.
Back: Press this submenu key to return to the Options Menu.
Back: Press this submenu key to return to the previous menu.
Figure 4-58. IA Application Options
Options
Bias Tee
Impedance
50 Ohm 75 Ohm Other
Bias Tee
On Off
Current
Low High
Bias Tee
Back
Bias Tee Voltage
15.0 V
Back
Spectrum Analyzer MG PN: 10580-00231 Rev. F 5-1
Chapter 5 — Channel Scanner (Option 27)
5-1 IntroductionThis chapter presents Channel Scanner information and procedures. The Channel Scanner option (Option 27) measures the signal power of multiple transmitted signals. The power can be displayed as either a bar graph or a text display showing the channel power of selected channels for a given air interface standard, or the manually entered channels. Up to 20 channels can be measured.
The operating frequency range for Channel Scanner mode can either be set manually, or the desired air interface standard can be selected from the Signal Standard and channel list in the instrument. When the channels are selected from the Signal Standard list, all frequency related parameters for the standard are automatically set to the appropriate values. The frequency and bandwidth settings can be manually entered using the Scan Frequencies selection if none of the available air interface standards meet the measurement need. A custom channel list can also be created to allow up to 20 independent channels to be defined.
With the use of Master Software Tools, Script Master extends the test capabilities of channel scanner testing of the instrument. Features include the use of a Script Master Test Setup File to set test parameters, extending the number of channel scans to 1200, repetitive testing, and time testing.
5-2 General Measurement Setups Please refer to User Guide for selecting the Channel Scanner mode, setting up frequency, span, amplitude, GPS, limit lines, markers, and file management.
NoteNot all instrument models offer every option. Please refer to the Technical Data Sheet of your instrument for available options.
5-3 Sample Procedure Channel Scanner (Option 27)
5-2 PN: 10580-00231 Rev. F Spectrum Analyzer MG
5-3 Sample Procedure The following procedure demonstrates a common channel scanner setup.
1. Press the Scanner main menu key to activate the Scanner menu. The power can be scanned using a signal standard and channel numbers or by entering a start frequency, frequency step size and bandwidth. The channels can be customized using the Scan Custom List or Custom Setup. For this example, select the channels by pressing the Scan Channels submenu key, then the Signal Standard submenu key. Select the CDMA US PCS signal standard.
2. Press the Number of Channels submenu key and enter 20.
3. Press the Amplitude main menu key and set the Reference Level and Scale so that the power of all the channels is displayed on the screen.
4. Press the Measurements main menu key to activate the Measurement menu.
5. Press the Display submenu key and select Graph display to display the measurements in the graph format.
6. Press the Channel Units submenu key and select Channel to display the measurements in channel format.
7. Press the Units Display submenu key and choose Max to display the maximum measured power for each channel.
8. Press the Color Code submenu key and select Dual to display the measurements in dual colors.
Note Confirm Max Hold is either On or set to 5 sec before setting this parameter.
NoteMeasurements can be made when the base station is in service, out of service, or over the air.
Channel Scanner (Option 27) 5-4 Custom Setup Measurements
Spectrum Analyzer MG PN: 10580-00231 Rev. F 5-3
5-4 Custom Setup Measurements
Procedure
1. Press the Custom Scan main menu key.
2. Press the Number of Channels submenu key to define how many channels to include in the custom list. This choice can be changed later if needed.
3. Press the Edit List submenu key to bring up the list of channels. The channel highlighted in blue is the channel active for editing. Use the Up/Down arrows to select the channel to edit. Each channel can be set up differently.
4. Press either the Select Signal Standard submenu key or the Set Freq submenu key. If the Select Signal Standard submenu key was pressed, select the desired air interface standard from the dialog box. When a standard is selected, the usual bandwidth for that standard is automatically set. The bandwidth can be changed if desired.
5. Press the Set Channel submenu key to enter the desired channel number. If the Set Freq submenu key was pressed, the frequency value of the active channel will be highlighted. Use the rotary knob or the numeric key pad to enter the desired center frequency in Hz, kHz, MHz, or GHz.
6. Press the Set Bandwidth submenu key and use the rotary knob or numeric keypad to enter the desired value in Hz, kHz, MHz, or GHz.
7. Press the Done Editing submenu key.
8. Repeat Step 3 through Step 7 to continue editing additional channels.
5-5 Custom Setup Example This example explains how to monitor several signals, plus a potential intermodulation product, to see if there is a correlation between the nearby signals and an intermittent interference problem.
The signals on or near the rooftop are:
• An FM broadcast station at 106.5 MHz
• A paging transmitter at 157.86 MHz
• Three cellular sites:
• US CDMA PCS channel 50 (1932.5 MHz)
• AMP/EIA 553 channel 525 (885.750 MHz)
• GSM 1800 channel 512 (1805.2 MHz)
• A Ham repeater at 147.36 MHz
• A Ham repeater at 446.5 MHz
• A land mobile repeater at 451.7875 MHz
• A public safety repeater at 485.5625 MHz
• In addition, the site is near the flight path of an airport. The approach frequency is 121.4 MHz.
Set up a measurement channel for each of the signals to be observed plus extra channels for any intermodulation products to be observed.
5-6 Script Master Measurement Setup Channel Scanner (Option 27)
5-4 PN: 10580-00231 Rev. F Spectrum Analyzer MG
After the channels are set up, press Shift | File | Save | Save Setup| and name the setup for easy recall later.
5-6 Script Master Measurement Setup The Script Measurement function (Scanner | Scan Scriptmaster) allows the user to increase the number of channels to scan from 20 channels to 1,200 channels. Channel scanning is done in groups of 20. So if the maximum number of channels were set, then there would be 60 sets of 20 channels.
The Channel Scanner Script Master allows the user to automatically repeat scanning of all channels multiple times. You may choose to repeat the scan for a specified number of cycles, or choose a time duration until which the scan is repeated or ended. Please refer to Script Master Editor in Master Software Tools for creating and uploading Script Files to the instrument.
Press the Repeat Scan Type submenu key to set either the number of scans or period of time as the mode of testing. If # Scans is selected, use the # of Repeat submenu key to set the number of repetitions for testing the full list of channels in the Script Master Test file. The maximum number of repetitions is 1000. If Time is selected, use the Scan Duration submenu key to setup a test period for testing the channels in the Script Master Test File.
If testing the number of channels in the Script Master Test File is shorter than the Scan Duration, testing those channels will repeat. If testing the number of channels in the Script Master Test File is longer than the Scan Duration, scanning ends and the rest of the channels are not tested. Units for Scan Duration is days, hours, minutes, and seconds, with a maximum scan time of three days and a minimum scan time of ten minutes.
The sets of channels in the Script Master Test File can also be tested repeatedly. Use the # of Repeats (Set) submenu key to set this parameter. For example, if 5 were entered, then each set of 20 channels, would be tested five times before the next set of channels are tested.
The # of Repeats (Set) feature can be used in combination with # of Repeats (List) feature. For example, the Script Master Test File contains 100 channels, that is 5 sets of 20 channels. # of Repeats (Set) is set to 3 and # of Repeats (List) is set to 5. Pressing the Start/Restart Test button starts test on the first 20 channels for 3 iterations, then testing moves to the second set of channels for 3 iterations and continues on till the fifth set is tested for 3 iterations. Then the list of 100 channels is tested again with each set of channels being tested 3 times. Testing is ended when five cycles of testing on 100 channels are completed.
Procedure
1. Press the Scanner main menu key.
2. Press the Script Master submenu key. If no script file is currently in use, the Select Script Master Scan Setup File dialog will open. Select from that dialog list the desired script file. If a script file is in use or has been loaded, pressing the Script Master submenu key will list the Scan Script Master submenu.
3. Press the Select Test submenu key to enter a new or change the current Script Master Scan Setup file. The Select Script Master Scan Setup File dialog opens. Select the desired measurement script file. Once a new file is selected, the channels are loaded, along with any other scan parameters defined in the file. To override these parameters, follow Step 4 through Step 6, otherwise continue to Step 7.
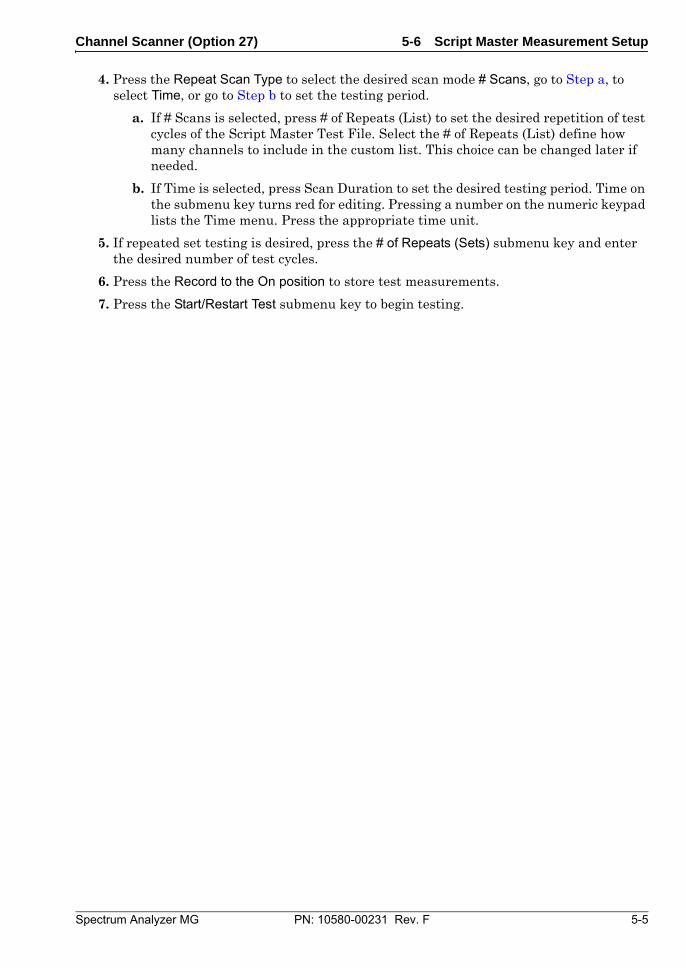
Channel Scanner (Option 27) 5-6 Script Master Measurement Setup
Spectrum Analyzer MG PN: 10580-00231 Rev. F 5-5
4. Press the Repeat Scan Type to select the desired scan mode # Scans, go to Step a, to select Time, or go to Step b to set the testing period.
a. If # Scans is selected, press # of Repeats (List) to set the desired repetition of test cycles of the Script Master Test File. Select the # of Repeats (List) define how many channels to include in the custom list. This choice can be changed later if needed.
b. If Time is selected, press Scan Duration to set the desired testing period. Time on the submenu key turns red for editing. Pressing a number on the numeric keypad lists the Time menu. Press the appropriate time unit.
5. If repeated set testing is desired, press the # of Repeats (Sets) submenu key and enter the desired number of test cycles.
6. Press the Record to the On position to store test measurements.
7. Press the Start/Restart Test submenu key to begin testing.
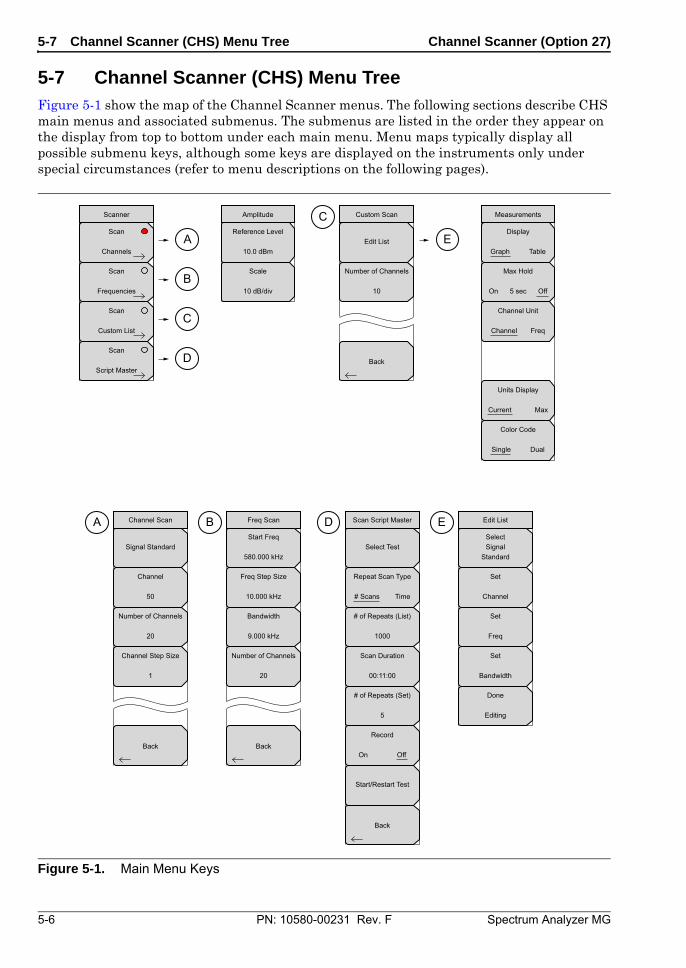
5-7 Channel Scanner (CHS) Menu Tree Channel Scanner (Option 27)
5-6 PN: 10580-00231 Rev. F Spectrum Analyzer MG
5-7 Channel Scanner (CHS) Menu Tree Figure 5-1 show the map of the Channel Scanner menus. The following sections describe CHS main menus and associated submenus. The submenus are listed in the order they appear on the display from top to bottom under each main menu. Menu maps typically display all possible submenu keys, although some keys are displayed on the instruments only under special circumstances (refer to menu descriptions on the following pages).
Figure 5-1. Main Menu Keys
DBA
A
Start/Restart Test
Repeat Scan Type
# Scans Time
Record
On Off
Amplitude
Reference Level
10.0 dBm
Scale
10 dB/div
Custom Scan
Back
Edit List
Number of Channels
10
Display
Graph Table
Measurements
Max Hold
On 5 sec Off
Units Display
Current Max
Color Code
Single Dual
Channel Unit
Channel Freq
Back
Channel Scan
Signal Standard
Channel
50
Number of Channels
20
Channel Step Size
1
Back
Freq Scan
Start Freq
580.000 kHz
Freq Step Size
10.000 kHz
Bandwidth
9.000 kHz
Number of Channels
20
Scanner
Scan
Channels
Scan
Frequencies
Scan
Custom List
Scan
Script Master
Scan Script Master
Select Test
# of Repeats (List)
1000
Scan Duration
00:11:00
# of Repeats (Set)
5
B
C
C
D
E
Back
E
Set
Bandwidth
Edit List
SelectSignal
Standard
Set
Channel
Set
Freq
Done
Editing
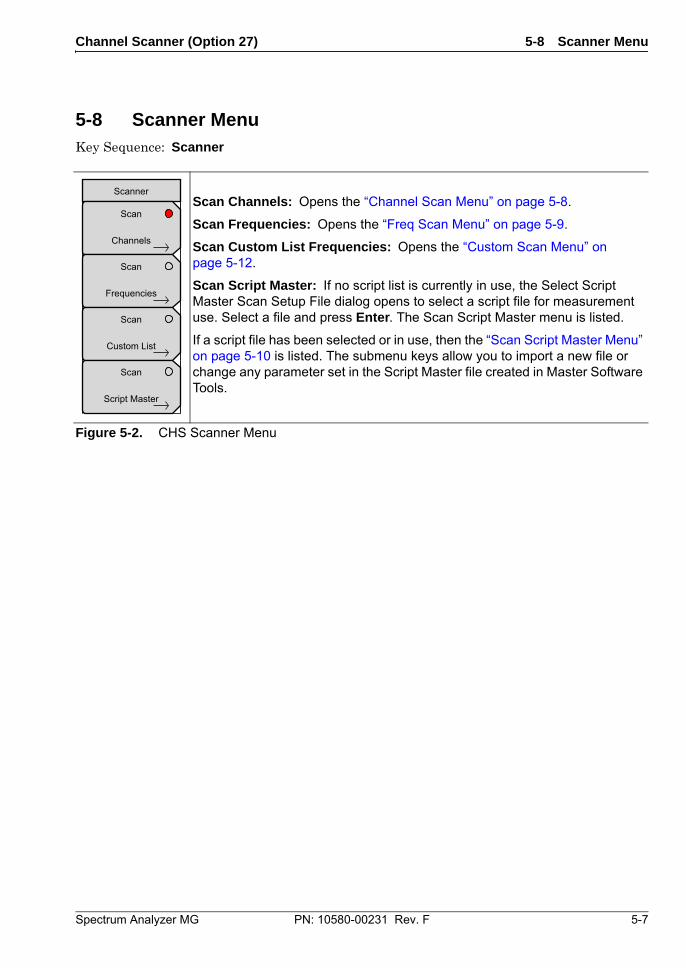
Channel Scanner (Option 27) 5-8 Scanner Menu
Spectrum Analyzer MG PN: 10580-00231 Rev. F 5-7
5-8 Scanner Menu Key Sequence: Scanner
Scan Channels: Opens the “Channel Scan Menu” on page 5-8.
Scan Frequencies: Opens the “Freq Scan Menu” on page 5-9.
Scan Custom List Frequencies: Opens the “Custom Scan Menu” on page 5-12.
Scan Script Master: If no script list is currently in use, the Select Script Master Scan Setup File dialog opens to select a script file for measurement use. Select a file and press Enter. The Scan Script Master menu is listed.
If a script file has been selected or in use, then the “Scan Script Master Menu” on page 5-10 is listed. The submenu keys allow you to import a new file or change any parameter set in the Script Master file created in Master Software Tools.
Figure 5-2. CHS Scanner Menu
Scanner
Scan
Channels
Scan
Frequencies
Scan
Custom List
Scan
Script Master
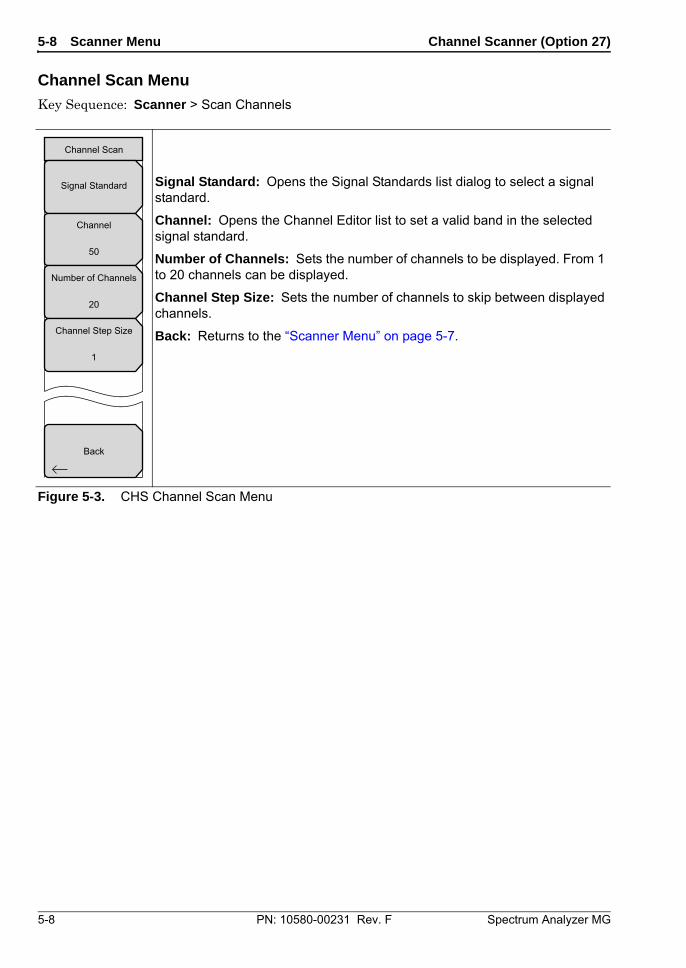
5-8 Scanner Menu Channel Scanner (Option 27)
5-8 PN: 10580-00231 Rev. F Spectrum Analyzer MG
Channel Scan Menu
Key Sequence: Scanner > Scan Channels
Signal Standard: Opens the Signal Standards list dialog to select a signal standard.
Channel: Opens the Channel Editor list to set a valid band in the selected signal standard.
Number of Channels: Sets the number of channels to be displayed. From 1 to 20 channels can be displayed.
Channel Step Size: Sets the number of channels to skip between displayed channels.
Back: Returns to the “Scanner Menu” on page 5-7.
Figure 5-3. CHS Channel Scan Menu
Back
Channel Scan
Signal Standard
Channel
50
Number of Channels
20
Channel Step Size
1
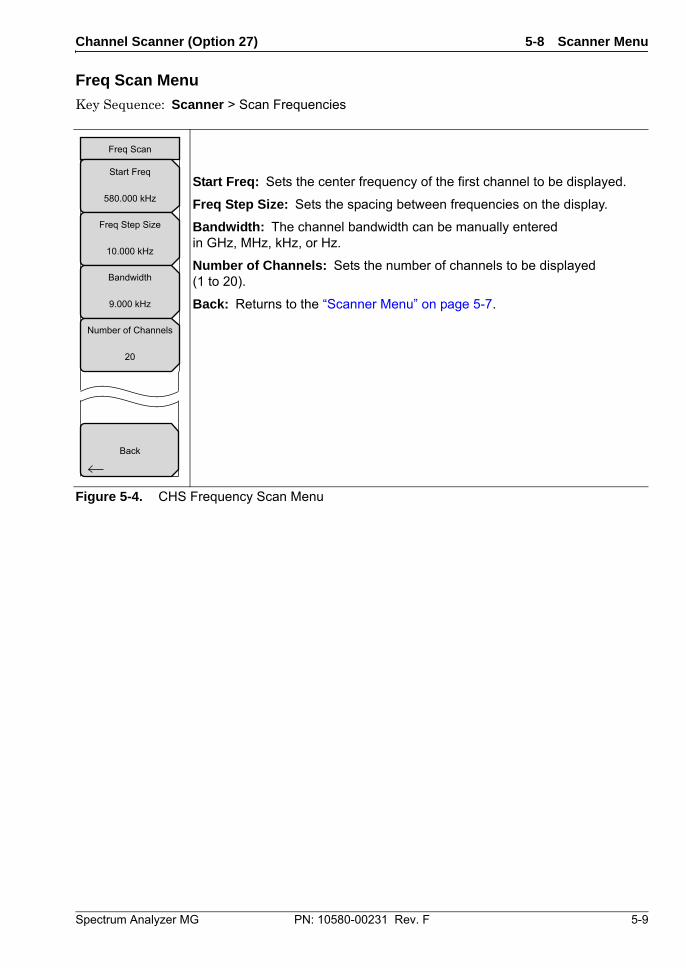
Channel Scanner (Option 27) 5-8 Scanner Menu
Spectrum Analyzer MG PN: 10580-00231 Rev. F 5-9
Freq Scan Menu
Key Sequence: Scanner > Scan Frequencies
Start Freq: Sets the center frequency of the first channel to be displayed.
Freq Step Size: Sets the spacing between frequencies on the display.
Bandwidth: The channel bandwidth can be manually entered in GHz, MHz, kHz, or Hz.
Number of Channels: Sets the number of channels to be displayed (1 to 20).
Back: Returns to the “Scanner Menu” on page 5-7.
Figure 5-4. CHS Frequency Scan Menu
Back
Freq Scan
Start Freq
580.000 kHz
Freq Step Size
10.000 kHz
Bandwidth
9.000 kHz
Number of Channels
20
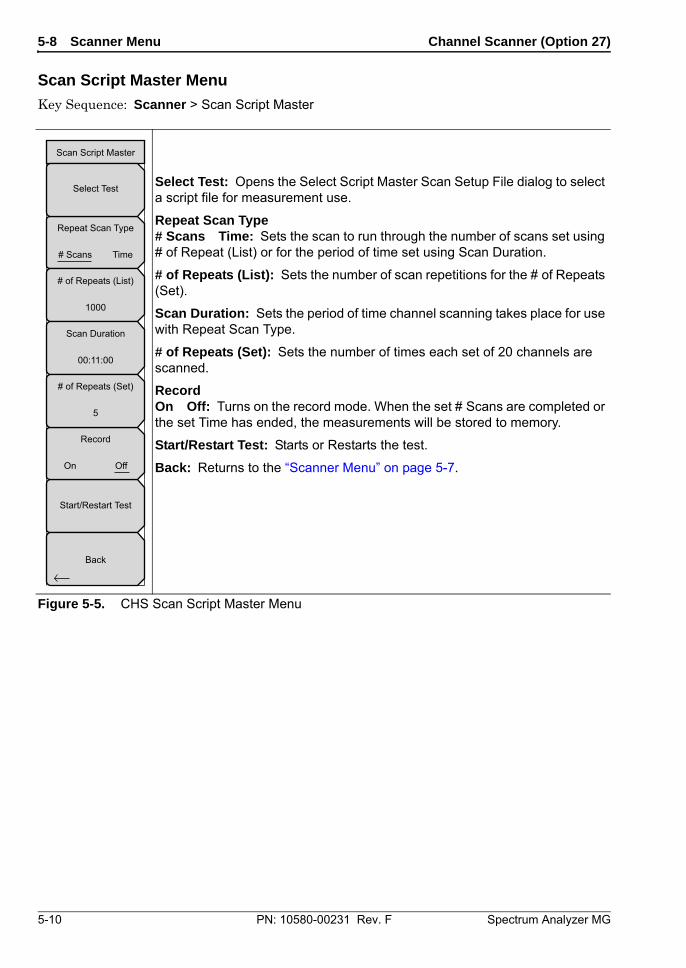
5-8 Scanner Menu Channel Scanner (Option 27)
5-10 PN: 10580-00231 Rev. F Spectrum Analyzer MG
Scan Script Master Menu
Key Sequence: Scanner > Scan Script Master
Select Test: Opens the Select Script Master Scan Setup File dialog to select a script file for measurement use.
Repeat Scan Type# Scans Time: Sets the scan to run through the number of scans set using # of Repeat (List) or for the period of time set using Scan Duration.
# of Repeats (List): Sets the number of scan repetitions for the # of Repeats (Set).
Scan Duration: Sets the period of time channel scanning takes place for use with Repeat Scan Type.
# of Repeats (Set): Sets the number of times each set of 20 channels are scanned.
RecordOn Off: Turns on the record mode. When the set # Scans are completed or the set Time has ended, the measurements will be stored to memory.
Start/Restart Test: Starts or Restarts the test.
Back: Returns to the “Scanner Menu” on page 5-7.
Figure 5-5. CHS Scan Script Master Menu
Start/Restart Test
Repeat Scan Type
# Scans Time
Record
On Off
Scan Script Master
Select Test
# of Repeats (List)
1000
Scan Duration
00:11:00
# of Repeats (Set)
5
Back
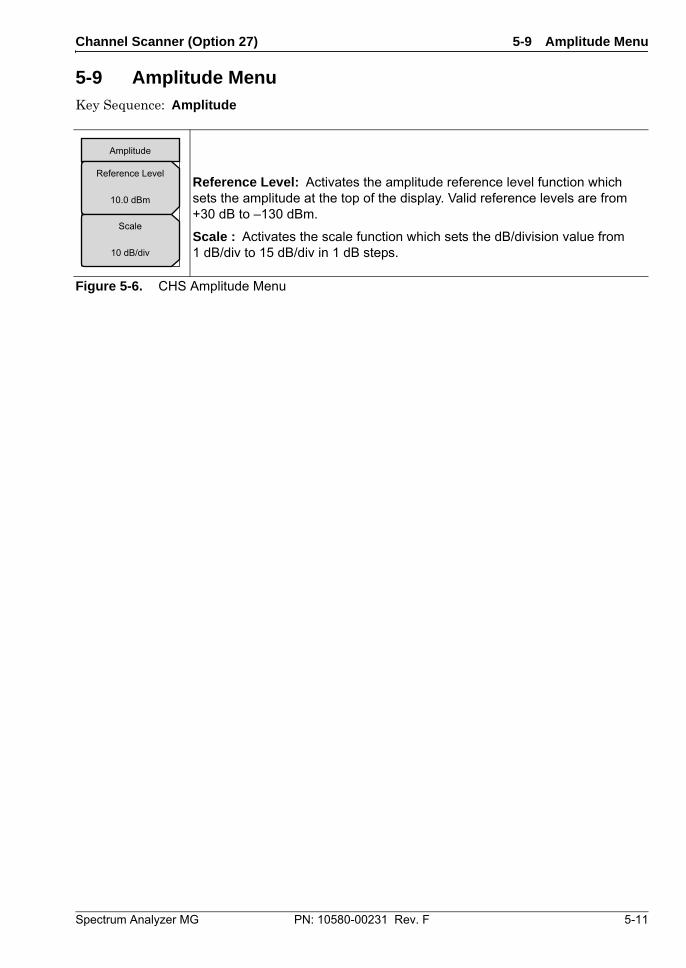
Channel Scanner (Option 27) 5-9 Amplitude Menu
Spectrum Analyzer MG PN: 10580-00231 Rev. F 5-11
5-9 Amplitude Menu Key Sequence: Amplitude
Reference Level: Activates the amplitude reference level function which sets the amplitude at the top of the display. Valid reference levels are from +30 dB to –130 dBm.
Scale : Activates the scale function which sets the dB/division value from 1 dB/div to 15 dB/div in 1 dB steps.
Figure 5-6. CHS Amplitude Menu
Amplitude
Reference Level
10.0 dBm
Scale
10 dB/div
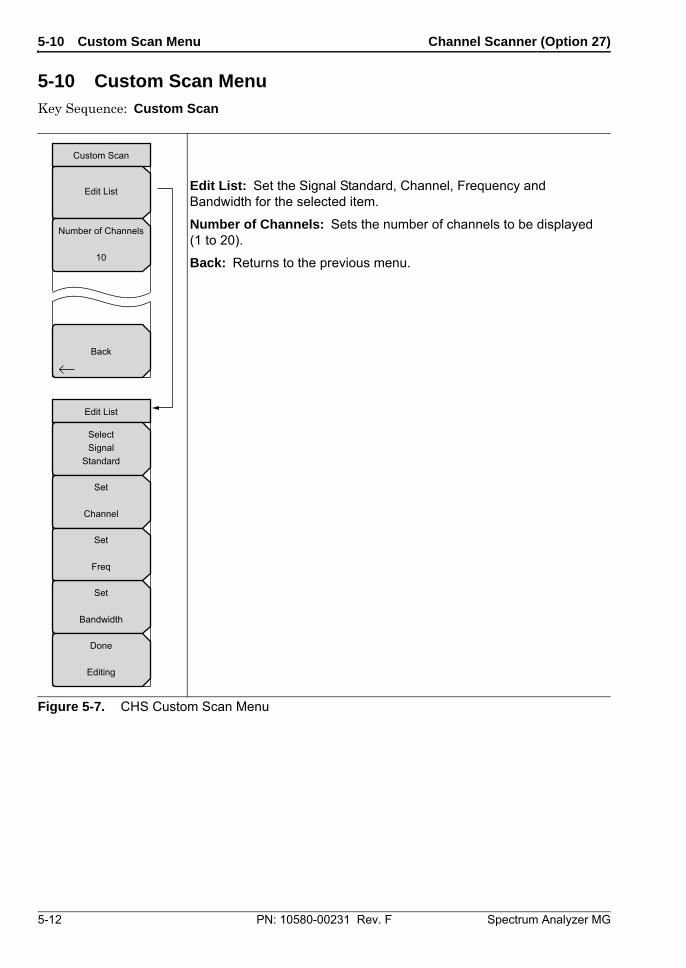
5-10 Custom Scan Menu Channel Scanner (Option 27)
5-12 PN: 10580-00231 Rev. F Spectrum Analyzer MG
5-10 Custom Scan Menu Key Sequence: Custom Scan
Edit List: Set the Signal Standard, Channel, Frequency and Bandwidth for the selected item.
Number of Channels: Sets the number of channels to be displayed (1 to 20).
Back: Returns to the previous menu.
Figure 5-7. CHS Custom Scan Menu
Custom Scan
Back
Edit List
Number of Channels
10
Set
Bandwidth
Edit List
SelectSignal
Standard
Set
Channel
Set
Freq
Done
Editing
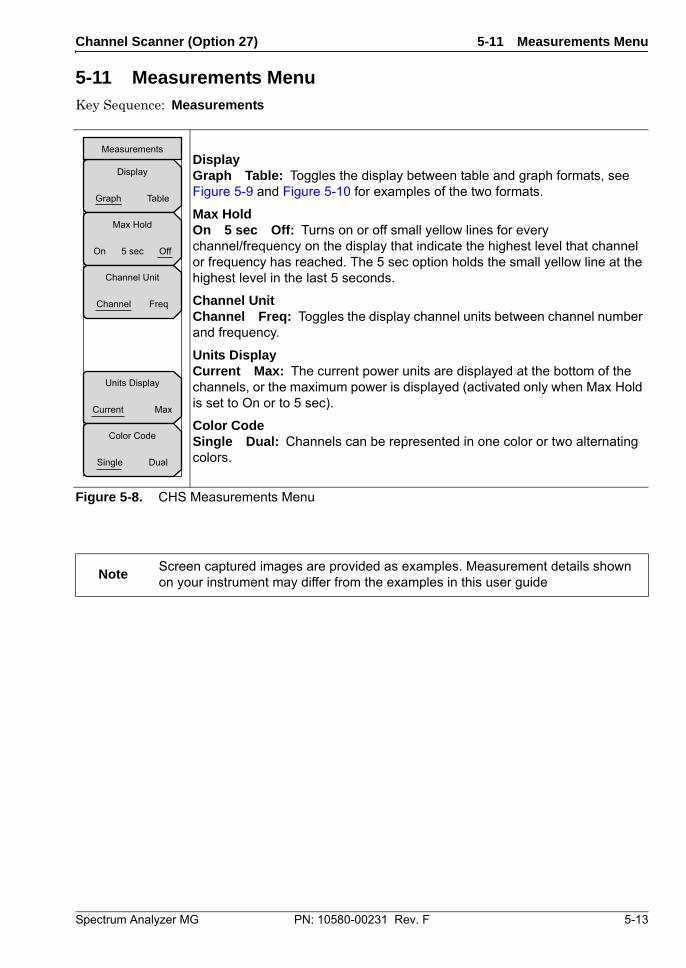
Channel Scanner (Option 27) 5-11 Measurements Menu
Spectrum Analyzer MG PN: 10580-00231 Rev. F 5-13
5-11 Measurements Menu Key Sequence: Measurements
DisplayGraph Table: Toggles the display between table and graph formats, see Figure 5-9 and Figure 5-10 for examples of the two formats.
Max HoldOn 5 sec Off: Turns on or off small yellow lines for every channel/frequency on the display that indicate the highest level that channel or frequency has reached. The 5 sec option holds the small yellow line at the highest level in the last 5 seconds.
Channel UnitChannel Freq: Toggles the display channel units between channel number and frequency.
Units DisplayCurrent Max: The current power units are displayed at the bottom of the channels, or the maximum power is displayed (activated only when Max Hold is set to On or to 5 sec).
Color CodeSingle Dual: Channels can be represented in one color or two alternating colors.
Figure 5-8. CHS Measurements Menu
NoteScreen captured images are provided as examples. Measurement details shown on your instrument may differ from the examples in this user guide
Display
Graph Table
Measurements
Max Hold
On 5 sec Off
Units Display
Current Max
Color Code
Single Dual
Channel Unit
Channel Freq
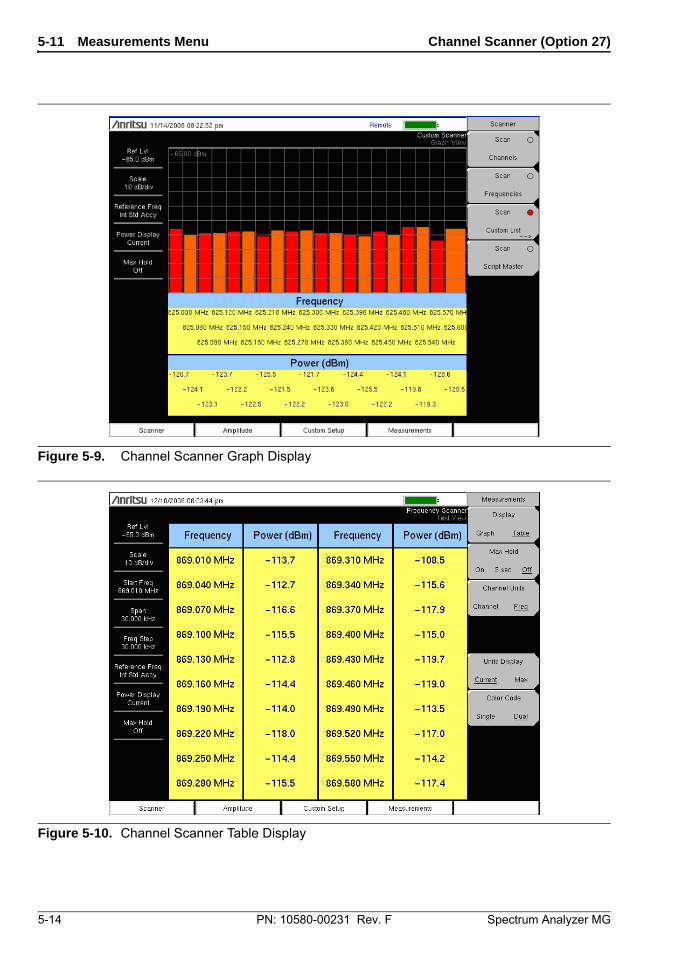
5-11 Measurements Menu Channel Scanner (Option 27)
5-14 PN: 10580-00231 Rev. F Spectrum Analyzer MG
Figure 5-9. Channel Scanner Graph Display
Figure 5-10. Channel Scanner Table Display
Channel Scanner (Option 27) 5-12 Sweep Menu
Spectrum Analyzer MG PN: 10580-00231 Rev. F 5-15
5-12 Sweep MenuThis menu is not available in Channel Scanner measurement mode.
5-13 Measure MenuThis menu is not available in Channel Scanner measurement mode.
5-14 Trace MenuThis menu is not available in Channel Scanner measurement mode.
5-15 Limit MenuThis menu is not available in Channel Scanner measurement mode.
5-16 Other MenusPreset, File, Mode, and System are described in the User Guide.

5-12 Sweep Menu Channel Scanner (Option 27)
5-16 PN: 10580-00231 Rev. F Spectrum Analyzer MG
Spectrum Analyzer MG PN: 10580-00231 Rev. F 6-1
Chapter 6 — CW Signal Generator (Option 28)
6-1 Introduction This chapter presents information and procedures used to make measurements using the optional CW Signal Generator mode (Option 28).
The CW Signal Generator provides a continuous wave (CW) signal from the VNA RF Out port of the instrument. The CW signal is primarily used for testing the sensitivity of receivers. To test receiver sensitivity, connect the signal directly to the receiver that is being measured, and then reduce the output amplitude until the receiver drops the signal.
The external splitter feeds the signal into the RF input of the instrument. The display shows the output power and frequency. The amplitude is set by using an external step attenuator.
The external splitter and attenuator are purchased separately. They are available as CW Signal Generator kit, part number 69793. The “fixed” CW signal levels vary as a function of the frequency.
Required Equipment
• Site Master S332E/S362E or Spectrum Master MS2712E/MS2713E or Cell Master MT8212E
• CW Signal Generator Kit 69793
NoteThe information in this chapter applies to the instruments with Option 28, CW Generator. Users of the LMR Master S412E should refer to Chapter 3.
NoteNot all instrument models offer every option. Please refer to the Technical Data Sheet of your instrument for available options.
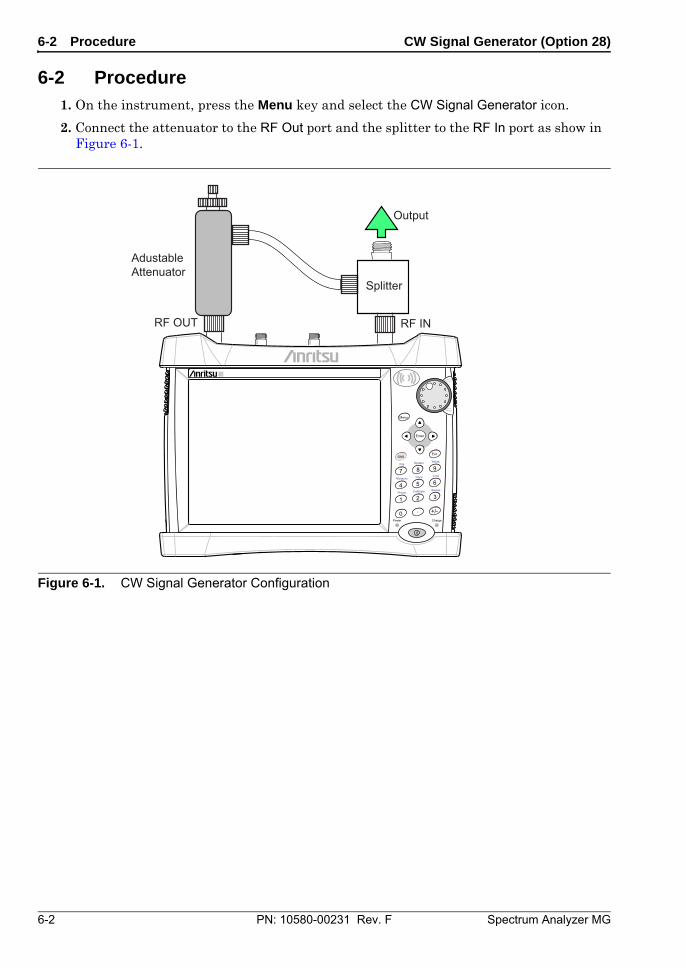
6-2 Procedure CW Signal Generator (Option 28)
6-2 PN: 10580-00231 Rev. F Spectrum Analyzer MG
6-2 Procedure1. On the instrument, press the Menu key and select the CW Signal Generator icon.
2. Connect the attenuator to the RF Out port and the splitter to the RF In port as show in Figure 6-1.
Figure 6-1. CW Signal Generator Configuration
Power Charge
+/-.0
3Sweep
2Calibrate
1Preset
6Limit
5Trace
4Measure
9Mode
8System
7File
ShiftEsc
Enter
Menu
RF OUT
AdustableAttenuator
Splitter
RF IN
Output
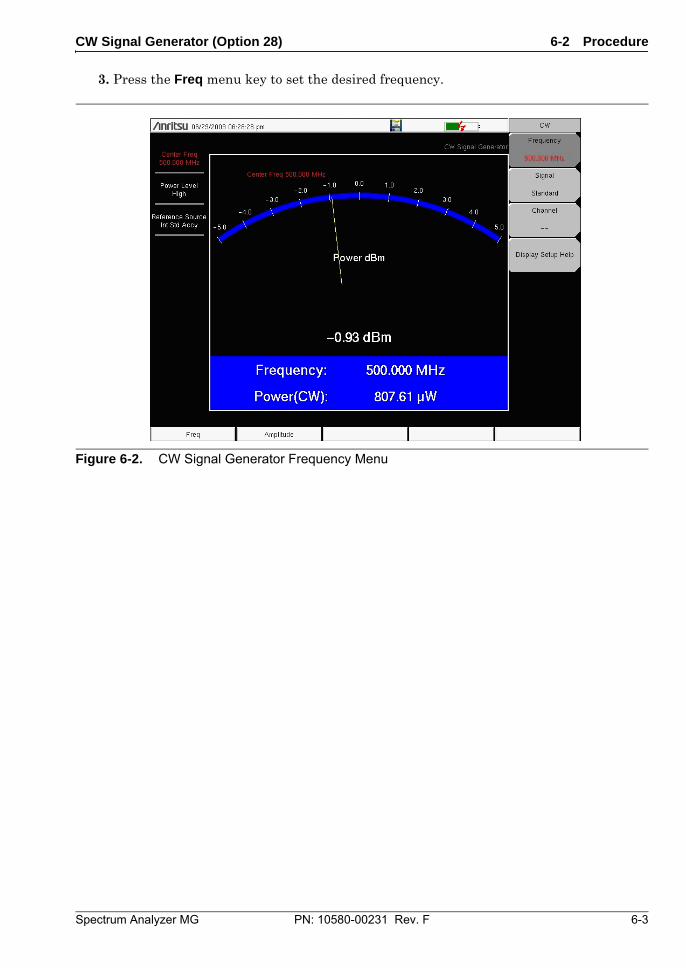
CW Signal Generator (Option 28) 6-2 Procedure
Spectrum Analyzer MG PN: 10580-00231 Rev. F 6-3
3. Press the Freq menu key to set the desired frequency.
Figure 6-2. CW Signal Generator Frequency Menu
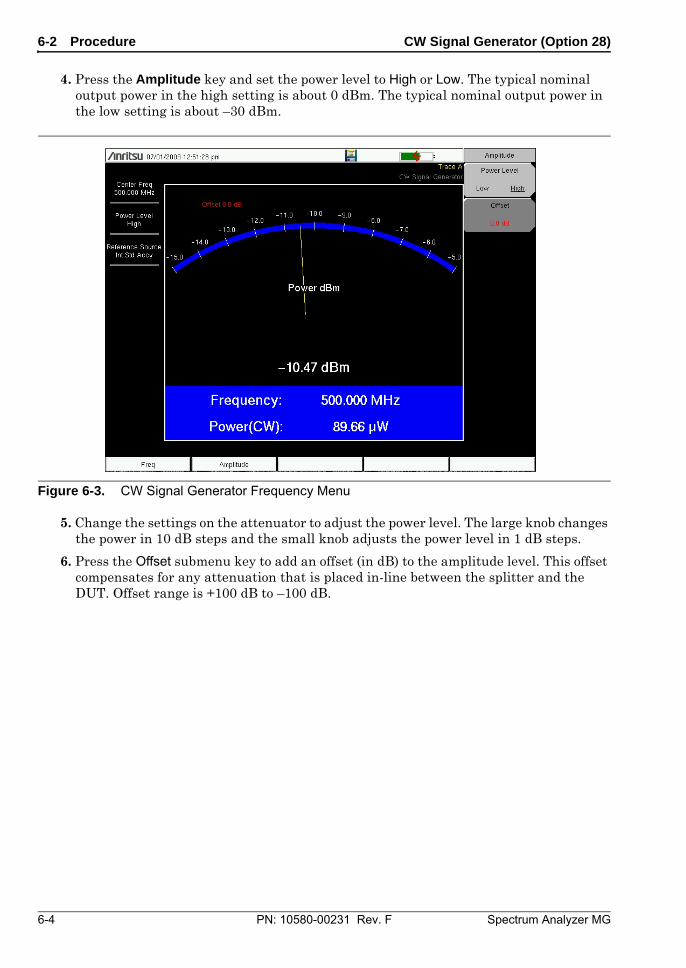
6-2 Procedure CW Signal Generator (Option 28)
6-4 PN: 10580-00231 Rev. F Spectrum Analyzer MG
4. Press the Amplitude key and set the power level to High or Low. The typical nominal output power in the high setting is about 0 dBm. The typical nominal output power in the low setting is about –30 dBm.
5. Change the settings on the attenuator to adjust the power level. The large knob changes the power in 10 dB steps and the small knob adjusts the power level in 1 dB steps.
6. Press the Offset submenu key to add an offset (in dB) to the amplitude level. This offset compensates for any attenuation that is placed in-line between the splitter and the DUT. Offset range is +100 dB to –100 dB.
Figure 6-3. CW Signal Generator Frequency Menu
Spectrum Analyzer MG PN: 10580-00231 Rev. F 7-1
Chapter 7 — Coverage Mapping (Option 431)
7-1 IntroductionCoverage Mapping option allows users to map RSSI and ACPR measurements. The included easyMap Tools program creates special maps compatible with the Anritsu Spectrum Master. The software imports maps from any map provider and creates files with or without GPS information. The files will have a .map extension. Anritsu easyMap Tools is shipped with the instrument on a CD and is also available from the Anritsu web site (www.anritsu.com).
The Coverage Mapping option is suitable for both Indoor and Outdoor mapping.
7-2 General Measurement Setups Please refer to your User Guide for selecting the Spectrum Analysis mode, setting up frequency, span, amplitude, GPS, limit lines, markers, and file management.
7-3 Spectrum Analysis SettingsRefer to Chapter 2 for details and full menu overview of Spectrum Analysis measurements including bandwidth parameters, sweep settings, trigger types, attenuator options, and preamp settings.
This chapter presents brief examples and menu overview of Option 431, Coverage Mapping. Press Shift + Measure (4) key followed by the More submenu key. Press the Coverage Mapping submenu key.
7-4 Coverage Mapping
The Coverage Mapping option of instruments allows for both indoor (no GPS signal) and outdoor (GPS signal required).
NoteNot all instrument models offer every option. Please refer to the Technical Data Sheet of your instrument for available options.
NoteSet the instrument to Spectrum Analyzer mode for Coverage Mapping (Option 431 required) measurements described in this chapter.
NoteOutdoor coverage mapping requires Option 31, GPS. Indoor coverage mapping does not.
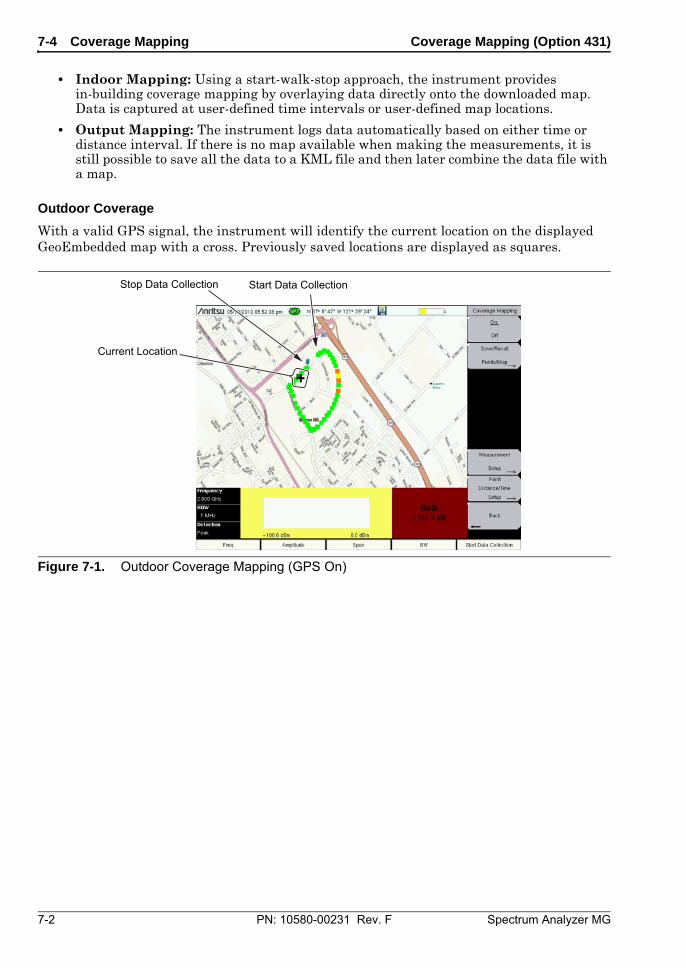
7-4 Coverage Mapping Coverage Mapping (Option 431)
7-2 PN: 10580-00231 Rev. F Spectrum Analyzer MG
• Indoor Mapping: Using a start-walk-stop approach, the instrument provides in-building coverage mapping by overlaying data directly onto the downloaded map. Data is captured at user-defined time intervals or user-defined map locations.
• Output Mapping: The instrument logs data automatically based on either time or distance interval. If there is no map available when making the measurements, it is still possible to save all the data to a KML file and then later combine the data file with a map.
Outdoor Coverage
With a valid GPS signal, the instrument will identify the current location on the displayed GeoEmbedded map with a cross. Previously saved locations are displayed as squares.
Figure 7-1. Outdoor Coverage Mapping (GPS On)
Start Data Collection
Current Location
Stop Data Collection
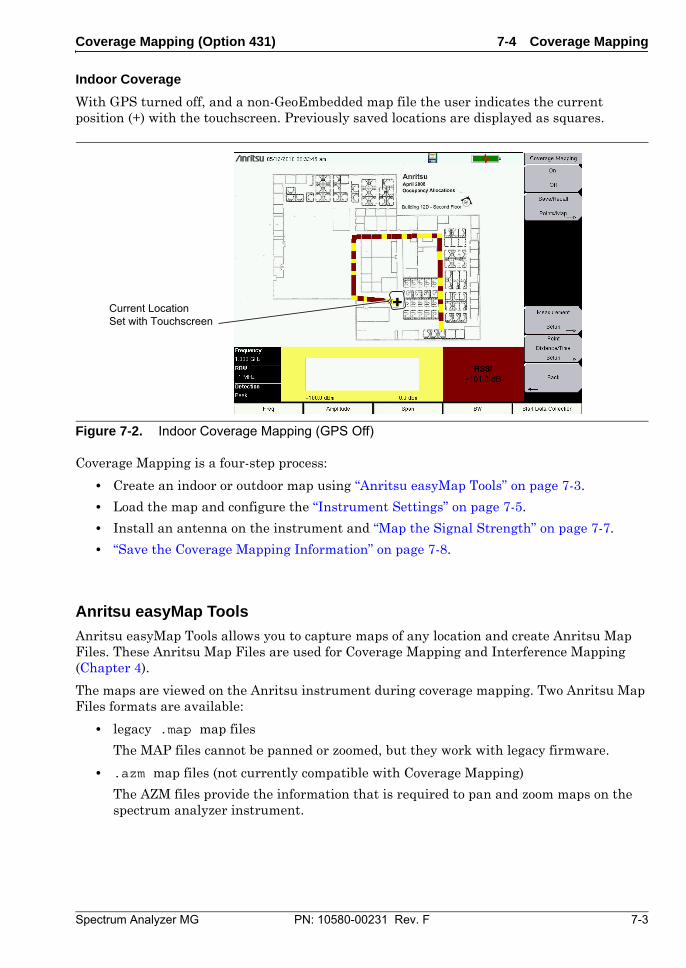
Coverage Mapping (Option 431) 7-4 Coverage Mapping
Spectrum Analyzer MG PN: 10580-00231 Rev. F 7-3
Indoor Coverage
With GPS turned off, and a non-GeoEmbedded map file the user indicates the current position (+) with the touchscreen. Previously saved locations are displayed as squares.
Coverage Mapping is a four-step process:
• Create an indoor or outdoor map using “Anritsu easyMap Tools” on page 7-3.
• Load the map and configure the “Instrument Settings” on page 7-5.
• Install an antenna on the instrument and “Map the Signal Strength” on page 7-7.
• “Save the Coverage Mapping Information” on page 7-8.
Anritsu easyMap Tools
Anritsu easyMap Tools allows you to capture maps of any location and create Anritsu Map Files. These Anritsu Map Files are used for Coverage Mapping and Interference Mapping (Chapter 4).
The maps are viewed on the Anritsu instrument during coverage mapping. Two Anritsu Map Files formats are available:
• legacy .map map files
The MAP files cannot be panned or zoomed, but they work with legacy firmware.
• .azm map files (not currently compatible with Coverage Mapping)
The AZM files provide the information that is required to pan and zoom maps on the spectrum analyzer instrument.
Figure 7-2. Indoor Coverage Mapping (GPS Off)
Current LocationSet with Touchscreen
7-4 Coverage Mapping Coverage Mapping (Option 431)
7-4 PN: 10580-00231 Rev. F Spectrum Analyzer MG
Download easyMap Tools from the Anritsu web site (www.anritsu.com). Additional information about easyMap Tools is available in the software Help.
Outdoor Maps
Type an address in easyMap Tool and capturing the map with GPS data.
Indoor Map
In easyMap Tools, open a bitmapped image (JPEG, GIF, TIFF, or PNG) of the floor plan for indoor mapping. The image size should be close to 666 pixels x 420 pixels (~1.6:1 ratio).
NoteFor best results, the coverage map should extended beyond estimated location of bearing readings and have the general location of the interferer centered in the map.
Note A USB flash drive is required to transfer maps to the instrument.
Coverage Mapping (Option 431) 7-4 Coverage Mapping
Spectrum Analyzer MG PN: 10580-00231 Rev. F 7-5
Instrument Settings
Setup
1. Create the appropriate map with Anritsu easyMap Tools. Refer to “Anritsu easyMap Tools” on page 7-3. Outdoor mapping requires a GeoEmbedded map or the default grid.
2. Open up Coverage Mapping by pressing the Menu key and selecting the Spectrum Analyzer icon or press Shift then Mode (9), highlight Spectrum Analyzer and press Enter.
3. Press Shift then Measure (4). Press the More submenu key then press the Coverage Mapping submenu key. Confirm that coverage mapping is On.
Continue with Step 4 for outdoor coverage mapping only. GPS must be off for indoor mapping.
4. Turn on GPS.
a. Press Shift then System (8).
b. Press the GPS submenu key.
c. Connect a GPS antenna to the SMA connector.
d. Turn on GPS. On should be underlined in the GPS submenu key.
e. Press GPS info and verify that the information from three or more satellites is captured. Press Esc to close the info box.
It may take several minutes for the GPS receiver to track at least three satellites. When it does the GPS icon at the top of the screen will turn green. Refer to the User Guide for your instrument for additional information about GPS.
Recall a Map (Indoor or Outdoor Coverage)
The instrument allows you to recall a .map file (created with Anritsu easyMap Tools). With a valid GPS signal the current location will be displayed on an outdoor map or an arrow will show the direction of the current location if it is outside the map coverage area. With an indoor map the user positions the cross at the current location using the touchscreen, or by using the arrow keys and then Enter.
Connect the USB flash drive that has the map file or files created in “Anritsu easyMap Tools” to the instrument.
1. Select the Coverage Mapping submenu key.
2. Press the Save/Recall Points/Map submenu key.
3. Press Recall a Map and select the appropriate map from the USB flash drive.
4. Use the arrow keys to scroll down to the desired map and press Enter to select.
Step 5 and Step 6 apply for outdoor coverage mapping only. 5. The new map file will be displayed and the current location (if within the
GPS boundaries of the displayed map) is shown as a cross with outdoor mapping.
6. If the current location is outside the map boundaries, an arrow will indicate the direction of the current location in relation to the displayed map.
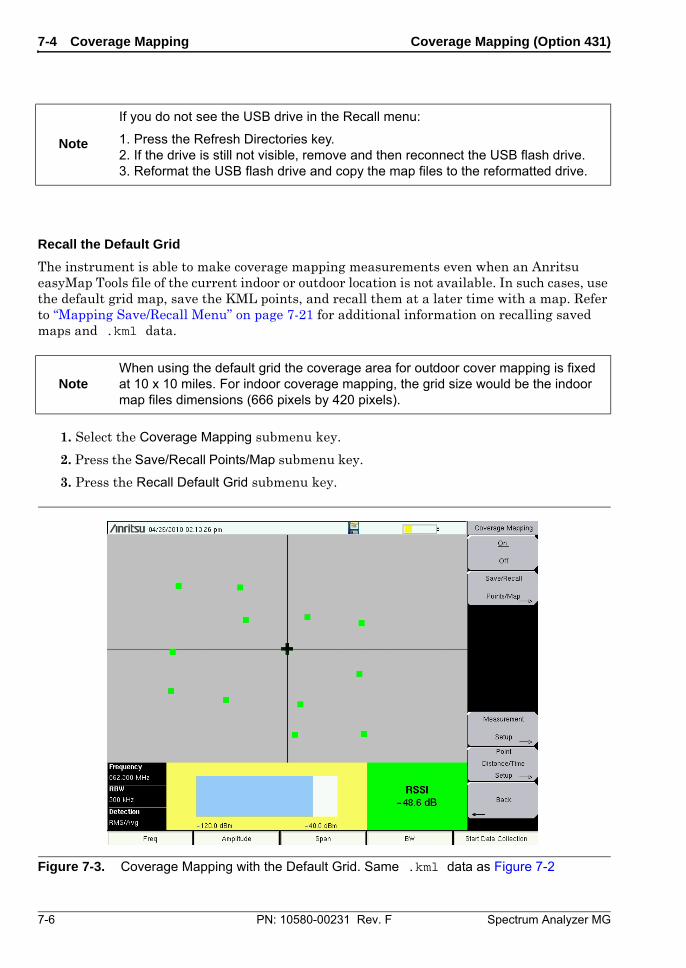
7-4 Coverage Mapping Coverage Mapping (Option 431)
7-6 PN: 10580-00231 Rev. F Spectrum Analyzer MG
Recall the Default Grid
The instrument is able to make coverage mapping measurements even when an Anritsu easyMap Tools file of the current indoor or outdoor location is not available. In such cases, use the default grid map, save the KML points, and recall them at a later time with a map. Refer to “Mapping Save/Recall Menu” on page 7-21 for additional information on recalling saved maps and .kml data.
1. Select the Coverage Mapping submenu key.
2. Press the Save/Recall Points/Map submenu key.
3. Press the Recall Default Grid submenu key.
Note
If you do not see the USB drive in the Recall menu:
1. Press the Refresh Directories key. 2. If the drive is still not visible, remove and then reconnect the USB flash drive. 3. Reformat the USB flash drive and copy the map files to the reformatted drive.
NoteWhen using the default grid the coverage area for outdoor cover mapping is fixed at 10 x 10 miles. For indoor coverage mapping, the grid size would be the indoor map files dimensions (666 pixels by 420 pixels).
Figure 7-3. Coverage Mapping with the Default Grid. Same .kml data as Figure 7-2
Coverage Mapping (Option 431) 7-4 Coverage Mapping
Spectrum Analyzer MG PN: 10580-00231 Rev. F 7-7
Map the Signal Strength
Coverage Mapping supports RSSI measurement or ACPR measurement during mapping.
ACPR
1. Select the Coverage Mapping submenu key.
2. Press the Measurement Setup submenu key.
3. Press ACPR once to select and again to open the setup menu.
a. Enter the Main and Adjacent Channel Bandwidths.
b. Enter the Channel Spacing.
c. Enter Good Passing Criteria and the Poor threshold level.
d. The main channel power indicator in the bottom part and the data collection squares will display colors as shown below:
Red Value (Poor) < Yellow Value < Green Value (Good)
4. Press the Start Data Collection main menu key. Data will be collected at the time or distance interval based on the setting in “Point Distance/Time Setup Menu” on page 7-19. The color of the squares indicate the power level based on the ACPR setup.
5. Press the Stop Data Collection main menu key. Save the collected data as a .kml file, a tab-delimited text file (.mtd), or a .jpg file. Refer to “Mapping Save/Recall Menu” on page 7-17.
RSSI
1. Select the Coverage Mapping submenu key.
2. Press the Measurement Setup submenu key.
3. Press RSSI once to select and again to open the setup menu.
4. Set the threshold levels: Excellent, Very Good, Good, and Poor.
5. Press the Start Data Collection main menu key. Data will be collected at the time or distance interval based on the setting in “Point Distance/Time Setup Menu” on page 7-19. The color of the squares indicates the power level based on the RSSI setup.
6. Press the Stop Data Collection main menu key. Save the collected data as a .kml file, a tab-delimited text file (.mtd), or a .jpg file. Refer to “Mapping Save/Recall Menu” on page 7-17.
Note The collected data can be saved in multiple formats.
7-4 Coverage Mapping Coverage Mapping (Option 431)
7-8 PN: 10580-00231 Rev. F Spectrum Analyzer MG
Save the Coverage Mapping Information
There are three save options in Coverage Mapping: “Save KML Points”, “Save Tab Delimited Points” on page 7-9 or “Save JPG” on page 7-10.
Save KML Points
Press Save/Recall Points/Map then Save KML Points. At the Save menu, press Enter. The following information is saved for the points and vectors currently displayed on the screen:
• Signal strength
• Setup (frequency, RBW, VBW, and detection type)
• Current location
The .kml file can be opened and viewed with Google Earth (Figure 7-4 on page 7-9) and can also be recalled and viewed on the instrument. Refer to “Mapping Save/Recall Menu” on page 7-21 for additional information.
Note
There are two options for interior coverage mapping considering the instrument does not have location or distance information available without GPS.
Option 1: Sets the Repeat Type to Time and walk the perimeter of the coverage area. Press the touchscreen at each turn and the unit will interpolate collected data points based on the Repeat Time setting.
Option 2: Set the Repeat Type to Distance and walk the coverage area. Press the touchscreen at any time that signal power data points in required.
The saved .kml file in either option will not have GPS data, but it will plot on a 666 x 420 grid with RSSI or ACPR data for each captured point.
Note
Installing Google Earth
1. Go to the web site: http://earth.google.com/.
2. Click Download Google Earth and follow the on-screen instructions.
3. After download, install Google Earth on your computer.
4. Double-click on the saved .kml file to view the measurements Google Earth.
After Google Earth is opened, user instructions and several types of help are available from the Help pull-down menu.
Saved .kml files can not be viewed directly from the instrument using Google Earth, the files need to be first copied to a USB memory stick.
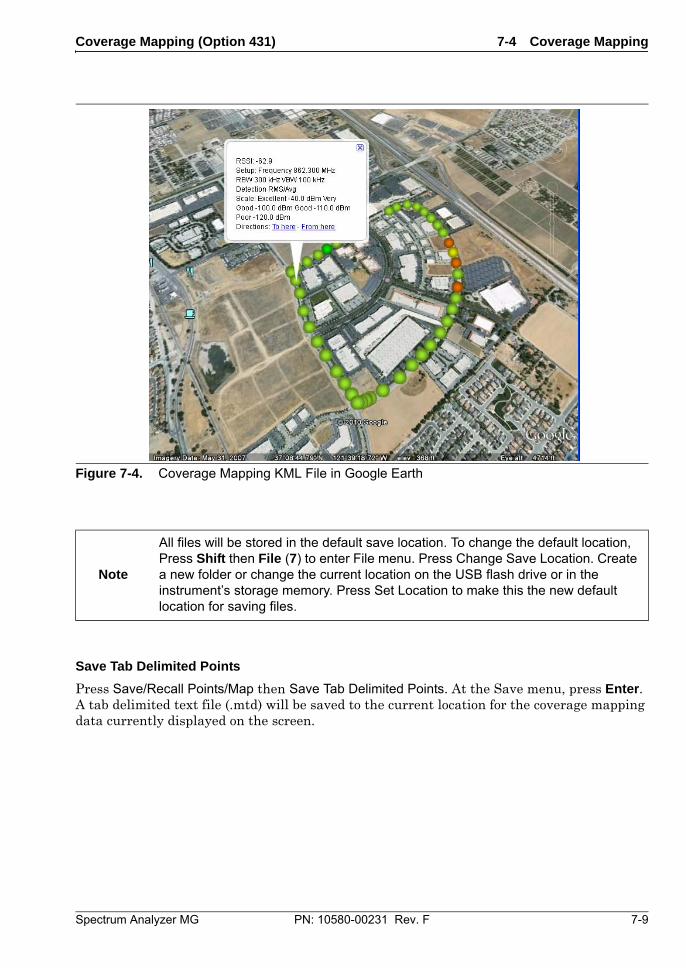
Coverage Mapping (Option 431) 7-4 Coverage Mapping
Spectrum Analyzer MG PN: 10580-00231 Rev. F 7-9
Save Tab Delimited Points
Press Save/Recall Points/Map then Save Tab Delimited Points. At the Save menu, press Enter. A tab delimited text file (.mtd) will be saved to the current location for the coverage mapping data currently displayed on the screen.
Figure 7-4. Coverage Mapping KML File in Google Earth
Note
All files will be stored in the default save location. To change the default location, Press Shift then File (7) to enter File menu. Press Change Save Location. Create a new folder or change the current location on the USB flash drive or in the instrument’s storage memory. Press Set Location to make this the new default location for saving files.
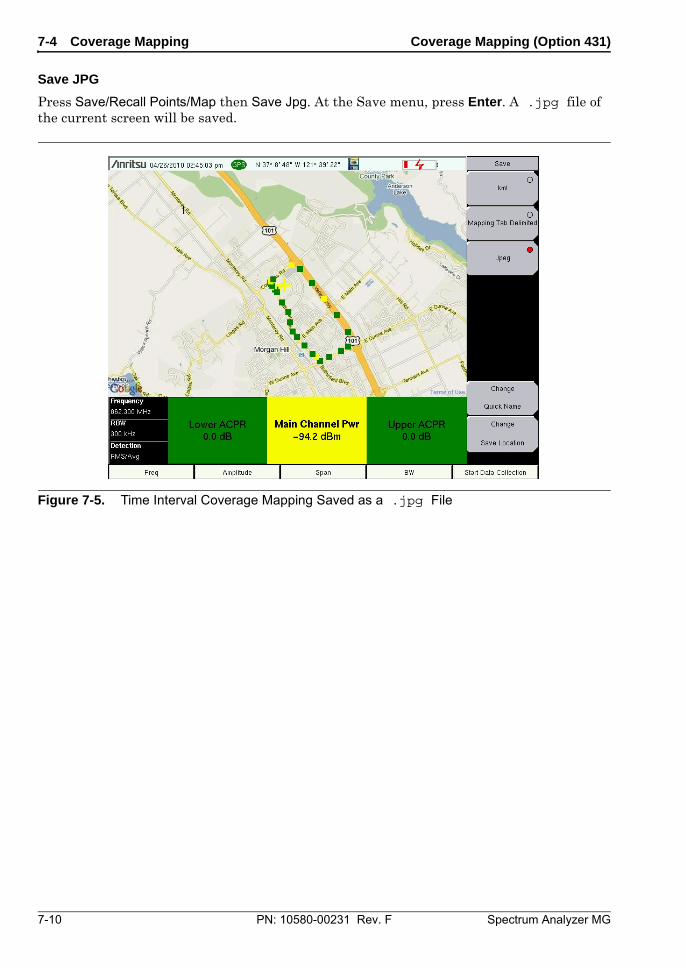
7-4 Coverage Mapping Coverage Mapping (Option 431)
7-10 PN: 10580-00231 Rev. F Spectrum Analyzer MG
Save JPG
Press Save/Recall Points/Map then Save Jpg. At the Save menu, press Enter. A .jpg file of the current screen will be saved.
Figure 7-5. Time Interval Coverage Mapping Saved as a .jpg File
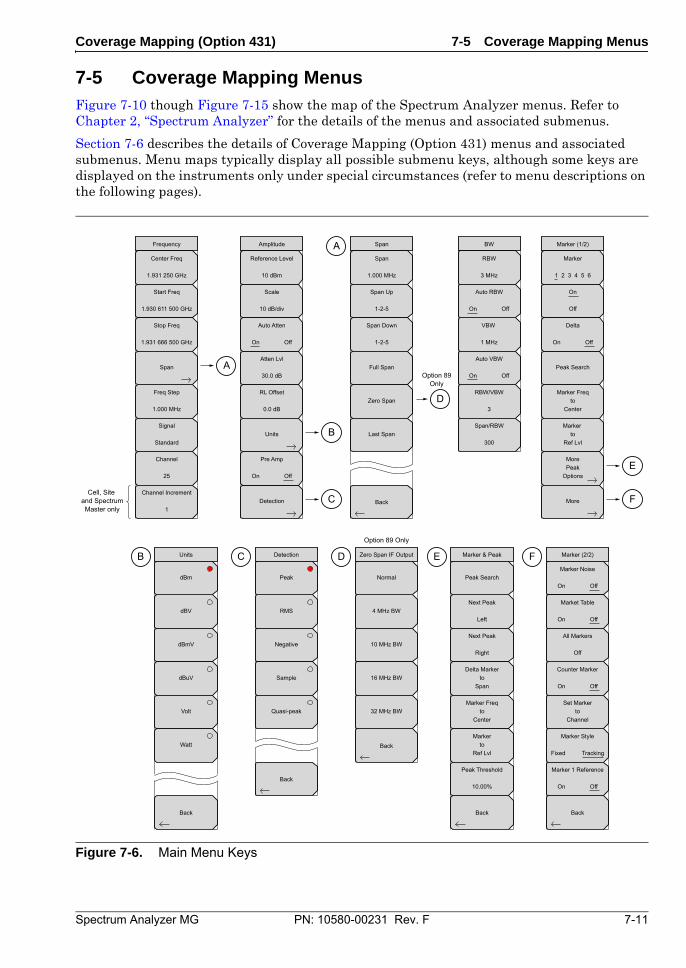
Coverage Mapping (Option 431) 7-5 Coverage Mapping Menus
Spectrum Analyzer MG PN: 10580-00231 Rev. F 7-11
7-5 Coverage Mapping Menus Figure 7-10 though Figure 7-15 show the map of the Spectrum Analyzer menus. Refer to Chapter 2, “Spectrum Analyzer” for the details of the menus and associated submenus.
Section 7-6 describes the details of Coverage Mapping (Option 431) menus and associated submenus. Menu maps typically display all possible submenu keys, although some keys are displayed on the instruments only under special circumstances (refer to menu descriptions on the following pages).
Figure 7-6. Main Menu Keys
Amplitude
Units
Scale
10 dB/div
Atten Lvl
30.0 dB
RL Offset
0.0 dB
Reference Level
10 dBm
Frequency
Center Freq
1.931 250 GHz
Start Freq
1.930 611 500 GHz
Stop Freq
1.931 666 500 GHz
Freq Step
1.000 MHz
Channel
25
Signal
Standard
Channel Increment
1
Back
A
A
B
C
D
F
E
Units
Span
Detection
Auto Atten
On Off
Pre Amp
On Off
dBV
dBmV
dBuV
Volt
Watt
dBm
Detection
Back
RMS
Negative
Sample
Quasi-peak
Peak
CB
Marker (1/2)
Marker & Peak
On
Off
Peak Search
Marker Freqto
Center
Marker to
Ref Lvl
Marker
1 2 3 4 5 6
BW
RBW
3 MHz
VBW
1 MHz
RBW/VBW
3
Span/RBW
300
Back Back
MorePeak
Options
More
Delta
On Off
Marker (2/2)
Marker Noise
On Off
Market Table
On Off
Counter Marker
On Off
Marker Style
Fixed Tracking
Marker 1 Reference
On Off
Auto RBW
On Off
Auto VBW
On Off
Next Peak
Left
Next Peak
Right
Delta Markerto
Span
All Markers
Off
Set Markerto
Channel
Marker Freqto
Center
Markerto
Ref Lvl
Peak Threshold
10.00%
Peak Search
FEZero Span IF Output
Option 89 Only
Back
4 MHz BW
10 MHz BW
16 MHz BW
32 MHz BW
Normal
D
Back
Span
Span
1.000 MHz
Span Up
1-2-5
Span Down
1-2-5
Full Span
Zero Span
Last Span
Option 89Only
Cell, Site and SpectrumMaster only
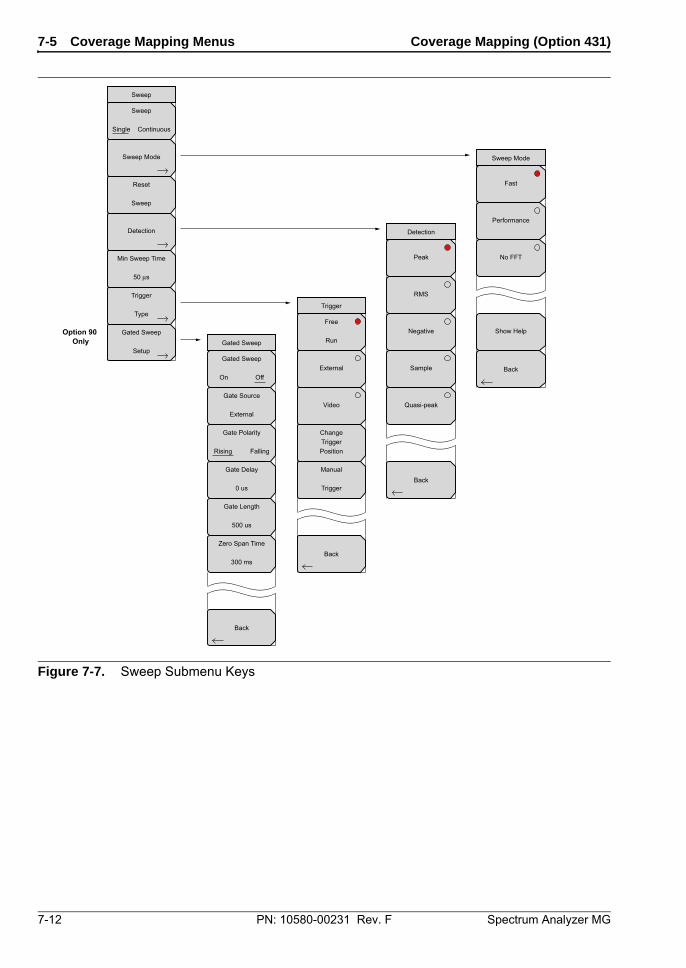
7-5 Coverage Mapping Menus Coverage Mapping (Option 431)
7-12 PN: 10580-00231 Rev. F Spectrum Analyzer MG
Figure 7-7. Sweep Submenu Keys
Trigger
Sweep
Reset
Sweep
Min Sweep Time
50 s
Back
Detection
Trigger
Type
Gated Sweep
Setup
Option 90 Only
Sweep
Single Continuous
External
Video
ChangeTriggerPosition
Manual
Trigger
Free
Run
Detection
Back
RMS
Negative
Sample
Quasi-peak
Peak
Sweep Mode
Back
Performance
No FFT
Show Help
Fast
Gated Sweep
On Off
Gate Polarity
Rising Falling
Gated Sweep
Back
Gate Source
External
Gate Delay
0 us
Gate Length
500 us
Zero Span Time
300 ms
Sweep Mode
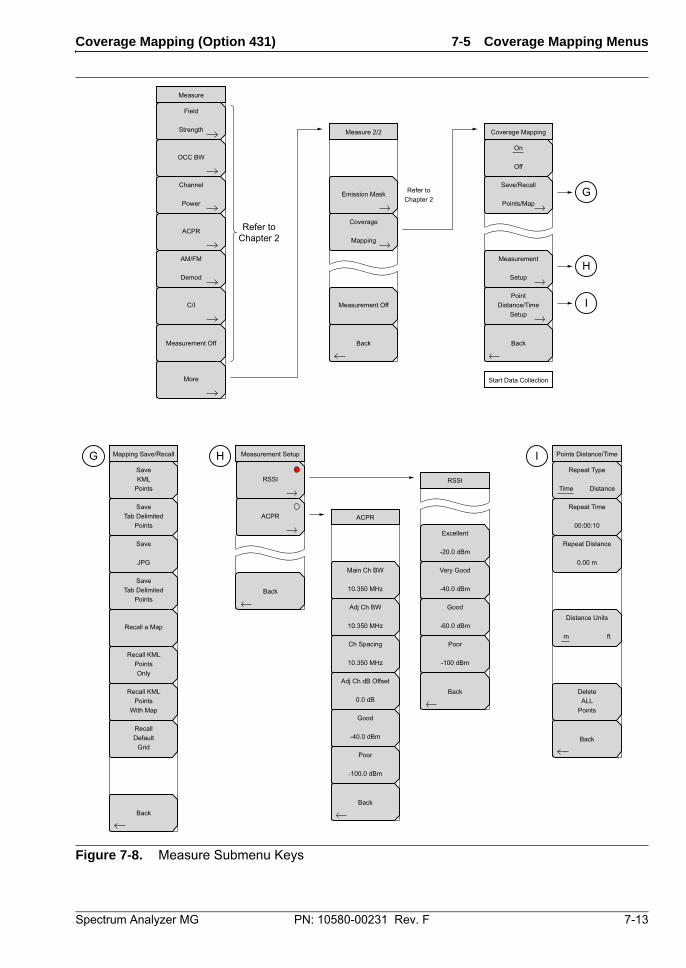
Coverage Mapping (Option 431) 7-5 Coverage Mapping Menus
Spectrum Analyzer MG PN: 10580-00231 Rev. F 7-13
Figure 7-8. Measure Submenu Keys
Measurement Off
Measure
Field
Strength
OCC BW
Channel
Power
ACPR
AM/FM
Demod
C/I
Emission Mask
Coverage
Mapping
More
Measure 2/2
Back
Measurement Off
Refer toChapter 2
Refer toChapter 2
Save/Recall
Points/Map
Measurement
Setup
PointDistance/Time
Setup
Coverage Mapping
Back
Back
Mapping Save/Recall
SaveKML
Points
Save
JPG
Recall a Map
Recall KMLPointsOnly
Recall KMLPoints
With Map
RecallDefault
Grid
Back
ACPR
Main Ch BW
10.350 MHz
Adj Ch BW
10.350 MHz
Ch Spacing
10.350 MHz
Adj Ch dB Offset
0.0 dB
Good
-40.0 dBm
Poor
-100.0 dBm
Back
Measurement Setup
On
Off
Back
RSSI
Excellent
-20.0 dBm
Very Good
-40.0 dBm
Good
-60.0 dBm
Poor
-100 dBm
G
H
I
G
Back
Points Distance/Time
Repeat Time
00:00:10
Repeat Distance
0.00 m
DeleteALL
Points
IH
RSSI
ACPR
Repeat Type
Time Distance
Distance Units
m ft
Start Data Collection
SaveTab Delimited
Points
SaveTab Delimited
Points
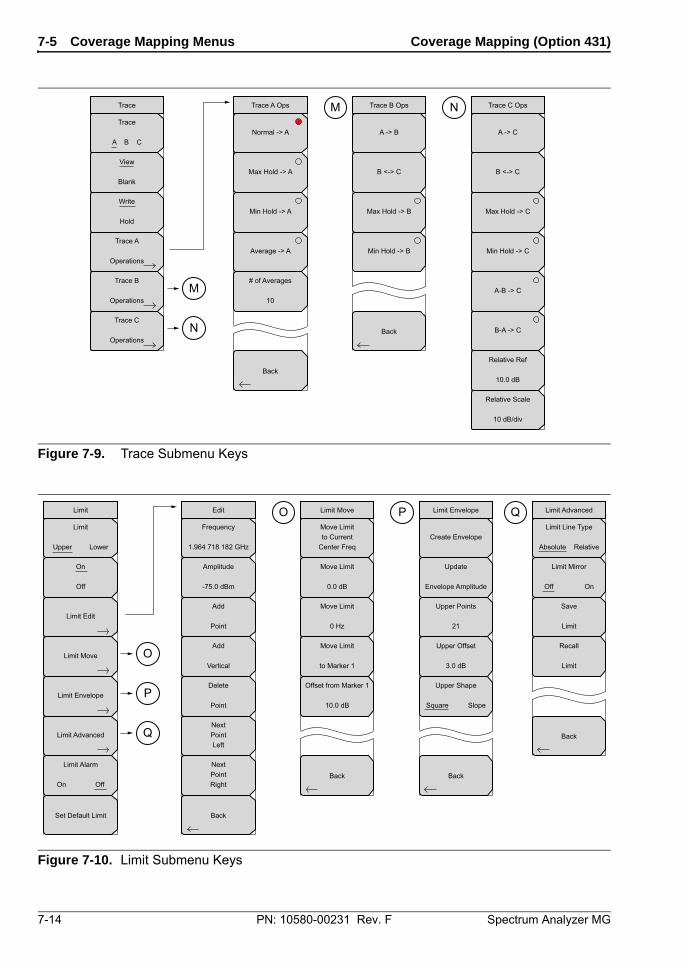
7-5 Coverage Mapping Menus Coverage Mapping (Option 431)
7-14 PN: 10580-00231 Rev. F Spectrum Analyzer MG
Figure 7-9. Trace Submenu Keys
Figure 7-10. Limit Submenu Keys
Trace Trace A Ops
Back
BackN
M
Trace A
Operations
Trace B
Operations
Trace C
Operations
View
Blank
Normal -> A
Max Hold -> A
Min Hold -> A
Average -> A
# of Averages
10
Trace B OpsM
A -> B
B <-> C
Max Hold -> B
Min Hold -> B
NTrace
A B C
Trace C Ops
A -> C
B <-> C
Max Hold -> C
Min Hold -> C
A-B -> C
B-A -> C
Relative Ref
10.0 dB
Relative Scale
10 dB/div
Write
Hold
Limit Edit
Back
Back
Upper Shape
Square Slope
Set Default Limit
O
P
Q
Limit Edit
Limit Move
Limit Envelope
Limit Advanced
On
Off
Frequency
1.964 718 182 GHz
Amplitude
-75.0 dBm
Add
Point
Add
Vertical
Delete
Point
NextPointLeft
NextPointRight
Limit MoveOMove Limitto Current
Center Freq
Move Limit
0.0 dB
Move Limit
0 Hz
Move Limit
to Marker 1
Offset from Marker 1
10.0 dB
Limit Envelope
Back
P
Create Envelope
Update
Envelope Amplitude
Upper Points
21
Upper Offset
3.0 dB
Limit Alarm
On Off
Limit
Upper Lower
Limit Line Type
Absolute Relative
Limit Advanced
Back
Q
Save
Limit
Recall
Limit
Limit Mirror
Off On
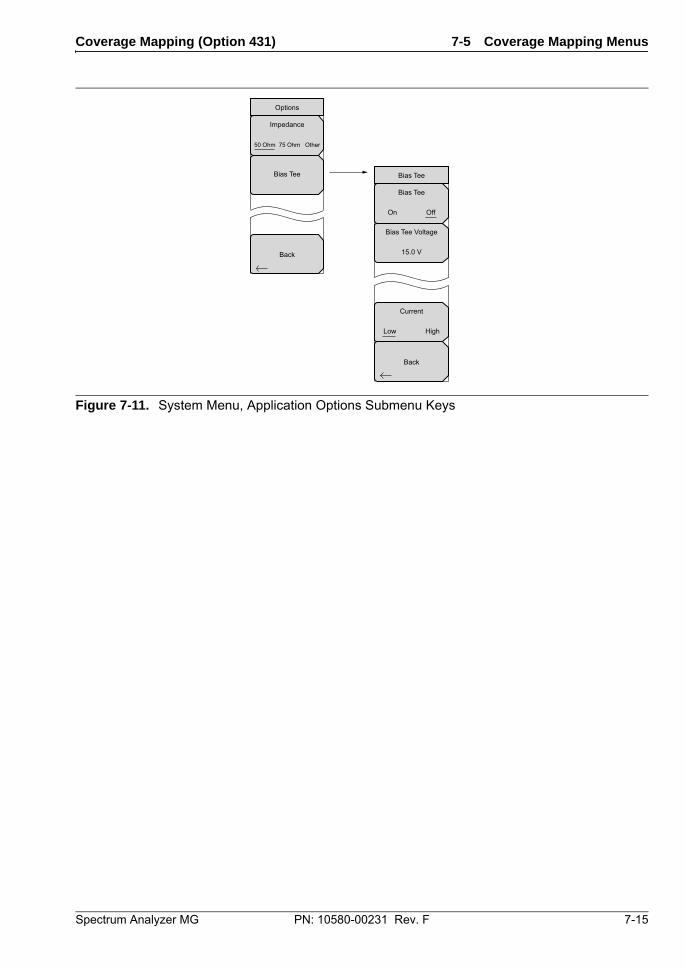
Coverage Mapping (Option 431) 7-5 Coverage Mapping Menus
Spectrum Analyzer MG PN: 10580-00231 Rev. F 7-15
Figure 7-11. System Menu, Application Options Submenu Keys
Options
Bias Tee
Impedance
50 Ohm 75 Ohm Other
Bias Tee
On Off
Current
Low High
Bias Tee
Back
Bias Tee Voltage
15.0 VBack
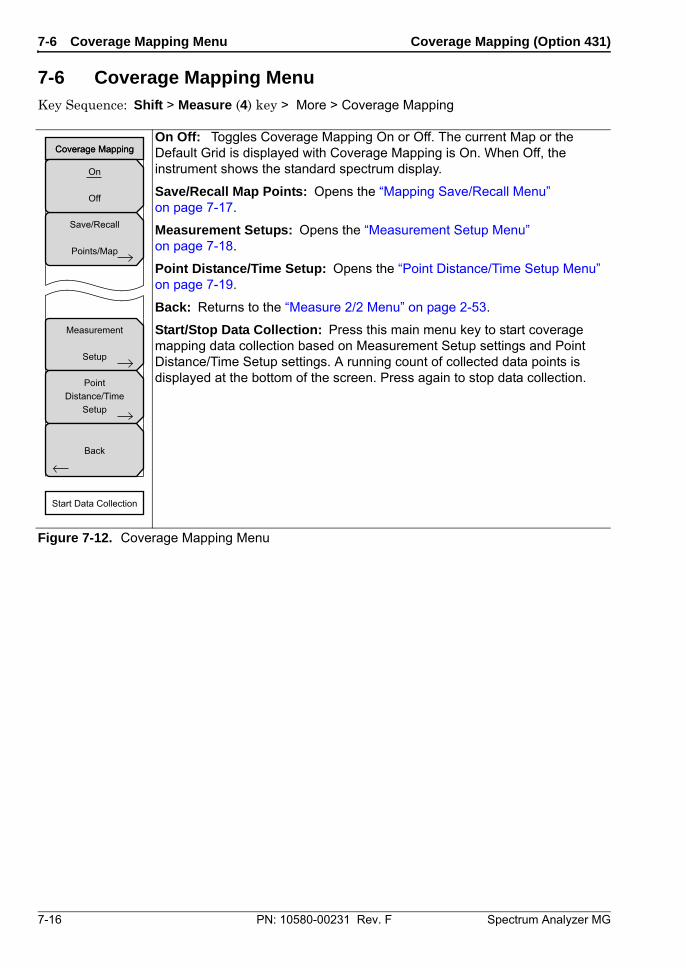
7-6 Coverage Mapping Menu Coverage Mapping (Option 431)
7-16 PN: 10580-00231 Rev. F Spectrum Analyzer MG
7-6 Coverage Mapping Menu Key Sequence: Shift > Measure (4) key > More > Coverage Mapping
On Off: Toggles Coverage Mapping On or Off. The current Map or the Default Grid is displayed with Coverage Mapping is On. When Off, the instrument shows the standard spectrum display.
Save/Recall Map Points: Opens the “Mapping Save/Recall Menu” on page 7-17.
Measurement Setups: Opens the “Measurement Setup Menu” on page 7-18.
Point Distance/Time Setup: Opens the “Point Distance/Time Setup Menu” on page 7-19.
Back: Returns to the “Measure 2/2 Menu” on page 2-53.
Start/Stop Data Collection: Press this main menu key to start coverage mapping data collection based on Measurement Setup settings and Point Distance/Time Setup settings. A running count of collected data points is displayed at the bottom of the screen. Press again to stop data collection.
Figure 7-12. Coverage Mapping Menu
Save/Recall
Points/Map
Measurement
Setup
PointDistance/Time
Setup
Coverage MappingCoverage Mapping
Start Data Collection
Back
On
Off
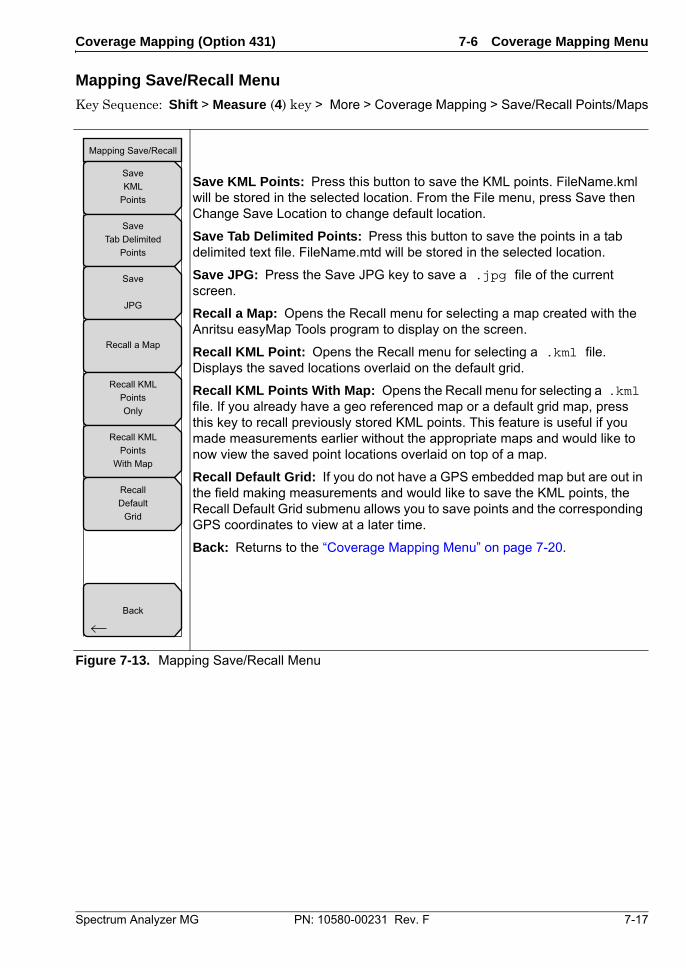
Coverage Mapping (Option 431) 7-6 Coverage Mapping Menu
Spectrum Analyzer MG PN: 10580-00231 Rev. F 7-17
Mapping Save/Recall Menu
Key Sequence: Shift > Measure (4) key > More > Coverage Mapping > Save/Recall Points/Maps
Save KML Points: Press this button to save the KML points. FileName.kml will be stored in the selected location. From the File menu, press Save then Change Save Location to change default location.
Save Tab Delimited Points: Press this button to save the points in a tab delimited text file. FileName.mtd will be stored in the selected location.
Save JPG: Press the Save JPG key to save a .jpg file of the current screen.
Recall a Map: Opens the Recall menu for selecting a map created with the Anritsu easyMap Tools program to display on the screen.
Recall KML Point: Opens the Recall menu for selecting a .kml file. Displays the saved locations overlaid on the default grid.
Recall KML Points With Map: Opens the Recall menu for selecting a .kml file. If you already have a geo referenced map or a default grid map, press this key to recall previously stored KML points. This feature is useful if you made measurements earlier without the appropriate maps and would like to now view the saved point locations overlaid on top of a map.
Recall Default Grid: If you do not have a GPS embedded map but are out in the field making measurements and would like to save the KML points, the Recall Default Grid submenu allows you to save points and the corresponding GPS coordinates to view at a later time.
Back: Returns to the “Coverage Mapping Menu” on page 7-20.
Figure 7-13. Mapping Save/Recall Menu
Back
Mapping Save/Recall
SaveKML
Points
SaveTab Delimited
Points
Save
JPG
Recall a Map
Recall KMLPointsOnly
Recall KMLPoints
With Map
RecallDefault
Grid
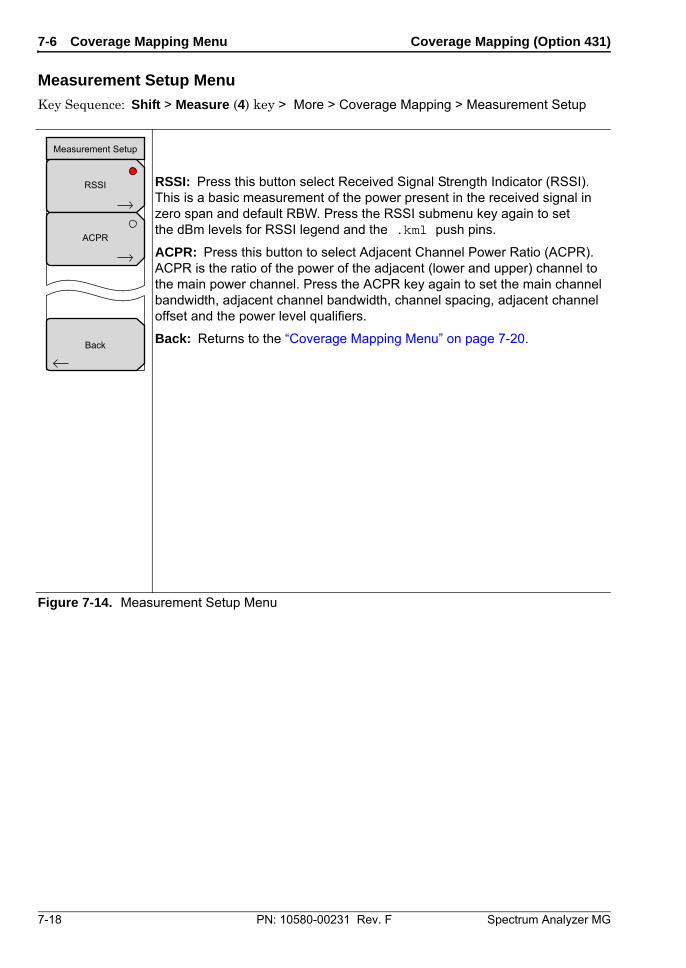
7-6 Coverage Mapping Menu Coverage Mapping (Option 431)
7-18 PN: 10580-00231 Rev. F Spectrum Analyzer MG
Measurement Setup Menu
Key Sequence: Shift > Measure (4) key > More > Coverage Mapping > Measurement Setup
RSSI: Press this button select Received Signal Strength Indicator (RSSI). This is a basic measurement of the power present in the received signal in zero span and default RBW. Press the RSSI submenu key again to set the dBm levels for RSSI legend and the .kml push pins.
ACPR: Press this button to select Adjacent Channel Power Ratio (ACPR). ACPR is the ratio of the power of the adjacent (lower and upper) channel to the main power channel. Press the ACPR key again to set the main channel bandwidth, adjacent channel bandwidth, channel spacing, adjacent channel offset and the power level qualifiers.
Back: Returns to the “Coverage Mapping Menu” on page 7-20.
Figure 7-14. Measurement Setup Menu
Back
Measurement Setup
RSSI
ACPR
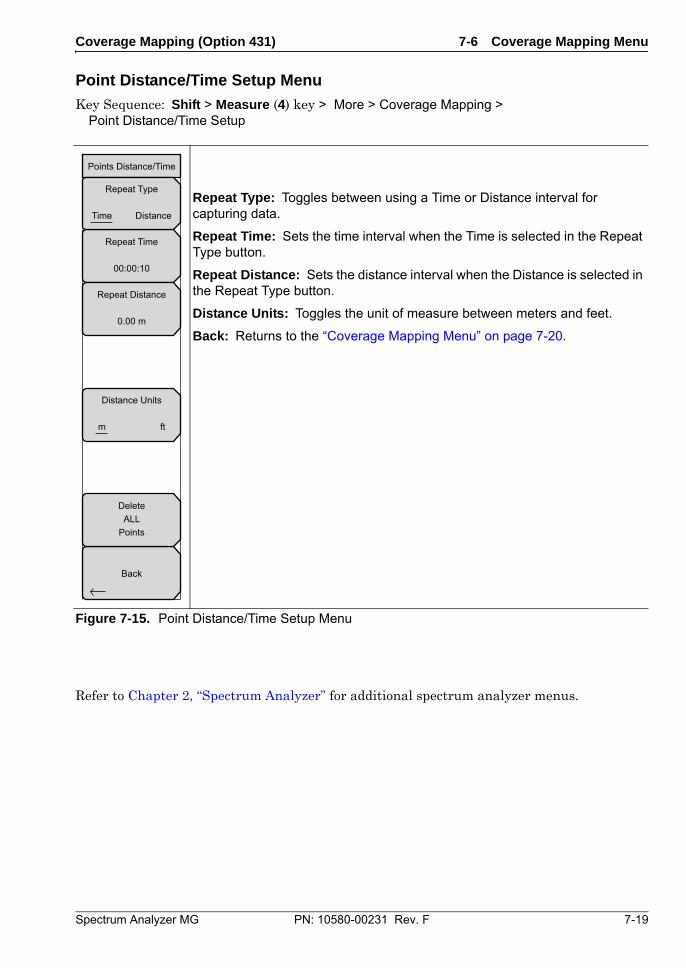
Coverage Mapping (Option 431) 7-6 Coverage Mapping Menu
Spectrum Analyzer MG PN: 10580-00231 Rev. F 7-19
Point Distance/Time Setup Menu
Key Sequence: Shift > Measure (4) key > More > Coverage Mapping > Point Distance/Time Setup
Refer to Chapter 2, “Spectrum Analyzer” for additional spectrum analyzer menus.
Repeat Type: Toggles between using a Time or Distance interval for capturing data.
Repeat Time: Sets the time interval when the Time is selected in the Repeat Type button.
Repeat Distance: Sets the distance interval when the Distance is selected in the Repeat Type button.
Distance Units: Toggles the unit of measure between meters and feet.
Back: Returns to the “Coverage Mapping Menu” on page 7-20.
Figure 7-15. Point Distance/Time Setup Menu
Back
Points Distance/Time
Repeat Time
00:00:10
Repeat Distance
0.00 m
DeleteALL
Points
Repeat Type
Time Distance
Distance Units
m ft

7-6 Coverage Mapping Menu Coverage Mapping (Option 431)
7-20 PN: 10580-00231 Rev. F Spectrum Analyzer MG
Spectrum Analyzer MG PN: 10580-00231 Rev. F 8-1
Chapter 8 — AM/FM/PM Analyzer (Option 509)
8-1 Introduction This chapter presents information and procedures that are used to make measurements when using the optional AM/FM/PM Analyzer mode (Option 509).
The AM/FM/PM Analyzer provides display and analysis of the key characteristics of analog AM, FM, and PM modulated signals. The AM/FM/PM Analyzer provides four different displays:
1. RF Spectrum shows the RF Spectrum graph, which is similar to Spectrum Analyzer mode with carrier power, carrier frequency, and occupied bandwidth measurements. To get to this view, select the Measurements menu and then press RF Spectrum. To change the occupied bandwidth measurement, press RF Spectrum again and make changes as desired.
2. Audio Spectrum shows the demodulated audio spectrum along the with the following measurements: Rate, RMS, Pk-Pk/2, SINAD, THD, and Distortion/Total. To change X-axis values to 2 kHz, 5 kHz, 10 kHz, or 20 kHz, press Audio Spectrum again and change Span. When analyzing FM and PM, the reference Y-axis value is also scalable.
3. Audio Waveform displays the time-domain demodulated waveform along with Rate, RMS, Pk-Pk/2, SINAD, THD, and Distortion/Total measurements. The X-axis value can be changed by pressing Audio Waveform and changing the Sweep Time. When analyzing FM and PM, the reference Y-axis value is also scalable.
4. Summary displays all of the above mentioned measurements from RF Spectrum as well as the demodulated signal.
Main Menu Keys in AM/FM/PM Analyzer mode:
Freq Amplitude Setup Measurements Marker
NoteNot all instrument models offer every option. Please refer to the Technical Data Sheet of your instrument for available options.
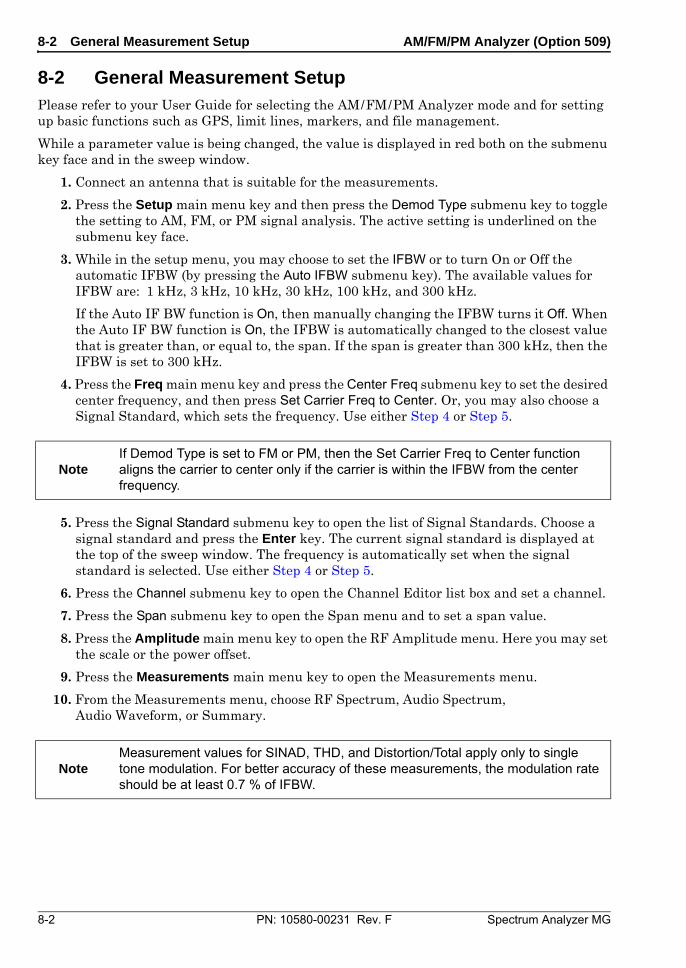
8-2 General Measurement Setup AM/FM/PM Analyzer (Option 509)
8-2 PN: 10580-00231 Rev. F Spectrum Analyzer MG
8-2 General Measurement Setup Please refer to your User Guide for selecting the AM/FM/PM Analyzer mode and for setting up basic functions such as GPS, limit lines, markers, and file management.
While a parameter value is being changed, the value is displayed in red both on the submenu key face and in the sweep window.
1. Connect an antenna that is suitable for the measurements.
2. Press the Setup main menu key and then press the Demod Type submenu key to toggle the setting to AM, FM, or PM signal analysis. The active setting is underlined on the submenu key face.
3. While in the setup menu, you may choose to set the IFBW or to turn On or Off the automatic IFBW (by pressing the Auto IFBW submenu key). The available values for IFBW are: 1 kHz, 3 kHz, 10 kHz, 30 kHz, 100 kHz, and 300 kHz.
If the Auto IF BW function is On, then manually changing the IFBW turns it Off. When the Auto IF BW function is On, the IFBW is automatically changed to the closest value that is greater than, or equal to, the span. If the span is greater than 300 kHz, then the IFBW is set to 300 kHz.
4. Press the Freq main menu key and press the Center Freq submenu key to set the desired center frequency, and then press Set Carrier Freq to Center. Or, you may also choose a Signal Standard, which sets the frequency. Use either Step 4 or Step 5.
5. Press the Signal Standard submenu key to open the list of Signal Standards. Choose a signal standard and press the Enter key. The current signal standard is displayed at the top of the sweep window. The frequency is automatically set when the signal standard is selected. Use either Step 4 or Step 5.
6. Press the Channel submenu key to open the Channel Editor list box and set a channel.
7. Press the Span submenu key to open the Span menu and to set a span value.
8. Press the Amplitude main menu key to open the RF Amplitude menu. Here you may set the scale or the power offset.
9. Press the Measurements main menu key to open the Measurements menu.
10. From the Measurements menu, choose RF Spectrum, Audio Spectrum, Audio Waveform, or Summary.
NoteIf Demod Type is set to FM or PM, then the Set Carrier Freq to Center function aligns the carrier to center only if the carrier is within the IFBW from the center frequency.
NoteMeasurement values for SINAD, THD, and Distortion/Total apply only to single tone modulation. For better accuracy of these measurements, the modulation rate should be at least 0.7 % of IFBW.
AM/FM/PM Analyzer (Option 509) 8-2 General Measurement Setup
Spectrum Analyzer MG PN: 10580-00231 Rev. F 8-3
11. If the RF Spectrum graph displays “ADC error”, then press the Amplitude main menu key and then press Adjust Range. Pressing the Adjust Range submenu key sets the Y-axis reference level based upon the signal strength. If the signal is too large (ADC error) or too low, then pressing this key sets the reference level such that the signal is displayed fully within the sweep window. The peak may be close to second grid from the reference.
12. To listen to the audio component of an AM or FM signal, press the Audio Demod submenu key. Audio demodulation is not available for PM signals.
13. In the Audio Demod menu, press the On / Off submenu key turn On or Off the audio demodulation function. A Demod Type submenu key is available, as well as a Volume submenu key.
14. To save or recall setups or measurements, press the Shift key and the File (7) key. Setup files are saved with a .stp extension, and measurement files are saved with a .afp extension.
15. Setups may also be saved or recalled by pressing the Shift key and the Preset (1) key. Refer to your instrument User Guide for details.
8-3 Example FM Demodulation Measurement AM/FM/PM Analyzer (Option 509)
8-4 PN: 10580-00231 Rev. F Spectrum Analyzer MG
8-3 Example FM Demodulation Measurement 1. Press the Setup main menu key and then press the Demod Type submenu key to toggle
the setting to FM. The active setting is underlined on the submenu key face.
2. Press the Auto IFBW submenu key to set the IFBW frequency automatically. The active setting is underlined on the submenu key face.
3. Press the IFBW submenu key to set the value manually. Doing so will automatically turn Off the Auto_IFBW function. The available values for IFBW are: 1 kHz, 3 kHz, 10 kHz, 30 kHz, 100 kHz, and 300 kHz.
4. Press the Freq main menu key to set the center frequency, the span, the signal standard, or the channel.
From the RF Freq menu, you can press the Set Carrier To Center submenu key. This adjusts the signal position within the sweep window.
5. Press the Amplitude main menu key to set the scale or the power offset. From the RF Amplitude menu, you can also press the Adjust Range submenu key.
6. Press the Measurements main menu key to choose the desired type of measurement.
7. From the Measurements menu, you can press the RF Spectrum submenu key to view the signal spectrum. Press the submenu again to set specific signal measurement functions.
a. Press the Occ BW Method submenu key to select the preferred method of presenting the occupied bandwidth, either by percent of the total received signal power or by an amount better than the dBc that is set with the dBc submenu key.
b. Use the other two submenu keys as needed for signal presentation.
8. Press the Audio Spectrum submenu key to view the audio spectrum. Press the submenu again to set the signal span or sweep scale.
9. From the Measurements menu, you can press the Audio Waveform submenu key to view the audio waveform. Press the submenu again to set the sweep time or sweep scale.
In this view, you can see the PL tone (or CTCSS tone) at the leading edge of the signal.
10. From the Measurements menu, you can press the Audio Demod submenu key to listen to the audio component of the FM signal. In this menu, you can choose wideband or narrowband demodulation, you can set the demodulation time, and you can also set the instrument speaker volume.
11. Press the Summary submenu key to view all of the signal characteristics in a table format.
NoteMeasurement values for SINAD, THD, and Distortion/Total apply only to single tone modulation. For better accuracy of these measurements, the modulation rate should be at least 0.7 % of IFBW.
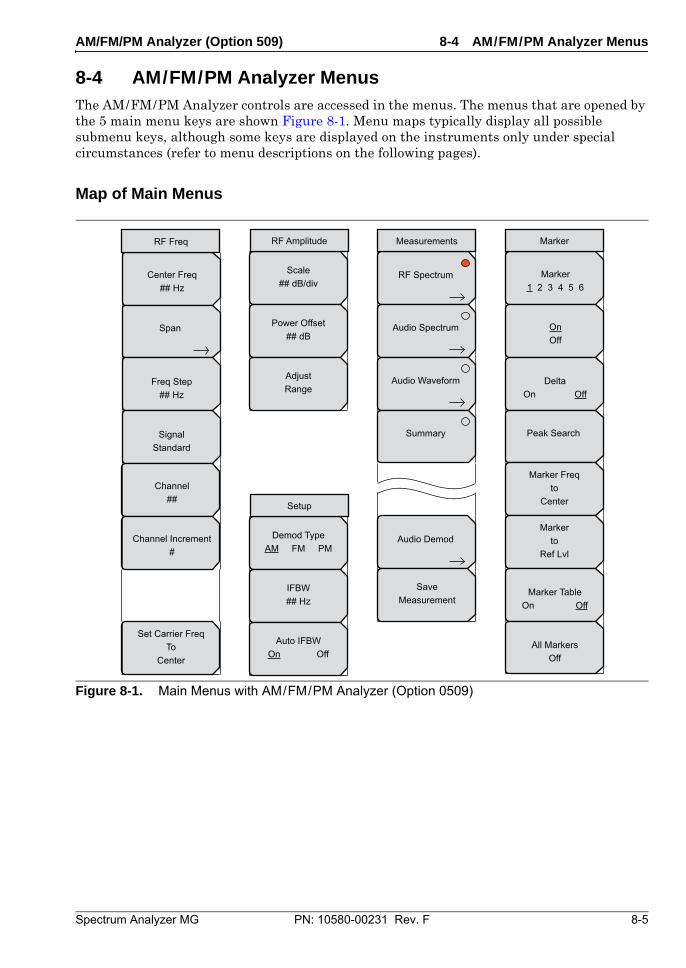
AM/FM/PM Analyzer (Option 509) 8-4 AM/FM/PM Analyzer Menus
Spectrum Analyzer MG PN: 10580-00231 Rev. F 8-5
8-4 AM/FM/PM Analyzer Menus The AM/FM/PM Analyzer controls are accessed in the menus. The menus that are opened by the 5 main menu keys are shown Figure 8-1. Menu maps typically display all possible submenu keys, although some keys are displayed on the instruments only under special circumstances (refer to menu descriptions on the following pages).
Map of Main Menus
Figure 8-1. Main Menus with AM/FM/PM Analyzer (Option 0509)
Span
SignalStandard
Freq Step## Hz
Channel Increment#
Channel##
Center Freq## Hz
Set Carrier FreqTo
Center
RF Freq
IFBW## Hz
Demod TypeAM FM PM
Auto IFBWOn Off
Setup
Audio Spectrum
Summary
Audio Waveform
Audio Demod
RF Spectrum
SaveMeasurement
Measurements
Power Offset## dB
Scale## dB/div
AdjustRange
RF Amplitude
Peak Search
DeltaOn Off
OnOff
All MarkersOff
Marker TableOn Off
Marker1 2 3 4 5 6
Marker Freqto
Center
Markerto
Ref Lvl
Marker
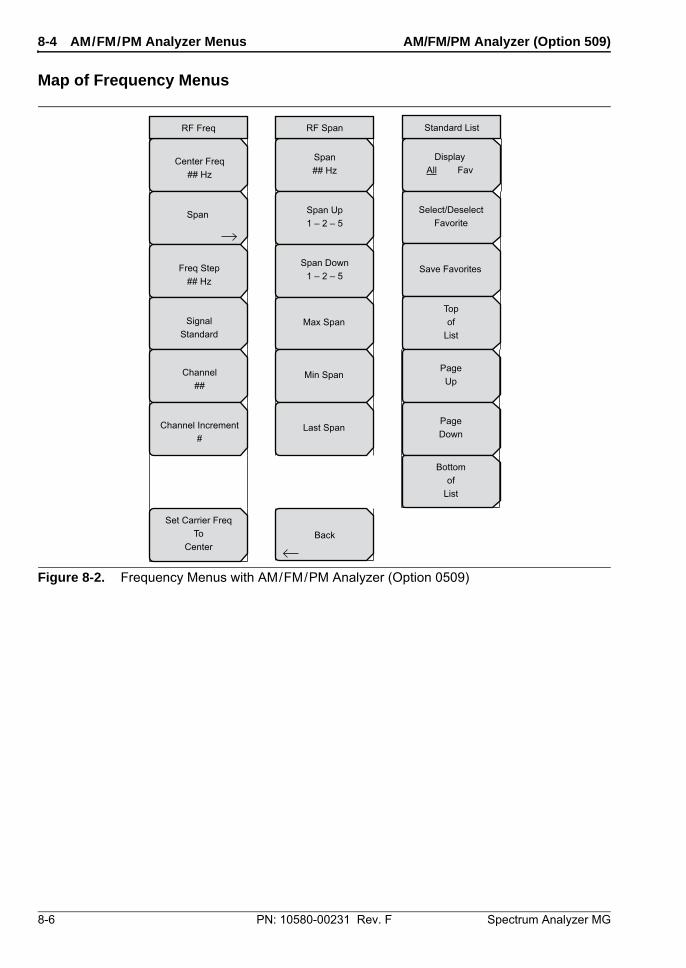
8-4 AM/FM/PM Analyzer Menus AM/FM/PM Analyzer (Option 509)
8-6 PN: 10580-00231 Rev. F Spectrum Analyzer MG
Map of Frequency Menus
Figure 8-2. Frequency Menus with AM/FM/PM Analyzer (Option 0509)
Span
SignalStandard
Freq Step## Hz
Channel Increment#
Channel##
Center Freq## Hz
Set Carrier FreqTo
Center
RF Freq
Back
Max Span
Min Span
Last Span
Span Up1 – 2 – 5
Span## Hz
Span Down1 – 2 – 5
RF Span
Save Favorites
DisplayAll Fav
Select/DeselectFavorite
PageDown
PageUp
Topof
List
Bottomof
List
Standard List
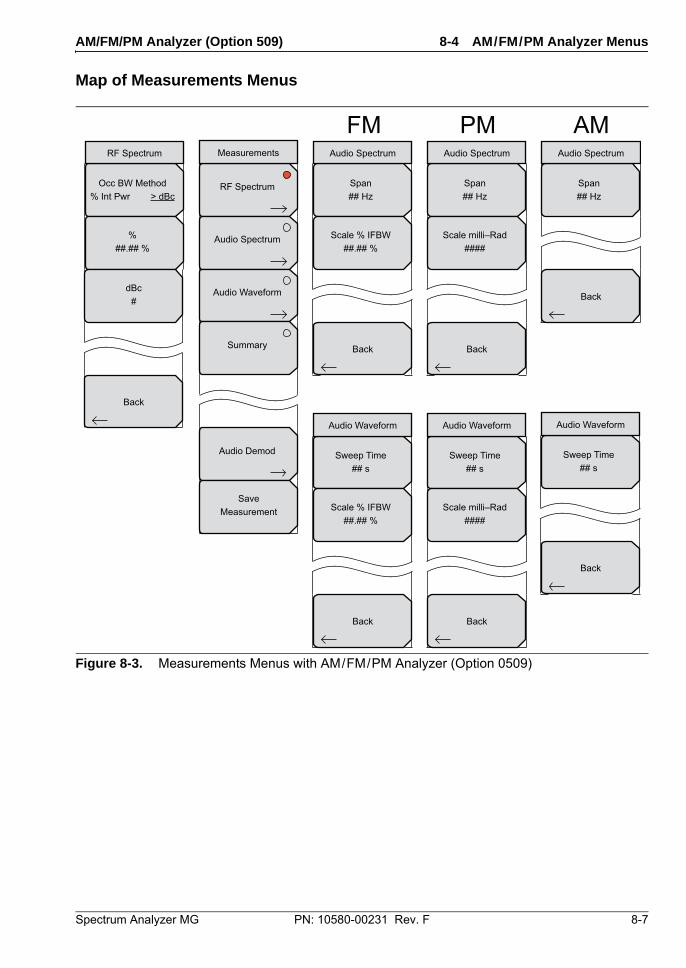
AM/FM/PM Analyzer (Option 509) 8-4 AM/FM/PM Analyzer Menus
Spectrum Analyzer MG PN: 10580-00231 Rev. F 8-7
Map of Measurements Menus
Figure 8-3. Measurements Menus with AM/FM/PM Analyzer (Option 0509)
Audio Spectrum
Summary
Audio Waveform
Audio Demod
RF Spectrum
SaveMeasurement
Measurements
Back
%##.## %
Occ BW Method% Int Pwr > dBc
dBc#
RF Spectrum
Back
Span## Hz
Audio Spectrum
AM
Back
Scale % IFBW##.## %
Span## Hz
Audio Spectrum
FM
Back
Scale milli–Rad####
Span## Hz
Audio Spectrum
PM
Back
Sweep Time## s
Audio Waveform
Back
Scale % IFBW##.## %
Sweep Time## s
Audio Waveform
Back
Scale milli–Rad####
Sweep Time## s
Audio Waveform
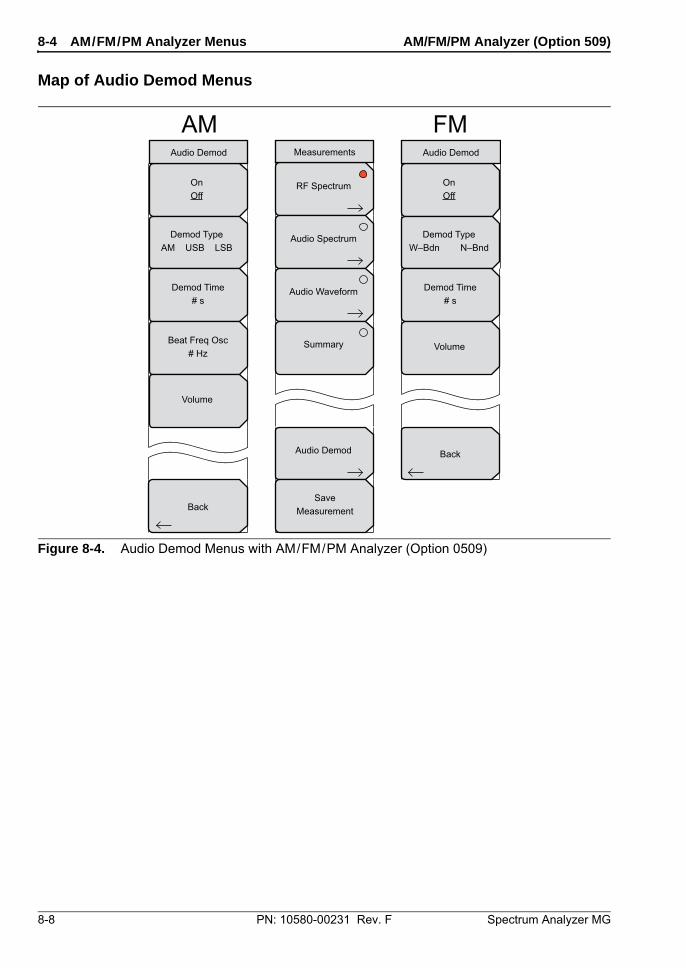
8-4 AM/FM/PM Analyzer Menus AM/FM/PM Analyzer (Option 509)
8-8 PN: 10580-00231 Rev. F Spectrum Analyzer MG
Map of Audio Demod Menus
Figure 8-4. Audio Demod Menus with AM/FM/PM Analyzer (Option 0509)
Audio Spectrum
Summary
Audio Waveform
Audio Demod
RF Spectrum
SaveMeasurement
Measurements
Back
Volume
Demod TypeAM USB LSB
OnOff
Beat Freq Osc# Hz
Demod Time# s
Audio Demod
AM
Back
Volume
Demod TypeW–Bdn N–Bnd
OnOff
Demod Time# s
Audio Demod
FM
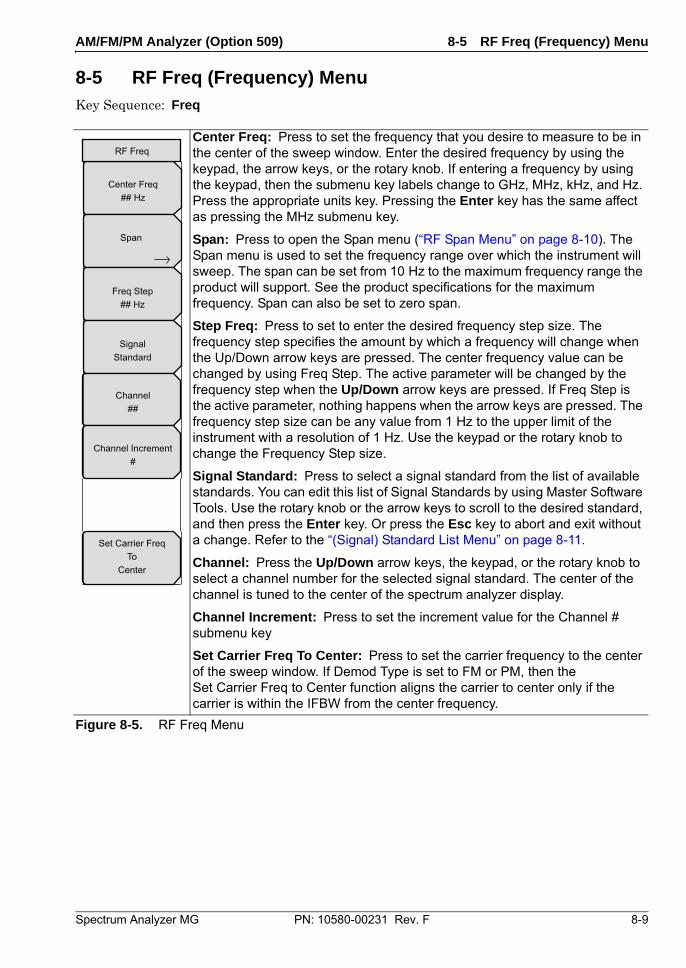
AM/FM/PM Analyzer (Option 509) 8-5 RF Freq (Frequency) Menu
Spectrum Analyzer MG PN: 10580-00231 Rev. F 8-9
8-5 RF Freq (Frequency) Menu Key Sequence: Freq
Center Freq: Press to set the frequency that you desire to measure to be in the center of the sweep window. Enter the desired frequency by using the keypad, the arrow keys, or the rotary knob. If entering a frequency by using the keypad, then the submenu key labels change to GHz, MHz, kHz, and Hz. Press the appropriate units key. Pressing the Enter key has the same affect as pressing the MHz submenu key.
Span: Press to open the Span menu (“RF Span Menu” on page 8-10). The Span menu is used to set the frequency range over which the instrument will sweep. The span can be set from 10 Hz to the maximum frequency range the product will support. See the product specifications for the maximum frequency. Span can also be set to zero span.
Step Freq: Press to set to enter the desired frequency step size. The frequency step specifies the amount by which a frequency will change when the Up/Down arrow keys are pressed. The center frequency value can be changed by using Freq Step. The active parameter will be changed by the frequency step when the Up/Down arrow keys are pressed. If Freq Step is the active parameter, nothing happens when the arrow keys are pressed. The frequency step size can be any value from 1 Hz to the upper limit of the instrument with a resolution of 1 Hz. Use the keypad or the rotary knob to change the Frequency Step size.
Signal Standard: Press to select a signal standard from the list of available standards. You can edit this list of Signal Standards by using Master Software Tools. Use the rotary knob or the arrow keys to scroll to the desired standard, and then press the Enter key. Or press the Esc key to abort and exit without a change. Refer to the “(Signal) Standard List Menu” on page 8-11.
Channel: Press the Up/Down arrow keys, the keypad, or the rotary knob to select a channel number for the selected signal standard. The center of the channel is tuned to the center of the spectrum analyzer display.
Channel Increment: Press to set the increment value for the Channel # submenu key
Set Carrier Freq To Center: Press to set the carrier frequency to the center of the sweep window. If Demod Type is set to FM or PM, then the Set Carrier Freq to Center function aligns the carrier to center only if the carrier is within the IFBW from the center frequency.
Figure 8-5. RF Freq Menu
Span
SignalStandard
Freq Step## Hz
Channel Increment#
Channel##
Center Freq## Hz
Set Carrier FreqTo
Center
RF Freq
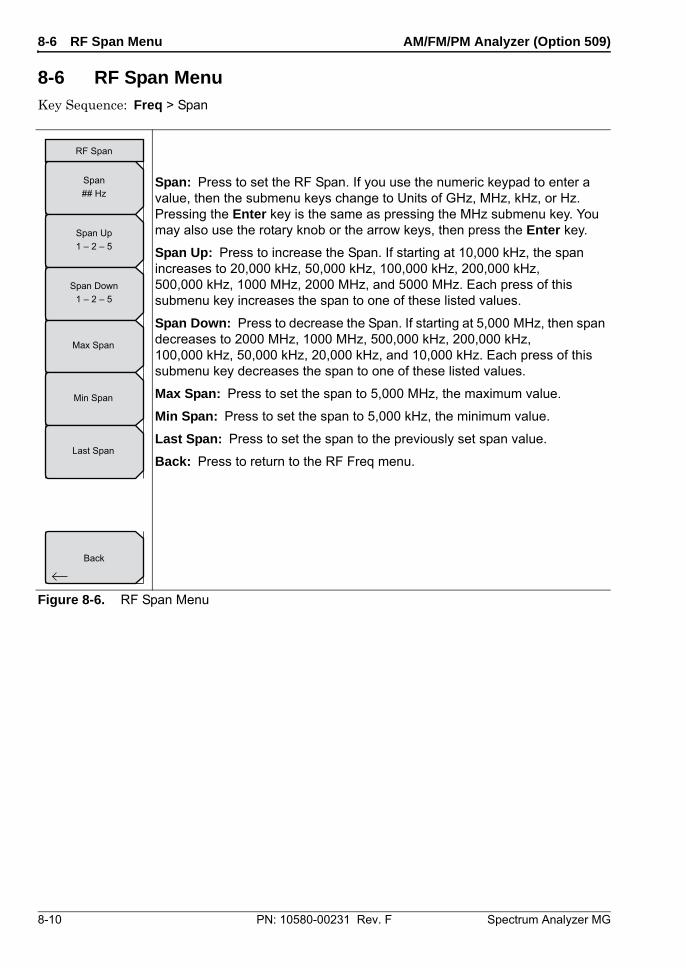
8-6 RF Span Menu AM/FM/PM Analyzer (Option 509)
8-10 PN: 10580-00231 Rev. F Spectrum Analyzer MG
8-6 RF Span Menu Key Sequence: Freq > Span
Span: Press to set the RF Span. If you use the numeric keypad to enter a value, then the submenu keys change to Units of GHz, MHz, kHz, or Hz. Pressing the Enter key is the same as pressing the MHz submenu key. You may also use the rotary knob or the arrow keys, then press the Enter key.
Span Up: Press to increase the Span. If starting at 10,000 kHz, the span increases to 20,000 kHz, 50,000 kHz, 100,000 kHz, 200,000 kHz, 500,000 kHz, 1000 MHz, 2000 MHz, and 5000 MHz. Each press of this submenu key increases the span to one of these listed values.
Span Down: Press to decrease the Span. If starting at 5,000 MHz, then span decreases to 2000 MHz, 1000 MHz, 500,000 kHz, 200,000 kHz, 100,000 kHz, 50,000 kHz, 20,000 kHz, and 10,000 kHz. Each press of this submenu key decreases the span to one of these listed values.
Max Span: Press to set the span to 5,000 MHz, the maximum value.
Min Span: Press to set the span to 5,000 kHz, the minimum value.
Last Span: Press to set the span to the previously set span value.
Back: Press to return to the RF Freq menu.
Figure 8-6. RF Span Menu
Back
Max Span
Min Span
Last Span
Span Up1 – 2 – 5
Span## Hz
Span Down1 – 2 – 5
RF Span
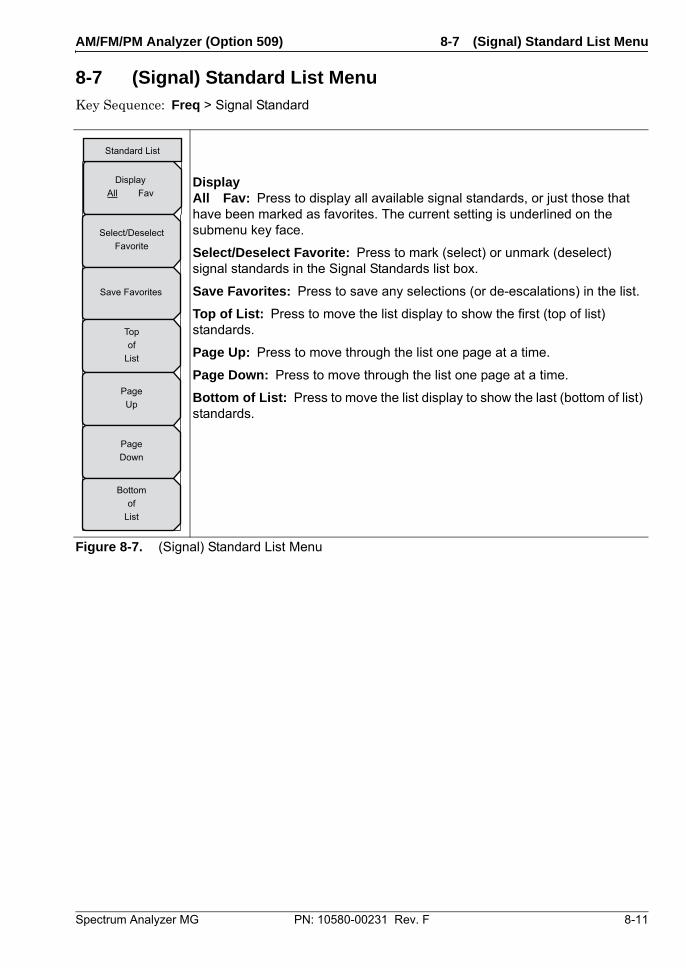
AM/FM/PM Analyzer (Option 509) 8-7 (Signal) Standard List Menu
Spectrum Analyzer MG PN: 10580-00231 Rev. F 8-11
8-7 (Signal) Standard List Menu Key Sequence: Freq > Signal Standard
DisplayAll Fav: Press to display all available signal standards, or just those that have been marked as favorites. The current setting is underlined on the submenu key face.
Select/Deselect Favorite: Press to mark (select) or unmark (deselect) signal standards in the Signal Standards list box.
Save Favorites: Press to save any selections (or de-escalations) in the list.
Top of List: Press to move the list display to show the first (top of list) standards.
Page Up: Press to move through the list one page at a time.
Page Down: Press to move through the list one page at a time.
Bottom of List: Press to move the list display to show the last (bottom of list) standards.
Figure 8-7. (Signal) Standard List Menu
Save Favorites
DisplayAll Fav
Select/DeselectFavorite
PageDown
PageUp
Topof
List
Bottomof
List
Standard List
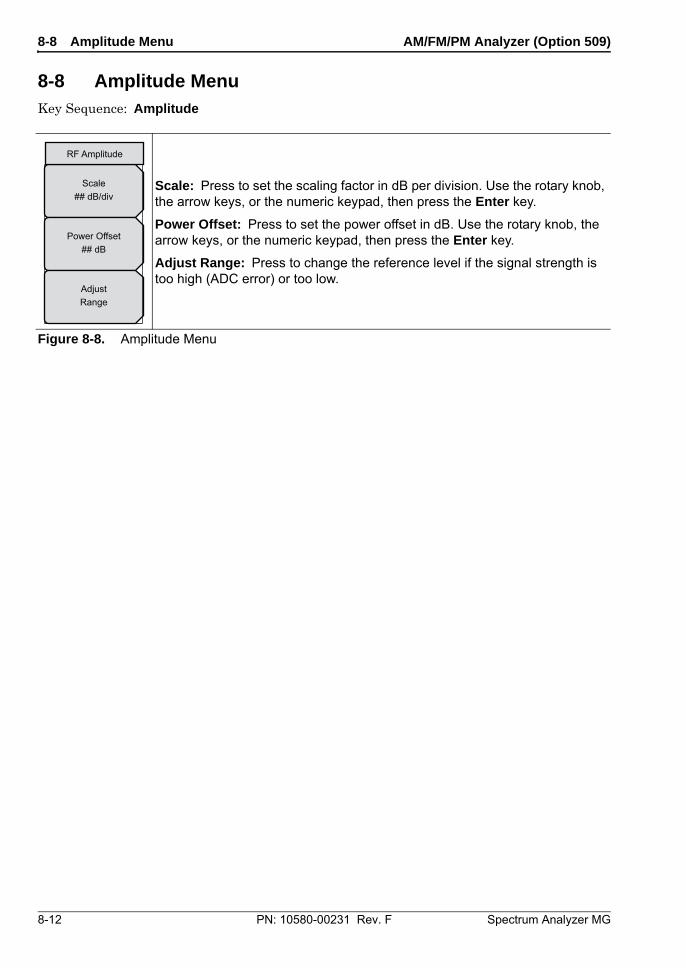
8-8 Amplitude Menu AM/FM/PM Analyzer (Option 509)
8-12 PN: 10580-00231 Rev. F Spectrum Analyzer MG
8-8 Amplitude Menu Key Sequence: Amplitude
Scale: Press to set the scaling factor in dB per division. Use the rotary knob, the arrow keys, or the numeric keypad, then press the Enter key.
Power Offset: Press to set the power offset in dB. Use the rotary knob, the arrow keys, or the numeric keypad, then press the Enter key.
Adjust Range: Press to change the reference level if the signal strength is too high (ADC error) or too low.
Figure 8-8. Amplitude Menu
Power Offset## dB
Scale## dB/div
AdjustRange
RF Amplitude
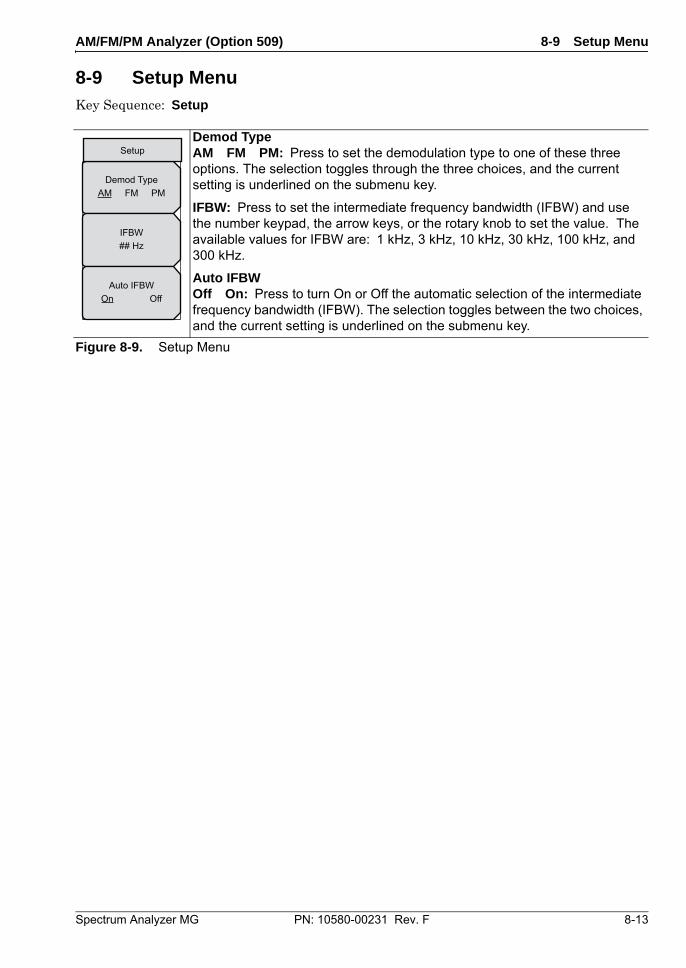
AM/FM/PM Analyzer (Option 509) 8-9 Setup Menu
Spectrum Analyzer MG PN: 10580-00231 Rev. F 8-13
8-9 Setup Menu Key Sequence: Setup
Demod TypeAM FM PM: Press to set the demodulation type to one of these three options. The selection toggles through the three choices, and the current setting is underlined on the submenu key.
IFBW: Press to set the intermediate frequency bandwidth (IFBW) and use the number keypad, the arrow keys, or the rotary knob to set the value. The available values for IFBW are: 1 kHz, 3 kHz, 10 kHz, 30 kHz, 100 kHz, and 300 kHz.
Auto IFBWOff On: Press to turn On or Off the automatic selection of the intermediate frequency bandwidth (IFBW). The selection toggles between the two choices, and the current setting is underlined on the submenu key.
Figure 8-9. Setup Menu
IFBW## Hz
Demod TypeAM FM PM
Auto IFBWOn Off
Setup
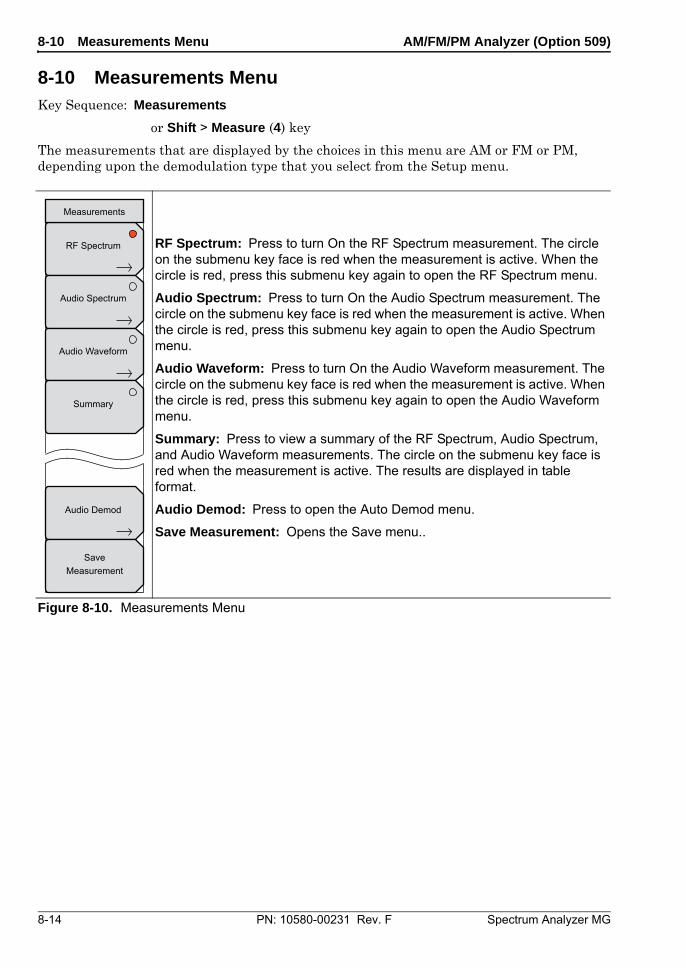
8-10 Measurements Menu AM/FM/PM Analyzer (Option 509)
8-14 PN: 10580-00231 Rev. F Spectrum Analyzer MG
8-10 Measurements Menu Key Sequence: Measurements
or Shift > Measure (4) key
The measurements that are displayed by the choices in this menu are AM or FM or PM, depending upon the demodulation type that you select from the Setup menu.
RF Spectrum: Press to turn On the RF Spectrum measurement. The circle on the submenu key face is red when the measurement is active. When the circle is red, press this submenu key again to open the RF Spectrum menu.
Audio Spectrum: Press to turn On the Audio Spectrum measurement. The circle on the submenu key face is red when the measurement is active. When the circle is red, press this submenu key again to open the Audio Spectrum menu.
Audio Waveform: Press to turn On the Audio Waveform measurement. The circle on the submenu key face is red when the measurement is active. When the circle is red, press this submenu key again to open the Audio Waveform menu.
Summary: Press to view a summary of the RF Spectrum, Audio Spectrum, and Audio Waveform measurements. The circle on the submenu key face is red when the measurement is active. The results are displayed in table format.
Audio Demod: Press to open the Auto Demod menu.
Save Measurement: Opens the Save menu..
Figure 8-10. Measurements Menu
Audio Spectrum
Summary
Audio Waveform
Audio Demod
RF Spectrum
SaveMeasurement
Measurements
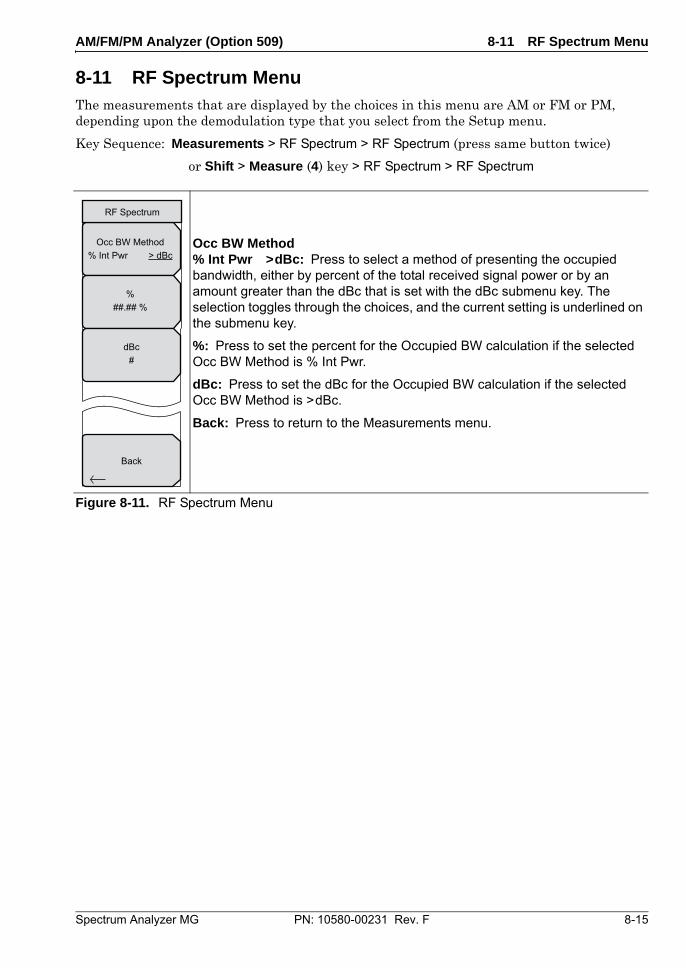
AM/FM/PM Analyzer (Option 509) 8-11 RF Spectrum Menu
Spectrum Analyzer MG PN: 10580-00231 Rev. F 8-15
8-11 RF Spectrum Menu The measurements that are displayed by the choices in this menu are AM or FM or PM, depending upon the demodulation type that you select from the Setup menu.
Key Sequence: Measurements > RF Spectrum > RF Spectrum (press same button twice)
or Shift > Measure (4) key > RF Spectrum > RF Spectrum
Occ BW Method% Int Pwr >dBc: Press to select a method of presenting the occupied bandwidth, either by percent of the total received signal power or by an amount greater than the dBc that is set with the dBc submenu key. The selection toggles through the choices, and the current setting is underlined on the submenu key.
%: Press to set the percent for the Occupied BW calculation if the selected Occ BW Method is % Int Pwr.
dBc: Press to set the dBc for the Occupied BW calculation if the selected Occ BW Method is >dBc.
Back: Press to return to the Measurements menu.
Figure 8-11. RF Spectrum Menu
Back
%##.## %
Occ BW Method% Int Pwr > dBc
dBc#
RF Spectrum
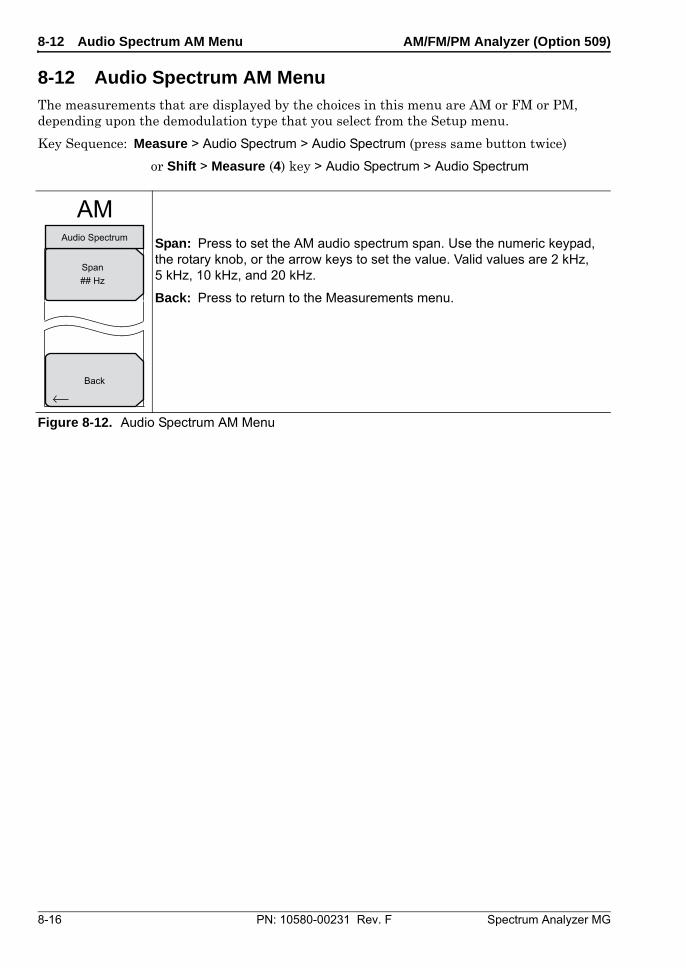
8-12 Audio Spectrum AM Menu AM/FM/PM Analyzer (Option 509)
8-16 PN: 10580-00231 Rev. F Spectrum Analyzer MG
8-12 Audio Spectrum AM Menu The measurements that are displayed by the choices in this menu are AM or FM or PM, depending upon the demodulation type that you select from the Setup menu.
Key Sequence: Measure > Audio Spectrum > Audio Spectrum (press same button twice)
or Shift > Measure (4) key > Audio Spectrum > Audio Spectrum
Span: Press to set the AM audio spectrum span. Use the numeric keypad, the rotary knob, or the arrow keys to set the value. Valid values are 2 kHz, 5 kHz, 10 kHz, and 20 kHz.
Back: Press to return to the Measurements menu.
Figure 8-12. Audio Spectrum AM Menu
Back
Span## Hz
Audio Spectrum
AM
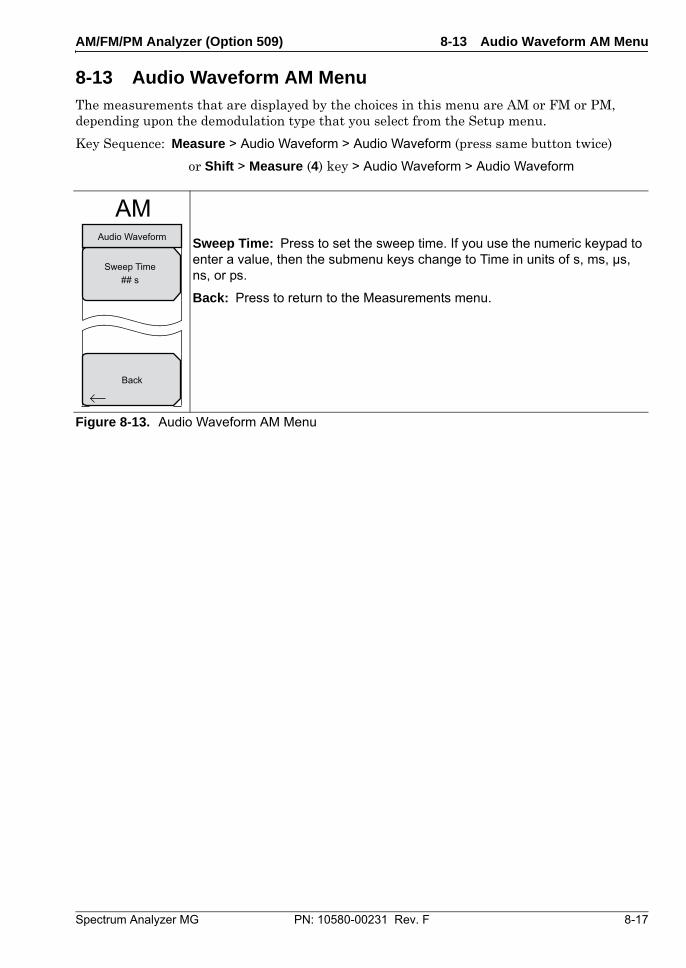
AM/FM/PM Analyzer (Option 509) 8-13 Audio Waveform AM Menu
Spectrum Analyzer MG PN: 10580-00231 Rev. F 8-17
8-13 Audio Waveform AM Menu The measurements that are displayed by the choices in this menu are AM or FM or PM, depending upon the demodulation type that you select from the Setup menu.
Key Sequence: Measure > Audio Waveform > Audio Waveform (press same button twice)
or Shift > Measure (4) key > Audio Waveform > Audio Waveform
Sweep Time: Press to set the sweep time. If you use the numeric keypad to enter a value, then the submenu keys change to Time in units of s, ms, µs, ns, or ps.
Back: Press to return to the Measurements menu.
Figure 8-13. Audio Waveform AM Menu
Back
Sweep Time## s
Audio Waveform
AM
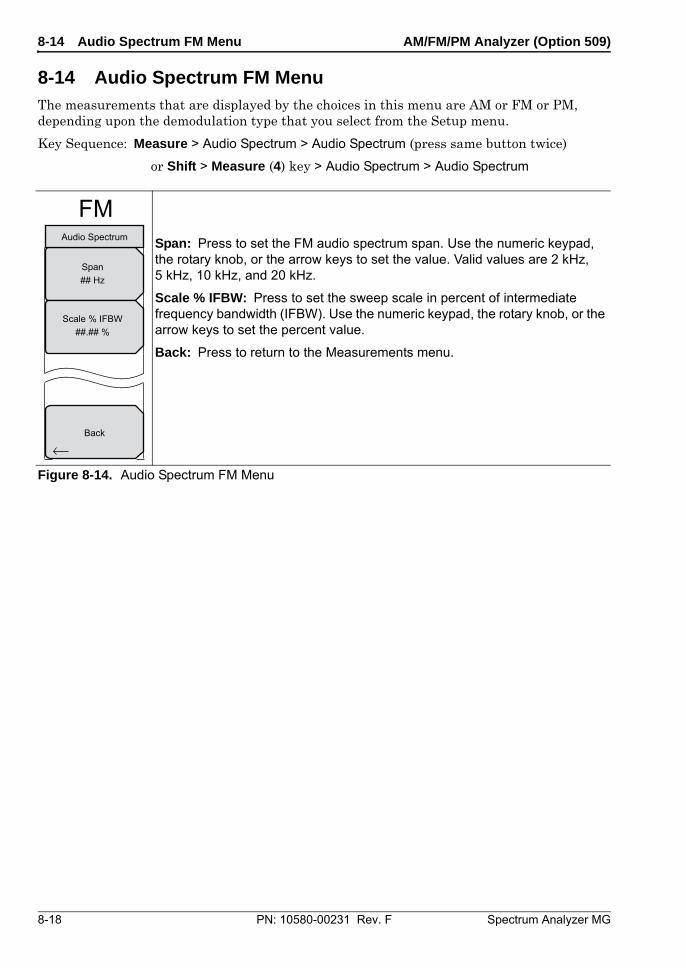
8-14 Audio Spectrum FM Menu AM/FM/PM Analyzer (Option 509)
8-18 PN: 10580-00231 Rev. F Spectrum Analyzer MG
8-14 Audio Spectrum FM Menu The measurements that are displayed by the choices in this menu are AM or FM or PM, depending upon the demodulation type that you select from the Setup menu.
Key Sequence: Measure > Audio Spectrum > Audio Spectrum (press same button twice)
or Shift > Measure (4) key > Audio Spectrum > Audio Spectrum
Span: Press to set the FM audio spectrum span. Use the numeric keypad, the rotary knob, or the arrow keys to set the value. Valid values are 2 kHz, 5 kHz, 10 kHz, and 20 kHz.
Scale % IFBW: Press to set the sweep scale in percent of intermediate frequency bandwidth (IFBW). Use the numeric keypad, the rotary knob, or the arrow keys to set the percent value.
Back: Press to return to the Measurements menu.
Figure 8-14. Audio Spectrum FM Menu
Back
Scale % IFBW##.## %
Span## Hz
Audio Spectrum
FM
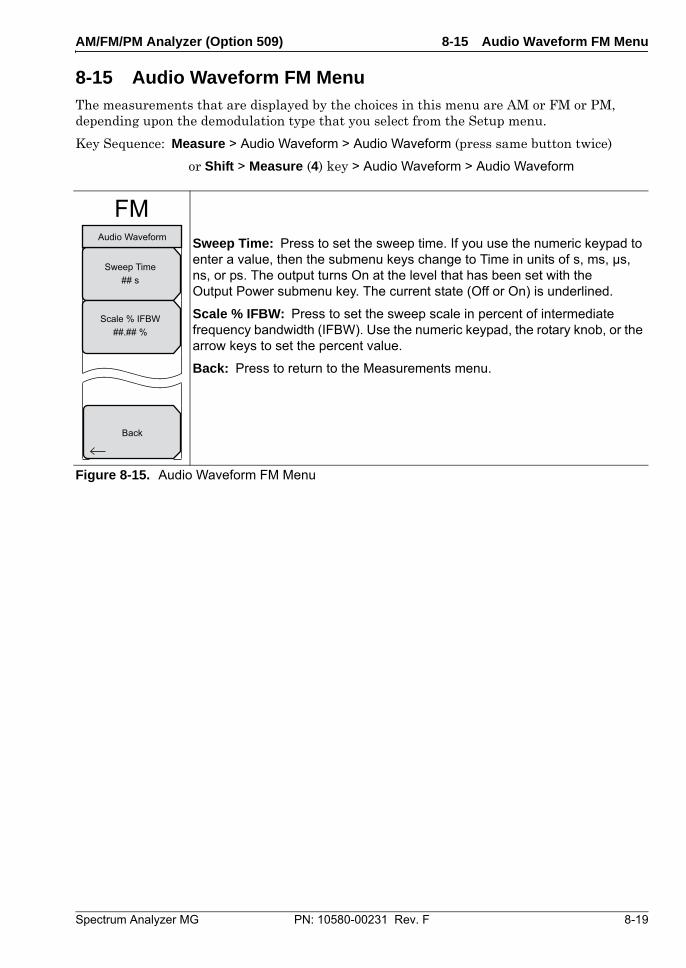
AM/FM/PM Analyzer (Option 509) 8-15 Audio Waveform FM Menu
Spectrum Analyzer MG PN: 10580-00231 Rev. F 8-19
8-15 Audio Waveform FM Menu The measurements that are displayed by the choices in this menu are AM or FM or PM, depending upon the demodulation type that you select from the Setup menu.
Key Sequence: Measure > Audio Waveform > Audio Waveform (press same button twice)
or Shift > Measure (4) key > Audio Waveform > Audio Waveform
Sweep Time: Press to set the sweep time. If you use the numeric keypad to enter a value, then the submenu keys change to Time in units of s, ms, µs, ns, or ps. The output turns On at the level that has been set with the Output Power submenu key. The current state (Off or On) is underlined.
Scale % IFBW: Press to set the sweep scale in percent of intermediate frequency bandwidth (IFBW). Use the numeric keypad, the rotary knob, or the arrow keys to set the percent value.
Back: Press to return to the Measurements menu.
Figure 8-15. Audio Waveform FM Menu
Back
Scale % IFBW##.## %
Sweep Time## s
Audio Waveform
FM
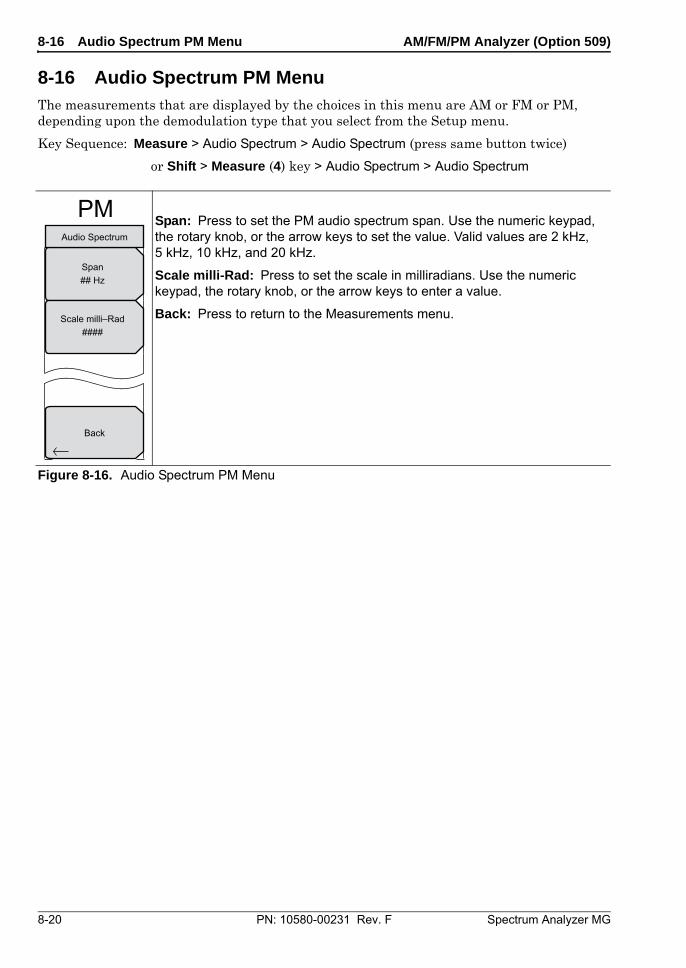
8-16 Audio Spectrum PM Menu AM/FM/PM Analyzer (Option 509)
8-20 PN: 10580-00231 Rev. F Spectrum Analyzer MG
8-16 Audio Spectrum PM Menu The measurements that are displayed by the choices in this menu are AM or FM or PM, depending upon the demodulation type that you select from the Setup menu.
Key Sequence: Measure > Audio Spectrum > Audio Spectrum (press same button twice)
or Shift > Measure (4) key > Audio Spectrum > Audio Spectrum
Span: Press to set the PM audio spectrum span. Use the numeric keypad, the rotary knob, or the arrow keys to set the value. Valid values are 2 kHz, 5 kHz, 10 kHz, and 20 kHz.
Scale milli-Rad: Press to set the scale in milliradians. Use the numeric keypad, the rotary knob, or the arrow keys to enter a value.
Back: Press to return to the Measurements menu.
Figure 8-16. Audio Spectrum PM Menu
Back
Scale milli–Rad####
Span## Hz
Audio Spectrum
PM
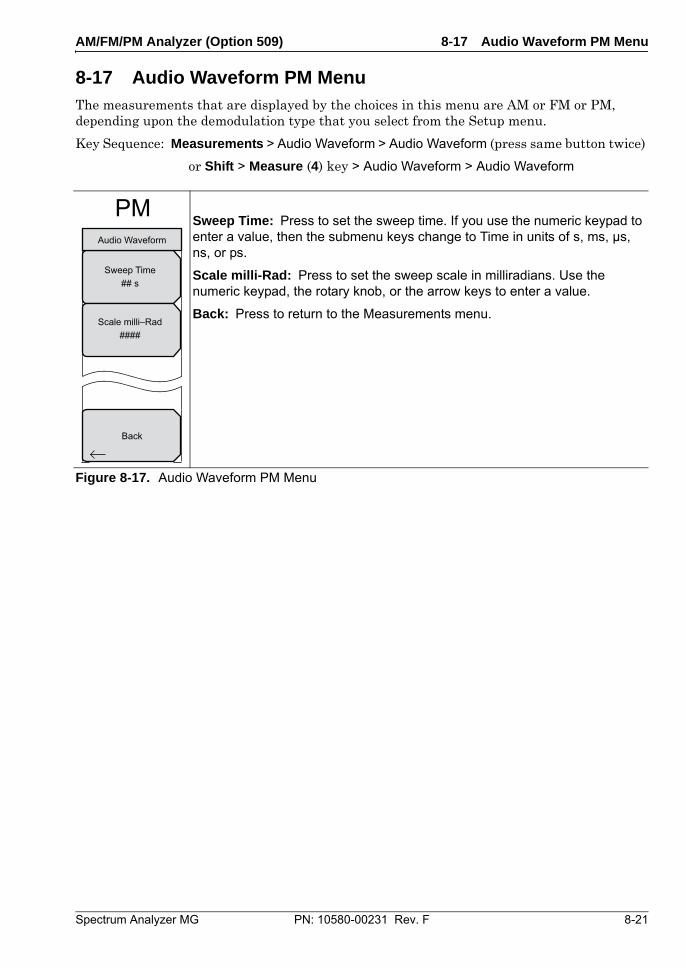
AM/FM/PM Analyzer (Option 509) 8-17 Audio Waveform PM Menu
Spectrum Analyzer MG PN: 10580-00231 Rev. F 8-21
8-17 Audio Waveform PM Menu The measurements that are displayed by the choices in this menu are AM or FM or PM, depending upon the demodulation type that you select from the Setup menu.
Key Sequence: Measurements > Audio Waveform > Audio Waveform (press same button twice)
or Shift > Measure (4) key > Audio Waveform > Audio Waveform
Sweep Time: Press to set the sweep time. If you use the numeric keypad to enter a value, then the submenu keys change to Time in units of s, ms, µs, ns, or ps.
Scale milli-Rad: Press to set the sweep scale in milliradians. Use the numeric keypad, the rotary knob, or the arrow keys to enter a value.
Back: Press to return to the Measurements menu.
Figure 8-17. Audio Waveform PM Menu
Back
Scale milli–Rad####
Sweep Time## s
Audio Waveform
PM
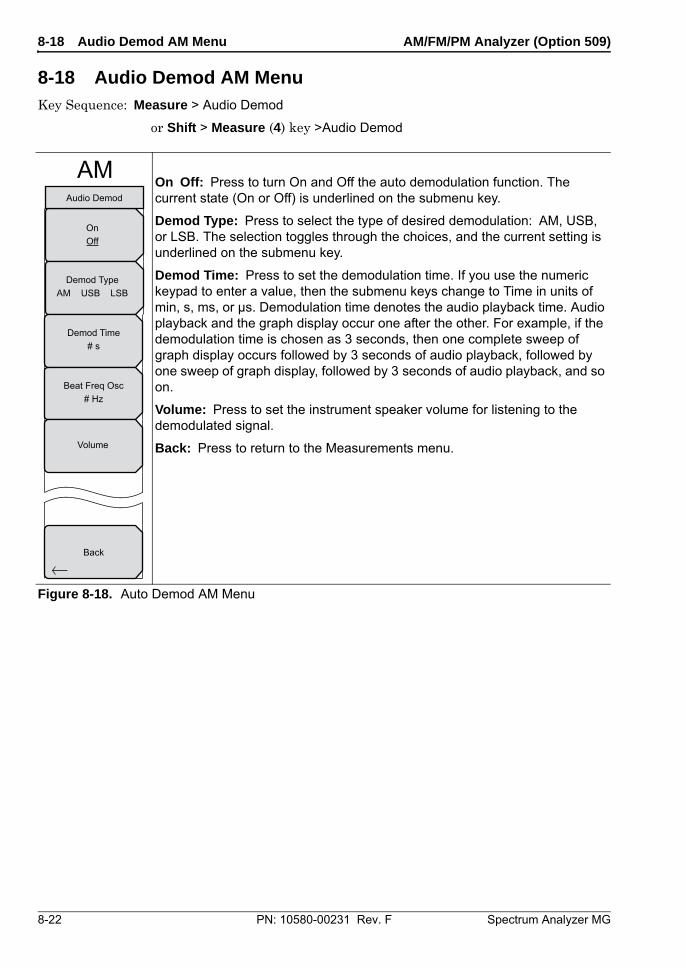
8-18 Audio Demod AM Menu AM/FM/PM Analyzer (Option 509)
8-22 PN: 10580-00231 Rev. F Spectrum Analyzer MG
8-18 Audio Demod AM Menu Key Sequence: Measure > Audio Demod
or Shift > Measure (4) key >Audio Demod
On Off: Press to turn On and Off the auto demodulation function. The current state (On or Off) is underlined on the submenu key.
Demod Type: Press to select the type of desired demodulation: AM, USB, or LSB. The selection toggles through the choices, and the current setting is underlined on the submenu key.
Demod Time: Press to set the demodulation time. If you use the numeric keypad to enter a value, then the submenu keys change to Time in units of min, s, ms, or µs. Demodulation time denotes the audio playback time. Audio playback and the graph display occur one after the other. For example, if the demodulation time is chosen as 3 seconds, then one complete sweep of graph display occurs followed by 3 seconds of audio playback, followed by one sweep of graph display, followed by 3 seconds of audio playback, and so on.
Volume: Press to set the instrument speaker volume for listening to the demodulated signal.
Back: Press to return to the Measurements menu.
Figure 8-18. Auto Demod AM Menu
Back
Volume
Demod TypeAM USB LSB
OnOff
Beat Freq Osc# Hz
Demod Time# s
Audio Demod
AM
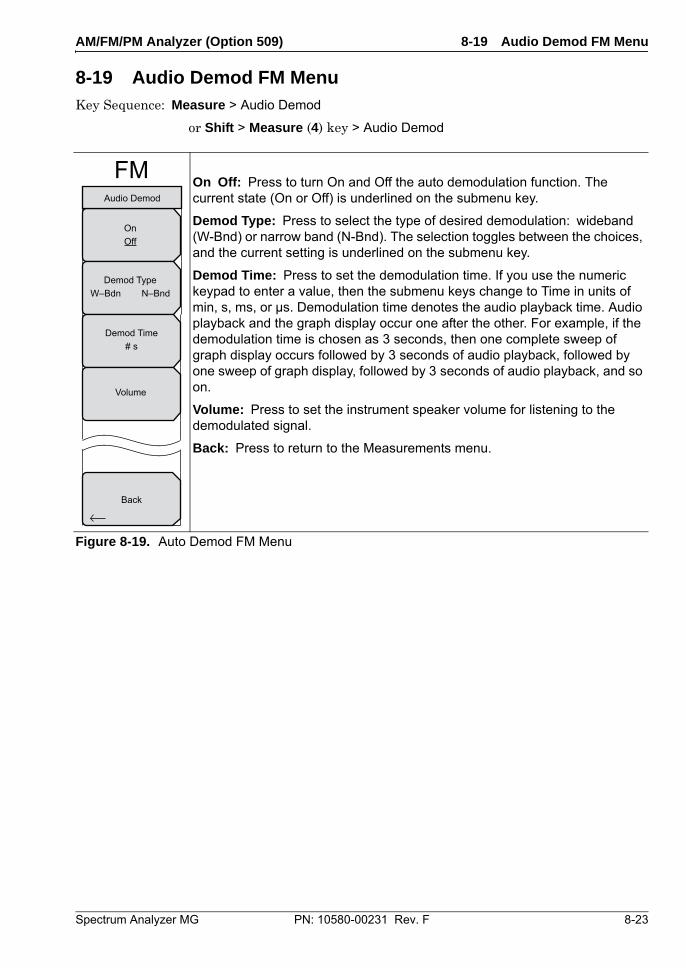
AM/FM/PM Analyzer (Option 509) 8-19 Audio Demod FM Menu
Spectrum Analyzer MG PN: 10580-00231 Rev. F 8-23
8-19 Audio Demod FM Menu Key Sequence: Measure > Audio Demod
or Shift > Measure (4) key > Audio Demod
On Off: Press to turn On and Off the auto demodulation function. The current state (On or Off) is underlined on the submenu key.
Demod Type: Press to select the type of desired demodulation: wideband (W-Bnd) or narrow band (N-Bnd). The selection toggles between the choices, and the current setting is underlined on the submenu key.
Demod Time: Press to set the demodulation time. If you use the numeric keypad to enter a value, then the submenu keys change to Time in units of min, s, ms, or µs. Demodulation time denotes the audio playback time. Audio playback and the graph display occur one after the other. For example, if the demodulation time is chosen as 3 seconds, then one complete sweep of graph display occurs followed by 3 seconds of audio playback, followed by one sweep of graph display, followed by 3 seconds of audio playback, and so on.
Volume: Press to set the instrument speaker volume for listening to the demodulated signal.
Back: Press to return to the Measurements menu.
Figure 8-19. Auto Demod FM Menu
Back
Volume
Demod TypeW–Bdn N–Bnd
OnOff
Demod Time# s
Audio Demod
FM
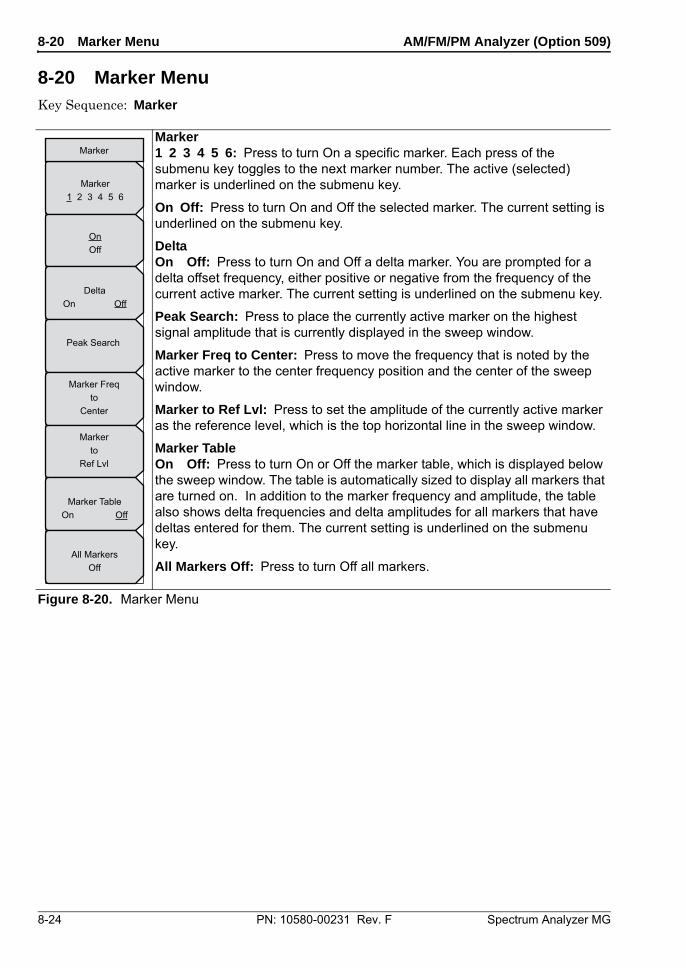
8-20 Marker Menu AM/FM/PM Analyzer (Option 509)
8-24 PN: 10580-00231 Rev. F Spectrum Analyzer MG
8-20 Marker Menu Key Sequence: Marker
Marker1 2 3 4 5 6: Press to turn On a specific marker. Each press of the submenu key toggles to the next marker number. The active (selected) marker is underlined on the submenu key.
On Off: Press to turn On and Off the selected marker. The current setting is underlined on the submenu key.
DeltaOn Off: Press to turn On and Off a delta marker. You are prompted for a delta offset frequency, either positive or negative from the frequency of the current active marker. The current setting is underlined on the submenu key.
Peak Search: Press to place the currently active marker on the highest signal amplitude that is currently displayed in the sweep window.
Marker Freq to Center: Press to move the frequency that is noted by the active marker to the center frequency position and the center of the sweep window.
Marker to Ref Lvl: Press to set the amplitude of the currently active marker as the reference level, which is the top horizontal line in the sweep window.
Marker TableOn Off: Press to turn On or Off the marker table, which is displayed below the sweep window. The table is automatically sized to display all markers that are turned on. In addition to the marker frequency and amplitude, the table also shows delta frequencies and delta amplitudes for all markers that have deltas entered for them. The current setting is underlined on the submenu key.
All Markers Off: Press to turn Off all markers.
Figure 8-20. Marker Menu
Peak Search
DeltaOn Off
OnOff
All MarkersOff
Marker TableOn Off
Marker1 2 3 4 5 6
Marker Freqto
Center
Markerto
Ref Lvl
Marker
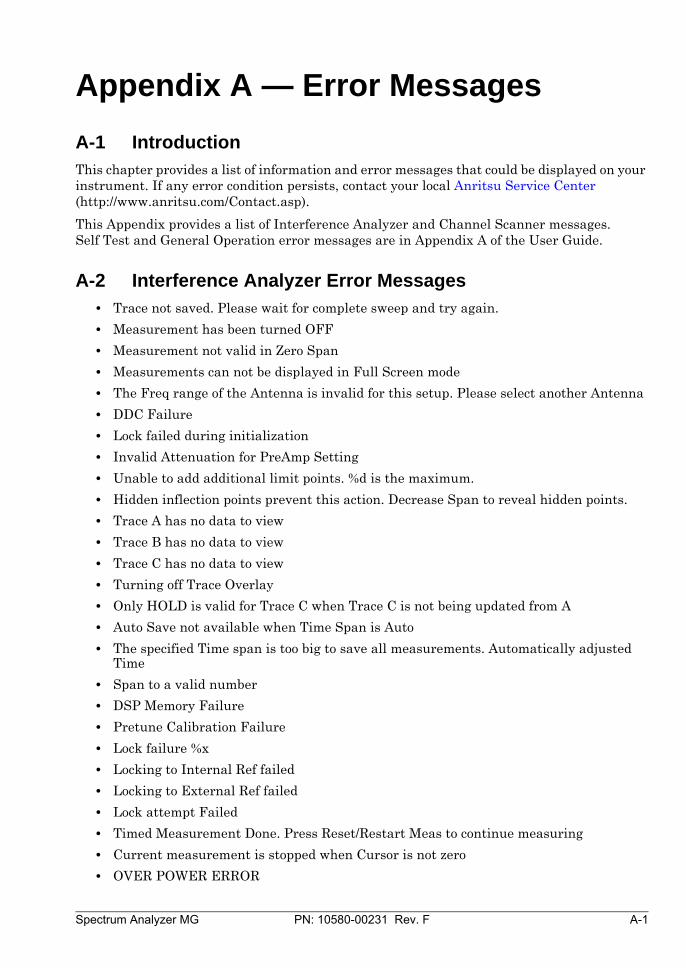
Spectrum Analyzer MG PN: 10580-00231 Rev. F A-1
Appendix A — Error Messages
A-1 Introduction This chapter provides a list of information and error messages that could be displayed on your instrument. If any error condition persists, contact your local Anritsu Service Center (http://www.anritsu.com/Contact.asp).
This Appendix provides a list of Interference Analyzer and Channel Scanner messages. Self Test and General Operation error messages are in Appendix A of the User Guide.
A-2 Interference Analyzer Error Messages• Trace not saved. Please wait for complete sweep and try again.
• Measurement has been turned OFF
• Measurement not valid in Zero Span
• Measurements can not be displayed in Full Screen mode
• The Freq range of the Antenna is invalid for this setup. Please select another Antenna
• DDC Failure
• Lock failed during initialization
• Invalid Attenuation for PreAmp Setting
• Unable to add additional limit points. %d is the maximum.
• Hidden inflection points prevent this action. Decrease Span to reveal hidden points.
• Trace A has no data to view
• Trace B has no data to view
• Trace C has no data to view
• Turning off Trace Overlay
• Only HOLD is valid for Trace C when Trace C is not being updated from A
• Auto Save not available when Time Span is Auto
• The specified Time span is too big to save all measurements. Automatically adjusted Time
• Span to a valid number
• DSP Memory Failure
• Pretune Calibration Failure
• Lock failure %x
• Locking to Internal Ref failed
• Locking to External Ref failed
• Lock attempt Failed
• Timed Measurement Done. Press Reset/Restart Meas to continue measuring
• Current measurement is stopped when Cursor is not zero
• OVER POWER ERROR
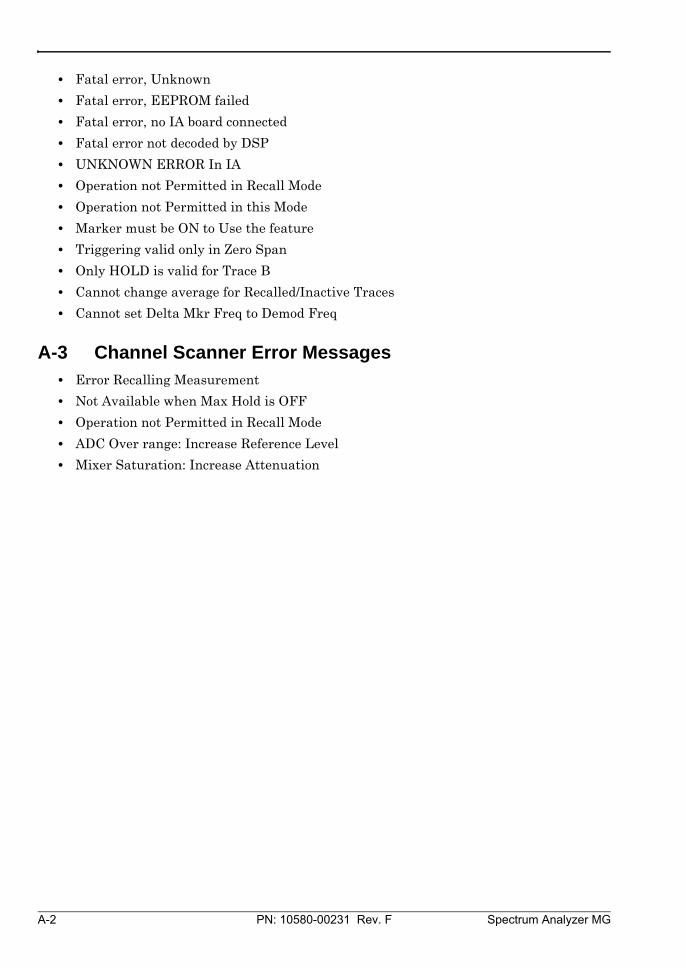
A-2 PN: 10580-00231 Rev. F Spectrum Analyzer MG
• Fatal error, Unknown
• Fatal error, EEPROM failed
• Fatal error, no IA board connected
• Fatal error not decoded by DSP
• UNKNOWN ERROR In IA
• Operation not Permitted in Recall Mode
• Operation not Permitted in this Mode
• Marker must be ON to Use the feature
• Triggering valid only in Zero Span
• Only HOLD is valid for Trace B
• Cannot change average for Recalled/Inactive Traces
• Cannot set Delta Mkr Freq to Demod Freq
A-3 Channel Scanner Error Messages• Error Recalling Measurement
• Not Available when Max Hold is OFF
• Operation not Permitted in Recall Mode
• ADC Over range: Increase Reference Level
• Mixer Saturation: Increase Attenuation
Numerics to D
Spectrum Analyzer MG PN: 10580-00231 Rev. F Index-1
IndexNumerics
802.11 a, b, g interference . . . . . . . . 2-21
AACPR
coverage mapping . . . . . . . . . . . . . . 7-7menu, interference analyzer . . . . 4-34menu, spectrum analyzer . . . . . . 2-50
adjacent channel powerfield measurements . . . . . . . . . . . 2-11measurement . . . . . . . . . . . . . . . . 2-16
AM/FM Demod menuinterference analyzer . . . . . . . . . . 4-35spectrum analyzer . . . . . . . . . . . . 2-51
AM/FM/PM analyzerexample FM demod measurement 8-4general measurement setup . . . . . 8-2main topic . . . . . . . . . . . . . . . . . . . . 8-1menu map . . . . . . . . . . . . . . . . . . . . 8-5
AM/FM/SSB demodulationmeasurement . . . . . . . . . . . . . . . . 2-20
Amplitude menuAM/FM/PM analyzer . . . . . . . . . . 8-12channel scanner . . . . . . . . . . . . . . 5-11interference analyzer . . . . . . . . . . 4-27spectrum analyzer . . . . . . . . . . . . 2-33
analysis mode selection . . . . . . . . . . . . 1-2Anritsu service centers . . . . . . . . . . . . . 1-1Anritsu, contact . . . . . . . . . . . . . . . . . . 1-1antenna calculations . . . . . . . . . . . . . 2-12Application Options
menu spectrum analyzer . . . . . . . 2-66attenuator settings . . . . . . . . . . . . . . . . 2-9Audio Demod
AM (AM/FM/PM) menu . . . . . . . . 8-22FM (AM/FM/PM) menu . . . . . . . . 8-23
Audio SpectrumAM (AM/FM/PM) menu . . . . . . . . 8-16FM (AM/FM/PM) menu . . . . . . . . 8-18PM (AM/FM/PM) menu . . . . . . . . 8-20
Audio WaveformAM (AM/FM/PM) menu . . . . . . . . 8-17FM (AM/FM/PM) menu . . . . . . . . 8-19PM (AM/FM/PM) menu . . . . . . . . 8-21
BBW menu
interference analyzer . . . . . . . . . . 4-29spectrum analyzer . . . . . . . . . . . . 2-39
CC/I menu
interference analyzer . . . . . . . . . . 4-36spectrum analyzer . . . . . . . . . . . . 2-52
calculationsantenna . . . . . . . . . . . . . . . . . . . . . 2-12occupied bandwidth (OBW) . . . . . 2-13root-mean-square . . . . . . . . . . . . . . 2-3
carrier to interference ratio (C/I)field measurements . . . . . . . . . . . 2-11measurement . . . . . . . . . . . . . . . . 2-21
channel power . . . . . . . . . . . . . . . . . . . 2-14measurement . . . . . . . . . . . . . . . . 2-14measurement, GSM . . . . . . . . . . . 2-15
Channel Power menuinterference analyzer . . . . . . . . . . 4-33spectrum analyzer . . . . . . . . . . . . 2-49
Channel Scan menu . . . . . . . . . . . . . . . 5-8channel scanner
custom setup . . . . . . . . . . . . . . . . . . 5-3introduction . . . . . . . . . . . . . . . . . . 5-1menus . . . . . . . . . . . . . . . . . . . . . . . 5-6sample procedure . . . . . . . . . . . . . . 5-2script master . . . . . . . . . . . . . . . . . 5-4
connector care . . . . . . . . . . . . . . . . . . . . 1-2contacting Anritsu . . . . . . . . . . . . . . . . 1-1coverage mapping
ACPR . . . . . . . . . . . . . . . . . . . . . . . 7-7default grid . . . . . . . . . . . . . . . . . . . 7-6GPS required . . . . . . . . . . . . . . . . . 7-1indoor . . . . . . . . . . . . . . . . . . . . . . . 7-3menus . . . . . . . . . . . . . . . . . . . . . . 7-11outdoor . . . . . . . . . . . . . . . . . . . . . . 7-2RSSI . . . . . . . . . . . . . . . . . . . . . . . . 7-7save JPG . . . . . . . . . . . . . . . . . . . . 7-10signal strength . . . . . . . . . . . . . . . . 7-7
Custom Scan menu . . . . . . . . . . . . . . . 5-12CW signal generator . . . . . . . . . . . . . . . 6-1
Ddefault grid, coverage mapping . . . . . . 7-6
E to M
Index-2 PN: 10580-00231 Rev. F Spectrum Analyzer MG
delta markerAM/FM/PM analyzer . . . . . . . . . . 8-24interference analyzer . . . . . . . . . . 4-44spectrum analyzer . . . . . . . . . . . . 2-40
Detection menuinterference analyzer . . . . . . . . . . 4-28spectrum analyzer . . . . . . . . . . . . 2-34
EeasyMap tools . . . . . . . . . . . . . . . .4-11, 7-3emission mask . . . . . . . . . . 2-24, 2-53, 4-37
Ffield strength
antenna calculations . . . . . . . . . . 2-12measurements example . . . . . . . . 2-11menu, interference analyzer . . . . 4-32menu, spectrum analyzer . . . . . . . 2-48
Freq menuAM/FM/PM analyzer . . . . . . . . . . . 8-9interference analyzer . . . . . . . . . . 4-24spectrum analyzer . . . . . . . . . . . . 2-31
Freq Scan menu, channel scanner . . . . 5-9
GGated Sweep menu
interference analyzer . . . . . . . . . . 4-50Gated Sweep Setup menu
spectrum analyzer . . . . . . . . . . . . 2-46GSM channel power . . . . . . . . . . . . . . 2-15
Hhear an interfering signal . . . . . . . . . 2-20http, contacting Anritsu . . . . . . . . . . . . 1-1
IIF signal, zero span . . . . . . . . . . . . . . . . 2-5in-band spurious
measurement . . . . . . . . . . . . . . . . 2-19in-band/out-of-channel
measurement . . . . . . . . . . . . . . . . 2-18indoor coverage mapping . . . . . . . . . . . 7-3interference analyzer
measurement options . . . . . . . . . . . 4-1menus . . . . . . . . . . . . . . . . . . . . . . 4-17RSSI . . . . . . . . . . . . . . . . . . . . . . . . 4-5signal ID . . . . . . . . . . . . . . . . . . . . . 4-6signal strength . . . . . . . . . . . . . . . . 4-4spectrogram . . . . . . . . . . . . . . . . . . 4-2
interference mappingmenu . . . . . . . . . . . . . . . . . . . . . . . 4-42submenu key . . . . . . . . . . . . . . . . . 4-30
interfering signal, AM/FM/SSB demod 2-20
KKML points
saving . . . . . . . . . . . . . . . . . . . . . . . 7-8
LLimit Advanced menu
interference analyzer . . . . . . . . . . 4-63spectrum analyzer . . . . . . . . . . . . 2-65
Limit Edit menuinterference analyzer . . . . . . . . . . 4-58spectrum analyzer . . . . . . . . . . . . 2-60
Limit Envelope menuinterference analyzer . . . . . . . . . . 4-61spectrum analyzer . . . . . . . . . . . . 2-63
Limit menuinterference analyzer . . . . . . . . . . 4-56spectrum analyzer . . . . . . . . . . . . 2-58
Limit Move menuinterference analyzer . . . . . . . . . . 4-60spectrum analyzer . . . . . . . . . . . . 2-62
linkscontacting Anritsu . . . . . . . . . . . . . 1-1
Mmapping
coverage mapping . . . . . . . . . . . . . . 7-1easyMap tools . . . . . . . . . . . . .4-11, 7-3interference mapping . . . . . . . . . . . 4-9interference mapping menu . . . . . 4-42
Marker menuAM/FM/PM analyzer . . . . . . . . . . 8-24interference analyzer . . . . . . . . . . 4-44spectrum analyzer . . . . . . . . . . . . 2-40
Measure menuinterference analyzer . . . . . . . . . . 4-37spectrum analyzer . . . . . . . . . . . . 2-47
measurement mode selection . . . . . . . . 1-2Measurements menu
AM/FM/PM analyzer . . . . . . . . . . 8-14channel scanner . . . . . . . . . . . . . . 5-13interference analyzer . . . . . . . . . . 4-30
M to M
Index-3 PN: 10580-00231 Rev. F Spectrum Analyzer MG
menu (AM/FM/PM)Amplitude . . . . . . . . . . . . . . . . . . . 8-12Audio Demod AM . . . . . . . . . . . . . 8-22Audio Demod FM . . . . . . . . . . . . . 8-23Audio Spectrum AM . . . . . . . . . . . 8-16Audio Spectrum FM . . . . . . . . . . . 8-18Audio Spectrum PM . . . . . . . . . . . 8-20Audio Waveform AM . . . . . . . . . . 8-17Audio Waveform FM . . . . . . . . . . 8-19Audio Waveform PM . . . . . . . . . . 8-21Marker . . . . . . . . . . . . . . . . . . . . . 8-24Measurements . . . . . . . . . . . . . . . 8-14RF Freq . . . . . . . . . . . . . . . . . . . . . . 8-9RF Spectrum . . . . . . . . . . . . . . . . . 8-15Setup . . . . . . . . . . . . . . . . . . . . . . . 8-13Span . . . . . . . . . . . . . . . . . . . . . . . 8-10Standard List . . . . . . . . . . . . . . . . 8-11
menu (Interference Analyzer)ACPR . . . . . . . . . . . . . . . . . . . . . . . 4-34AM/FM Demod . . . . . . . . . . . . . . . 4-35Amplitude . . . . . . . . . . . . . . . . . . . 4-27BW . . . . . . . . . . . . . . . . . . . . . . . . . 4-29C/I . . . . . . . . . . . . . . . . . . . . . . . . . 4-36Channel Power . . . . . . . . . . . . . . . 4-33Detection . . . . . . . . . . . . . . . . . . . . 4-28Edit . . . . . . . . . . . . . . . . . . . . . . . . 4-58Field Strength . . . . . . . . . . . . . . . 4-32Frequency . . . . . . . . . . . . . . . . . . . 4-24Gated Sweep . . . . . . . . . . . . . . . . . 4-50interference mapping . . . . . . . . . . 4-42Limit . . . . . . . . . . . . . . . . . . . . . . . 4-56Limit Advanced . . . . . . . . . . . . . . 4-63Limit Envelope . . . . . . . . . . . . . . . 4-61Limit Move . . . . . . . . . . . . . . . . . . 4-60Marker . . . . . . . . . . . . . . . . . . . . . 4-44Marker & Peak . . . . . . . . . . . . . . . 4-45Marker 2/2 . . . . . . . . . . . . . . . . . . 4-46Measure 2/2 . . . . . . . . . . . . . . . . . 4-37Measurements . . . . . . . . . . . . . . . 4-30OCC BW . . . . . . . . . . . . . . . . . . . . 4-32Options (Application) . . . . . . . . . . 4-64RSSI . . . . . . . . . . . . . . . . . . . . . . . 4-40Signal ID . . 4-41, 4-43, 7-17, 7-18, 7-19Signal Strength . . . . . . . . . . . . . . 4-39Span . . . . . . . . . . . . . . . . . . . . . . . 4-26Spectogram . . . . . . . . . . . . . . . . . . 4-38Spectrum . . . . . . . . . . . . . . . . . . . . 4-31Sweep . . . . . . . . . . . . . . . . . . . . . . 4-47Trace . . . . . . . . . . . . . . . . . . . . . . . 4-52Trace A Ops . . . . . . . . . . . . . . . . . 4-53Trace B Ops . . . . . . . . . . . . . . . . . 4-54Trace C Ops . . . . . . . . . . . . . . . . . 4-55Trigger . . . . . . . . . . . . . . . . . . . . . 4-49
O to S
Spectrum Analyzer MG PN: 10580-00231 Rev. F Index-4
menu (Spectrum Analyzer)ACPR . . . . . . . . . . . . . . . . . . . . . . 2-50AM/FM Demod . . . . . . . . . . . . . . . 2-51Amplitude . . . . . . . . . . . . . . . . . . . 2-33Application Options . . . . . . . . . . . 2-66BW . . . . . . . . . . . . . . . . . . . . . . . . 2-39C/I . . . . . . . . . . . . . . . . . . . . . . . . . 2-52Channel Power . . . . . . . . . . . . . . . 2-49Detection . . . . . . . . . . . . . . . . . . . . 2-34Field Strength . . . . . . . . . . . . . . . 2-48Frequency . . . . . . . . . . . . . . . . . . . 2-31Gated Sweep Setup . . . . . . . . . . . 2-46Limit . . . . . . . . . . . . . . . . . . . . . . . 2-58Limit Advanced . . . . . . . . . . . . . . 2-65Limit Edit . . . . . . . . . . . . . . . . . . . 2-60Limit Envelope . . . . . . . . . . . . . . . 2-63Limit Move . . . . . . . . . . . . . . . . . . 2-62Marker . . . . . . . . . . . . . . . . . . . . . 2-40Measure . . . . . . . . . . . . . . . . . . . . 2-47Measure 2/2 . . . . . . . . . . . . . . . . . 2-53More Peak Options . . . . . . . . . . . . 2-41OCC BW . . . . . . . . . . . . . . . . . . . . 2-48Span . . . . . . . . . . . . . . . . . . . . . . . 2-35Sweep . . . . . . . . . . . . . . . . . . . . . . 2-43Sweep Mode . . . . . . . . . . . . . . . . . 2-44Trace . . . . . . . . . . . . . . . . . . . . . . . 2-54Trace A Ops . . . . . . . . . . . . . . . . . 2-55Trace B Ops . . . . . . . . . . . . . . . . . 2-56Trace C Ops . . . . . . . . . . . . . . . . . 2-57Trigger . . . . . . . . . . . . . . . . . . . . . 2-45Zero Span IF BW . . . . . . . . .2-37, 2-38
menu mapAM/FM/PM analyzer . . . . . . . . . . . 8-5channel scanner . . . . . . . . . . . . . . . 5-6coverage mapping . . . . . . . . . . . . . 7-11interference analyzer . . . . . . . . . . 4-17spectrum analyzer . . . . . . . . . . . . 2-25
More Peak Optionsmenu (Spectrum Analyzer) . . . . . 2-41
OOCC BW menu
interference analyzer . . . . . . . . . . 4-32spectrum analyzer . . . . . . . . . . . . 2-48
occupied bandwidth (OBW)AM/FM/PM analyzer OBW method 8-15calculation methods . . . . . . . . . . . 2-13channel power meas’t example . . 2-14description . . . . . . . . . . . . . . . . . . 2-13interference analyzer menu . . . . . 4-32interference analyzer menu key . 4-31procedure . . . . . . . . . . . . . . . . . . . 2-13spectrum analyzer measurement 2-13spectrum analyzer menu . . . . . . . 2-48
one-button smart measurements . . . . 2-11option
25, interference analyzer . . . . . . . . 4-127, channel scanner . . . . . . . . . . . . 5-128, CW signal generator . . . . . 3-1, 6-131, required for coverage mapping 7-131, required for interference mapping
4-9431, coverage mapping . . . . . 7-1, 7-11431, required for coverage mapping 2-53509, AM/FM/PM analyzer . . . . . . . 8-189, zero span . . . . . . . . . . . . . . . . . 2-3689, Zero Span described . . . . . . . . . 2-590, gated sweep . .2-4, 2-43, 2-46, 4-47
outdoor coverage mapping . . . . . . . . . . 7-2out-of-band spurious emission
measurement . . . . . . . . . . . . . . . . 2-17
Pparts replacement, service centers . . . 1-1power density, antenna calculations . 2-12preamplifier settings . . . . . . . . . . . . . . 2-9
RRBW to VBW ratio . . . . . . . . . . . . . . . . 2-2received signal strength indicator . . . . 4-5repairs, service centers . . . . . . . . . . . . . 1-1resolution bandwidth . . . . . . . . . . . . . . 2-8RF Freq menu (AM/FM/PM) . . . . . . . . 8-9RF Spectrum menu (AM/FM/PM) . . . 8-15RSSI
menu . . . . . . . . . . . . . . . . . . . . . . . 4-40
SSafety Symbols
For Safety . . . . . . . . . . . . . . . . Safety-2In Manuals . . . . . . . . . . . . . . . Safety-1On Equipment . . . . . . . . . . . . Safety-1
T to Z
Index-5 PN: 10580-00231 Rev. F Spectrum Analyzer MG
saveinterference mapping information 4-15JPG, coverage mapping . . . . . . . . 7-10KML points . . . . . . . . . . . . . . . . . . . 7-8limit, SPA . . . . . . . . . . . . . . . . . . . 2-65location, interference mapping . . 4-10tab delimited points . . . . . . . . . . . . 7-9
Scan Script Master menu . . . . . . . . . . 5-10Scanner menu . . . . . . . . . . . . . . . . . . . . 5-7script master . . . . . . . . . . . . . . . . . . . . . 5-4service centers . . . . . . . . . . . . . . . . . . . . 1-1Setup (AM/FM/PM) menu . . . . . . . . . 8-13signal ID . . . . . . . . . . . . . . . . . . . . . . . . 4-6Signal ID menu 4-41, 4-43, 7-17, 7-18, 7-19signal level conversion, antenna calculations 2-12signal strength
coverage mapping . . . . . . . . . . . . . . 7-7interference analyzer . . . . . . . . . . . 4-4menu . . . . . . . . . . . . . . . . . . . . . . . 4-39
smart one-button measurements . . . . 2-11SPA bandwidth parameters . . . . . . . . . 2-2SPA measurements . . . . . . . . . . . . . . . . 2-2Span menu
AM/FM/PM analyzer . . . . . . . . . . 8-10interference analyzer . . . . . . . . . . 4-26spectrum analyzer . . . . . . . . . . . . 2-35zero span IF BW keys . . . . . . . . . 2-37zero span IF BW keys, MS272xB 2-38zero span keys . . . . . . . . . . . . . . . 2-36
Span/RBW ratio . . . . . . . . . . . . . . . . . . 2-2spectogram
description . . . . . . . . . . . . . . . . . . . 4-2menu . . . . . . . . . . . . . . . . . . . . . . . 4-38
spectrum analyzer menus . . . . . . . . . 2-25Spectrum menu
interference analyzer . . . . . . . . . . 4-31Standard List menu (AM/FM/PM) . . . 8-11
sweepmode . . . . . . . . . . . . . . . . . . . . . . . . 2-3parameters . . . . . . . . . . . . . . . . . . . 2-3speed . . . . . . . . . . . . . . . . . . . . . . . . 2-9
Sweep menuinterference analyzer . . . . . . . . . . 4-47spectrum analyzer . . . . . . . . . . . . 2-43
TTrace A Ops
menu spectrum analyzer menu . . 2-55Trace B Ops
menu spectrum analyzer menu . . 2-56Trace C Ops
menu spectrum analyzer menu . . 2-57Trace menu
interference analyzer . . . . . . . . . . 4-52spectrum analyzer . . . . . . . . . . . . 2-54
Trigger menuinterference analyzer . . . . . . . . . . 4-49spectrum analyzer . . . 2-44, 2-45, 4-48
UURL contacting Anritsu . . . . . . . . . . . . 1-1
Vvideo bandwidth . . . . . . . . . . . . . . . . . . 2-8
Wwebsite, contacting Anritsu . . . . . . . . . 1-1
ZZero Span
exceptions for MS2723B and MS2724B 2-5
option 89, IF output . . . . . . . . . . . . 2-5Zero Span IF BW
menu . . . . . . . . . . . . . . . . . . . . . . . 2-37menu, MS272xB . . . . . . . . . . . . . . 2-38

Z to Z
Spectrum Analyzer MG PN: 10580-00231 Rev. F Index-6

Anritsu Company490 Jarvis DriveMorgan Hill, CA 95037-2809
P/N: 10000-00000Revision: Prelim
Printed: April 2013

Anritsu Company490 Jarvis Drive
Morgan Hill, CA 95037-2809USA
http://www.anritsu.com
Anritsu prints on recycled paper with vegetable soybean oil ink.