anomaly detection in a mobile communication networkdial/publications/pawling2007...anomaly detection...
TRANSCRIPT
Comput Math Organ Theory (2007) 13: 407–422DOI 10.1007/s10588-007-9018-7
Anomaly detection in a mobile communication network
Alec Pawling · Nitesh V. Chawla · Greg Madey
Published online: 27 September 2007© Springer Science+Business Media, LLC 2007
Abstract Mobile communication networks produce massive amounts of data whichmay be useful in identifying the location of an emergency situation and the area itaffects. We propose a one pass clustering algorithm for quickly identifying anom-alous data points. We evaluate this algorithm’s ability to detect outliers in a data setand describe how such an algorithm may be used as a component of an emergencyresponse management system.
Keywords Anomaly detection · Communication network · Data clustering · Datamining
1 Introduction
Mobile communication networks have recently received attention as viable, pre-existing sensor networks. City officials in Baltimore use cell phone location datato monitor traffic flow, and the state of Missouri is considering a similar statewide program that would make traffic information available to the public (Asso-ciated Press 2005). IntelliOne, a company based in Atlanta, GA, recently released
This paper won the best student paper award at the North American Association for Computationaland Organizational Science (NAACSOS) Conference 2006, University of Notre Dame, Notre Dame,IN, USA.
A. Pawling (�) · N.V. Chawla · G. MadeyDepartment of Computer Science and Engineering, University of Notre Dame, Notre Dame,IN 46556, USAe-mail: [email protected]
N.V. Chawlae-mail: [email protected]
G. Madeye-mail: [email protected]

408 A. Pawling et al.
a system that displays anonymous cell phone location data onto a map so thatusers can identify congested areas (National Science Foundation 2006). The emer-gency response community has also gained interest in using existing cell phonenetworks as a way to distribute warnings to citizens (Sillem and Wiersma 2006;Wood 2005).
The Wireless Phone Emergency Response (WIPER) system, an emergency re-sponse management tool currently under development, monitors an existing mobilecommunication network. Operating under the assumptions that the behavior of thenetwork models the behavior of a population and that anomalous behavior may in-dicate an emergency situation has developed, the system attempts to quickly detectanomalies in the network. When anomalies occur, WIPER uses a suite of simulationsto predict how the situation will unfold. This paper focuses on the problem of iden-tifying anomalous events in streaming cell phone data as part of the WIPER system.See (Madey et al. 2007; Schoenharl et al. 2006a, 2006b) for a complete overview ofthe WIPER system.
Our goal is to mine the mobile communication network data for events and anom-alies to enable a more efficient emergency response system. Emergency response sys-tems are tools that aid emergency response managers in the decision making process.The difficulty of making good decisions is increased by several factors includingstress, fatigue, restrictive time constraints.
Another major issue for emergency response managers is the problem of “infor-mation overload.” Studies have shown a correlation between abundant available dataand bad decision making in crisis situations (Smart and Vertinsky 1977). Good emer-gency response systems provide access to the large amount of available data in such away that the emergency response manager can use the data effectively to reach gooddecisions (Belardo et al. 1984; Jennex 2007).
We believe that an anomaly detection system that monitors incoming streamingmobile communication network data and posts alerts for the emergency responsemanager will be a useful addition to an emergency response system. It will drawthe managers attention to information that may be easily missed in a fast moving,stressful situation. The manager can use or ignore that information based on theirexperience. The goal is to provide valuable information without being too intrusivein the case of false positives.
The nature of the data poses some difficulties in developing an anomaly detectionsystem. First, a large amount of data arrives at a rapid rate. The sheer volume of thedata makes it difficult to store it in its entirety, much less operate on it using repeatedaccesses, which is a typical algorithmic requirement. Therefore, we aim to develop amethod that follows the data stream model (Babcock et al. 2002). Intuitively, a datastream is a sequence of data items that arrive at such a rapid rate that it is only feasibleto operate on a small portion of the data. As each data item is seen, it must be eitherincorporated into a summary that requires a small amount of memory or it mustbe discarded, in which case it cannot be retrieved. The data stream model imposestwo algorithmic limitations: each item in the dataset may only be read once in apredefined order, and memory usage must be sub-linear—typically polylogarithmicwith respect to the number of data items seen. Our main focus in this paper is theone pass requirement; we present a one pass hybrid clustering algorithm for anomalydetection.

Anomaly detection in a mobile communication network 409
Another difficulty is the fact that the system is dynamic; the way in which peopleuse the services provided by a mobile communication network changes over time.The anomaly detection approach should be sensitive enough to detect anomalies butshould not be so sensitive that it flags changes in the underlying system as anomalies.That said, the cost of false positives is far less than the cost of false negatives. Thesystem can handle the detection of a few non-emergency situations, as long it doesnot happen too often.
In this paper, we present a one-pass hybrid clustering algorithm for detectinganomalies in streaming data. We evaluate clusters produced by the algorithm andits ability to detect outliers. Finally, we discuss how such an algorithm can be used inan emergency response system like the one described above.
2 Related work
There is abundant literature on the anomaly detection problem which describes a vari-ety approaches, including statistical, neural network, and machine learning methods.In this paper, we focus on the statistical approaches, which can be divided into twocategories: parametric and non-parametric. Parametric approaches tend to be moreefficient, but assume the data conforms to a particular distribution. Non-parametricmethods do not assume any particular data distribution; however, they are often lessefficient. (Hodge and Austin 2004; Markou and Singh 2003a, 2003b).
Clustering is an appealing non-parametric method because it allows us to capturevarious classes of “normal” and “abnormal” behavior. This may be quite useful since,in addition to detecting anomalies caused by events that have never been seen before,knowing various types of “abnormality” would allow us to identify interesting eventsthat have already been seen.
The goal of clustering is to group similar data items together. The concept of sim-ilarity is often defined by a distance metric; we use Euclidean distance. Good clus-tering algorithms form clusters such that the distance between intra-cluster points areminimized and the distance between inter-cluster points are maximized. Anomaliesare, intuitively, the data items that are far from all other data items. There are threemajor types of clustering algorithms: partitional, hierarchical, and incremental (Jainet al. 1999).
2.1 Partitional clustering
Partitional clustering divides the data set into some number, often a predefined num-ber, of disjoint subsets. K-means is a classical and simple clustering algorithm thatiteratively refines a set of clusters. The initial cluster centroids for the k-means algo-rithm are k randomly selected data items from the data set. Each example in the dataset is assigned to the closest cluster, and the new cluster centroids are computed. Thisprocess is repeated until the clusters stabilize, i.e. no point in the data set receives anew cluster assignment (Witten and Frank 2005).
Expectation maximization (EM) clustering is another classical, partitional algo-rithm. EM is a probability based algorithm that seeks to discover a set of clusters

410 A. Pawling et al.
corresponding to a Gaussian mixture model, a set of Gaussian distributions, that de-scribes the data set. The algorithm is initialized with k random Gaussian distributionsand iteratively refines these distributions using a two step process. The expectationstep computes the probability that the data set is drawn from the current Gaussianmixture—the likelihood. The maximization step reassigns the data items to the clus-ter which they most likely belong and recomputes the Gaussian mixture. The algo-rithm halts when the likelihood that the dataset is drawn from the Gaussian mixtureincreases by less than a user defined threshold.
There are a couple of drawbacks with these approaches. The k-means and EMalgorithms are not guaranteed to find an optimal set of clusters, and both algorithmsrequire a priori knowledge of the number of clusters in the data. These issues can bemitigated by running the algorithms multiple times using different initial conditionsand varying numbers of clusters. The best set of clusters is used to describe the data(Witten and Frank 2005). Another issue is scalability. These algorithms are inefficientfor very large data sets. Spatial data structures may reduce the time required by thesealgorithms. kd-trees (Bentley 1975) have been used reduce the number of distancecalculations required by k-means. Often, a kd-tree can be used to determine clustermemberships for a subset of points with only k distance computations (rather thank computations for each point in the subset) (Pelleg and Moore 1999). Multiresolu-tional kd-trees have been used to improve the performance of EM clustering. A mul-tiresolutional kd-tree stores hierarchical summary statistics on the data “owned” bythe node: the number of points, centroid, covariance matrix, and bounding hyper-rectangle. With these summaries stored for hierarchical subsets of the data set, thecomputation of EM parameters can be accelerated significantly (Moore 1999).
2.2 Hierarchical clustering
Hierarchical clustering divides data into a nested set of partitions and may be use-ful for discovering taxonomies in data. Agglomerative algorithms produce hierarchi-cal clusters via a bottom-up approach in which each example is initially a uniquecluster and the clusters are iteratively merged with their neighbors. Two commonagglomerative clustering algorithms are single link and complete link. These algo-rithms are graph based: each example becomes a vertex, and edges are added basedon the distance between pairs of vertices. A level of the hierarchical cluster is de-fined by a distance threshold: an edge is added to the graph if and only if two ex-amples are separated by a distance less than the threshold. The connected compo-nents and completely connected components are the clusters for the single link andcomplete link algorithms, respectively. The hierarchy of clusters is formed by iter-atively increasing the threshold to produce larger clusters (Jain and Dubes 1998;Jain et al. 1999). Since single and complete link clustering compute the distancesbetween all pairs of examples in the dataset they have greater time complexity thanpartitional algorithms, however, they produce optimal solutions.
2.3 Incremental clustering
Incremental algorithms consider each example once, immediately deciding either toplace it in a existing cluster or to create a new cluster. These algorithms tend to be fast,

Anomaly detection in a mobile communication network 411
but are also often order dependent (Jain et al. 1999). The leader algorithm is a simpleincremental clustering algorithm in which each cluster is defined by a single dataitem—the first item assigned to the cluster. For each data example, if the example iswithin a user specified distance of the defining item of the closest cluster, the exampleis assigned to that cluster; otherwise, the example becomes the defining example of anew cluster (Hartigan 1975).
Portnoy et al. (2001) use the leader algorithm for intrusion detection (another ap-plication of anomaly detection). In order to handle arbitrary distributions, they nor-malize the data using the z-score, in which the feature values are transformed by
v′i = vi − v̄i
σi
. (1)
Unfortunately, this requires two passes over the data. Furthermore, the distancethreshold is fixed over all clusters, and cannot change as the data stream evolves.
2.4 Clustering algorithms for streaming data
A few methods have been developed for clustering data streams. Guha et al. (2003)present a method based on k-mediods—an algorithm similar to k-means. The clustersare computed periodically as the stream arrives, using a combination of the streamingdata and cluster centers from previous iterations to keep memory usage low. Aggar-wal et al. (2003) present a method that takes into account the evolution of streamingdata, giving more importance to more recent data items rather than letting the cluster-ing results be dominated by a significant amount of outdated data. The algorithmcomputes micro-clusters, which are statistical summaries of the data periodicallythroughout the stream. These micro-clusters serve as the data points for a modifiedk-means clustering algorithm.
2.5 Hybrid clustering
Hybrid clustering combines two clustering algorithms. Cheu et al. (2004) examinethe use of iterative, partitional algorithms such as k-means, which tend to be fast, asa method of reducing a data set for hierarchical, agglomerative algorithms, such ascomplete-link, that tend to have high computational complexity. Chipman and Tibshi-rani (2006) combine agglomerative algorithms—which tend to do well at discoveringsmall clusters—with top-down methods—which tend to do well at discovering largeclusters. Surdeanu et al. (2005) propose a hybrid clustering algorithm for documentclassification that uses hierarchical clustering as a method for determining initial pa-rameters for expectation maximization.
3 The dataset
We use a data set generated from a database of real world mobile communication net-work information. The database provides the following information for each transac-tion (use of a service by a customer): the initiation time, the duration (in minutes),
412 A. Pawling et al.
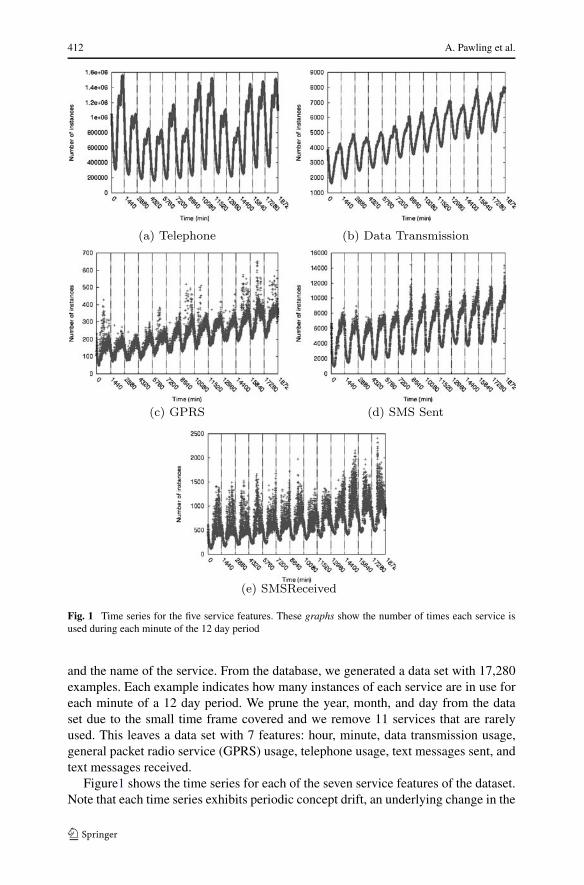
Fig. 1 Time series for the five service features. These graphs show the number of times each service isused during each minute of the 12 day period
and the name of the service. From the database, we generated a data set with 17,280examples. Each example indicates how many instances of each service are in use foreach minute of a 12 day period. We prune the year, month, and day from the dataset due to the small time frame covered and we remove 11 services that are rarelyused. This leaves a data set with 7 features: hour, minute, data transmission usage,general packet radio service (GPRS) usage, telephone usage, text messages sent, andtext messages received.
Figure1 shows the time series for each of the seven service features of the dataset.Note that each time series exhibits periodic concept drift, an underlying change in the

Anomaly detection in a mobile communication network 413
process generating the data (Tsymbal 2004), based on the time of day. The telephonetime series is relatively consistent from day to day, though the call volume variessomewhat depending on the day of the week and on whether the day is a holiday.In contrast, there is a noticeable increase in the network load for each of the otherservices as time goes by; this is a form of non-periodic concept drift. This suggeststhat the way in which people use the telephone service is relatively well established.Notably, this is also the oldest and most used service. As technology evolves, andpeoples habits change, we can expect new manifestations of concept drift.
3.1 Offline clustering analysis
Since many clustering algorithms require a priori knowledge of the number of clus-ters, we must have some way of determining the correct value for this parameter.There are a couple of methods for accomplishing this. One method is to simply per-form the clustering for various numbers of clusters and choose the best result basedon some metric such as sum squared error or log likelihood. Another method is touse 10-fold cross validation for k ∈ 1,2, . . . ,m, increasing k until the quality of theclustering starts to degrade (Witten and Frank 2005).
We use the implementation of expectation maximization provided by the Wekapackage (Witten and Frank 2005) with 10-fold cross validation to determine the num-ber of clusters. 10-fold cross validation partitions the data set into 10 equally sizedsubsets, or folds. Starting with k = 1, for each distinct set of 9 folds we computeclusters and the log likelihood of the cluster set. The value of k is incremented by 1and the process repeats until the average log likelihood is less than that of the pre-vious iteration. The final result is the set of clusters that maximizes the average log
Fig. 2 The number of clusters for each hour of day 4. The number of clusters is determined using 10 foldcross validation with expectation maximization clustering
414 A. Pawling et al.
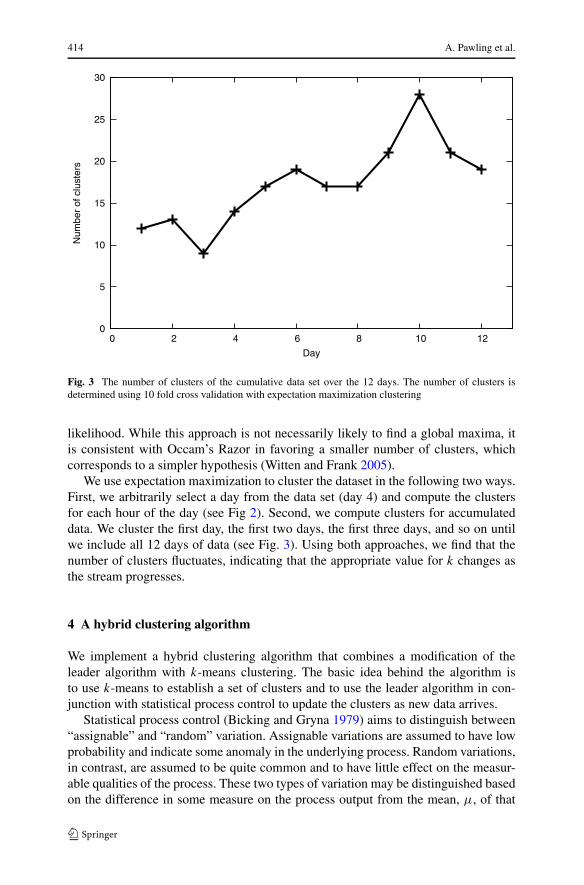
Fig. 3 The number of clusters of the cumulative data set over the 12 days. The number of clusters isdetermined using 10 fold cross validation with expectation maximization clustering
likelihood. While this approach is not necessarily likely to find a global maxima, itis consistent with Occam’s Razor in favoring a smaller number of clusters, whichcorresponds to a simpler hypothesis (Witten and Frank 2005).
We use expectation maximization to cluster the dataset in the following two ways.First, we arbitrarily select a day from the data set (day 4) and compute the clustersfor each hour of the day (see Fig 2). Second, we compute clusters for accumulateddata. We cluster the first day, the first two days, the first three days, and so on untilwe include all 12 days of data (see Fig. 3). Using both approaches, we find that thenumber of clusters fluctuates, indicating that the appropriate value for k changes asthe stream progresses.
4 A hybrid clustering algorithm
We implement a hybrid clustering algorithm that combines a modification of theleader algorithm with k-means clustering. The basic idea behind the algorithm isto use k-means to establish a set of clusters and to use the leader algorithm in con-junction with statistical process control to update the clusters as new data arrives.
Statistical process control (Bicking and Gryna 1979) aims to distinguish between“assignable” and “random” variation. Assignable variations are assumed to have lowprobability and indicate some anomaly in the underlying process. Random variations,in contrast, are assumed to be quite common and to have little effect on the measur-able qualities of the process. These two types of variation may be distinguished basedon the difference in some measure on the process output from the mean, μ, of that

Anomaly detection in a mobile communication network 415
measure. The threshold is typically some multiple, l, of the standard deviation, σ .Therefore, if the measured output falls in the range μ± lσ , the variance is consideredrandom; otherwise, it is assignable.
Our algorithm represents the data using two structures: the cluster set and theoutlier set. To save space, the cluster set does not store the examples that make upeach cluster. Instead, each cluster is summarized by the sum and sum squared valuesof its feature vectors along with the number of items in the cluster. The outlier setconsists of the examples that do not belong to any cluster. We rely on the centroidand the standard deviations of the features to summarize and update the clusters, soclusters are only accepted when they contain some minimum number of examples, m.The algorithm periodically clusters the examples in the outlier set using k-means.Clusters which contain at least m items are reduced to the summary described aboveand added to the cluster set.
Algorithm 1 shows the details of our approach. The algorithm takes three argu-ments: the minimum number of elements per cluster, m; the number of clusters to
Algorithm 1 INCREMENTAL HYBRID(X, l, k′,m)
Let X be a list of examples, �x1, �x2, . . .
Let l be the threshold multipleLet k′ be the number of clusters to produce in the first levelLet m be the minimum number of items required to accept a cluster
Let C be the set of clustersLet U be the set of unclustered examples
C ← ∅U ← ∅for all �x ∈ X do
Find the closed cluster, Ci
if dist(�x,Ci) < |�σ | thenAdd �c to Ci
end ifif |U | = km then
C′ ← k-MEANS(k′,U)
for all c′ ∈ C′ doif c′ contains more than m examples then
Add c′ to C
elsePut the items in c′ into U
end ifend for
end ifend for
Algorithm 1 The hybrid clustering algorithm

416 A. Pawling et al.
compute with k-means, k′; and a threshold, l that, when multiplied by the magni-tude of the standard deviation vector, defines the boundary between “random” and“assignable” variation. (Note that k′ specifies the number of clusters for the first levelof the hybrid algorithm, not the final number of clusters produced by the algorithm.)For each example that arrives, we compute the closest cluster. If the example is con-sidered an “assignable” variation, i.e. it is further than lσ from the closest clustercenter (or the set of clusters is empty), the example is placed in the outlier set. Other-wise, if the example is considered a “random” variation, the example is used to updatethe summary of the closest cluster. When there are k′m examples in the outlier set,cluster these examples with k-means. The new clusters with at least m examples areadded to the cluster set, and all the examples in the remaining clusters return to theoutlier set.
This algorithm attempts to take advantage of the fact that the mean is sensitive tooutliers. By using means as the components of the cluster center and updating thecenters whenever a new example is added to a cluster, we hope to handle a certainamount of concept drift. At the same time, we hope that the use of statistical processcontrol to filter out anomalous data prevents the cluster centers from being affectedby outlying points. This algorithm does not require a priori knowledge of the numberof clusters (recall that the argument k′ is only the number of clusters for the first levelcluster), since new clusters will form as necessary.
5 Experimental setup
We evaluate our incremental hybrid clustering algorithms against the expectationmaximization clustering algorithm. We use the implementation of expectation maxi-mization provided by the Weka package (Witten and Frank 2005) using 10 fold crossvalidation to determine the baseline for the number of clusters in the data. For the hy-brid algorithm, we use l = 1,3 and k′ = 5,10,20,30. We evaluate the cluster qualityusing sum square error. We examine the number of clusters and outliers produced bythe hybrid algorithm, and we compare the outlier set produced by the hybrid algo-rithm to outliers determined by an offline algorithm.
6 Results
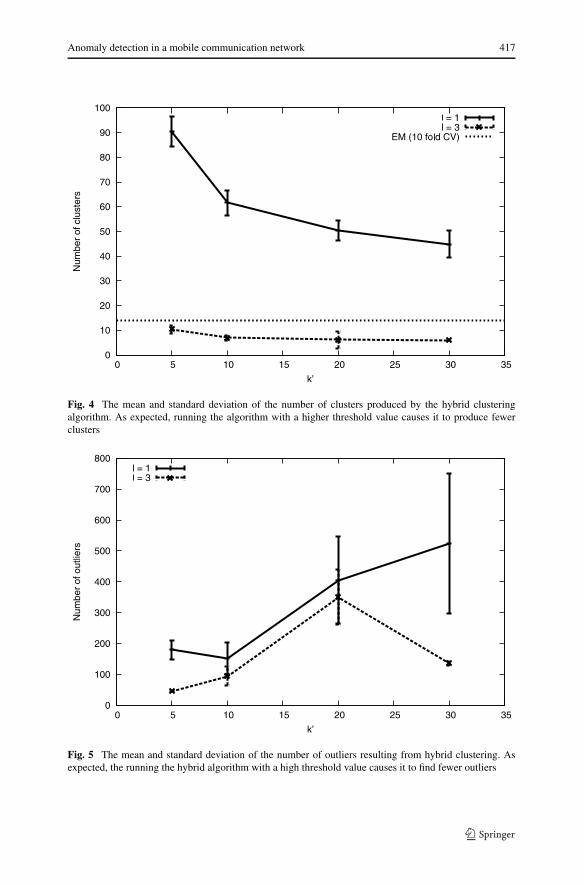
Figure 4 shows the number of clusters produced by expectation maximization clus-tering and our hybrid clustering algorithm. As expected, the number of clusters pro-duced by the hybrid clustering algorithm decreases as the threshold, l, increases.Figure 5 shows the average number of outliers resulting from the application of thehybrid clustering algorithm, with error bars. There are a few factors that cause thenumber of outliers to fluctuate. Recall that we only accept clusters from k-meansif they have some minimum number of members, m. Since we cluster when thereare mk′ members in the outlier set, increasing k′ also increases the number of itemsused by k-means. If all the clusters are approximately the same size, several clusterswith nearly m items may remain in the outlier set, increasing the number of outliersfound by the algorithm. In contrast, if most of the examples fall in a few clusters, fewexamples may remain in the outliers set.
Anomaly detection in a mobile communication network 417
Fig. 4 The mean and standard deviation of the number of clusters produced by the hybrid clusteringalgorithm. As expected, running the algorithm with a higher threshold value causes it to produce fewerclusters
Fig. 5 The mean and standard deviation of the number of outliers resulting from hybrid clustering. Asexpected, the running the hybrid algorithm with a high threshold value causes it to find fewer outliers
418 A. Pawling et al.
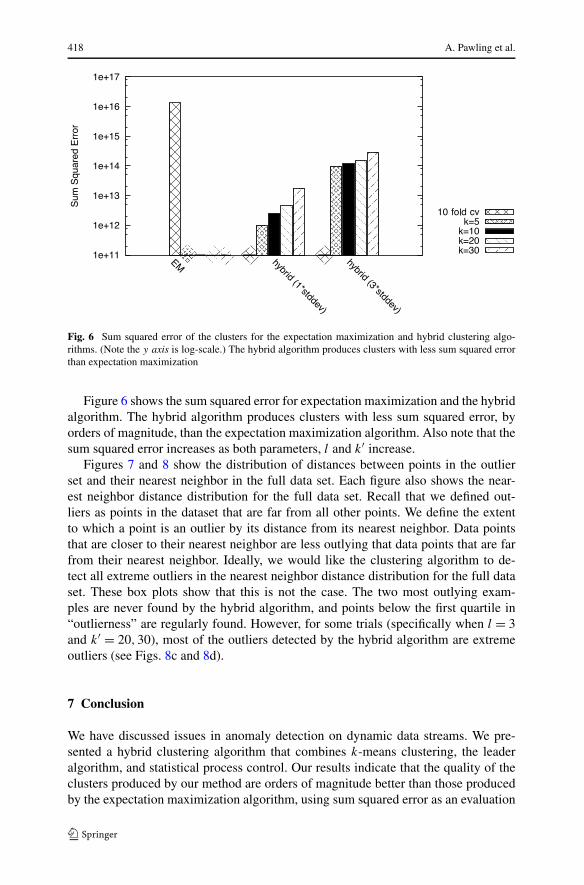
Fig. 6 Sum squared error of the clusters for the expectation maximization and hybrid clustering algo-rithms. (Note the y axis is log-scale.) The hybrid algorithm produces clusters with less sum squared errorthan expectation maximization
Figure 6 shows the sum squared error for expectation maximization and the hybridalgorithm. The hybrid algorithm produces clusters with less sum squared error, byorders of magnitude, than the expectation maximization algorithm. Also note that thesum squared error increases as both parameters, l and k′ increase.
Figures 7 and 8 show the distribution of distances between points in the outlierset and their nearest neighbor in the full data set. Each figure also shows the near-est neighbor distance distribution for the full data set. Recall that we defined out-liers as points in the dataset that are far from all other points. We define the extentto which a point is an outlier by its distance from its nearest neighbor. Data pointsthat are closer to their nearest neighbor are less outlying that data points that are farfrom their nearest neighbor. Ideally, we would like the clustering algorithm to de-tect all extreme outliers in the nearest neighbor distance distribution for the full dataset. These box plots show that this is not the case. The two most outlying exam-ples are never found by the hybrid algorithm, and points below the first quartile in“outlierness” are regularly found. However, for some trials (specifically when l = 3and k′ = 20,30), most of the outliers detected by the hybrid algorithm are extremeoutliers (see Figs. 8c and 8d).
7 Conclusion
We have discussed issues in anomaly detection on dynamic data streams. We pre-sented a hybrid clustering algorithm that combines k-means clustering, the leaderalgorithm, and statistical process control. Our results indicate that the quality of theclusters produced by our method are orders of magnitude better than those producedby the expectation maximization algorithm, using sum squared error as an evaluation

Anomaly detection in a mobile communication network 419
Fig. 7 Box-plots of the distribution of distances between the outliers and their nearest neighbor in the fulldataset for each trial of the hybrid clustering algorithm where l = 1. The bottom box-plot in each graphshows the distribution of distances from the nearest neighbor for all examples in the dataset
metric. We also compared the outlier set discovered by our algorithm with the out-liers discovered using one nearest neighbor. While our clustering algorithm produceda number of significant false positive and false negatives, most of the outlier detectedby our hybrid algorithm (with proper parameter settings) were in fact outliers. We be-lieve that our approach has promise for clustering and outlier detection on streamingdata.
We also believe that this approach has promise for use as a component of theWIPER system. Determining where a new example will be placed—either in an ex-isting cluster or in the outlier set—can be accomplished quickly. It is simply a matterof finding the closest cluster and determining if the example falls within its thresholdboundary. Once an initial set of clusters is formed, an alert can be produced whenever

420 A. Pawling et al.
Fig. 8 Box-plots of the distance between the outliers and their nearest neighbor in the full dataset foreach trial of the hybrid clustering algorithm where l = 1. The bottom box-plot shows the distribution ofdistances from the nearest neighbor for all examples in the dataset
a data item is assigned to the outlier set. Additionally, data items assigned to a clusterwhich is known to contain items produced during an emergency situation can also beused to inform the emergency response manager of a potential emergency.
7.1 Future work
We would like to further investigate hybrid clustering algorithms that utilize theleader algorithm and statistical process control. We plan to examine how the clusterschange over time as the data stream arrives. We also plan to try different algorithmsin place of k-means, particularly an agglomerative algorithm such as complete linkclustering.

Anomaly detection in a mobile communication network 421
Acknowledgements The material in this paper is based in part upon work supported by the NationalScience Foundation, the DDDAS program under Grant No. CNS-050348.
References
Aggarwal CC, Han J, Wang J, Yu PS (2003) framework for clustering evolving data streams. In: Proceed-ings of the 29th VLDB conference
Associated Press (2005) Tracking cell phones for real-time traffic dataBabcock B, Babu S, Datar M, Motwanim R, Widom J (2002) Models and issues in data stream systems.
In: Proceedings of the 21st ACM SIGMOD-SIGACT-SIGART symposium on principles of databasesystems, pp 1–16
Belardo S, Karwan KR, Wallace WA (1984) Managing the response to disasters using microcomputers.Interfaces 14(2):29–39
Bentley JL (1975) Multidimensional binary search trees used for associative searching. Commun ACM18(9):509–517
Bicking C, Gryna Jr FM (1979) Quality control handbook. McGraw-Hill, New YorkCheu EY, Keongg C, Zhou Z (2004) On the two-level hybrid clustering algorithm. In: International con-
ference on artificial intelligence in science and technology, pp 138–142Chipman H, Tibshirani R (2006) Hybrid hierarchical clustering with applications to microarray data. Bio-
statistics 7(2):286–301Guha S, Meyerson A, Mishra N, Motwani R, O’Callaghan L (2003) Clustering data streams: theory and
practice. IEEE Trans Knowl Data Eng 3:515–528Hartigan JA (1975) Clustering algorithms. Wiley series in probability and mathematical statistics. Wiley,
New YorkHodge VJ, Austin J (2004) A survey of outlier detection methodologies. Artif Intell Rev 22:85–126Jain AK, Dubes RC (1998) Algorithms for clustering data. Prentice-Hall, Englewood CliffsJain AK, Murty MN, Flynn PJ (1999) Data clustering: a review. ACM Comput Surveys 31(3):264–323Jennex ME (2007) Modeling emergency response systems. In: Proceedings of the 40th Hawaii interna-
tional conference on system sciencesMadey GR, Barabási AL, Chawla NV, Gonzalez M, Hachen D, Lantz B, Pawling A, Schoenharl T, Sz-
abó G, Wang P, Yan P (2007) Enhanced situational awareness: application of DDDAS concepts toemergency and disaster management. In: Alexandrov VN, van Albada GD, Sloot PMA, Dongarra J(eds) International conference on computational science. Lecture notes in computer science. Springer,Berlin
Markou M, Singh S (2003a) Novelty detection: a review. part 1: statistical approaches. Signal Process83(12):2481–2497
Markou M, Singh S (2003b) Novelty detection: a review. part 2: neural network based approaches. SignalProcess 83(12):2499–2521
Moore A (1999) Very fast EM-based mixture model clustering using multiresolution kd-trees. In: KearnsM, Cohn D (eds) Advances in neural information processing systems. Kaufman, Los Altos, pp 543–549
National Science Foundation (2006) Real-time traffic routing from the comfort of your car. Press release06-124. http://www.nsf.gov/news/news_summ.jsp?cntn_id=107972
Pelleg D, Moore A (1999) Accelerating exact k-means algorithms with geometric reasoning. In: Proceed-ings of the fifth ACM SIGKDD international conference on knowledge discovery and data mining.ACM, New York, pp 277–281
Portnoy L, Eskin E, Stolfo S (2001) Intrusion detection with unlabeled data using clustering. In: ACMworkshop on data mining applied to security
Schoenharl T, Bravo R, Madey G (2006a) WIPER: leveraging the cell phone network for emergencyresponse. Int J Intell Control Syst 11(4):209–216
Schoenharl T, Madey G, Szabó G, Barabási AL (2006b) WIPER: multi-agent system for emergency re-sponse. In: Proceedings of the 3rd international ISCRAM conference
Sillem S, Wiersma E (2006) Comparing cell broadcast and text messaging for citizen warning. In: Pro-ceedings of the 3rd international ISCRAM conference
Smart C, Vertinsky I (1977) Designs for crisis decision units. Adm Sci Q 22:640–657
422 A. Pawling et al.
Surdeanu M, Turmo J, Ageno A (2005) A hybrid unsupervised approach for document clustering. In:Proceedings of the 5th ACM SIGKDD international conference on knowledge discovery and datamining
Tsymbal A (2004) The problem of concept drift: definitions and related work. Technical report TCD-CS-2004-15, Trinity College, Dublin
Witten IH, Frank E (2005) Data mining: practical machine learning tools and techniques, 2nd edn. Kauf-man, Los Altos
Wood M (2005) Cell@lert, for government-to-citizen mass communications in emergencies; it’s abouttime. In: Proceedings of the second international ISCRAM conference
Alec Pawling is a Ph.D. student in the Department of Computer Science and Engineering at the Universityof Notre Dame. His research interests include machine learning, graph mining, and stream mining.
Nitesh V. Chawla is an Assistant Professor in the Department of Computer Science and Engineeringat the University of Notre Dame. His core research in machine learning and data mining focuses oncost/distribution sensitive learning, massively parallel and distributed data mining, semi-supervised learn-ing, and learning in graphs/networks. His recent work has also included various applications of machinelearning to systems, bioinformatics, medicine, security, biometrics, and finance. He has served as a co-PIon grants from DoD and DoJ. He has received various awards for his research and teaching. His workwith students has resulted in best student paper awards at conferences. He is the recipient of FIE NewFaculty Fellowship for his education paper on teaching data mining. He is Associate Editor for the IEEETransactions on SMC-B. In addition, he has served on organizing and program committees for variousworkshops/conferences/special issues.
Greg Madey received the Ph.D. and M.S. degrees in operations research from Case Western Reserve Uni-versity and the M.S. and B.S. degrees in mathematics from Cleveland State University. He is currently anassociate professor in the Department of Computer Science and Engineering at the University of NotreDame. His research includes topics in emergency management systems, web-services and service orientedarchitectures, bioinformatics, web portals for scientific collaboration, GRID computing, web intelligence,web mining, agent-based modeling and simulation, and swarm intelligence. He has published in variousjournals, including Communications of the ACM, IEEE Transactions on Engineering Management, IEEEComputing in Science & Engineering, The Journal of Systems & Software, The Journal of MIS, DecisionSciences, The European Journal of OR, Omega, Expert Systems with Applications, and Expert Systems.He is a member of the ACM, AIS, IEEE Computer Society, Informs, and the Society for Computer Simu-lation.