annual results presentation - nzx.com · pdf fileviews provided in that material. annual...
TRANSCRIPT
DISCLAIMERThis annual results presentation dated 29 July 2015 provides additional comment on the 2015 financial year end results media statement and financial materials released by Abano Healthcare Group on 29 July 2015. As such, it should be read in conjunction with, and subject to, the explanations and views provided in that material.
ANNUAL RESULTS PRESENTATIONFOR THE FINANCIAL YEAR ENDED 31 MAY 2015
Alan Clarke, Retiring Chief Executive Officer and Managing Director
Richard Keys, Incoming Chief Executive Officer, Current Chief Operating Officer/Chief Financial Officer

“Our strategy is to invest into scalable, growth businesses in the private, fee for service, healthcare market, that are compatible with a corporate owner and that offer attractive and sustainable long term value for our shareholders.”
Abano Healthcare Group Limited is an investor in and operator of healthcare businesses, in New Zealand, Australia and South East Asia.
ABOUT ABANO
We have five businesses in five countries with over 2,000 employees in more than 220 locations.
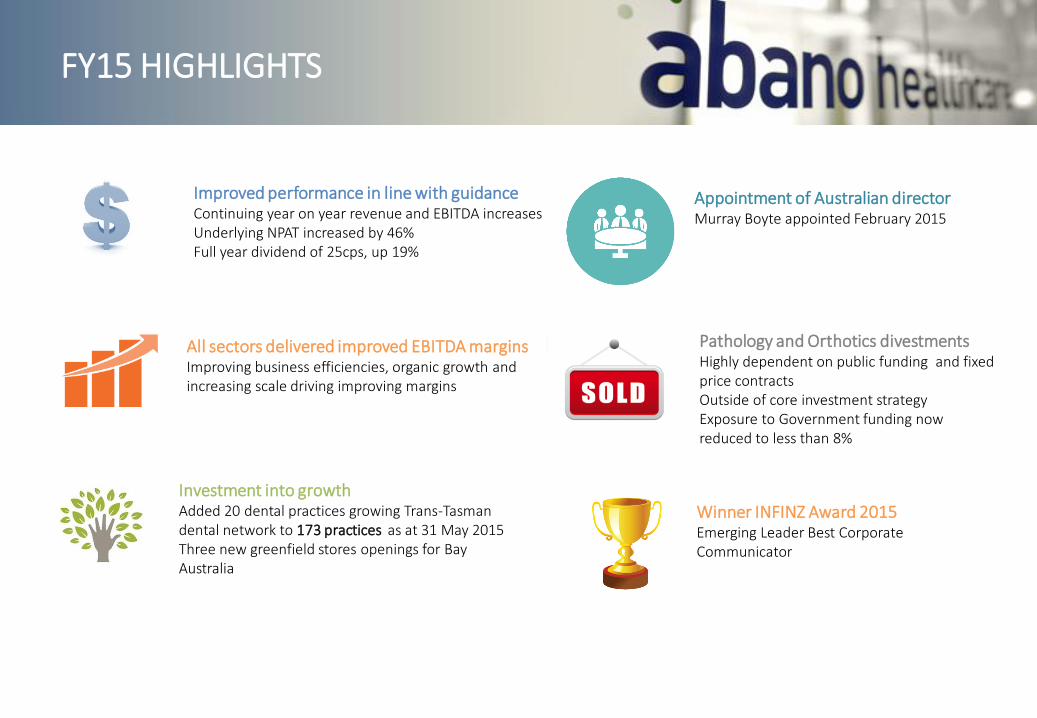
FY15 HIGHLIGHTS
Investment into growth Added 20 dental practices growing Trans-Tasman dental network to 173 practices as at 31 May 2015Three new greenfield stores openings for Bay Australia
Pathology and Orthotics divestmentsHighly dependent on public funding and fixed price contractsOutside of core investment strategy Exposure to Government funding now reduced to less than 8%
Improved performance in line with guidanceContinuing year on year revenue and EBITDA increasesUnderlying NPAT increased by 46%Full year dividend of 25cps, up 19%
All sectors delivered improved EBITDA marginsImproving business efficiencies, organic growth and increasing scale driving improving margins
Winner INFINZ Award 2015Emerging Leader Best Corporate Communicator
Appointment of Australian directorMurray Boyte appointed February 2015
FY15 BUSINESS OVERVIEW
Year of continued investment into Abano’s growth businesses of dental, audiology and radiology.
As the size of our Group grows, we are generating stronger margins and increasing returns.
DENTAL (70% Gross Revenue)
Primary focus on dental sector with continued growth through acquisition and organic expansion
– Addition of 20 practices, growing Abano’s trans-Tasman network to 173 practices: Nineteen dental practice acquisitions expected to provide approximately $30 million in additional annualised gross revenue plus one greenfield practice opening
AUDIOLOGY (13% Gross Revenue)
Bay International achieved positive EBITDA for first time after eight years of loss making
– Continuing improvement in Australian audiology business with 22% year on year increase in same store revenue
– Opening of three new greenfield stores in Australia
– Challenging market conditions continue for very small Asian audiology network
DIAGNOSTICS (14% Gross Revenue)
Insight+Ascot Radiology delivered another year on year improvement in both revenue and EBITDA
Divestment of non-core businesses in Pathology and Orthotics

FULL YEAR RESULTS SNAPSHOT
$ Millions FY14 FY15
Gross Revenue 274.0 300.4
Revenue 211.1 222.2
Underlying EBITDA 29.1 30.7
Acquisition Costs (1.3) (1.1)
EBITDA 27.8 29.6
Depreciation and Amortisation (10.0) (10.1)
Net Financing Costs and FV Amortisation (5.8) (5.8)
Share of loss of associate (2.2) (0.1)
Loss on sale of subsidiary businesses - (9.0)
Taxation (3.7) (4.5)
Minority Interest (1.2) (1.4)
NPAT/NLAT 4.9 (1.3)
Underlying NPAT 6.1 8.8
See glossary slide for explanation of gross revenue and underlying earnings
Record gross revenue and revenues, primarily driven by acquisitions in the dental business and improving performance across all businesses
EBITDA and Underlying EBITDA both up on FY14 and in the middle of guidance
Pathology and Orthotics businesses sold for cash proceeds of $11.1 million, resulting in a non cash loss on sale and reduction in goodwill of $9.0 million
Net Loss After Tax of $(1.3) million including non-cash impairment of goodwill and loss on sale
Underlying NPAT result of $8.8 million at top end of guidance and up 46% on previous year
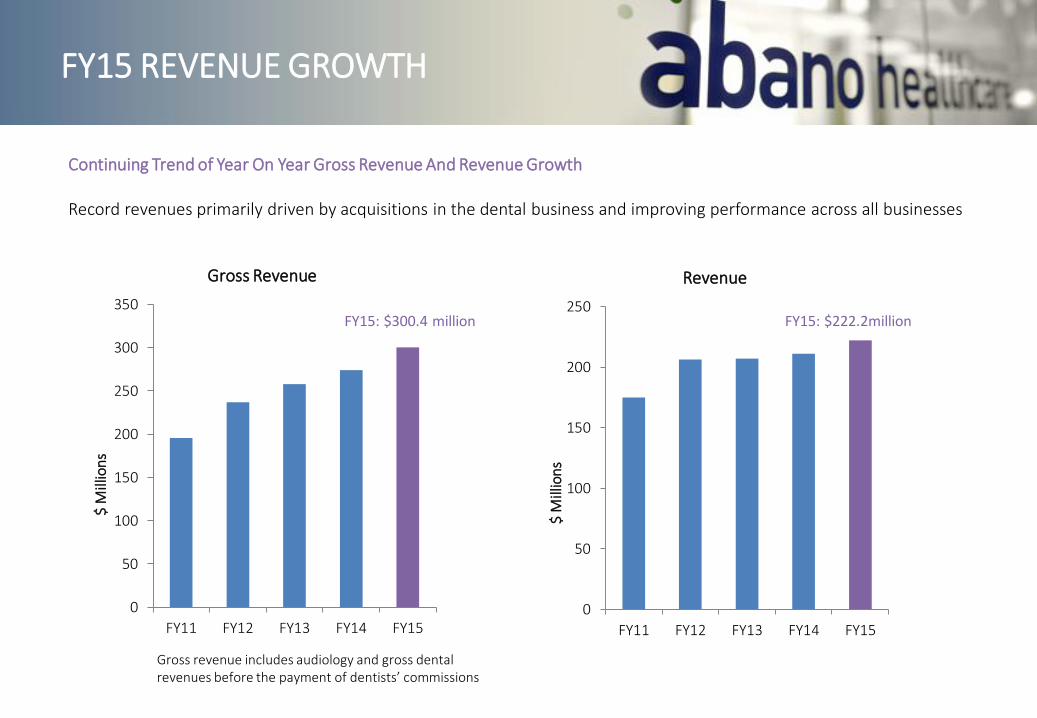
FY15 REVENUE GROWTH
0
50
100
150
200
250
300
350
FY11 FY12 FY13 FY14 FY15
$ M
illio
ns
Gross Revenue
0
50
100
150
200
250
FY11 FY12 FY13 FY14 FY15
$ M
illio
ns
Revenue
Continuing Trend of Year On Year Gross Revenue And Revenue Growth
Record revenues primarily driven by acquisitions in the dental business and improving performance across all businesses
Gross revenue includes audiology and gross dental revenues before the payment of dentists’ commissions
FY15: $222.2millionFY15: $300.4 million
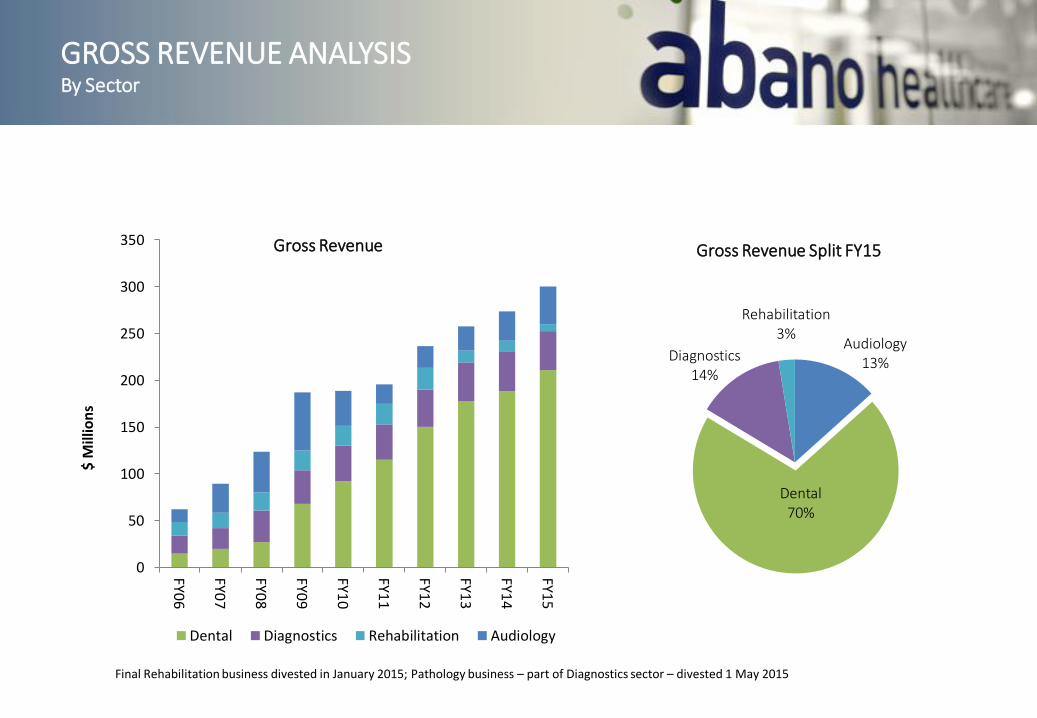
GROSS REVENUE ANALYSISBy Sector
0
50
100
150
200
250
300
350
FY06
FY07
FY08
FY09
FY10
FY11
FY12
FY13
FY14
FY15
$ M
illio
ns
Gross Revenue
Dental Diagnostics Rehabilitation Audiology
Final Rehabilitation business divested in January 2015; Pathology business – part of Diagnostics sector – divested 1 May 2015
Audiology13%
Dental70%
Diagnostics14%
Rehabilitation3%
Gross Revenue Split FY15

GROSS REVENUE ANALYSISFunding Source
82
18
FY15 Including Divested Businesses
Private MOH/DHB/ACC/Other
25
58
18
FY03
Private MOH/DHB ACC
We Invest In Businesses Predominantly Funded By Private Revenue On A Sustainable Fee For Service Basis
FY15 divestment of Pathology and Orthotics businesses which had a high reliance on DHB and ACC funding and fixed price contractsRevenue from private funding is now 92% with less than 3% from NZ DHBs, Ministry of Health and ACC funding
92
3 5
Continuing Operations
Private
MOH/DHB/ACC/Other
Australia Office of Hearing Services
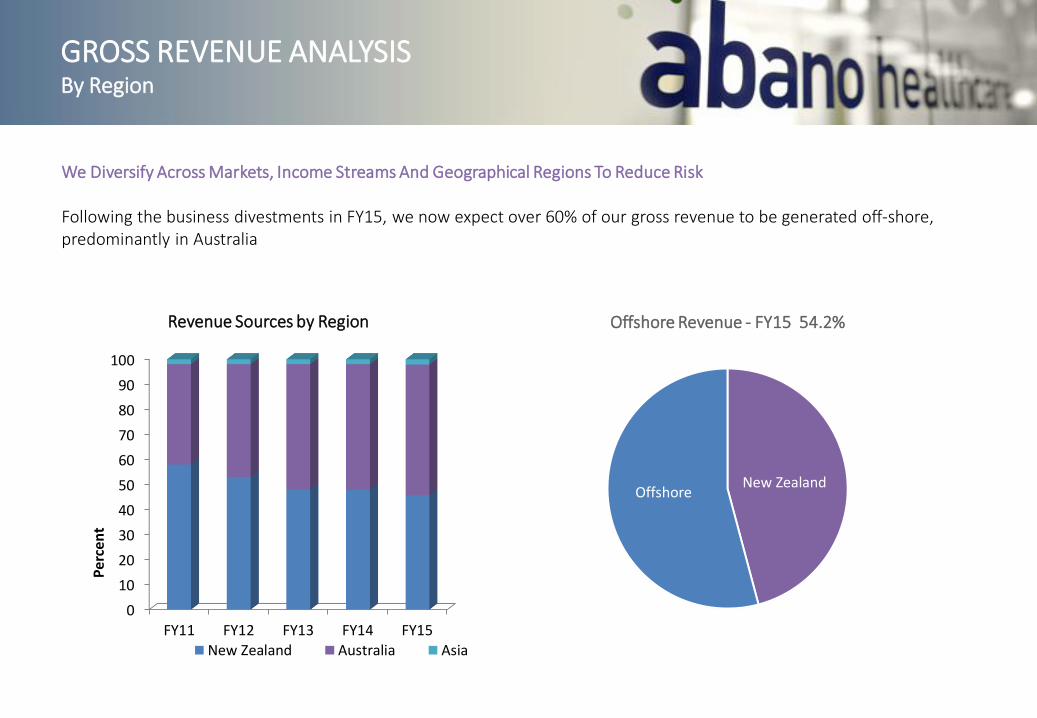
GROSS REVENUE ANALYSISBy Region
0
10
20
30
40
50
60
70
80
90
100
FY11 FY12 FY13 FY14 FY15
Per
cen
t
Revenue Sources by Region
New Zealand Australia Asia
52% Off shore
48% New Zealand
We Diversify Across Markets, Income Streams And Geographical Regions To Reduce Risk
Following the business divestments in FY15, we now expect over 60% of our gross revenue to be generated off-shore, predominantly in Australia
New ZealandOffshore
Offshore Revenue - FY15 54.2%
0
5
10
15
20
25
30
35
FY11 FY12 FY13 Fy14 FY15
$ M
illio
ns
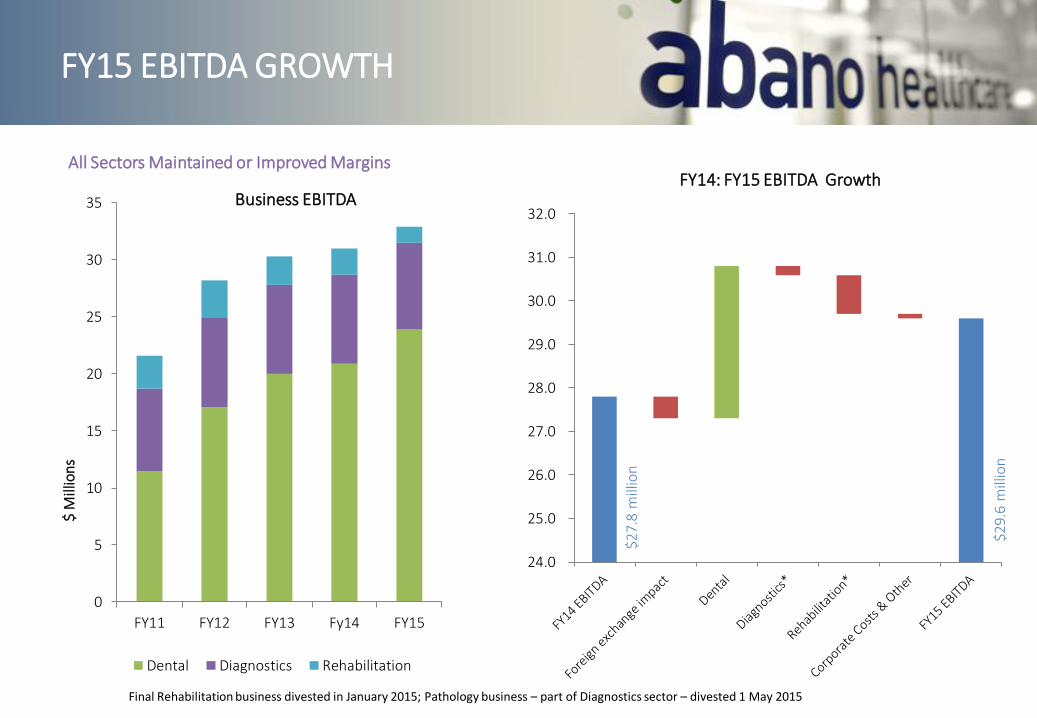
Business EBITDA
Dental Diagnostics Rehabilitation
$29.
6 m
illio
n
24.0
25.0
26.0
27.0
28.0
29.0
30.0
31.0
32.0
FY14: FY15 EBITDA GrowthAll Sectors Maintained or Improved Margins
FY15 EBITDA GROWTH
Final Rehabilitation business divested in January 2015; Pathology business – part of Diagnostics sector – divested 1 May 2015
$27.
8 m
illio
n
0
5
10
15
20
25
30
35
40
FY11 FY12 FY13 FY14 FY15
$ M
illio
ns
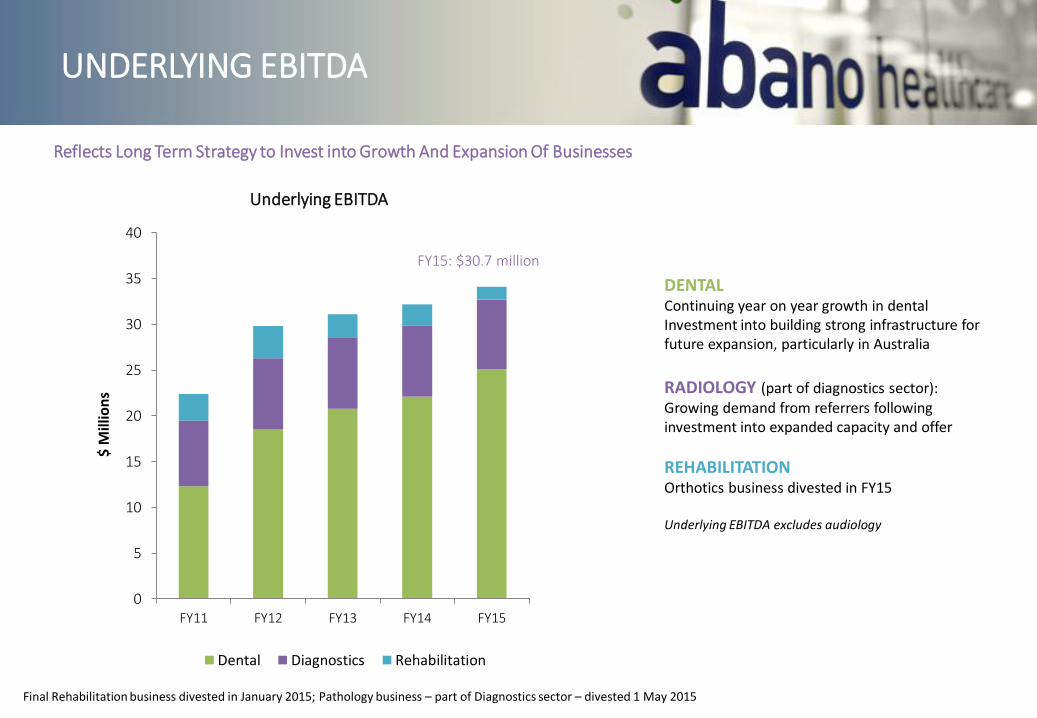
Underlying EBITDA
Dental Diagnostics Rehabilitation
DENTALContinuing year on year growth in dental Investment into building strong infrastructure for future expansion, particularly in Australia
RADIOLOGY (part of diagnostics sector):Growing demand from referrers following investment into expanded capacity and offer
REHABILITATIONOrthotics business divested in FY15
Underlying EBITDA excludes audiology
Final Rehabilitation business divested in January 2015; Pathology business – part of Diagnostics sector – divested 1 May 2015
UNDERLYING EBITDA
Reflects Long Term Strategy to Invest into Growth And Expansion Of Businesses
FY15: $30.7 million

0
2
4
6
8
10
12
14
FY11 FY12 FY13 FY14 FY15$
Mill
ion
s
Capital Expenditure
New Income GeneratingAssets
NormalOperational/ReplacementCosts
ACQUISITIONS AND CAPEX
0
5
10
15
20
25
30
35
40
FY11 FY12 FY13 FY14 FY15
$ M
illio
ns
Acquisitions
Minority Shareholdingin Dental Partners
Dental Acquistitions
Added 20 practices with acquisition of 19 dental practices expected to add additional annualised gross revenue of approximately NZ$30 million (NZ$12.1m and A$16.0m) plus one greenfield dental practice
Three new greenfield audiology stores not included in group capital expenditure due to this being a joint venture business and therefore not consolidated
FY15 represented further investment into the trans-Tasman dental industry
Normal operational and replacement capital expenditure is increasing as the business continues to grow and acquire, but at a rate lower than depreciation
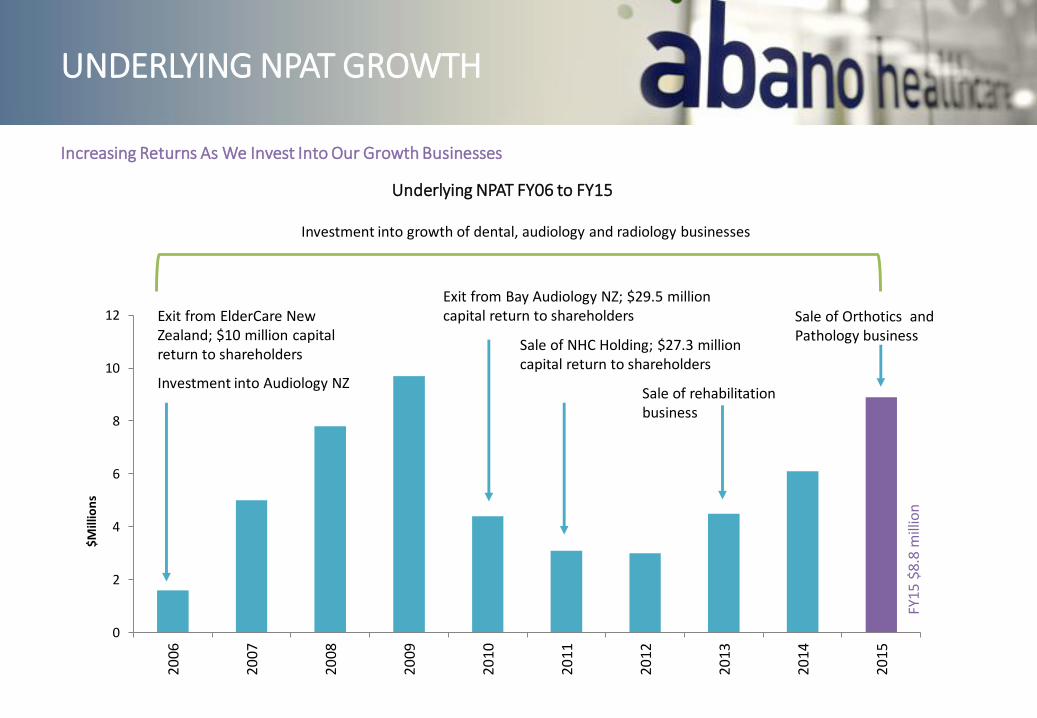
FY15: $8.8 million
FY15: $29.9 million
UNDERLYING NPAT GROWTH
0
2
4
6
8
10
12
2006
2007
2008
2009
2010
2011
2012
2013
2014
2015
$Mill
ion
s
Exit from ElderCare New Zealand; $10 million capital return to shareholders
Investment into Audiology NZ
Exit from Bay Audiology NZ; $29.5 million capital return to shareholders
Sale of NHC Holding; $27.3 million capital return to shareholders
FY15
$8.
8 m
illio
n
Sale of Orthotics and Pathology business
Sale of rehabilitation business
Underlying NPAT FY06 to FY15
Investment into growth of dental, audiology and radiology businesses
Increasing Returns As We Invest Into Our Growth Businesses
UNDERLYING EARNINGS PER SHARE
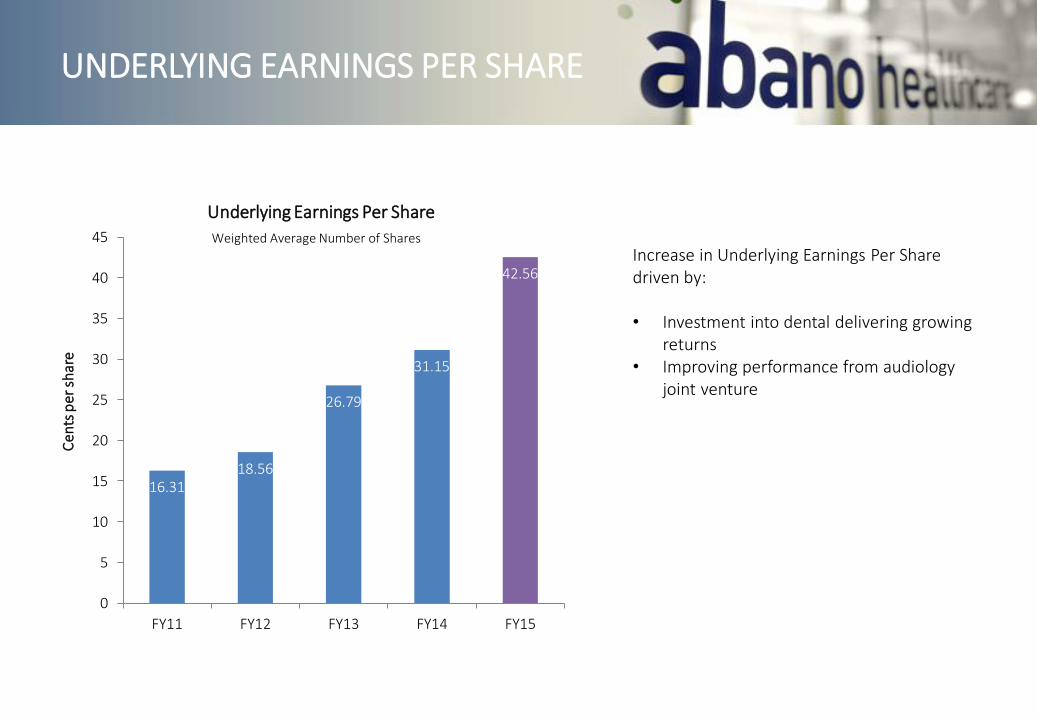
16.3118.56
26.79
31.15
42.56
0
5
10
15
20
25
30
35
40
45
FY11 FY12 FY13 FY14 FY15
Cen
ts p
er s
har
e
Underlying Earnings Per Share
Increase in Underlying Earnings Per Share driven by:
• Investment into dental delivering growing returns
• Improving performance from audiology joint venture
Weighted Average Number of Shares
DIVIDEND
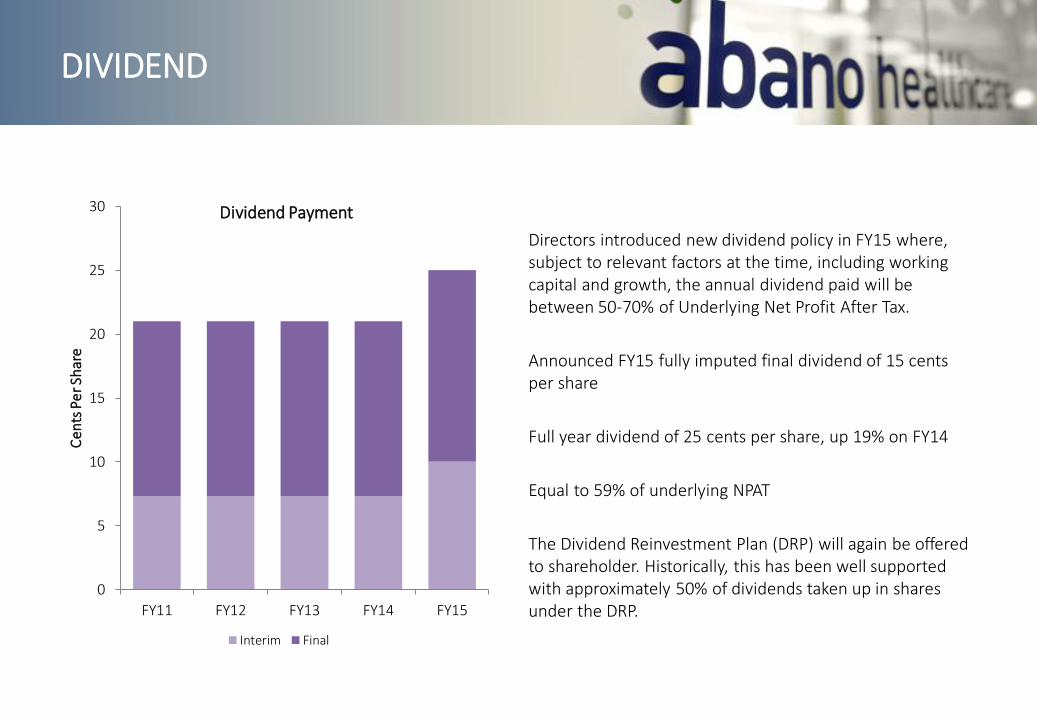
Directors introduced new dividend policy in FY15 where, subject to relevant factors at the time, including working capital and growth, the annual dividend paid will be between 50-70% of Underlying Net Profit After Tax.
Announced FY15 fully imputed final dividend of 15 cents per share
Full year dividend of 25 cents per share, up 19% on FY14
Equal to 59% of underlying NPAT
The Dividend Reinvestment Plan (DRP) will again be offered to shareholder. Historically, this has been well supported with approximately 50% of dividends taken up in shares under the DRP.
0
5
10
15
20
25
30
FY11 FY12 FY13 FY14 FY15
Cen
ts P
er S
har
e
Dividend Payment
Interim Final

SHAREHOLDER RETURNS
$-
$1,000
$2,000
$3,000
$4,000
$5,000
$6,000
$7,000
$8,000
$9,000
2006
2007
2008
2009
2010
2011
2012
2013
2014
1-Ju
n-
15
Cumulative dividends/returns and year end share value
Internal Rate of Return = 54.9% pa
Compound Annual Growth Rate = 31.3% pa
$970 Initial investment into 1,000 shares as at 31 May 2006
$4,962 Capital returns and dividends received between 2006 and 1 June 2015
$8,662 Total value of investment including dividends and capital returns received as at 1 June 2015
$87m Returned to shareholders since 2006
31.3% per annum
Compound annual growth rate compared to NZX50 of 5.5%
Excludes final FY15 dividend
BALANCE SHEET
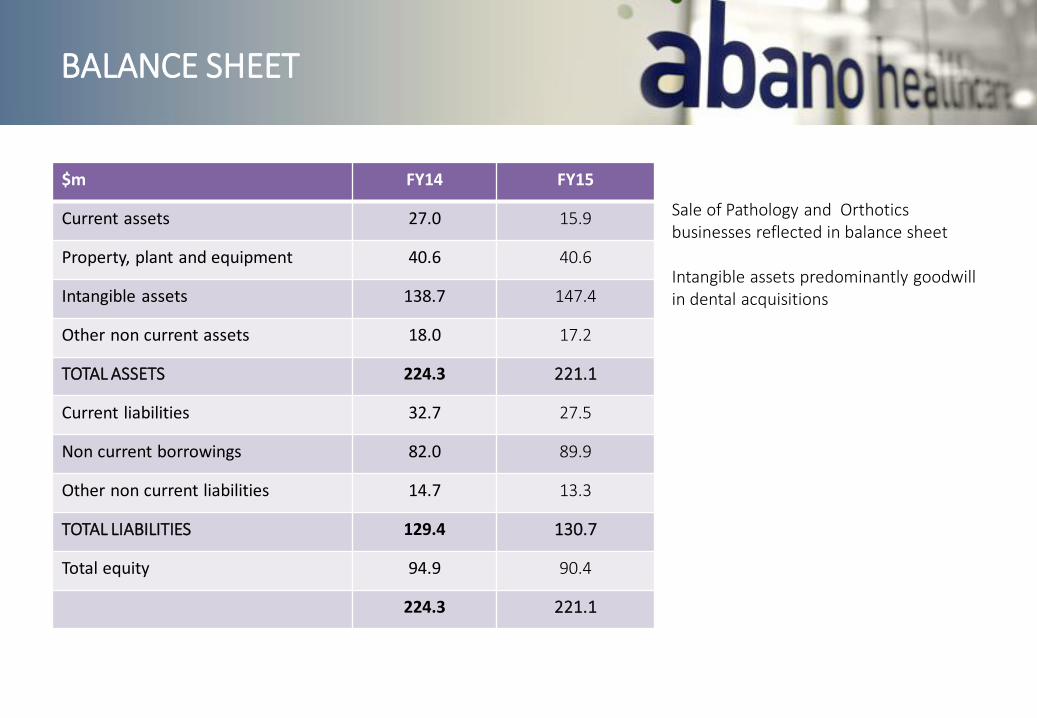
$m FY14 FY15
Current assets 27.0 15.9
Property, plant and equipment 40.6 40.6
Intangible assets 138.7 147.4
Other non current assets 18.0 17.2
TOTAL ASSETS 224.3 221.1
Current liabilities 32.7 27.5
Non current borrowings 82.0 89.9
Other non current liabilities 14.7 13.3
TOTAL LIABILITIES 129.4 130.7
Total equity 94.9 90.4
224.3 221.1
Sale of Pathology and Orthotics businesses reflected in balance sheet
Intangible assets predominantly goodwill in dental acquisitions

BANKING FACILITIES
Australian Bank Facilities As at 31 May 2015
Value ($m)
Expiry Drawn DownAs at 31 May 2015
($m)
Tranche A A$25.0 1 June 2017 A$25.0
Tranche B A$30.0 30 June 2018 A$30.0
Tranche C A$30.0 1 July 2019 A$0.8
NZ Bank FacilitiesAs at 31 May 2015
Tranche A NZ$30.0 15 Dec 2018 NZ$10.2
Tranche B NZ$20.0 30 Sept 2017 NZ$20.0
TOTAL NZ$141.1 NZ$90.0
Cash on Hand NZ$3.9
Net Bank Debt NZ$86.1
Undrawn facilities of over $50 million, providing headroom for continued growth
Fixed interest rates in place for 69% of drawn debt as at 31 May 2015
Extended tenure and improved pricing were agreed during FY15
BUSINESS OVERVIEW

THE OPPORTUNITY IN DENTAL
~14,000Dental Practices
Trans-Tasman dental market is worth approx.
NZ$11 billion
Trans-Tasman Market Ownership
Other
Corporate Consolidators
Huge pool of practices for acquisition and ongoing expansion of Abano’s dental networks on both sides of the Tasman
Growing Acceptance And Popularity Of The Corporate Dental Model
More dentists are choosing to join a corporate dental group
Corporate consolidators own less than 5% of practices and have less than 10% of revenues
Changing workforce: Growing number of females favouring flexible working conditions available in corporate dental model
Predominantly privately funded: Minimal reliance on Government funded contracts; Payment from patients or their health insurance
Long Term Growth Trend: Better Oral Health and retention of natural teeth; More Services on offer; Increasing Demand for Cosmetic Services
ABANO’S DENTAL BUSINESSES
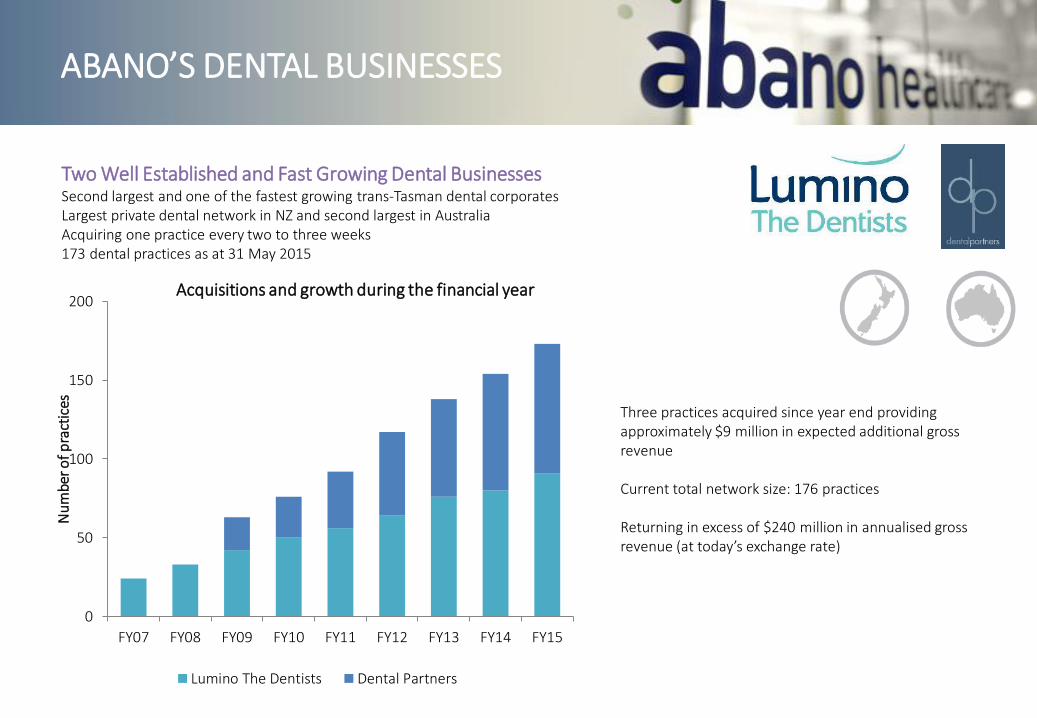
Two Well Established and Fast Growing Dental BusinessesSecond largest and one of the fastest growing trans-Tasman dental corporatesLargest private dental network in NZ and second largest in AustraliaAcquiring one practice every two to three weeks173 dental practices as at 31 May 2015
0
50
100
150
200
FY07 FY08 FY09 FY10 FY11 FY12 FY13 FY14 FY15
Nu
mbe
r of p
ract
ices
Acquisitions and growth during the financial year
Lumino The Dentists Dental Partners
Three practices acquired since year end providing approximately $9 million in expected additional gross revenue
Current total network size: 176 practices
Returning in excess of $240 million in annualised gross revenue (at today’s exchange rate)
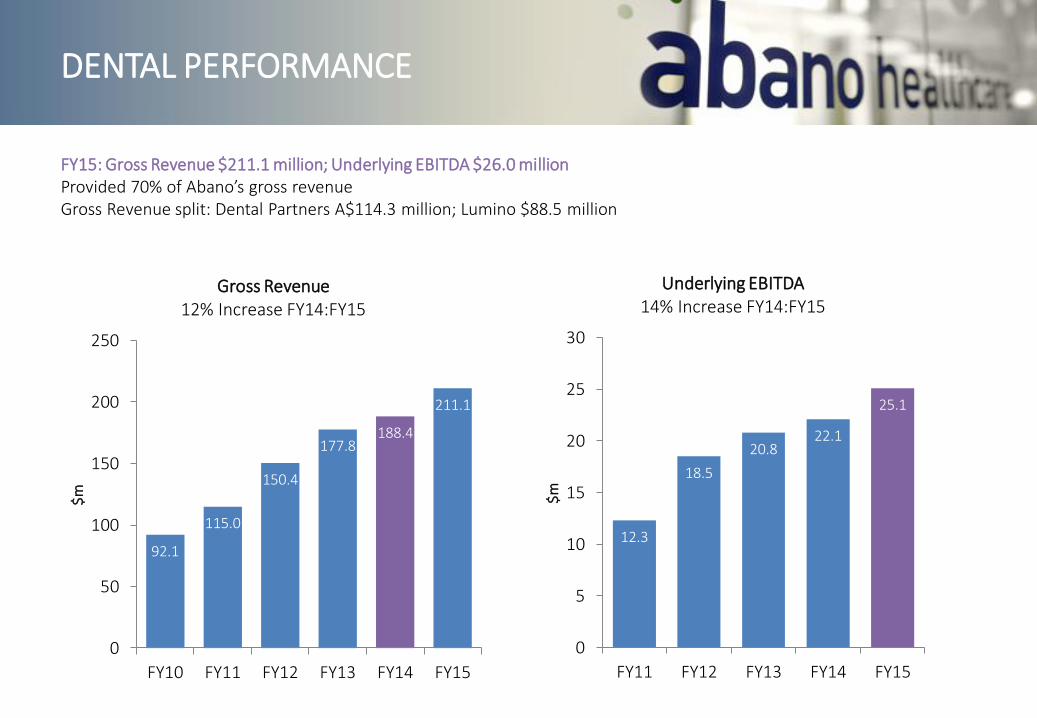
FY15: Gross Revenue $211.1 million; Underlying EBITDA $26.0 millionProvided 70% of Abano’s gross revenueGross Revenue split: Dental Partners A$114.3 million; Lumino $88.5 million
92.1
115.0
150.4
177.8188.4
211.1
0
50
100
150
200
250
FY10 FY11 FY12 FY13 FY14 FY15
$m
Gross Revenue12% Increase FY14:FY15
12.3
18.5
20.822.1
25.1
0
5
10
15
20
25
30
FY11 FY12 FY13 FY14 FY15
$m
Underlying EBITDA14% Increase FY14:FY15
DENTAL PERFORMANCE
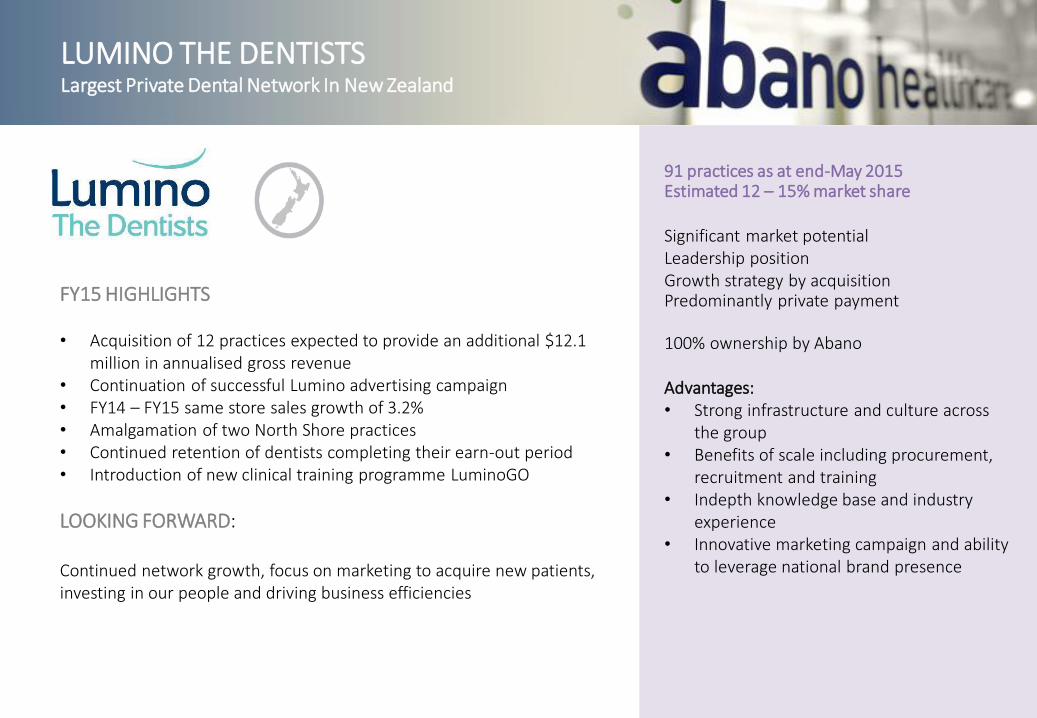
LUMINO THE DENTISTSLargest Private Dental Network In New Zealand
91 practices as at end-May 2015Estimated 12 – 15% market share
Significant market potentialLeadership positionGrowth strategy by acquisitionPredominantly private payment
100% ownership by Abano
Advantages: • Strong infrastructure and culture across
the group• Benefits of scale including procurement,
recruitment and training• Indepth knowledge base and industry
experience• Innovative marketing campaign and ability
to leverage national brand presence
FY15 HIGHLIGHTS
• Acquisition of 12 practices expected to provide an additional $12.1 million in annualised gross revenue
• Continuation of successful Lumino advertising campaign• FY14 – FY15 same store sales growth of 3.2%• Amalgamation of two North Shore practices• Continued retention of dentists completing their earn-out period• Introduction of new clinical training programme LuminoGO
LOOKING FORWARD:
Continued network growth, focus on marketing to acquire new patients, investing in our people and driving business efficiencies
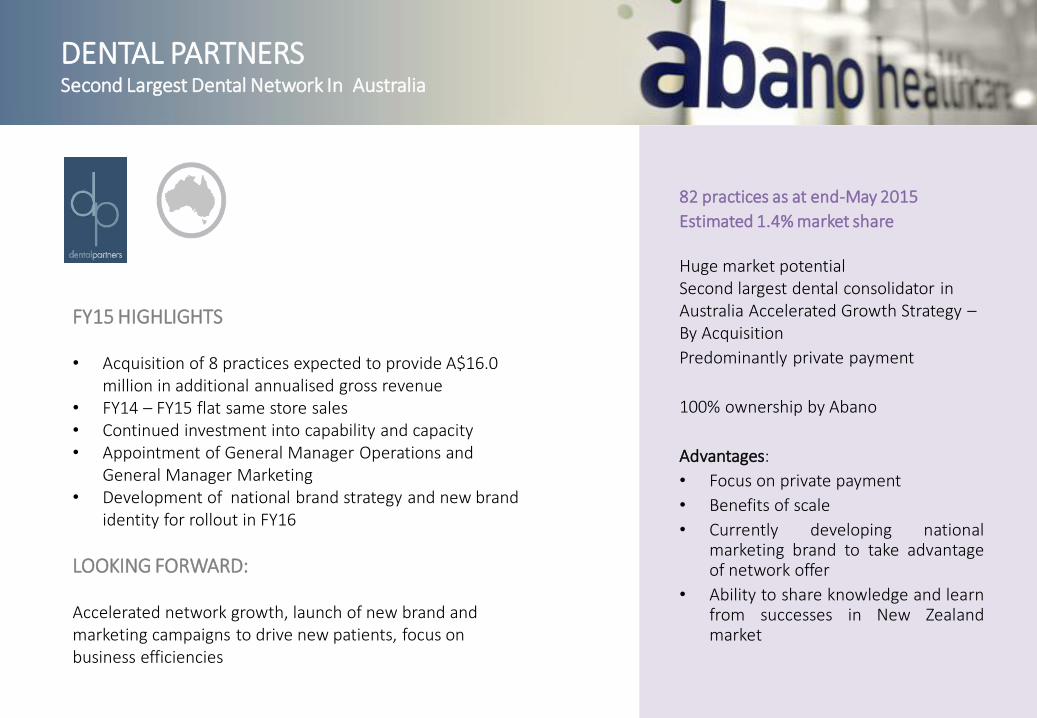
DENTAL PARTNERSSecond Largest Dental Network In Australia
82 practices as at end-May 2015
Estimated 1.4% market share
Huge market potentialSecond largest dental consolidator in Australia Accelerated Growth Strategy –By Acquisition
Predominantly private payment
100% ownership by Abano
Advantages:
• Focus on private payment
• Benefits of scale
• Currently developing nationalmarketing brand to take advantageof network offer
• Ability to share knowledge and learnfrom successes in New Zealandmarket
FY15 HIGHLIGHTS
• Acquisition of 8 practices expected to provide A$16.0 million in additional annualised gross revenue
• FY14 – FY15 flat same store sales• Continued investment into capability and capacity• Appointment of General Manager Operations and
General Manager Marketing • Development of national brand strategy and new brand
identity for rollout in FY16
LOOKING FORWARD:
Accelerated network growth, launch of new brand and marketing campaigns to drive new patients, focus on business efficiencies
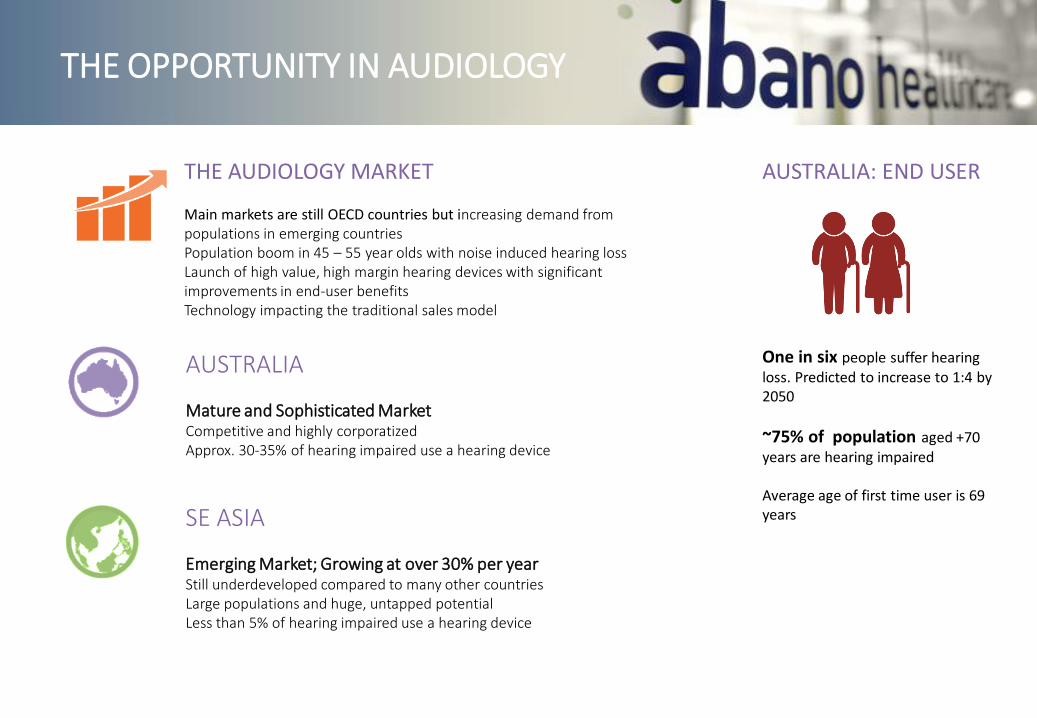
THE OPPORTUNITY IN AUDIOLOGY
AUSTRALIA
Mature and Sophisticated MarketCompetitive and highly corporatizedApprox. 30-35% of hearing impaired use a hearing device
THE AUDIOLOGY MARKET
Main markets are still OECD countries but increasing demand from populations in emerging countriesPopulation boom in 45 – 55 year olds with noise induced hearing lossLaunch of high value, high margin hearing devices with significant improvements in end-user benefitsTechnology impacting the traditional sales model
AUSTRALIA: END USER
One in six people suffer hearing loss. Predicted to increase to 1:4 by 2050
~75% of population aged +70 years are hearing impaired
Average age of first time user is 69 yearsSE ASIA
Emerging Market; Growing at over 30% per year Still underdeveloped compared to many other countriesLarge populations and huge, untapped potentialLess than 5% of hearing impaired use a hearing device

FY15: Gross Revenue $40.1 million; Underlying EBITDA $2.0 millionProvided 13% of Abano’s gross revenue
20.823.4
25.8
31.6
40.1
0
5
10
15
20
25
30
35
40
45
FY11 FY12 FY13 FY14 FY15
$ m
Gross Revenue27% Increase FY14:FY15
-6.9
-8.0-7.7
-2.8
2.0
-8.0
-6.0
-4.0
-2.0
0.0
2.0
FY11 FY12 FY13 FY14 FY15
$ m
Underlying EBITDAIncrease FY14:FY15
AUDIOLOGY PERFORMANCE
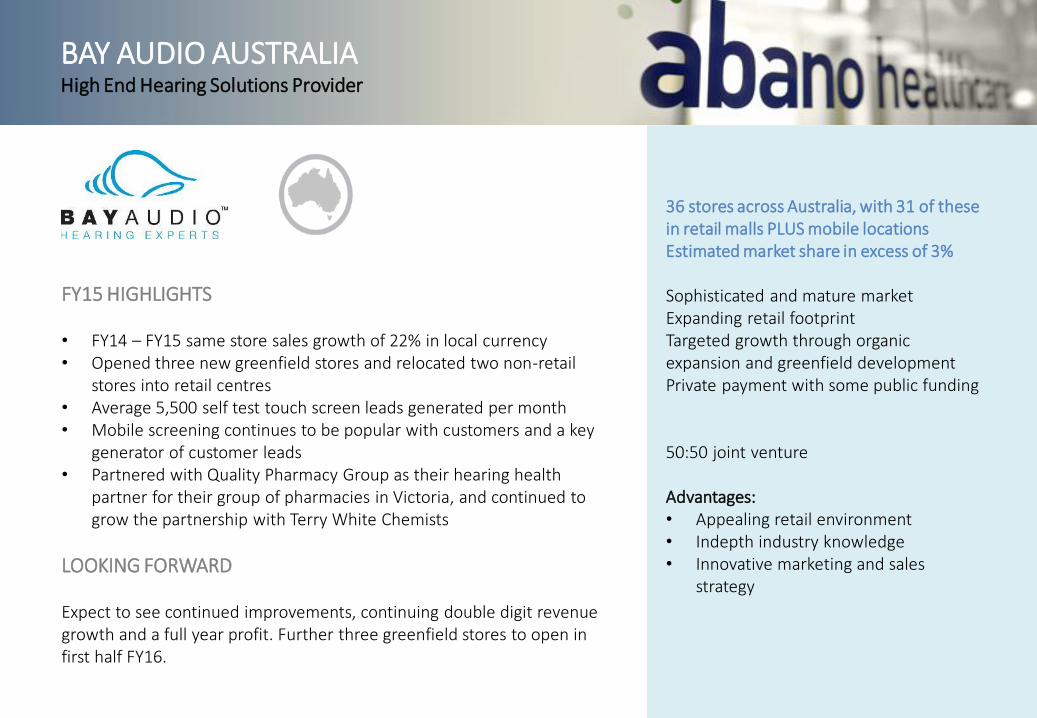
BAY AUDIO AUSTRALIAHigh End Hearing Solutions Provider
36 stores across Australia, with 31 of these in retail malls PLUS mobile locationsEstimated market share in excess of 3%
Sophisticated and mature marketExpanding retail footprintTargeted growth through organic expansion and greenfield developmentPrivate payment with some public funding
50:50 joint venture
Advantages:• Appealing retail environment• Indepth industry knowledge• Innovative marketing and sales
strategy
FY15 HIGHLIGHTS
• FY14 – FY15 same store sales growth of 22% in local currency • Opened three new greenfield stores and relocated two non-retail
stores into retail centres• Average 5,500 self test touch screen leads generated per month• Mobile screening continues to be popular with customers and a key
generator of customer leads• Partnered with Quality Pharmacy Group as their hearing health
partner for their group of pharmacies in Victoria, and continued to grow the partnership with Terry White Chemists
LOOKING FORWARD
Expect to see continued improvements, continuing double digit revenue growth and a full year profit. Further three greenfield stores to open in first half FY16.

BAY AUDIO ASIA
14 stores in Taiwan plus 4 in Singapore and 3 in Malaysia
Significant untapped market potential
Small investments into test marketsVery small part of Bay International groupPrivate payment
Advantages• Introducing a new way for consumers
to access hearing health in Asia• Industry knowledge and experience• Independent of manufacturing chains• Local teams in each market
FY15 HIGHLIGHTS
• Focus on growth in Taiwan, our largest opportunity (13 stores), along with Singapore (4 stores) and Malaysia (3 stores)
• Continued to invest into upskilling management and retail staff, witha focus on conversion and driving sale
LOOKING FORWARD
Now under the oversight of the proven Australian team. Focus ondelivering breakeven performance in a more challenging market
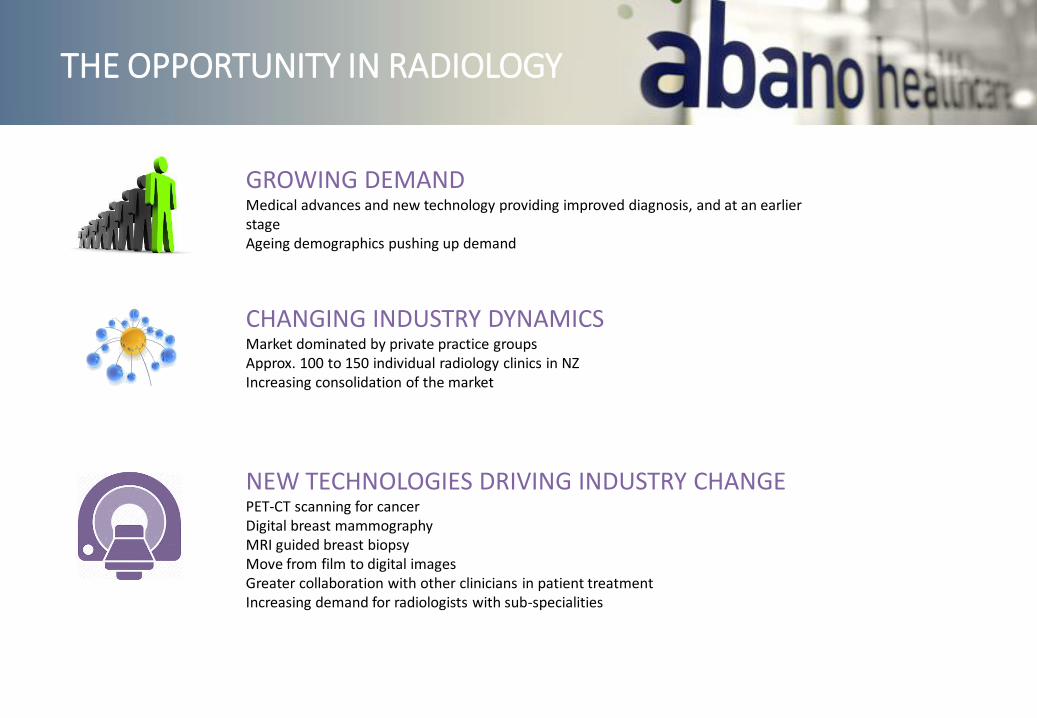
THE OPPORTUNITY IN RADIOLOGY
GROWING DEMANDMedical advances and new technology providing improved diagnosis, and at an earlier stageAgeing demographics pushing up demand
NEW TECHNOLOGIES DRIVING INDUSTRY CHANGEPET-CT scanning for cancerDigital breast mammographyMRI guided breast biopsyMove from film to digital imagesGreater collaboration with other clinicians in patient treatmentIncreasing demand for radiologists with sub-specialities
CHANGING INDUSTRY DYNAMICSMarket dominated by private practice groupsApprox. 100 to 150 individual radiology clinics in NZIncreasing consolidation of the market
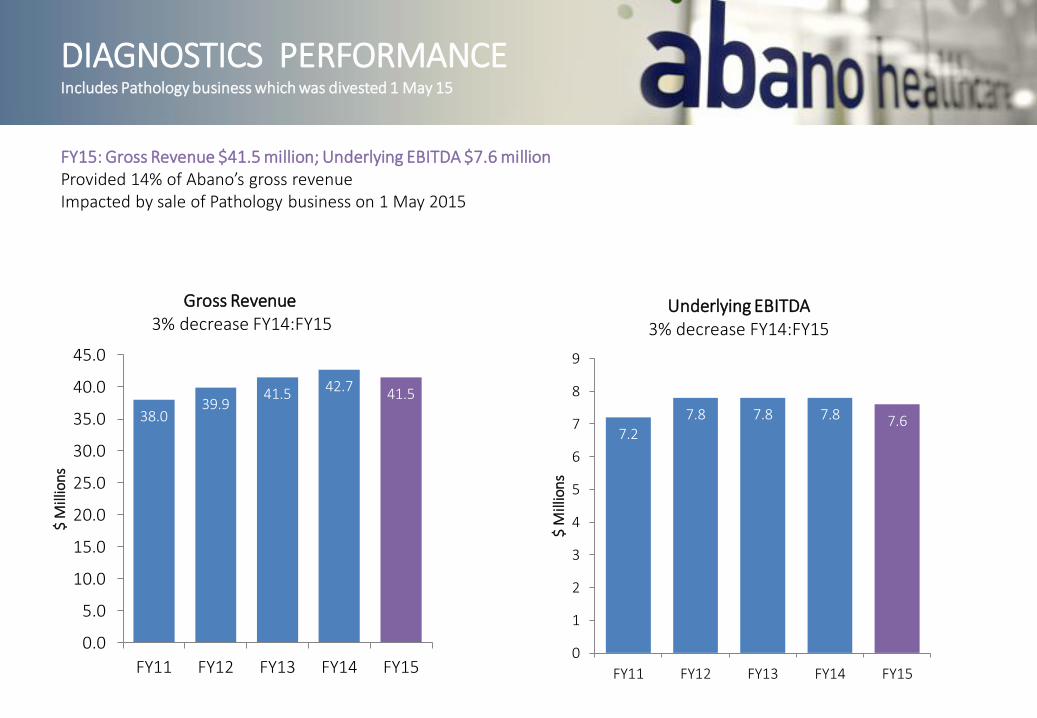
38.039.9
41.5 42.7 41.5
0.0
5.0
10.0
15.0
20.0
25.0
30.0
35.0
40.0
45.0
FY11 FY12 FY13 FY14 FY15
$ M
illio
ns
Gross Revenue3% decrease FY14:FY15
7.27.8 7.8 7.8 7.6
0
1
2
3
4
5
6
7
8
9
FY11 FY12 FY13 FY14 FY15
$ M
illio
ns
Underlying EBITDA3% decrease FY14:FY15
FY15: Gross Revenue $41.5 million; Underlying EBITDA $7.6 millionProvided 14% of Abano’s gross revenueImpacted by sale of Pathology business on 1 May 2015
DIAGNOSTICS PERFORMANCEIncludes Pathology business which was divested 1 May 15
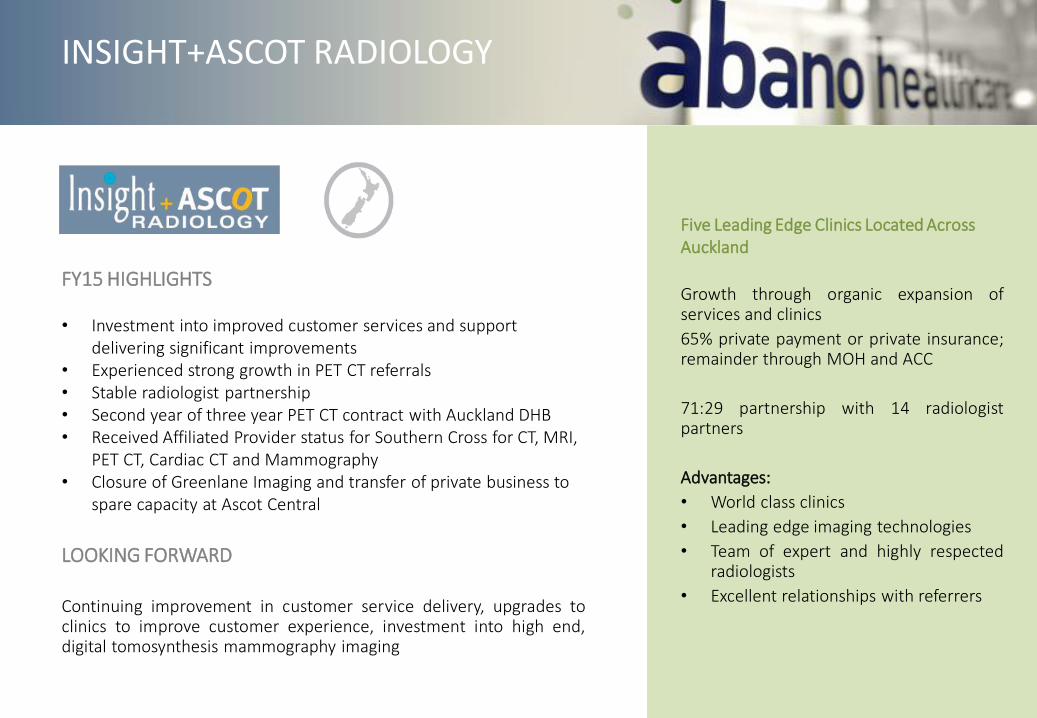
Five Leading Edge Clinics Located Across Auckland
Growth through organic expansion ofservices and clinics
65% private payment or private insurance;remainder through MOH and ACC
71:29 partnership with 14 radiologistpartners
Advantages:
• World class clinics
• Leading edge imaging technologies
• Team of expert and highly respectedradiologists
• Excellent relationships with referrers
INSIGHT+ASCOT RADIOLOGY
FY15 HIGHLIGHTS
• Investment into improved customer services and support delivering significant improvements
• Experienced strong growth in PET CT referrals• Stable radiologist partnership• Second year of three year PET CT contract with Auckland DHB• Received Affiliated Provider status for Southern Cross for CT, MRI,
PET CT, Cardiac CT and Mammography• Closure of Greenlane Imaging and transfer of private business to
spare capacity at Ascot Central
LOOKING FORWARD
Continuing improvement in customer service delivery, upgrades toclinics to improve customer experience, investment into high end,digital tomosynthesis mammography imaging

INVESTING TODAY FOR TOMORROW
DEMAND FOR HEALTHCARE IS ESCALATING RAPIDLY
• People are living longer than even before
• Healthier lifestyles and medical advances are improving longevity
• As people age, they require more healthcare
• New technologies are providing better and more accurate diagnosis
• People want access to healthcare now, not when they reach the top of a waiting list
• People want their choice of healthcare provider
PRIVATE HEALTHCARE IS NOW AN ESSENTIAL AND INDESPENSIBLE PART OF THE HEALTHCARE SECTOR
• Governments can no longer fund the public appetite and need for healthcare services
• The role of private healthcare providers has become an essential part of the healthcare sector
ABANO: INVESTING TODAY FOR TOMORROW
• For the past 15 years, we’ve been planning for a future of increasing demand
• We have invested in private healthcare and medical services businesses in sectors where we see significant growth potential
• We invest into businesses which generate most of their income from private payment, either from individuals or their healthcare insurance provider
• We will keep investing in our businesses; into helping them to grow, build capability and gain market share
• We are well positioned to become a competitive and profitable large scale provider in our target sectors.
ABANO - LOOKING FORWARD
INVESTMENT INTO GROWTH
Expansion of targeted businesses in sectors with identified growth potential
Dental practice acquisition and organic growth in dental
Organic growth and greenfield store openings in audiology
New modalities and services in radiology
EFFICIENT USE OF FUNDS
Capital deployment towards higher growth, higher return businesses
In particular, dental and audiology
INVEST INTO TALENTED PEOPLE
Recruit and retain the best possible talent
Invest into our people to help them realise their potential
Create world class working environments and foster cultures that recognise excellence
DELIVER IMPROVING SHAREHOLDER RETURNS
Dividends in line with new policy
Improving underlying EBITDA and underlying NPAT
QUESTIONS
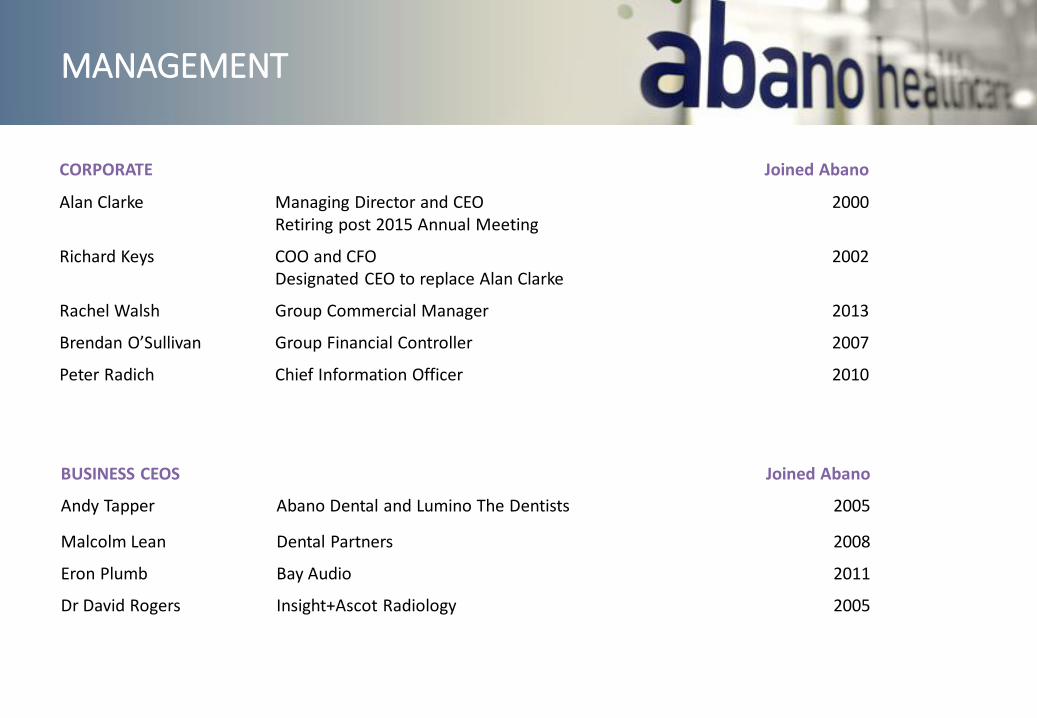
MANAGEMENT
CORPORATE Joined Abano
Alan Clarke Managing Director and CEORetiring post 2015 Annual Meeting
2000
Richard Keys COO and CFODesignated CEO to replace Alan Clarke
2002
Rachel Walsh Group Commercial Manager 2013
Brendan O’Sullivan Group Financial Controller 2007
Peter Radich Chief Information Officer 2010
BUSINESS CEOS Joined Abano
Andy Tapper Abano Dental and Lumino The Dentists 2005
Malcolm Lean Dental Partners 2008
Eron Plumb Bay Audio 2011
Dr David Rogers Insight+Ascot Radiology 2005

GLOSSARY
• Revenue excludes any audiology revenues, as this is a joint venture and is therefore equity accounted, and only includes Australian dental revenues after the payment of dentists’ commissions.
• Gross revenue is reported within the segment note in the Financial Statements and includes audiology revenues and Australian dental revenues before payment of dentists’ commissions.
• Earnings Before Interest, Tax, Depreciation and Amortisation (“EBITDA”) is reported within the segment note in the Financial Statements and is Net Profit After Tax (“NPAT”) excluding GAAP compliant net finance expenses, gains/losses arising on sale of businesses, equity accounted investments, non-controlling interests, tax, depreciation and amortisation costs. Particularly, it excludes profit/losses generated by the Bay Group, in which Abano holds a 50% shareholding. Due to this being a joint venture, the results for the Bay Group are equity accounted and therefore not included in the consolidated EBITDA.
• Underlying earnings are reported for both NPAT (a GAAP compliant measure) and EBITDA (a non-GAAP financial measure) and excludes gains/losses arising on sale of businesses, IFRS adjustments and impairments, including their tax effect. Both measures are reconciled back to reported NPAT. It is the measure used within the Company to evaluate performance, establish strategic goals and to allocate resources.
• More information on gross revenue and underlying earnings, which are non-GAAP financial measures and are not prepared in accordance with NZ IFRS, is available on the Abano website at www.abano.co.nz/underlyingearnings.
DISCLAIMER
This Company presentation dated 29 July 2015 includes comment on Abano’s financial performance including financial results for the year ended 31 May 2015, which were released by Abano Healthcare Group on 29 July 2015. As such, it should be read in conjunction with, and subject to, the explanations and views provided in that material.
• The information in this presentation is an overview and does not contain all information necessary to make an investment decision. It is intended to constitute a summary of certain information relating to the performance of Abano Healthcare Group (“Abano”).
• The information in this presentation does not purport to be a complete description of Abano. This presentation is not investment advice or financial advice. Abano, its directors and employees do not give or make any recommendation or opinion in relation to acquiring or disposing of Abano shares. In making an investment decision, investors must rely on their own examination of Abano, including the merits and risks involved. Investors should consult with their own legal, tax, business and/or financial advisors in connection with any acquisition of securities.
• The information contained in this presentation has been prepared in good faith by Abano. No representation or warranty, express or implied, is made as to the accuracy, adequacy or reliability of any statements, estimates or opinions or other information contained in this presentation, any of which may change without notice. To the maximum extent permitted by law, Abano, its directors, officers, employees and agents disclaim all liability and responsibility (including without limitation any liability arising from fault or negligence on the part of Abano, its directors, officers, employees and agents) for any direct or indirect loss or damage which may be suffered by any recipient through use of or reliance on anything contained in, or omitted from, this presentation.
• This presentation is not a prospectus, investment statement or disclosure document, or an offer of shares for subscription, or sale, in any jurisdiction.
• This presentation includes non-GAAP financial measures in various sections. This information has been included on the basis thatmanagement and the Board believe that this information assists readers with key drivers of the performance of Abano which are not disclosed as part of the financial statements.
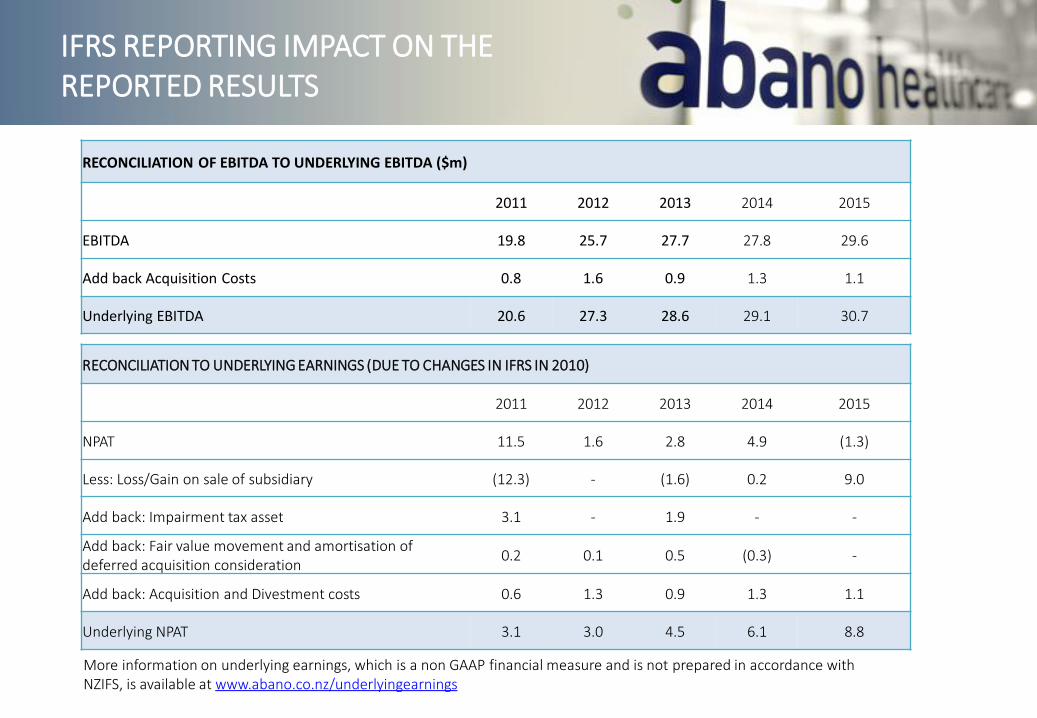
IFRS REPORTING IMPACT ON THE REPORTED RESULTS
RECONCILIATION OF EBITDA TO UNDERLYING EBITDA ($m)
2011 2012 2013 2014 2015
EBITDA 19.8 25.7 27.7 27.8 29.6
Add back Acquisition Costs 0.8 1.6 0.9 1.3 1.1
Underlying EBITDA 20.6 27.3 28.6 29.1 30.7
RECONCILIATION TO UNDERLYING EARNINGS (DUE TO CHANGES IN IFRS IN 2010)
2011 2012 2013 2014 2015
NPAT 11.5 1.6 2.8 4.9 (1.3)
Less: Loss/Gain on sale of subsidiary (12.3) - (1.6) 0.2 9.0
Add back: Impairment tax asset 3.1 - 1.9 - -
Add back: Fair value movement and amortisation of deferred acquisition consideration
0.2 0.1 0.5 (0.3) -
Add back: Acquisition and Divestment costs 0.6 1.3 0.9 1.3 1.1
Underlying NPAT 3.1 3.0 4.5 6.1 8.8
More information on underlying earnings, which is a non GAAP financial measure and is not prepared in accordance with NZIFS, is available at www.abano.co.nz/underlyingearnings