annual report for the year ended 30 june 2015 - ecograf
TRANSCRIPT

Annual Report for the Year Ended
30 June 2015
ABN 15 117 330 757

CORPORATE DIRECTORY
Directors
Andrew Spinks – Managing Director
Grant Pierce – Executive Director Projects
John Conidi – Non-Executive Director
Company Secretary
Robert Hodby
Registered and Principal Office
338 Hay Street
Subiaco WA 6008
Telephone: +61 8 6830 1003
Facsimile: +61 8 6380 1026
Internet: www.kibaranresources.com
Email: [email protected]
Share Registry
Link Market Services Limited
Level 12, 680 George Street
Sydney NSW 2000
Telephone: +61 2 8280 7111
Facsimile: +61 2 9287 0303
Solicitor
Steinepreis Paganin
Level 12, 60 Carrington Street
Sydney NSW 2000
Telephone: +61 2 8915 1000
Facsimile: +61 2 8916 2000
Auditor
Ernst & Young
11 Mounts Bay Road
Perth, WA 6000
Telephone: +61 8 9429 2222
Facsimile: +61 8 9429 2435
Banker
Westpac Banking Corporation
109 St Georges Terrace
Perth WA 6000
Stock Exchange Listing
Australian Securities Exchange
ASX Code: KNL
Fully paid ordinary shares

1
Page
Review of Operations 2
Directors’ Report 8
Corporate Governance Statement 20
Auditor’s Independence Declaration 27
Statement of Comprehensive Income 28
Statement of Financial Position 29
Statement of Changes in Equity 30
Statement of Cash Flows 31
Notes to the Financial Statements 32
Directors’ Declaration 65
Independent Auditor’s Report 66
ASX Additional Information 68

REVIEW OF OPERATIONS
2
Kibaran Resources made significant progress during the reporting period at its flagship Epanko Graphite Project within the Mahenge Project Area in southeast Tanzania. A number of milestones were achieved, which positions the Company to make further progress in the upcoming year ahead of production commencement scheduled for 2017. Our strategy is to develop the Company’s three Tanzanian graphite projects as a globally competitive East African graphite mining and processing hub ideally placed to service growing market opportunities in Europe. HIGHLIGHTS EPANKO GRAPHITE PROJECT - Tanzania
• Proved and Probable Ore Reserves of 10.9Mt at 8.6% TGC • Bankable Feasibility Study Completed:
- NPV (pre-tax) US$197.4m - IRR (pre-tax) 41.2% - Capital expenditure: US$77.5m - Annual EBITDA of US$33.6m for 15 years - Payback 2.7 years with 25 year mine life - Strip Ratio (W:O) 1:1 LOM
• Mining Licence and Environmental Approvals in place • Testwork demonstrates Epanko graphite is of superior quality with significant commercial advantages • 75% planned production supported by offtake and sales agreements with German-European interests • In principle eligibility for Loan guarantee received from German Government • Completion of Battery Manufacturing Facility Study highlights robust economics of downstream value-
added processing • Debt financing discussions for mine construction commenced
MERELANI-ARUSHA GRAPHITE PROJECT - Tanzania
• Maiden mineral resource estimate of 17.2Mt at 6.5% TGC for 1.12Mt of contained graphite
CORPORATE
• Successful completion of equity raisings, with $7.2 million raised in two oversubscribed placements and strong shareholder support for $1.5 million Share Purchase Plan
• Appointment of experienced Graphite Specialist to further develop portfolio of graphite projects
Project Locations

REVIEW OF OPERATIONS
3
EPANKO GRAPITE PROJECT (100% KNL) The Epanko Graphite Project is located 245km southwest of Morogoro in southeast Tanzania within the Mahenge Graphite Project Area. During the reporting period, Kibaran made substantial progress on the project, achieving a number of milestones in Epanko’s pre-development phase.
BANKABLE FEASIBILITY STUDY
Kibaran achieved a significant milestone with the successful completion of the Bankable Feasibility Study (BFS), which confirmed that Epanko is both technically and financially viable with robust project economics.
A management summary of the BFS was released to market subsequent to the reporting period. Key project points include:
Technical:
• Annual production rate of 40,000 tonnes of graphite concentrate for the first 15 years, and then averaging 31,300tpa for the remaining 10 years
• Long mine life of 25 years based only on current Reserves • Uncomplicated mining and production operation via a conventional open cut mine and
conventional flotation processing plant • Demonstrated metallurgical testwork indicates a very high proportion of large flake graphite with
85.7% of the flake distribution greater than +106 micron • Exceptional final average carbon concentrates of 96.3%
Financial:
• Annual EBITDA of US$33.6m for 15 years • Net Present Value (pre-tax)of US$197.4m • Internal Rate of Return (pre-tax) of 41.2% • Revenue Price of US$1,446/t of concentrate • OPEX FOB Dar es Salaam of US$570/t • Project Capital Expenditure of US$77.5m
MAIDEN ORE RESERVE ESTIMATE
The completion of a positive BFS resulted in a maiden Ore Reserve Estimate, which underpins the 25-year mine life, being declared.
Ore Reserve Statement >5% TGC
JORC Classification Tonnage (Mt) TGC Grade (%) Contained Graphite (t) Proved 8.0 8.3 659,000 Probable 2.9 9.6 279,000
TOTAL 10.9 8.6 938,000
The Ore Reserve Estimate is based on and inclusive of the Measured and Indicated Mineral Resource that was upgraded during the reporting period.
Approximately 62% of the JORC 2012 Resource Estimate is now in the Measured and Indicated categories.
Mineral Resource Estimate for Epanko Deposit >8% TGC, June 2015
JORC Classification Tonnage (Mt) TGC Grade (%) Contained Graphite (t) Measured 6.6 9.7 635,800 Indicated 7.9 10.0 785,300 Inferred 8.8 8.7 773,500 TOTAL 23.3 9.4 2,194,600 Tonnage figures contained within tables have been rounded to nearest 100,000. % TGC grades are rounded to 1 decimal figure. Abbreviations used: Mt = 1,000,000 tonnes. Rounding errors may occur in tables.

REVIEW OF OPERATIONS
4
REGULATORY APPROVALS
During the reporting period, Kibaran advised it had been granted a Mining Licence for Epanko by the Ministry of Energy and Minerals of Tanzania. The licence covers an area of 9.49 square kilometres and is for a period of 10 years, the maximum period under Tanzanian legislation but renewable for subsequent 10 year periods.
Kibaran received Epanko’s Environmental Impact Assessment Certificate in May 2015, which was the first to be issued for a graphite project within Tanzania since the historic Graphtan Graphite Mine at Merelani was in operation in the 1990s.
TESTWORK CONFIRMS SUPERIOR GRAPHITE QUALITY
Testwork undertaken by an independent, specialised German graphite laboratory demonstrated the suitability of Epanko’s graphite for the production of Expandable Graphite Salt (also referred to as Graphite Intercalation Compound).
The specifications of the Epanko graphite confirmed that Kibaran is in possession of a graphite source that provides a significant competitive advantage, particularly compared against graphite mined in major graphite producer, China.
Additionally, the testwork confirmed that Epanko graphite can be used in a wide range of applications, from basic uses such as refractories to sophisticated applications of anode grade graphite for Lithium-ion batteries and expandable graphite for graphite foil production.
OFF-TAKE AGREEMENT AND FUNDING GUARANTEE
Subsequent to the reporting period, Kibaran announced it had executed an off-take agreement with ThyssenKrupp Metallurgical Products GmbH, a subdivision of the Materials Services business area of the substantial German multi-national conglomerate, ThyssenKrupp Group.
Under the terms of an exclusive long-term commercial off-take agreement, Kibaran will sell a minimum of 20,000tpa of refractory grade natural flake graphite in Europe, Turkey, Russia, Ukraine and Korea. The term of the agreement is 10 years, with an option to extend for five years.
Combined with the existing agreement with the European Graphite Trader (December 2013), 75% of planned graphite production at Epanko is now supported by binding off-take and sales agreements.
Following on from the ThyssenKrupp off-take agreement, Kibaran received confirmation of ‘in-principle eligibility for cover’ for a loan guarantee for Epanko by the German Government. The confirmation is a significant milestone in the Epanko funding process as it sets up Kibaran to formally receive a United Term Loan Guarantee - Ungebundener Finanzkredit (‘UFK’) - from the German state-owned KfW-IPEX Bank, which has a strong track record in the mining sector in Africa and globally.
The UFK potentially significantly de-risks the funding of Epanko as it provides eligible lenders insurance against commercial and political risk. The UFK is subject to project finance.
BATTERY MANUFACTURING FACILITY STUDY
Subsequent to the reporting period, Kibaran released the results of its Battery Grade Graphite Scoping Study, which highlights robust economics, and a compelling business case for the development in Tanzania of a Manufacturing Facility to participate in downstream value added processing. This is driven by an exponential growth in graphite demand forecasted over the next five year from electric vehicle (EV) and Battery Storage industries.
Testwork confirms Epanko Graphite is well suited for the production of Spherical Graphite and other purified graphite products.
Manufacturing is scheduled to commence 12 to 18 months into Stage 1 of the Epanko Graphite Project expanding to production of 15,000tpa, and increasing to 50,000tpa over three stages.
Key Results:
• Pre-tax NPV10 – US$155m • Pre-tax IRR - 51% • Capital Expenditure – US$35m • Annual pre-tax cashflow of US$18m based on Stage 1 • Payback: 1.9 years
Discussions have commenced with strategic industry partners to jointly fund the feasibility study and ultimately capital expenditure through direct investment into the project.

REVIEW OF OPERATIONS
5
MERELANI-ARUSHA GRAPITE PROJECT (100% KNL) The Merelani-Arusha Graphite Project consists of seven tenements and covers 973.4km2 in an area 55km southeast of Arusha, Tanzania. Like Mahenge, the project area is located in geological settings favourable for graphite mineralisation.
MAIDEN RESOURCE
The Merelani-Arusha Project, located in Tanzania, provides Kibaran with a potential second source of graphite production from the Merelani East Deposit.
During the reporting period, Kibaran announced the maiden JORC-compliant Mineral Resource for Merelani East (>5% TGC):
JORC Classification Tonnage (Mt) TGC Grade (%) Contained Graphite (t) Inferred 17.2 6.5 1,120,000
The mineral resource estimate covers only 15% of Kibaran’s tenement position and has a total strike length of more than 4km, with mineralisation remaining open in all directions.
The Merelani East Deposit occurs within a brownfields graphite province that has past production and a recognised graphite sales history, generating considerable interest from traders and end-users. This provides Kibaran with the confidence that Merelani-Arusha will support a second graphite operation for the Company in Tanzania after the development of Epanko.
METALLURGY
Testwork during the reporting period confirmed Merelani East contains a high distribution of large flake graphite with very high-grade concentrates recovered from simple flotation.
Graphite Flake Distribution for Merelani East Deposit
Flake Size Portion Retained
(%)
Carbon
(%) Name Microns Mesh Jumbo > 300 > 48 29.7 96.2 Larger > 180 > 80 29.0 95.7
> 150
> 100
Small > 75 > 200 7.3 92.8 Fine < 75 < 200 12.9 81.9
Micron (µm) and Millimetre (mm). 1mm = 1000µm and fixed carbon content determined by loss on ignition method (LOI).
The metallurgical results followed an initial exploration programme comprising 22 Reverse Circulation (RC) drillholes, two diamond drillholes and eight trenches that targeted three prospects.
The trench results doubled the total strike length of graphite mineralisation to more than four kilometres.
TENEMENT RATIONALISATION
Following the exploration that resulted in the maiden resource for the Merelani East deposit, the Company undertook a strategic review of its Merelani-Arusha Project tenure. This review resulted in the relinquishment of four licences that were determined not to have significant graphite development potential.

REVIEW OF OPERATIONS
6
TANGA GRAPHITE PROJECT (100% KNL) The Tanga licence covers 84km2 near Tanzania’s east coast and provides Kibaran with a third graphite province to underpin the Company’s strategy of becoming a significant and long-term supplier of premium quality graphite from Tanzania. There was no notable activity undertaken on the Tanga project during the reporting period.
KAGERA NICKEL PROJECT (100% KNL) Kibaran is continuing efforts to seek a cornerstone investor to advance the divestment strategy for the Kagera Nickel Project, which is of limited current focus for the Company.
Kagera is located along the western border of Tanzania and has nickel-sulphide potential. Kibaran has access to significant regional airborne EM and aeromagnetic data conducted by BHP Billiton, data which has an estimated replacement cost of more than $12 million.
RESEARCH AND DEVELOPMENT 3D PRINTING
Kibaran, together with its 50% owned subsidiary, 3D Graphtech Industries Pty Ltd (“Graphtech”), received results from a collaborative CSIRO white paper study during the period. The study identified two opportunities that could produce high volume/high quality graphene and a pathway for the development of graphene inks for fused filament fabrication 3D printing. Graphtech is assessing the two potential opportunities:
• The development of a scalable manufacturing technique to produce a high volume of high quality graphene at low cost
• The development of equipment to produce graphene composite polymer thermoplastic filaments for extrusion 3D printers that contain graphene
Both of the above opportunities have the potential to deliver commercial solutions, but are subject to further research and development by Graphtech and the CSIRO.
GRAPHENE RESEARCH
During the reporting period, Kibaran partnered with the University of Western Australia (WA) in collaboration with Ben Gurion University (Israel) and Flinders University (South Australia) in a multinational, multi-disciplinary research team, aiming to advance the commercialisation of a method that produces commercial quantities of graphene.
CORPORATE SUCCESSFUL EQUITY RAISING
During the reporting period, Kibaran raised a total of $8.7m through two placements and a Share Purchase Plan (SPP) that received strong support from new and existing shareholders.
In July 2014, Kibaran completed an oversubscribed placement to sophisticated and institutional investors. Under the placement, the Company issued 23.0m ordinary shares at an issue price of $0.135 raising $3.1m.
A second successful placement was undertaken in April 2015 with Kibaran issuing 24.4m ordinary shares at an issue price of $0.17 raising $4.1m.
Kibaran raised a further $1.5m through a SPP, which received such strong support from shareholders that the Company elected to accept oversubscriptions to the value of $500,000 over the targeted $1 million for the equity raising.
Funds from the combined capital raises were applied to the completion of the Bankable Feasibility Study and place Kibaran in a strong position for the development of Epanko.
APPOINTMENT OF GRAPHITE SPECIALIST
Kibaran appointed Mr Christoph Frey during the year as part of a focused and fast-tracked strategy to further the development of the Company’s graphite projects. Mr Frey is a qualified process engineer and is based in Germany. He has worked exclusively in the natural graphite industry for the past 22 years. Mr Frey has expertise in supervision of graphite mining and processing, evaluation of new graphite projects, management development of production portfolios from graphite concentrate to higher value graphite products, sales and procurement.

REVIEW OF OPERATIONS
7
BOARD CHANGES
In May 2015, Mr John Conidi joined the Board. Mr Conidi is a successful businessman bringing a wealth of knowledge to Kibaran. An accountant, Mr Conidi is an experienced investor specialising in technology and resources and his appointment supports the Company’s value-add growth strategy. Mr Conidi will play a vital role in downstream negotiations with off-take providers and commercial partners as well as bringing a wealth of public company expertise to Kibaran.
In June, the Company was deeply saddened with the loss of its Chairman, Mr John Park. Mr Park was a valuable contributor in the Groups progression. Kibaran is currently evaluating suitable replacements to fill this Board vacancy and Chair.

DIRECTORS REPORT
8
The Directors present their report on the consolidated entity consisting of Kibaran Resources Limited and the entities it controlled during the financial year ended 30 June 2015.
DIRECTORS
The names and details of the Directors of Kibaran Resources Limited (“Company”) in office during the financial year and until the date of this report are set out below. Directors have been in office for the entire period unless otherwise stated.
Andrew Spinks - Managing Director (appointed 13 July 2012)
Grant Pierce - Executive Director - Projects (appointed 16 January 2013)
John Conidi - Non-Executive Director (appointed 4 May 2015)
John Park - Non-Executive Chairman (passed away 15 June 2015)
Simon O’Loughlin - Non-Executive Director (resigned 21 August 2014)
Robert Greenslade - Non-Executive Director (resigned 21 August 2014)
BOARD OF DIRECTORS
Mr Andrew Spinks, Managing Director
B.App.Sc (Geol), Grad. Dip (Mining), W.A Quarry Managers Certificate, FAusIMM
Andrew Spinks is a geologist with over 25 years professional experience in a range of commodities in Australia and Africa. Andrew has worked with a number of mining companies including Resolute Limited, Plutonic Resources, Dominion Mining and Whim Creek Resources in diverse roles from exploration, project development and mining. He is a co-founder of Tanzgraphite Pty Ltd and was responsible for the strategy, target generation and acquisitions of that company.
Andrew lived and worked in Tanzania at Resolute's Golden Pride Project for several years and was a key member of the management team that won the inaugural Presidential Award for Environmental Excellence and Leadership, awarded by the then President of Tanzania, His Excellency President Benjamin William Mkapa.
Mr Spinks is currently a Non-Executive Director of Kingsrose Mining Limited (appointed 21 August 2012).
Mr Grant Pierce, OAM
Executive Director – Projects
BEng (Mining), First Class Mine Managers Certificate (WA & NT), FAusIMM, Assoc AICD
Grant Pierce is a mining engineer with over 25 years of experience in both open-pit and underground mining operations and in a range of commodities including gold, copper, copper/cobalt, nickel, iron ore and rare earth elements. He has extensive management experience, having held numerous senior operational management roles with both mining and exploration companies operating in Africa.
Grant was a member of the development team that built Tanzania's first modern gold mine, Resolute's Golden Pride Project and was Operations Manager of the mine for its first 6 years of production. Other senior roles include Executive General Manager (Tanzania) for Barrick Gold Corporation during which time the Tulawaka Gold Mine came online and General Manager (Operations) for Perseus Mining Limited, from the environmental permitting phase through construction, to the Edikan Mine's first gold pour.
Grant was awarded the Order of Australia Medal in 2003 for his personal contribution to social development in rural Tanzania. In 2006 he was also awarded Tanzania's Zeze Award, the highest accolade for outstanding contribution to Tanzania's cultural development.
Mr Pierce does not currently hold any directorships in listed companies and has not held any directorships in the past three years.

DIRECTORS REPORT
9
Mr John Conidi
Non-Executive Director
BBus, FCPA
John Conidi is a Certified Practicing Accountant and Managing Director of ASX-listed Capitol Health Ltd (ASX:CAJ) which he co-founded. He has over 14 years of experience developing, acquiring and managing businesses in the technology and healthcare sectors. Mr Conidi’s role in strategy, management and business development has driven the sustained expansion of Capitol Health, increasing its market capitalisation from $20m to over $500m in the past 8 years.
John has extensive interests in the graphite space. He is an experienced investor specialising in technology and resources. He is also the Chairman of 333D Pty Ltd which together with Kibaran jointly owns 3D Graphtech Industries Pty Ltd. 3D Graphtech is exploring mechanisms for the deployment of graphite and graphene in emerging technologies.
Mr Conidi currently holds a directorship in Capitol Health Limited (appointed August 2007) and Oz Brewing Limited (appointed March 2015).
Mr John Park (passed away 15 June 2015)
Non-Executive Chairman
B.Sc Hons, Fellow of Australasian Institute of Mining, CP(Man), Member of AIME
John Park is a Metallurgist with a successful track record in technical, financial and management aspects of the minerals industry. John has held Executive and Board positions for a number of UK, Canadian and Australian listed companies. He was a founder and Exec. Director of TSX-listed SAMAX Gold, and developed and operated the Merelani graphite mine in Tanzania, which was the first new mine since Independence and remains the largest historical producer of graphite in East Africa.
Mr Park did not hold any directorships in listed companies in the last three years
Mr Simon O’Loughlin (resigned 21 August 2014)
Non-Executive Chairman
BA (Acc), Law Society Certificate in Law
Simon O’Loughlin is the founding member of O’Loughlins Lawyers, an Adelaide based medium sized specialist commercial law firm. He has obtained extensive experience in the corporate and commercial law fields while practising in Sydney and Adelaide. More recently, he has been focusing on the resources sector. Simon also holds accounting qualifications. He has comprehensive experience with companies in the small industrial and resources sectors. Simon is a former Chairman of the Taxation Institute of Australia (SA Division) and Save the Children Fund (SA Division).
Mr Robert Greenslade (resigned 21 August 2014)
Non-Executive Director
BA (Ec)
Robert Greenslade is a Managing Director, Mining and Metals, Corporate Advisory for Standard Chartered Bank since 2011. Prior to this, he was a founding director of Adelaide based boutique corporate advisor, Gryphon Partners Advisory specialising in resource transactions. Gryphon was acquired by Standard Chartered Bank in 2011.
Prior to 2002, Mr Greenslade was Group Executive Corporate for Normandy Mining Ltd heading up the Company's corporate division. Following the takeover of Normandy by Newmont Mining Corporation Inc., he was appointed Vice President of Newmont Capital Ltd responsible for the Group's Australian and Asian Pacific corporate and business development activities.

DIRECTORS REPORT
10
COMPANY SECRETARY
Mr Robert Hodby
Mr Hodby holds a Bachelor of Commerce from Murdoch University and is a member of CPA Australia and the Governance Institute of Australia with over 20 years industry experience in financing and administration of public and listed companies gathered at both operational and corporate levels. During his time, he has held numerous executive and project management positions as well as CFO, Board and Company Secretarial roles with a number of companies involved in the resource and energy industries.
DIRECTORS’ INTERESTS
As at the date of this report, the interests (directly or indirectly held) of the Directors in the shares and options of the Company were:
Director Ordinary Shares Options over Ordinary Shares
Andrew Spinks 18,001,998 - Grant Pierce 1,545,000 1,800,000 John Conidi 2,250,000 -
REMUNERATION REPORT (AUDITED)
This report details the nature and amount of remuneration paid to each director of the Company and key management for the financial year ending 30 June 2015. The information provided in this remuneration report has been audited as required by Section 308(3C) of the Corporations Act 2001.
Key Management Personnel
(i) Directors
Andrew Spinks (Managing Director) (appointed 13 July 2012)
Grant Pierce (Executive Director - Projects) (appointed 16 January 2013)
John Conidi (Non-Executive Director) (appointed 4 May 2015)
John Park (Non-Executive Chairman) (passed away 15 June 2015)
Simon O’Loughlin (Non-Executive Chairman) (resigned 21 August 2014)
Robert Greenslade (Non-Executive Director) (resigned 21 August 2014)
(ii) Executives
Robert Hodby (Company Secretary) (appointed 31 January 2013)
Remuneration Policy
The objective of the consolidated entity's and Company's executive reward framework is to ensure reward for performance is competitive and appropriate for the results delivered. The framework aligns executive reward with the achievement of strategic objectives and the creation of value for shareholders, and conforms to the market best practice for delivery of reward. The Board of Directors ('the Board') ensures that executive reward satisfies the following key criteria for good reward governance practices:
• competitiveness and reasonableness
• acceptability to shareholders
• performance linkage / alignment of executive compensation
• transparency

DIRECTORS REPORT
11
Alignment to shareholders' interests:
• has economic profit as a core component of plan design
• focuses on sustained growth in shareholder wealth, consisting of growth in share price, and delivering constant or increasing return on assets as well as focusing the executive on key non-financial drivers.
• attracts and retains high calibre executives
Alignment to program participants' interests:
• rewards capability and experience
• reflects competitive reward for contribution to growth in shareholder wealth
• provides a clear structure for earning rewards
In accordance with best practice corporate governance, the structure of Non-Executive directors and executive remunerations are separate.
Non-Executive Directors remuneration
Fees and payment to Non-Executive Directors reflect the demands which are made on, and the responsibilities of, the Directors. The Chairman's fees are determined independently to the fees of other non-Executive Directors based on comparative roles in the external market. The chairman is not present at any discussions relating to determination of his own remuneration.
ASX listing rules requires that the aggregate Non-Executive Directors’ remuneration shall be determined periodically by a general meeting. The aggregate amount approved is $300,000. This amount remains unchanged since it was set in the Prospectus dated 16 August 2010.
Executive Remuneration
The consolidated entity and company aims to reward executives with a level and mix of remuneration based on their position and responsibility, which is both fixed and variable.
The executive remuneration and reward framework has four components:
• base pay and non-monetary benefits
• short-term performance incentives
• share-based payments
• other remuneration such as superannuation and long service leave
The combination of these comprises the executive's total remuneration.
The long-term incentives ('LTI') include share-based payments and options. Options are awarded to executives over a period of three to five years based on long-term incentive measures. These include increase in shareholder value relative to the entire market.
Consolidated entity performance and link to remuneration
The Board has a policy of granting incentive options to executives with exercise prices at and/or above market share price (at the time of agreement). As such, incentive options granted to executives will generally only be of benefit if the executives perform to the level whereby the value of the consolidated entity increases sufficiently to warrant the exercising of the incentive options granted. Other than service based vesting conditions, there is no additional performance criteria on the incentive options granted to executives.
The tables below set out summary information about the entity’s earnings and movements in shareholder wealth for the five years to 30 June 2015:
30 June 2015 $
30 June 2014 $
30 June 2013 $
30 June 2012 $
30 June 2011 $
Net loss after tax (5,703,703) (1,463,380) (780,224) (3,825,424) (1,410,445)
Share price at end of year 0.18 0.16 0.07 0.20 0.17
Loss before tax (5,703,703) (1,463,380) (780,224) (3,825,424) (1,418,817)
Basic loss per share (cents) (4.39) (1.89) (1.22) (11.27) (5.01)

DIRECTORS REPORT
12
Voting and comments made at the company's 20 November 2014 Annual General Meeting ('AGM'.
The Company received in excess of 75% of 'for' votes in relation to its remuneration report for the year ended 30 June 2014. The Company did not receive any specific feedback at the AGM regarding its remuneration practices.
Employment Contracts
Remuneration and other terms of employment for the executives are formalised in service agreements specifying the components of remuneration, benefits and notice periods.
The Company has an agreement with Mr Andrew Spinks, Managing Director of the Company. The agreement provides for remuneration of $200,000 per annum exclusive of superannuation, as well as mobile phone costs and business related expenditure. The agreement specifies a six month notice in the event that it is terminated. In the event of termination under no fault of the executive, he qualifies for a termination payment of three months. Following a material change, Mr Spinks may qualify for a termination benefit of up to twelve months subject to limits imposed by the Corporations Act and Listing Rules. There are no other termination benefits specified in the agreement.
The Company has an agreement with Mr Grant Pierce, an Executive Director of the Company. The agreement provides for remuneration of $200,000 per annum, as well as medical and travel insurance, four return flights Dar es Salaam to Perth, mobile phone costs, fully furnished and equipped serviced accommodation in Dar es Salaam, a maintained vehicle and business related expenditure. The agreement specifies a three month notice in the event that it is terminated. In the event of termination under no fault of the executive, he qualifies for a termination payment of three months. There are no other termination benefits specified in the agreement.
The Company has an agreement with Mr Robert Hodby, as the Company Secretary and Chief Financial Officer of the Company for his services. The agreement provides for remuneration of $180,000 per annum exclusive of superannuation, as well as mobile phone costs and business related expenditure. The agreement specifies a six month notice in the event that it is terminated. In the event of termination under no fault of the executive, he qualifies for a termination payment of three months. Following a material change, Mr Hodby may qualify for a termination benefit of up to twelve months subject to limits imposed by the Corporations Act and Listing Rules. There are no other termination benefits specified in the agreement.
The Company has an agreement with Mr John Conidi for the provision of his services as a Non-Executive Director. The term of the agreement commenced on 4 May 2015 and in accordance with the Company’s Constitution, John cannot hold office for more than three years without retiring, but will be eligible to be re-elected. He is paid $50,000 per annum as well as costs relating to performance of duties as a Director. There are no termination notice periods or termination benefits specified in the agreement.
Company Performance, Shareholder Wealth and Director and Executive Remuneration
The Remuneration policy is tailored to enhance goal congruence between shareholders, Directors and executives. Options are issued to all Directors to encourage the alignment of personal and shareholder interests. Remuneration levels are not dependent upon performance criteria as the nature of the Company’s operations are exploration and are not generating profits.
Remuneration Committee
The Remuneration Committee function is performed by the whole Board of Directors and is discussed in Board meetings. All Directors jointly take responsibility determining and reviewing compensation arrangements for the Directors and the executive team. The Remuneration Committee assesses the appropriateness of the nature and amount of remuneration of directors and executives on a periodic basis by reference to relevant employment market conditions with an overall objective of ensuring maximum stakeholder benefit from the retention of a high quality Board and executive team.
Key Management Personnel Remuneration Policy
Board policy for determining remuneration of key personnel is as follows:
Compensation is based on length of service, experience and speciality of the individual concerned, and overall performance of the Company. Contracts for service between the Company and key personnel are on a continuing basis, the terms of which are not expected to change in the immediate future. There is no scheme to provide retirement benefits, other than statutory superannuation.

DIRECTORS REPORT
13
Employment conditions of key personnel are formalised in contracts of employment. The Company may terminate an employment contract without cause by providing three months written notice or making payment in lieu of notice, based on annual salary. Termination payments are generally not payable on resignation or dismissal for serious misconduct. In the case of serious misconduct the Company can terminate employment at any time. Share options not exercised before or on the date of termination will lapse.
Fixed and variable compensations for key management personnel are shown below.
Key Management Personnel Compensation
Short-term Post-employment
Share-based payment
2015
Salary/Fees $
Superannuation $
Plan Shares $
Total $
% of compensation consisting of
options
% performance related
Non- Executive
John Conidi 5,651 154,750 160,401 96% -
John Park1 56,533 5,371 91,620 153,524 60% -
Simon O’Loughlin2 6,290 - - 6,290 - -
Robert Greenslade3 6,667 - - 6,667 - -
Executive
Andrew Spinks 188,479 17,905 765,550 971,934 79% -
Grant Pierce 232,879 - 154,750 387,629 40% -
Robert Hodby4 149,698 12,422 612,850 774,970 79% -
TOTAL 646,197 35,698 1,779,520 2,461,415 - -
(1) Mr Park passed away 15 June 2015
(2) Mr O’Loughlin resigned 21 August 2014
(3) Mr Greenslade resigned 21 August 2014
(4) Includes consultancy fees and expense allowances of $8,000 paid or payable to Strategic Resource Management Pty Ltd, of which Mr Hodby is a Director and beneficiary.
(5) Short term non-monetary benefits: during the year, the Company paid insurance premiums in respect of a contract insuring the Directors, Company Secretary and all executive officers of the Company and of any related body corporates against liability incurred as a Director, secretary or executive officer.

DIRECTORS REPORT
14
Short-term Post-employment
Share-based payment
2014
Salary/Fees $
Superannuation $
Options $
Total $
% of compensation consisting of
options
% performance related
Non- Executive
John Park 36,613 3,387 101,400 141,400 71.7% -
Simon O’Loughlin 46,125 - 101.400 147,525 68.7% -
Robert Greenslade 30,000 - - 30,000 - -
Executive
Andrew Spinks1 154,073 5,927 - 160,000 - -
Grant Pierce 108,241 - 152,100 260,341 58.4% -
Robert Hodby2 64,000 - - 64,000 - -
TOTAL 439,052 9,314 354,900 803,266
(1) Includes consultancy fees and expense allowances of $90,000 paid or payable to Strategic Resource
Management Pty Ltd, of which Mr Spinks is a Director and beneficiary.
(2) Includes consultancy fees and expense allowances of $32,000 paid or payable to Strategic Resource Management Pty Ltd, of which Mr Hodby is a Director and beneficiary.
(3) Short term non-monetary benefits: during the year the Company paid insurance premiums in respect of a contract insuring the Directors, Company Secretary and all executive officers of the Company and of any related body corporates against liability incurred as a Director, secretary or executive officer.
Share Based Compensation
The following grants of share-based payment compensation to Directors and senior management relate to the 2015 financial year:
Executive Share Incentive Plan
Under the plan, eligible employees are offered shares in the Company at prices determined by the Board. The Board has the ultimate discretion to impose special conditions on the shares issued under the ESP and can grant a loan to a participant for the purposes of subscribing for plan shares. Shares issued under loan facilities are escrowed until the loan has been fully repaid. ESP participants receive all the rights associated with the ordinary shares.
Loans granted to participants are limited recourse and interest free unless otherwise determined by the Board. The loans are to be repaid via cash payment and/or the sale of the plan shares. Where the loan is repaid by the sale of shares, any remaining surplus on sale is remitted to the participant while any shortfall is borne by the Group.
During the year, the Company issued the following shares under the ESP:
1. 2,000,000 shares at 23.84 cents per share to Andrew Spinks, Managing Director, on 15 October 2014 after shareholder approval
2. 300,000 shares at 23.84 cents per share to John Park, Non-Executive Chairman, on 15 October 2014 after shareholder approval
3. 1,500,000 shares at 23.84 cents per share to Robert Hodby, Company Secretary, on 15 October 2014 after shareholder approval
4. 1,250,000 shares at 17.36 cents per share to Andrew Spinks, Managing Director, on 30 June 2015 after
shareholder approval
5. 1,250,000 shares at 17.36 cents per share to Grant Pierce, Executive Director Projects, on 30 June 2015
after shareholder approval
6. 1,250,000 shares at 17.36 cents per share to John Conidi, Non-Executive Director, on 30 June 2015 after
shareholder approval

DIRECTORS REPORT
15
7. 1,250,000 shares at 17.36 cents per share to Robert Hodby, Company Secretary, on 30 June 2015 after shareholder approval
The above shares vest on issue and as such, there are not considered to be any service conditions attaching to the grant of shares under the ESP, and the full expense is recognised at grant date.
Fair value of shares granted
Shares granted under the ESP are accounted for as “in-substance” options due to the limited recourse nature of the loan between the employees and the Company to finance the purchase of ordinary shares. The fair value at grant date for the various tranches of shares issued under the ESP is determined using a Black Scholes methodology using the following model inputs:
October Issue
Shares issued 3,800,000
Loan price per share (AUD cents) 23.84
Valuation date 9 September 2014
Loan expiry date 14 October 2019
Underlying security spot price at valuation date (AUD cents) 33.5
Expected price volatility of the Company’s shares 140%
Expected dividend yield 0%
Expected life (years) 5.0
Risk-free interest rate 3.06%
Black Scholes valuation per share (AUD cents per share) 30.54
June Issue
Shares issued 5,000,000
Loan price per share (AUD cents) 17.36
Valuation date 30 June 2015
Loan expiry date 8 July 2020
Underlying security spot price at valuation date (AUD cents) 18.0
Expected price volatility of the Company’s shares 85.74%
Expected dividend yield 0%
Expected life (years) 5.0
Risk-free interest rate 2.32%
Black Scholes valuation per share (AUD cents per share) 12.38
Movements in employee share plan shares issued with limited recourse employee loans:
Date Details Number of Shares
Nominal Value
$
Balance at beginning of the year
-
15 October 2014 Issued during period 3,800,000 905,920
30 June 2015 Issued during period 5,000,000 868,000
Balance at the end of the year 8,800,000 1,773,920
DIRECTORS REPORT
16
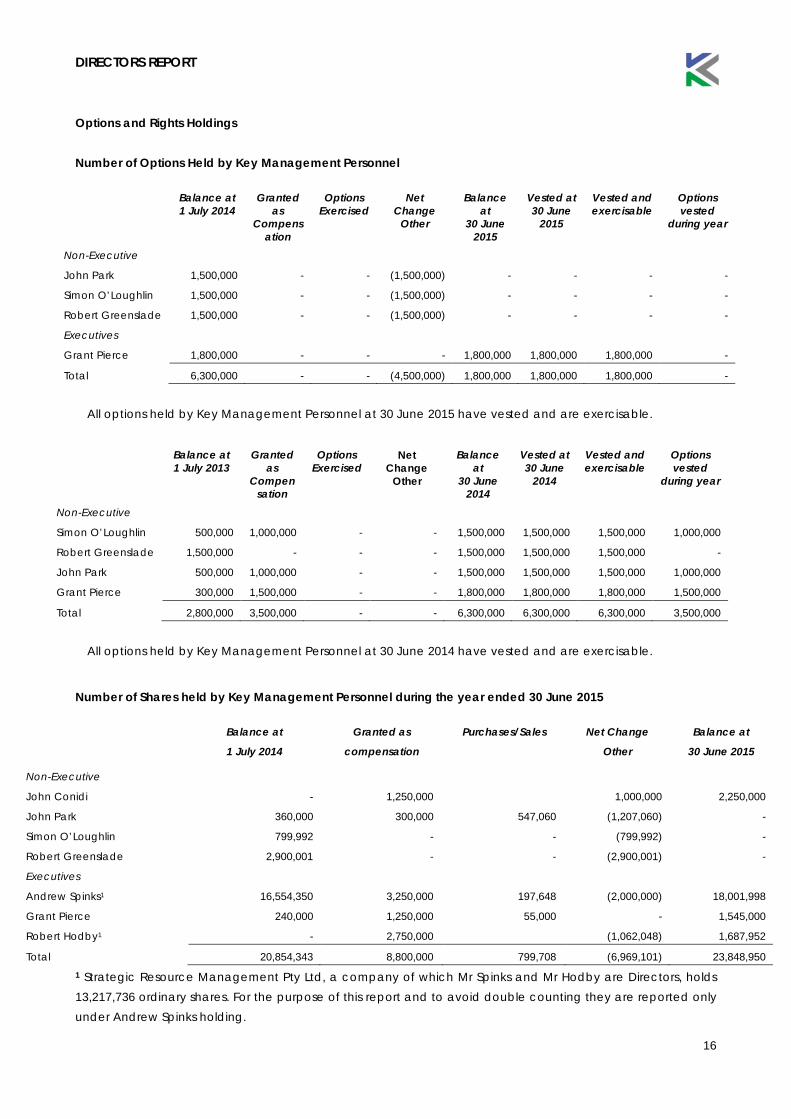
Options and Rights Holdings
Number of Options Held by Key Management Personnel
Balance at 1 July 2014
Granted as
Compensation
Options Exercised
Net Change
Other
Balance at
30 June 2015
Vested at 30 June
2015
Vested and exercisable
Options vested
during year
Non-Executive
John Park 1,500,000 - - (1,500,000) - - - -
Simon O’Loughlin 1,500,000 - - (1,500,000) - - - -
Robert Greenslade 1,500,000 - - (1,500,000) - - - -
Executives
Grant Pierce 1,800,000 - - - 1,800,000 1,800,000 1,800,000 -
Total 6,300,000 - - (4,500,000) 1,800,000 1,800,000 1,800,000 -
All options held by Key Management Personnel at 30 June 2015 have vested and are exercisable.
Balance at
1 July 2013 Granted
as Compen
sation
Options Exercised
Net Change
Other
Balance at
30 June 2014
Vested at 30 June
2014
Vested and exercisable
Options vested
during year
Non-Executive
Simon O’Loughlin 500,000 1,000,000 - - 1,500,000 1,500,000 1,500,000 1,000,000
Robert Greenslade 1,500,000 - - - 1,500,000 1,500,000 1,500,000 -
John Park 500,000 1,000,000 - - 1,500,000 1,500,000 1,500,000 1,000,000
Grant Pierce 300,000 1,500,000 - - 1,800,000 1,800,000 1,800,000 1,500,000
Total 2,800,000 3,500,000 - - 6,300,000 6,300,000 6,300,000 3,500,000
All options held by Key Management Personnel at 30 June 2014 have vested and are exercisable.
Number of Shares held by Key Management Personnel during the year ended 30 June 2015
Balance at
1 July 2014
Granted as
compensation
Purchases/Sales
Net Change
Other
Balance at
30 June 2015
Non-Executive
John Conidi - 1,250,000 1,000,000 2,250,000
John Park 360,000 300,000 547,060 (1,207,060) -
Simon O’Loughlin 799,992 - - (799,992) -
Robert Greenslade 2,900,001 - - (2,900,001) -
Executives
Andrew Spinks1 16,554,350 3,250,000 197,648 (2,000,000) 18,001,998
Grant Pierce 240,000 1,250,000 55,000 - 1,545,000
Robert Hodby1 - 2,750,000 (1,062,048) 1,687,952
Total 20,854,343 8,800,000 799,708 (6,969,101) 23,848,950 1 Strategic Resource Management Pty Ltd, a company of which Mr Spinks and Mr Hodby are Directors, holds 13,217,736 ordinary shares. For the purpose of this report and to avoid double counting they are reported only under Andrew Spinks holding.

DIRECTORS REPORT
17
Number of Shares held by Key Management Personnel during the year ended 30 June 2014
Balance at
1 July 2013
Granted as
compensation
Purchases/Sales
Exercised
Options
Balance at
30 June 2014
Non Executive
John Park 310,000 - 50,000 - 360,000
Grant Pierce 240,000 - - - 240,000
Robert Greenslade 2,901,001 - - - 2,901,001
Simon O’Loughlin 799,992 - - - 799,992
Executives
Andrew Spinks 5,314,386 - 11,239,9641 - 16,554,350
Total 9,564,379 - 11,289,964 - 20,854,343
(1) Includes the conversion of performance shares into ordinary share on attainment of performance milestones (refer to Note 11(c) for additional details on performance shares).
Share Options
Unissued shares
As at the date of this report, there were 1,800,000 unissued ordinary shares under options (1,800,000 at reporting date). Refer to the remuneration report for further details of the options outstanding.
Option holders do not have any right, by virtue of the option, to participate in any share issue of the Company or any related body corporate.
Shares issued as a result of the exercise of options
During the financial year, no shares were issued as a result of the exercise of options.
Loans to Directors or other Key Management Personnel
During the year shareholders approved the issue of shares (Plan Shares) under a combination of executive and individual Share Investment Plans. Under the Plans 8,800,000 shares were offered to eligible recipients at issue prices equal to the five day volume weighted average price at which ordinary shares in the Company traded prior to the offer. The eligible recipients were granted loans for the purpose of subscribing for Plan Shares.
The loans granted are limited recourse and interest free. The loans are to be repaid via cash payment and/or the sale of the plan shares. Where the loan is repaid by the sale of shares, any remaining surplus on sale is remitted to the participant while any shortfall is borne by the Group. Shares issued under loan facilities are escrowed until the loan has been fully repaid.
A total of $1,773,920 had been loaned to Directors and other key management personnel under the Share Investment Plans during the year ended 30 June 2015.
Other transactions with Key Management Personnel
Strategic Resource Management Pty Ltd, a company of which Mr Spinks and Mr Hodby are Directors, provided the consolidated entity with a fully serviced office including administration and information technology support totalling $101,000 (2014: $132,500) and reimbursement of payments for drilling and explorations costs in Tanzania and minor expenses at a cost of $100,671 (2014: $160,612). As at 30 June 2015 there is $18,700 (2014: $59,359) payable to Strategic Resource Management Pty Ltd.
[END OF REMUNERATION REPORT]

DIRECTORS REPORT
18
Meetings of Directors
During the financial year, five meetings of Directors were held. Attendances by each Director during the year were as follows:
Directors Meetings
Number Eligible to
attend
Number Attended
Directors
John Conidi 1 1
John Park 5 5
Andrew Spinks 5 5
Grant Pierce 5 5
Simon O’Loughlin 1 1
Robert Greenslade 1 1
Indemnifying Directors and Officers
The Company has entered into an agreement to indemnify all Directors and officers against any liability arising from a claim brought by a third party against the Company. The Company has paid premiums to insure each Director and officer against liabilities for costs and expenses incurred by them in defending any legal proceedings arising out of their conduct while acting in the capacity of Director of the Company, other than conduct involving a wilful breach of duty in relation to the Company.
Indemnification of Auditors
To the extent permitted by law, the Company has agreed to indemnify its auditors, Ernst & Young, as part of the terms of its audit engagement agreement against claims by third parties arising from the audit (for an unspecified amount). No payment has been made to indemnify Ernst & Young during or since the financial year.
OPERATING AND FINANCIAL REVIEW
Principal Activities
The principal activities of the Company during the financial year consisted of the exploration and evaluation of its tenements in primarily graphite focused mineral resources in Tanzania in East Africa.
Review of Operations
The review of operations is presented before the Directors Report on page 2.
Results from Operations
The net loss after providing for income tax for the year ended 30 June 2015 amounted to $5,703,703 (2014: $1,463,380).
Employees
In addition to the Directors, the Company has two employees as at the date of this report.
Corporate Structure
Kibaran Resources Limited is a public company incorporated and domiciled in Australia, limited by shares. At the date of this report, the Company had 167,629,223 ordinary shares and 12,000,000 options on issue.
DIVIDENDS
The Directors of the Company do not recommend the payment of a dividend in respect of the current financial year ended 30 June 2015 (2014: Nil).
SIGNIFICANT CHANGES IN STATE OF AFFAIRS
All significant changes in the state of affairs of the consolidated entity during the year are discussed in detail above under the Operating and Financial Review section.

DIRECTORS REPORT
19
AFTER BALANCE DATE EVENTS
Subsequent to 30 June 2015, Kibaran announced that it had been granted a Mining Licence for its Epakno Graphite Project, paving the way for the development of Epanko. The Group has also released the results of a Bankable Feasibility Study for the Epanko Graphite Project showing the technical and commercial viability of the Project. This positive result then led to the finalisation of an Offtake Agreement with German conglomerate, ThyssenKrupp, for 50% of the planned graphite concentrate output at Epanko further strengthening its development potential.
Other than this there have not been any events that have arisen in the interval between the end of the financial year and the date of this report or any other item, transaction or event of a material and unusual nature likely, in the opinion of the Directors of the Company, to affect significantly the operations of the Company, the results of those operations or the state of affairs of the Company, in future financial years.
FUTURE DEVELOPMENTS, PROSPECTS AND BUSINESS STRATEGIES
Likely future developments in the operations of the Company are referred to in the Review of Operations.
ENVIRONMENTAL ISSUES
The Company’s operations are subject to environmental regulation under the laws of the Republic of Tanzania. The Board believes that the Company has adequate systems in place for environmental management and is not aware of any breach of environmental requirements as they apply to the Company.
PROCEEDINGS ON BEHALF OF THE COMPANY
No person has applied for leave of court to bring proceedings on behalf of the Company or intervene in any proceedings to which the Company is a party for the purpose of taking responsibility on behalf of the Company for all or any part of those proceedings. The Company was not a party to any such proceedings during the year.
NON-AUDIT SERVICES
The Board is satisfied that the provision of any non-audit services is compatible with the general standard of independence for auditors imposed by the Corporations Act 2001. The Directors ensure that:
• all non-audit services are reviewed and approved by the Audit Committee prior to commencement to ensure they do not adversely affect the integrity and objectivity of the auditor; and
• the nature of the audit services do not compromise the general principles relating to auditor independence in accordance with APES 110: Code of Ethics for Professional Accountants set by the Accounting Professional and Ethical Standards Board.
Fees of $7,500 for non-audit services were paid to the external auditors during the year ended 30 June 2015 (2014: Nil)
AUDITOR’S INDEPENDENCE DECLARATION
The auditor’s independence declaration for the year ended 30 June 2015 has been received and can be found on page 27 of the Annual Report.
CORPORATE GOVERNANCE
The Directors recognise the Australian Securities Exchange Corporate Governance Council’s Principles Recommendations and considers that the Company substantially complies with those guidelines. The Corporate Governance Statement and disclosures of the Company are contained in the Annual Report.
Signed in accordance with a resolution of the Board of Directors made pursuant to s298 (2) of Corporations Act 2001.
On behalf of the Directors
Andrew Spinks Managing Director 30 September 2015

CORPORATE GOVERNANCE STATEMENT
20
This Corporate Governance Statement ("Statement") outlines the key aspects of Kibaran Resources Limited ('Kibaran' or the Company') governance framework and main governance practices. The Company's charters, policies, and procedures are regularly reviewed and updated to comply with law and best practice. These charters and policies can be viewed on Kibaran's website located at www.kibaranresources.com.
This Statement is structured with reference to the Australian Securities Exchange Corporate Governance Council's ("the Council's") "Principles of Good Corporate Governance and Best Practice Recommendations 3'd Edition"· ("the Recommendations").
The Board of Directors has adopted the Recommendations to the extent that is deemed appropriate considering current the size and operations of the Company. Therefore, considering the size and financial position of the Company, where the Board considers that the cost of implementing a recommendation outweighs any potential benefits, those recommendations have not been adopted.
This Statement was approved by the Board of Directors and is current as at 30 September 2015.
PRINCIPLE 1: LAY SOLID FOUNDATIONS FOR MANAGEMENT AND OVERSIGHT
Roles of the Board & Management
The Board is responsible for evaluating and setting the strategic direction for the Company, establishing goals for management and monitoring the achievement of these goals. The Managing Director is responsible to the Board for the day-to-day management of the Company.
The principal functions and responsibilities of the Board include, but are not limited to, the following:
• Appointment, evaluation and, if necessary, removal of the Managing Director, any other executive directors, the Company Secretary and the Chief Financial Officer and approval of their remuneration;
• Determining, in conjunction with management, corporate strategy, objectives, operations, plans and approving and appropriately monitoring plans, new investments, major capital and operating expenditures, capital management, acquisitions, divestitures and major funding activities;
• Establishing appropriate levels of delegation to the Managing Director to allow the business to be managed efficiently;
• Approval of remuneration methodologies and systems; • Monitoring actual performance against planned performance expectations and reviewing operating
information at a requisite level to understand at all times the financial and operating conditions of the Company;
• Monitoring the performance of senior management including the implementation of strategy and ensuring appropriate resources are available;
• Overseeing the management of business risks, safety, occupational health and environmental issues; • Satisfying itself that the financial statements of the Company fairly and accurately set out the financial
position and financial performance of the Company for the period under review; • Satisfying itself that there are appropriate reporting systems and controls in place to assure the Board
that proper operational, financial, compliance, risk management and internal control processes are in place and funct'1oning appropriately;
• Assuring itself that appropriate audit arrangements are in place in relation to the Company's financial affairs;
• Authorising the issue of any shares, options, equity instruments or other securities within the constraints of the Corporations Act and the ASX Listing Rules; and
• Ensuring that the Company acts legally and responsibly on all matters and assuring itself that the Company has adopted, and that its practice is consistent with, a number of guidelines including: o Code of Conduct; o Continuous Disclosure Policy; o Diversity Policy; o Performance Evaluation Policy; o Procedures for Selection and Appointment of Directors; o Remuneration Policy; o Risk Management and Internal Compliance and Control Policy; o Securities Trading Policy; and o Shareholder Communications Policy.
Subject to the specific authorities reserved to the Board under the Board Charter, the Board delegates to the Managing Director responsibility for the management and operation of Kibaran. The Managing Director will be is responsible for the day-to-day operations, financial performance and administration of Kibaran within the powers authorised to him from time-to-time by the Board. The Managing Director may make further delegation within the delegations specified by the Board and will be accountable to the Board for the exercise of those delegated powers.

CORPORATE GOVERNANCE STATEMENT
21
Further details of Board responsibilities, objectives and structure are set out in the Board Charter on the Kibaran website.
Board Committees
The Board had an established an Audit Committee which operates under a charter approved by the Board. The Audit Committee charter and procedures are disclosed on the Company website.
Following the loss of John Park, the Board was reduced to a total of three Directors and subsequently the whole Board has been performing the role of the Audit Committee at the date of this report.
The Company Secretary and external auditors are invited to assist the Board at its discretion. Performance of the external auditor is reviewed annually. The external auditor is requested to attend the annual general meeting and be available to answer questions about the conduct of the audit and the preparation and content of the audit report.
The Board has not formally constituted a nomination committee or remuneration committee. The whole Board conducts the functions of a nomination committee and remuneration committee
The maximum remuneration of Non-Executive Directors is subject to shareholder resolution in accordance with the Company Constitution, the Corporations Act and ASX Listing Rules. The apportionment of Non-Executive Directors remuneration within that maximum will be made by the Board having regard to the inputs and value of contributions by the Non-Executive Director. The current limit, which may only be varied by shareholders in General Meeting, is $300,000 per annum.
Board Appointments
The Company undertakes comprehensive reference checks prior to appointing a director or putting that person forward as a candidate to ensure that person is competent, experienced, and would not be impaired in any way from undertaking the duties of director. The Company provides relevant information to shareholders for their consideration about the attributes of candidates together with whether the Board supports the appointment or re-election.
The terms of the appointment of a non-executive director, executive directors and senior executives are agreed upon and set out in writing at the time of appointment.
The Company Secretary
The Company Secretary is accountable directly to the Board, through the Chairman, on all matters to do with the proper functioning of the Board, including agendas, Board papers and minutes, advising the Board and its Committees (as applicable) on governance matters, monitoring that the Board and Committee policies and procedures are followed, communication with regulatory bodies and the ASX and statutory and other filings.
Diversity
Due to the Company’s size and nature of operations, there are yet no women in senior executive positions. The Board remains conscious of the requirement to establish reasonable and measurable objectives for achieving gender diversity and identifying key measurable diversity performance objectives for the Board, Executive Directors and senior management.
In addition to the Board the Company has only two employees. 50% of these positions were filled by women. None of these positions were filled by women in the prior year, 2014.
The participation of women in the Company at the date of this report is as follows:
Women employees in the Company 25%
Women in senior management positions 0%
Women on the Board 0%
The Company's Diversity Policy is available on its website.
Board & Management Performance Review
On an annual basis, the Board conducts a review of its structure, composition and performance.

CORPORATE GOVERNANCE STATEMENT
22
The annual review includes consideration of the following measures:
• comparing the performance of the Board against the requirements of its Charter; • assessing the performance of the Board over the previous 12 months having regard to the corporate
strategies, operating plans and the annual budget; • reviewing the Board's interaction with management; • reviewing the type and timing of information provided to the Board by management; • reviewing management's performance in assisting the Board to meet its objectives; and • identifying any necessary or desirable improvements to the Board Charter.
The method and scope of the performance evaluation will be set by the Board and may include a Board self-assessment checklist to be completed by each Director. The Board may also use an independent adviser to assist in the review.
The Chairman has primary responsibility for conducting performance appraisals of Non-Executive Directors, in conjunction with them, having particular regard to:
• contribution to Board discussion and function; • degree of independence including relevance of any conflicts of interest; • availability for and attendance at Board meetings and other relevant events; • contribution to Company strategy; • membership of and contribution to any Board committees; and • suitability to Board structure and composition.
Given, the size of the Board, the change to the composition of the Board during the financial year and the current level of operations of the Company, no formal appraisal of the Board was conducted during the financial year.
The Board conducts an annual performance assessment of the Managing Director against agreed key performance indicators.
Independent Advice
Directors have a right of access to all Company information and executives. Directors are entitled, in fulfilling their duties and responsibilities, to obtain independent professional advice on any matter connected with the discharge of their responsibilities, with prior notice to the Chairman, at Kibaran's expense.
PRINCIPLE 2: STRUCTURE THE BOARD TO ADD VALUE
Board Composition
During the financial year and to the date of this report the Board was comprised of the following members:
Andrew Spinks - Managing Director (appointed 13 July 2012) Grant Pierce - Executive Director - Projects (appointed 16 January 2013) John Conidi - Non-Executive Director – independent (appointed 4 May 2015) John Park - Non-Executive Chairman - independent (passed away 15 June 2015) Simon O’Loughlin - Non-Executive Director – independent (resigned 21 August 2014) Robert Greenslade - Non-Executive Director – independent (resigned 21 August 2014)
The Board comprises one Non-Executive Director and two Executive Directors.
Kibaran has adopted a definition of 'independence' for Directors that is consistent with the Recommendations.
During the reporting period at least one Director was considered independent. For much of the reporting period and as at the date of this report there was not a majority of independent Directors on the Board.
The Board is currently considering its composition and is looking to fill the role of Chairman following the vacancy in this position on the loss of John Park.
As the size and resources available to the Company grow, additional independent Directors will be considered to add substance to the objective decision making of the Board.
Board Selection Process
The Board considers that a diverse range of skills, backgrounds, knowledge and experience is required in order to effectively govern the Kibaran. The Board believes that orderly succession and renewal contributes to strong corporate governance and is achieved by careful planning and continual review.

CORPORATE GOVERNANCE STATEMENT
23
The Board is responsible for the nomination and selection of directors. The Board reviews the size and composition of the Board regularly and at least once a year as part of the Board evaluation process. The Company does not have an established Board skills matrix on the mix of skills and diversity for Board membership. The Board continues to monitor the mix of skills and diversity on the Board. However, due to the size of the Company, the Board does not consider it appropriate at this time to formally establish a matrix on the· mix of skills and diversity for Board membership. When the need for a new director is identified, the Board considers the required skills, experience and competencies of candidates and the mix of skills of the existing directors.
Generally a list of potential candidates is identified based on these skills required and other issues such as geographic location and diversity criteria. Candidates are assessed against the required skills and on their qualifications, backgrounds and personal qualities. In addition, candidates are sought who have a proven track record in creating security holder value and the required time to commit to the position.
Induction of New Directors and Ongoing Development
New Directors are issued with a formal Letter of Appointment that sets out the key terms and conditions of their appointment, including Director's duties, rights and responsibilities, the time commitment envisaged, and the Board's expectations regarding involvement with any Committee work.
An induction program is in place and new Directors are encouraged to engage in professional development activities to develop and maintain the skills and knowledge needed to perform their role as Directors effectively.
PRINCIPLE 3: ACT ETHICALLY AND RESPONSIBLY
The Company has implemented a Code of Conduct, which provides guidelines aimed at maintaining high ethical standards, corporate behaviour and accountability within the Company.
All employees and Directors are expected to:
• respect the law and act in accordance with it; • maintain high levels of professional conduct; • respect confidentiality and not misuse Company information, assets or facilities; • avoid real or perceived conflicts of interest; • act in the best interests of shareholders; • by their actions contribute to the Company's reputation as a good corporate citizen which seeks the
respect of the community and environment in which it operates; • perform their duties in ways that minimise environmental impacts and maximise workplace safety; • exercise fairness, courtesy, respect, consideration and sensitivity in all dealings within their workplace
and with customers, suppliers and the public generally; and • act with honesty, integrity, decency and responsibility at all times.
An employee that breaches the Code of Conduct may face disciplinary action including, in the cases of serious breaches, dismissal. If an employee suspects that a breach of the Code of Conduct has occurred or will occur, he or she must report that breach to the Company Secretary. No employee will be disadvantaged or prejudiced if he or she reports in good faith a suspected breach. All reports will be acted upon and kept confidential.
PRINCIPLE 4: SAFEGUARD INTEGRITY IN CORPORATE REPORTING
The Board had an established an Audit Committee which operates under a charter approved by the Board. The Audit Committee charter and procedures are disclosed on the Company website.
Following the loss of John Park, the Board was reduced to a total of three Directors and subsequently the whole Board has been performing the role of the Audit Committee at the date of this report.
The Company Secretary and external auditors are invited to assist the Board at its discretion. Performance of the external auditor is reviewed annually. The external auditor is requested to attend the annual general meeting and be available to answer questions about the conduct of the audit and the preparation and content of the audit report.
The Board is responsible for the initial appointment of the external auditor and the appointment of a new external auditor when any vacancy arises. Candidates for the position of external auditor must demonstrate complete independence from the Company through the engagement period. The Board may otherwise select an external auditor based on criteria relevant to the Company's business and circumstances. The performance of the external auditor is reviewed on an annual basis by the Board.
CORPORATE GOVERNANCE STATEMENT
24
The Board receives regular reports from management and from external auditors. It also meets with the external auditors as and when required.
The external auditors attend Kibaran's AGM and are available to answer questions from security holders relevant to the audit.
Prior approval of the Board must be gained for non-audit work to be performed by the external auditor. There are qualitative limits on this non-audit work to ensure that the independence of the auditor is maintained.
There is also a requirement that the audit partner responsible for the audit not perform in that role for more than five years.
Director and CFO Certifications
The Board has received certifications from a Director and the CFO in connection with the financial statements for the Kibaran for the Reporting Period. The certifications state that the declaration provided in accordance with Section 295A of the Corporations Act as to the integrity of the financial statements is founded on a sound system of risk management and internal control which is operating effectively.
PRINCIPLE 5: MAKE TIMELY AND BALANCED DISCLOSURE
The Company has a Disclosure Policy which outlines the disclosure obligations of the Company as required under the ASX listing Rules and Corporations Act. The policy is designed to ensure that procedures are in place so that the market is properly informed of matters which may have a material impact on the price at which Company securities are traded.
The Board considers whether there are any matters requiring disclosure in respect of each and every item of business that it considers in its meetings. Individual Directors are required to make such a consideration when they become aware of any information in the course of their duties as a Director of the Company.
The Company is committed to ensuring all investors have equal and timely access to material information concerning the Company.
The Board has designated the Company Secretary as the person responsible for communicating with the ASX. The Chairman, Managing Director and the Company Secretary are responsible for ensuring that:
a) Company announcements are made in a timely manner, that announcements are factual and do not omit any material information required to be disclosed under the ASX Listing Rules and Corporations Act; and
b) Company announcements are expressed in a clear and objective manner that allows investors to assess the impact of the information when making investment decisions.
PRINCIPLE 6: RESPECT THE RIGHTS OF SECURITY HOLDERS
The Company recognizes the value of providing current and relevant information to its shareholders.
The Company respects the rights of its shareholders and to facilitate the effective exercise of those rights the Company is committed to:
• communicating effectively with shareholders through releases to the market via ASX, the company website, information mailed to shareholders and the general meetings of the Company;
• giving shareholders ready access to clear and understandable information about the Company; and • making it easy for shareholders to participate in general meetings of the Company.
The Company also makes available a telephone number and email address for shareholders to make enquiries of the Company. These contact details are available on the "contact us" page of the Company's website.
Shareholders may elect to, and are encouraged to, receive communications from Kibaran and Kibaran’s securities registry electronically.
The Company maintains information in relation to its Constitution, governance documents, Directors and senior executives, Board and committee charters, annual reports and ASX announcements on the Company's website.
PRINCIPLE 7: RECOGNISE AND MANAGE RISK
The Board is responsible for ensuring there are adequate policies in relation to risk oversight, management, compliance and internal control systems, but recognises that no cost effective internal control system will preclude all errors and irregularities. The Company policies are designed to ensure strategic, operational,

CORPORATE GOVERNANCE STATEMENT
25
legal, reputational and financial risks are identified, assessed, effectively and efficiently managed and monitored to enable achievement of the Consolidated Entity’s business objectives.
The Company’s senior management are delegated with the tasks of management of operational risk and implementation of risk management strategies.
The Company’s risk management systems and control framework include the Board’s ongoing monitoring of management and operation performance, a comprehensive system of budgeting, forecasting and reporting to the Board, regular presentations to the Board by management of the management of risk, approval procedures for significant capital expenditure above threshold levels, comprehensive written policies on specific activities and corporate governance, regular communication between Directors on compliance and risk and consultation and review between the Board and external accountants.
The Board recognises that material risks facing the Consolidated Entity are the more significant areas of uncertainty or exposure to the Consolidated Entity that could adversely affect the achievement of the Consolidated Entity’s objectives and successful implementation of its business strategies.
Within the identified risk profile of the Company, comprehensive practices are in place that are directed towards achieving the following objectives:
• Effectiveness and efficiency in the use of the Company’s resources; • Compliance with applicable laws and regulations; and • Preparation of reliable published financial information
The material risks, both financial and non-financial, facing the Consolidated Entity are:
• protection of assets • maintenance of proper financial an accounting records • reliability of financial information • compliance with key performance indicators • financial markets • currency movements • pricing • competitive position • operational efficiency • investments in new projects • retaining key personnel • technical risk
The Board considers these identified material risks as part of its annual risk management review, or on an as required basis as a result of regular interaction with management.
The responsibility for undertaking and assessing risk management and internal control effectiveness is delegated to management. Management is required by the Board to report back on the efficiency and effectiveness of risk management, inter alia, by benchmarking the Company’s performance against industry standards. Management is required to report to the Board and confirm the effectiveness of the Company’s management of its material business risks. This occurs formally during regular monthly management meetings, and directly to the Board on an ad hoc basis when required.
The Board requires assurance from the Executive Director and the Chief Financial Officer that the declaration in relation to section 295A of the Corporations Act is founded in a sound system of risk management and internal control and that the system is operating effectively in all material aspects in relation to financial report risks.
The Board review's the Company's risk management framework at least annually to ensure that it continues to effectively manage risk.
PRINCIPLE 8: REMUNERATE FAIRLY AND RESPONSIBLY
The Board as a whole fulfils to the functions normally delegated to the Remuneration Committee as detailed in the Remuneration Committee Charter.
Kibaran has implemented a Remuneration Policy which was designed to recognise the competitive environment within which Kibaran operates and also emphasise the requirement to attract and retain high calibre talent in order to achieve sustained improvement in Kibaran’s performance. The overriding objective of the Remuneration Policy is to ensure that an individual's remuneration package accurately reflects their experience, level of responsibility, individual performance and the performance of Kibaran.

CORPORATE GOVERNANCE STATEMENT
26
The key principles are to:
• link executive reward with strategic goals and sustainable performance of Kibaran • apply challenging corporate and individual key performance indicators that focus on both short-term
and long- term outcomes • motivate and recognise superior performers with fair, consistent and competitive rewards • remunerate fairly and competitively in order to attract and retain top talent • recognise capabilities and promote opportunities for career and professional development • through employee ownership of Kibaran shares, foster a partnership between employees and other
security holders
The Board determines the Company's remuneration policies and practices and assesses the necessary and desirable competencies of Board members. The Board is responsible for evaluating Board performance, reviewing Board and management succession plans and determines remuneration packages for the Managing Director, Non-Executive Directors and senior management based on an annual review.
Kibaran's executive remuneration policies and structures and details of remuneration paid to directors and senior managers are set out in the Remuneration Report.
Non-Executive Directors receive fees (including statutory superannuation where applicable) for their services, the reimbursement of reasonable expenses and, in certain circumstances options. They do not receive any termination or retirement benefits, other than statutory superannuation.
The maximum aggregate remuneration approved by shareholders for Non-Executive Directors is $300,000 per annum. The Directors set the individual Non-Executive Directors fees within the limit approved by shareholders.
The total fees paid to Non-Executive Directors during the reporting period were $75,141.
Executive directors and other senior executives are remunerated using combinations of fixed and performance based remuneration. Fees and salaries and set at levels reflecting market rates and performance based remuneration is linked directly to specific performance targets that are aligned to both short and long term objectives.
In accordance with the Company's share trading policy, participants in an equity based incentive scheme are prohibited from entering into any transaction that would have the effect of hedging or otherwise transferring the risk of any fluctuation in the value of any unvested entitlement in the Company's securities to any other person.
Further details in relation to the company's remuneration policies are contained in the Remuneration Report, within the Directors' report.

A member firm of Ernst & Young Global Limited
Liability limited by a scheme approved under Professional Standards Legislation
GB:ET:KNL:015
Ernst & Young 11 Mounts Bay Road Perth WA 6000 Australia GPO Box M939 Perth WA 6843
Tel: +61 8 9429 2222 Fax: +61 8 9429 2436 ey.com/au
Auditor’s Independence Declaration to the Directors of Kibaran Resources Limited
In relation to our audit of the financial report of Kibaran Resources Limited for the financial year ended 30 June 2015, to the best of my knowledge and belief, there have been no contraventions of the auditor independence requirements of the Corporations Act 2001 or any applicable code of professional conduct.
Ernst & Young Gavin Buckingham Partner 30 September 2015

STATEMENT OF COMPREHENSIVE INCOME FOR THE YEAR ENDED 30 JUNE 2015
28
Consolidated
Notes
2015
$
2014
$
Revenue 3 49,551 27,645
Directors and consultants fees (2,888,277) (860,514)
Impairment of capitalised exploration expenditure 9 (1,467,304) -
Other expenses from ordinary activities 4 (1,397,673) (630,511)
LOSS BEFORE INCOME TAX EXPENSE (5,703,703) (1,463,380)
Income tax expense 5 - -
LOSS FROM CONTINUING OPERATIONS FOR THE YEAR (5,703,703) (1,463,380)
Other comprehensive income, net of tax -
Items that may subsequently be reclassified to profit
or loss
Exchange differences on translation of foreign
operations 24,974 (16,602)
TOTAL COMPREHENSIVE LOSS FOR THE YEAR (5,678,729) (1,479,982)
Basic loss per share (cents per share) 16 (4.39) (1.89)
Diluted loss per share (cents per share) 16 (4.39) (1.89)
The above statement of comprehensive income should be read in conjunction with the accompanying notes.

STATEMENT OF FINANCIAL POSITION AS AT 30 JUNE 2015
29
Consolidated
Notes
2015
$
2014
$
CURRENT ASSETS
Cash and cash equivalents 6 4,648,784 524,746
Trade and other receivables 7 80,892 46,810
TOTAL CURRENT ASSETS 4,729,676 571,556
NON-CURRENT ASSETS
Property, plant & equipment 8 23,235 -
Exploration and evaluation expenditure 9 7,711,720 6,608,601
TOTAL NON-CURRENT ASSETS 7,734,955 6,608,601
TOTAL ASSETS 12,464,631 7,180,157
CURRENT LIABILITIES
Trade and other payables 10 203,593 421,150
TOTAL CURRENT LIABILITIES 203,593 421,150
TOTAL LIABILITIES 203,593 421,150
NET ASSETS 12,261,038 6,759,007
EQUITY
Issued capital 11 24,059,748 13,025,803
Reserves 12 1,784,375 1,612,586
Accumulated losses 13 (13,583,085) (7,879,382)
TOTAL EQUITY 12,261,038 6,759,007
The above statement of financial position should be read in conjunction with the accompanying notes.

STATEMENT OF CHANGES IN EQUITY FOR THE YEAR ENDED 30 JUNE 2015
30
Issued Capital
$
Accumulated Losses
$
Loan Share Reserve
$
Share Based
Payments Reserve
$
Option Reserve
$
Foreign Currency
Translation Reserve
$ Total
$ BALANCE AT 30 JUNE 2013 11,936,177 (6,416,002) - - 1,231,960 (8,372) 6,743,763
Loss for the year - (1,463,380) - - - - (1,463,380)
Other comprehensive income - - - - - (16,602) (16,602)
Total Comprehensive Loss for the year - (1,463,380) - - - (16,602) (1,479,982)
Transactions with owners in their capacity as owners
Shares Issued during the year 1,157,127 - - - - - 1,157,127
Share based payments - - - - 405,600 - 405,600
Share Issue expense (67,500) - - - - - (67,500)
BALANCE AT 30 JUNE 2014 13,025,803 (7,879,382) - - 1,637,560 (24,974) 6,759,007
Loss for the year - (5,703,703) - - - - (5,703,703)
Other comprehensive loss - - - - - 24,974 24,974
Total Comprehensive Loss for the year - (5,703,703) - - - 24,974 (5,678,729)
Transactions with owners in their capacity as owners
Shares Issued during the year 12,193,197 - (1,773,920) - - - 10,419,277
Share based payments - - - 1,779,520 141,215 - 1,920,735
Share Issue expense (1,159,252) - - - - - (1,159,252)
BALANCE AT 30 JUNE 2015 24,059,748 (13,583,085) (1,773,920) 1,779,520 1,778,775 - 12,261,038
The above statement of changes in equity should be read in conjunction with the accompanying notes.

STATEMENT OF CASH FLOWS FOR THE YEAR ENDED 30 JUNE 2015
31
Consolidated
Notes
2015
$
2014
$
CASH FLOWS FROM OPERATING ACTIVITIES
Payments to suppliers and employees (2,435,261) (938,229)
NET CASH FLOWS USED IN OPERATING ACTIVITIES 14 (2,435,261) (938,229)
CASH FLOWS FROM INVESTING ACTIVITIES
Payments for exploration and evaluation (2,859,962) (955,181)
Payments for property plant & equipment (26,546) -
Interest received 49,551 27,645
NET CASH FLOWS USED IN INVESTING ACTIVITIES (2,836,957) (927,536)
CASH FLOWS FROM FINANCING ACTIVITIES
Net proceeds from issue of shares and options 9,994,277 1,125,000
Capital raising costs for issue of shares (518,092) (73,380)
NET CASH FLOWS PROVIDED BY FINANCING ACTIVITIES 9,476,185 1,051,620
NET INCREASE/(DECREASE) IN CASH AND CASH EQUIVALENTS
HELD 4,203,967 (814,145)
Net foreign exchange difference (79,929) 11,829
Cash and cash equivalents at beginning of financial year 524,746 1,327,062
CASH AND CASH EQUIVALENTS AT END OF FINANCIAL YEAR 6 4,648,784 524,746
The above statement of cash flows should be read in conjunction with the accompanying notes.
NOTES TO THE FINANCIAL STATEMENTS FOR THE YEAR ENDED 30 JUNE 2015
32
Basis of Preparation
The financial report has been prepared on an accruals basis and is based on historical costs.
The financial report complies with Australian Accounting Standards and International Financial Reporting
Standards (‘IFRS’).
New and amended standards adopted by the consolidated entity
The consolidated entity has adopted all of the new, revised or amending Accounting Standards and
Interpretations issued by the Australian Accounting Standards Board (AASB) that are mandatory for the
current reporting period.
Any new, revised or amending Accounting Standards or Interpretations that are not yet mandatory have
not been early adopted
Any significant impact on the accounting policies of the consolidated entity from the adoption of these
Accounting Standards and Interpretations are disclosed below. The adoption of these Accounting
Standards and Interpretations did not have any significant impact on the financial performance or position
of the consolidated entity.
1. CORPORATE INFORMATION & STATEMENT OF SIGNIFICANT ACCOUNTING POLICIES
Corporate Information
The consolidated financial statements of Kibaran Resources Limited and its subsidiaries (collectively, the
Group) for the year ended 30 June 2015 were authorised for issue in accordance with a resolution of the
Directors on 29 September 2015.
Kibaran Resources Limited (the Company or the parent) is a for profit company limited by shares
incorporated in Australia whose shares are publicly traded on the Australian Stock Exchange. The Company
has activities in Tanzania and Australia, with the country of domicile being Australia and the registered
office located in Australia.
The nature of the operations and principal activities of the Group are described in the Directors’ report.
Information on the Group’s structure is provided in Note 21. Information on other related party relationships is
provided in Note 20.
Significant Accounting Policies
These general purpose financial statements have been prepared in accordance with Australian Accounting Standards and Interpretations issued by the Australian Accounting Standards Board ('AASB') and the Corporations Act 2001, as appropriate for for-profit oriented entities. These financial statements also comply with International Financial Reporting Standards as issued by the International Accounting Standards Board ('IASB').
The following is a summary of the material accounting policies adopted by the consolidated entity in the preparation of the financial report. The accounting policies have been consistently applied, unless otherwise stated.

NOTES TO THE FINANCIAL STATEMENTS FOR THE YEAR ENDED 30 JUNE 2015
33
Reference Title Application date of standard*
Application date for Group*
AASB 1031 Materiality
The revised AASB 1031 is an interim standard that cross-references to other Standards and the Framework (issued December 2013) that contain guidance on materiality. AASB 1031 will be withdrawn when references to AASB 1031 in all Standards and Interpretations have been removed. AASB 2014-1 Part C issued in June 2014 makes amendments to
eight Australian Accounting Standards to delete their references
to AASB 1031. The amendments are effective from 1 July 2014*.
1 January 2014 1 July 2014
AASB 2014-1
Part A -Annual
Improvements
2010–2012 Cycle
AASB 2014-1 Part A: This standard sets out amendments to
Australian Accounting Standards arising from the issuance by the
International Accounting Standards Board (IASB) of International
Financial Reporting Standards (IFRSs) Annual Improvements to IFRSs
2010–2012 Cycle and Annual Improvements to IFRSs 2011–2013
Cycle.
Annual Improvements to IFRSs 2010–2012 Cycle addresses the
following items:
► AASB 2 - Clarifies the definition of 'vesting conditions' and 'market condition' and introduces the definition of 'performance condition' and 'service condition'.
► AASB 3 - Clarifies the classification requirements for contingent consideration in a business combination by removing all references to AASB 137.
► AASB 8 - Requires entities to disclose factors used to identify the entity's reportable segments when operating segments have been aggregated. An entity is also required to provide a reconciliation of total reportable segments' asset to the entity's total assets.
► AASB 116 & AASB 138 - Clarifies that the determination of accumulated depreciation does not depend on the selection of the valuation technique and that it is calculated as the difference between the gross and net carrying amounts.
AASB 124 - Defines a management entity providing KMP services
as a related party of the reporting entity. The amendments added
an exemption from the detailed disclosure requirements in
paragraph 17 of AASB 124 for KMP services provided by a
management entity. Payments made to a management entity in
respect of KMP services should be separately disclosed.
1 July 2014 1 July 2014

NOTES TO THE FINANCIAL STATEMENTS FOR THE YEAR ENDED 30 JUNE 2015
34
New and amended standards applicable in future years
Australian Accounting Standards and Interpretations that have recently been issued or amended but are
not yet effective have not been adopted by the consolidated entity for the annual reporting period ended
30 June 2015. These are outlined below:
Reference Title Summary Application date of
standard
Application date for Group
AASB 9/IFRS 9 Financial Instruments
AASB 9 (December 2014) is a new standard which replaces AASB 139. This new version supersedes AASB 9 issued in December 2009 (as amended) and AASB 9 (issued in December 2010) and includes a model for classification and measurement, a single, forward-looking ‘expected loss’ impairment model and a substantially-reformed approach to hedge accounting. AASB 9 is effective for annual periods beginning on or after 1 January 2018. However, the Standard is available for early adoption. The own credit changes can be early adopted in isolation without otherwise changing the accounting for financial instruments. Classification and measurement AASB 9 includes requirements for a simpler approach for classification and measurement of financial assets compared with the requirements of AASB 139. There are also some changes made in relation to financial liabilities. The main changes are described below. Financial assets a. Financial assets that are debt instruments will be
classified based on (1) the objective of the entity's business model for managing the financial assets; (2) the characteristics of the contractual cash flows.
b. Allows an irrevocable election on initial recognition to present gains and losses on investments in equity instruments that are not held for trading in other comprehensive income. Dividends in respect of these investments that are a return on investment can be recognised in profit or loss and there is no impairment or recycling on disposal of the instrument.
c. Financial assets can be designated and measured at fair value through profit or loss at initial recognition if doing so eliminates or significantly reduces a measurement or recognition inconsistency that would arise from measuring assets or liabilities, or recognising the gains and losses on them, on different bases.
Financial liabilities Changes introduced by AASB 9 in respect of financial liabilities are limited to the measurement of liabilities designated at fair value through profit or loss (FVPL) using the fair value option. Where the fair value option is used for financial liabilities, the change in fair value is to be accounted for as follows:
► The change attributable to changes in credit risk are presented in other comprehensive income (OCI)
► The remaining change is presented in profit or
1 January
2018
1 July 2018

NOTES TO THE FINANCIAL STATEMENTS FOR THE YEAR ENDED 30 JUNE 2015
35
Reference Title Summary Application date of
standard
Application date for Group
loss AASB 9 also removes the volatility in profit or loss that was caused by changes in the credit risk of liabilities elected to be measured at fair value. This change in accounting means that gains or losses attributable to changes in the entity’s own credit risk would be recognised in OCI. These amounts recognised in OCI are not recycled to profit or loss if the liability is ever repurchased at a discount. Impairment The final version of AASB 9 introduces a new expected-loss impairment model that will require more timely recognition of expected credit losses. Specifically, the new Standard requires entities to account for expected credit losses from when financial instruments are first recognised and to recognise full lifetime expected losses on a more timely basis. Hedge accounting Amendments to AASB 9 (December 2009 & 2010 editions and AASB 2013-9) issued in December 2013 included the new hedge accounting requirements, including changes to hedge effectiveness testing, treatment of hedging costs, risk components that can be hedged and disclosures. Consequential amendments were also made to other standards as a result of AASB 9, introduced by AASB 2009-11 and superseded by AASB 2010-7, AASB 2010-10 and AASB 2014-1 – Part E. AASB 2014-7 incorporates the consequential amendments arising from the issuance of AASB 9 in Dec 2014. AASB 2014-8 limits the application of the existing versions of AASB 9 (AASB 9 (December 2009) and AASB 9 (December 2010)) from 1 February 2015 and applies to annual reporting periods beginning on after 1 January 2015.
AASB 15 Revenue from Contracts with Customers
AASB 15 Revenue from Contracts with Customers replaces the existing revenue recognition standards AASB 111 Construction Contracts, AASB 118 Revenue and related Interpretations (Interpretation 13 Customer Loyalty Programmes, Interpretation 15 Agreements for the Construction of Real Estate, Interpretation 18 Transfers of Assets from Customers, Interpretation 131 Revenue—Barter Transactions Involving Advertising Services and Interpretation 1042 Subscriber Acquisition Costs in the Telecommunications Industry). AASB 15 incorporates the requirements of IFRS 15 Revenue from Contracts with Customers issued by the International Accounting Standards Board (IASB) and developed jointly with the US Financial Accounting Standards Board (FASB). AASB 15 specifies the accounting treatment for revenue arising from contracts with customers (except for contracts within the scope of other accounting standards such as leases or financial instruments).The core principle of AASB 15 is that an entity recognises revenue to depict the transfer of promised goods or services to customers in an amount that reflects the consideration to which the entity expects to be entitled in exchange for those goods or services. An entity recognises revenue in accordance with that core principle by applying the following steps: (a) Step 1: Identify the contract(s) with a customer (b) Step 2: Identify the performance obligations in the
contract
1 January
2017
1 July 2017

NOTES TO THE FINANCIAL STATEMENTS FOR THE YEAR ENDED 30 JUNE 2015
36
Reference Title Summary Application date of
standard
Application date for Group
(c) Step 3: Determine the transaction price (d) Step 4: Allocate the transaction price to the
performance obligations in the contract (e) Step 5: Recognise revenue when (or as) the entity
satisfies a performance obligation Currently, AASB 15 is effective for annual reporting periods commencing on or after 1 January 2017. Early application is permitted. (Note A) AASB 2014-5 incorporates the consequential amendments to a number Australian Accounting Standards (including Interpretations) arising from the issuance of AASB 15.
The core principle of IFRS 15 is that an entity recognises
revenue to depict the transfer of promised goods or
services to customers in an amount that reflects the
consideration to which the entity expects to be entitled
in exchange for those goods or services. An entity
recognises revenue in accordance with that core
principle by applying the following steps:
(a) Step 1: Identify the contract(s) with a customer
(b) Step 2: Identify the performance obligations in the
contract
(c) Step 3: Determine the transaction price
(d) Step 4: Allocate the transaction price to the
performance obligations in the contract
(e) Step 5: Recognise revenue when (or as) the entity
satisfies a performance obligation
Early application of this standard is permitted.
AASB 2014-3 Amendments to
Australian
Accounting
Standards –
Accounting for
Acquisitions of
Interests in Joint
Operations
[AASB 1 & AASB
11]
AASB 2014-3 amends AASB 11 to provide guidance on
the accounting for acquisitions of interests in joint
operations in which the activity constitutes a business.
The amendments require:
(a) the acquirer of an interest in a joint operation in
which the activity constitutes a business, as defined in
AASB 3 Business Combinations, to apply all of the
principles on business combinations accounting in AASB
3 and other Australian Accounting Standards except for
those principles that conflict with the guidance in AASB
11; and
(b) the acquirer to disclose the information required by
AASB 3 and other Australian Accounting Standards for
business combinations.
This Standard also makes an editorial correction to AASB
11
1 January
2016
1 July 2016

NOTES TO THE FINANCIAL STATEMENTS FOR THE YEAR ENDED 30 JUNE 2015
37
Reference Title Summary Application date of
standard
Application date for Group
AASB 2014-4 Clarification of
Acceptable
Methods of
Depreciation and
Amortisation
(Amendments to
AASB 116 and
AASB 138)
AASB 116 and AASB 138 both establish the principle for
the basis of depreciation and amortisation as being the
expected pattern of consumption of the future
economic benefits of an asset.
The IASB has clarified that the use of revenue-based
methods to calculate the depreciation of an asset is not
appropriate because revenue generated by an activity
that includes the use of an asset generally reflects factors
other than the consumption of the economic benefits
embodied in the asset.
The amendment also clarified that revenue is generally
presumed to be an inappropriate basis for measuring the
consumption of the economic benefits embodied in an
intangible asset. This presumption, however, can be
rebutted in certain limited circumstances.
1 January
2016
1 July 2016
The impact of the above new and amended standards is yet to be determined.

NOTES TO THE FINANCIAL STATEMENTS FOR THE YEAR ENDED 30 JUNE 2015
38
Accounting Policies
a) Going Concern The consolidated entity recorded a loss of $5,703,703 for the year ended 30 June 2015 (30 June 2014:
$1,463,380) and had net cash outflows from operating and investing activities of $5,272,218 for the year
ended 30 June 2015 (30 June 2014: $1,865,765). The consolidated entity had cash and cash equivalents
at 30 June 2015 of $4,648,784 (30 June 2014: $524,746) and has working capital of $4,526,083 (30 June
2014: $150,406).
In the event that the Group commences development and is unable to raise additional funds to meet
the Group’s planned development expenditure in relation to the Epanko Graphite Project and ongoing
working capital requirements when required, there is uncertainty as to whether the Group will be able to
meet its debts as and when they fall due and thus continue as a going concern.
The financial statements do not include any adjustments relating to the recoverability and classification
of recorded asset amounts, nor to the amounts or classification of liabilities that might be necessary
should the Group not be able to continue as a going concern
b) Income Tax
The charge for current income tax expense is based on the profit/(loss) for the year adjusted for any non-
assessable or disallowed items. It is calculated using the tax rates that have been enacted or are
substantively enacted by the reporting date.
Deferred tax is accounted for using the balance sheet liability method in respect of temporary
differences arising between the tax bases of assets and liabilities and their carrying amounts in the
financial statements. No deferred income tax will be recognised from the initial recognition of an asset or
liability, excluding a business combination, where there is no effect on accounting or taxable profit or
loss.
Deferred tax is calculated at the tax rates that are expected to apply to the period when the asset is
realised or liability is settled. Deferred tax is credited to the profit and loss component of the statement of
profit or loss and other comprehensive income except where it relates to items that may be credited
directly to other comprehensive income or equity, in which case the deferred tax is adjusted directly
against other comprehensive income or equity.
Deferred income tax assets are recognised to the extent that it is probable that future tax profits will be
available against which deductible temporary differences can be utilised.
The amount of benefits brought to account or which may be realised in the future is based on the
assumption that no adverse change will occur in income taxation legislation and the anticipation that
the entity will derive sufficient future assessable income to enable the benefit to be realised and comply
with the conditions of deductibility imposed by the law.
c) Parent entity information
In accordance with the Corporations Act 2001, these financial statements present the results of the
consolidated entity only. Supplementary information about the parent entity is disclosed in note 22.

NOTES TO THE FINANCIAL STATEMENTS FOR THE YEAR ENDED 30 JUNE 2015
39
d) Basis of consolidation
The consolidated financial statements comprise the financial statements of the Group and its subsidiaries
as at 30 June 2015. Control is achieved when the Group is exposed, or has rights, to variable returns from
its involvement with the investee and has the ability to affect those returns through its power over the
investee. Specifically, the Group controls an investee if and only if the Group has:
• Power over the investee (i.e. existing rights that give it the current ability to direct the relevant activities of the investee)
• Exposure, or rights, to variable returns from its involvement with the investee • The ability to use its power over the investee to affect its returns
When the Group has less than a majority of the voting or similar rights of an investee, the Group considers
all relevant facts and circumstances in assessing whether it has power over an investee, including:
• The contractual arrangement with the other vote holders of the investee • Rights arising from other contractual arrangements • The Group’s voting rights and potential voting rights
The Group re-assesses whether or not it controls an investee if facts and circumstances indicate that
there are changes to one or more of the three elements of control. Consolidation of a subsidiary begins
when the Group obtains control over the subsidiary and ceases when the Group loses control of the
subsidiary. Assets, liabilities, income and expenses of a subsidiary acquired or disposed of during the year
are included in the statement of comprehensive income from the date the Group gains control until the
date the Group ceases to control the subsidiary.
Profit or loss and each component of other comprehensive income (OCI) are attributed to the equity
holders of the parent of the Group and to the non-controlling interests, even if this results in the non-
controlling interests having a deficit balance. When necessary, adjustments are made to the financial
statements of subsidiaries to bring their accounting policies into line with the Group’s accounting policies.
All intra-group assets and liabilities, equity, income, expenses and cash flows relating to transactions
between members of the Group are eliminated in full on consolidation.
A change in the ownership interest of a subsidiary, without a loss of control, is accounted for as an equity
transaction. If the Group loses control over a subsidiary, it:
• De-recognises the assets (including goodwill) and liabilities of the subsidiary • De-recognises the carrying amount of any non-controlling interests • De-recognises the cumulative translation differences recorded in equity • Recognises the fair value of the consideration received • Recognises the fair value of any investment retained • Recognises any surplus or deficit in profit or loss • Reclassifies the parent’s share of components previously recognised in OCI to profit or loss or
retained earnings, as appropriate, as would be required if the Group had directly disposed of the related assets or liabilities.

NOTES TO THE FINANCIAL STATEMENTS FOR THE YEAR ENDED 30 JUNE 2015
40
e) Exploration and development expenditure
Exploration and evaluation expenditure in relation to separate areas of interest for which rights of tenure
are current is carried forward as an asset in the statement of financial position where it is expected that
the expenditure will be recovered through the successful development and exploitation of an area of
interest, or by its sale; or exploration activities are continuing in an area and activities have not reached
a stage which permits a reasonable estimate of the existence or otherwise of economically recoverable
reserves. Where a project or an area of interest has been abandoned, the expenditure incurred thereon
is written off in the year in which the decision is made.
Accumulated costs in relation to an abandoned area are written off in full against profit or loss in the
year in which the decision to abandon the area is made.
When production commences, the accumulated costs for the relevant area of interest are amortised
over the life of the area according to the rate of depletion of the economically recoverable reserves.
A regular review is undertaken of each area of interest to determine the appropriateness of continuing to
carry forward costs in relation to that area of interest.
Costs of site restoration are provided over the life of the facility from when exploration commences and
are included in the costs of that stage. Site restoration costs include the dismantling and removal of
plant, equipment and building structures, waste removal, and rehabilitation of the site in accordance
with clauses of the permits. Such costs have been determined using estimates of future costs, current
legal requirements and technology on a discounted basis.
Payments for exploration and development expenditure are net of government grants and funding
partner contribution.
f) Operating segments
Operating segments are presented using the 'management approach', where the information presented
is on the same basis as the internal reports provided to the Chief Operating Decision Makers ('CODM').
The CODM is responsible for the allocation of resources to operating segments and assessing their
performance.
g) Property plant & equipment
Each class of property, plant and equipment is carried at cost less, where applicable, any accumulated
depreciation and impairment losses.
Plant and equipment
Plant and equipment are measured on a historical cost basis.
The carrying amount of plant and equipment is reviewed annually by directors to ensure it is not in excess
of the recoverable amount from these assets. The recoverable amount is assessed on the basis of the
expected net cash flows that will be received from the asset’s employment and subsequent disposal. The
expected net cash flows have been discounted to their present values in determining recoverable
amounts.

NOTES TO THE FINANCIAL STATEMENTS FOR THE YEAR ENDED 30 JUNE 2015
41
Subsequent costs are included in the asset’s carrying amount or recognised as a separate asset, as
appropriate, only when it is probable that future economic benefits associated with the item will flow to
the Company and the cost of the item can be measured reliably. All other repairs and maintenance are
charged to the profit and loss component of the statement of comprehensive income during the
financial period in which they are incurred.
Depreciation
The depreciable amount of all fixed assets including building and capitalised lease assets, but excluding
freehold land, is depreciated on a straight-line basis over their useful lives to the entity commencing from
the time the asset is held ready for use as follows:
Plant and equipment 3-5 years
The assets’ residual values and useful lives are reviewed, and adjusted if appropriate, at each statement
of financial position date.
An asset’s carrying amount is written down immediately to its recoverable amount if the asset’s carrying
amount is greater than its estimated recoverable amount.
Gains and losses on disposals are determined by comparing proceeds with the carrying amount. These
gains and losses are included in the profit and loss component of the statement of comprehensive
income.
h) Impairment of Non-Financial Assets
At each reporting date, the entity reviews the carrying values of its tangible and intangible assets to
determine whether there is any indication that those assets have been impaired. If such an indication
exists, the recoverable amount of the asset, being the higher of the asset’s fair value less costs to sell and
value in use, is compared to the asset’s carrying value. Any excess of the asset’s carrying value over its
recoverable amount is expensed to the profit or loss component of the consolidated statement of profit
or loss and other comprehensive income.
Impairment testing is performed annually for goodwill and intangible assets with indefinite lives.
Where it is not possible to estimate the recoverable amount of an individual asset, the entity estimates
the recoverable amount of the cash-generating unit to which the asset belongs.

NOTES TO THE FINANCIAL STATEMENTS FOR THE YEAR ENDED 30 JUNE 2015
42
i) Foreign Currency Transactions and Balances
Functional and presentation currency
The functional currency of the entity is the currency of the primary economic environment in which that
entity operates. The financial statements are presented in Australian dollars which is the parent entity’s
functional and presentation currency.
Transaction and balances
Foreign currency transactions are translated into functional currency using the exchange rates prevailing
at the date of the transaction. Foreign currency monetary items are translated at the year-end
exchange rate. Non-monetary items measured at historical cost continue to be carried at the exchange
rate at the date of the transaction. Non-monetary items measured at fair value are reported at the
exchange rate at the date when fair values were determined.
Exchange differences arising on the translation of monetary items are recognised in the profit or loss
component of the statement of profit or loss and other comprehensive income, except where deferred
in equity as a qualifying cash flow or net investment hedge.
Group companies
On consolidation, the assets and liabilities of foreign operations are translated into dollars at the rate of
exchange prevailing at the reporting date and their statements of profit or loss are translated at
exchange rates prevailing at the dates of the transactions. The exchange differences arising on
translation for consolidation are recognised in other comprehensive income. On disposal of a foreign
operation, the component of other comprehensive income relating to that particular foreign operation is
recognised in profit or loss.
j) Employee benefits
Provision is made for the consolidated entity’s liability for employee benefits arising from services
rendered by employees to reporting date. Short term employee benefits have been measured at the
amounts expected to be paid when the liability is settled, plus related on-costs. Long term employee
benefits have been measured at the present value of the estimated future cash outflows to be made for
those benefits
Share-based payments
Equity-settled share-based compensation benefits are provided to employees and directors.
Equity-settled transactions are awards of shares, or options over shares that are provided to employees in
exchange for the rendering of services.
The cost of equity-settled transactions is measured at fair value on grant date. Fair value is independently
determined using either the Binomial or Black-Scholes option pricing model that takes into account the
exercise price, the term of the option, the impact of dilution, the share price at grant date and expected
price volatility of the underlying share, the expected dividend yield and the risk free interest rate for the
term of the option, together with non-vesting conditions that do not determine whether the consolidated
entity receives the services that entitle the employees to receive payment. No account is taken of any
other vesting conditions.

NOTES TO THE FINANCIAL STATEMENTS FOR THE YEAR ENDED 30 JUNE 2015
43
The cost of equity-settled transactions is recognised as an expense with a corresponding increase in
equity over the vesting period. The cumulative charge to profit or loss is calculated based on the grant
date fair value of the award, the best estimate of the number of awards that are likely to vest and the
expired portion of the vesting period. The amount recognised in profit or loss for the period is the
cumulative amount calculated at each reporting date less amounts already recognised in previous
periods.
If equity-settled awards are modified, as a minimum an expense is recognised as if the modification has
not been made. An additional expense is recognised, over the remaining vesting period, for any
modification that increases the total fair value of the share-based compensation benefit as at the date
of modification.
If the non-vesting condition is within the control of the consolidated entity or employee, the failure to
satisfy the condition is treated as a cancellation. If the condition is not within the control of the
consolidated entity or employee and is not satisfied during the vesting period, any remaining expense for
the award is recognised over the remaining vesting period, unless the award is forfeited.
If equity-settled awards are cancelled, it is treated as if it has vested on the date of cancellation, and
any remaining expense is recognised immediately. If a new replacement award is substituted for the
cancelled award, the cancelled and new award is treated as if they were a modification.
k) Issued capital Ordinary shares are classified as equity.
Incremental costs directly attributable to the issue of new shares or options are shown in equity as a
deduction, net of tax, from the proceeds.
l) Trade and other receivables Trade and other receivables, which generally have 30 day terms, are recognised initially at fair value and
subsequently carried at amortised cost using the effective interest method, less an allowance for any
estimated shortfall in receipt. An estimate of any shortfall in receipt is made when there is objective
evidence a loss has been incurred. Bad Debts are written off when identified.
m) Trade and other payables
Liabilities for creditors and other amounts are carried at amortised cost, which is the present value of the
consideration to be paid in the future for goods and services received, whether or not billed to the
consolidated entity. The carrying period is dictated by market conditions but is generally less than 30
days.
n) Cash and cash equivalents
Cash and cash equivalents include cash on hand, deposits held at call with banks, other short-term highly
liquid investments with original maturities of 3 months or less.
o) Revenue
Revenue is recognised when it is probable that the economic benefit will flow to the Group and the
revenue can be reliably measured. Revenue is measured at the fair value of the consideration received
or receivable.

NOTES TO THE FINANCIAL STATEMENTS FOR THE YEAR ENDED 30 JUNE 2015
44
Interest revenue is accrued on a time basis, by reference to the principal outstanding and at the
effective interest rate applicable, which is the rate that exactly discounts estimated future cash receipts
through the expected life of the financial asset to that asset’s net carrying amount.
Other revenue is recognised when it is received or when the right to receive payment is established.
All revenue is stated net of the amount of goods and services tax (GST).
p) Goods and services tax (GST)
Revenues, expenses and assets are recognised net of the amount of GST, except where the amount of
GST incurred is not recoverable from the Australian Tax Office (ATO). In these circumstances the GST is
recognised as part of the cost of acquisition of the asset or as part of an item of the expense. Receivables
and payables in the statement of financial position are shown inclusive of GST.
The net amount of GST recoverable from, or payable to, the ATO is included as part of receivables or
payables.
Cash flows are presented in the cash flow statement on a gross basis, except for the GST component of
investing and financing activities, which are disclosed as operating cash flows.
q) Earnings per share
Basic earnings per share
Basic earnings per share is calculated by dividing the profit/(loss) attributable to the owners of Kibaran
Resources Limited, excluding any costs of servicing equity other than ordinary shares, by the weighted
average number of ordinary shares outstanding during the financial year, adjusted for bonus elements in
ordinary shares issued during the financial year.
Diluted earnings per share
Diluted earnings per share adjusts the figures used in the determination of basic earnings per share to
take into account the after income tax effect of interest and other financing costs associated with
dilutive potential ordinary shares and the weighted average number of shares assumed to have been
issued for no consideration in relation to dilutive potential ordinary shares.
r) Critical accounting estimates and judgements
The directors evaluate estimates and judgments incorporated into the financial report based on historical
knowledge and best available current information. Estimates assume a reasonable expectation of future
events and are based on current trends and economic data, obtained both externally and within the
entity.
Key Estimates — Impairment
The entity assesses impairment at each reporting date by evaluating conditions specific to the entity that
may lead to impairment of assets. Where an impairment trigger exists, the recoverable amount of the
asset is determined. Value-in-use calculations performed in assessing recoverable amounts incorporate a
number of key estimates.

NOTES TO THE FINANCIAL STATEMENTS FOR THE YEAR ENDED 30 JUNE 2015
45
Recoverability of exploration and evaluation costs
The Company assesses the recoverability of the carrying value of capitalised exploration and evaluation
costs at each reporting date (or at closer intervals should the need arise). In completing this assessment,
regard is had to the Company’s intentions with regard to proposed future exploration and development
plans for individual exploration areas, to the success or otherwise of activities undertaken in individual
areas in recent times, to the likely success of future planned exploration activities, and to any potential
plans for divestment of individual areas. Any required adjustments to the carrying value of capitalised
exploration are completed based on the results of this assessment.
Share-based payment transactions
The Company measures the cost of shares and options issued to employees and third parties by
reference to the fair value of the equity instruments at the date at which they are granted. The fair value
of unlisted options is determined by an external valuer using the Black-Scholes formula, taking into
account the terms and conditions upon which the instruments were granted.
Functional currency translation reserve
Under the Accounting Standards, each entity within the Group is required to determine its functional
currency, which is the currency of the primary economic environment in which the entity operates.
Management considers its foreign subsidiaries to be foreign operations with the currency of the
economies they operate in as the functional currency. In arriving at this determination, management has
given priority to the currency that influences the labour, materials and other costs of exploration activities
as they consider this to be a primary indicator of the functional currency.
2. SEGMENT INFORMATION
Identification of reportable segments
The consolidated entity has identified its operating segments based on the internal reports that are
reviewed and used by the Board of Directors (chief operating decision makers) in assessing performance
and determining the allocation of resources.
Types of service by segment
As of the date of this report and during the year, the consolidated entity operates in the industry of
exploration of graphite and nickel in Tanzania. The operating segments are identified based on the size of
the exploration tenements.
The consolidated entity is managed primarily on its tenements. An operating segment is engaged in
providing products or services within a particular economic environment and is subject to risks and returns
that are different from those of segments operating in other economic environment.
The consolidated entity has determined that the reportable operating segments are based on
geographical locations as the assets are 10 percent or more of the combined assets all operating
segments in accordance with AASB 8.
Accounting policies adopted
Unless stated otherwise, all amounts reported to the Board of Directors as the chief decision maker with
respect to operating segments are determined in accordance with accounting policies that are
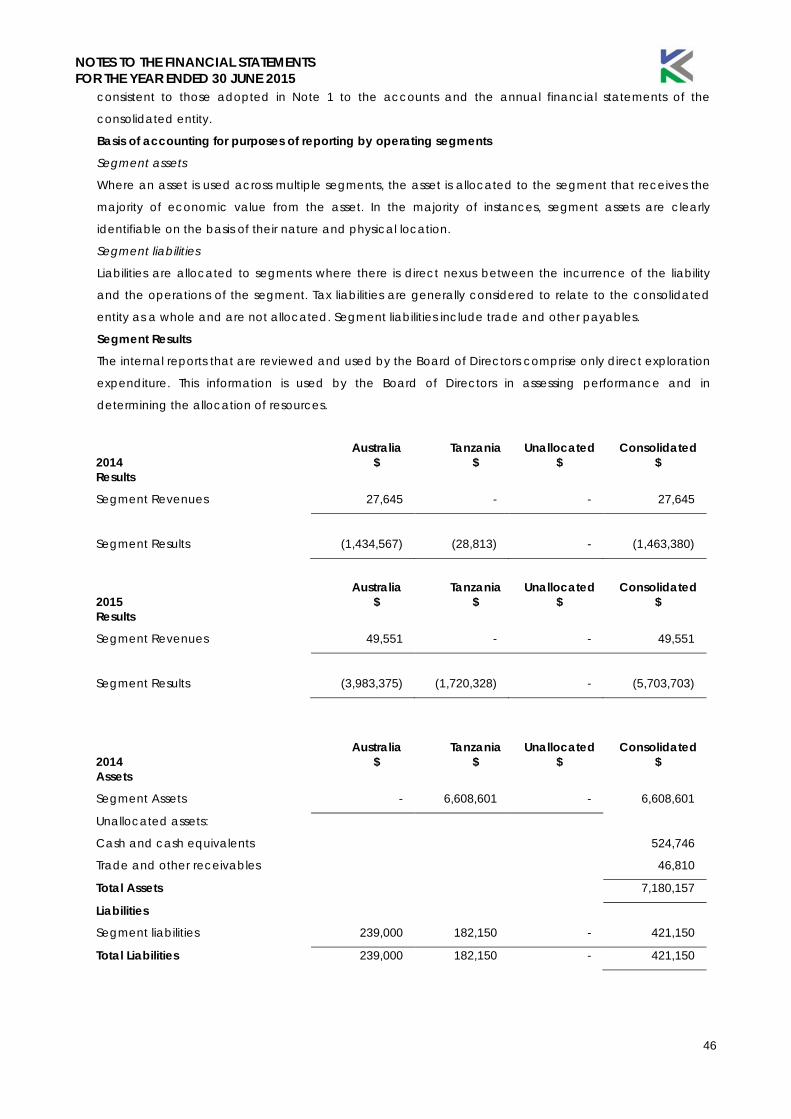
NOTES TO THE FINANCIAL STATEMENTS FOR THE YEAR ENDED 30 JUNE 2015
46
consistent to those adopted in Note 1 to the accounts and the annual financial statements of the
consolidated entity.
Basis of accounting for purposes of reporting by operating segments
Segment assets
Where an asset is used across multiple segments, the asset is allocated to the segment that receives the
majority of economic value from the asset. In the majority of instances, segment assets are clearly
identifiable on the basis of their nature and physical location.
Segment liabilities
Liabilities are allocated to segments where there is direct nexus between the incurrence of the liability
and the operations of the segment. Tax liabilities are generally considered to relate to the consolidated
entity as a whole and are not allocated. Segment liabilities include trade and other payables.
Segment Results
The internal reports that are reviewed and used by the Board of Directors comprise only direct exploration
expenditure. This information is used by the Board of Directors in assessing performance and in
determining the allocation of resources.
Australia Tanzania Unallocated Consolidated 2014 $ $ $ $ Results
Segment Revenues 27,645 - - 27,645
Segment Results (1,434,567) (28,813) - (1,463,380)
Australia Tanzania Unallocated Consolidated 2015 $ $ $ $ Results
Segment Revenues 49,551 - - 49,551
Segment Results (3,983,375) (1,720,328) - (5,703,703)
Australia Tanzania Unallocated Consolidated 2014 $ $ $ $ Assets
Segment Assets - 6,608,601 - 6,608,601
Unallocated assets:
Cash and cash equivalents 524,746
Trade and other receivables 46,810
Total Assets 7,180,157
Liabilities
Segment liabilities 239,000 182,150 - 421,150
Total Liabilities 239,000 182,150 - 421,150

NOTES TO THE FINANCIAL STATEMENTS FOR THE YEAR ENDED 30 JUNE 2015
47
Australia Tanzania Unallocated Consolidated 2015 $ $ $ $ Assets
Segment Assets 10,103 7,724,852 - 7,734,955
Unallocated assets:
Cash and cash equivalents 4,648,784
Trade and other receivables 80,892
Total Assets 12,464,631
Australia Tanzania Unallocated Consolidated Liabilities
Segment liabilities 196,035 7,558 - 203,593
Total Liabilities 196,035 7,558 - 203,593
Consolidated
2015
$ 2014
$
3. REVENUE
Interest received from financial institutions 49,551 27,645
Total Revenue 49,551 27,645
4. EXPENSES
Finance & legal expenses 108,378 75,415
Occupancy expense 60,429 42,000
Communication expense 58,316 15,979
Travel & accommodation 350,753 84,516
Foreign currency losses 42,428 13,686
Other expenses 777,369 398,915
Total expenses from ordinary activities 1,397,673 630,511 5. INCOME TAX EXPENSE
a) Income Tax Expense
The prima facie tax on operating loss from ordinary activities before income tax is reconciled to the
income tax as follows:
Loss before tax (5,703,703) (1,463,380)
Prima facie tax on loss from ordinary activities at tax rate of 30% (2014:30%) (1,711,111) (564,508)
Tax effect of amounts not deductable 29,167 13,810
Benefit of tax losses and timing differences not brought to account as an asset 1,681,944 550,698
Income tax expense attributable to entity - -

NOTES TO THE FINANCIAL STATEMENTS FOR THE YEAR ENDED 30 JUNE 2015
48
Deferred income tax at balance date relates to the following:
2015 $
2014 $
Deferred Tax Assets Foreign exchange translation differences 8,999 3,752 Tax losses available to offset against future taxable income
2,741,662 1,059,718
Total deferred tax asset 2,750,661 1,063,470
Deferred Tax Liabilities
Accrued expenditure (106,224) (17,562)
Deferred tax asset used to offset deferred tax liability 106,224 17,562
Deferred tax assets not brought to account 2,644,437 1,045,908
The benefit of deferred tax assets not brought to account will only be brought to account if: • future assessable income is derived of a nature and of an amount sufficient to enable the benefit to
be realised; • the conditions for deductibility imposed by tax legislation continue to be complied with; and • no changes in tax legislation adversely affect the Group in realising the benefit.
6. CASH AND CASH EQUIVALENTS
2015
$ 2014
$ Cash at bank and on hand 4,548,784 524,746
Short-term bank deposits 100,000 -
4,648,784 524,746
7. TRADE AND OTHER RECEIVABLES
2015 $
2014 $
Goods and services taxation receivable (i) 80,892 18,223
Other receivables - 28,587
80,892 46,810
(i) Goods and services taxation is non-interest bearing and generally on 14 day terms at the end of
each quarter.
(ii) None of the receivables are past due and no impairment is required.

NOTES TO THE FINANCIAL STATEMENTS FOR THE YEAR ENDED 30 JUNE 2015
49
8. PROPERTY, PLANT AND EQUIPMENT
2015 $
2014 $
At cost 26,545 -
Accumulated depreciation 3,310 -
23,235 -
a) Movements in Carrying Amounts:
Movement in the carrying amounts for each class of property, plant and equipment between the
beginning and the end of the current financial year, is as follows:
Office Equipment
Computing Equipment
Total
Balance at 1 July 2014 - - -
Additions 2,885 23,660 26,545
Depreciation expense (436) (2,874) (3,310)
Balance at 30 June 2015 2,449 20,786 23,235
9. EXPLORATION AND EVALUATION EXPENDITURE 2015 $
2014 $
Exploration and evaluation expenditure carried forward:
Carrying amount as at 1 July 6,608,601 5,855,381
Exploration expenditure capitalised 2,570,423 753,220
Exploration expenditure impaired1 (1,467,304) -
Carrying amount as at 30 June 7,711,720 6,608,601 1 This relates to the impairment of the Kagera Nickel project. The Group has impaired the carrying value of the Kagera Nickel project as substantive expenditure on further exploration for and evaluation for the Kagera Nickel project is neither budgeted nor planned as the Group focuses on developing its graphite assets. Recoverability of the remaining carrying amount of exploration assets is dependent on the successful development and commercial exploitation of areas of interest and the sale of minerals or the sale of the respective areas of interest.
2015
$ 2014
$
10. TRADE AND OTHER PAYABLES
Trade payables1 18,980 304,775
Accruals 106,223 102,254
Payroll payables 47,919 14,121
Sundry payables 30,471 -
Total trade and other payables 203,593 421,150
1 Terms and conditions: Trade creditors are non-interest bearing and are normally settled on 45 day
terms.

NOTES TO THE FINANCIAL STATEMENTS FOR THE YEAR ENDED 30 JUNE 2015
50
11. ISSUED CAPITAL
167,534,223 (2014: 92,327,669) fully paid ordinary
shares 24,059,748 13,025,803
(a) Ordinary Shares
Date $ Issue Price No. of Shares
At 30 June 2013 11,936,176 67,076,404
Conversion of Performance Share 28/01/14 - 15,930,000 Placement 06/02/14 1,125,000 $0.125 9,000,000 Placement 06/02/14 32,127 $0.10 321,265 Transaction Costs - (67,500) - At 30 June 2014 13,025,803 92,327,669
Placement July 11/07/14 3,116,059 0.135 23,081,916
Option Exercise 16/07/14 300,000 0.200 1,500,000
Option Exercise 21/07/14 150,000 0.100 1,500,000
Option Exercise 22/07/14 180,000 0.300 600,000
Option Exercise 22/07/14 50,000 0.100 500,000
Option Exercise 8/08/14 80,000 0.100 800,000
Option Exercise 10/09/14 222 0.200 1,112
Loan Shares 15/10/14 905,920 0.238 3,800,000
Option Exercise 21/10/14 200,000 0.200 1,000,000
Option Exercise 21/10/14 100,000 0.200 500,000
Option Exercise 22/10/14 100,000 0.200 500,000
Option Exercise 22/10/14 20,000 0.100 200,000
Option Exercise 23/03/15 15,000 0.100 150,000
Option Exercise 30/03/15 15,000 0.100 150,000
Placement April 2015 27/04/15 4,148,000 0.170 24,400,000
Consultant Shares 27/04/15 425,000 0.170 2,500,000
Share Purchase Plan1 15/05/15 1,499,996 0.170 8,823,526
Option Exercise 26/06/15 20,000 0.100 200,000
Loan Shares 30/06/15 868,000 0.174 5,000,000
Transaction Costs (1,159,252) -
At 30 June 2015 24,059,748 167,534,223 Note 1: The plan shares were granted on 30 June 2015, however the shares were not issued until 8 July 2015. Fully paid ordinary shares carry one vote per share and carry a right to dividends.

NOTES TO THE FINANCIAL STATEMENTS FOR THE YEAR ENDED 30 JUNE 2015
51
(b) Options:
The unissued ordinary shares of the Company under option are as follows: 2015
Grant Date Date of Expiry
Exercise Price
Balance at start of the
year
Granted Exercised Expired unexercised
Balance at end of the
year
22/10/2010 21/10/2015 0.20 3,500,000 - (3,500,000) - -
24/03/2011 24/03/2015 0.25 2,500,000 - - (2,500,000) -
31/03/2011 31/03/2015 0.25 700,000 - - (700,000) -
31/03/2011 30/09/2015 0.35 700,000 - - - 700,000
31/03/2011 31/03/2015 0.30 600,000 - (600,000) - -
31/03/2011 31/03/2016 0.40 700,000 - - - 700,000
24/07/2012 30/06/2015 0.10 3,500,000 - (3,500,000) - -
12/02/2013 11/02/2017 0.27 800,000 - - - 800,000
05/02/2014 03/08/15 0.20 4,500,000 - (1,112) - 4,498,888
12/05/2014 11/05/17 0.193 4,000,000 - - - 4,000,000
15/05/2015 26/10/2016 0.30 - 750,000 - - 750,000
30/06/2015 29/10/2017 0.40 - 4,000,000 - - 4,000,000
TOTAL 21,500,000 4,750,000 (7,601,112) (3,200,000) 15,448,888
Weighted average exercise price of options outstanding at 30 June 2015: $0.27 2014
Grant Date Date of Expiry Exercise Price
Balance at start of the
year
Granted Exercised Expired/ Exercised
Balance at end of the
year
22/10/2010 21/10/2015 0.20 3,500,000 - - -
3,500,000
24/03/2011 24/03/2015 0.25 2,500,000 - - -
2,500,000
31/03/2011 31/03/2015 0.25 700,000 - - -
700,000
31/03/2011 30/09/2015 0.35 700,000 - - -
700,000
31/03/2011 31/03/2015 0.30 600,000 - - -
600,000
24/07/2012 30/06/2015 0.10 3,500,000 - - -
3,500,000
31/03/2011 31/03/2016 0.40 700,000 - - -
700,000
12/02/2013 11/02/2017 0.27 800,000 - - -
800,000
05/02/2014 03/08/15 0.20 - 4,500,0001 - -
4,500,000
12/05/2014 11/05/17 0.193 - 4,000,0002 - -
4,000,000
TOTAL 13,000,000 8,500,000 - - 21,500,000

NOTES TO THE FINANCIAL STATEMENTS FOR THE YEAR ENDED 30 JUNE 2015
52
1 Options granted pursuant to placement of shares 2 Options granted as share based payments to consultants and KMP Weighted average exercise price of options outstanding at 30 June 2014: $0.13 The weighted average remaining contractual life of options outstanding at 30 June 2015 was 1.30 years (2014: 1.30 years). (c) Performance Shares
At 30 June 2015 there were 15,000,000 (30 June 2014: 15,000,000) performance shares on issue.
22,500,000 performance shares were issued in 2010 to the vendors of the nickel project, Castillian Resources (Tanzania) Limited. These shares can be converted to ordinary shares once certain agreed milestones relating to resource and reserve levels are achieved. 7,500,000 of these performance shares expired in October 2014 as the agreed milestones were not achieved. The remaining performance shares expire in October 2015 (with an option for 1 year extension).
Consolidated
2015
$ 2014
$ 12. RESERVES
Foreign currency reserve - (24,974)
Share option Reserve 1,778,775 1,637,560
Loan Share Reserve (1,773,920) -
Share based Payments 1,779,520 -
1,784,375 1,612,586
Movement in foreign currency reserve
Balance at beginning of the year (24,974) (8,372)
Foreign exchange translation differences 24,974 (16,602)
Balance at the end of the year - (24,974)
Movement in share option reserve
Balance at beginning of the year 1,637,560 1,231,960
Share based payment expense for the year 141,215 405,600
Balance at the end of the year 1,778,775 1,637,560
Movement in loan share reserve
Balance at beginning of the year - -
Plan shares issued during the year (1,773,920) -
Balance at the end of the year (1,773,920) -

NOTES TO THE FINANCIAL STATEMENTS FOR THE YEAR ENDED 30 JUNE 2015
53
Consolidated
2015 $
2014 $
Movement in share based payments
Balance at beginning of the year - -
Plan shares and options issued during the year 1,779,520 -
Balance at the end of the year 1,779,520 -
Foreign currency reserve The reserve issued to recognise exchange differences arising from translation of the financial statements of foreign operations to Australian dollars. It is also used to recognise gains and losses on hedges of the net investments in foreign operations. Share option reserve The reserve is used to recognise the value of equity benefits provided to employees and directors as part of their remuneration, and other parties as part of their compensation for services. Plan share reserve The reserve is used to recognise the value of loans associated with the Plan shares provided to executives as part of their remuneration, and other parties as part of their compensation for services. Share based payments reserve The reserve is used to recognise the value of equity benefits provided to employees and directors as part of their remuneration, and other parties as part of their compensation for services.
Consolidated
2015
$ 2014
$
13. ACCUMULATED LOSSES
Accumulated losses at the beginning of the year (7,879,382) (6,416,002)
Loss for the year (5,703,703) (1,463,380)
Accumulated losses at the end of the year (13,583,085) (7,879,382)
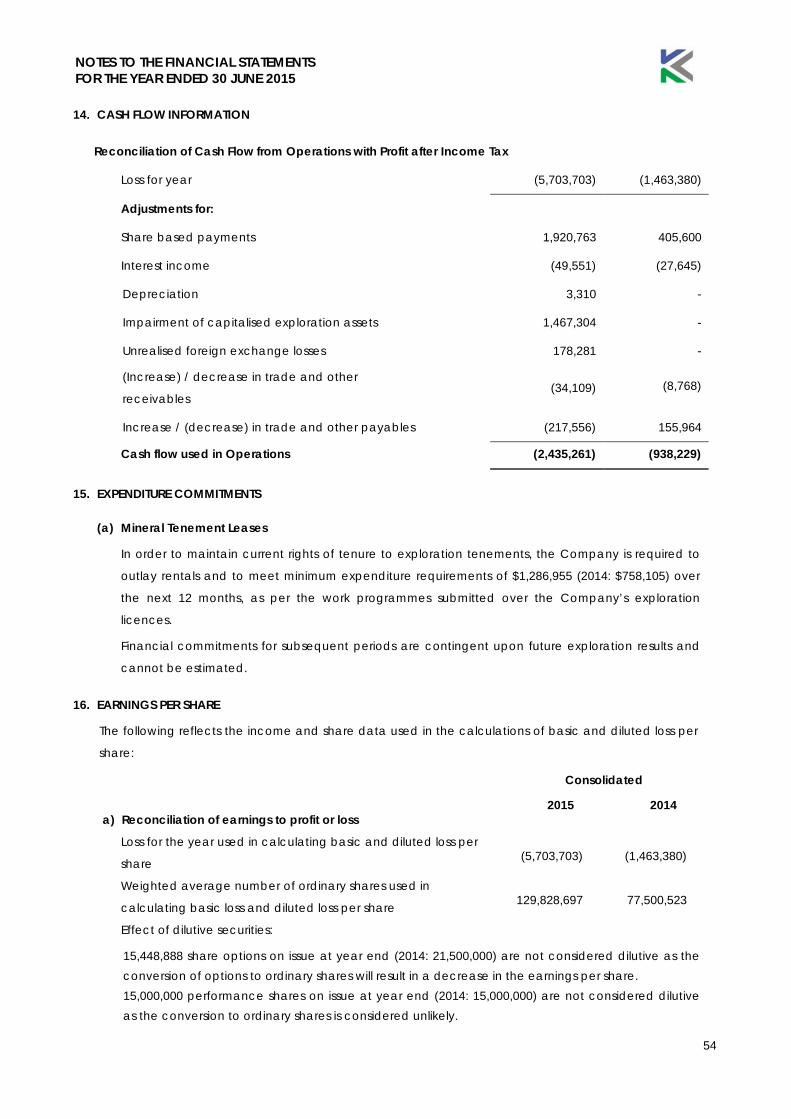
NOTES TO THE FINANCIAL STATEMENTS FOR THE YEAR ENDED 30 JUNE 2015
54
14. CASH FLOW INFORMATION
Reconciliation of Cash Flow from Operations with Profit after Income Tax
Loss for year
(5,703,703) (1,463,380)
Adjustments for:
Share based payments 1,920,763 405,600
Interest income (49,551) (27,645)
Depreciation 3,310 -
Impairment of capitalised exploration assets 1,467,304 -
Unrealised foreign exchange losses 178,281 -
(Increase) / decrease in trade and other
receivables
(34,109) (8,768)
Increase / (decrease) in trade and other payables (217,556) 155,964
Cash flow used in Operations (2,435,261) (938,229)
15. EXPENDITURE COMMITMENTS
(a) Mineral Tenement Leases
In order to maintain current rights of tenure to exploration tenements, the Company is required to
outlay rentals and to meet minimum expenditure requirements of $1,286,955 (2014: $758,105) over
the next 12 months, as per the work programmes submitted over the Company’s exploration
licences.
Financial commitments for subsequent periods are contingent upon future exploration results and
cannot be estimated.
16. EARNINGS PER SHARE
The following reflects the income and share data used in the calculations of basic and diluted loss per
share:
Consolidated
2015 2014 a) Reconciliation of earnings to profit or loss
Loss for the year used in calculating basic and diluted loss per
share (5,703,703) (1,463,380)
Weighted average number of ordinary shares used in
calculating basic loss and diluted loss per share 129,828,697 77,500,523
Effect of dilutive securities:
15,448,888 share options on issue at year end (2014: 21,500,000) are not considered dilutive as the conversion of options to ordinary shares will result in a decrease in the earnings per share. 15,000,000 performance shares on issue at year end (2014: 15,000,000) are not considered dilutive as the conversion to ordinary shares is considered unlikely.

NOTES TO THE FINANCIAL STATEMENTS FOR THE YEAR ENDED 30 JUNE 2015
55
17. AUDITOR’S REMUNERATION
Audit services
Audit or review of the financial
statements 26,000 25,750
Other services
Tax advisory services 7,500 -
33,500 25,750
18. SHARE BASED PAYMENTS
The Company seeks to incentivise staff and consultants to remain with the Group and to improve the longer-term performance of the Company and its return to shareholders. This is done through the issue of a combination of shares and options. Details of share issued under the Executive Share Incentive Plan are detailed in Note 19.
Details of options issued are: Terms and Conditions The terms and conditions relating to the grant of existing share options are as follows:
Grant Date Number of Instruments
Vesting Conditions Expiry Date Contractual life
of options 15/05/2015 750,000 None 26/10/2016 1.4 year
30/06/2015 1,000,000 None 29/10/2017 2.3 years
30/06/2015 2,000,000 Funding raising target 29/10/2017 2.3 years
30/06/2015 1,000,000 Target share price 29/10/2017 2.3 years
4,750,000
Movements The following table illustrates the number and weighted average exercise prices (WAEP) of, and movements in, share options during the year
2015
Number 2015 WAEP
2014 Number
2014 WAEP
Outstanding at 1 July 21,500,000 0.13 13,000,000 0.213
Issued during the year 4,750,000 0.38 8,500,000 0.193
Exercised/expired during the year (10,801,112) 0.19 - -
Outstanding at 30 June 15,448,888 0.27 21,500,000 0.13
Exercisable at 30 June 13,448,888 0.26 21,500,000 0.13

NOTES TO THE FINANCIAL STATEMENTS FOR THE YEAR ENDED 30 JUNE 2015
56
The model inputs for the options granted during the year were as follows:
Quantity 750,000 4,000,000
Grant date 15/05/2015 30/06/2015
Expiry date 26/10/2016 29/10/2017
Grant date share price $0.18 $0.18
Exercise price $0.30 $0.40
Expected volatility 85.74% 85.74%
Option life (years) 1.4 2.3
Expected dividend yield 0% 0%
Risk free rate at grant date 2.01% 2.05%
19. DIRECTORS AND KEY MANAGEMENT PERSONNEL DISCLOSURES
(a) Names and positions of key management personnel in office at any time during the financial
year are:
Name Position
John Conidi
Andrew Spinks
Grant Pierce
Robert Hodby
John Park
Simon O’Loughlin
Robert Greenslade
Non-Executive Director
Managing Director
Executive Director Projects
CFO/Company Secretary
Non-Executive Chairman (passed away 15 June 2015)
Non-Executive Director (resigned 21 August 2014)
Non-Executive Director (resigned 21 August 2014)
(a) Key management personnel compensation
The aggregate compensation made to key management personnel of the consolidated entity is set out
below:
2015
$
2014
$
Short term employee benefits 646,197 439,052
Post-employment benefits 35,698 9,314
Share based payments 1,779,520 354,900
2,461,415 803,266
Executive Share Incentive Plan
Under the plan, eligible employees are offered shares in the Company at prices determined by the Board. The Board has the ultimate discretion to impose special conditions on the shares issued under the ESP and can grant a loan to a participant for the purposes of subscribing for plan shares. Shares issued under loan facilities are escrowed until the loan has been fully repaid. ESP participants receive all the rights associated with the ordinary shares.
Loans granted to participants are limited recourse and interest free unless otherwise determined by the Board. The loans are to be repaid via cash payment and/or the sale of the plan shares. Where

NOTES TO THE FINANCIAL STATEMENTS FOR THE YEAR ENDED 30 JUNE 2015
57
the loan is repaid by the sale of shares, any remaining surplus on sale is remitted to the participant while any shortfall is borne by the Group.
During the year, the Company issued the following shares under the ESP:
1) 2,000,000 shares at 23.84 cents per share to Andrew Spinks, Managing Director, on 15 October 2014 after shareholder approval
2) 300,000 shares at 23.84 cents per share to John Park, Non-Executive Chairman, on 15 October 2014 after shareholder approval
3) 1,500,000 shares at 23.84 cents per share to Robert Hodby, Company Secretary, on 15 October 2014 after shareholder approval
4) 1,250,000 shares at 17.36 cents per share to Andrew Spinks, Managing Director, on 30 June 2015
after shareholder approval
5) 1,250,000 shares at 17.36 cents per share to Grant Pierce, Executive Director Projects, on 30 June
2015 after shareholder approval
6) 1,250,000 shares at 17.36 cents per share to John Conidi, Non-Executive Director, on 30 June
2015 after shareholder approval
7) 1,250,000 shares at 17.36 cents per share to Robert Hodby, Company Secretary, on 30 June
2015 after shareholder approval
The above shares vest on issue and as such, there are not considered to be any service conditions attaching to the grant of shares under the ESP, and the full expense is recognised at grant date.
Fair value of shares granted
Shares granted under the ESP are accounted for as “in-substance” options due to the limited recourse nature of the loan between the employees and the Company to finance the purchase of ordinary shares. The fair value at grant date for the various tranches of shares issued under the ESP is determined using a Black Scholes methodology using the following model inputs:
October Issue
Shares issued 3,800,000
Loan price per share (AUD cents) 23.84
Valuation date 9 September 2014
Loan expiry date 14 October 2019
Underlying security spot price at valuation date (AUD cents) 33.5
Expected price volatility of the Company’s shares 140%
Expected dividend yield 0%
Expected life (years) 5.0
Risk-free interest rate 3.06%
Black Scholes valuation per share (AUD cents per share) 30.54
June Issue
Shares issued 5,000,000
Loan price per share (AUD cents) 17.36
Valuation date 30 June 2015
Loan expiry date 7 July 2020
Underlying security spot price at valuation date (AUD cents) 18.0
Expected price volatility of the Company’s shares 85.74%
Expected dividend yield 0%

NOTES TO THE FINANCIAL STATEMENTS FOR THE YEAR ENDED 30 JUNE 2015
58
Expected life (years) 5.0
Risk-free interest rate 2.32%
Black Scholes valuation per share (AUD cents per share) 12.38
Movements in employee share plan shares issued with limited recourse employee loans:
Date Details Number of Shares
Nominal Value
$
Balance at beginning of the year -
15 October 2014 Issued during period 3,800,000 905,920
30 June 2015 Issued during period 5,000,000 868,000
Balance at the end of the year 8,800,000 1,773,920
20. RELATED PARTY DISCLOSURES
Transactions between related parties are on normal commercial terms and conditions no more
favourable than those available to other parties unless otherwise stated.
Transactions with related parties :
(a) Parent entity
Kibaran Resources Limited is the parent entity.
(b) Subsidiaries
Interests in subsidiaries are set out in note 21.
(c) Key Management Personnel
Disclosures relating to key management personnel are set out in note 18 and the remuneration report
in the directors’ report.
(d) Transactions with related parties
Strategic Resource Management Pty Ltd, a company of which Mr Spinks and Mr Hodby are Directors,
provided the consolidated entity with geological services, a fully serviced office including
administration and information technology support totalling $101,000 (2014: $132,500) and
reimbursement of payments for drilling and explorations costs in Tanzania and minor expenses at a
cost of $100,671 (2014: $160,612). As at 30 June 2015 there is $18,700 (2014: $59,359) payable to
Strategic Resource management Pty Ltd.
These transactions have been entered into under normal commercial terms and at market rates.
21. SUBSIDIARIES
Country of Incorporation Percentage Owned (%) 2015 2014
Subsidiaries of Kibaran Resources Ltd:
Tanzanian Exploration Company Pty Ltd Australia 100 100

NOTES TO THE FINANCIAL STATEMENTS FOR THE YEAR ENDED 30 JUNE 2015
59
Castillian Resources (Tanzania) Limited Tanzania 100 100
Kibaran Nickel Tanzania Limited Tanzania 100 100
TanzGraphite Pty Ltd Australia 100 100
TanzGraphite (TZ) Limited Tanzania 100 100
22. PARENT ENTITY INFORMATION
Set out below is the supplementary information about the parent entity.
Statement of comprehensive income
2015 $
2014 $
Loss after income tax (7,380,117) (1,767,693)
Total comprehensive income (7,380,117) (1,767,693)
Statement of financial position
Total current assets 4,559,600 363,179
Total assets 7,899,743 4,224,596
Total current liabilities 120,263 239,531
Total liabilities 120,263 239,531
Equity
Issued capital 24,059,748 13,025,803
Share option reserve 1,778,147 1,637,560
Accumulated losses (18,058,415) (10,678,298 )
Total equity 7,779,480 3,985,065
Guarantees entered into by the parent entity in relation to the debts of its subsidiaries
The parent entity had no guarantees in relation to the debts of its subsidiaries as at 30 June 2015 and 30
June 2014.
Contingent liabilities
The parent entity had no contingent liabilities as at 30 June 2015.
Capital commitments - Property, plant and equipment
The parent entity had no capital commitments for property, plant and equipment as at 30 June 2015 and
30 June 2014
Significant accounting policies
The accounting policies of the parent entity are consistent with those of the consolidated entity, as
disclosed in note 1, except for the following
• Investments in subsidiaries are accounted for at cost, less any impairment, in the parent entity
• Associates are accounted for at cost, less any impairment, in the parent entity
NOTES TO THE FINANCIAL STATEMENTS FOR THE YEAR ENDED 30 JUNE 2015
60
23. FINANCIAL INSTRUMENTS
The consolidated entity's activities expose it to a variety of financial risks, market risk (including foreign
currency risk and interest rate risk), credit risk and liquidity risk. The consolidated entity's overall risk
management program focuses on the unpredictability of financial markets and seeks to minimise
potential adverse effects on the financial performance of the consolidated entity. Given the nature and
size of the business and uncertainty as to the timing and amount of cash inflows and outflows, the
consolidated entity does not enter into derivative transactions to mitigate the financial risks. In addition,
the consolidated entity’s policy is that no trading in financial instruments shall be undertaken for the
purposes of making speculative gains. As the consolidated entity's operations change, the directors will
review this policy periodically going forward.
The Company’s financial instruments consist mainly of cash, short-term deposits with banks, local money
market instruments and accounts payable. The main purpose of these financial instruments is to finance
the Company’s operations. The Company has various other financial instruments such as trade
receivables and trade payables, which arise directly from its operations. It is, and has been throughout
the period under review, the Company’s policy that no trading in financial instruments shall be
undertaken.
Details of the significant accounting policies and methods adopted, include the criteria for recognition,
the basis of measurement and the basis on which income and expense are recognised, in respect of
each class of financial asset, financial liability and equity instrument are disclosed in note 1 to the financial
statements.
The main risks arising from the Company’s financial instruments are foreign currency risk, interest rate risk,
liquidity risk and credit risk. The board reviews and agrees policies for managing each of these risks and
they are summarised below.
Fair values
Unless otherwise stated, the carrying amounts of financial instruments reflect their fair value. The carrying
amounts of trade receivables and trade payables are assumed to approximate their fair values due to their
short-term nature.
Foreign currency risk
The consolidated entity undertakes certain transactions denominated in foreign currency and are exposed
to foreign currency risk through foreign exchange rate fluctuations.
Foreign exchange risk arises from future commercial transactions and recognised financial assets and
financial liabilities denominated in a currency that is not the entity’s functional currency. The risk is
measured using sensitivity analysis and cash flow forecasting.

NOTES TO THE FINANCIAL STATEMENTS FOR THE YEAR ENDED 30 JUNE 2015
61
The consolidated entity operates internationally and is exposed to foreign exchange risk arising from
currency exposures to the US$, ZAR and EUR due to its operations in Tanzania. Exploration activity in
overseas operations is transacted in US$, TZS, ZAR and EUR.
The carrying amount of the consolidated entity's foreign currency denominated financial assets and
financial liabilities at the reporting date was as follows:
Assets Liabilities
2015 $
2014 $
2015 $
2014 $
US Dollars 162,950 64,179 - 137,905
Euro - - 6,540 10,252
162,950 64,179 6,540 148,157
AUD strengthened AUD weakened
% change Effect on
profit before
tax
Effect on
equity
% change Effect on
profit before
tax
Effect on
equity
2015
AUD to foreign currencies 5% 8,148 8,148 5% 8,148 (8,148)
2014
AUD to foreign currencies 5% 7,408 10,617 5% (7,408) (10,617)
The percentage change is the expected overall volatility of the significant currencies, which is based on
management’s assessment of reasonable possible fluctuations taking into consideration movements over
the last 6 months each year and the spot rate at each reporting date.

NOTES TO THE FINANCIAL STATEMENTS FOR THE YEAR ENDED 30 JUNE 2015
62
Interest rate risk
The Company’s exposure to market risk for changes in interest rates relates primarily to the Company’s
cash, local money market instruments and short-term deposits. Cash includes funds held in term deposits
and cheque accounts during the year, which earned variable interest at rates ranging between 0% to
3.6% (2014: 0% to 4.3%), depending on the bank account type and account balances. The Company has
no loans or borrowings.
At the reporting date, the interest rate profile for the Company and the Company interest-bearing
financial instruments was:
30 June 2015 30 June 2014
Carrying amount
Fair Value Carrying amount
Fair Value
Cash and cash equivalents 4,648,784 4,648,784 524,746 524,746
Carrying Amount ($)
2015 2014
Variable rate financial assets 4,648,784 524,746
A change of 1% in the variable interest rates at the reporting date would have increased/decreased profit
and loss and equity by the amounts shown below. The analysis that all other variables remain constant.
2015 2014
$ $
1% increase 46,488 5,247
1% decrease (46,488) (5,247)
The percentage change is based on the expected volatility of interest rates using market data and
analysts forecasts.
Liquidity risk
Vigilant liquidity risk management requires the consolidated entity to maintain sufficient liquid assets
(mainly cash and cash equivalents) and available borrowing facilities to be able to pay debts as and
when they become due and payable.
The consolidated entity manages liquidity risk by maintaining adequate cash reserves by continuously
monitoring actual and forecast cash flows and matching the maturity profiles of financial assets and
liabilities.

NOTES TO THE FINANCIAL STATEMENTS FOR THE YEAR ENDED 30 JUNE 2015
63
The following tables detail the consolidated entity's remaining contractual maturity for its financial
instrument liabilities. The tables have been drawn up based on the undiscounted cash flows of financial
liabilities based on the earliest date on which the financial liabilities are required to be paid. The tables
include both interest and principal cash flows disclosed as remaining contractual maturities and therefore
these totals may differ from their carrying amount in the statement of financial position.
2015
Carrying
Amount
$
Contractual
Cash Flows
$
1 year
or less
$
Between 1
and 2 years
$
Between 2
and 5 years
$
Over 5
Years
$
Trade and other payables 203,593 203,593 203,593 - - -
2014
Trade and other payables 421,150 421,150 421,150 - - -
Credit risk
Credit risk refers to the risk that a counterparty will default on its contractual obligations resulting in financial
loss to the consolidated entity. The consolidated entity has a strict code of credit, including obtaining
agency credit information, confirming references and obtains guarantees where appropriate to mitigate
credit risk. The maximum exposure to credit risk at the reporting date to recognised financial assets is the
carrying amount, net of any provisions for impairment of those assets, as disclosed in the statement of
financial position and notes to the financial statements. The consolidated entity does not hold any
collateral.
The consolidated entity does not have any significant credit risk exposure to any single counterparty or any
group of counterparties having similar characteristics. The credit risk on liquid funds is limited because the
counterparties are banks with high credit-ratings assigned by international credit-rating agencies.
Capital risk management
The consolidated entity’s objectives when managing capital are to safeguard the ability to continue as a
going concern, so that the consolidated entity can continue to provide returns for shareholders and
benefits for other stakeholders and to maintain an optimal capital structure to reduce the cost of capital.
The consolidated entity’s overall strategy remains unchanged from 2014.
Operating cash flows are used to maintain and expand operations, as well as to make routine
expenditures such as tax, dividends and general administrative outgoings.
Gearing levels are reviewed by the Board on a regular basis in line with its target gearing ratio, the cost of
capital and the risks associated with each class of capital.
In order to maintain or adjust the capital structure, the consolidated entity may issue new shares or sell
assets to reduce debts.

NOTES TO THE FINANCIAL STATEMENTS FOR THE YEAR ENDED 30 JUNE 2015
64
24. CONTINGENT LIABILITIES
The Board is not aware of any other circumstances or information which leads them to believe there
are any material contingent liabilities outstanding as at 30 June 2015.
25. EVENTS AFTER BALANCE DATE
Subsequent to 30 June 2015 Kibaran announced that it had been granted a Mining Licence for its
Epanko Graphite Project paving the way for the development of Epanko. The Group has also released
the results of a Bankable Feasibility Study for the Epanko Graphite Project showing the technical and
commercial viability of the Project. This positive result then led to the finalisation of an Offtake
Agreement with German conglomerate, ThyssenKrupp, for 50% of the planned output at Epanko,
further strengthening its development potential.
Other than this there have not been any events that have arisen in the interval between the end of
the financial year and the date of this report or any other item, transaction or event of a material and
unusual nature likely, in the opinion of the Directors of the Company, to affect significantly the
operations of the Company, the results of those operations or the state of affairs of the Company, in
future financial years.

DIRECTORS DECLARATION
65
The Directors of the Company declare that:
1) The financial statements, comprising the statement of profit or loss and other comprehensive income, statement of financial position, statement of cash flows, statement of changes in equity, accompanying notes, are in accordance with the Corporations Act 2001 and:
a) comply with Accounting Standards and the Corporations Regulations 2001; and
b) give a true and fair view of the financial position as at 30 June 2015 and of the performance for the year ended on that date of the consolidated entity.
2) The Company has included in the notes to the financial statements an explicit and unreserved statement of compliance with International Financial Reporting Standards.
3) Subject to the achievement of the matters set out in Note 1(a), in the Directors’ opinion, there are reasonable grounds to believe that the Company will be able to pay its debts as and when they become due and payable
4) The Directors have been given the declarations by the Chief Executive Officer and Chief Financial Officer required by section 295A.
This declaration is made in accordance with a resolution of the Board of Directors and is signed for and on behalf of the Directors by:
Andrew Spinks
Managing Director
Perth, 30 September 2015

A member firm of Ernst & Young Global Limited
Liability limited by a scheme approved under Professional Standards Legislation
GB:ET:KNL:016
Ernst & Young 11 Mounts Bay Road Perth WA 6000 Australia GPO Box M939 Perth WA 6843
Tel: +61 8 9429 2222 Fax: +61 8 9429 2436 ey.com/au
Independent auditor's report to the members of Kibaran Resources Limited
Report on the financial report
We have audited the accompanying financial report of Kibaran Resources Limited, which comprises the statement of financial position as at 30 June 2015, the statement of comprehensive income, the statement of changes in equity and the statement of cash flows for the year then ended, notes comprising a summary of significant accounting policies and other explanatory information, and the directors' declaration of the consolidated entity comprising the company and the entities it controlled at the year's end or from time to time during the financial year.
Directors' responsibility for the financial report
The directors of the company are responsible for the preparation of the financial report that gives a true and fair view in accordance with Australian Accounting Standards and the Corporations Act 2001 and for such internal controls as the directors determine are necessary to enable the preparation of the financial report that is free from material misstatement, whether due to fraud or error. In Note 1, the directors also state, in accordance with Accounting Standard AASB 101 Presentation of Financial Statements, that the financial statements comply with International Financial Reporting Standards.
Auditor's responsibility
Our responsibility is to express an opinion on the financial report based on our audit. We conducted our audit in accordance with Australian Auditing Standards. Those standards require that we comply with relevant ethical requirements relating to audit engagements and plan and perform the audit to obtain reasonable assurance about whether the financial report is free from material misstatement.
An audit involves performing procedures to obtain audit evidence about the amounts and disclosures in the financial report. The procedures selected depend on the auditor's judgment, including the assessment of the risks of material misstatement of the financial report, whether due to fraud or error. In making those risk assessments, the auditor considers internal controls relevant to the entity's preparation and fair presentation of the financial report in order to design audit procedures that are appropriate in the circumstances, but not for the purpose of expressing an opinion on the effectiveness of the entity's internal controls. An audit also includes evaluating the appropriateness of accounting policies used and the reasonableness of accounting estimates made by the directors, as well as evaluating the overall presentation of the financial report.
We believe that the audit evidence we have obtained is sufficient and appropriate to provide a basis for our audit opinion.
Independence
In conducting our audit we have complied with the independence requirements of the Corporations Act 2001. We have given to the directors of the company a written Auditor’s Independence Declaration, a copy of which is included in the directors’ report.

A member firm of Ernst & Young Global Limited
Liability limited by a scheme approved under Professional Standards Legislation
GB:ET:KNL:016
Opinion
In our opinion:
(a) the financial report of Kibaran Resources Limited is in accordance with the Corporations Act 2001, including:
(i) giving a true and fair view of the consolidated entity's financial position as at 30 June 2015 and of its performance for the year ended on that date; and
(ii) complying with Australian Accounting Standards and the Corporations Regulations 2001; and
(b) the financial report also complies with International Financial Reporting Standards as disclosed in Note 1.
Emphasis of Matter
Without qualifying our opinion, we draw attention to Note 1 in the financial report. These conditions indicate the existence of a material uncertainty that may cast significant doubt about the consolidated entity’s ability to continue as a going concern and therefore, the consolidated entity may be unable to realise its assets and discharge its liabilities in the normal course of business.
Report on the remuneration report
We have audited the Remuneration Report included in the directors' report for the year ended 30 June 2015. The directors of the company are responsible for the preparation and presentation of the Remuneration Report in accordance with section 300A of the Corporations Act 2001. Our responsibility is to express an opinion on the Remuneration Report, based on our audit conducted in accordance with Australian Auditing Standards.
Opinion
In our opinion, the Remuneration Report of Kibaran Resources Limited for the year ended 30 June 2015, complies with section 300A of the Corporations Act 2001.
Ernst & Young Gavin Buckingham Partner Perth 30 September 2015

ASX ADDITIONAL INFORMATION
68
a) Distribution of Listed Securities (as at 21 September 2015)
Fully Paid Ordinary Shares
Number of holders
1 - 1,000 22,529 71 1,001 - 5,000 1,170,247 371 5,001 - 10,000 2,562,687 312 10,001 - 100,000 35,046,136 894 100,001 - and over 128,827,624 248 TOTAL 167,629,223 1,896
b) Top Twenty Ordinary Shareholders (as at 21 September 2015)
Name Number of Ordinary Shares
held
%
STRATEGIC RESOURCE MANAGEMENT PTY LTD 13,217,736 7.94
J P MORGAN NOMINEES AUSTRALIA LIMITED 8,178,678 4.92
TALISMAN CAPITAL PTE LTD 4,882,353 2.93
MR MARK CHRISTOPHER JOBLING 3,855,000 2.32
DR PETER DENNETT MEIER & MRS LYNETTE SUZANNE MEIER 3,692,093 2.22
COLBERN FIDUCIARY NOMINEES PTY LTD 3,327,000 2.00
MR ANDREW PETER SPINKS <A S GOLD SF A/C> 3,199,962 1.92
TY WEBB PTY LTD <TY WEBB A/C> 2,972,300 1.79
HSBC CUSTODY NOMINEES (AUSTRALIA) LIMITED 2,881,315 1.73
DAVID HODBY NOMINEES PTY LTD <HODBY SUPER FUND> 2,395,536 1.44
GOLD ELEGANT (HK) INVESTMENT LIMITED 1,600,000 0.96
MR NICOLA CONIDI & MRS GIANNINA CONIDI <NICK & JAN CONIDI S/F A/C> 1,593,000 0.96
GRANT PIERCE 1,545,000 0.93
GP SECURITIES 1,500,000 0.90
RWH NOMINEES PTY LTD <RWH A/C> 1,307,000 0.79
IDINOC PTY LTD <J & R CONIDI FAMILY> 1,250,000 0.75
ANDREW SPINKS 1,250,000 0.75
GR ENGINEERING SERVICES LIMITED 1,470,588 0.88
MR TONY ATHAS & MRS ANGELA ATHAS <ATHAS FAMILY SUPER FUND A/C> 1,050,000 0.63
LTL CAPITAL PTY LTD <LTL CAPITAL TRADING A/C> 1,000,000 0.60
Total Top 20 Shareholders 62,167,561 37.36
Other Shareholders 104,211,662 62.64
Total ordinary shares on issue 166,379,223 100.00

ASX ADDITIONAL INFORMATION
69
c) Non marketable parcels (as at 21 September 2015)
The number of shareholders holding less than a marketable parcel of shares is 201, totalling 274,025 ordinary shares.
d) Voting rights
All ordinary shares (whether fully paid or not) carry one vote per share without restriction.
e) Franking Credits
The Company has nil franking credits.
f) Restricted Securities (as at 21 September 2015)
The Company has 1,250,000 securities subject to voluntary escrow until the 27 October 2015.
g) Substantial Shareholders (as at 21 September 2015)
Name Number of Ordinary Shares held
%
Andrew Spinks 18,001,998 10.75
h) On-Market Buy Back
There is no current on market buy back.

ASX ADDITIONAL INFORMATION
70
i) Other Securities on issue (as at 21 September 2015)
Options
(1) Options
(2) Options
(3) Options
(4) Options
(5) Options
(6) Options
(7) Performance
Shares (9)
1 – 1,000 2 1 2 4 1 2 8 1 1,001 – 5,000 - - - - - - - - 5,001 – 10,000 - - - - - - - - 10,001 – 100,000 - - - - - - - - 100,001 and over - - - - - - - - 2 1 2 4 1 2 8 1
Options (1)
Options (2)
Options (3)
Options (4)
Options (5)
Options (6)
Options (7)
Performance Shares
(9) Number on issue 700,000 700,000 800,000 4,000,000 4,000,000 750,000 1,050,000 15,000,000 Number of holders 2 1 2 4 1 2 8 1 Yoix Pty Ltd - - - 1,000,000 - - - - Castillian Resources Limited - - - - - - - 15,000,000 Grant Pierce - - 300,000 1,500,000 - - - - John Park - - 500,000 1,000,000 - - - - Sven Olson - - - 500,000 - - 250,000 - Argonaut Securities - - - - 4,000,000 - - - Christoph Frey - - - - - 250,000 - - Joint Gain Worldwide Ltd - - - - - - 100,000
*details of holders of employee share options are exempt from disclosure under Chapter 4 of the Listing Rules
Number Expiry Exercise Price Number of Options 1 30/09/2015 $0.35 700,000 2 31/03/2016 $0.40 700,000 3 11/02/2017 $0.27 800,000 4 11/05/2017 $0.193 4,000,000 5 26/10/2017 $0.40 4,000,000 6 17/10/2017 $0.30 750,000 7 13/07/2017 $0.174 1,050,000 8 The performance shares will convert into 15,000,000 ordinary shares upon achievement of milestones as noted in the Castillian
Resources share sale agreement entered on 21 October 2010.

ASX ADDITIONAL INFORMATION
71
The tenements below are located in Tanzania and are 100% owned by Kibaran Resources Limited group and controlled by the following subsidiaries:
Tenements controlled by TanzGraphite (TZ) Ltd:
Ministry ID Area (square km) Expiry Date ML 548/2015 9.49 12/07/2025 PL 7906/2012 130.49 14/05/2016 PL 7907/2012 53.78 24/05/2016 PL 7915/2012 92.28 24/05/2016 PL 7918/2012 121.88 14/05/2016 PL 9306/2013 35.31 2-Aug-17 PL 9331/2013 2.76 4-Oct-17 PL 9537/2014 84.00 15-Jan-18
PL 10090/2015 44.88 10/08/2018 PL 10091/2015 114.22 10/08/2018 PL 10092/2015 23.23 10/08/2018 PL 10388/2014 2.57 13-Nov-18 PL 10389/2014 103.56 15-Nov-18 PL 10390/2014 2.81 15-Nov-18 PL 10392/2014 133.95 15-Nov-18 PL 10394/2014 9.74 15-Nov-18 PL 10396/2014 152.43 14-Nov-18
Tenements controlled by Castillian Resources (Tanzania) Ltd:
Ministry ID Area (sq. km) Expiry date PL 4985/2008 30.71 19/09/2016 PL 5306/2011 44.65 27/08/2016 PL 5192/2008 23.93 17/07/2016 PL 8368/2012 157.62 12/11/2016

ASX ADDITIONAL INFORMATION
72
Mineral Resource Estimation - Governance Statement Kibaran Resources Limited ensures that the Mineral Resource estimates are subject to appropriate levels of governance and internal controls. The Mineral Resource estimation procedures are well established and are subject to systematic internal peer review and external technical review undertaken by highly competent and qualified professionals. These reviews have not identified any material issues and are undertaken as part of a formal risk assessment. The Company periodically reviews the governance framework in line with the expansion and development of its business.
Kibaran Resources Limited reports its Mineral Resources on an annual basis in accordance with the ‘Australasian Code for Reporting of Exploration Results, Mineral Resources and Ore Reserves’ (the JORC Code) 2012 Edition. Mineral Resources are quoted inclusive of Ore Reserves. Competent Persons named by the Company are Members or Fellows of the Australian Institute of Mining and Metallurgy and/or the Australian Institute of Geoscientists and qualify as Competent Persons as defined in the JORC Code.
The tables below set out Mineral Resource comparatives for 2014 and 2015.
Mineral Resource Statement Note: totals may not sum exactly due to rounding
Table 1 – Epanko Mineral Resource Estimate as at 30 June 2015
Mineral Resource
Classification
Tonnage (Mt) Grade (%TGC) Contained Graphite (t)
Measured 6.6 9.7 635,800
Indicated 7.9 10.0 785,300
Inferred 8.8 8.7 773,500
Total 23.3 9.8 2,194,600
Table 2 – Epanko Mineral Resource Estimate as at 30 June 2014
Mineral Resource
Classification
Tonnage (Mt) Grade (%TGC) Contained Graphite (t)
Indicated 12.8 10.0 1,281,200
Inferred 9.9 9.6 942,100
Total 22.7 9.8 2,223,300

ASX ADDITIONAL INFORMATION
73
Table 3 – Merelani –Arusha Mineral Resource Estimate as at 30 June 2015
Mineral Resource
Classification
Tonnage
(Mt)
Grade
(%TGC)
Contained
Graphite (t)
Indicated 7.4 6.7 500,000
Inferred 10.3 6.3 650,000
Total 17.7 6.5 1,150,000
There was no mineral resource estimate at Merelani Arusha as at 30 June 2014. Notes for table 1, 2 and 3
• Tonnage figures contained within Table 1 have been rounded to nearest 1000. % TGC grades are rounded to 1 decimal figure. • The Mineral Resource is quoted from blocks where the TGC (%) grade is greater than 8%. • Abbreviations used: Mt = 1,000,000 tonnes
The information in this report that relates to Exploration Results is based on information compiled by Mr Andrew Spinks, a
Competent Person, who is a Member of The Australasian Institute of Mining and Metallurgy. Andrew Spinks is employed by
Kibaran Resources Limited. Mr Spinks has sufficient experience which is relevant to the style of mineralisation and type of
deposit under consideration and to the activity which he is undertaking to qualify as a Competent Person as defined in
the 2012 Edition of the “Australasian Code for Reporting of Exploration Results, Mineral Resources and Ore Reserves”.
Andrew Spinks consents to the inclusion in the report of the matters based on his information in the form and context in
which it appears.
The information in this report that relates to Mineral Resources is based on information compiled by Mr David Williams, a
Competent Person, who is a Member of The Australasian Institute of Mining and Metallurgy. David Williams is employed by
CSA Global Pty Ltd, an independent consulting Company. Mr Williams has sufficient experience which is relevant to the
style of mineralisation and type of deposit under consideration and to the activity which he is undertaking to qualify as a
Competent Person as defined in the 2012 Edition of the “Australasian Code for Reporting of Exploration Results, Mineral
Resources and Ore Reserves”. David Williams consents to the inclusion in the report of the matters based on his
information in the form and context in which it appears.