annual report - dar es salaam stock exchange financial... · the dar es salaam stock exchange (dse)...
TRANSCRIPT
Dar es Salaam Stock ExchangeTwiga Building, 4th Floor
Samora AvenueP.O. Box 70081
Tel: + 255 22 2135779, 2123983, 2128522Fax: + 255 22 2133849E-Mail: [email protected]
Website: http://www.dse.co.tz
Annual Reportand Financial Statementsfor the year ended 30 June 2012
Dar es Salaam Stock Exchange Limited
Annual Report and Financial Statementsfor the year ended 30 June 2012
Dar es Salaam Stock Exchange Limited
14th Floor, Golden Jubilee Towers, Ohio Street
P. O. Box 70081, Dar es Salaam, Tanzania
Tel: +255 22 2128522 / 2123983; Fax: +255 22 213349
Email: [email protected]
Website: www.dse.co.tz
| ii |
Annual Report and Financial Statements for the year ended 30 June 2012
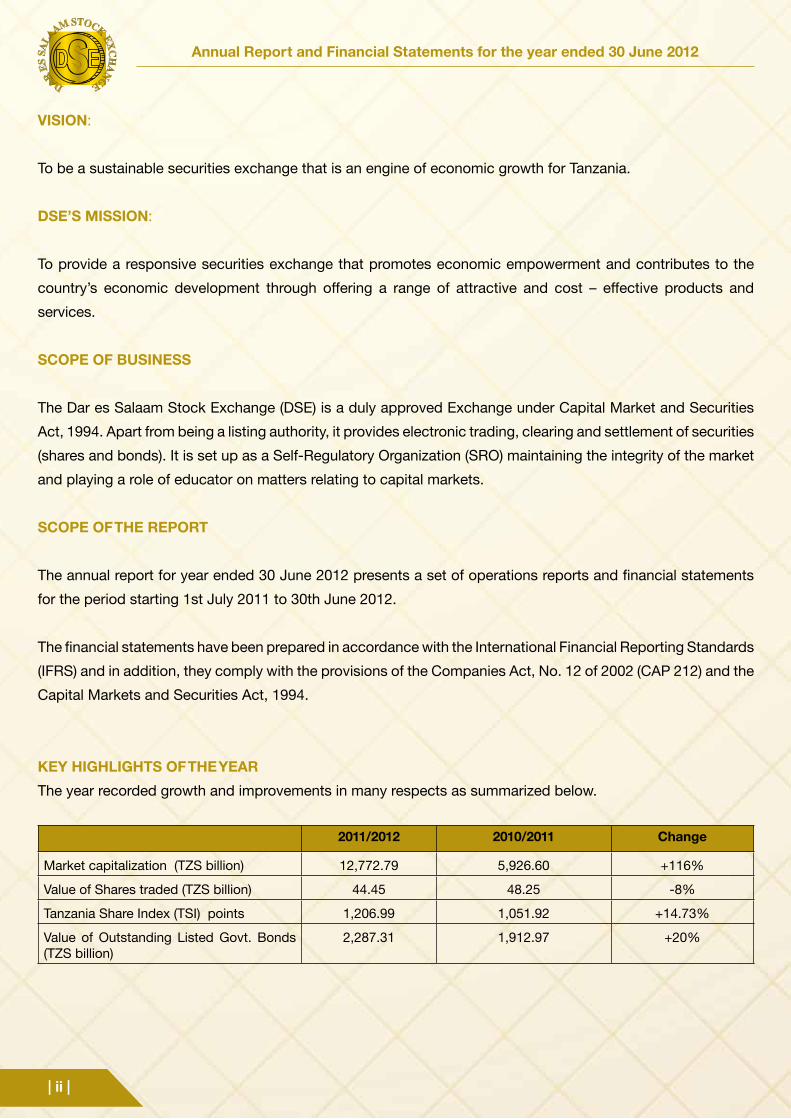
VISION:
To be a sustainable securities exchange that is an engine of economic growth for Tanzania.
DSE’S MISSION:
To provide a responsive securities exchange that promotes economic empowerment and contributes to the
country’s economic development through offering a range of attractive and cost – effective products and
services.
SCOPE OF BUSINESS
The Dar es Salaam Stock Exchange (DSE) is a duly approved Exchange under Capital Market and Securities
Act, 1994. Apart from being a listing authority, it provides electronic trading, clearing and settlement of securities
(shares and bonds). It is set up as a Self-Regulatory Organization (SRO) maintaining the integrity of the market
and playing a role of educator on matters relating to capital markets.
SCOPE OF THE REPORT
The annual report for year ended 30 June 2012 presents a set of operations reports and financial statements
for the period starting 1st July 2011 to 30th June 2012.
The financial statements have been prepared in accordance with the International Financial Reporting Standards
(IFRS) and in addition, they comply with the provisions of the Companies Act, No. 12 of 2002 (CAP 212) and the
Capital Markets and Securities Act, 1994.
KEY HIGHLIGHTS OF THE YEAR
The year recorded growth and improvements in many respects as summarized below.
2011/2012 2010/2011 Change
Market capitalization (TZS billion) 12,772.79 5,926.60 +116%
Value of Shares traded (TZS billion) 44.45 48.25 -8%
Tanzania Share Index (TSI) points 1,206.99 1,051.92 +14.73%
Value of Outstanding Listed Govt. Bonds (TZS billion)
2,287.31 1,912.97 +20%
Annual Report and Financial Statements for the year ended 30 June 2012
| iii |
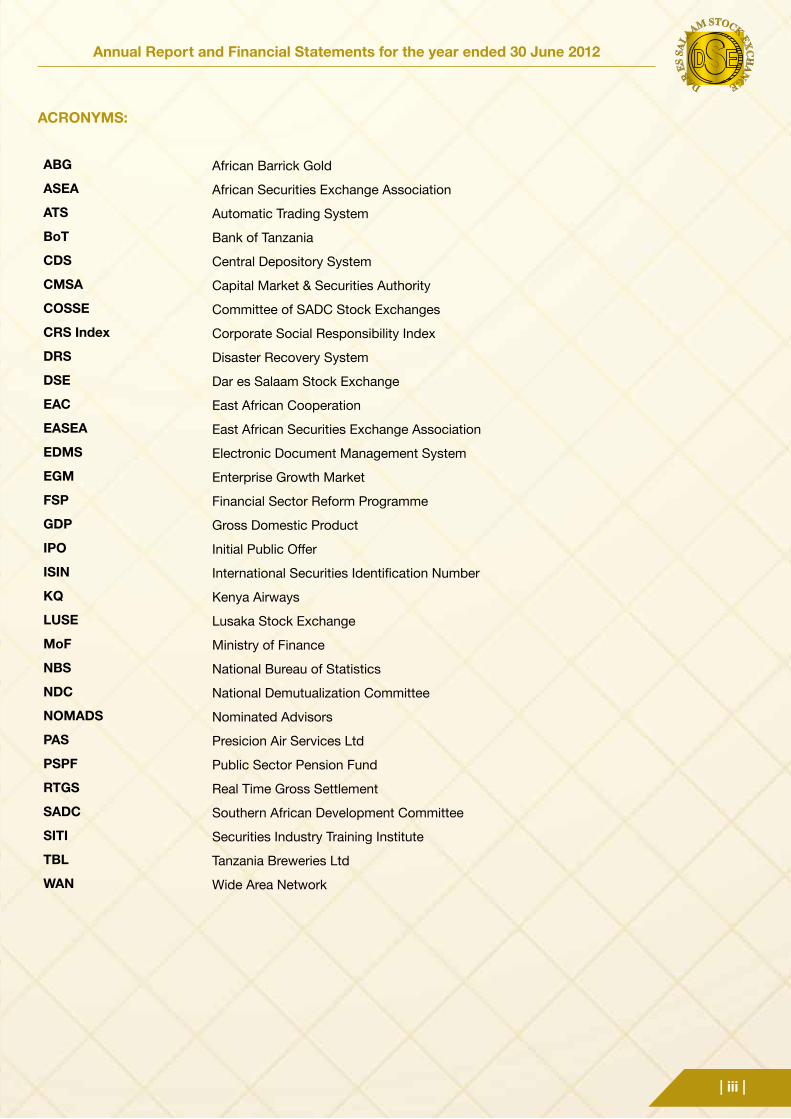
ACRONYMS:
ABG African Barrick Gold
ASEA African Securities Exchange Association
ATS Automatic Trading System
BoT Bank of Tanzania
CDS Central Depository System
CMSA Capital Market & Securities Authority
COSSE Committee of SADC Stock Exchanges
CRS Index Corporate Social Responsibility Index
DRS Disaster Recovery System
DSE Dar es Salaam Stock Exchange
EAC East African Cooperation
EASEA East African Securities Exchange Association
EDMS Electronic Document Management System
EGM Enterprise Growth Market
FSP Financial Sector Reform Programme
GDP Gross Domestic Product
IPO Initial Public Offer
ISIN International Securities Identification Number
KQ Kenya Airways
LUSE Lusaka Stock Exchange
MoF Ministry of Finance
NBS National Bureau of Statistics
NDC National Demutualization Committee
NOMADS Nominated Advisors
PAS Presicion Air Services Ltd
PSPF Public Sector Pension Fund
RTGS Real Time Gross Settlement
SADC Southern African Development Committee
SITI Securities Industry Training Institute
TBL Tanzania Breweries Ltd
WAN Wide Area Network
| iv |
Annual Report and Financial Statements for the year ended 30 June 2012
CONTENTS PAGE
Chairman’s Statement 1- 2
Members of Governing Council 3
Chief Executive Officer’s Report 4 – 8
DSE Management 9
Council Members’ Report 10 – 13
Statement of Council Members’ Responsibilities 14
Auditors Report 15 – 18
Financial Statements 19 – 23
Notes to the Financial Statements 24 – 44
Fidelity Fund 45 – 61
Member Firms 62 – 64
Annual Report and Financial Statements for the year ended 30 June 2012
| 1 |
CHAIRMANS’ STATEMENT
It is my pleasure to present to you the Annual Report and Financial Statements for the
year ended 30th June 2012. Despite the globally experienced economic slowdown,
the Dar es Salaam Stock Exchange (DSE) stood firm in the delivery of its services to
the investors.
During the financial year 2011/2012, DSE registered a number of milestone
achievements supporting realisation of the DSE vision of being a sustainable securities
exchange that is an engine of the country’s economic growth. A number of strategic
initiatives were initiated and carried out during the period. The 5 Year (2012/13 – 2016/17) Business Plan was
put in place by the Governing Council. The Plan is aimed at steering the DSE to increased activity volumes,
broader range of products, streamlined operations and commercialization. During the period, a consulting team
was also commissioned to put in place the demutualization options for the Exchange and the roadmap to a
demutualized DSE. The task will be completed during year 2012/2013.
Cognizant of a fact that most DSE rules were adopted since 1998 and a lot of development has happened since
then, a gap analysis on the rules book (DSE Blue Print) was initiated during the year. Following the rules book
gap analysis, procurement process for a consultant to undertake the DSE Blue Print review was initiated with
the actual review exercise slated for the year 2012/2013. During the period, DSE acquired its own building in a
remote location for use as Disaster Recovery Site (DRS). A full range of new ICT equipment’s were procured to
replace the ageing hardware at the main office and for installation at the DRS. The procured ICT equipment are
expected to support increased operational efficiency in the Exchange. In May 2012 DSE offices were relocated
to the 14th Floor of Golden Jubilee Tower building, Ohio Street in Dar es Salaam to provide for more space for
planned activities and services and uplift corporate image of the Exchange.
During the year, the market capitalization doubled from TZS 5,926 billion to TZS 12,772 billion. The outstanding
achievement was caused by both the positive performance of the market indices’ and listing of new securities.
During the year Precision Air Limited and African Barrick Gold (ABG) were listed. Listing of Precision Air
increased the number of listed companies dealing with the air transport to two, after the Kenya Airways. On
the other hand, listing of the ABG made it the first mining company to list at the Exchange. With regards to the
fixed income securities, the outstanding listed debt securities increased by 20% during the year (i.e. from TZS
1,912.97 billion in June 2011 to TZS 2,287.31 in June 2012). The growth slowed down as the main issuer – the
government looked for alternative ways of raising funds. During the year 2011/12 treasury bonds worth TZS
433 billion were listed which was 47% of the amount listed in year 2010/2011 (i.e. TZS 918 billion). Secondary
market activity for both the equity and fixed income boards declined when compared to the level achieved
during the preceding year, 2010/2011. Equity turnover declined by 8% (i.e. from TZS 48.25 billion to TZS
| 2 |
Annual Report and Financial Statements for the year ended 30 June 2012
44.45 billion) while trading of the fixed income securities decreased by 32 % i.e. from TZS 363 billion to TZS
248 billion.
The recorded weaker performance in listing of treasury bonds and secondary market trading of securities
negatively impacted the financial performance during the year. The DSE internally generated revenue decreased
by 14% from TZS 1,077.40 million in 2010/2011 to TZS 930.97 million in 2011/2012. The Government support
through subvention also declined by 33% from TZS 500.90 in year 2010/2011 to TZS 333.80 in year 2011/2012.
The combined trend made the year one of the toughest during the recent history of the Exchange.
Going forward, the Exchange is still facing a number of challenges. The challenges among others include staffing
level, dearth of products and services and low level of public awareness regarding investment opportunities
at the Exchange. The 5 Year Business Plan (2012/13 to 2016/17), which its implementation will start in year
2012/13, aim at addressing these challenges. The plan seeks to make DSE assume its purposeful role in the
economy.
On behalf of the Governing Council Management and staff of the Dar es Salaam Stock Exchange, I wish to
acknowledge and extend our appreciation for the continued support of the Government of the United Republic
of Tanzania through the Ministry of Finance to the DSE. It is our sincere belief that the Government will continue
to support the DSE for the foreseeable future. I am also very grateful to all our development partners and market
stakeholders. During the year the Financial Sector Support Programme funded by the World Bank supported
replacement of the ICT equipment, the technical assistance on the DSE 5 year plan, and demutualisation
study. Financial Sector Deepening Trust (FSDT) had also started working on the awareness programme for the
Enterprises Market Segment at DSE. We look forward for continued cooperation and support.
I would also like to thank the DSE Management and entire team of staff for their dedication and commitment
in ensuring that the Exchange meets its strategic objectives even during challenging times. Lastly let me also
acknowledge with appreciation the outstanding role played by the Members of Governing Council. The
concerted efforts by the Management and the Governing Council should push even further the development
agenda of the DSE in years to come.
Pius A. Maneno
Chairman
DSE Governing Council

Annual Report and Financial Statements for the year ended 30 June 2012
| 3 |
MEMBERS OF GOVERNING COUNCIL
Mr. Pius A. Maneno Chairman
Mr. Andulile J. Mwakalyelye V/Chairman
Mr. Moremi Marwa Member
Mr. Gabriel D. Y. Kitua DSE - CEO Ex Officio
Mr. Rweyunga L. Malauri Member
Mr. Kisali G. SolomonMember
Mrs. Gilder F. KibolaMember
Mr. Nyanduga D. Mukirya Member
Mrs. Fatma S. Chakindo Member
Mr. Steve F. KilindoMember
Mrs. M. S. MniwasaDSE Legal Counsel
| 4 |
Annual Report and Financial Statements for the year ended 30 June 2012
CHIEF EXECUTIVE OFFICERS’ REPORT
2011/12 Economic overview
The rate of growth of Tanzania’s Gross Domestic Product (GDP) was 6.4% which was lower compared to year
2010/11 GDP of 7.0%. The slowdown in growth is largely attributed to drought conditions in some part of the
country which adversely affected agricultural production. Electricity outage contributed to low performance in
manufacturing and other economic activities that rely on electricity. Despite the slowdown in overall growth,
communication, financial intermediation, construction and education sub sector recorded higher growth rates
ranging between 6% and 19%.
Price Movement (inflation)
The annual average inflation rate rose from 10.9% in July 2011 to 17.4% in June 2012. The rise in inflation rate
was driven by continued increase in the average price of oil in the world market, drought which affected crop
harvest, depreciation of the shilling as well as rise in the price of gas and food. Also food shortage in the East
Africa region particularly in neighbouring countries Kenya, Uganda, Somalia and South Sudan fuelled food
inflation. To curb inflation the Government is taking a number of policy initiatives.
Source: Bank of Tanzania and National Bureau of Statistics.
Performance Review for 2011/12
Listings
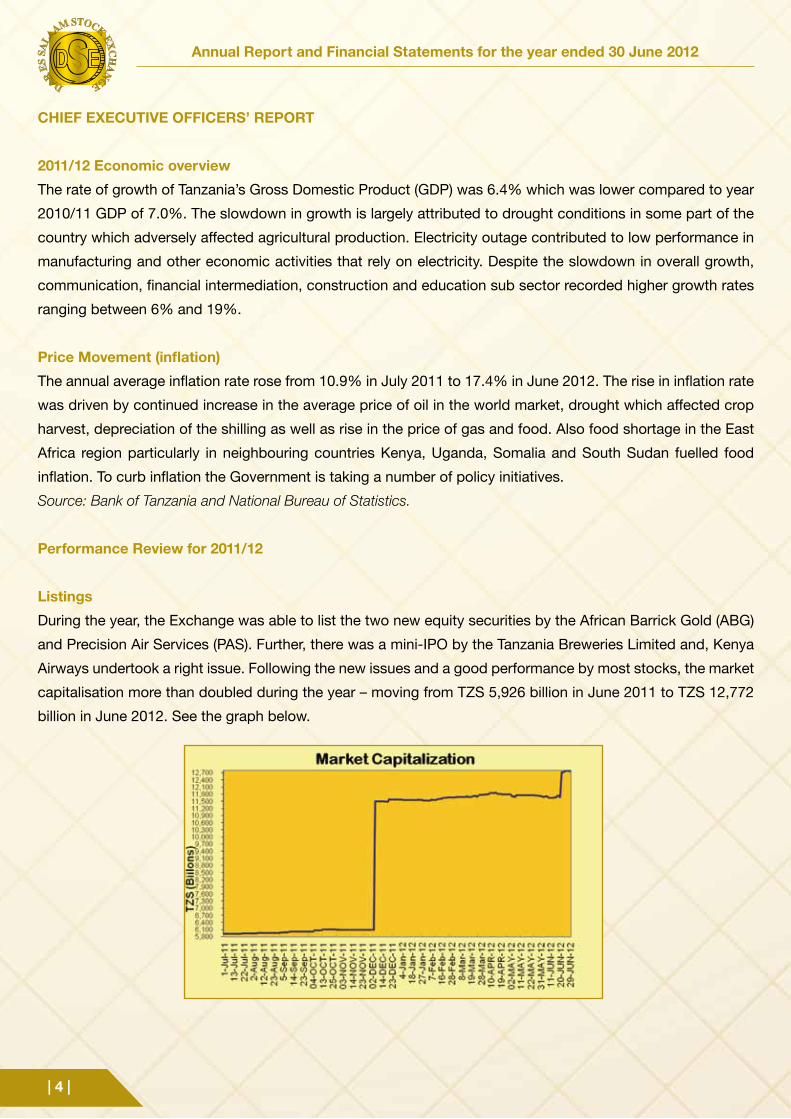
During the year, the Exchange was able to list the two new equity securities by the African Barrick Gold (ABG)
and Precision Air Services (PAS). Further, there was a mini-IPO by the Tanzania Breweries Limited and, Kenya
Airways undertook a right issue. Following the new issues and a good performance by most stocks, the market
capitalisation more than doubled during the year – moving from TZS 5,926 billion in June 2011 to TZS 12,772
billion in June 2012. See the graph below.
Annual Report and Financial Statements for the year ended 30 June 2012
| 5 |
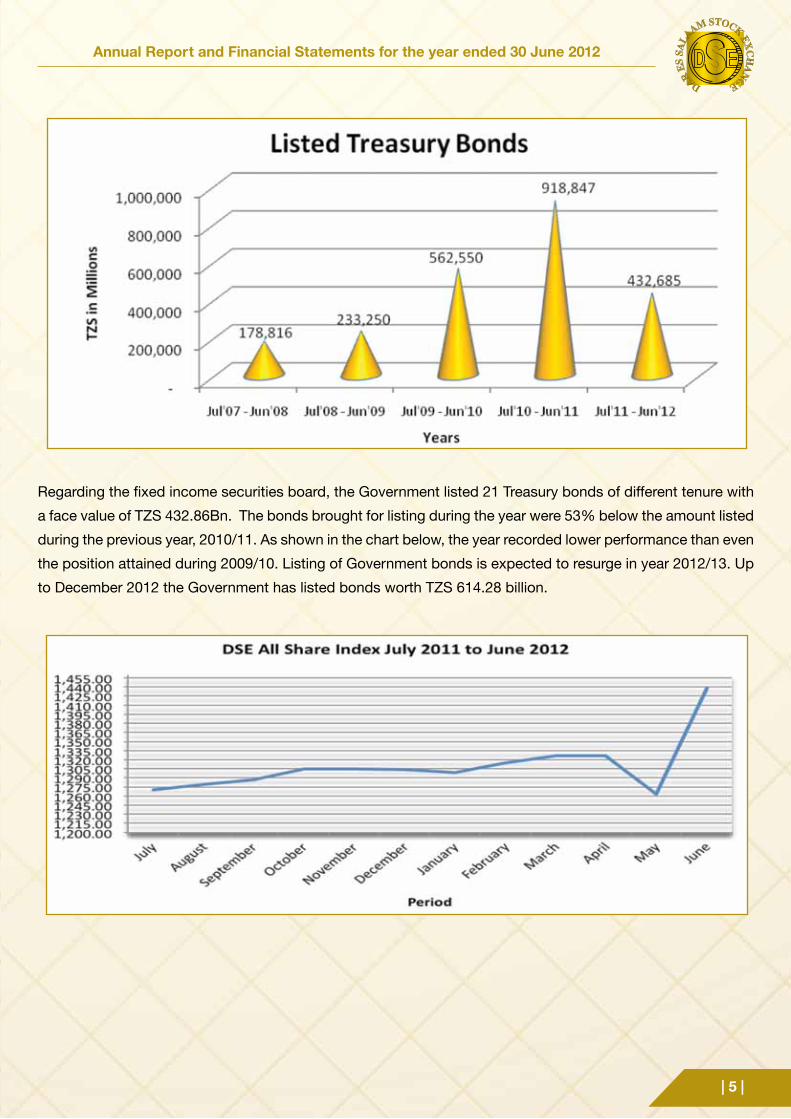
Regarding the fixed income securities board, the Government listed 21 Treasury bonds of different tenure with
a face value of TZS 432.86Bn. The bonds brought for listing during the year were 53% below the amount listed
during the previous year, 2010/11. As shown in the chart below, the year recorded lower performance than even
the position attained during 2009/10. Listing of Government bonds is expected to resurge in year 2012/13. Up
to December 2012 the Government has listed bonds worth TZS 614.28 billion.
| 6 |
Annual Report and Financial Statements for the year ended 30 June 2012
Trading
Equity Trading
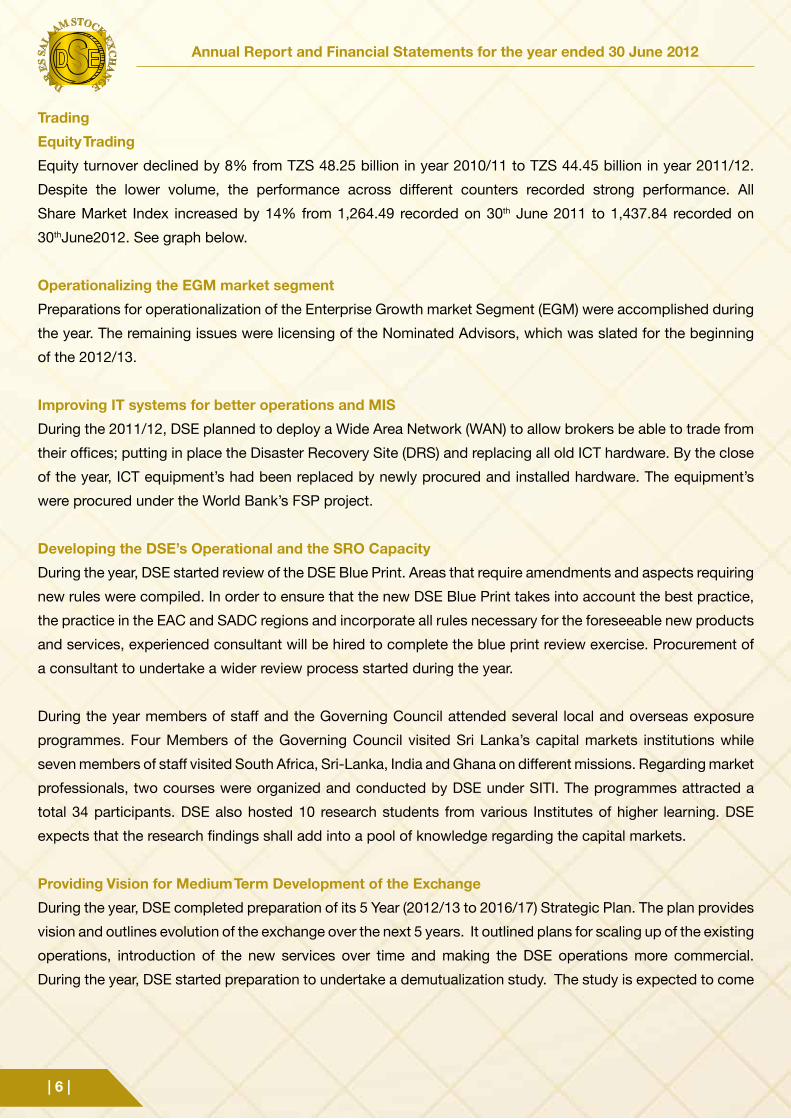
Equity turnover declined by 8% from TZS 48.25 billion in year 2010/11 to TZS 44.45 billion in year 2011/12.
Despite the lower volume, the performance across different counters recorded strong performance. All
Share Market Index increased by 14% from 1,264.49 recorded on 30th June 2011 to 1,437.84 recorded on
30thJune2012. See graph below.
Operationalizing the EGM market segment
Preparations for operationalization of the Enterprise Growth market Segment (EGM) were accomplished during
the year. The remaining issues were licensing of the Nominated Advisors, which was slated for the beginning
of the 2012/13.
Improving IT systems for better operations and MIS
During the 2011/12, DSE planned to deploy a Wide Area Network (WAN) to allow brokers be able to trade from
their offices; putting in place the Disaster Recovery Site (DRS) and replacing all old ICT hardware. By the close
of the year, ICT equipment’s had been replaced by newly procured and installed hardware. The equipment’s
were procured under the World Bank’s FSP project.
Developing the DSE’s Operational and the SRO Capacity
During the year, DSE started review of the DSE Blue Print. Areas that require amendments and aspects requiring
new rules were compiled. In order to ensure that the new DSE Blue Print takes into account the best practice,
the practice in the EAC and SADC regions and incorporate all rules necessary for the foreseeable new products
and services, experienced consultant will be hired to complete the blue print review exercise. Procurement of
a consultant to undertake a wider review process started during the year.
During the year members of staff and the Governing Council attended several local and overseas exposure
programmes. Four Members of the Governing Council visited Sri Lanka’s capital markets institutions while
seven members of staff visited South Africa, Sri-Lanka, India and Ghana on different missions. Regarding market
professionals, two courses were organized and conducted by DSE under SITI. The programmes attracted a
total 34 participants. DSE also hosted 10 research students from various Institutes of higher learning. DSE
expects that the research findings shall add into a pool of knowledge regarding the capital markets.
Providing Vision for Medium Term Development of the Exchange
During the year, DSE completed preparation of its 5 Year (2012/13 to 2016/17) Strategic Plan. The plan provides
vision and outlines evolution of the exchange over the next 5 years. It outlined plans for scaling up of the existing
operations, introduction of the new services over time and making the DSE operations more commercial.
During the year, DSE started preparation to undertake a demutualization study. The study is expected to come
Annual Report and Financial Statements for the year ended 30 June 2012
| 7 |
up with a roadmap towards a commercially run Exchange. It is expected that demutualization strategy study
will be concluded during the second quarter of the year 2012/13.
Providing proper office accommodation that uplifts the image of the Exchange
DSE offices were relocated during the year, moving from a relatively small office at Twiga house, Samora
Avenue, to a more spacious newly built Golden Jubilee Towers (PSPF building) – Ohio Street. The move was
a medium term measure as the DSE vision of DSE is to have own its own office. The new offices will support
better the planned Exchange’s operations that have been identified in the newly adopted 5 year plan.
Public Education Programmes
A number of public awareness programmes were conducted during the year. The programmes included,
educating 290 students from secondary schools and higher learning institutions who visited the Exchange.
Publication of DSE’s Quarterly Bulletins and other printed materials for public education were printed and
circulated. Also DSE organized tailor training for various media houses. A total of fifteen journalists attended
the training. Further, DSE participated with other institutions under the Ministry of Finance on the 50 years of
Independence exhibitions at Mnazi-Mmoja grounds and Mwalimu Nyerere grounds where more than seven
thousand people visited DSE pavilion during the 20 days of exhibitions. DSE use these crowd pooling events
to disseminate information’s regarding stock markets operations with a view to increase public awareness on
opportunities at the Exchange.
Regional Integration Initiatives
DSE continued to be an active member of the East Africa Stock Exchanges Association (EASEA) and the
Committee of Stock Exchanges of SADC (COSSE). During year 2011/12 DSE participated in a number of
initiatives crafted by the regional bodies. Among other DSE participated on drafting of guidelines for the EAC
stockbrokers and clearing and settlement of cross listed securities. The guidelines aim at smoothening cross-
border transactions. In October 2011, DSE hosted a COSSE meeting in Dar es Salaam, which among others,
approved the COSSE 5 year strategy and business plan. During the year, Lusaka Stock Exchange and DSE
were elected as Chair and Vice Chair of COSSE for a period of two years.
Financial Performance
Income
During the year 2011/12 the total income declined by 9% to TZS 1.83 billion, compared to TZS 2.01 billion
recorded during 2010/11. The decrease in income was caused by decrease in listing of treasury bonds and
further cut in the Government subvention. In year 2011/12 the Government listed bond worth TZS 433 billion
compared to TZS 918 billion listed during 2010/11. Government subvention decreased by 33% to from TZS
500.90 million in year 2010/11 to TZS 333.80 million in year 2011/12.
| 8 |
Annual Report and Financial Statements for the year ended 30 June 2012
Total cost (Expenses)
Total expenses increased by 31% (i.e. from TZS 1.73 billion in years 2010/11 to TZS 2. 27 billion in year
2011/12). The increase in expenditure was contributed by among others adjustments on the salaries of the DSE
staff, recruitment of additional staff to match up with increasing operations and expansion of DSE operations.
Other increased expenses were office rent and depreciation charges on newly acquired ICT equipment’s, office
partitioning and furniture’s for the new office. Expenses exceeded income led to a deficit of TZS 338.85 Million.
Looking Forward
The major focus for year 2012/13 will be on consolidating revenue generating activities initiated during 2011/12
while working for new listings both in the main market segment and the new EGM market segment. The thrust
will also be in laying foundation for new products to be launched in subsequent years for example; introduction
of the M-Akiba bonds and Exchange Traded Funds (ETFs). Finally, effort will be put in place to support better
trading operations by the dealing members through putting in place the WAN and supporting use of the Broker’s
back office systems.
Appreciation
On behalf of the Management of the Exchange, I wish to extend our gratitude and thanks to all stakeholders
who worked hand in hand with DSE in achieving the reported results above. We look forward to continuing
working together in strengthening the achievement made on the Exchange thus far. I would like to thank the
Governing Council for its guidance, the staff for their hard work, the Government and Donors for the unrelenting
financial support.
Gabriel D.Y. Kitua
Chief Executive Officer

Annual Report and Financial Statements for the year ended 30 June 2012
| 9 |
DSE MANAGEMENT
Mr. Gabriel D. Y. Kitua Chief Executive Officer
Mr. E. F. NyalaliManager - Operations
Mr. M. I. MshindoManager - Finance &
Administration
Mrs. M. S. MniwasaManager - Coporate Affairs &
Legal Counsel
| 10 |
Annual Report and Financial Statements for the year ended 30 June 2012
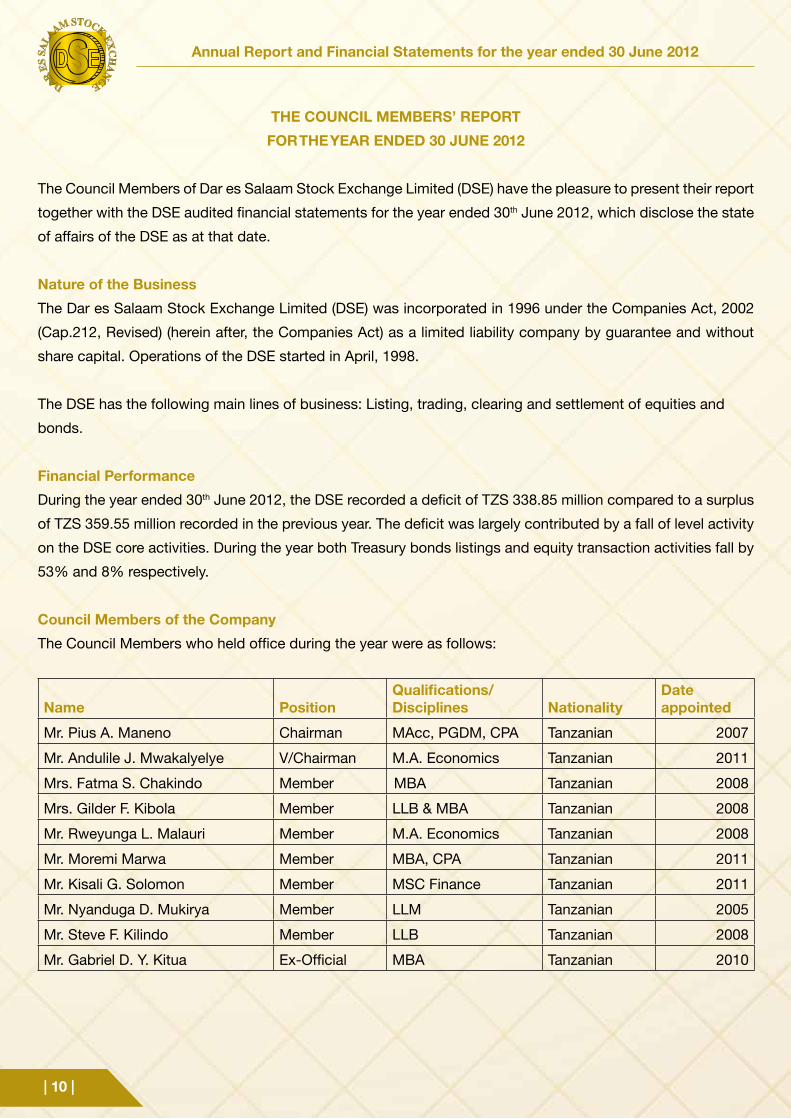
THE COUNCIL MEMBERS’ REPORT
FOR THE YEAR ENDED 30 JUNE 2012
The Council Members of Dar es Salaam Stock Exchange Limited (DSE) have the pleasure to present their report
together with the DSE audited financial statements for the year ended 30th June 2012, which disclose the state
of affairs of the DSE as at that date.
Nature of the Business
The Dar es Salaam Stock Exchange Limited (DSE) was incorporated in 1996 under the Companies Act, 2002
(Cap.212, Revised) (herein after, the Companies Act) as a limited liability company by guarantee and without
share capital. Operations of the DSE started in April, 1998.
The DSE has the following main lines of business: Listing, trading, clearing and settlement of equities and
bonds.
Financial Performance
During the year ended 30th June 2012, the DSE recorded a deficit of TZS 338.85 million compared to a surplus
of TZS 359.55 million recorded in the previous year. The deficit was largely contributed by a fall of level activity
on the DSE core activities. During the year both Treasury bonds listings and equity transaction activities fall by
53% and 8% respectively.
Council Members of the Company
The Council Members who held office during the year were as follows:
Name PositionQualifications/Disciplines Nationality
Date appointed
Mr. Pius A. Maneno Chairman MAcc, PGDM, CPA Tanzanian 2007
Mr. Andulile J. Mwakalyelye V/Chairman M.A. Economics Tanzanian 2011
Mrs. Fatma S. Chakindo Member MBA Tanzanian 2008
Mrs. Gilder F. Kibola Member LLB & MBA Tanzanian 2008
Mr. Rweyunga L. Malauri Member M.A. Economics Tanzanian 2008
Mr. Moremi Marwa Member MBA, CPA Tanzanian 2011
Mr. Kisali G. Solomon Member MSC Finance Tanzanian 2011
Mr. Nyanduga D. Mukirya Member LLM Tanzanian 2005
Mr. Steve F. Kilindo Member LLB Tanzanian 2008
Mr. Gabriel D. Y. Kitua Ex-Official MBA Tanzanian 2010
Annual Report and Financial Statements for the year ended 30 June 2012
| 11 |
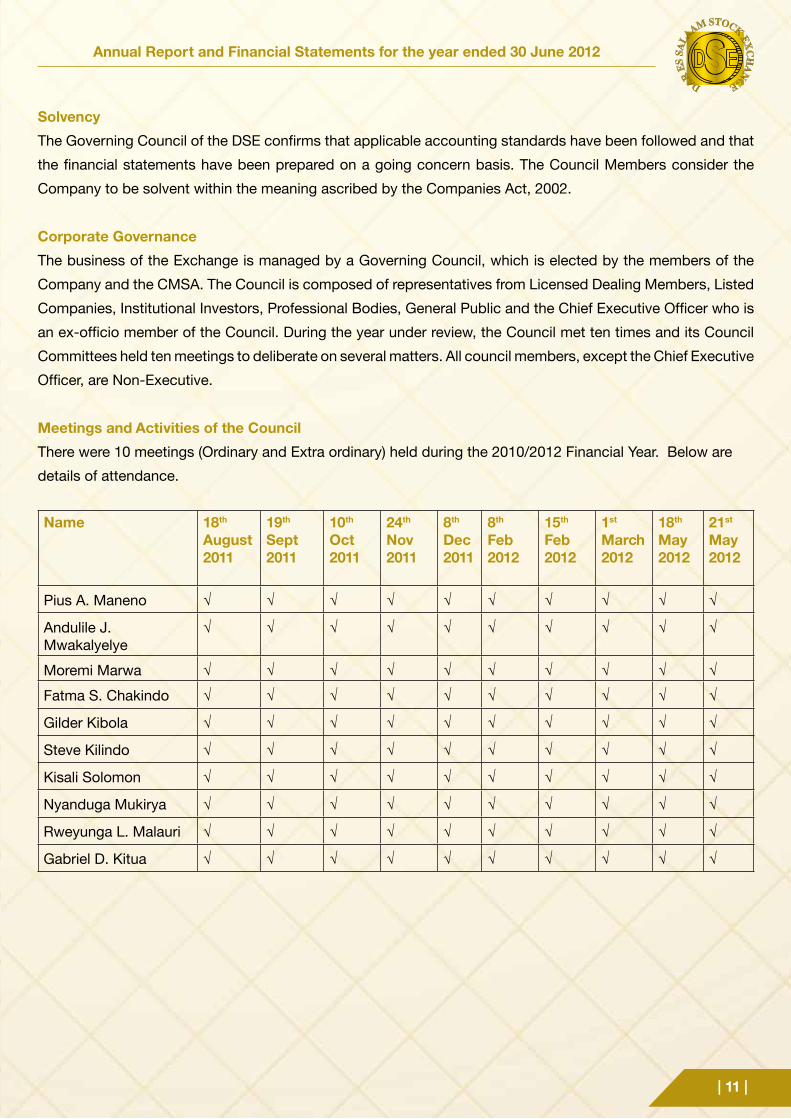
Solvency
The Governing Council of the DSE confirms that applicable accounting standards have been followed and that
the financial statements have been prepared on a going concern basis. The Council Members consider the
Company to be solvent within the meaning ascribed by the Companies Act, 2002.
Corporate Governance
The business of the Exchange is managed by a Governing Council, which is elected by the members of the
Company and the CMSA. The Council is composed of representatives from Licensed Dealing Members, Listed
Companies, Institutional Investors, Professional Bodies, General Public and the Chief Executive Officer who is
an ex-officio member of the Council. During the year under review, the Council met ten times and its Council
Committees held ten meetings to deliberate on several matters. All council members, except the Chief Executive
Officer, are Non-Executive.
Meetings and Activities of the Council
There were 10 meetings (Ordinary and Extra ordinary) held during the 2010/2012 Financial Year. Below are
details of attendance.
Name 18th
August2011
19th
Sept2011
10th
Oct2011
24th
Nov2011
8th
Dec2011
8th
Feb2012
15th
Feb2012
1st
March2012
18th
May2012
21st
May2012
Pius A. Maneno √ √ √ √ √ √ √ √ √ √
Andulile J. Mwakalyelye
√ √ √ √ √ √ √ √ √ √
Moremi Marwa √ √ √ √ √ √ √ √ √ √
Fatma S. Chakindo √ √ √ √ √ √ √ √ √ √
Gilder Kibola √ √ √ √ √ √ √ √ √ √
Steve Kilindo √ √ √ √ √ √ √ √ √ √
Kisali Solomon √ √ √ √ √ √ √ √ √ √
Nyanduga Mukirya √ √ √ √ √ √ √ √ √ √
Rweyunga L. Malauri √ √ √ √ √ √ √ √ √ √
Gabriel D. Kitua √ √ √ √ √ √ √ √ √ √
| 12 |
Annual Report and Financial Statements for the year ended 30 June 2012
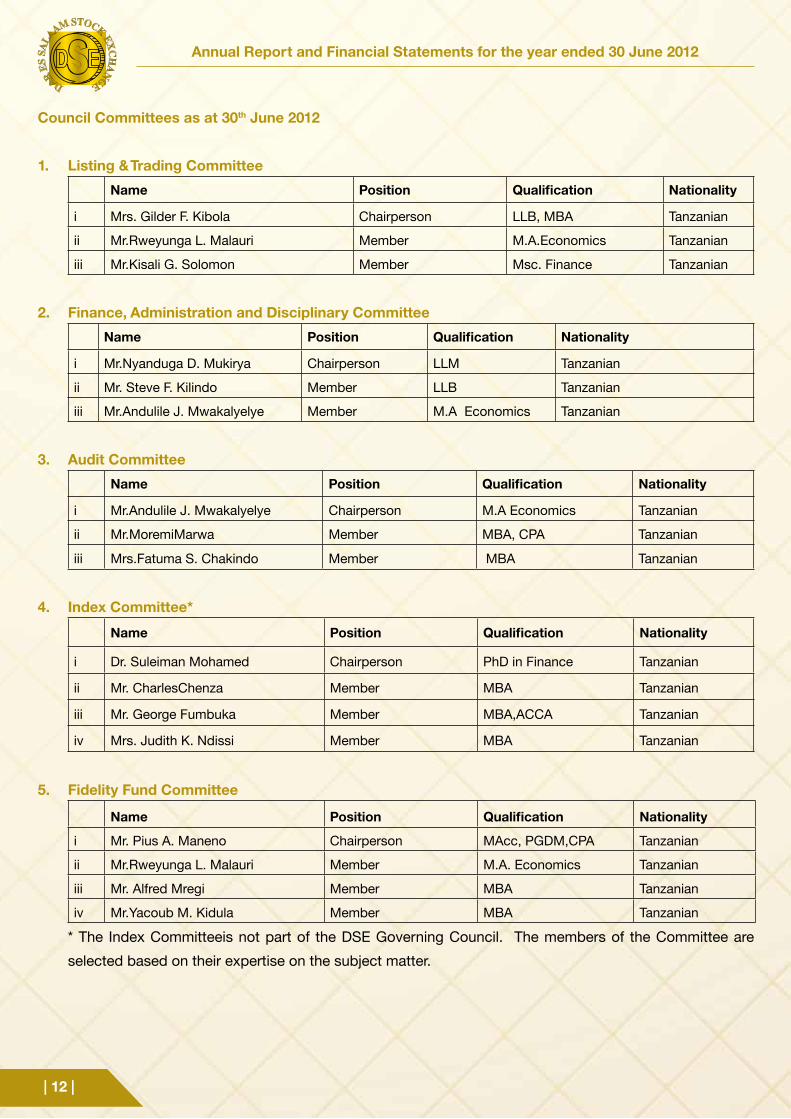
Council Committees as at 30th June 2012
1. Listing & Trading Committee
Name Position Qualification Nationality
i Mrs. Gilder F. Kibola Chairperson LLB, MBA Tanzanian
ii Mr.Rweyunga L. Malauri Member M.A.Economics Tanzanian
iii Mr.Kisali G. Solomon Member Msc. Finance Tanzanian
2. Finance, Administration and Disciplinary Committee
Name Position Qualification Nationality
i Mr.Nyanduga D. Mukirya Chairperson LLM Tanzanian
ii Mr. Steve F. Kilindo Member LLB Tanzanian
iii Mr.Andulile J. Mwakalyelye Member M.A Economics Tanzanian
3. Audit Committee
Name Position Qualification Nationality
i Mr.Andulile J. Mwakalyelye Chairperson M.A Economics Tanzanian
ii Mr.MoremiMarwa Member MBA, CPA Tanzanian
iii Mrs.Fatuma S. Chakindo Member MBA Tanzanian
4. Index Committee*
Name Position Qualification Nationality
i Dr. Suleiman Mohamed Chairperson PhD in Finance Tanzanian
ii Mr. CharlesChenza Member MBA Tanzanian
iii Mr. George Fumbuka Member MBA,ACCA Tanzanian
iv Mrs. Judith K. Ndissi Member MBA Tanzanian
5. Fidelity Fund Committee
Name Position Qualification Nationality
i Mr. Pius A. Maneno Chairperson MAcc, PGDM,CPA Tanzanian
ii Mr.Rweyunga L. Malauri Member M.A. Economics Tanzanian
iii Mr. Alfred Mregi Member MBA Tanzanian
iv Mr.Yacoub M. Kidula Member MBA Tanzanian
* The Index Committeeis not part of the DSE Governing Council. The members of the Committee are
selected based on their expertise on the subject matter.
Annual Report and Financial Statements for the year ended 30 June 2012
| 13 |
Membership
During the year under review Tanzania Mortgage Refinance Company Limited (TMRC) was admitted as a new
associate member to the Exchange making a total of 37 members comprising of 7 dealing members and 30
associate members.
Auditors
The Controller and Auditor General using powers entrusted to him under Section 33 of Public Audit Act
2008approved KPMG to be the External auditors of the DSE for the accounts of the financial year ended 30th
June 2012.
BY ORDER OF THE COUNCIL
……………………….. ………………………MEMBER CHAIRMAN
DATE: ………………..……………..
| 14 |
Annual Report and Financial Statements for the year ended 30 June 2012
STATEMENT OF COUNCIL MEMBERS’ RESPONSIBILITIES
FOR THE YEAR ENDED 30 JUNE 2012
The Companies Act 2002 (cap 212) requires the company to prepare financial statements for each financial
year, which gives a true and fair view of the state of affairs of the company as at the end of the financial year
and of its operating results for that year. It also requires the directors to ensure that the company keeps proper
accounting records, which disclose with reasonable accuracy at any time, the financial position of the company.
The Council Members are also responsible for safeguarding the assets of the Company.
The Council members are responsible for the preparation of the financial statements that give a true and fair
view in accordance with International Financial Reporting Standards and the requirements of the Companies
Act, 2002 among others and for such internal controls as Directors determine are necessary to enable the
preparation of the financial statements that are free from material misstatement, whether due to fraud or error.
The Council members accept responsibility for the annual financial statements, which have been prepared
using appropriate accounting policies supported by reasonable estimates, in conformity with International
Financial Reporting Standards and the requirements of the Companies Act 2002. The Directors are of the
opinion that, the financial statements give a true and fair view of the state of the financial affairs of the Company
and of its deficit in accordance with International Financial Reporting Standards. The Directors further accept
responsibility for the maintenance of accounting records that may be relied upon in the preparation of financial
statements, as well as adequate system of internal financial control.
Nothing has come to the attention of the Directors to indicate that the Company will not remain a going concern
for at least twelve months from the date of this statement.
BY ORDER OF THE COUNCIL
__________________________________ __________________________________
Chairman: Date
Annual Report and Financial Statements for the year ended 30 June 2012
| 15 |
THE UNITED REPUBLIC OF TANZANIA
NATIONAL AUDIT OFFICE
REPORT OF THE CONTROLLER AND AUDITOR GENERAL ON THE FINANCIAL STATEMENTS OF DAR ES SALAAM STOCK EXCHANGE
LIMITED FOR THE YEAR ENDED 30TH JUNE,2012
The Controller and Auditor General,
National Audit Office, Tanzania
Samora Avenue/Ohio Street,
P.O. Box 9080,
Dar Es Salaam
Tel: 255 (022) 2115157/8
Fax: 255 (022) 2117527
E-mail: [email protected]
Website: www.nao.go.tzREPO
RT O
F TH
E CO
NTRO
LLER
AND
AUD
ITOR
| 16 |
Annual Report and Financial Statements for the year ended 30 June 2012
Office of the Controller and Auditor General,
National Audit Office,
The United Republic of Tanzania
(Established under Article 143 of the Constitution of the URT)
The statutory duties and responsibilities of the Controller and Auditor General are given under Article 143 of the
Constitution of the United Republic of Tanzania and amplified in the Public Audit Act No.11 of 2008.
Vision
To be a center of excellence in public sector auditing.
Mission
To provide efficient audit services to enhance accountability and value for money in the collection and use of
public resources.
In providing quality services, NAO is guided by the following Core Values:
Objectivity: We are an impartial organization, offering services to our clients in an objective, and
unbiased manner;
Excellence: We are professionals providing high quality audit services based on best practices;
Integrity: We observe and maintain high standards of ethical behavior and the rule of law;
People focus: We focus on stakeholders’ needs by building a culture of good customer care and having
competent and motivated work force;
Innovation: We are a creative organization that constantly promotes a culture of developing and
accepting new ideas from inside and outside the organization; and
Best resource utilization: We are an organization that values and uses public resources entrusted to
it in efficient, economic and effective manner.
We do this by:-
• Contributing to better stewardship of public funds by ensuring that our clients are accountable for the
resources entrusted to them;
• Helping to improve the quality of public services by supporting innovation on the use of public resources;
• Providing technical advice to our clients on operational gaps in their operating systems;
• Systematically involve our clients in the audit process and audit cycles; and
• Providing audit staff with adequate working tools and facilities that promote independence.
© This audit report is intended to be used by Government Authorities. However, upon receipt of the
report by the Speaker and once it is tabled in Parliament, the report becomes a matter of public
record and its distribution may not be limited.
Annual Report and Financial Statements for the year ended 30 June 2012
| 17 |
To:Chairman,Governing CouncilDar es Salaam Stock Exchange LimitedP.O. Box 70081DAR ES SALAAM.
REPORT OF THE CONTROLLER AND AUDITOR GENERAL TO THE COUNCIL OF THE
DAR ES SALAAM STOCK EXCHANGE LIMITED FOR THE YEAR ENDED 30 JUNE 2012
Introduction
I have audited the accompanying financial statements of Dar es Salaam Stock Exchange (DSE) Limited, which
comprise the statement of financial position as at 30 June 2012, the statement of comprehensive income,
statement of changes in equity and statement of cash flows for the year then ended, and a summary of
significant accounting policies and other explanatory notes set out from pages 24 to 44 of this report.
Council members’ Responsibility for the Financial Statements
The Governing Council of Dar es Salaam Stock Exchange Limited is responsible for the preparation and fair
presentation of these financial statements in accordance with International Financial Reporting Standards. This
responsibility includes designing, implementing and maintaining internal control relevant to the presentation of
financial statements that are free from material misstatement whether due to fraud or error, selecting and applying
appropriate accounting policies and making accounting estimates that are reasonable in the circumstance
Responsibility of the Controller and Auditor General
My responsibility as auditor is to express an independent opinion on these financial statements and procurement
procedures based on the audit. The audit was conducted in accordance with International Audit Standards
(ISA). These standards require that I comply with ethical requirements and plan and perform the audit to obtain
reasonable assurance about whether the financial statements are free from material misstatement.
An audit involves performing procedures to obtain audit evidence about the amounts and disclosures in the
financial statements. The procedures selected depend on the auditor’s judgement, including the assessment
of the risks of material misstatements of the financial statements, whether due to fraud or error. In making those
risk assessments, I considered the internal control relevant to the entity’s preparation and fair presentation of
the financial statements in order to design audit procedures that are appropriate in the circumstances, but not
for the purpose of expressing an opinion of the effectiveness of the entity’s internal controls. An audit also
includes evaluating the appropriateness of accounting policies used and the reasonableness of accounting
estimates made by management, as well as evaluating the overall presentation of the financial statements.
| 18 |
Annual Report and Financial Statements for the year ended 30 June 2012
In addition, Sect. 10 (2) of the PAA of 2008 requires me to satisfy myself that the accounts have been prepared
in accordance with the appropriate accounting standards and that; reasonable precautions have been taken
to safeguard the collection of revenue, the receipt, custody, disposal, issue and proper use of public property,
and that the law, directions and instructions applicable thereto have been duly observed, expenditures of public
monies have been properly authorized.
Furthermore, Sect. 44(2) of the Public Procurement Act No. 21 of 2004 and Reg. No. 31 of the Public Procurement
(Goods, Works, Non-consultant services and Disposal of Public Assets by Tender) Regulations of 2005 requires
me to state in my annual audit report whether or not the auditee has complied with the provisions of the law
and its regulations
I believe that the audit evidence I have obtained is sufficient and appropriate to provide a basis of my audit
opinion.
Unqualified Audit Opinion
In my opinion, the financial statements presents fairly, in all material respects, the financial position of Dar es
Salaam Stock Exchange Limited as at 30th June 2012 and of its financial performance and cash flows for
the year then ended in accordance with International Financial Reporting Standards and have been properly
prepared and have complied with the Companies Act 2002.
Report on other Legal and Regulatory Requirements
1. As required by the Tanzanian Companies Act, 2002, I am also required to report to you if, in my opinion,
the Directors’ Report is not consistent with the financial statements, if the Company has not kept proper
accounting records, if I have not received all the information and explanations I require for the audit, or if
information specified by law regarding Council members’ remuneration and transactions with the Company
have been disclosed. There is no matter to report in respect of the foregoing requirements.
2. Compliance with Public Procurement Act 2004
In view of my responsibility on procurement legislation, and taking into consideration the procurement
transactions and processes I reviewed as part of this audit, I state that Dar es Salaam Stock Exchange
Limited has generally complied with the requirements of the PPA No. 21 of 2004 together with its related
Regulations of 2005.
Francis Mwakapalila
Ag. CONTROLLER AND AUDITOR GENERAL
National Audit Office, Dar es Salaam, Tanzania
21st March, 2013
Annual Report and Financial Statements for the year ended 30 June 2012
| 19 |
STATEMENT OF COMPREHENSIVE INCOME
FOR THE YEAR ENDED 30 JUNE 2012
2012 2011
Notes TZS TZSIncomeRevenue 6 1,232,838,476 1,555,726,334
Other income 7 219,893,286 176,117,449
Amortization of capital grants 19 358,956,988 275,012,956
1,811,688,750 2,006,856,739ExpenditureStaff costs 8 893,182,111 700,877,750
Administrative expenses 9 1,163,813,151 914,261,488
Other operating expenses 10 191,392,958 118,420,773
2,248,388,220 1,733,560,011
(Deficit)/Surplus from operations before financing charge (436,699,470) 273,296,728
Interest income 97,850,099 86,251,669
Gross (Deficit)/Surplus (338,849,371) 359,548,397
Taxation 11 - -
Net (Deficit)/Surplus for the year (338,849,371) 359,548,397
Other comprehensive income - -
Total Comprehensive (loss)/ income for the year (338,849,371) 359,548,397
Notes and related statements forming part of these financial statements appear on page 24 to 44
Report of the Auditors – Page 15 to 18
| 20 |
Annual Report and Financial Statements for the year ended 30 June 2012
STATEMENT OF FINANCIAL POSITION
AS AT 30 JUNE 2012
2012 2011
Notes TZS TZSASSETS
Non-current assets
Motor vehicles and equipment 12 635,806,953 152,405,950
Intangible assets 13 76,997,008 244,498,042
712,803,961 396,903,992Current assets
Trade and other receivables 15 195,900,010 267,358,201
Prepayments 16 77,754,941 282,488,011
Term deposit with the banks 18(a) 976,481,000 980,090,863
Cash and cash equivalents 18(b) 53,104,054 419,679,376
1,303,240,005 1,949,616,451
Total assets 2,016,043,966 2,346,520,443
EQUITY AND LIABILITIES
Equity
Accumulated Fund 246,601,089 585,450,461
Capital grants 19 1,441,709,285 1,464,890,148
Car loan Fund 20 35,000,000 35,000,000
1,723,310,374 2,085,340,609Current liabilities
Listing fees received in advance 21 36,525,000 105,325,000
Trade and other payables 22 256,208,592 155,854,834
292,733,592 261,179,834
Total equity and liabilities 2,016,043,966 2,346,520,443
Annual Report and Financial Statements for the year ended 30 June 2012
| 21 |
These financial statements were approved for issue by the Governing Council on 11th December 2012and
signed on its behalf by:
……………………….. ………………………MEMBER CHAIRMAN
DATE: ………………..………………..
Notes and related statements forming part of these financial statements appear on page 24 to 44
Report of the Auditors – Page 15 to 18
| 22 |
Annual Report and Financial Statements for the year ended 30 June 2012
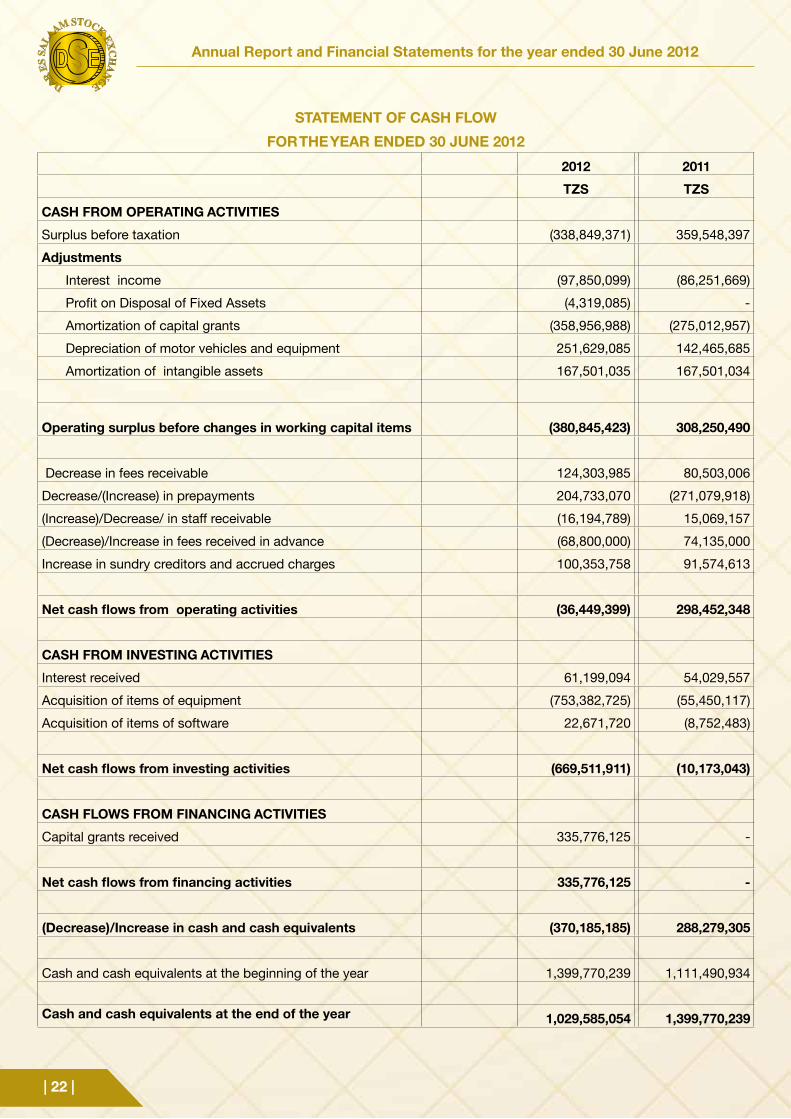
STATEMENT OF CASH FLOW
FOR THE YEAR ENDED 30 JUNE 2012
2012 2011
TZS TZS
CASH FROM OPERATING ACTIVITIES
Surplus before taxation (338,849,371) 359,548,397
Adjustments
Interest income (97,850,099) (86,251,669)
Profit on Disposal of Fixed Assets (4,319,085) -
Amortization of capital grants (358,956,988) (275,012,957)
Depreciation of motor vehicles and equipment 251,629,085 142,465,685
Amortization of intangible assets 167,501,035 167,501,034
Operating surplus before changes in working capital items (380,845,423) 308,250,490
Decrease in fees receivable 124,303,985 80,503,006
Decrease/(Increase) in prepayments 204,733,070 (271,079,918)
(Increase)/Decrease/ in staff receivable (16,194,789) 15,069,157
(Decrease)/Increase in fees received in advance (68,800,000) 74,135,000
Increase in sundry creditors and accrued charges 100,353,758 91,574,613
Net cash flows from operating activities (36,449,399) 298,452,348
CASH FROM INVESTING ACTIVITIES
Interest received 61,199,094 54,029,557
Acquisition of items of equipment (753,382,725) (55,450,117)
Acquisition of items of software 22,671,720 (8,752,483)
Net cash flows from investing activities (669,511,911) (10,173,043)
CASH FLOWS FROM FINANCING ACTIVITIES
Capital grants received 335,776,125 -
Net cash flows from financing activities 335,776,125 -
(Decrease)/Increase in cash and cash equivalents (370,185,185) 288,279,305
Cash and cash equivalents at the beginning of the year 1,399,770,239 1,111,490,934
Cash and cash equivalents at the end of the year 1,029,585,054 1,399,770,239
Annual Report and Financial Statements for the year ended 30 June 2012
| 23 |
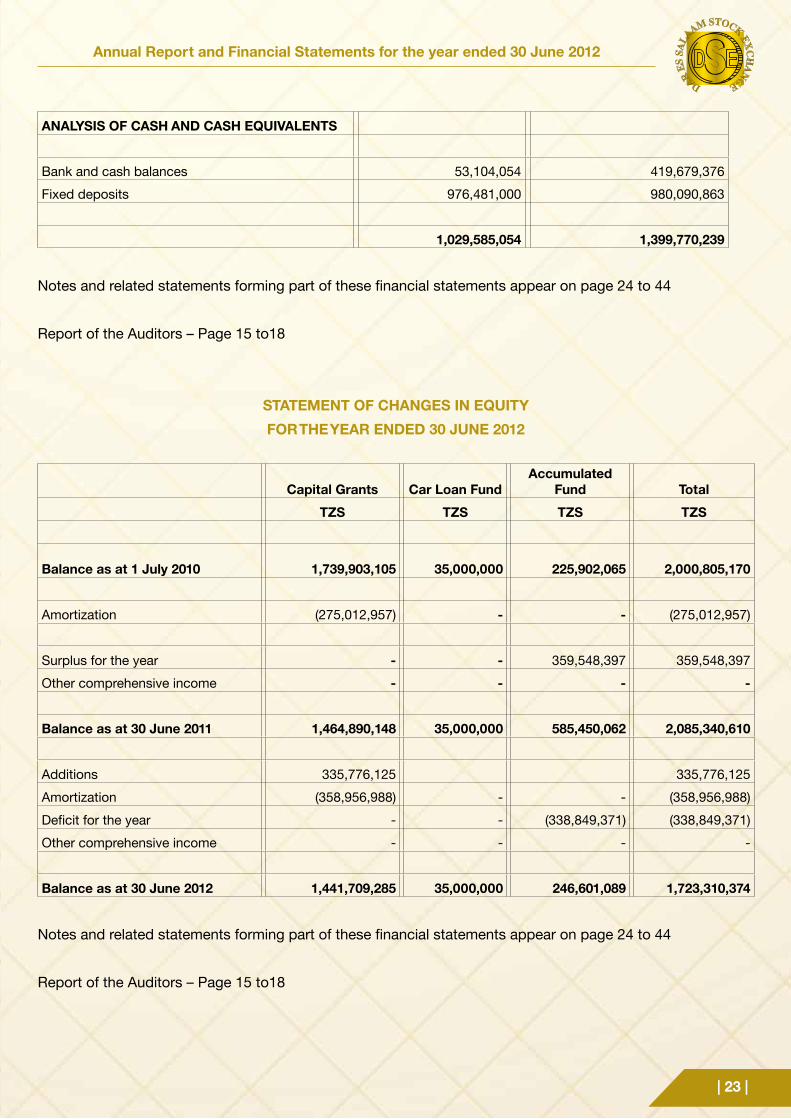
ANALYSIS OF CASH AND CASH EQUIVALENTS
Bank and cash balances 53,104,054 419,679,376
Fixed deposits 976,481,000 980,090,863
1,029,585,054 1,399,770,239
Notes and related statements forming part of these financial statements appear on page 24 to 44
Report of the Auditors – Page 15 to18
STATEMENT OF CHANGES IN EQUITY
FOR THE YEAR ENDED 30 JUNE 2012
Capital Grants Car Loan FundAccumulated
Fund Total
TZS TZS TZS TZS
Balance as at 1 July 2010 1,739,903,105 35,000,000 225,902,065 2,000,805,170
Amortization (275,012,957) - - (275,012,957)
Surplus for the year - - 359,548,397 359,548,397
Other comprehensive income - - - -
Balance as at 30 June 2011 1,464,890,148 35,000,000 585,450,062 2,085,340,610
Additions 335,776,125 335,776,125
Amortization (358,956,988) - - (358,956,988)
Deficit for the year - - (338,849,371) (338,849,371)
Other comprehensive income - - - -
Balance as at 30 June 2012 1,441,709,285 35,000,000 246,601,089 1,723,310,374
Notes and related statements forming part of these financial statements appear on page 24 to 44
Report of the Auditors – Page 15 to18
| 24 |
Annual Report and Financial Statements for the year ended 30 June 2012
NOTES TO THE FINANCIAL STATEMENTS
FOR THE YEAR ENDED 30 JUNE 2012
1. REPORTING ENTITY
The Dar es Salaam Stock Exchange Limited (DSE) is a body corporate (limited by guarantee)
incorporated in 1996 under the Companies Act, 2002 (Cap.212). The principal objective of the Stock
Exchange is to provide a securities market to investors who intend to invest in the listed companies.
The Stock Exchange assists companies to raise capital through the issuance of equities and debt
securities.
The Stock Exchange is also an instrument for use by Government privatization and private companies for
raising capital. Under the provisions of the Capital Markets and Securities (CMS) Act, 1994 (as amended),
the Capital Markets and Securities Authority regulates the Exchange.
2. BASIS OF PREPARATION
2.1 Statement of Compliance
The financial statements for the year ended 30th June, 2012 and the comparative figures for the
previous financial year have been prepared in accordance with International Financial Reporting
Standards (“IFRS”) and the interpretations adopted by the International Accounting Standards
Board (“IASB”).
The financial statements were approved for issue by the Governing Council Members on 11th
December 2012
2.2 Basis of Measurement
The financial statements are prepared on the historical cost basis except for the financial instruments
at fair value through profit or loss which are measured at fair value.
The methods used to measure fair value are discussed further in note 4.
2.3 Functional and Presentation Currency
The financial statements are presented in Tanzanian Shillings (TZS), which is the Company’s
functional currency. All financial information presented in Tanzanian Shillings has been rounded to
the nearest thousand (TZS’000).
Annual Report and Financial Statements for the year ended 30 June 2012
| 25 |
2.4 Use of Estimates and Judgments
The preparation of financial statements in conformity with IFRS requires management to make
judgments, estimates and assumptions that affect the application of accounting policies and the
reported amounts of assets, liabilities, income and expenses. Actual results may differ from these
estimates.
Estimates and underlying assumptions are reviewed on an on-going basis. Revisions to accounting
estimates are recognized in the period in which the estimate is revised if the revision affects only
that period or in the period of the revision and future periods if the revision affects both current and
future periods.
Information about critical judgments in applying accounting policies that have the most significant
effect on the amount recognized in the financial statements are described in the respective notes to
the financial statements.
3. SIGNIFICANT ACCOUNTING POLICIES
The accounting policies set out below have been applied consistently to all periods presented in these
financial statements.
3.1 Foreign Currency Transactions
Transactions in foreign currencies are translated to the functional currency (TZS) at exchange rates
at the dates of the transactions. Monetary assets and liabilities denominated in foreign currencies
at the reporting date are retranslated to the functional currency at the exchange rate at that date.
The foreign currency gain or loss on monetary items is the difference between amortized cost in
the functional currency at the beginning of the period, adjusted for effective interest and payments
during the period, and the amortized cost in foreign currency translated at the exchange rate at the
end of the period.
Non-monetary assets and liabilities denominated in foreign currencies that are measured at fair
value are retranslated to the functional currency at the exchange rate at the date that the fair value
was determined. Non-monetary items that are measured in terms of historical cost in a foreign
currency are translated using the exchange rate at the date of the transaction.
Foreign currency differences arising on retranslation are recognized in profit or loss in the period in
which they arise.
3.2 Financial Instruments
| 26 |
Annual Report and Financial Statements for the year ended 30 June 2012
3.2.1 Non-derivatives Financial Assets
The Company initially recognizes loans, receivables and deposits on the date that they are
originated. All other financial assets (including assets designated at fair value through profit or
loss) are recognized initially on the trade date at which the Company becomes a party to the
contractual provisions of the instrument.
The Company derecognizes a financial asset when the contractual rights to the cash flows
from the asset expire, or it transfers the rights to receive the contractual cash flows on the
financial asset in a transaction in which substantially all the risks and rewards of ownership of
the financial asset are transferred. Any interest in transferred financial assets that is created
or retained by the Company is recognized as a separate asset or liability.
Financial assets and liabilities are offset and the net amount presented in the statement of
financial position when, and only when, the Company has a legal right to offset the amounts
and intends either to settle on a net basis or to realize the asset and settle the liability
simultaneously.
The Company has the following non-derivative financial assets:
Loans and Receivables
Loans and receivables are financial assets with fixed or determinable payments that are not
quoted in an active market. Such assets are recognized initially at fair value plus any directly
attributable transaction costs. Subsequent to initial recognition loans and receivables are
measured at amortized cost using the effective interest method, less any impairment losses.
Loans and receivables comprise cash and cash equivalent and trade and other receivables.
Cash and Cash Equivalents
Cash and cash equivalents comprise cash balances and bank deposits with maturities of three
month or less from the acquisition date that are subject to insignificant risk of changes in their
fair value and are used by the Company in the management of its short term commitments.
Bank overdrafts (if any) that are repayable on demand and form an integral part of the
company’s cash management are included as component of cash and cash equivalents for
the purpose of the statement of cash flows.
Investment Securities
Investment securities are initially measured at fair value plus incremental direct transaction
Annual Report and Financial Statements for the year ended 30 June 2012
| 27 |
costs and subsequently accounted for depending on their classification as either held-to-
maturity, fair value through profit or loss, or available-for-sale.
Held-to-Maturity
Held-to-maturity investments are non-derivative assets with fixed or determinable payments
and fixed maturity that the Company has the positive intent and ability to hold to maturity, and
which are not designated at fair value through profit or loss or available-for-sale.
Held-to-maturity investments are carried at amortized cost using the effective interest method.
Any sale or reclassification of a significant amount of held-to-maturity investments not close
to their maturity would result in the reclassification of all held-to-maturity investments as
available-for-sale, and prevent the Company from classifying investment securities as held-
to-maturity for the current and the following two financial years.
3.3 Property and Equipment
3.3.1 Recognition and Measurement
Items of property and equipment are measured at cost less accumulated depreciation and
impairment losses. Cost includes expenditures that are directly attributable to the acquisition
of the asset. Purchased software that is integral to the functionality of the related equipment
is capitalized as part of that equipment. When parts of an item of property or equipment
have different useful lives, they are accounted for as separate items (major components) of
property and equipment.
3.3.2 Subsequent Costs
The cost of replacing part of an item of property or equipment is recognized in the carrying
amount of the item if it is probable that the future economic benefits embodied within the part
will flow to the company and its cost can be measured reliably. The costs of the day-to-day
servicing of property and equipment are recognized in profit or loss as incurred.
3.3.3 Depreciation of Fixed Assets
Depreciation is recognized on profit or loss on a straight-line basis over the estimated useful
lives of each part of an item of property and equipment as follows:Rate
Computer software 20%
Office Furniture and equipment 25%
Power Generator 25%
Motor vehicles 25%
| 28 |
Annual Report and Financial Statements for the year ended 30 June 2012
3.3.4 Intangible Assets
Computer Software
Computer software licenses are capitalized on the basis of the costs incurred to acquire and
bring to use the specific software. These costs are amortized on the basis of the expected
useful lives, using straight line method. The amortized costs are taken to the profit or loss
through administrative expenses’ line item.
3.4 Impairment
i) Financial Assets
A financial asset not carried at fair value through profit or loss is assessed at each reporting
date to determine whether there is objective evidence that it is impaired. A financial asset
is impaired if objective evidence indicates that a loss event has occurred after the initial
recognition of the asset, and that the loss event had a negative effect on the estimated future
cash flows of that asset that can be estimated reliably.
Objective evidence that financial assets are impaired can include default or delinquency
by a debtor, restructuring of an amount due to the Company on terms that the Company
would not consider otherwise, indications that a debtor or issuer will enter bankruptcy, the
disappearance of an active market for a security.
The Company considers evidence of impairment for receivables at both a specific asset and
collective level. All individually significant receivables are assessed for specific impairment. All
individually significant receivables found not to be specifically impaired are then collectively
assessed for any impairment that has been incurred but not yet identified. Receivables that
are not individually significant are collectively assessed for impairment by grouping together
receivables with similar risk characteristics.
In assessing collective impairment, the Company uses historical trends of the probability of
default, timing of recoveries and the amount of loss incurred, adjusted for management’s
judgment as to whether current economic and credit conditions are such that the actual
losses are likely to be greater or less than suggested by historical trends.
An impairment loss in respect of a financial asset measured at amortized cost is calculated as
the difference between its carrying amount and the present value of the estimated future cash
flows discounted at the asset’s original effective interest rate. Losses are recognized in profit
or loss and reflected in an allowance account against receivables. Interest on the impaired
Annual Report and Financial Statements for the year ended 30 June 2012
| 29 |
asset continues to be recognized through the unwinding of the discount. When a subsequent
event causes the amount of impairment loss to decrease, the decrease in impairment loss is
reversed through profit or loss.
ii) Non-financial Assets
The carrying amounts of the Company’s non-financial assets are reviewed at each reporting
date to determine whether there is any indication of impairment. If any such indication exists,
then the asset’s recoverable amount is estimated. For intangible assets that have indefinite
useful lives or that are not yet available for use, the recoverable amount is estimated each year
at the same time.
The recoverable amount of an asset or cash-generating unit is the greater of its value in use
and its fair value less costs to sell. In assessing value in use, the estimated future cash flows
are discounted to their present value using a pre-tax discount rate that reflects current market
assessments of the time value of money and the risks specific to the asset. For the purpose
of impairment testing, assets that cannot be tested individually are grouped together into
the smallest group of assets that generates cash inflows from continuing use that are largely
independent of the cash inflows of other assets or groups of assets (the “cash-generating
unit, or CGU”). Subject to an operating segment ceiling test, for the purposes of goodwill
impairment testing, CGUs to which goodwill has been allocated are aggregated so that the
level at which impairment is tested reflects the lowest level at which goodwill is monitored for
internal reporting purposes.
The Company’s corporate assets do not generate separate cash inflows. If there is an
indication that a corporate asset may be impaired, then the recoverable amount is determined
for the CGU to which the corporate asset belongs.
An impairment loss is recognized if the carrying amount of an asset or its CGU exceeds its
estimated recoverable amount. Impairment losses are recognized in profit or loss. Impairment
losses recognised in respect of CGUs are allocated first to reduce the carrying amount of any
goodwill allocated to the units, and then to reduce the carrying amounts of the other assets in
the unit (group of units) on a pro rata basis.
An impairment loss in respect of goodwill is not reversed. In respect of other assets, impairment
losses recognized in prior periods are assessed at each reporting date for any indications
that the loss has decreased or no longer exists. An impairment loss is reversed if there has
been a change in the estimates used to determine the recoverable amount. An impairment
| 30 |
Annual Report and Financial Statements for the year ended 30 June 2012
loss is reversed only to the extent that the asset’s carrying amount does not exceed the
carrying amount that would have been determined, net of depreciation or amortizations, if no
impairment loss had been recognized.
3.5 Employees Benefits
3.5.1 Defined Contribution Plans
DSE has statutory obligations to contribute to various pension schemes in favour of all the
employees employed under permanent and pensionable terms. The pension schemes in
force, which the Exchange contributes to, are the PPF Fund (PPF) and National Social Security
Fund (NSSF). Contributions to the Funds are recognized as an expense in the Statement for
Comprehensive Income when they are due.
3.5.2 Short Term Benefits
Short term employee benefit obligations are measured on an undiscounted basis and are
expensed as the related service is provided
3.5.3 Leave Pay
Employee entitlements to annual leave are recognized when they accrue to employees. A
provision is made for the estimated liability for annual leave as a result of services rendered
by employees up to the reporting date.
3.5.4 Terminal Benefits
Terminal benefits are payable whenever an employee’s employment is terminated before the
normal retirement date or whenever an employee accepts voluntary redundancy in exchange
of these benefits.
3.6 Provisions
Provisions are liabilities of uncertain timing or amount. Provisions are recognized when there is a
present legal or constructive obligation as a result of past events, for which it is probable that an
outflow of economic benefits will occur, and where reliable estimate can be made of the amount of
the obligation.
3.7 Revenue
DSE revenue comprises listing fees, transaction fees and membership fee.
Annual Report and Financial Statements for the year ended 30 June 2012
| 31 |
3.7.1 Listing Fees
Initial listing fee is recognized in the year in which the company makes the floatation.
Annual listing fee is computed on the capitalization value of the listed securities.
Additional listing income is recognized during the year in which the issuing company makes
announcement of the bonus/rights issues.
3.7.2 Transaction Fees
Transaction fee is based on the percentage of the value of shares traded and is recognized on
the dates of the transactions.
3.8 Other Income
Other income comprises of subvention from government, grant income, membership fee, CDS
fees, and sundry income.
Subvention from the government is granted to compensate the company for expenses incurred and
is recognized on profit or loss on a systematic basis in the same period in which the expenses are
recognized
Membership fees are recognized at fair value in the year to which they relate.
3.9 Grants
Grants are recognized at their fair value where there is reasonable assurance that grant will be
received and all attaching conditions will be complied with.
Grants received for capital expenditure are classified as capital grants in the Statement of Financial
Position while grants received for operating expenses are treated as recurrent income.
Capital grants are amortized at the rate which fixed assets acquired through the grants are
depreciated.
3.10 Finance Income
Finance income comprises interest income over Fund invested. Interest income is recognized as it
accrues, using the effective interest methods.
| 32 |
Annual Report and Financial Statements for the year ended 30 June 2012
3.11 Income Tax Expense
The DSE as a non-profit making organization is being supported by the Government to meet both
of its capital and recurrent expenditure. In view of its nature of operations, it is considered to be tax
exempt. However, no formal exemption has been obtained from relevant authorities.
3.12 New Standards and Interpretation not yet Adopted
A number of new standards, amendments to standards and interpretations are not effective for the
year ended 30 June 2012, and have not been applied in preparing these financial statements.
Improvement to IAS 1 – Presentation of items of other comprehensive income
The amendment will impact the presentation of items of other comprehensive income that will be
reclassified into profit or loss in the future and those that will never be reclassified to profit or loss.
The amendment will be adopted by the entity for its financial reporting period ending 31 December
2013.
Improvements to IFRS 2010 – IFRS 7 Financial Instruments: Disclosures
The amendments require additional disclosure if the entity transfers financial assets that are not
derecognized in their entirety or that are derecognized in the entirety but for which the DSE retains
continuing involvement. The amendment will be adopted by the entity for its financial reporting
period ending 31 December 2012.
Amendments to IFRS 9
The amendments affect the classification, measurement and de-recognition of financial assets
and financial liabilities. The amendment will be adopted by the entity for its financial reporting
period ending 31 December 2015.
3.13 Comparative Figures
Comparative figures, where necessary, have been reclassified to conform to changes in
presentation in the current year.
4. DETERMINATION OF FAIR VALUES
Trade and other Receivables
The fair value of trade and other receivables is estimated as the present value of future cash flows,
discounted at the market rate of interest at the reporting date.
Annual Report and Financial Statements for the year ended 30 June 2012
| 33 |
Non-derivative Financial Liabilities
Fair value, which is determined for disclosure purposes, is calculated based on the present value of
future principal and interest cash flows, discounted at the market rate of interest at the reporting date.
5. FINANCIAL RISK MANAGEMENT
The Company has exposure to the following risks from its use of financial instruments:
• Credit risk
• Liquidity risk
• Market risk
• Operational risk
Risk management framework
The Governing Council has overall responsibility for the establishment and oversight of the Company’s
risk management framework. The Company’s risk management policies are established to identify and
analyses the risks faced by the Company, to set appropriate risk limits and controls, and to monitor
risks and adherence to limits. Risk management policies and systems are reviewed regularly to reflect
changes in market conditions and the Company’s activities.
The Company, through its training and management standards and procedures, aims to develop a
disciplined and constructive control environment in which all employees understand their roles and
obligations.
The Governing Council oversees how management monitors compliance with the Company’s risk
management policies and procedures, and reviews the adequacy of the risk management framework in
relation to the risks faced by the Company.
5.1 Credit Risk
Credit risk is the risk of financial loss to the DSE arising from failure of customers to meet their
contractual obligations when fall due and arises principally from the company‘s investment securities
such as fixed deposits and receivables from customers.
The DSE customers are basically brokerage firms and listed companies whom the DSE rules require
them to furnish their financial position each quarter. DSE Management uses this information to
evaluate the credit worthiness of each broker as a way of mitigating credit and investing in issuers
with known credibility.
| 34 |
Annual Report and Financial Statements for the year ended 30 June 2012
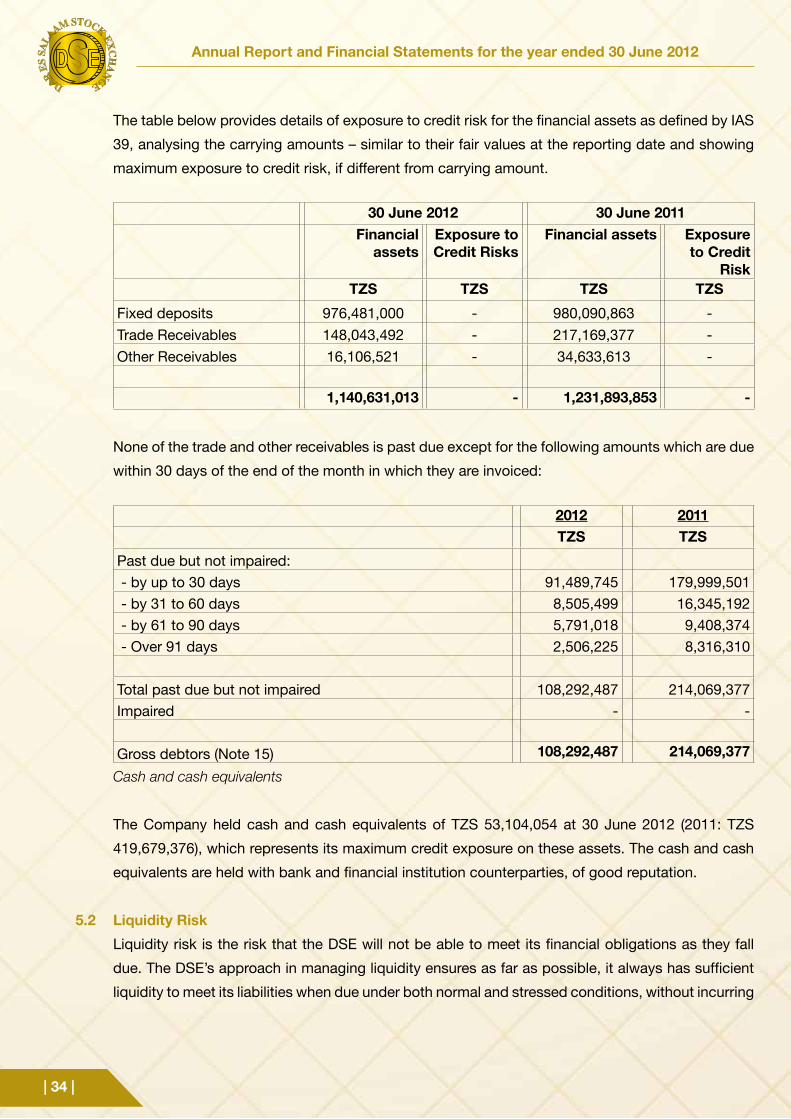
The table below provides details of exposure to credit risk for the financial assets as defined by IAS
39, analysing the carrying amounts – similar to their fair values at the reporting date and showing
maximum exposure to credit risk, if different from carrying amount.
30 June 2012 30 June 2011Financial
assetsExposure to Credit Risks
Financial assets Exposure to Credit
RiskTZS TZS TZS TZS
Fixed deposits 976,481,000 - 980,090,863 -
Trade Receivables 148,043,492 - 217,169,377 -
Other Receivables 16,106,521 - 34,633,613 -
1,140,631,013 - 1,231,893,853 -
None of the trade and other receivables is past due except for the following amounts which are due
within 30 days of the end of the month in which they are invoiced:
2012 2011TZS TZS
Past due but not impaired:
- by up to 30 days 91,489,745 179,999,501
- by 31 to 60 days 8,505,499 16,345,192
- by 61 to 90 days 5,791,018 9,408,374
- Over 91 days 2,506,225 8,316,310
Total past due but not impaired 108,292,487 214,069,377
Impaired - -
Gross debtors (Note 15) 108,292,487 214,069,377
Cash and cash equivalents
The Company held cash and cash equivalents of TZS 53,104,054 at 30 June 2012 (2011: TZS
419,679,376), which represents its maximum credit exposure on these assets. The cash and cash
equivalents are held with bank and financial institution counterparties, of good reputation.
5.2 Liquidity Risk
Liquidity risk is the risk that the DSE will not be able to meet its financial obligations as they fall
due. The DSE’s approach in managing liquidity ensures as far as possible, it always has sufficient
liquidity to meet its liabilities when due under both normal and stressed conditions, without incurring
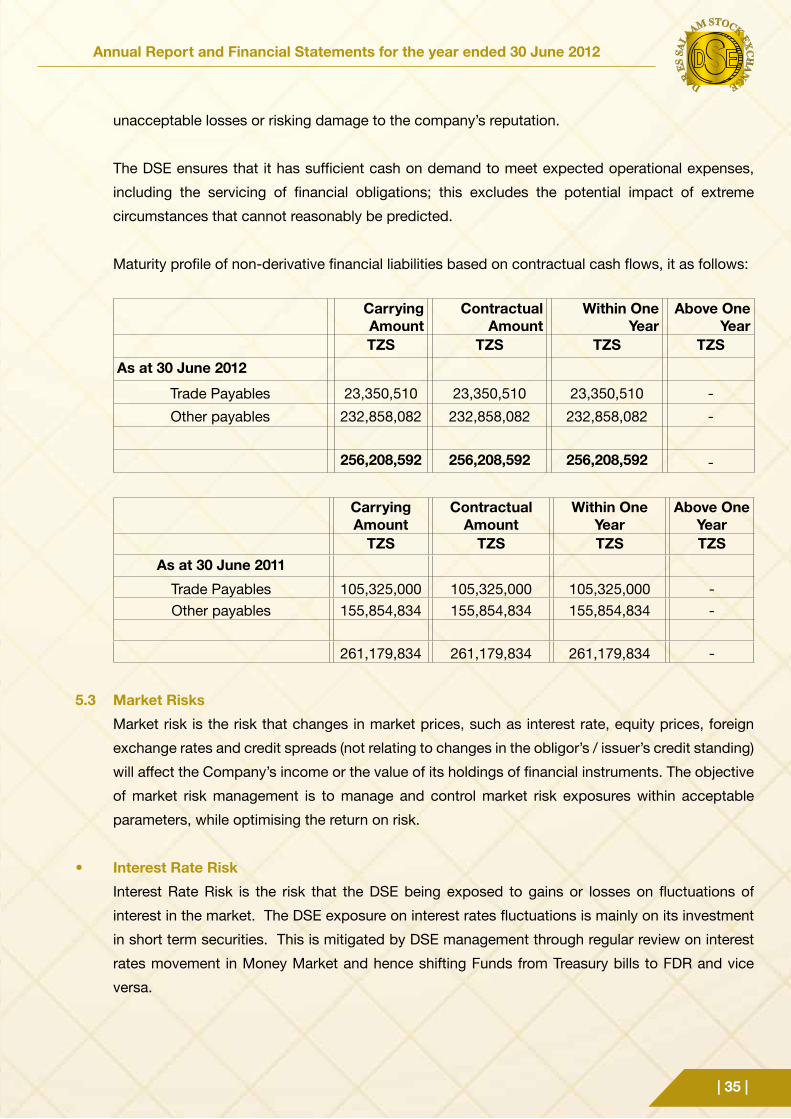
Annual Report and Financial Statements for the year ended 30 June 2012
| 35 |
unacceptable losses or risking damage to the company’s reputation.
The DSE ensures that it has sufficient cash on demand to meet expected operational expenses,
including the servicing of financial obligations; this excludes the potential impact of extreme
circumstances that cannot reasonably be predicted.
Maturity profile of non-derivative financial liabilities based on contractual cash flows, it as follows:
Carrying Amount
Contractual Amount
Within One Year
Above One Year
TZS TZS TZS TZSAs at 30 June 2012
Trade Payables 23,350,510 23,350,510 23,350,510 -
Other payables 232,858,082 232,858,082 232,858,082 -
256,208,592 256,208,592 256,208,592 -
Carrying Amount
Contractual Amount
Within One Year
Above One Year
TZS TZS TZS TZSAs at 30 June 2011
Trade Payables 105,325,000 105,325,000 105,325,000 -
Other payables 155,854,834 155,854,834 155,854,834 -
261,179,834 261,179,834 261,179,834 -
5.3 Market Risks
Market risk is the risk that changes in market prices, such as interest rate, equity prices, foreign
exchange rates and credit spreads (not relating to changes in the obligor’s / issuer’s credit standing)
will affect the Company’s income or the value of its holdings of financial instruments. The objective
of market risk management is to manage and control market risk exposures within acceptable
parameters, while optimising the return on risk.
• Interest Rate Risk
Interest Rate Risk is the risk that the DSE being exposed to gains or losses on fluctuations of
interest in the market. The DSE exposure on interest rates fluctuations is mainly on its investment
in short term securities. This is mitigated by DSE management through regular review on interest
rates movement in Money Market and hence shifting Funds from Treasury bills to FDR and vice
versa.
| 36 |
Annual Report and Financial Statements for the year ended 30 June 2012
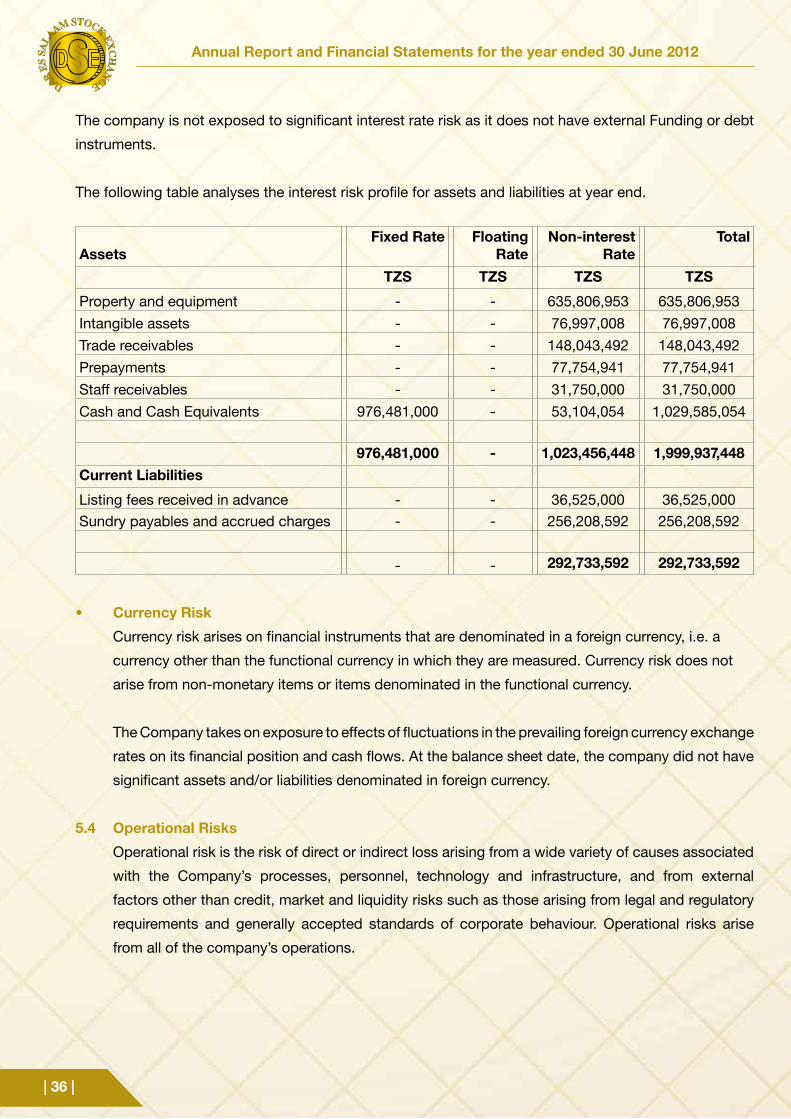
The company is not exposed to significant interest rate risk as it does not have external Funding or debt
instruments.
The following table analyses the interest risk profile for assets and liabilities at year end.
AssetsFixed Rate Floating
RateNon-interest
RateTotal
TZS TZS TZS TZS
Property and equipment - - 635,806,953 635,806,953
Intangible assets - - 76,997,008 76,997,008
Trade receivables - - 148,043,492 148,043,492
Prepayments - - 77,754,941 77,754,941
Staff receivables - - 31,750,000 31,750,000
Cash and Cash Equivalents 976,481,000 - 53,104,054 1,029,585,054
976,481,000 - 1,023,456,448 1,999,937,448Current Liabilities
Listing fees received in advance - - 36,525,000 36,525,000
Sundry payables and accrued charges - - 256,208,592 256,208,592
- - 292,733,592 292,733,592
• Currency Risk
Currency risk arises on financial instruments that are denominated in a foreign currency, i.e. a
currency other than the functional currency in which they are measured. Currency risk does not
arise from non-monetary items or items denominated in the functional currency.
The Company takes on exposure to effects of fluctuations in the prevailing foreign currency exchange
rates on its financial position and cash flows. At the balance sheet date, the company did not have
significant assets and/or liabilities denominated in foreign currency.
5.4 Operational Risks
Operational risk is the risk of direct or indirect loss arising from a wide variety of causes associated
with the Company’s processes, personnel, technology and infrastructure, and from external
factors other than credit, market and liquidity risks such as those arising from legal and regulatory
requirements and generally accepted standards of corporate behaviour. Operational risks arise
from all of the company’s operations.
Annual Report and Financial Statements for the year ended 30 June 2012
| 37 |
The Company’s objective is to manage operational risk so as to balance the avoidance of financial
losses and damage to the Company’s reputation with overall cost effectiveness and to avoid control
procedures that restrict initiative and creativity.
The primary responsibility for the development and implementation of controls to address operational
risk is assigned to senior management. This responsibility is supported by the development of
overall company standards for the management of operational risk in the following areas:
• requirements for appropriate segregation of duties, including the independent authorization of
transactions
• requirements for the reconciliation and monitoring of transactions
• compliance with regulatory and other legal requirements
• documentation of controls and procedures
• requirements for the periodic assessment of operational risks faced, and the adequacy of
controls and procedures to address the risks identified
• requirements for the reporting of operational losses and proposed remedial action
• development of contingency plans
• training and professional development
• ethical and business standards
• risk mitigation, including insurance where this is effective
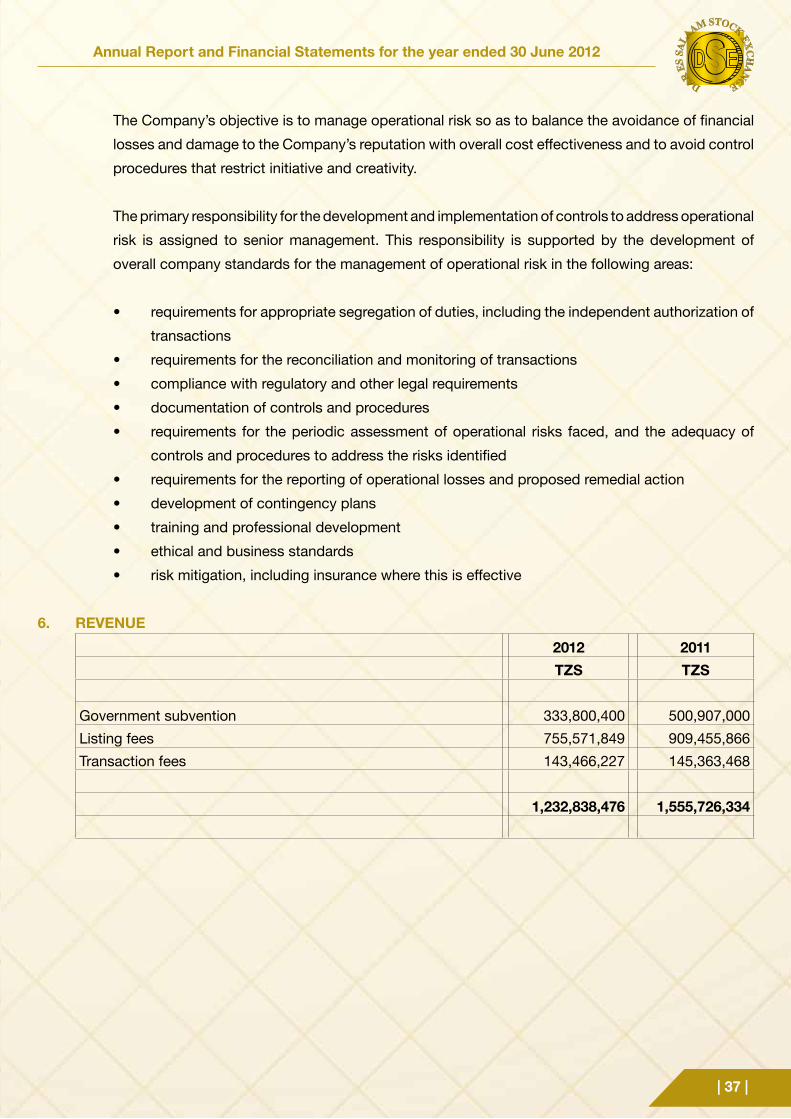
6. REVENUE
2012 2011TZS TZS
Government subvention 333,800,400 500,907,000
Listing fees 755,571,849 909,455,866
Transaction fees 143,466,227 145,363,468
1,232,838,476 1,555,726,334
| 38 |
Annual Report and Financial Statements for the year ended 30 June 2012
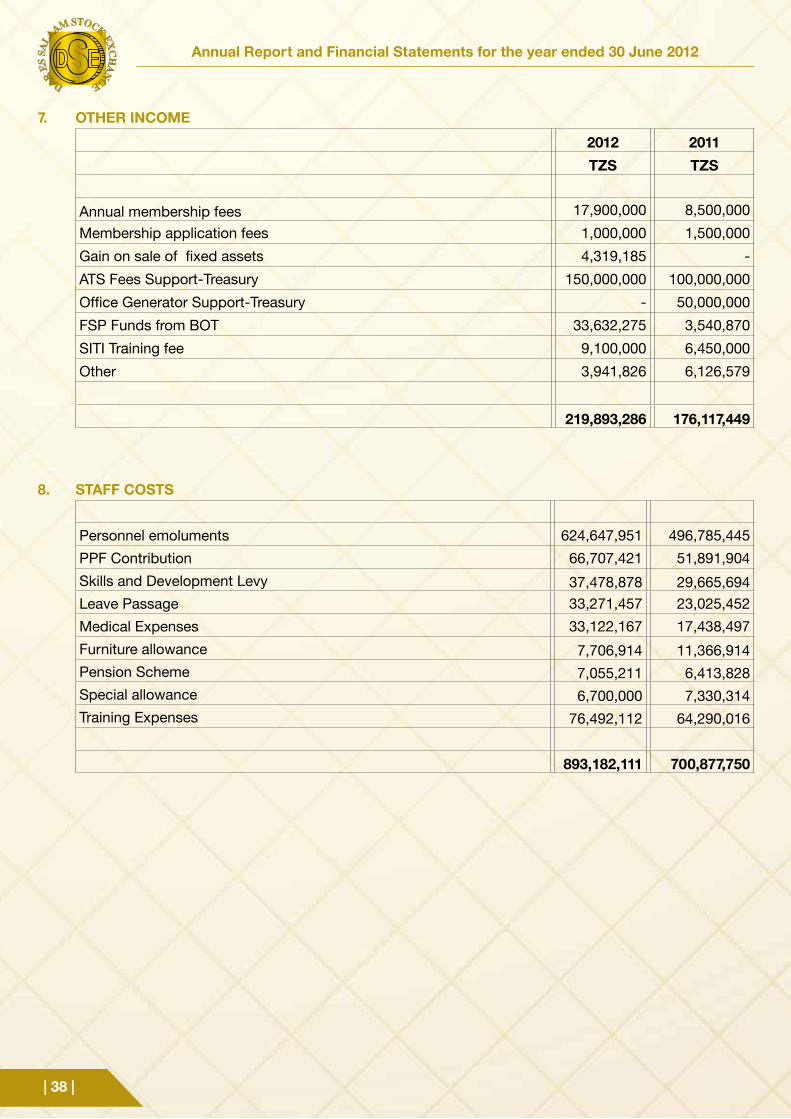
7. OTHER INCOME
2012 2011TZS TZS
Annual membership fees 17,900,000 8,500,000
Membership application fees 1,000,000 1,500,000
Gain on sale of fixed assets 4,319,185 -
ATS Fees Support-Treasury 150,000,000 100,000,000
Office Generator Support-Treasury - 50,000,000
FSP Funds from BOT 33,632,275 3,540,870
SITI Training fee 9,100,000 6,450,000
Other 3,941,826 6,126,579
219,893,286 176,117,449
8. STAFF COSTS
Personnel emoluments 624,647,951 496,785,445
PPF Contribution 66,707,421 51,891,904
Skills and Development Levy 37,478,878 29,665,694
Leave Passage 33,271,457 23,025,452
Medical Expenses 33,122,167 17,438,497
Furniture allowance 7,706,914 11,366,914
Pension Scheme 7,055,211 6,413,828
Special allowance 6,700,000 7,330,314
Training Expenses 76,492,112 64,290,016
893,182,111 700,877,750
Annual Report and Financial Statements for the year ended 30 June 2012
| 39 |
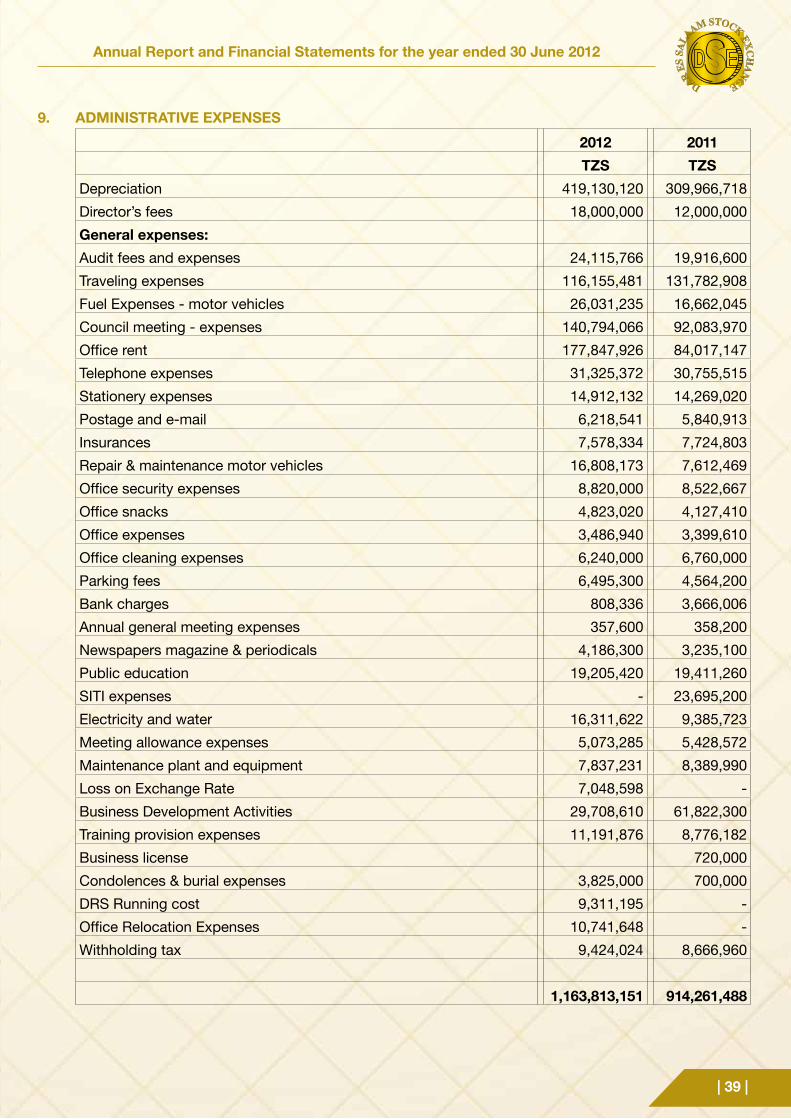
9. ADMINISTRATIVE EXPENSES
2012 2011TZS TZS
Depreciation 419,130,120 309,966,718
Director’s fees 18,000,000 12,000,000
General expenses:Audit fees and expenses 24,115,766 19,916,600
Traveling expenses 116,155,481 131,782,908
Fuel Expenses - motor vehicles 26,031,235 16,662,045
Council meeting - expenses 140,794,066 92,083,970
Office rent 177,847,926 84,017,147
Telephone expenses 31,325,372 30,755,515
Stationery expenses 14,912,132 14,269,020
Postage and e-mail 6,218,541 5,840,913
Insurances 7,578,334 7,724,803
Repair & maintenance motor vehicles 16,808,173 7,612,469
Office security expenses 8,820,000 8,522,667
Office snacks 4,823,020 4,127,410
Office expenses 3,486,940 3,399,610
Office cleaning expenses 6,240,000 6,760,000
Parking fees 6,495,300 4,564,200
Bank charges 808,336 3,666,006
Annual general meeting expenses 357,600 358,200
Newspapers magazine & periodicals 4,186,300 3,235,100
Public education 19,205,420 19,411,260
SITI expenses - 23,695,200
Electricity and water 16,311,622 9,385,723
Meeting allowance expenses 5,073,285 5,428,572
Maintenance plant and equipment 7,837,231 8,389,990
Loss on Exchange Rate 7,048,598 -
Business Development Activities 29,708,610 61,822,300
Training provision expenses 11,191,876 8,776,182
Business license 720,000
Condolences & burial expenses 3,825,000 700,000
DRS Running cost 9,311,195 -
Office Relocation Expenses 10,741,648 -
Withholding tax 9,424,024 8,666,960
1,163,813,151 914,261,488
| 40 |
Annual Report and Financial Statements for the year ended 30 June 2012
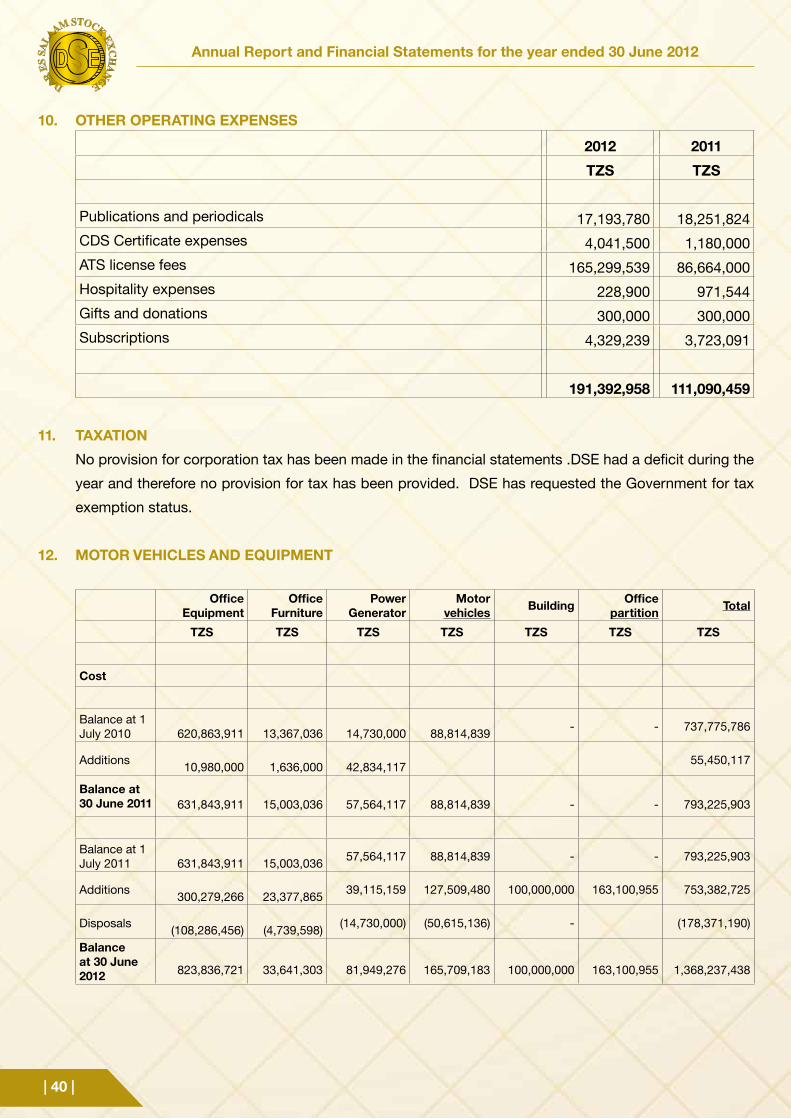
10. OTHER OPERATING EXPENSES
2012 2011
TZS TZS
Publications and periodicals 17,193,780 18,251,824
CDS Certificate expenses 4,041,500 1,180,000
ATS license fees 165,299,539 86,664,000
Hospitality expenses 228,900 971,544
Gifts and donations 300,000 300,000
Subscriptions 4,329,239 3,723,091
191,392,958 111,090,459
11. TAXATION
No provision for corporation tax has been made in the financial statements .DSE had a deficit during the
year and therefore no provision for tax has been provided. DSE has requested the Government for tax
exemption status.
12. MOTOR VEHICLES AND EQUIPMENT
Office Equipment
Office Furniture
Power Generator
Motor vehicles Building Office
partition Total
TZS TZS TZS TZS TZS TZS TZS
Cost
Balance at 1 July 2010
620,863,911
13,367,036
14,730,000
88,814,839
- - 737,775,786
Additions
10,980,000
1,636,000
42,834,117 55,450,117
Balance at 30 June 2011
631,843,911
15,003,036
57,564,117
88,814,839
-
-
793,225,903
Balance at 1 July 2011
631,843,911
15,003,036
57,564,117 88,814,839 - - 793,225,903
Additions
300,279,266
23,377,865 39,115,159 127,509,480 100,000,000 163,100,955 753,382,725
Disposals
(108,286,456)
(4,739,598) (14,730,000) (50,615,136) - (178,371,190)
Balance at 30 June 2012
823,836,721
33,641,303
81,949,276
165,709,183
100,000,000
163,100,955
1,368,237,438
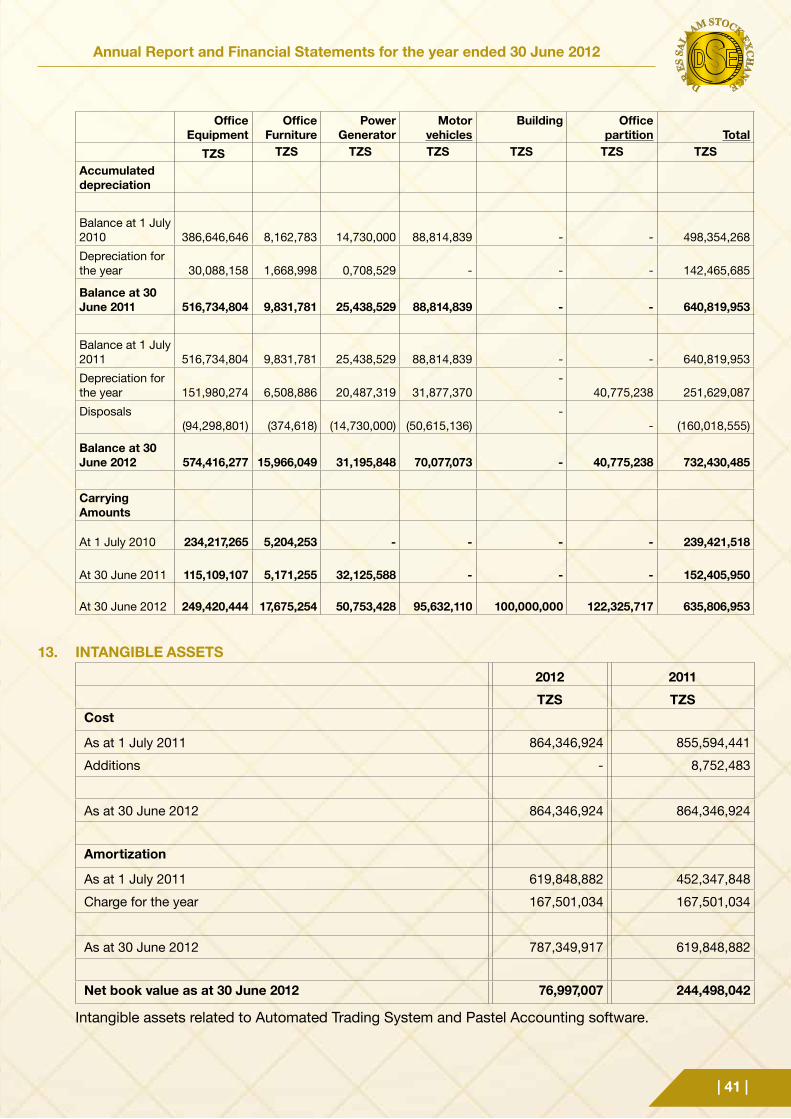
Annual Report and Financial Statements for the year ended 30 June 2012
| 41 |
Office Equipment
Office Furniture
Power Generator
Motor vehicles
Building Office partition Total
TZS TZS TZS TZS TZS TZS TZS
Accumulated depreciation
Balance at 1 July 2010 386,646,646
8,162,783 14,730,000 88,814,839 - - 498,354,268
Depreciation for the year 30,088,158
1,668,998 0,708,529 - - - 142,465,685
Balance at 30 June 2011
516,734,804
9,831,781
25,438,529
88,814,839
-
- 640,819,953
Balance at 1 July 2011
516,734,804
9,831,781
25,438,529
88,814,839 - - 640,819,953
Depreciation for the year
151,980,274
6,508,886
20,487,319
31,877,370
- 40,775,238 251,629,087
Disposals (94,298,801)
(374,618)
(14,730,000)
(50,615,136)
- - (160,018,555)
Balance at 30 June 2012
574,416,277
15,966,049
31,195,848
70,077,073
-
40,775,238 732,430,485
Carrying Amounts
At 1 July 2010 234,217,265 5,204,253 - - - - 239,421,518
At 30 June 2011 115,109,107
5,171,255 32,125,588
-
-
- 152,405,950
At 30 June 2012
249,420,444 17,675,254
50,753,428
95,632,110
100,000,000
122,325,717 635,806,953
13. INTANGIBLE ASSETS
2012 2011
TZS TZSCost
As at 1 July 2011 864,346,924 855,594,441
Additions - 8,752,483
As at 30 June 2012 864,346,924 864,346,924
Amortization
As at 1 July 2011 619,848,882 452,347,848
Charge for the year 167,501,034 167,501,034
As at 30 June 2012 787,349,917 619,848,882
Net book value as at 30 June 2012 76,997,007 244,498,042
Intangible assets related to Automated Trading System and Pastel Accounting software.
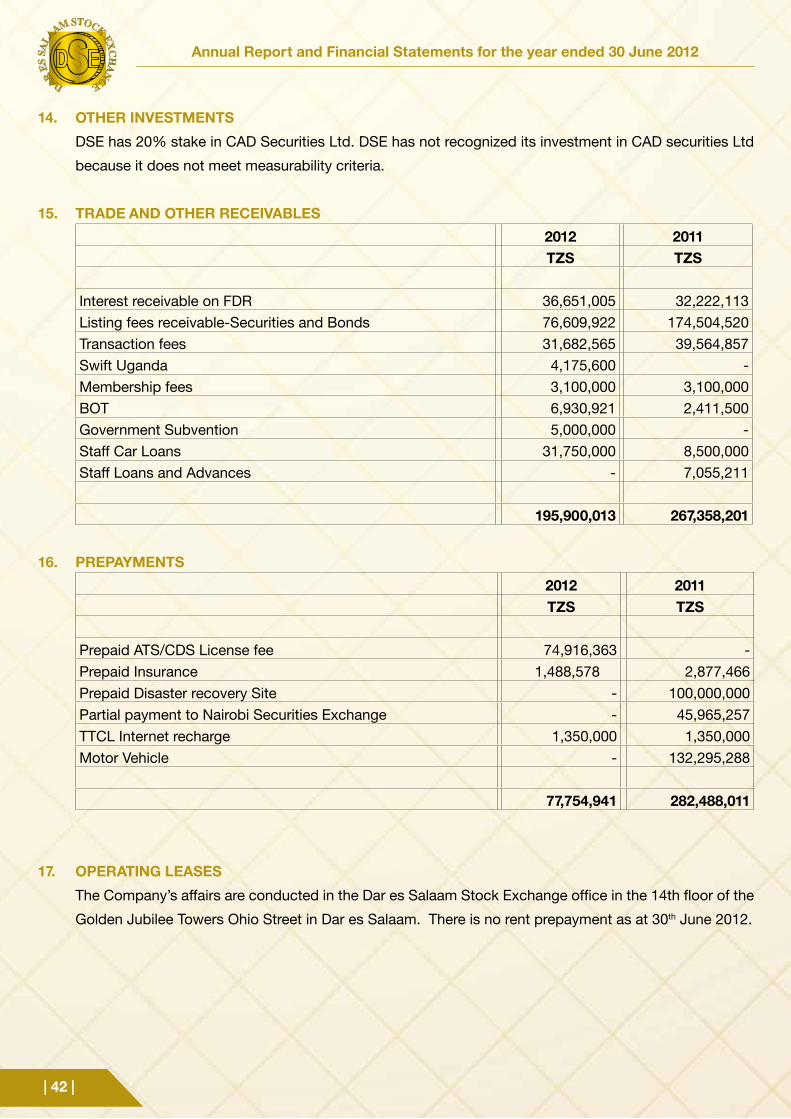
| 42 |
Annual Report and Financial Statements for the year ended 30 June 2012
14. OTHER INVESTMENTS
DSE has 20% stake in CAD Securities Ltd. DSE has not recognized its investment in CAD securities Ltd
because it does not meet measurability criteria.
15. TRADE AND OTHER RECEIVABLES
2012 2011TZS TZS
Interest receivable on FDR 36,651,005 32,222,113
Listing fees receivable-Securities and Bonds 76,609,922 174,504,520
Transaction fees 31,682,565 39,564,857
Swift Uganda 4,175,600 -
Membership fees 3,100,000 3,100,000
BOT 6,930,921 2,411,500
Government Subvention 5,000,000 -
Staff Car Loans 31,750,000 8,500,000
Staff Loans and Advances - 7,055,211
195,900,013 267,358,201
16. PREPAYMENTS
2012 2011TZS TZS
Prepaid ATS/CDS License fee 74,916,363 -
Prepaid Insurance 1,488,578 2,877,466
Prepaid Disaster recovery Site - 100,000,000
Partial payment to Nairobi Securities Exchange - 45,965,257
TTCL Internet recharge 1,350,000 1,350,000
Motor Vehicle - 132,295,288
77,754,941 282,488,011
17. OPERATING LEASES
The Company’s affairs are conducted in the Dar es Salaam Stock Exchange office in the 14th floor of the
Golden Jubilee Towers Ohio Street in Dar es Salaam. There is no rent prepayment as at 30th June 2012.
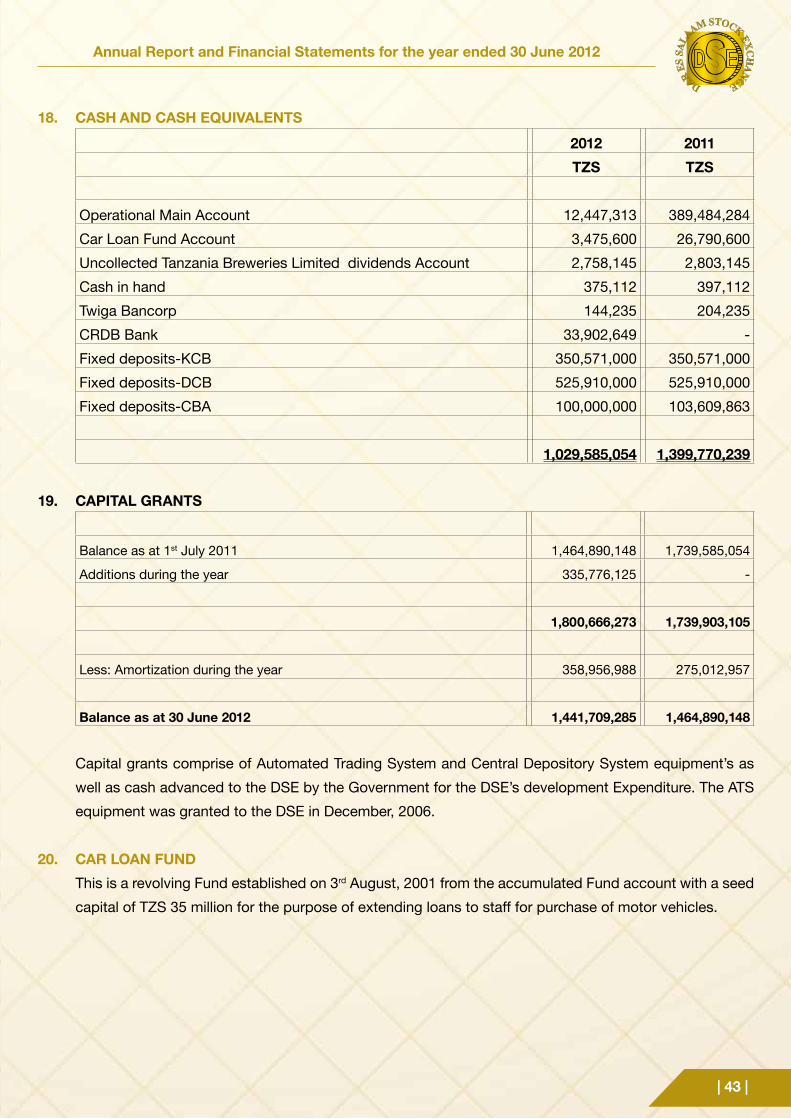
Annual Report and Financial Statements for the year ended 30 June 2012
| 43 |
18. CASH AND CASH EQUIVALENTS
2012 2011
TZS TZS
Operational Main Account 12,447,313 389,484,284
Car Loan Fund Account 3,475,600 26,790,600
Uncollected Tanzania Breweries Limited dividends Account 2,758,145 2,803,145
Cash in hand 375,112 397,112
Twiga Bancorp 144,235 204,235
CRDB Bank 33,902,649 -
Fixed deposits-KCB 350,571,000 350,571,000
Fixed deposits-DCB 525,910,000 525,910,000
Fixed deposits-CBA 100,000,000 103,609,863
1,029,585,054 1,399,770,239
19. CAPITAL GRANTS
Balance as at 1st July 2011 1,464,890,148 1,739,585,054
Additions during the year 335,776,125 -
1,800,666,273 1,739,903,105
Less: Amortization during the year 358,956,988 275,012,957
Balance as at 30 June 2012 1,441,709,285 1,464,890,148
Capital grants comprise of Automated Trading System and Central Depository System equipment’s as
well as cash advanced to the DSE by the Government for the DSE’s development Expenditure. The ATS
equipment was granted to the DSE in December, 2006.
20. CAR LOAN FUND
This is a revolving Fund established on 3rd August, 2001 from the accumulated Fund account with a seed
capital of TZS 35 million for the purpose of extending loans to staff for purchase of motor vehicles.
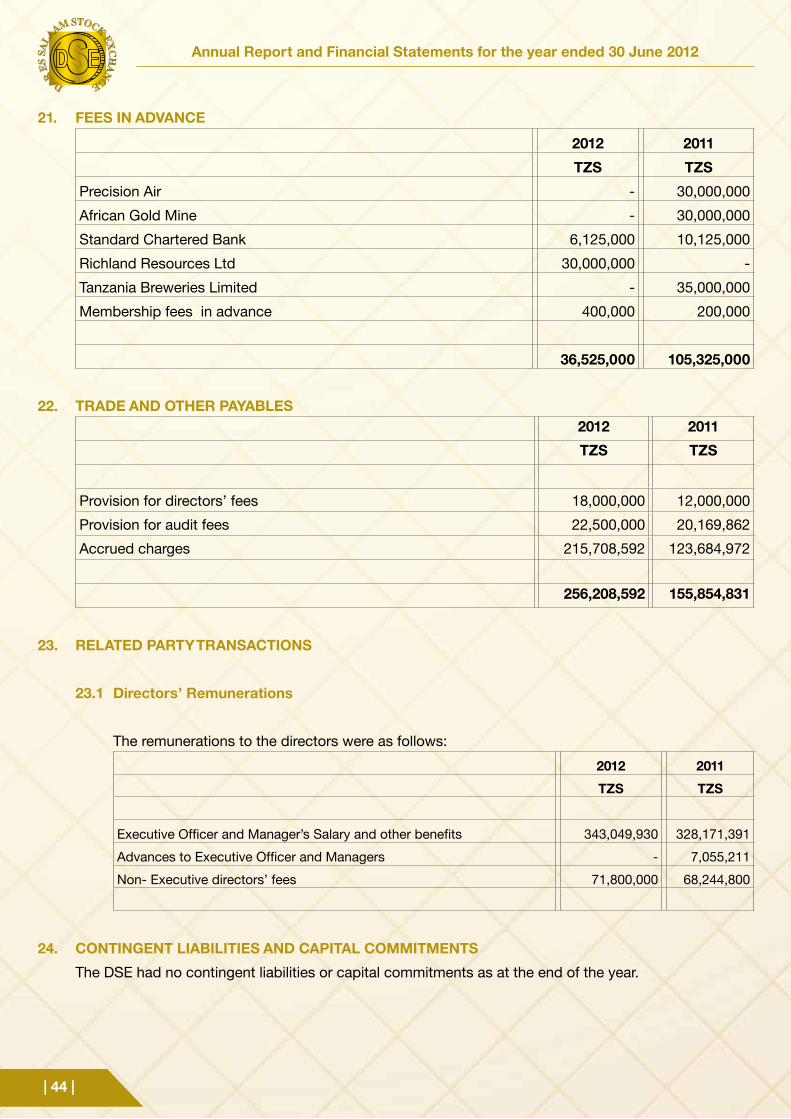
| 44 |
Annual Report and Financial Statements for the year ended 30 June 2012
21. FEES IN ADVANCE
2012 2011
TZS TZS
Precision Air - 30,000,000
African Gold Mine - 30,000,000
Standard Chartered Bank 6,125,000 10,125,000
Richland Resources Ltd 30,000,000 -
Tanzania Breweries Limited - 35,000,000
Membership fees in advance 400,000 200,000
36,525,000 105,325,000
22. TRADE AND OTHER PAYABLES2012 2011
TZS TZS
Provision for directors’ fees 18,000,000 12,000,000
Provision for audit fees 22,500,000 20,169,862
Accrued charges 215,708,592 123,684,972
256,208,592 155,854,831
23. RELATED PARTY TRANSACTIONS
23.1 Directors’ Remunerations
The remunerations to the directors were as follows:
2012 2011
TZS TZS
Executive Officer and Manager’s Salary and other benefits 343,049,930 328,171,391
Advances to Executive Officer and Managers - 7,055,211
Non- Executive directors’ fees 71,800,000 68,244,800
24. CONTINGENT LIABILITIES AND CAPITAL COMMITMENTS
The DSE had no contingent liabilities or capital commitments as at the end of the year.
Annual Report and Financial Statements for the year ended 30 June 2012
| 45 |
Financial Statements for the year ended 30th June, 2012
TABLE OF CONTENTS PAGEReport of the Management Committee 46- 47
Statement of the Management Committee’s Responsibilities in respect of the Financial Statements
48
Report of the Independent Auditors 49 - 50
Financial Statements 51 - 53
Notes to the Financial Statements 54 - 61
Members Firms 62 - 64
| 46 |
Annual Report and Financial Statements for the year ended 30 June 2012
REPORT OF THE FUND MANAGEMENT COMMITTEE
FOR THE YEAR ENDED 30 JUNE 2012
The Fund Management Committee present this report together with the audited financial statements of the Dar
es Salaam Stock Exchange – Fidelity Fund (the Fund) for the year ended 30 June 2012.
1. ESTABLISHMENT AND PURPOSE
In accordance with the provisions of the Capital Markets and Securities Act 1994, the Fund was established
in April 1998 to hold in trust certain assets, the property of the Dar es Salaam Stock Exchange (the
Stock Exchange), for the purpose of providing compensation to persons who suffer pecuniary loss from
any defalcation committed by a Licensed Dealing Member (LDM) or its directors or partners or through
defalcations by any of the employees of the company or firm.
2. MINIMUM BALANCE
The Fund shall consist of an amount of not less than TZS 100 million or such other sum as may be
directed by the Minister, by Notice in the Gazette in accordance with the CMS Act 1994.
3. ACTIVITIES
As noted above, the Fund holds in trust certain assets, the property of the Stock Exchange, for the
purpose of compensating any persons who suffer pecuniary loss as a result of defalcations committed by
a member company of the stock exchange and certain other persons. The Fund’s income to meet these
potential commitments is obtained from, inter alia, fees based on a certain percentage of the underlying
transactions on the Stock Exchange and annual receipts equal to 10% or more of the net income of the
Stock Exchange for any one financial year.
4. FUND POSITION
The position of the Fund as at the end of the year is reflected in the accumulated Fund balance of
TZS 172,139,846 shown in the statement of financial position in note 10 to the financial statements. The
minimum amount of the Fund, however, shall be either TZS 100 million or such other sum as the Minister
for Finance may direct to be paid into the Fund. The Minister has, through a Government Notice, gazette
the amount to be credited to the Fund to be at the rate of 0.04% from equity securities. No claim has been
made against the Fund since its establishment in 1998.
5. RESULTS FOR THE YEAR
The results for the year are shown in the Statement of Comprehensive Income. No annual receipt based
on the net income of the Stock Exchange has been recognized in the accounts as the Stock Exchange
did not realize a net income after the exclusion of government subventions.
Annual Report and Financial Statements for the year ended 30 June 2012
| 47 |
6. FIDELITY FUND MANAGEMENT COMMITTEE
The Committee was established under the Capital Markets and Securities Act, 1994 to oversee the
administration of the DSE Fidelity Fund. The Committee is composed of five members. These are:
Name Position Qualification Nationality
Mr. Pius A. Maneno Chairperson MAcc, PGDM, CPA Tanzanian
Mr. Rweyunga L. Malauri Member M.A. Economics Tanzanian
Mr. Alfred Mregi Member MBA Tanzanian
Mr. Yacoub M. Kidula Member MBA Tanzanian
7. AUDITORS
The Controller and Auditor General using powers entrusted to him under Section 33 of Public Audit Act
2008 approved KPMG to be the External auditors of the DSE Fidelity Fund accounts for the financial year
ended 30th June 2012.
....................................... .......................................
Chairman Member
| 48 |
Annual Report and Financial Statements for the year ended 30 June 2012
FUND MANAGEMENT COMMITTEE RESPONSIBILITY STATEMENTS
FOR THE YEAR ENDED 30 JUNE 2012
As provided by the Capital Markets and Securities Act 1994, the Fund shall be administered by the Council of
the Stock Exchange which, as further provided, may appoint a Fund Management Committee (The Committee)
to which it may delegate all its powers. This delegation has been effected.
The Committee is responsible for the preparation and fair presentation of the financial statements, comprising
the balance sheet at 30 June 2012, and the income statement, and cash flow statement for the year then
ended, and the notes to the financial statements, which include a summary of significant accounting policies
and other explanatory notes, in accordance with International Financial Reporting Standards.
The Committee’s responsibility includes: designing, implementing and maintaining internal control relevant to
the preparation and fair presentation of these financial statements that are free from material misstatement,
whether due to fraud or error; selecting and applying appropriate accounting policies; and making accounting
estimates that are reasonable in the circumstances.
The Committee has made an assessment of the Fund’s ability to continue as a going concern and have no
reason to believe the business will not be a going concern in the year ahead.
Approval of the financial statements
The financial statements of Fidelity Fund, as indicated above, were approved for issue by the Governing Council
on 11th December 2012 and are signed on its behalf by:
....................................... .......................................
Chairman Member
Annual Report and Financial Statements for the year ended 30 June 2012
| 49 |
REPORT OF THE CONTROLLER AND AUDITOR GENERAL TO THE COUNCIL
OF THE DAR ES SALAAM STOCK EXCHANGE - FIDELITY FUND
Report on the Financial Statements
I have audited the accompanying financial statements of Dar es Salaam Stock Exchange - Fidelity Fund, which
comprise the statement of financial position as at 30 June 2012, the statement of comprehensive income,
statement of changes in equity and statement of cash flows for the year then ended, and a summary of significant
accounting policies and other explanatory notes set out from pages 54 to 61 of the financial statements.
Council members’ Responsibility for the Financial Statements
The Fund Management Committee is responsible for the preparation and fair presentation of these financial
statements in accordance with International Financial Reporting Standards, and in the manner required by the
Capital Market and Securities Act, 1994, and for such internal control as the Committee members determine is
necessary to enable the preparation of financial statements that are free from material misstatement, whether
due to fraud or error.
Responsibility of the Controller and Auditor General
My responsibility as an auditor is to express an independent opinion on these financial statements and
procurement procedures based on the audit. The audit was conducted in accordance with International
Standards on Auditing (ISA). These standards require that I comply with ethical requirements and plan and
perform the audit to obtain reasonable assurance about whether the financial statements are free from material
misstatement.
An audit involves performing procedures to obtain audit evidence about the amounts and disclosures in the
financial statements. The procedures selected depend on the auditor’s judgment, including the assessment of
the risks of material misstatements of the financial statements, whether due to fraud or error. In making those
risk assessments, I considered internal control relevant to the entity’s preparation and fair presentation of the
financial statements in order to design audit procedures that are appropriate in the circumstances, but not for
the purpose of expressing an opinion on the effectiveness of the entity’s internal controls. An audit also includes
evaluating the appropriateness of accounting policies used and the reasonableness of accounting estimates
made by management, as well as evaluating the overall presentation of the financial statements.
In addition, Sect.10 (2) of PAA No. 11 of 2008 requires me satisfy myself that the accounts have been prepared
in accordance with the appropriate accounting standards and that; reasonable precautions have been taken to
safe guard the collection of revenue, receipts, custody, disposal, issue and proper use of public property and
that the law, directions and instructions applicable thereto have been duly observed and expenditure of public
monies have been properly authorized.
| 50 |
Annual Report and Financial Statements for the year ended 30 June 2012
Further, Sect 44(2) of the Public Procurement Act No 21 of 2004 and Reg No. 31 of the Public Procurement
(Goods, Works, Non- consultant services and Disposal of Public Assets by Tender) Regulations of 2005 requires
me to state in my annual audit reports whether or not the Auditee has complied with the provisions of the law
and its Regulations.
I believe that the audit evidence I have obtained is sufficient and appropriate to provide a basis of my audit
opinion.
Unqualified audit opinion
In my opinion, the financial statements presents fairly, in all material respects, the financial position of Dar es
Salaam Stock Exchange - Fidelity Fund as at 30th June 2012 and of its financial performance and cash flows
for the year then ended in accordance with International Financial Reporting Standards and have been properly
prepared and have complied with the Capital Market and Securities Act, 1994.
Report on Other Legal and Regulatory Requirements
Compliance with Public Procurement Act.
In view of my responsibility on procurement legislation, and taking into consideration the procurement
transactions and processes I reviewed as part of this audit, I state that Dar es Salaam Stock Exchange -
Fidelity Fund procurement processes have generally complied with the requirements of the PPA No. 21 of 2004
together with its related Regulations of 2005
Francis Mwakapalila
Ag. CONTROLLER AND AUDITOR GENERAL
National Audit Office,
DAR ES SALAAM.
26th March, 2013
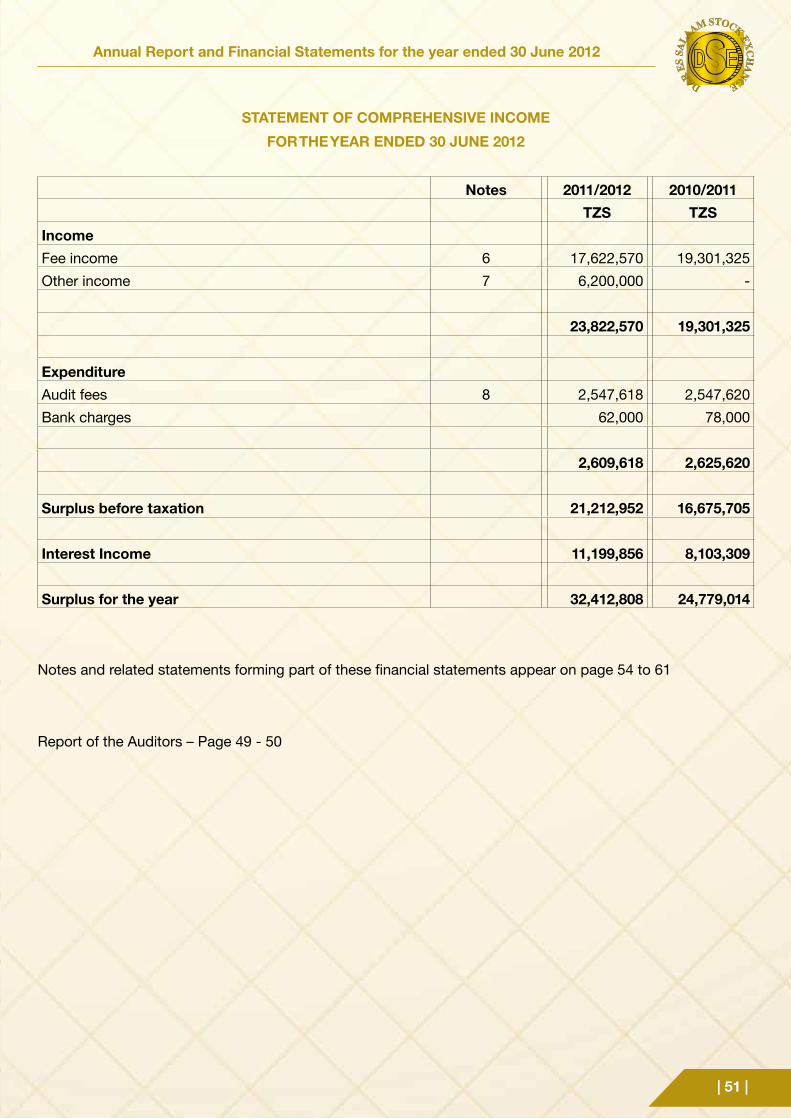
Annual Report and Financial Statements for the year ended 30 June 2012
| 51 |
STATEMENT OF COMPREHENSIVE INCOME
FOR THE YEAR ENDED 30 JUNE 2012
Notes 2011/2012 2010/2011TZS TZS
IncomeFee income 6 17,622,570 19,301,325
Other income 7 6,200,000 -
23,822,570 19,301,325
ExpenditureAudit fees 8 2,547,618 2,547,620
Bank charges 62,000 78,000
2,609,618 2,625,620
Surplus before taxation 21,212,952 16,675,705
Interest Income 11,199,856 8,103,309
Surplus for the year 32,412,808 24,779,014
Notes and related statements forming part of these financial statements appear on page 54 to 61
Report of the Auditors – Page 49 - 50
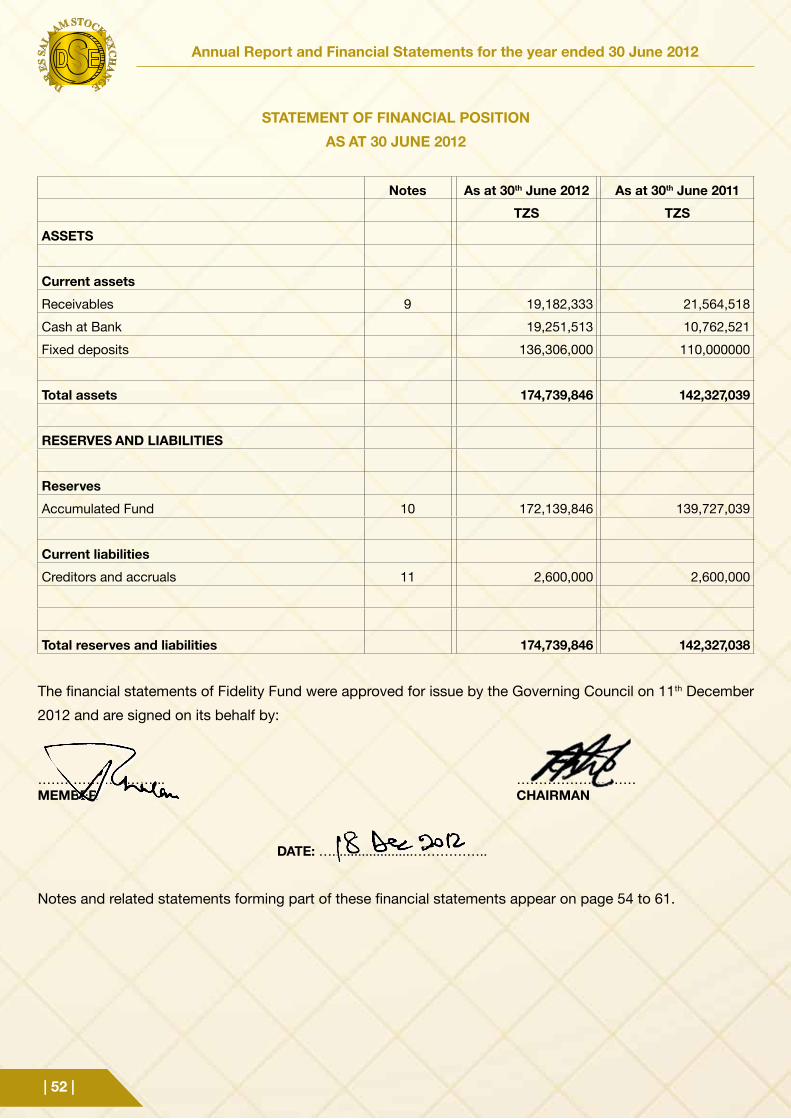
| 52 |
Annual Report and Financial Statements for the year ended 30 June 2012
STATEMENT OF FINANCIAL POSITION
AS AT 30 JUNE 2012
Notes As at 30th June 2012 As at 30th June 2011
TZS TZS
ASSETS
Current assets
Receivables 9 19,182,333 21,564,518
Cash at Bank 19,251,513 10,762,521
Fixed deposits 136,306,000 110,000000
Total assets 174,739,846 142,327,039
RESERVES AND LIABILITIES
Reserves
Accumulated Fund 10 172,139,846 139,727,039
Current liabilities
Creditors and accruals 11 2,600,000 2,600,000
Total reserves and liabilities 174,739,846 142,327,038
The financial statements of Fidelity Fund were approved for issue by the Governing Council on 11th December
2012 and are signed on its behalf by:
……………………….. ………………………MEMBER CHAIRMAN
DATE: …......................……………..
Notes and related statements forming part of these financial statements appear on page 54 to 61.
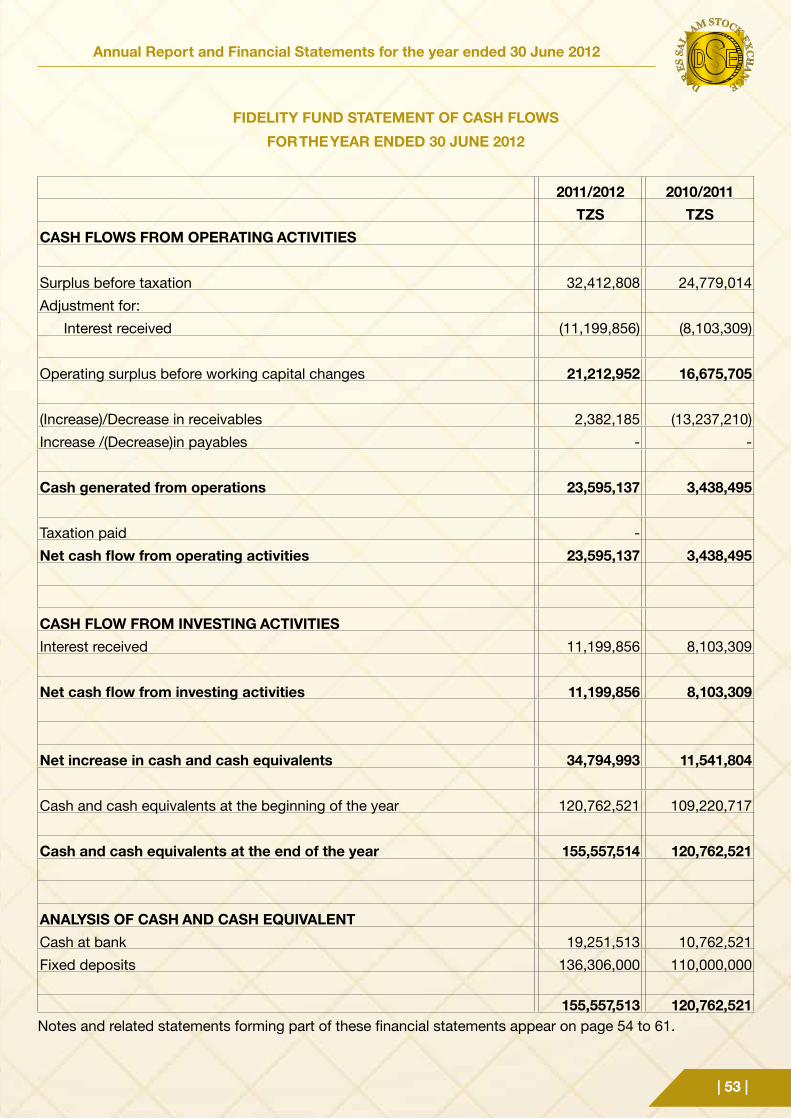
Annual Report and Financial Statements for the year ended 30 June 2012
| 53 |
FIDELITY FUND STATEMENT OF CASH FLOWS
FOR THE YEAR ENDED 30 JUNE 2012
2011/2012 2010/2011TZS TZS
CASH FLOWS FROM OPERATING ACTIVITIES
Surplus before taxation 32,412,808 24,779,014
Adjustment for:
Interest received (11,199,856) (8,103,309)
Operating surplus before working capital changes 21,212,952 16,675,705
(Increase)/Decrease in receivables 2,382,185 (13,237,210)
Increase /(Decrease)in payables - -
Cash generated from operations 23,595,137 3,438,495
Taxation paid -
Net cash flow from operating activities 23,595,137 3,438,495
CASH FLOW FROM INVESTING ACTIVITIESInterest received 11,199,856 8,103,309
Net cash flow from investing activities 11,199,856 8,103,309
Net increase in cash and cash equivalents 34,794,993 11,541,804
Cash and cash equivalents at the beginning of the year 120,762,521 109,220,717
Cash and cash equivalents at the end of the year 155,557,514 120,762,521
ANALYSIS OF CASH AND CASH EQUIVALENTCash at bank 19,251,513 10,762,521
Fixed deposits 136,306,000 110,000,000
155,557,513 120,762,521Notes and related statements forming part of these financial statements appear on page 54 to 61.
| 54 |
Annual Report and Financial Statements for the year ended 30 June 2012
NOTES TO THE FINANCIAL STATEMENTS
FOR THE YEAR ENDED 30 JUNE 2012
1. REPORTING ENTITY
a) Establishment and Legal Status
The Fidelity Fund (the Fund) was established in accordance with the provisions of the Capital
Markets and Securities (CMS) Act 1994 whereby the Dar es Salaam Stock Exchange is required
to establish and keep a fidelity Fund which shall be administered by its council on behalf of the
Stock Exchange. The assets of the Fidelity Fund shall be the property of the Dar es Salaam Stock
Exchange but shall be kept separate from all other property and shall be held in trust for the purpose
set out in the CMS Act.
The Dar es Salaam Stock Exchange is a body corporate incorporated in 1996 under the Companies
Ordinance (Cap 212) as a company limited by guarantee without a share capital.
b) Purpose
The Fund’s assets are to be used to provide compensation to persons who suffer pecuniary loss from
any defalcation committed by a member company or member firm or its directors or partners or through
defalcations by any of the employees of the company or firm, in accordance with the provisions of the
CMS Act. No claims against the Fund have been received since the Fund was created.
2. BASIS OF PREPARATION
a) Statement of Compliance
The Financial Statements for the year ended 30th June, 2012 and the comparative figures for the
previous financial year have been prepared in accordance with International Financial Reporting
Standards (“IFRS”) and the interpretations adopted by the International Accounting Standards
Board (“IASB”).
The financial statements were approved for issue by the Governing Council Members on
11thDecember 2012
b) Basis of Measurement
These financial statements are presented in Tanzanian shillings, which is the company’s functional
and presentation currency. The financial statements have been prepared under the historical cost
basis except for the items stated at fair value as described below:
Annual Report and Financial Statements for the year ended 30 June 2012
| 55 |
• available for sale financial assets
• cash and cash equivalents
c) Use of Estimates and Judgments
The preparation of financial statements in conformity with IFRS requires management to make
judgments, estimates and assumptions that affect the application of accounting policies and the
reported amounts of assets, liabilities, income and expenses. Actual results may differ from these
estimates.
Estimates and underlying assumptions are reviewed on an on-going basis. Revisions to accounting
estimates are recognized in the period in which the estimate is revised if the revision affects only
that period or in the period of the revision and future periods if the revision affects both current and
future periods.
In particular, information about significant areas of estimation uncertainty and critical judgements in
applying accounting policies that have the most significant effect on the amount recognised in the
financial statements are described in the respective notes to the financial statements.
3. SIGNIFICANT ACCOUNTING POLICIES
The accounting policies set out below have been applied consistently to all periods presented in these
financial statements.
a) Foreign Currency Transactions
The functional and presentation currency of the DSE is the Tanzanian Shilling (TZS). Transactions
in foreign currency are initially recorded in the functional currency rate ruling at the date of the
transaction. Monetary assets and liabilities dominated in foreign currencies are translated at the
functional currency rate of exchange ruling at the balance sheet date. All differences are recognized
in profit or loss.
b) Financial instruments
Non derivative Financial Instruments:
Non derivative financial instruments comprise investments in equity and debt securities, trade and
other receivables, cash and cash equivalents, and trade and other payables.
Non derivative financial instruments are recognized initially at fair value plus, for instruments not at
fair value through profit and loss, any directly attributable transaction costs.
| 56 |
Annual Report and Financial Statements for the year ended 30 June 2012
Cash and Cash Equivalents:
Cash and cash equivalents comprise cash balances and bank deposits. Bank overdrafts (if any)
that are repayable on demand and form an integral part of the company’s cash management are
included as component of cash and cash equivalents for the purpose of the statement of cash
flows. Cash and cash equivalents comprise cash balances.
Loans and Receivables:
Loans and receivables are non-derivative financial assets with fixed or determinable payments that
are not quoted in an active market. They arise as a result of the company providing money, goods,
or services directly to a debtor with no intention of trading the receivable. These non-derivatives are
measured at amortized cost using effective interest method, less any impairment losses.
c) Income
Fee income - comprises fees on the underlying transactions of the Stock Exchange. Fees are
accrued at the rate gazette by the Government of Tanzania from time to time on the underlying
transactions on the stock exchange.
Annual receipts – an amount equal to 10% or more of the net income of the stock exchange for any
one financial year (section 89(2) of the CMS Act) is accounted for on an accrual basis.
d) Comparative Figures
Where it is necessary, comparative figures have been reclassified to conform to changes in
presentation in the current year.
e) New Standards and Interpretations not yet Adopted
A number of new standards, amendments to standards and interpretations are not effective for the
year ended 30 June 2011, and have not been applied in preparing these financial statements.
IFRS 9 Financial Instruments - IFRS 9 will be adopted by the entity for the first time for its financial
reporting period ending 31 March 2013. The standard will be applied retrospectively, subject to
transitional provisions.
IFRS 9 addresses the initial measurement and classification of financial assets and will replace the
relevant sections of IAS 39.
Under IFRS 9 there are two options in respect of classification of financial assets, namely, financial
assets measured at amortized cost or at fair value. Financial assets are measured at amortized
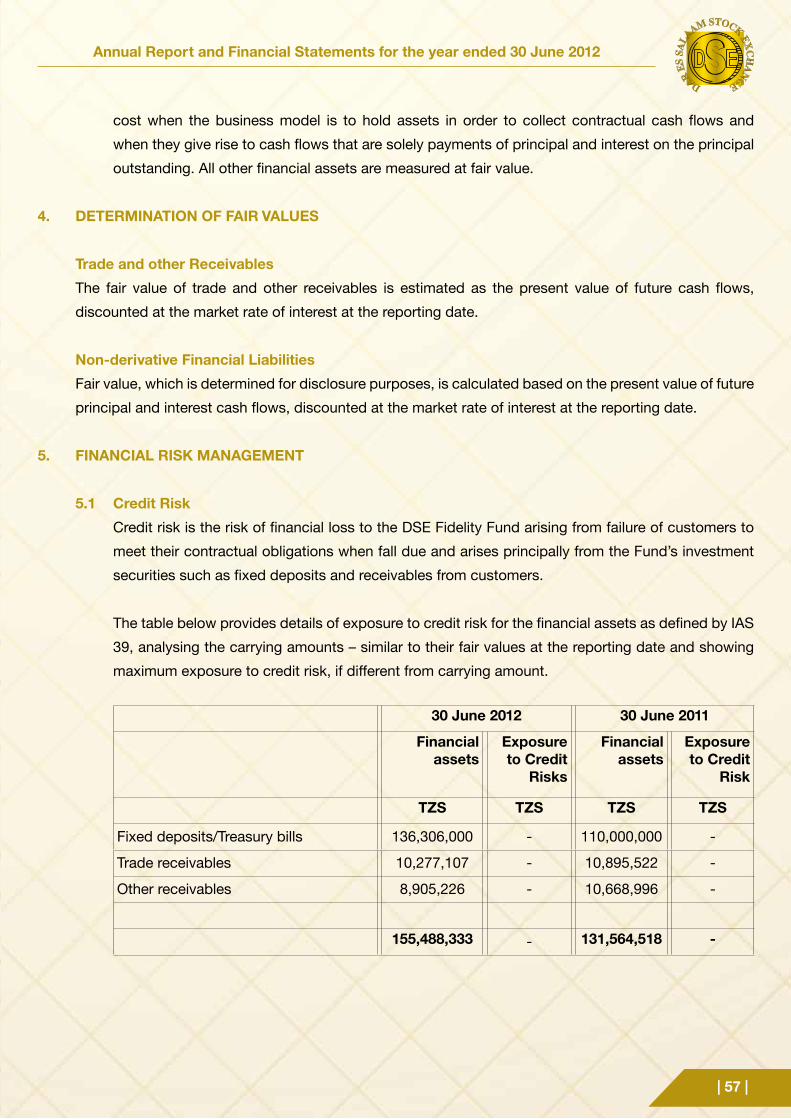
Annual Report and Financial Statements for the year ended 30 June 2012
| 57 |
cost when the business model is to hold assets in order to collect contractual cash flows and
when they give rise to cash flows that are solely payments of principal and interest on the principal
outstanding. All other financial assets are measured at fair value.
4. DETERMINATION OF FAIR VALUES
Trade and other Receivables
The fair value of trade and other receivables is estimated as the present value of future cash flows,
discounted at the market rate of interest at the reporting date.
Non-derivative Financial Liabilities
Fair value, which is determined for disclosure purposes, is calculated based on the present value of future
principal and interest cash flows, discounted at the market rate of interest at the reporting date.
5. FINANCIAL RISK MANAGEMENT
5.1 Credit Risk
Credit risk is the risk of financial loss to the DSE Fidelity Fund arising from failure of customers to
meet their contractual obligations when fall due and arises principally from the Fund’s investment
securities such as fixed deposits and receivables from customers.
The table below provides details of exposure to credit risk for the financial assets as defined by IAS
39, analysing the carrying amounts – similar to their fair values at the reporting date and showing
maximum exposure to credit risk, if different from carrying amount.
30 June 2012 30 June 2011
Financial assets
Exposure to Credit
Risks
Financial assets
Exposure to Credit
Risk
TZS TZS TZS TZS
Fixed deposits/Treasury bills 136,306,000 - 110,000,000 -
Trade receivables 10,277,107 - 10,895,522 -
Other receivables 8,905,226 - 10,668,996 -
155,488,333 - 131,564,518 -
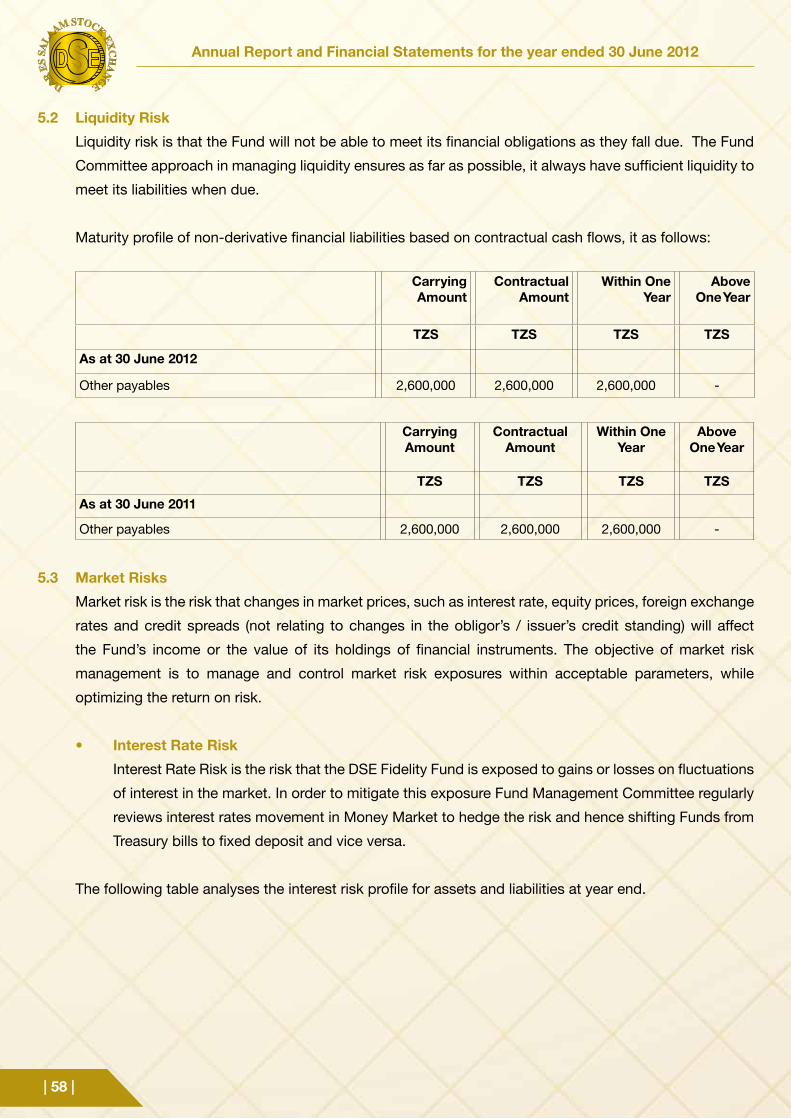
| 58 |
Annual Report and Financial Statements for the year ended 30 June 2012
5.2 Liquidity Risk
Liquidity risk is that the Fund will not be able to meet its financial obligations as they fall due. The Fund
Committee approach in managing liquidity ensures as far as possible, it always have sufficient liquidity to
meet its liabilities when due.
Maturity profile of non-derivative financial liabilities based on contractual cash flows, it as follows:
Carrying Amount
Contractual Amount
Within One Year
Above One Year
TZS TZS TZS TZS
As at 30 June 2012
Other payables 2,600,000 2,600,000 2,600,000 -
Carrying Amount
Contractual Amount
Within One Year
Above One Year
TZS TZS TZS TZS
As at 30 June 2011
Other payables 2,600,000 2,600,000 2,600,000 -
5.3 Market Risks
Market risk is the risk that changes in market prices, such as interest rate, equity prices, foreign exchange
rates and credit spreads (not relating to changes in the obligor’s / issuer’s credit standing) will affect
the Fund’s income or the value of its holdings of financial instruments. The objective of market risk
management is to manage and control market risk exposures within acceptable parameters, while
optimizing the return on risk.
• Interest Rate Risk
Interest Rate Risk is the risk that the DSE Fidelity Fund is exposed to gains or losses on fluctuations
of interest in the market. In order to mitigate this exposure Fund Management Committee regularly
reviews interest rates movement in Money Market to hedge the risk and hence shifting Funds from
Treasury bills to fixed deposit and vice versa.
The following table analyses the interest risk profile for assets and liabilities at year end.
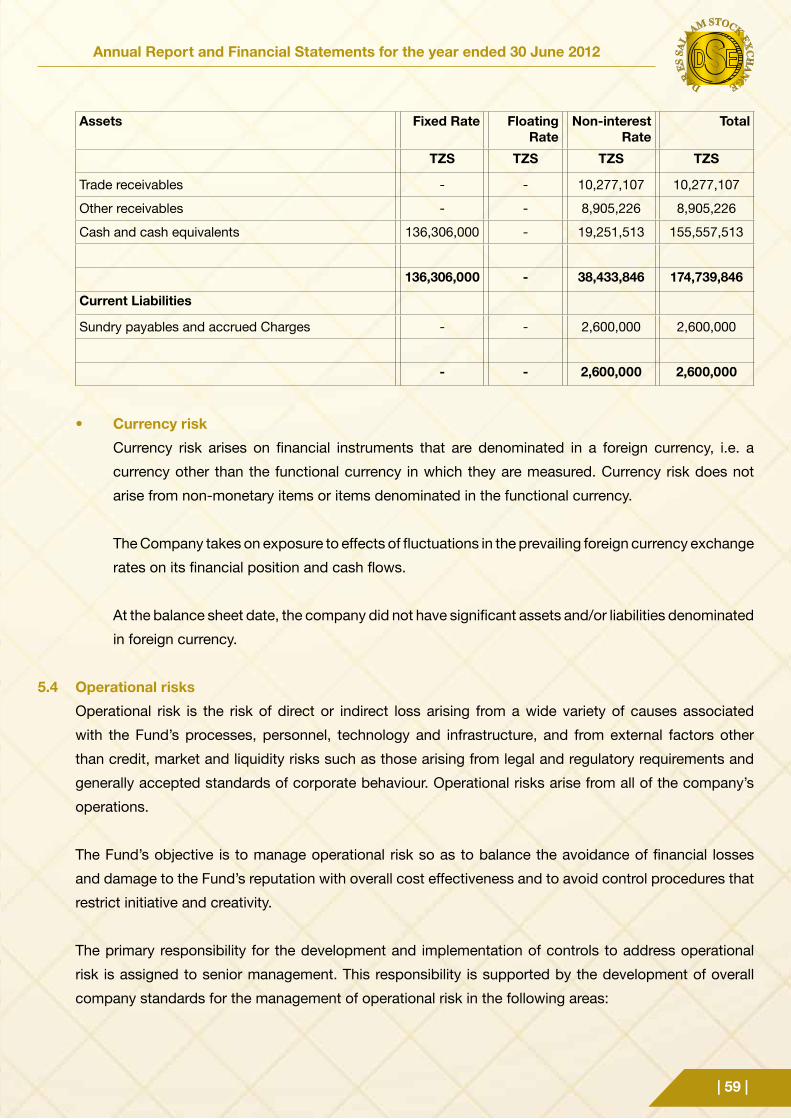
Annual Report and Financial Statements for the year ended 30 June 2012
| 59 |
Assets Fixed Rate Floating Rate
Non-interest Rate
Total
TZS TZS TZS TZS
Trade receivables - - 10,277,107 10,277,107
Other receivables - - 8,905,226 8,905,226
Cash and cash equivalents 136,306,000 - 19,251,513 155,557,513
136,306,000 - 38,433,846 174,739,846
Current Liabilities
Sundry payables and accrued Charges - - 2,600,000 2,600,000
- - 2,600,000 2,600,000
• Currency risk
Currency risk arises on financial instruments that are denominated in a foreign currency, i.e. a
currency other than the functional currency in which they are measured. Currency risk does not
arise from non-monetary items or items denominated in the functional currency.
The Company takes on exposure to effects of fluctuations in the prevailing foreign currency exchange
rates on its financial position and cash flows.
At the balance sheet date, the company did not have significant assets and/or liabilities denominated
in foreign currency.
5.4 Operational risks
Operational risk is the risk of direct or indirect loss arising from a wide variety of causes associated
with the Fund’s processes, personnel, technology and infrastructure, and from external factors other
than credit, market and liquidity risks such as those arising from legal and regulatory requirements and
generally accepted standards of corporate behaviour. Operational risks arise from all of the company’s
operations.
The Fund’s objective is to manage operational risk so as to balance the avoidance of financial losses
and damage to the Fund’s reputation with overall cost effectiveness and to avoid control procedures that
restrict initiative and creativity.
The primary responsibility for the development and implementation of controls to address operational
risk is assigned to senior management. This responsibility is supported by the development of overall
company standards for the management of operational risk in the following areas:
| 60 |
Annual Report and Financial Statements for the year ended 30 June 2012
• requirements for appropriate segregation of duties, including the independent authorization of transactions
• requirements for the reconciliation and monitoring of transactions
• compliance with regulatory and other legal requirements
• documentation of controls and procedures
• requirements for the periodic assessment of operational risks faced, and the adequacy of controls and
procedures to address the risks identified
• requirements for the reporting of operational losses and proposed remedial action
• development of contingency plans
• training and professional development
• ethical and business standards
• risk mitigation, including insurance where this is effective.
6. FEE INCOME
2012 2011TZS TZS
Transaction fees 17,622,570 19,301,324
7. OTHER INCOME
2012 2011TZS TZS
Interest income 11,199,856 8,103,309
Fines and Penalties 6,200,000
17,399,856 8,103,309
8. AUDIT FEES
2,547,618 2,547,620
9. RECEIVABLES
Amount owing by brokers &DSE 10,277,107 14,553,148
Interest receivable from CBA 8,905,226 7,011,370
19,182,333 21,564,518
Annual Report and Financial Statements for the year ended 30 June 2012
| 61 |
10. ACCUMULATED FUND
At beginning of year 139,727,039 114,948,025
Surplus for the year 32,412,808 24,779,014
172,139,847 139,727,039
The minimum amount of the Fund as provided by the Capital Markets and Securities (CMS) Act, 1994 is
TZS 100 million or such other sum as the Minister may, by Notice in the Gazette, direct to be paid to the
credit of the Fund on the establishment of the Stock Exchange. Subsequent to establishment a Notice
in the Gazette dated 25th March 1998 stated that the Fund shall consist of a credit of 0.04% of the total
commissions charged for securities transactions at the Exchange.
The CMS Act further provides that an annual sum equal to 10% or more of the net income of the Stock
Exchange for any one financial year be paid to the Fund, as reflected in the accounting policies. No such
sum has been received since inception as there has been no net income after exclusion of Government
subventions
11. CURRENT LIABILITIES
2012 2011
TZS TZS
The amount of current liabilities comprise:
(a) Provision for audit fee 2,600,000 2,600,000
| 62 |
Annual Report and Financial Statements for the year ended 30 June 2012
Member firms
(a) Licensed Dealing Members
CORE securities Ltd
4th Floor, Elite City Building
Samora Avenue, DSM
Tel: +255 22 212 3103
Fax: +255 22 218 2521
Orbit Securities Co. Ltd
4th Floor, Golden Jubilee Towers
Ohio Street, DSM
Tel: +255 22 211 1758
Fax: +255 22 211 3067
Rasilimali Ltd
CHC Building
Samora Avenue, DSM
Tel: +255 22 211 1708
Fax: +255 22 212 2883
Solomon Stockbrokers Co. Ltd
Ground Floor, PPF House
Samora Avenue/ Morogoro Road, DSM
Tel: +255 22 211 2874
Fax: +255 22 213 1969
Tanzania Securities Ltd
7thFloor, IPS Building
Samora Avenue/ AzikiweStr, DSM
Tel: +255 22 211 2807
Fax: +255 22 211 2809
Vertex International Securities Ltd
Annex Building – Zambia High Commission
Sokoine Drive / Ohio Street, DSM
Tel: +255 22 211 6382
Fax: +255 22 211 0387
ZAN Securities Ltd
Mezzanine Floor/Haidary Plaza
Upanga/KisutuStreet,DSM
Tel:+255 22 2126415
Fax;+255 22 2126414
Annual Report and Financial Statements for the year ended 30 June 2012
| 63 |
(b) Licensed Investment Advisor
Banc ABC(Formerly African Banking Corporation)
1stFloor, Barclays House
Ohio Street/ Ali H. Mwinyi Road, DSM
Tel: +255 22 211 0392
Fax: +255 22 211 2402
Aureos Tanzania Managers Ltd50 Mirambo Street,
DSM
Tel: +255 22 211 2926
Fax: +255 22 2113645
Barclays Bank Tanzania LtdTDFL Building
Ohio Street, DSM
Tel: +255 22 212 9381
Fax: +255 22 212 9757
Consultants for Resources Evaluation LtdGround Floor, Twiga House
Samora Avenue, DSM
Tel: +255 22 212 3103
Fax: +255 22 218 2521
Deloitte Consulting Ltd10
thFloor, PPF Tower
Ohio street, DSM
Tel: + 255 22 211 6006
Fax: +255 22 211 6379
Tanzania Securities Ltd7
thFloor, IPS Building
Samora Avenue/Azikiwe Street, DSM
Tel: +255 22 211 2807
Fax: +255 22 211 2809
Orbit Securities Company Ltd4thFloor, Golden Jubilee Towers
Ohio Street, DSM
Tel: +255 22 211 1758
Fax: +255 22 211 3067
Rasilimali LtdCHC Building
Samora Avenue, DSM
Tel: +255 22 211 1708
Fax: +255 22 212 2883
Standard Chartered Bank (T) LtdInternational House
Shaaban Robert Street/Garden Avenue, DSM
Tel: +255 22 212 2160
Fax: +255 22 212 2089
Unit Trust of Tanzania3
rdFloor, Sukari House
Samora Avenue/Azikiwe Street, DSM
Tel: + 255 22 212 8460
Fax: + 255 22 213 7593
| 64 |
Annual Report and Financial Statements for the year ended 30 June 2012
Vertex Financial Services.Annex Building, Zambia High
Commission.
Sokoine Drive / Ohio Street, DSM
Tel: +255 22 211 6382
Fax: +255 22 211 0387
Ernst &Young Advisory ServicesUtalii House, 36 Laibon Road,
OysterbayDSM
Tel: +255 22 266 7227;
Fax: +255 22 266 6948
Commercial Bank of Africa (Tanzania) Limited
Amani Place, 2nd Floor
Ohio Street
P.O. Box 9640
Dar es Salaam
Tel: +255 22 213 0113
Fax: +255 22 213 0116
Email: [email protected]
Website: www.cba.co.tz
FTC Consultants Limited
2nd Floor, Osman Towers
Zanaki Street
P.O. Box 22731
Dar es Salaam
Tel: +255 22 211 5251 / 2 / 3
Fax: +255 22 213 0519
Email: [email protected]
Bank M (Tanzania) Limited
Money Centre – 8 Ocean Road
P.O. Box 96, Dar es Salaam
Tel: +255 22 234 5678
Fax: +255 22 212 7824
Website: www.bankm.co.tz
Choice Capital Management Company Ltd
5th Floor, NIC Life House, Wing B
Sokoine Drive/ Ohio Street
P.0. Box 61269
Dar es Salaam
Tel: +255 22 213 3997
Website: www.choicecapitalmanagement.com
Exim Advisory Services Ltd
8th Floor, Office Academy Scheme Building,
Azikiwe Street
P.0. Box 3219
Dar es Salaam
Tel: +255 22 213 4156
Fax: +255 22 213 4157
Website: www.eximadvisoryservices.com
LJK Konsulting Limited
8th Floor, Harbour View Towers
Samora Avenue
P.O. Box 20651
Dar es Salaam
Tel: +255 22 212 4383
Fax: +255 22 212 4383
Equity Investment Management Limited
4th Floor, 50 Mirambo Street
P.O. Box 8020
Dar es Salaam
Tel: +255 22 211 2926
Fax: +255 22 211 3645

Dar es Salaam Stock ExchangeTwiga Building, 4th Floor
Samora AvenueP.O. Box 70081
Tel: + 255 22 2135779, 2123983, 2128522Fax: + 255 22 2133849E-Mail: [email protected]
Website: http://www.dse.co.tz
Annual Reportand Financial Statementsfor the year ended 30 June 2012