annual report and financial statements - sanctuary group · 6 annual report and financial...
TRANSCRIPT
2 ANNUAL REPORT AND FINANCIAL STATEMENTS 2016/2017
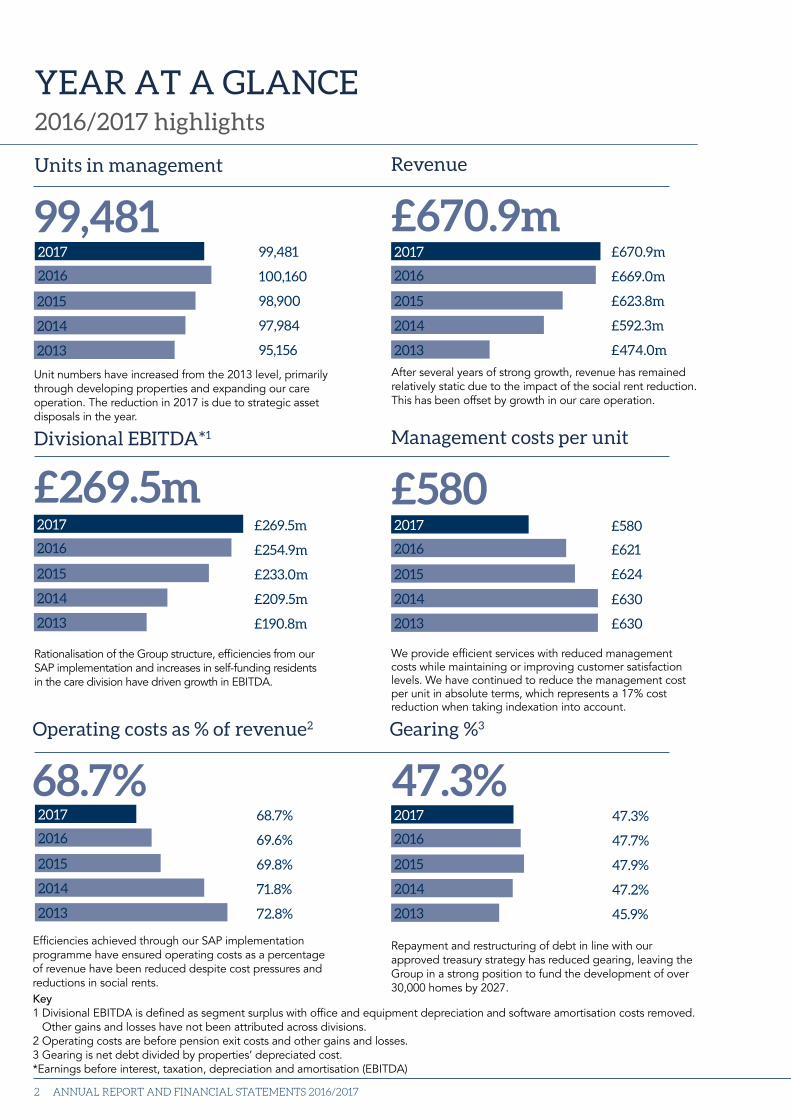
YEAR AT A GLANCE 2016/2017 highlights
68.7% 2017 68.7%
2016 69.6%
2015 69.8%
2014 71.8%
2013 72.8%
Efficiencies achieved through our SAP implementation programme have ensured operating costs as a percentage of revenue have been reduced despite cost pressures and reductions in social rents.
99,481 2017 99,481
2016 100,160
2015 98,900
2014 97,984
2013 95,156
Units in management
Unit numbers have increased from the 2013 level, primarily through developing properties and expanding our care operation. The reduction in 2017 is due to strategic asset disposals in the year.
Divisional EBITDA*1
£269.5m 2017 £269.5m
2016 £254.9m
2015 £233.0m
2014 £209.5m
2013 £190.8m
Rationalisation of the Group structure, efficiencies from our SAP implementation and increases in self-funding residents in the care division have driven growth in EBITDA.
47.3% 2017 47.3%
2016 47.7%
2015 47.9%
2014 47.2%
2013 45.9%
Repayment and restructuring of debt in line with our approved treasury strategy has reduced gearing, leaving the Group in a strong position to fund the development of over 30,000 homes by 2027.
Revenue
£670.9m 2017 £670.9m
2016 £669.0m
2015 £623.8m
2014 £592.3m
2013 £474.0m
After several years of strong growth, revenue has remained relatively static due to the impact of the social rent reduction. This has been offset by growth in our care operation.
Management costs per unit
£580 2017 £580
2016 £621
2015 £624
2014 £630
2013 £630
We provide efficient services with reduced management costs while maintaining or improving customer satisfaction levels. We have continued to reduce the management cost per unit in absolute terms, which represents a 17% cost reduction when taking indexation into account.
Key1 Divisional EBITDA is defined as segment surplus with office and e quipment depreciation and software amortisation costs removed.
Other gains and losses have not been attributed across divisions.2 Operating costs are before pension exit costs and other gains and losses.3 Gearing is net debt divided by properties’ depreciated cost.*Earnings before interest, taxation, depreciation and amortisation (EBITDA)
Operating costs as % of revenue2 Gearing %3
Strategic report Financial statem
ents
3
CONTENTS
STR
AT
EG
IC R
EP
OR
T
GO
VE
RN
AN
CE
F
INA
NC
IAL
STA
TE
ME
NT
SO
TH
ER
INF
OR
MA
TIO
N
CONTENTS
THE STRATEGIC REPORT OF THE BOARD AND OPERATING AND FINANCIAL REVIEW
GROUP CHAIR’S STATEMENT 4
GROUP CHIEF EXECUTIVE’S
STATEMENT
6
THE OPERATING STRUCTURE OF
OUR BUSINESS
8
OUR VALUES 9
SANCTUARY’S BUSINESS MODEL 10
VALUE FOR MONEY 12
BUSINESS STRATEGY 2017–2021 14
CHIEF FINANCIAL OFFICER’S REVIEW 16
BUSINESS REVIEW 22
GOVERNANCE
GROUP BOARD 32
STATUTORY, REGULATORY AND
OTHER INFORMATION
38
INTERNAL CONTROLS 40
VIABILITY STATEMENT 42
PRINCIPAL RISKS AND
UNCERTAINTIES
43
STATEMENT OF BOARD’S
RESPONSIBILITIES IN RESPECT OF
THE BOARD’S REPORT AND THE
FINANCIAL STATEMENTS
46
FINANCIAL STATEMENTS
INDEPENDENT AUDITOR’S
REPORT TO SANCTUARY
HOUSING ASSOCIATION
47
STATEMENT OF
COMPREHENSIVE INCOME
48
STATEMENT OF FINANCIAL
POSITION
49
STATEMENT OF CHANGES IN
EQUITY
50
STATEMENT OF CASH FLOWS 51
NOTES TO THE FINANCIAL
STATEMENTS
52
OTHER INFORMATION
APPENDIX 1 TURNOVER, COST
OF SALES, OPERATING COSTS
AND OPERATING SURPLUS
114
APPENDIX 2 INCOME AND
EXPENDITURE FROM SOCIAL
HOUSING LETTINGS
116
APPENDIX 3 FIVE-YEAR
SUMMARY NOTES117
ADVISORS AND OTHER
INFORMATION
118
Icon keyLinks to website
ANNUAL REPORT AND FINANCIAL STATEMENTS 2016/20174
GROUP CHAIR’S STATEMENT
“Sanctuary’s unique portfolio of accommodation and services means we are well placed to make a positive difference to a wide range of communities across the country.”
In a changing operating environment, Sanctuary remains committed to delivering high quality services, whilst leading the way in solving Britain’s housing crisis. As a result, we are developing over 30,000 new homes in England and Scotland by 2027, two-thirds of which will be affordable housing.
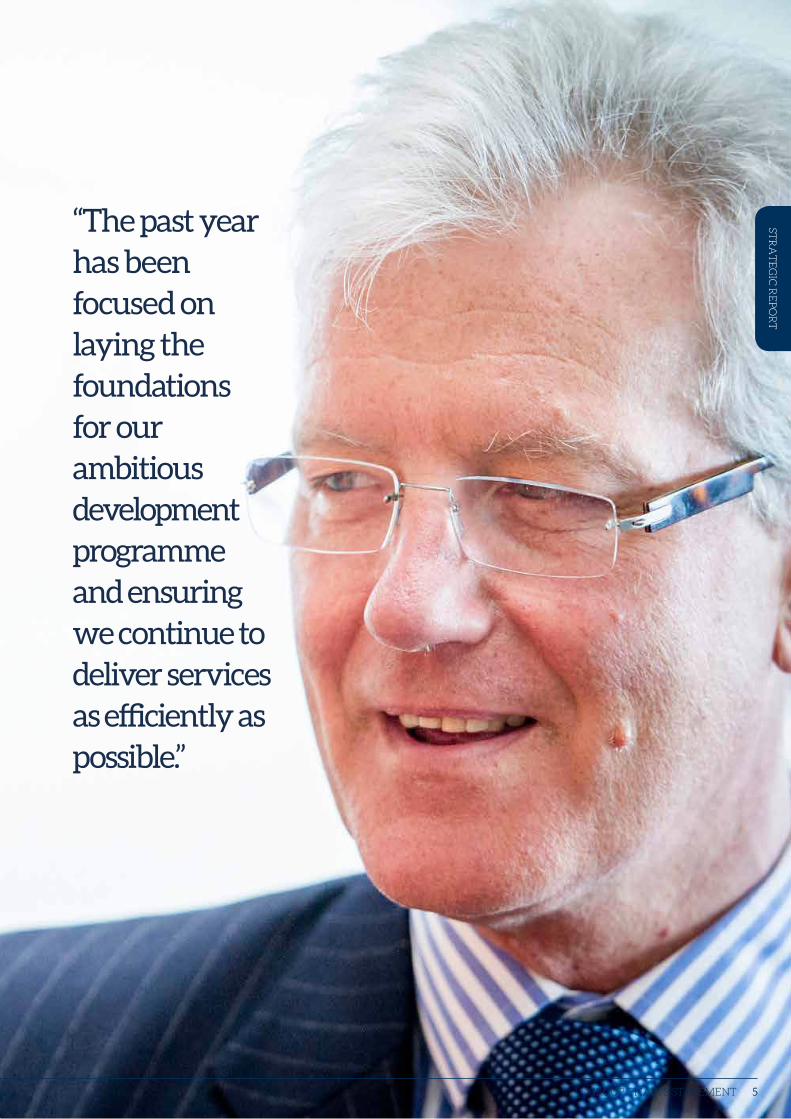
The past year has been focused on laying the foundations for our ambitious development programme and ensuring we continue to deliver services as efficiently as possible.
Sanctuary’s unique portfolio of accommodation and services means we are well placed to make a positive difference to a wide range of communities across the country.
Sanctuary is in the process of expanding its portfolio of care homes through a combination of construction and acquisition. As one of the largest providers of residential and nursing care in the UK, this will enable us to give a greater number of older people the care and support they want to live healthy and fulfilling lives.
None of our achievements would be possible without financial strength and uncompromising standards of governance. The confirmation of the Group’s financial ratings by Moody’s and Standard & Poor’s, and the Homes and Communities Agency’s G1/V1 rating, confirm external confidence in the Group’s business plan and governance.
We are mindful of the risks Sanctuary is facing, including the impact of welfare reform on our tenants, further reductions in social rents and uncertainty around Brexit. I am confident that we will be able to succeed in our mission and ensure Sanctuary’s continued growth as a sector-leading and sustainable business.
Our charitable objectives, of providing housing and care to those who are in need, remain the reason for our existence and are what motivate us every day. To that end, it is thanks to the commitment of our 11,000 staff that we can look to the future with optimism for our customers, stakeholders and investors.
Leading the way in solving Britain’s housing crisis
ANNUAL REPORT AND FINANCIAL STATEMENTS 2016/20174
Jonathan Lander Group Chair
Strategic report Financial statem
ents
5
“The past year has been focused on laying the foundations for our ambitious development programme and ensuring we continue to deliver services as efficiently as possible.”
5GROUP CHAIR’S STATEMENT 5
STR
AT
EG
IC R
EP
OR
T
ANNUAL REPORT AND FINANCIAL STATEMENTS 2016/20176
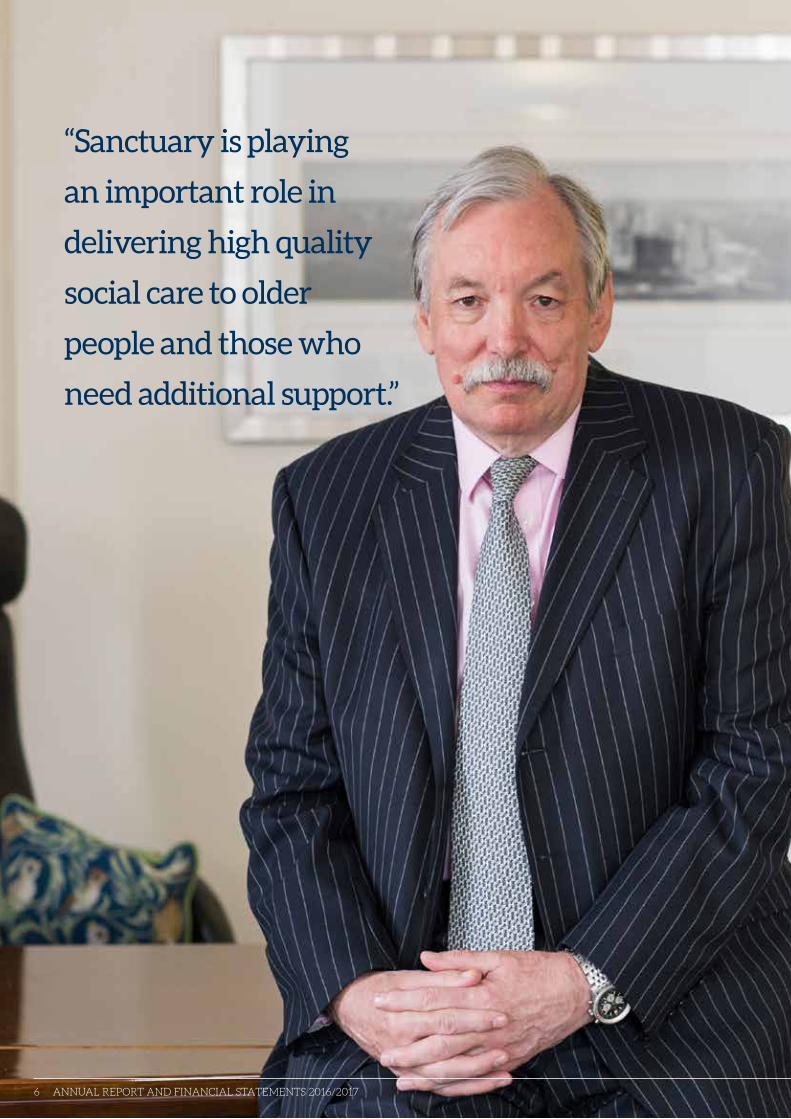
“Sanctuary is playing
an important role in
delivering high quality
social care to older
people and those who
need additional support.”
ANNUAL REPORT AND FINANCIAL STATEMENTS 2016/20176
Strategic report Financial statem
ents
7
GROUP CHIEF EXECUTIVE’S STATEMENT
GROUP CHIEF EXECUTIVE’S STATEMENT 7
STR
AT
EG
IC R
EP
OR
T
Demonstrating our values
“As Sanctuary approaches its 50th year, our charitable objectives remain as important as when we were set up.”
Sanctuary is developing over 30,000 homes by 2027, which will enable the Group to make a marked contribution to improving housing nationwide. The programme has been progressing apace and now has 5,000 homes in the pipeline, building up to a sustainable programme of 3,000 new homes each year from 2020.
The Group is proud to be developing notable and exciting schemes including the former Victoria Infirmary in Glasgow; contemporary, stylish apartments at The Quadrangle in Haringey; and family homes at Bullwood Hall in Rochford. As well as providing new homes, this programme will create a wide range of employment and training opportunities, enhancing theimpact of the investment. To supportthe delivery of the programme the Homes and Communities Agency has awarded Sanctuary almost £90 million of funding, the largest grant allocation in the sector.
Furthermore, Sanctuary is playing an important role in delivering high quality social care to older people and those who need additional support. Our 68 care homes hold one of the highest overall Care Quality Commission ratings for large providers in the sector with 85 per cent of our homes rated good or outstanding, while we continue to win contracts around the country, most recently in Redcar and Cleveland, to deliver support services. We have expanded our offering with a number of intermediate care contracts allowing people to leave hospital when they are ready and receive rehabilitative care before returning home.
Our continued focus on cost-effective services has seen us launch our sector-leading enterprise-wide information technology system. We now use the SAP system to manage housing and maintenance operations, on top of our existing use of it for human resources, finance and recruitment. This has led to improved and streamlined processes and will mean we can operate even more efficiently.
As Sanctuary approaches its 50th year, our charitable objectives remain as important as when we were set up. Throughout that time, we have demonstrated our values of ambition, diversity, integrity, quality and sustainability. Our people share those values and it is thanks to them that we are able to make a difference to customers and society as a whole.
David Bennett Group Chief Executive
ANNUAL REPORT AND FINANCIAL STATEMENTS 2016/20178
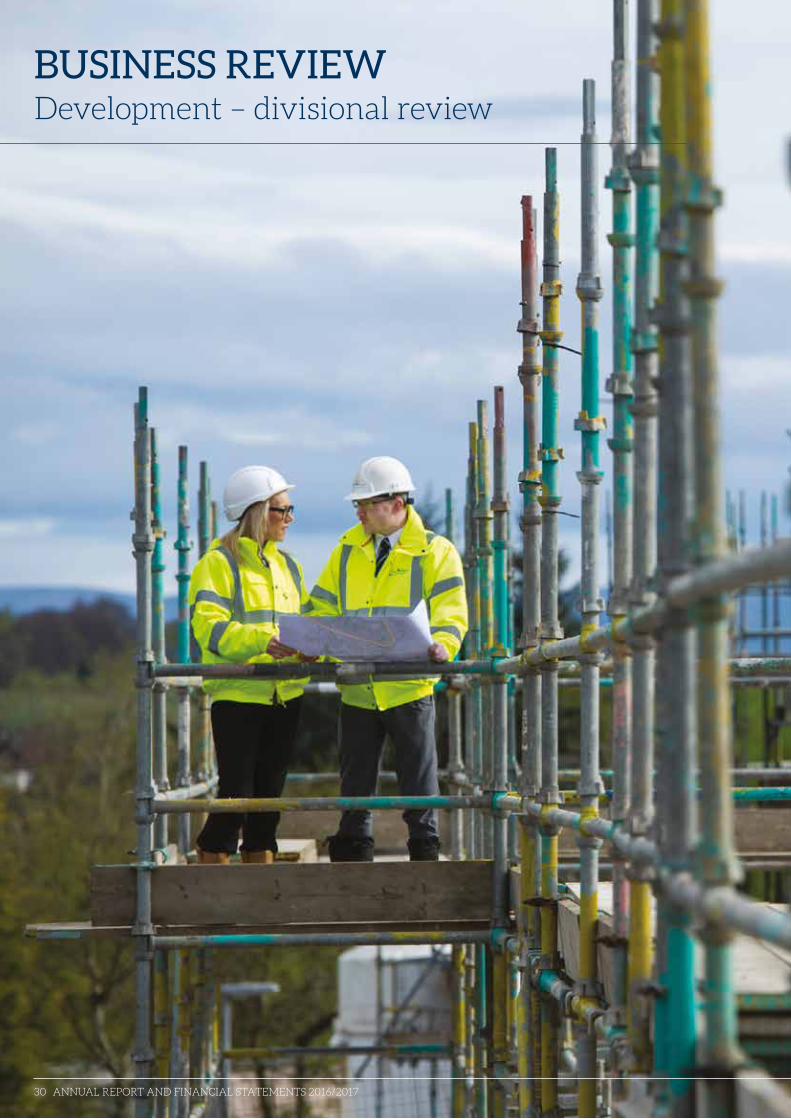
Development We take our role in meeting the UK’s housing shortage seriously and we are building more homes than ever before. Our significant development programme will include homes built by our own in-house construction team. Ultimately, we want to build the majority of our new homes, creating training and employment opportunities for our customers along the way.
Affordable housing We believe everyone should be able to live in a decent home, where they feel safe and secure. We provide a range of high quality affordable homes and support services across England and Scotland, reflecting the needs and aspirations of our customers and delivering services at a competitive cost. We also provide in-house maintenance and reinvestment services across our portfolio of properties.
CareWe are a leading provider of care for older people, with 68 welcoming homes operated by highly trained staff. We are committed to keeping kindness at the heart of our care. We help our residents live dignified and fulfilling lives in places where they can explore their passions, learn new things and build lasting friendships. Our well-equipped care homes provide a range of long and short-term care and support, including residential, nursing, intermediate, respite, end-of-life, and specialist dementia care.
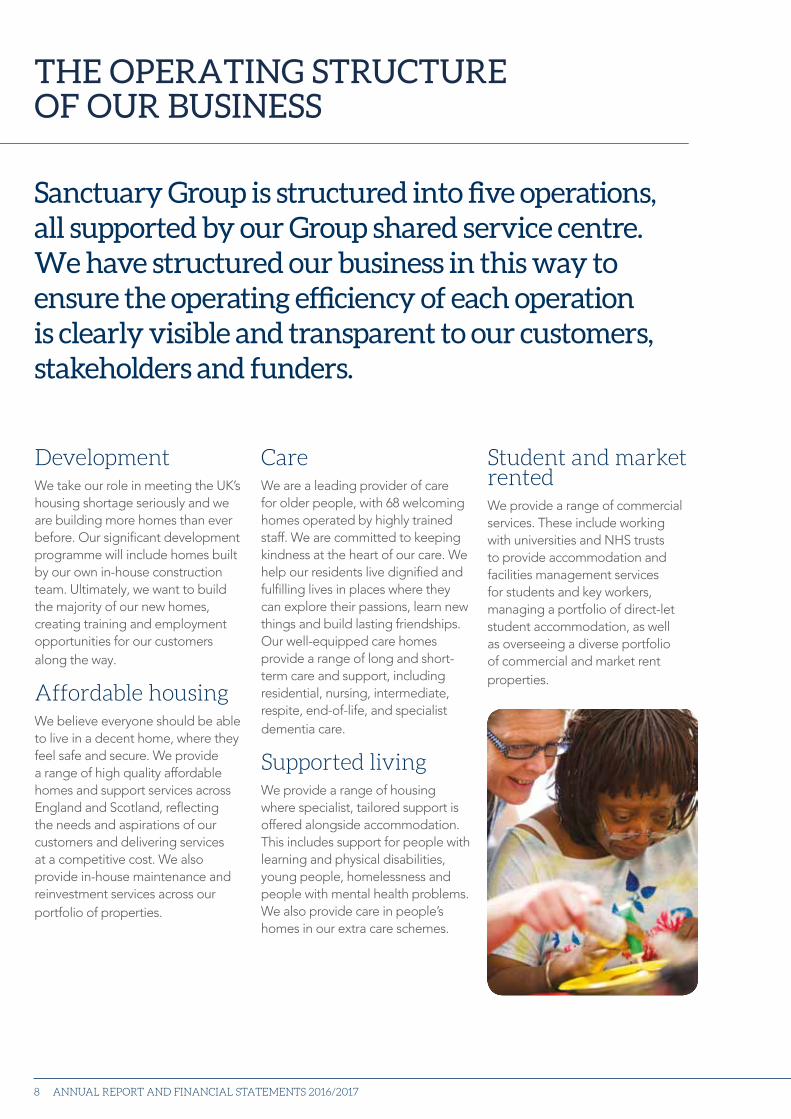
Supported livingWe provide a range of housing where specialist, tailored support is offered alongside accommodation. This includes support for people with learning and physical disabilities, young people, homelessness and people with mental health problems. We also provide care in people’s homes in our extra care schemes.
Student and market rentedWe provide a range of commercial services. These include working with universities and NHS trusts to provide accommodation and facilities management services for students and key workers, managing a portfolio of direct-let student accommodation, as well as overseeing a diverse portfolio of commercial and market rent properties.
Sanctuary Group is structured into five operations, all supported by our Group shared service centre. We have structured our business in this way to ensure the operating efficiency of each operation is clearly visible and transparent to our customers, stakeholders and funders.
THE OPERATING STRUCTURE OF OUR BUSINESS
Strategic report Financial statem
ents
9
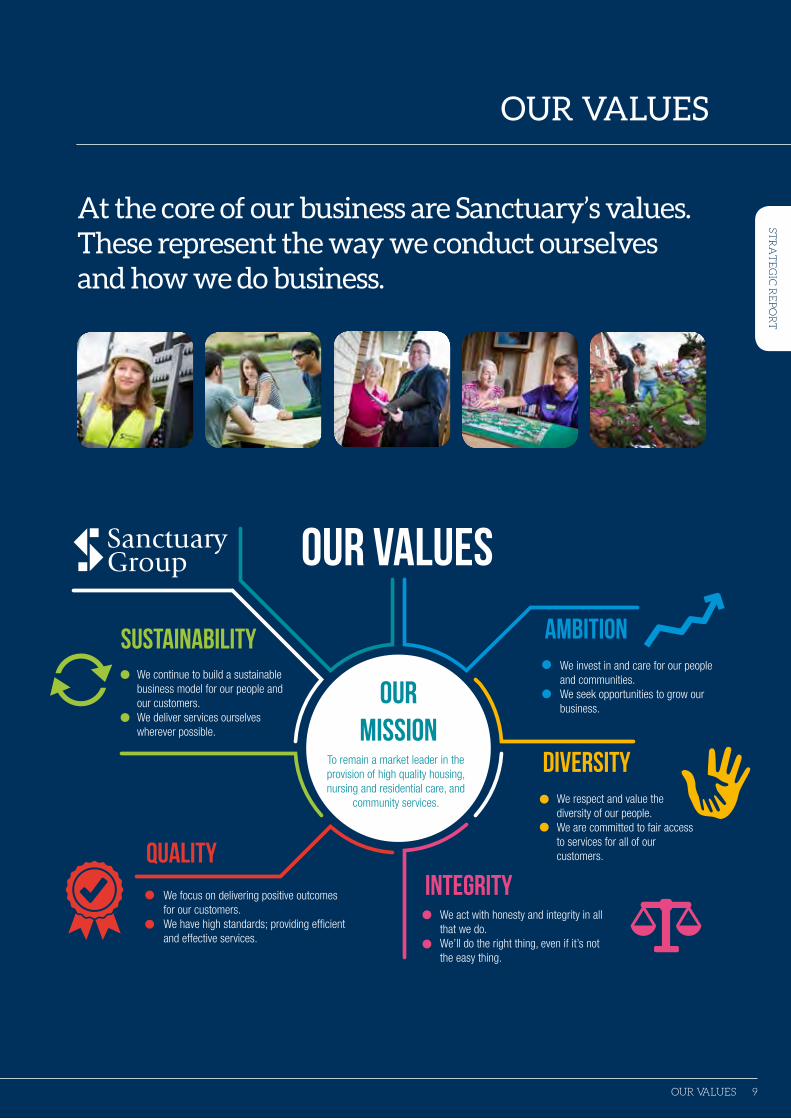
At the core of our business are Sanctuary’s values. These represent the way we conduct ourselves and how we do business.
OUR VALUES
OUR values
our mission
To remain a market leader in the provision of high quality housing, nursing and residential care, and
community services.
AMBITION
qualityWe focus on delivering positive outcomesfor our customers.We have high standards; providing efficient and effective services.
sustainabilityWe continue to build a sustainable business model for our people and our customers.We deliver services ourselves wherever possible.
diversityWe respect and value the diversity of our people. We are committed to fair access to services for all of our customers.
We invest in and care for our people and communities.We seek opportunities to grow our business.
integrityWe act with honesty and integrity in all that we do. We’ll do the right thing, even if it’s not the easy thing.
OUR VALUES 9
STR
AT
EG
IC R
EP
OR
T
ANNUAL REPORT AND FINANCIAL STATEMENTS 2016/201710
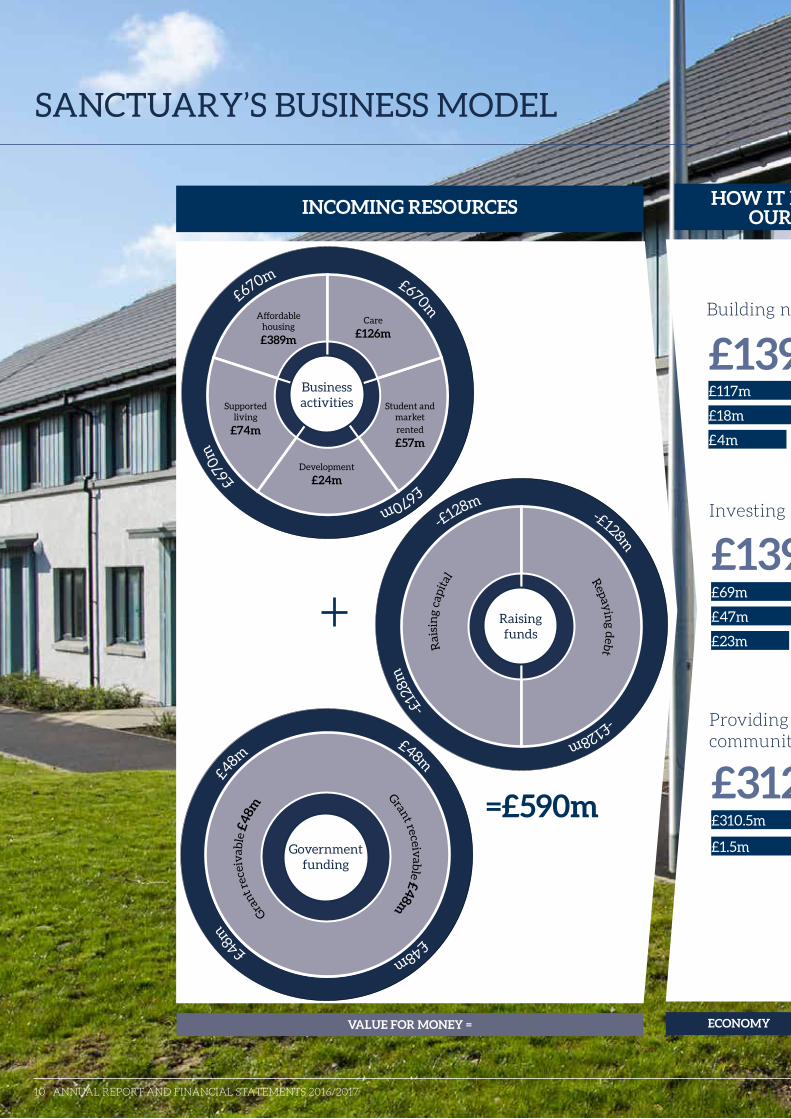
Building new homes
£117m
£18m
£4m
£139m
Investing in existing homes
£69m
£47m
£23m
£139m
Providing services and community investment
£312m
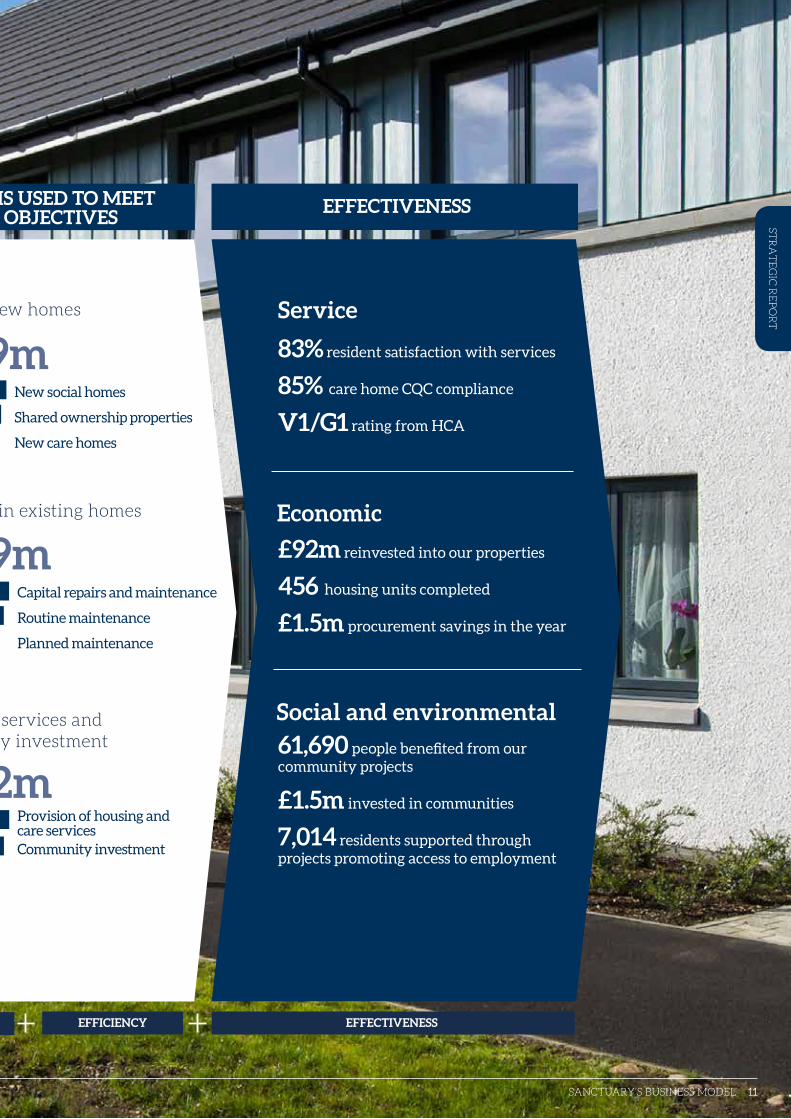
HOW IT IS USED TO MEET OUR OBJECTIVES
ECONOMY
Raising funds
Repaying debt
£50m
Raising capital
£250m
-£128m -£128m
-£12
8m
-£128m
R
aisi
ng
capi
tal
R
epayin
g deb
t
=£590m
Businessactivities
Affordable housing
£389m
Care
£126m
Student and market rented £57m
Development
£24m
Supportedliving
£74m
£670m £670m
£670
m
£670m
Government funding
£48m £48m
£48m
£48m
G
ran
t rec
eiv
able
£48m
Grant receivab
le £48m
INCOMING RESOURCES
SANCTUARY’S BUSINESS MODEL
VALUE FOR MONEY =
ANNUAL REPORT AND FINANCIAL STATEMENTS 2016/201710
£310.5m
£1.5m
Strategic report Financial statem
ents
11
Building new homes
New social homes
Shared ownership properties
New care homes
Investing in existing homes
Capital repairs and maintenance
Routine maintenance
Planned maintenance
Providing services and community investment
Provision of housing and care services Community investment
HOW IT IS USED TO MEET OUR OBJECTIVES
EFFECTIVENESS
Service
83% resident satisfaction with services
85% care home CQC compliance
V1/G1 rating from HCA
Economic
£92m reinvested into our properties
456 housing units completed
£1.5m procurement savings in the year
Social and environmental
61,690 people benefited from our community projects
£1.5m invested in communities
7,014 residents supported through projects promoting access to employment
EFFICIENCY EFFECTIVENESSECONOMY
SANCTUARY’S BUSINESS MODEL 1111
STR
AT
EG
IC R
EP
OR
T
£117m
£18m
£139m
£69m
£47m
£139m
£312m£310.5m
£1.5m

ANNUAL REPORT AND FINANCIAL STATEMENTS 2016/201712
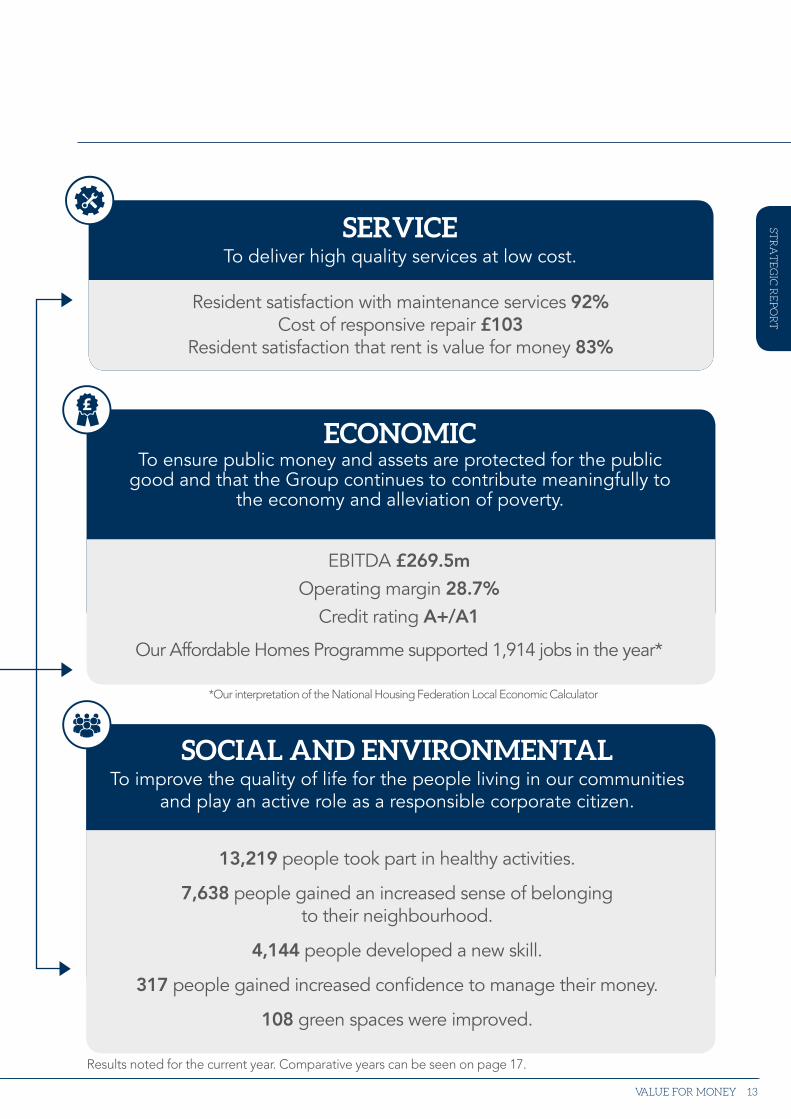
ECONOMYAchieving the best value
from our inputs, that is, where items were purchased did we
get them for the best possible value?
EFFICIENCYMaximising the outputs for a given level of inputs, that is, how good are we at creating
the output?
EFFECTIVENESSEnsuring the outputs deliver the desired
outcome, that is, was what we delivered at the correct standard and did
it achieve the desired outcome? We measure
effectiveness through the service, economic, and
social and environmental benefits created.
+
Our full Value for Money document is included within our Value Report, which can be found at: www.sanctuary-group.co.uk/about-us/publications
VALUE FOR MONEY
Our Group Board has responsibility for setting Value for Money objectives and for
monitoring progress. Objectives are set in the business plan and are reflected in
operational plans and budgets. Key performance indicators and management accounts
reports are monitored by our Executive Committee and Group Board against operational
plans and budgets. A balanced scorecard and performance reports are presented to our
Group Board.
At Sanctuary, we work to the principles of the three Es – Economy, Efficiency and
Effectiveness – while focusing on delivering service, economic, and social and
environmental benefits. We believe that to achieve and provide Value for Money we
must balance these in achieving our objectives.
Strategic report Financial statem
ents
13VALUE FOR MONEY
SERVICETo deliver high quality services at low cost.
SOCIAL AND ENVIRONMENTALTo improve the quality of life for the people living in our communities
and play an active role as a responsible corporate citizen.
Resident satisfaction with maintenance services 92% Cost of responsive repair £103
Resident satisfaction that rent is value for money 83%
ECONOMICTo ensure public money and assets are protected for the public
good and that the Group continues to contribute meaningfully to the economy and alleviation of poverty.
EBITDA £269.5m
Operating margin 28.7%
Credit rating A+/A1
Our Affordable Homes Programme supported 1,914 jobs in the year*
13,219 people took part in healthy activities.
7,638 people gained an increased sense of belonging to their neighbourhood.
4,144 people developed a new skill.
317 people gained increased confidence to manage their money.
108 green spaces were improved.
STR
AT
EG
IC R
EP
OR
T
*Our interpretation of the National Housing Federation Local Economic Calculator
Results noted for the current year. Comparative years can be seen on page 17.
ANNUAL REPORT AND FINANCIAL STATEMENTS 2016/201714
BUSINESS STRATEGY 2017–2021
The opportunities and challenges facing the UK’s housing sector have never been greater. The EU referendum, increasing demographic pressure on housing and social care, deregulation, the impact of welfare reform, and rent reduction have contributed to a shifting landscape for social landlords. Organisations will need strength and flexibility to thrive in this new environment.
Sanctuary has that strength and flexibility, combined with a bold ambition to play a key part in solving the UK’s housing shortage. We recognise that now is a time for action and that the country needs organisations which are going to step up to dramatically increase housing supply while looking at new ways to deliver a range of tenures. Our strategy, as set out in the Group Business Plan, will do just that.
Our plan includes:
• building new homes – we are developing over 30,000 new homes by 2027. These will be a mixture of shared ownership, rent and properties for outright sale as well as care homes.
• providing cost-effective services – we provide efficient services with reduced management costs while maintaining or improving customer satisfaction levels.
• achieving high quality standards – we will make sure operations across the Group’s diverse range of activities meet the high service expectations of customers and regulators.
The Group has a well-earned reputation as a financially robust and well governed organisation. As a consequence of our careful financial management, public investment has been protected and we have been able to create capacity to subsidise the delivery of social housing, build new homes for those aspiring to own, part own or rent, and for Sanctuary to be an important stakeholder in the communities we serve.
We will reinforce that reputation by utilising our resources to develop new housing for rent and for sale while:
• maintaining and improving key performance ratios;
• proactively managing a range of risks from sales risk through to welfare reform; and
• ensuring access to competitively priced credit.
The full Group Business Plan can be found on the Group website at www.sanctuary-group.co.uk/about-us/publications
Strategic report Financial statem
ents
15
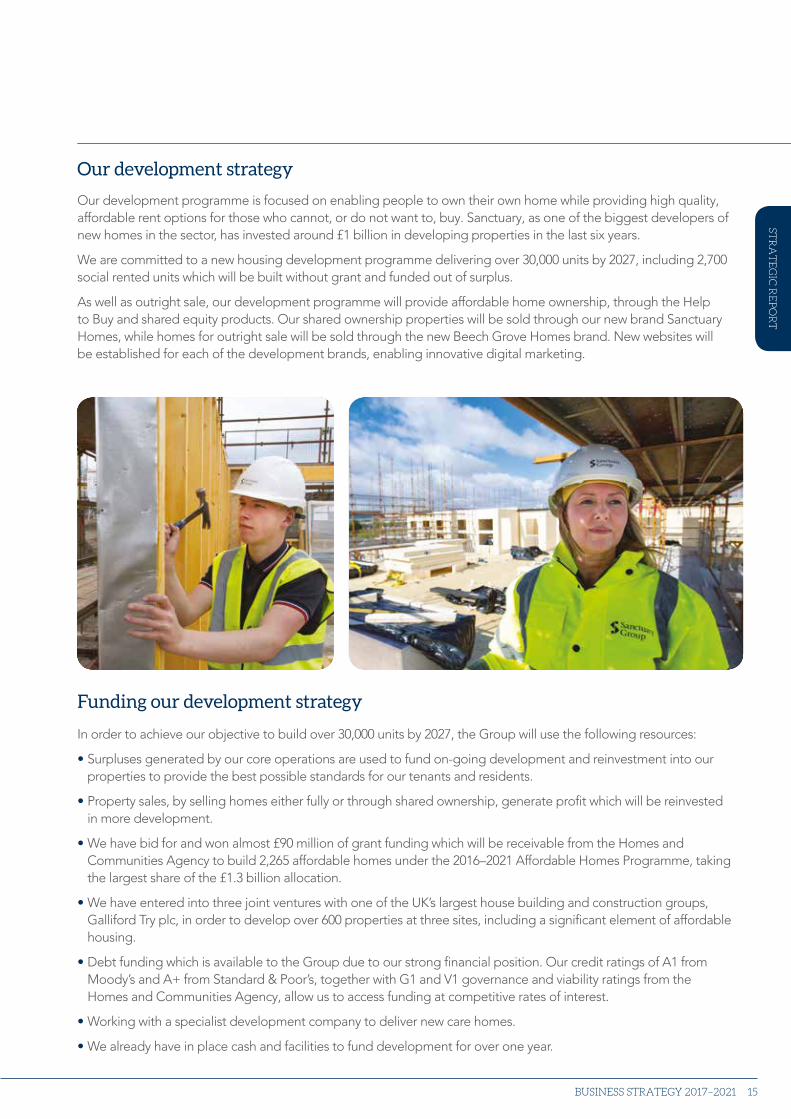
Our development strategy
Our development programme is focused on enabling people to own their own home while providing high quality, affordable rent options for those who cannot, or do not want to, buy. Sanctuary, as one of the biggest developers of new homes in the sector, has invested around £1 billion in developing properties in the last six years.
We are committed to a new housing development programme delivering over 30,000 units by 2027, including 2,700 social rented units which will be built without grant and funded out of surplus.
As well as outright sale, our development programme will provide affordable home ownership, through the Help to Buy and shared equity products. Our shared ownership properties will be sold through our new brand Sanctuary Homes, while homes for outright sale will be sold through the new Beech Grove Homes brand. New websites will be established for each of the development brands, enabling innovative digital marketing.
Funding our development strategy
In order to achieve our objective to build over 30,000 units by 2027, the Group will use the following resources:
• Surpluses generated by our core operations are used to fund on-going development and reinvestment into our properties to provide the best possible standards for our tenants and residents.
• Property sales, by selling homes either fully or through shared ownership, generate profit which will be reinvested in more development.
• We have bid for and won almost £90 million of grant funding which will be receivable from the Homes and Communities Agency to build 2,265 affordable homes under the 2016–2021 Affordable Homes Programme, taking the largest share of the £1.3 billion allocation.
• We have entered into three joint ventures with one of the UK’s largest house building and construction groups, Galliford Try plc, in order to develop over 600 properties at three sites, including a significant element of affordable housing.
• Debt funding which is available to the Group due to our strong financial position. Our credit ratings of A1 from Moody’s and A+ from Standard & Poor’s, together with G1 and V1 governance and viability ratings from the Homes and Communities Agency, allow us to access funding at competitive rates of interest.
• Working with a specialist development company to deliver new care homes.
• We already have in place cash and facilities to fund development for over one year.
BUSINESS STRATEGY 2017–2021
STR
AT
EG
IC R
EP
OR
T
ANNUAL REPORT AND FINANCIAL STATEMENTS 2016/201716
CHIEF FINANCIAL OFFICER’S REVIEW
IntroductionSanctuary has recorded a strong financial performance, delivering stable revenue and increasing operating margin in a period of rent reduction. The steps taken to improve operational efficiency in recent years have positioned the Group to respond to the challenges of our ambitious development plan and expansion of our care home operation.
Five-year summary
IFRS IFRS IFRS UK GAAP UK GAAP
2017 £m 2016 £m 2015 £m 2014 £m 2013 £m
Statement of Comprehensive Income
Revenue 670.9 669.0 623.8 592.3 474.0
Cost of sales and operating expenditure (478.6) (485.5) (450.3) (443.1) (353.4)
Other gains and losses 3.0 17.7 6.8 - -
Share of profit of joint ventures 0.1 - - - 0.1
Operating surplus before pension exit costs 195.4 201.2 180.3 149.2 120.7
Pension exit costs - (8.2) - - -
Operating surplus after pension exit costs 195.4 193.0 180.3 149.2 120.7
Net gain on business combinations - - 0.5 - 25.8
Surplus on sale of fixed assets - - - 3.2 0.6
Net interest payable in respect of loan instruments (134.0) (137.8) (128.6) (17.6) (93.3)
Other finance (costs)/income (2.3) (2.4) (3.4) 7.5 0.8
Surplus for the year before tax 59.1 52.8 48.8 42.3 54.6
Surplus for the year before tax and net gains on business combinations
59.1 52.8 48.3 42.3 28.8
Statement of Financial Position
Non-current assets 3,486.1 3,434.6 3,393.2 3,122.6 2,884.9
Current assets 283.9 434.0 260.0 230.3 212.8
3,770.0 3,868.6 3,653.2 3,352.9 3,097.7
Current liabilities 278.2 271.4 271.1 198.8 182.7
Loans and borrowings and other payables 2,500.8 2,647.0 2,482.8 2,326.1 2,122.5
Provisions, pensions and derivatives 138.4 80.0 96.9 69.4 79.8
Reserves 852.6 870.2 802.4 758.6 712.7
3,770.0 3,868.6 3,653.2 3,352.9 3,097.7
Statement of Cash Flows
Cash generated from operating activities 221.4 207.4 248.8 205.0 182.0
Financing and returns on investments (143.8) (133.4) (133.0) (122.5) (90.3)
Investing - capital expenditure and investment (253.2) (213.3) (422.4) (341.4) (270.1)
Investing - capital grants and sales proceeds 136.2 131.2 94.5 98.5 87.1
Cash and debt on acquisitions - - - (3.6) 13.8
Net cash flow from financing activities (128.3) 180.0 223.9 181.2 195.6
(167.7) 171.9 11.8 17.2 118.1
Cash and cash equivalents at start of year 344.7 172.8 161.0 143.8 25.7
Cash and cash equivalents at end of year 177.0 344.7 172.8 161.0 143.8
Strategic report Financial statem
ents
17
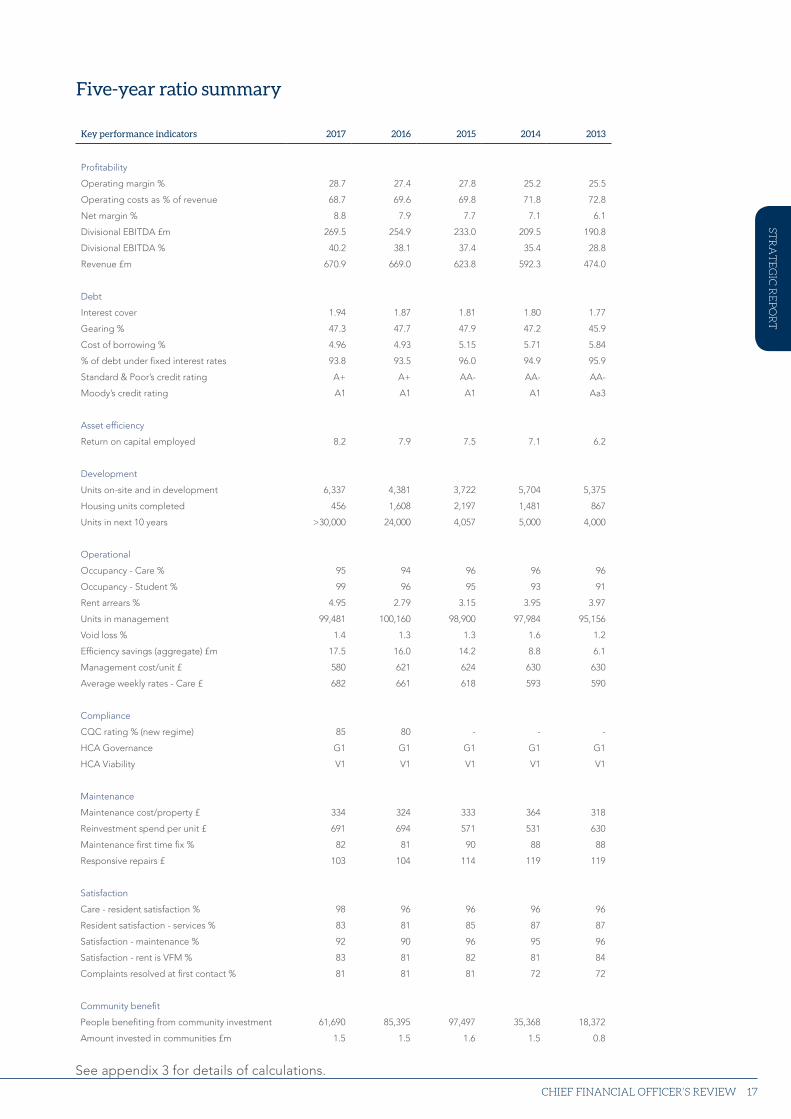
Five-year ratio summary
CHIEF FINANCIAL OFFICER’S REVIEW
Key performance indicators 2017 2016 2015 2014 2013
Profitability
Operating margin % 28.7 27.4 27.8 25.2 25.5
Operating costs as % of revenue 68.7 69.6 69.8 71.8 72.8
Net margin % 8.8 7.9 7.7 7.1 6.1
Divisional EBITDA £m 269.5 254.9 233.0 209.5 190.8
Divisional EBITDA % 40.2 38.1 37.4 35.4 28.8
Revenue £m 670.9 669.0 623.8 592.3 474.0
Debt
Interest cover 1.94 1.87 1.81 1.80 1.77
Gearing % 47.3 47.7 47.9 47.2 45.9
Cost of borrowing % 4.96 4.93 5.15 5.71 5.84
% of debt under fixed interest rates 93.8 93.5 96.0 94.9 95.9
Standard & Poor’s credit rating A+ A+ AA- AA- AA-
Moody’s credit rating A1 A1 A1 A1 Aa3
Asset efficiency
Return on capital employed 8.2 7.9 7.5 7.1 6.2
Development
Units on-site and in development 6,337 4,381 3,722 5,704 5,375
Housing units completed 456 1,608 2,197 1,481 867
Units in next 10 years >30,000 24,000 4,057 5,000 4,000
Operational
Occupancy - Care % 95 94 96 96 96
Occupancy - Student % 99 96 95 93 91
Rent arrears % 4.95 2.79 3.15 3.95 3.97
Units in management 99,481 100,160 98,900 97,984 95,156
Void loss % 1.4 1.3 1.3 1.6 1.2
Efficiency savings (aggregate) £m 17.5 16.0 14.2 8.8 6.1
Management cost/unit £ 580 621 624 630 630
Average weekly rates - Care £ 682 661 618 593 590
Compliance
CQC rating % (new regime) 85 80 - - -
HCA Governance G1 G1 G1 G1 G1
HCA Viability V1 V1 V1 V1 V1
Maintenance
Maintenance cost/property £ 334 324 333 364 318
Reinvestment spend per unit £ 691 694 571 531 630
Maintenance first time fix % 82 81 90 88 88
Responsive repairs £ 103 104 114 119 119
Satisfaction
Care - resident satisfaction % 98 96 96 96 96
Resident satisfaction - services % 83 81 85 87 87
Satisfaction - maintenance % 92 90 96 95 96
Satisfaction - rent is VFM % 83 81 82 81 84
Complaints resolved at first contact % 81 81 81 72 72
Community benefit
People benefiting from community investment 61,690 85,395 97,497 35,368 18,372
Amount invested in communities £m 1.5 1.5 1.6 1.5 0.8
STR
AT
EG
IC R
EP
OR
T
See appendix 3 for details of calculations.
ANNUAL REPORT AND FINANCIAL STATEMENTS 2016/201718
Operational growth and efficiency
Group revenue was £670.9 million for the year, of which £646.8 million was attributable to operations and £24.1 million was attributable to property sales. Realising efficiency gains from our enterprise-wide SAP system, OneSanctuary, and increasing numbers of self-funders in our care operation have reduced the impact of changes in the housing and care sectors.
Operating surplus before other gains and losses has increased by £8.9 million to £192.4 million, an operating margin of 28.7%. EBITDA has increased by £14.6 million to £269.5 million.
Investment in our assets
Growth in housing properties includes: construction costs of £139.0 million; reinvestment spend on components of £68.7 million and planned maintenance of £22.5 million. Grant funding of £48.1 million has been received in the year for the development of new homes.
Cash collection and generation
The cash position of the Group is strong, with sufficient cash in hand and facilities to fund operations and capital expenditure throughout the next financial year and beyond.
The Group generated £221.4 million of cash from operating activities, an increase of £14.0 million on the prior year. At 31 March 2017, the Group had a cash balance of £177.0 million and had £176.0 million of undrawn facilities available.
Debt repayment profile and cost of capital
Net interest payable in respect of loan instruments has fallen by £3.8 million to £134.0 million as a result of restructuring the financing of one of the student properties and the repayment of certain loan facilities. Overall, the Group cost of borrowing for the year has increased to 4.96% from 4.93%, while interest cover has increased from 1.87 to 1.94. The Group has reduced its exposure to volatility of inherited financial derivatives by redeeming a forward starting derivative during the year. The weighted average duration of drawn debt across the Group is 20.3 years. Our funding strategy is designed to ensure refinancing requirements are manageable and planned.
The Group has a refinancing risk of 10.93% (£282.7 million) of existing drawn loans in the next five years. The Group is confident it can both refinance existing loans and finance the current business plan commitments. The Group anticipates funding this through a mix of fixed and variable interest rate facilities, cash generated from property sales, operating activities and Government grant.
During the year the Group has agreed £75 million of revolving credit facilities. This form of funding has been put in place to reflect the expected cash flows from our development and sales programme; ensuring flexible funding at cost-effective rates.
Capital finance and treasury
At 31 March 2017 the Group had total borrowings of £2,585.7 million, analysed as follows:
2017 £m 2016 £m
Bank loans and mortgages 1,153.7 1,273.8Senior secured notes and debenture stock 1,285.2 1,282.3Finance leases 146.8 150.4
2,585.7 2,706.5
Strategic report Financial statem
ents
19
Working capital and liquidity management
The Group’s treasury function manages liquidity by preparing cash forecasts on daily, weekly, monthly and longer-term bases to ensure that short and longer-term requirements are known. The forecasts are cautious and are constantly updated, including sensitivity analysis. Drawdowns are managed to ensure funding is available as required while debt finance costs are minimised.
Interest rates
The Group operates an interest rate policy designed to minimise interest cost and reduce volatility in cash flow and debt service costs. Our borrowings at the year end comprise 93.8% fixed rate debt (2016: 93.5%) and 6.2% floating rate debt (2016: 6.5%).
Within the loan portfolio is one interest rate swap arrangement, which swaps a variable interest rate to a fixed rate. At the reporting date, the derivative financial instruments recognised for this project finance funding arrangement amounted to a £4.4 million liability. There is no requirement to collateralise this derivative.
Foreign currency management
At 31 March 2017 the Group had borrowings in US dollars totalling $100 million and had utilised derivative financial instruments to hedge against currency rate volatility. Following the year end, $20 million of this debt has been repaid in line with the repayment schedule.
Covenant compliance
The Group monitors all covenants on a continual basis and these are reported to Group Board, Group Audit and Risk Committee and subsidiary boards as appropriate. Key covenants are interest cover, gearing ratios and asset cover. All covenants on existing Group finance arrangements have been met during the financial year and post-year end.
Building homes and partnerships
The Group plans to deliver over 30,000 new homes by 2027. To accomplish this, we have expanded our in-house construction team and have entered into two further joint ventures with Galliford Try plc, one of the UK’s largest developers, bringing the total number of joint ventures to three, in addition to working with a specialist development company in the care home sector to develop new care homes.
CHIEF FINANCIAL OFFICER’S REVIEW
STR
AT
EG
IC R
EP
OR
T
Debt maturity profile
500,000
450,000
400,000
350,000
300,000
250,000
200,000
150,000
100,000
50,000
0
2018-2022 2023-2027 2028-2032 2033-2037 2038-2042 2043-2047 2048-2052
£’000
Bank finance Bond finance
20 ANNUAL REPORT AND FINANCIAL STATEMENTS 2016/2017
Divisional EBITDA
For the Business Review on pages 22 to 31, Divisional EBITDA is defined as segment surplus with office and equipment depreciation and software amortisation costs removed. Other gains and losses have not been attributed across divisions. Prior year figures have been restated to reflect the Group’s revised operating segments. The Group now has a separate supported living segment comprising home care and supported services.
Accommodation in management
The Group has a range of property types and tenancies across the UK: general rented homes for people who need affordable accommodation; low-cost home ownership schemes for people making their first move into owner occupation; sheltered housing for rent and for purchase; residential care homes and nursing homes for people who need nursing support; as well as student and key worker accommodation.
Group Association
2017 2016 2017 2016
Social housing accommodation:General needs housing 52,310 52,593 46,025 43,150General needs housing affordable rent 5,259 5,081 3,100 2,940Supported housing accommodation 3,793 3,835 3,644 3,499Supported housing affordable rent 122 122 1 1Housing for older people 10,831 10,881 10,512 9,870Housing for older people affordable rent 460 460 77 77Social care homes 180 164 180 164Key worker (social lets) 515 509 515 509Shared ownership 3,619 3,601 2,735 2,614Home ownership 6,397 6,373 4,584 4,342Social housing leased outside Group tenancy agreement 162 107 162 86
83,648 83,726 71,535 67,252Non-social housing accommodation: Student and key worker (non-social lets) 11,284 11,943 7,026 7,243Registered care homes (including children’s homes) 3,869 3,858 2,373 3,336Commercial 184 181 157 139Market rented accommodation 96 96 86 86Other non-social rental accommodation - 356 - -Non-social leased housing 71 - 62 -Non-social housing leased outside Groupagreement 329 - 329 -
15,832 16,434 10,033 10,804
Total units in management 99,481 100,160 81,568 78,056
At 31 March 2017 the Group had 920 (2016: 632) development units on-site. 1,630 owned units are managed by third parties (2016: 1,630).
Strategic report Financial statem
ents
21CHIEF FINANCIAL OFFICER’S REVIEW 21
STR
AT
EG
IC R
EP
OR
T
ANNUAL REPORT AND FINANCIAL STATEMENTS 2016/201722
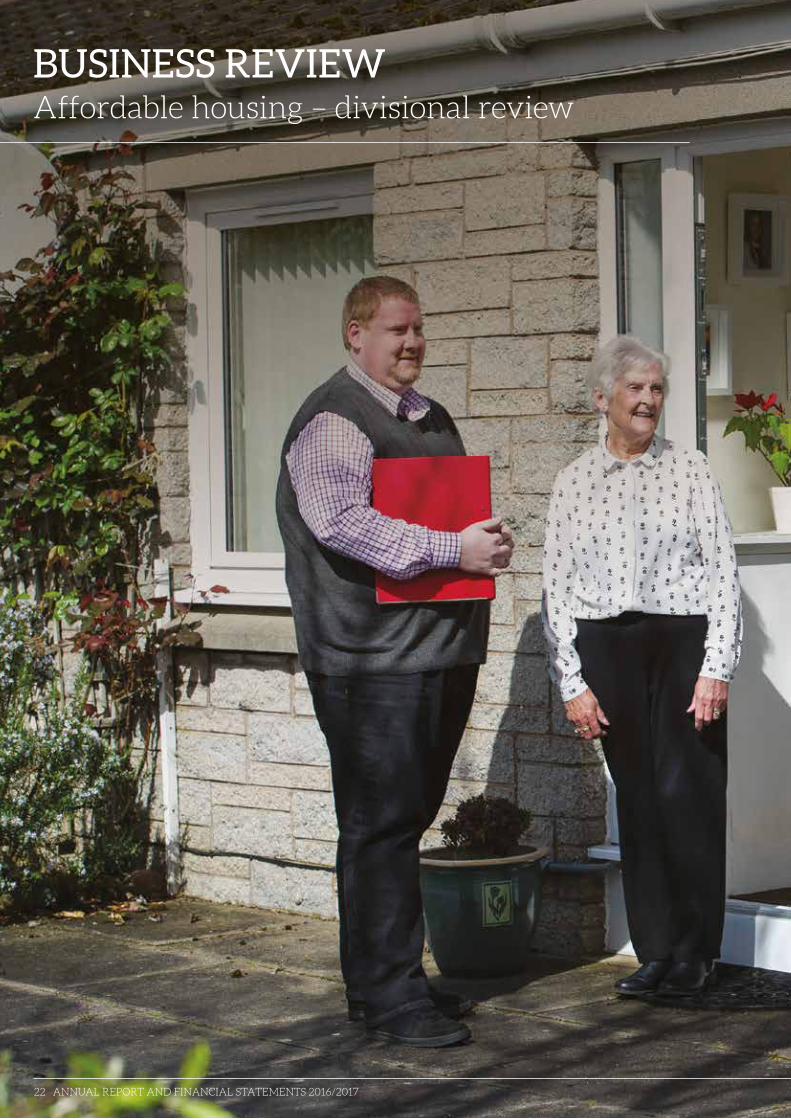
BUSINESS REVIEW Affordable housing – divisional review
ANNUAL REPORT AND FINANCIAL STATEMENTS 2016/201722
Strategic report Financial statem
ents
23
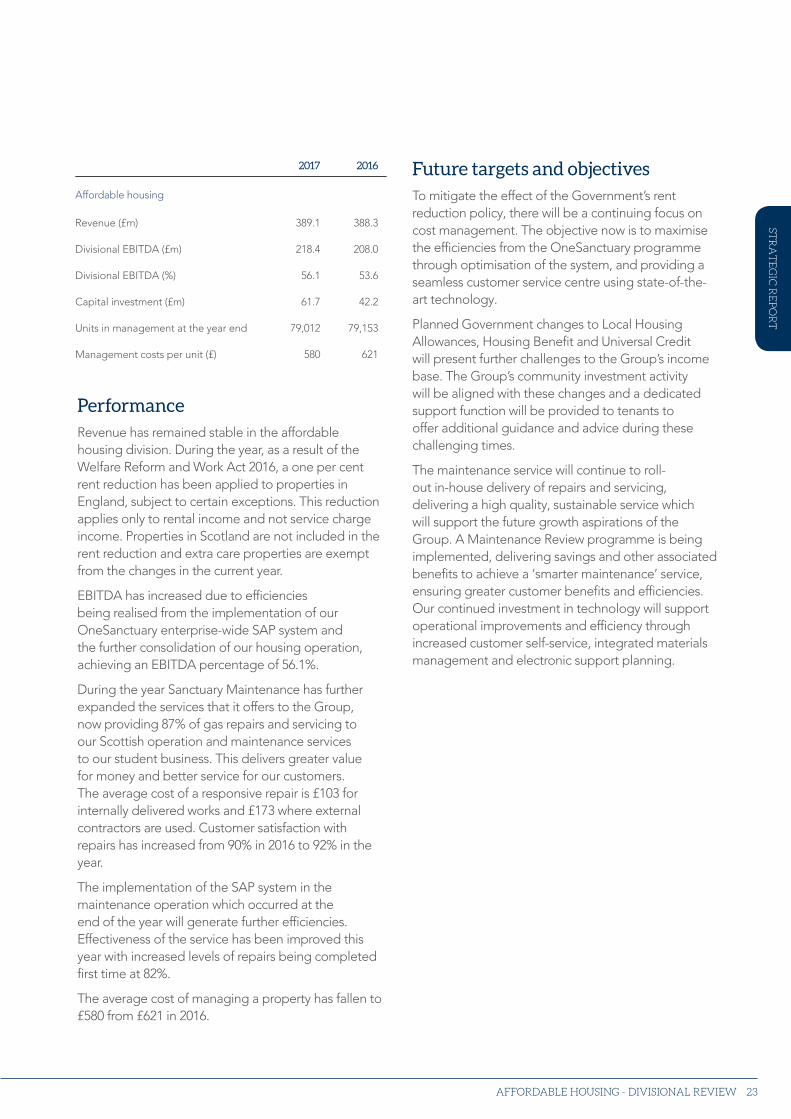
Performance Revenue has remained stable in the affordable housing division. During the year, as a result of the Welfare Reform and Work Act 2016, a one per cent rent reduction has been applied to properties in England, subject to certain exceptions. This reduction applies only to rental income and not service charge income. Properties in Scotland are not included in the rent reduction and extra care properties are exempt from the changes in the current year.
EBITDA has increased due to efficiencies being realised from the implementation of our OneSanctuary enterprise-wide SAP system and the further consolidation of our housing operation, achieving an EBITDA percentage of 56.1%.
During the year Sanctuary Maintenance has further expanded the services that it offers to the Group, now providing 87% of gas repairs and servicing to our Scottish operation and maintenance services to our student business. This delivers greater value for money and better service for our customers. The average cost of a responsive repair is £103 for internally delivered works and £173 where external contractors are used. Customer satisfaction with repairs has increased from 90% in 2016 to 92% in the year.
The implementation of the SAP system in the maintenance operation which occurred at the end of the year will generate further efficiencies. Effectiveness of the service has been improved this year with increased levels of repairs being completed first time at 82%.
The average cost of managing a property has fallen to £580 from £621 in 2016.
Future targets and objectivesTo mitigate the effect of the Government’s rent reduction policy, there will be a continuing focus on cost management. The objective now is to maximise the efficiencies from the OneSanctuary programme through optimisation of the system, and providing a seamless customer service centre using state-of-the-art technology.
Planned Government changes to Local Housing Allowances, Housing Benefit and Universal Credit will present further challenges to the Group’s income base. The Group’s community investment activity will be aligned with these changes and a dedicated support function will be provided to tenants to offer additional guidance and advice during these challenging times.
The maintenance service will continue to roll-out in-house delivery of repairs and servicing, delivering a high quality, sustainable service which will support the future growth aspirations of the Group. A Maintenance Review programme is being implemented, delivering savings and other associated benefits to achieve a ‘smarter maintenance’ service, ensuring greater customer benefits and efficiencies. Our continued investment in technology will support operational improvements and efficiency through increased customer self-service, integrated materials management and electronic support planning.
AFFORDABLE HOUSING - DIVISIONAL REVIEW
2017 2016
Affordable housing
Revenue (£m) 389.1 388.3
Divisional EBITDA (£m) 218.4 208.0
Divisional EBITDA (%) 56.1 53.6
Capital investment (£m) 61.7 42.2
Units in management at the year end 79,012 79,153
Management costs per unit (£) 580 621
23
STR
AT
EG
IC R
EP
OR
T
ANNUAL REPORT AND FINANCIAL STATEMENTS 2016/201724
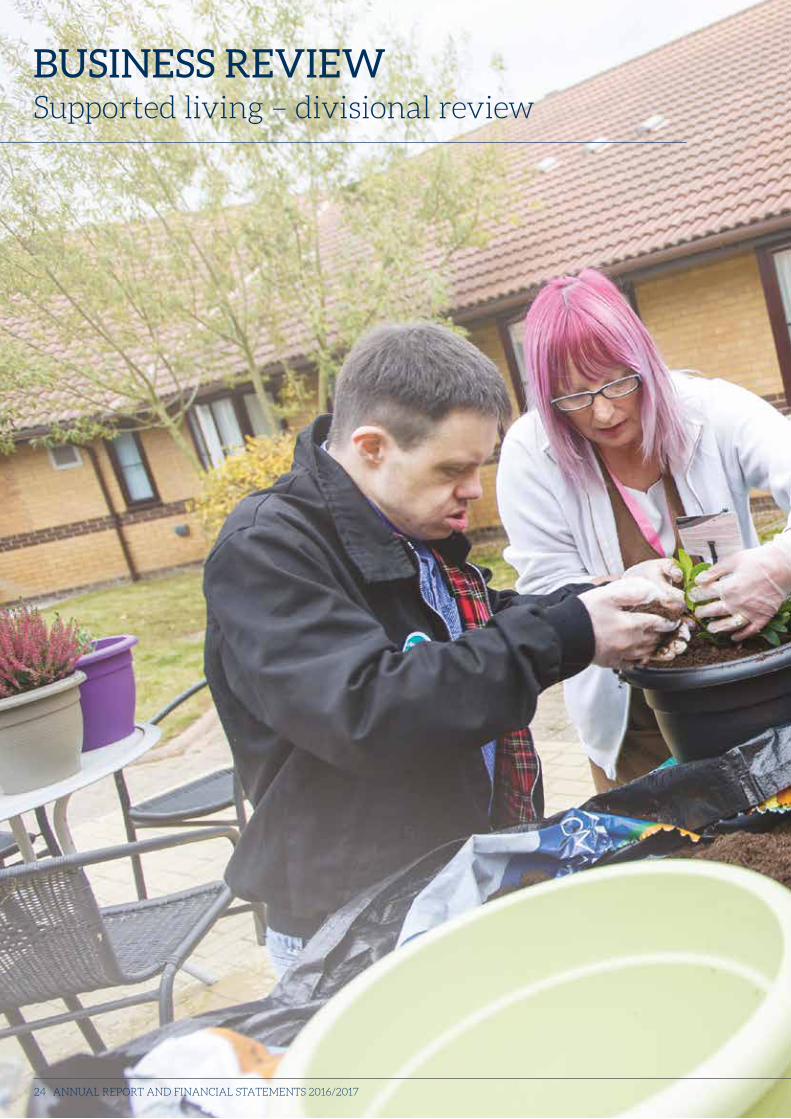
BUSINESS REVIEW Supported living – divisional review
ANNUAL REPORT AND FINANCIAL STATEMENTS 2016/201724
Strategic report Financial statem
ents
25SUPPORTED LIVING - DIVISIONAL REVIEW 25
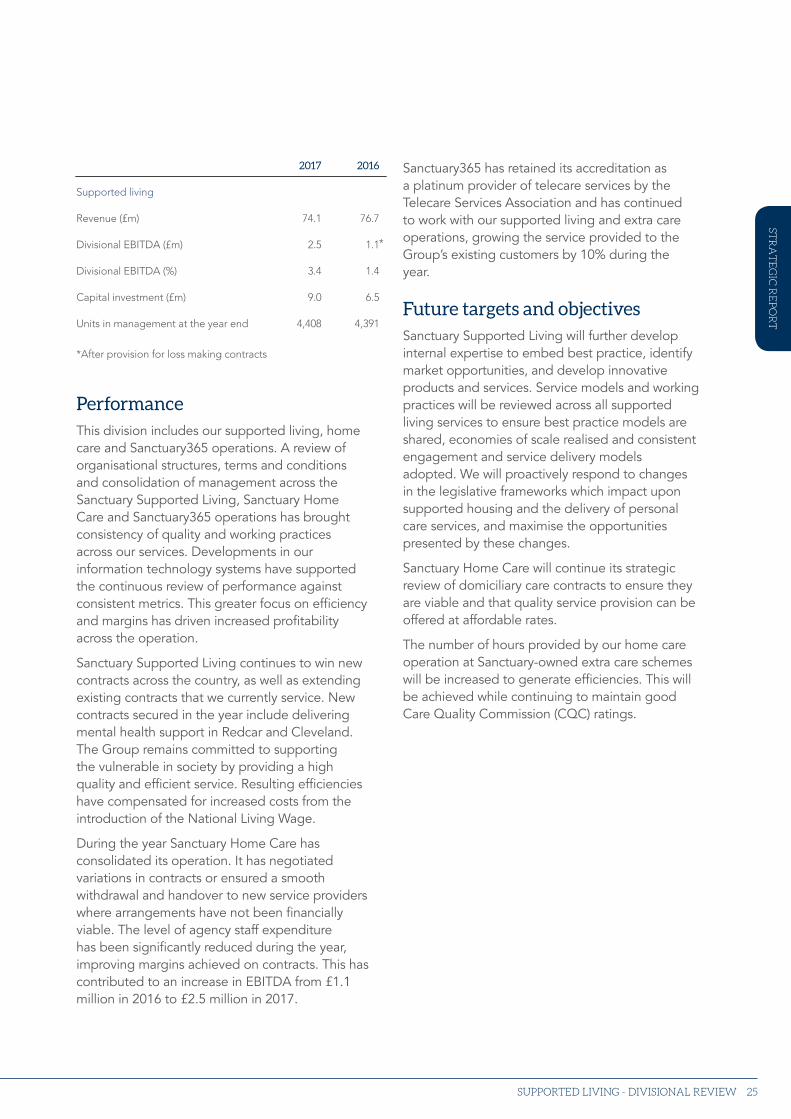
*After provision for loss making contracts
Performance This division includes our supported living, home care and Sanctuary365 operations. A review of organisational structures, terms and conditions and consolidation of management across the Sanctuary Supported Living, Sanctuary Home Care and Sanctuary365 operations has brought consistency of quality and working practices across our services. Developments in our information technology systems have supported the continuous review of performance against consistent metrics. This greater focus on efficiency and margins has driven increased profitability across the operation.
Sanctuary Supported Living continues to win new contracts across the country, as well as extending existing contracts that we currently service. New contracts secured in the year include delivering mental health support in Redcar and Cleveland. The Group remains committed to supporting the vulnerable in society by providing a high quality and efficient service. Resulting efficiencies have compensated for increased costs from the introduction of the National Living Wage.
During the year Sanctuary Home Care has consolidated its operation. It has negotiated variations in contracts or ensured a smooth withdrawal and handover to new service providers where arrangements have not been financially viable. The level of agency staff expenditure has been significantly reduced during the year, improving margins achieved on contracts. This has contributed to an increase in EBITDA from £1.1 million in 2016 to £2.5 million in 2017.
Sanctuary365 has retained its accreditation as a platinum provider of telecare services by the Telecare Services Association and has continued to work with our supported living and extra care operations, growing the service provided to the Group’s existing customers by 10% during the year.
Future targets and objectivesSanctuary Supported Living will further develop internal expertise to embed best practice, identify market opportunities, and develop innovative products and services. Service models and working practices will be reviewed across all supported living services to ensure best practice models are shared, economies of scale realised and consistent engagement and service delivery models adopted. We will proactively respond to changes in the legislative frameworks which impact upon supported housing and the delivery of personal care services, and maximise the opportunities presented by these changes.
Sanctuary Home Care will continue its strategic review of domiciliary care contracts to ensure they are viable and that quality service provision can be offered at affordable rates.
The number of hours provided by our home care operation at Sanctuary-owned extra care schemes will be increased to generate efficiencies. This will be achieved while continuing to maintain good Care Quality Commission (CQC) ratings.
2017 2016
Supported living
Revenue (£m) 74.1 76.7
Divisional EBITDA (£m) 2.5 1.1
Divisional EBITDA (%) 3.4 1.4
Capital investment (£m) 9.0 6.5
Units in management at the year end 4,408 4,391
STR
AT
EG
IC R
EP
OR
T

ANNUAL REPORT AND FINANCIAL STATEMENTS 2016/201726
BUSINESS REVIEW Care – divisional review
ANNUAL REPORT AND FINANCIAL STATEMENTS 2016/201726
Strategic report Financial statem
ents
27CARE - DIVISIONAL REVIEW 27
Performance Revenue has grown strongly in Sanctuary Care. Average weekly fee rates increased from £661 in 2016 to £682 in 2017. This has been driven by growth in local authority and self-funder rates. The proportion of self-funding residents in our homes has increased by 4% to 46% during the year. Occupancy was 95% in the year, which is above sector averages, while resident satisfaction remains high at 98%. Growth in bed spaces in management represents the opening of two new care homes in Warwickshire and Westminster.
Strong financial performance has been delivered while improving the quality of our care. The CQC inspections in our care homes have demonstrated improvement from 80% to a sector-leading 85% in the year, compared to a sector average of 75%.
EBITDA has increased for the existing business despite increasing staff costs and has been achieved through higher fee rates and focusing on cost efficiencies. Agency costs have been static in the existing business during the year. Strategies to reduce costs include investment in staff training and the creation of a centralised recruitment team to increase the number of new starters and reduce the time taken to recruit.
New homes, including the provision of care services to Westminster Council through six homes, have been operating well during the year. Lower EBITDA on the new homes is due to the phasing of admissions and the delayed handover of the now operational Butterworth Hospital, which is Sanctuary Care’s first CQC hospital registration.
Future targets and objectivesSanctuary Care has continued to develop its working practices and governance to ensure homes meet the CQC standards. Internal quality assurance monitoring has been adapted so it accurately reflects the CQC inspection and we are committed to working with the CQC to maintain the delivery of high quality care.
Sanctuary Care continues its focus on being the employer of choice in terms of recruitment and staff retention. Minimising the use of agency staff will continue to be a priority in the next year and the centralised recruitment team will continue to focus on this, alongside a strategy to increase the use of bank staff.
Sanctuary Care is developing an electronic care planning solution to accurately and securely record resident data in a timely manner, releasing staff to spend more time with residents.
2017 2016
Care existing business
Revenue (£m) 106.0 99.8
Divisional EBITDA (£m) 18.7 17.0
Divisional EBITDA (%) 17.6 17.0
Care new openings
Revenue (£m) 19.8 8.9
Divisional EBITDA (£m) 0.5 -
Divisional EBITDA (%) 2.5 -
Capital investment (£m) 9.0 21.0
Number of bed spaces in management 3,555 3,549
STR
AT
EG
IC R
EP
OR
T

ANNUAL REPORT AND FINANCIAL STATEMENTS 2016/201728
BUSINESS REVIEW Student and market rented – divisional review
ANNUAL REPORT AND FINANCIAL STATEMENTS 2016/201728
Strategic report Financial statem
ents
29STUDENT AND MARKET RENTED - DIVISIONAL REVIEW 29
Performance Our range of commercial services include working with universities and NHS trusts to provide accommodation and facilities management services for students and key workers, and managing a portfolio of direct-let student accommodation, as well as operating a diverse portfolio of commercial and market rent properties. We have continued to transform our buildings, our services and our operating platforms as part of our on-going commitment to being a market leader in the provision of high quality housing and student accommodation.
EBITDA margin percentage has grown to 49.9% from 49.1% in 2016 due to careful cost control and improved occupancy, which has increased to 99% across our student portfolio.
Revenue has reduced by £7.2 million in the year and is attributable to a change in structure of a long-term arrangement with a university partner, combined with the disposal of one of our student properties.
We have also invested in our online service and website functionality to deliver improved search, booking and self-service functions for our customers. These changes have enhanced the visibility and awareness of our accommodation and services. Our site-based teams deliver on-site welcome events and activities, which have increased our tenant retention and satisfaction.
Future targets and objectivesThe roll-out of the enterprise-wide SAP system, OneSanctuary, has also created efficiencies in the areas of tenancy management, maintenance and human resources. We will continue working to deliver operational efficiencies and improve customer experience through advancements in technology, leveraging OneSanctuary to improve business information and control.
Under-utilised assets will be optimised to generate value, focusing on opportunities to convert schemes and increase summer business. Maintenance which was previously performed by external contractors is now provided by the Group’s maintenance service, ensuring value for money for our customers.
2017 2016
Student and market rented
Revenue (£m) 56.5 63.7
Divisional EBITDA (£m) 28.2 31.3
Divisional EBITDA (%) 49.9 49.1
Capital investment (£m) 11.7 9.6
Units in management at year end 12,435 13,067
STR
AT
EG
IC R
EP
OR
T
ANNUAL REPORT AND FINANCIAL STATEMENTS 2016/201730
BUSINESS REVIEW Development – divisional review
ANNUAL REPORT AND FINANCIAL STATEMENTS 2016/201730
Strategic report Financial statem
ents
31DEVELOPMENT - DIVISIONAL REVIEW 31
Performance During the year the development team has been dedicated to the growth and continued delivery of affordable home ownership properties. The focus has been on the establishment of an internal structure and framework which will ultimately support the delivery of over 30,000 homes by 2027. This includes entering into joint ventures and working with our consortium members as well as identifying opportunities to deliver more affordable home ownership products.
The Group continues to progress the 2015–2018 Affordable Homes Programme in England and the Scottish Affordable Housing Programme. We have completed 456 units during the year and were on-site and in development with 6,337 units at the year end.
During the year the Group bid for and won almost £90 million of funding from the Homes and Communities Agency to build 2,265 homes under the 2016–2021 Affordable Homes Programme, taking the largest share of the £1.3 billion allocation. Two new joint ventures have been negotiated with one of the UK’s largest house building and construction groups, Galliford Try plc, bringing the total joint ventures to three, in order to develop over 600 properties, including a significant element of affordable housing.
Future targets and objectivesOur newly expanded in-house construction function will give Sanctuary the flexibility to deliver new developments, allowing build programmes to flex with market conditions, while enabling more cost-effective construction through the removal of external management costs and profit.
Development will work with local communities and provide in-depth market analysis to identify customer requirements, and ensure new schemes meet the local needs and provide the strong financial returns required.
As well as outright sale, our development programme will provide affordable homeownership, through the Help to Buy and shared equity products. The sales programme will continue on our flagship private extra care scheme in Cheltenham. Shared ownership properties will be sold through our new brand Sanctuary Homes, while the homes for outright sale will be sold through the Beech Grove Homes brand. New websites will be implemented for each of the brands, enabling innovative digital marketing.
Total intended development capital spend has increased in the year from £4,320.9 million in 2016 to £4,489.8 million in 2017.
2017 2016
Revenue (£m) 24.1 28.2
Operating costs (£m) (17.5) (19.7)
Divisional EBITDA (£m) 6.6 8.5
Divisional EBITDA (%) 27.4 30.1
Units completed during the year 456 1,608
First tranche sales units sold 154 264
Units under construction 6,337 4,381
Projected development units >30,000 24,000 to be delivered by 2027
Funding for development
Expenditure contracted (£m) 81.8 110.7
Authorised expenditure not 629.3 157.3 contracted (£m)
Intended development capital spend (£m) 3,778.7 4,052.9
Total (£m) 4,489.8 4,320.9
STR
AT
EG
IC R
EP
OR
T
ANNUAL REPORT AND FINANCIAL STATEMENTS 2016/201732
GROUP BOARD
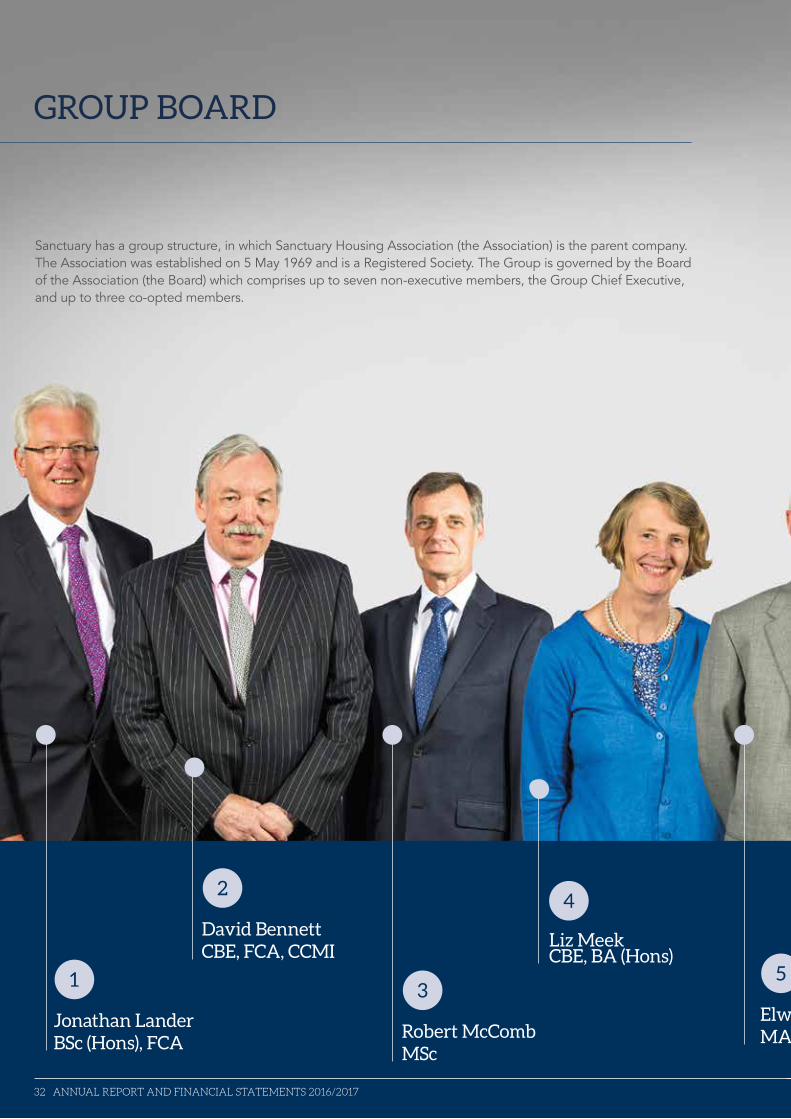
Jonathan Lander BSc (Hons), FCA
1
Robert McComb MSc
3
Liz Meek CBE, BA (Hons)
4
David Bennett CBE, FCA, CCMI
2
Sanctuary has a group structure, in which Sanctuary Housing Association (the Association) is the parent company. The Association was established on 5 May 1969 and is a Registered Society. The Group is governed by the Board of the Association (the Board) which comprises up to seven non-executive members, the Group Chief Executive, and up to three co-opted members.
ANNUAL REPORT AND FINANCIAL STATEMENTS 2016/201732
Elwyn Roberts MA, FCA
5
Strategic report Financial statem
ents
33
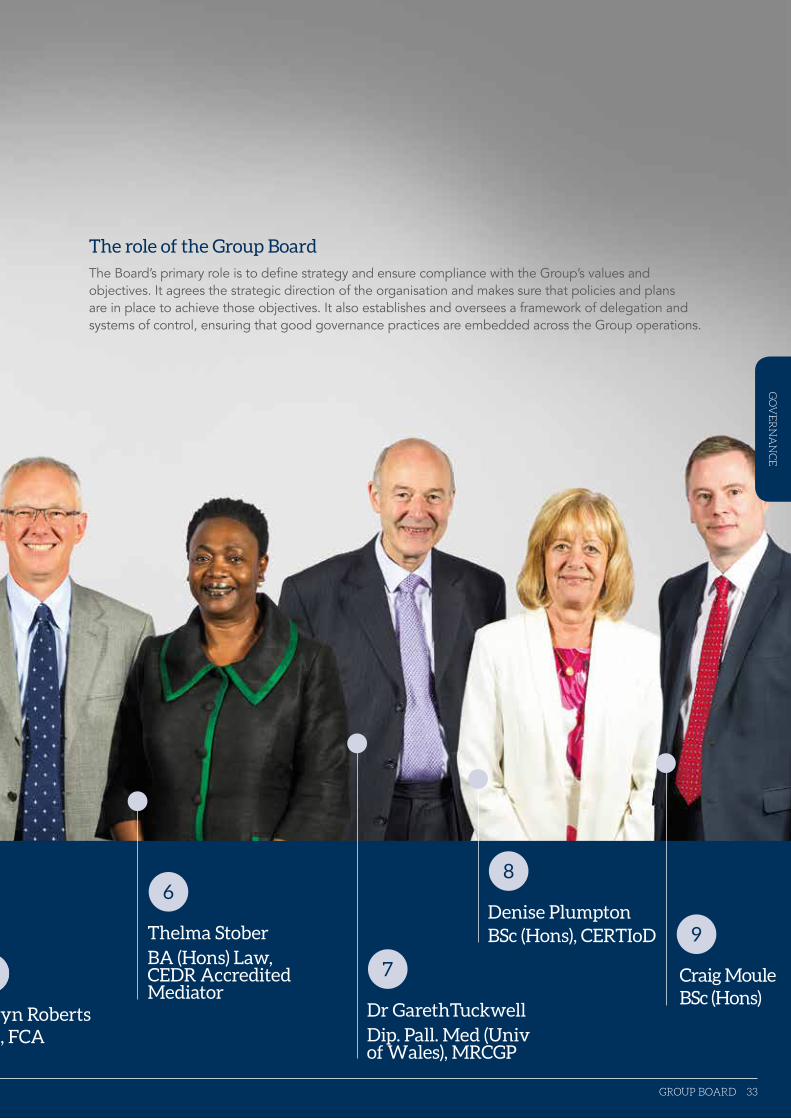
The role of the Group BoardThe Board’s primary role is to define strategy and ensure compliance with the Group’s values and objectives. It agrees the strategic direction of the organisation and makes sure that policies and plans are in place to achieve those objectives. It also establishes and oversees a framework of delegation and systems of control, ensuring that good governance practices are embedded across the Group operations.
Craig Moule BSc (Hons)
9
Dr GarethTuckwell Dip. Pall. Med (Univ of Wales), MRCGP
7
Thelma Stober BA (Hons) Law, CEDR Accredited Mediator
6Denise Plumpton BSc (Hons), CERTIoD
8
Elwyn Roberts MA, FCA
5
GROUP BOARD 33
GO
VE
RN
AN
CE
5
34 ANNUAL REPORT AND FINANCIAL STATEMENTS 2016/2017
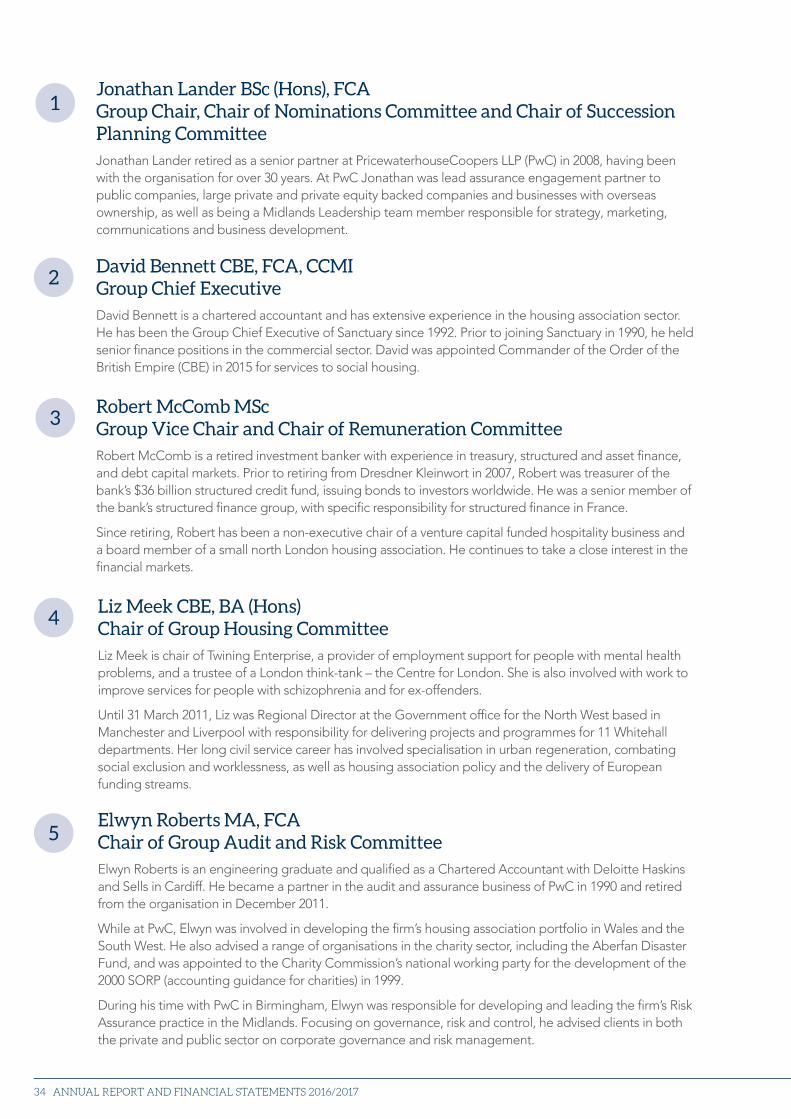
Jonathan Lander BSc (Hons), FCA Group Chair, Chair of Nominations Committee and Chair of Succession Planning CommitteeJonathan Lander retired as a senior partner at PricewaterhouseCoopers LLP (PwC) in 2008, having been with the organisation for over 30 years. At PwC Jonathan was lead assurance engagement partner to public companies, large private and private equity backed companies and businesses with overseas ownership, as well as being a Midlands Leadership team member responsible for strategy, marketing, communications and business development.
1
David Bennett CBE, FCA, CCMI Group Chief ExecutiveDavid Bennett is a chartered accountant and has extensive experience in the housing association sector. He has been the Group Chief Executive of Sanctuary since 1992. Prior to joining Sanctuary in 1990, he held senior finance positions in the commercial sector. David was appointed Commander of the Order of the British Empire (CBE) in 2015 for services to social housing.
2
Robert McComb MSc Group Vice Chair and Chair of Remuneration CommitteeRobert McComb is a retired investment banker with experience in treasury, structured and asset finance, and debt capital markets. Prior to retiring from Dresdner Kleinwort in 2007, Robert was treasurer of the bank’s $36 billion structured credit fund, issuing bonds to investors worldwide. He was a senior member of the bank’s structured finance group, with specific responsibility for structured finance in France.
Since retiring, Robert has been a non-executive chair of a venture capital funded hospitality business and a board member of a small north London housing association. He continues to take a close interest in the financial markets.
3
Liz Meek CBE, BA (Hons) Chair of Group Housing Committee Liz Meek is chair of Twining Enterprise, a provider of employment support for people with mental health problems, and a trustee of a London think-tank – the Centre for London. She is also involved with work to improve services for people with schizophrenia and for ex-offenders.
Until 31 March 2011, Liz was Regional Director at the Government office for the North West based in Manchester and Liverpool with responsibility for delivering projects and programmes for 11 Whitehall departments. Her long civil service career has involved specialisation in urban regeneration, combating social exclusion and worklessness, as well as housing association policy and the delivery of European funding streams.
4
Elwyn Roberts MA, FCA Chair of Group Audit and Risk Committee Elwyn Roberts is an engineering graduate and qualified as a Chartered Accountant with Deloitte Haskins and Sells in Cardiff. He became a partner in the audit and assurance business of PwC in 1990 and retired from the organisation in December 2011.
While at PwC, Elwyn was involved in developing the firm’s housing association portfolio in Wales and the South West. He also advised a range of organisations in the charity sector, including the Aberfan Disaster Fund, and was appointed to the Charity Commission’s national working party for the development of the 2000 SORP (accounting guidance for charities) in 1999.
During his time with PwC in Birmingham, Elwyn was responsible for developing and leading the firm’s Risk Assurance practice in the Midlands. Focusing on governance, risk and control, he advised clients in both the private and public sector on corporate governance and risk management.
5
Strategic report Financial statem
ents
35GROUP BOARD
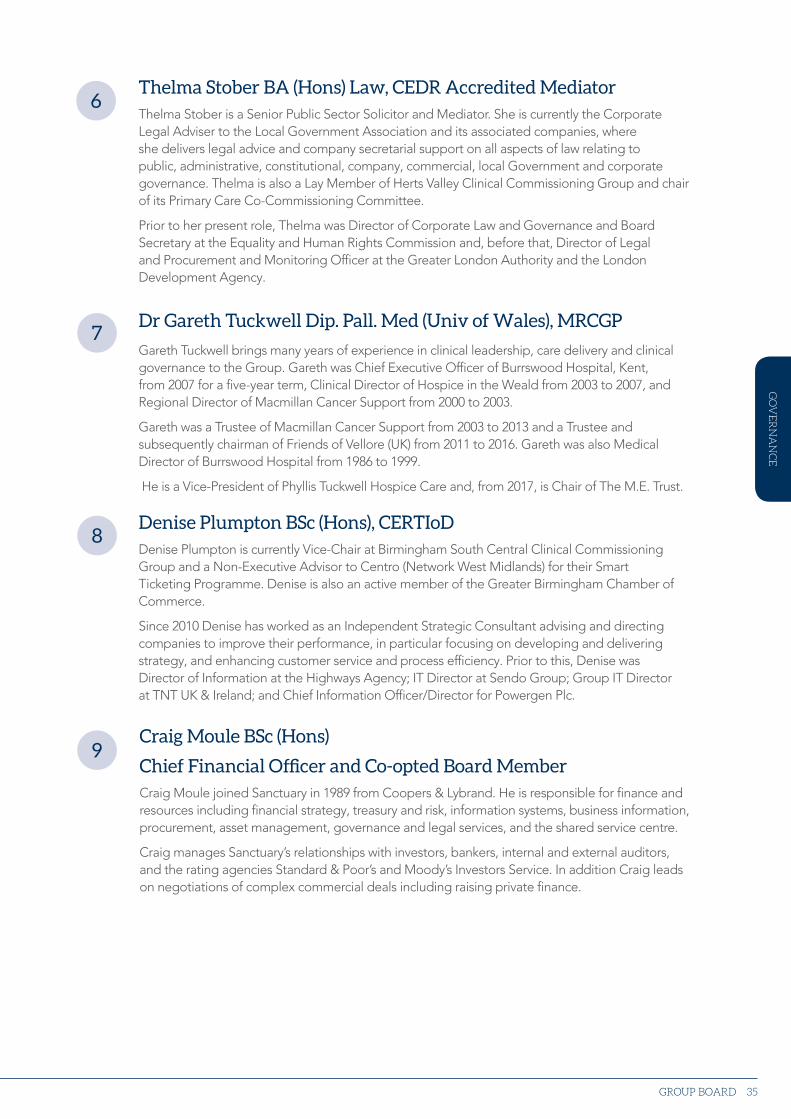
Thelma Stober BA (Hons) Law, CEDR Accredited Mediator Thelma Stober is a Senior Public Sector Solicitor and Mediator. She is currently the Corporate Legal Adviser to the Local Government Association and its associated companies, where she delivers legal advice and company secretarial support on all aspects of law relating to public, administrative, constitutional, company, commercial, local Government and corporate governance. Thelma is also a Lay Member of Herts Valley Clinical Commissioning Group and chair of its Primary Care Co-Commissioning Committee.
Prior to her present role, Thelma was Director of Corporate Law and Governance and Board Secretary at the Equality and Human Rights Commission and, before that, Director of Legal and Procurement and Monitoring Officer at the Greater London Authority and the London Development Agency.
6
Dr Gareth Tuckwell Dip. Pall. Med (Univ of Wales), MRCGP
Gareth Tuckwell brings many years of experience in clinical leadership, care delivery and clinical governance to the Group. Gareth was Chief Executive Officer of Burrswood Hospital, Kent, from 2007 for a five-year term, Clinical Director of Hospice in the Weald from 2003 to 2007, and Regional Director of Macmillan Cancer Support from 2000 to 2003.
Gareth was a Trustee of Macmillan Cancer Support from 2003 to 2013 and a Trustee and subsequently chairman of Friends of Vellore (UK) from 2011 to 2016. Gareth was also Medical Director of Burrswood Hospital from 1986 to 1999.
He is a Vice-President of Phyllis Tuckwell Hospice Care and, from 2017, is Chair of The M.E. Trust.
Denise Plumpton BSc (Hons), CERTIoDDenise Plumpton is currently Vice-Chair at Birmingham South Central Clinical Commissioning Group and a Non-Executive Advisor to Centro (Network West Midlands) for their Smart Ticketing Programme. Denise is also an active member of the Greater Birmingham Chamber of Commerce.
Since 2010 Denise has worked as an Independent Strategic Consultant advising and directing companies to improve their performance, in particular focusing on developing and delivering strategy, and enhancing customer service and process efficiency. Prior to this, Denise was Director of Information at the Highways Agency; IT Director at Sendo Group; Group IT Director at TNT UK & Ireland; and Chief Information Officer/Director for Powergen Plc.
7
GO
VE
RN
AN
CE
8
Craig Moule BSc (Hons)
Chief Financial Officer and Co-opted Board MemberCraig Moule joined Sanctuary in 1989 from Coopers & Lybrand. He is responsible for finance and resources including financial strategy, treasury and risk, information systems, business information, procurement, asset management, governance and legal services, and the shared service centre.
Craig manages Sanctuary’s relationships with investors, bankers, internal and external auditors, and the rating agencies Standard & Poor’s and Moody’s Investors Service. In addition Craig leads on negotiations of complex commercial deals including raising private finance.
9
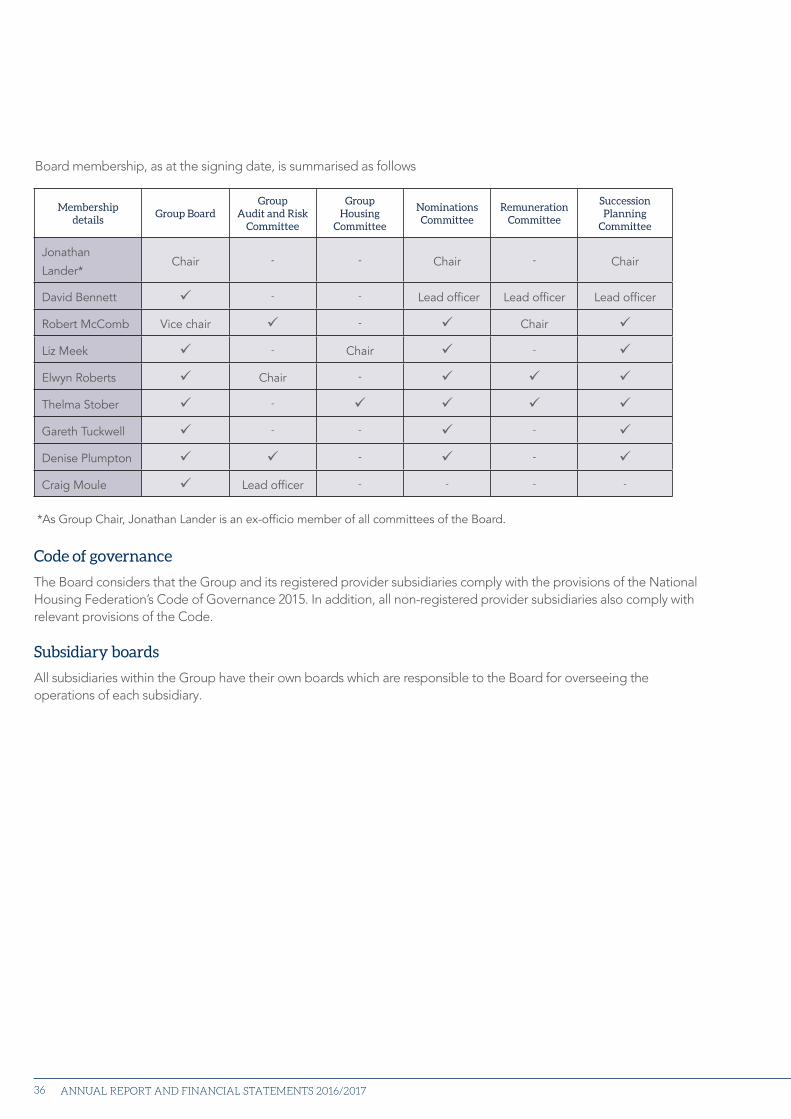
Membership details
Group BoardGroup
Audit and Risk Committee
Group Housing
Committee
Nominations Committee
Remuneration Committee
Succession Planning
Committee
Jonathan
Lander*Chair - - Chair - Chair
David Bennett - - Lead officer Lead officer Lead officer
Robert McComb Vice chair - Chair
Liz Meek - Chair -
Elwyn Roberts Chair -
Thelma Stober -
Gareth Tuckwell - - -
Denise Plumpton - -
Craig Moule Lead officer - - - -
*As Group Chair, Jonathan Lander is an ex-officio member of all committees of the Board.
Board membership, as at the signing date, is summarised as follows
Code of governance
The Board considers that the Group and its registered provider subsidiaries comply with the provisions of the National Housing Federation’s Code of Governance 2015. In addition, all non-registered provider subsidiaries also comply with relevant provisions of the Code.
Subsidiary boards
All subsidiaries within the Group have their own boards which are responsible to the Board for overseeing the operations of each subsidiary.
36 ANNUAL REPORT AND FINANCIAL STATEMENTS 2016/2017
Strategic report Financial statem
ents
37
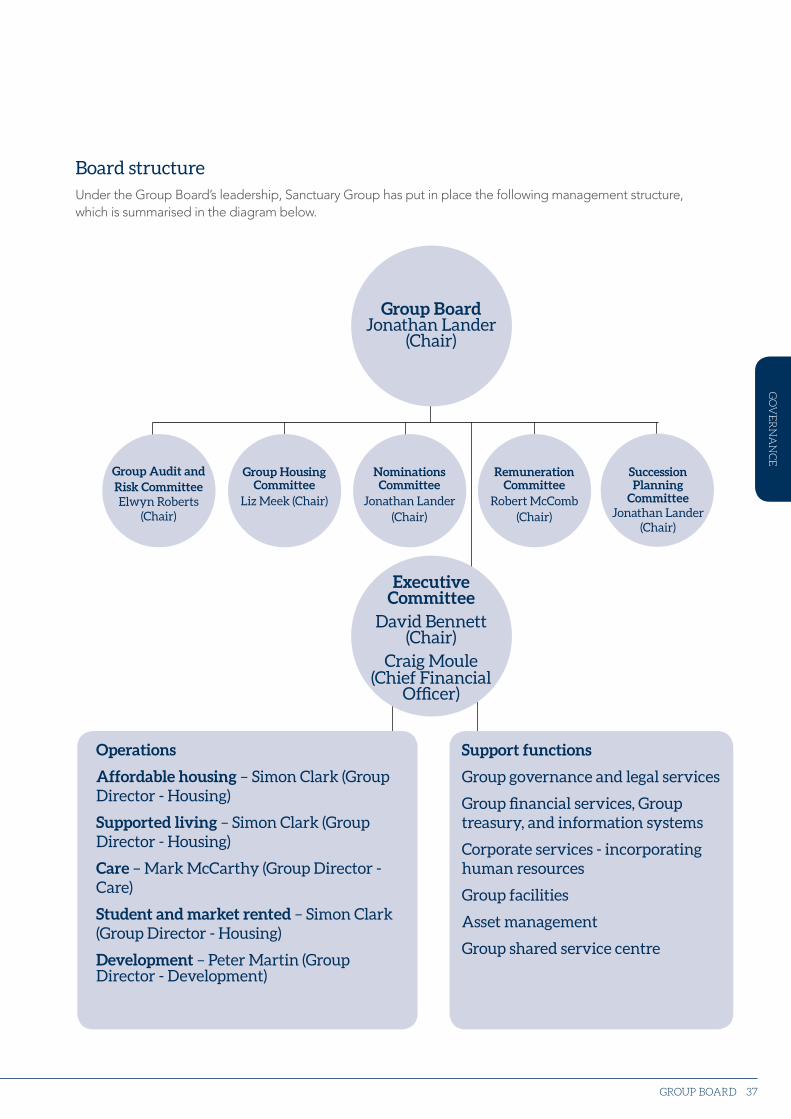
Board structureUnder the Group Board’s leadership, Sanctuary Group has put in place the following management structure, which is summarised in the diagram below.
Operations
Affordable housing – Simon Clark (Group Director - Housing)
Supported living – Simon Clark (Group Director - Housing)
Care – Mark McCarthy (Group Director - Care)
Student and market rented – Simon Clark (Group Director - Housing)
Development – Peter Martin (Group Director - Development)
Support functions
Group governance and legal services
Group financial services, Group treasury, and information systems
Corporate services - incorporating human resources
Group facilities
Asset management
Group shared service centre
Executive Committee
David Bennett (Chair)
Craig Moule (Chief Financial
Officer)
Group Housing Committee
Liz Meek (Chair)
Group Audit and Risk Committee Elwyn Roberts
(Chair)
Nominations Committee
Jonathan Lander (Chair)
Remuneration Committee
Robert McComb (Chair)
Succession Planning
Committee Jonathan Lander
(Chair)
Group Board Jonathan Lander
(Chair)
GROUP BOARD
GO
VE
RN
AN
CE
ANNUAL REPORT AND FINANCIAL STATEMENTS 2016/201738
STATUTORY, REGULATORY AND OTHER INFORMATION
Executive management
The Board delegates day-to-day management of activities to the Group Chief Executive, David Bennett, who is responsible for ensuring that the organisation has appropriate executive arrangements in place to meet Group objectives and targets, and that those arrangements reflect the complex needs of the business, including financial performance, capital investment, compliance, growth and business planning. To this end the Group has an Executive Committee, chaired by David Bennett, which considers and approves strategic matters affecting the Group (either implementation of strategy direction by the Board or determination of recommendations to the Board); and a Capital Committee, also chaired by David Bennett, which is responsible for monitoring performance and approving capital projects in furtherance of the Group Business Plan agreed by the Group Board.
Audit
KPMG provides external audit services and PwC performs internal audit services. The Group Audit and Risk Committee has approved a policy in relation to the nature of non-audit work undertaken by PwC and KPMG. Where such work is expected to be in excess of a specified amount, the Chair of the Group Audit and Risk Committee must approve the work. Below that amount, the Chief Financial Officer has authority to approve such work once he is satisfied that PwC or KPMG are the most appropriate providers. There is an annual review of the provision of, and fees for, non-audit services as part of the Group Audit and Risk Committee’s review of the services provided by PwC and KPMG.
Group financial statements
The financial statements for the Group consist of the financial results of the Association and its subsidiary undertakings, which have been consolidated in accordance with the relevant financial reporting standards.
Rent
The Group has various different types of social housing tenancies, the rents for which are set in accordance with the regulatory frameworks for social housing in England and Scotland.
Health and safety
It is the clear intention of the Group to ensure, as far as reasonably practicable, the health, safety and welfare at work of all its employees. The Group undertakes to comply, as a minimum, with the provisions of the Health and Safety at Work Act 1974 and other relevant legislation to meet the objective of achieving the highest possible standards.
Political and charitable donations
The Group made no donations to political organisations (2016: none). The Group made donations to charitable organisations of £11,800 (2016: £17,070).
Employee involvement
It is Group policy to involve all employees in matters affecting them. At a formal level this takes place through the Staff Council, where management consult with elected staff representatives. At an operational level, a team briefing system is in place to keep all employees updated on core Group business issues.
Strategic report Financial statem
ents
39
Ethical business
The Group is committed to conducting its business in an ethical and responsible manner. This involves making decisions which take into account not only economic considerations but also social and environmental impacts. It means running Group operations efficiently, investing in the communities where the Group works, providing training and employment opportunities, and ensuring that Group operations are run in an environmentally-friendly manner.
Slavery and human trafficking statement
The Group is committed to achieving greater clarity and understanding of our supply chains in order to seek out and deal with any evidence of slavery and human trafficking. The Group recognises that no supply chain can be considered entirely free from the potential for slavery or human trafficking to occur and we are endeavouring to take further steps to understand high risk areas, communicate our approach and take positive action. The Group’s full statement can be found on the Group website at https://www.sanctuary-group.co.uk.
Equality and diversity
The Group aims to be an open and inclusive organisation, where diversity is promoted and discrimination eliminated. Our single equality scheme – ‘Fairness for All’ – outlines the commitment to ensuring that our services and operations meet the needs of all customers. It ensures that equality, diversity and human rights are integrated into the way the Group plans, develops and delivers services, covering internal functions as an employer and external operations as a provider of housing, care and commercial services. The Group operates an Equality and Diversity Working Group, which ensures that the requirements set out by the scheme are embedded across the Group’s operations. The Working Group is chaired by Nathan Warren, Group Director - Commercial.
Directors’ and Officers’ liability insurance
The Group has maintained Directors’ and Officers’ liability insurance throughout the year and up to the date of approval of the financial statements.
Events after the reporting period
On 19 June 2017 the Association purchased 100 per cent of the ordinary share capital of Embrace Care Ltd (Embrace), the parent of a group of companies that own and manage 35 care homes and a supported living scheme. The acquisition enables the Group to further fulfil its charitable objectives of providing housing and care services to those who need it. The locations of Embrace’s homes, which are in Scotland and the North of England, allow the Group to expand its care offering into a wider geographical area. This transaction will be treated as a business combination under IFRS 3 and full details of the financial effects will be included in the next set of financial statements.
STATUTORY, REGULATORY AND OTHER INFORMATION
GO
VE
RN
AN
CE
ANNUAL REPORT AND FINANCIAL STATEMENTS 2016/201740
The Board is ultimately responsible for ensuring that the Group maintains a system of internal control that is appropriate to the various business environments in which it operates. Internal control systems are designed to meet the particular needs of the Group and the risks to which it is exposed. The controls by their nature can provide reasonable but not absolute assurance against material misstatement or loss.
The Board has established key procedures to provide internal control and there are clear lines of responsibility for the creation and maintenance of the procedures through the Executive Committee of the Group. These controls are designed to give reasonable assurance with respect to:
• the reliability of financial information used within the Group or for publication;
• the maintenance of proper accounting records; and
• the safeguarding of assets against unauthorised use or disposition.
Major business risks are identified through a system of continuous monitoring. The financial control framework includes the following key features:
• The Board being directly responsible for strategic risk management.
• The adoption of formal policies and procedures including documentation of key systems and rules relating to a delegation of authorities which allows the monitoring of controls and restricts the unauthorised use of the Group’s assets.
• Experienced and suitably qualified staff being responsible for important business functions. Annual appraisal procedures have been established to maintain standards of performance.
• Executives to monitor the key business risks and financial objectives allowing the Group to progress towards its financial plans set for the year and the medium-term. Regular management accounts are prepared promptly providing relevant, reliable and up-to-date financial and other information including significant variances from budgets which are investigated as necessary.
• All significant new initiatives, major commitments and investment projects are subject to formal authorisation procedures.
• The Group Audit and Risk Committee reviews reports from management, PwC (internal auditors) and KPMG (external auditors) to provide reasonable assurance that control procedures are in place and are being followed. The Group Audit and Risk Committee receives an annual report on internal controls from the Executive Directors. The Group Audit and Risk Committee makes regular reports to the Board. The Group follows formal procedures for instituting appropriate action to correct weaknesses identified in the above reporting.
During the year the Group migrated its housing, assets and maintenance systems to SAP, the Group’s new information technology system, known internally as OneSanctuary. The Group Board and Group Audit and Risk Committee are satisfied that since the transfers the system of internal control is appropriate to the various business environments in which it operates.
On behalf of the Board, the Group Audit and Risk Committee has reviewed the effectiveness of the systems of internal control in existence in the Group for the year ended 31 March 2017 and is not aware of any material changes at the date of signing the financial statements.
INTERNAL CONTROLS
Strategic report Financial statem
ents
41
Arrangements for managing the risk of fraud
The Group has robust arrangements in place for managing the risks of fraud. These include:
• prevention – the Group seeks to generate a strong anti-fraud culture supported by appropriate controls over operational and employment systems.
• detection – the Group has implemented comprehensive systems and procedures to detect evidence of fraud and to facilitate and encourage the reporting of fraud.
• investigation – the Group follows a comprehensive Group policy on fraud investigation and reporting.
• insurance – the Group has appropriate insurance cover in place to mitigate the potential financial losses associated with fraud.
Going concern
The Board has a reasonable expectation that the Group has adequate resources to continue in operational existence for a period of at least 12 months. Accordingly, it continues to adopt the going concern basis in preparing the Group and Association’s financial statements.
INTERNAL CONTROLS
GO
VE
RN
AN
CE
ANNUAL REPORT AND FINANCIAL STATEMENTS 2016/201742
VIABILITY STATEMENT
During the year the Board has assessed the viability of the Group over a four-year period. This assessment has been made through the business planning process which takes account of both the Group’s current position and its principal risks, which are detailed on pages 43 to 45.
The Board has determined that a four-year period is an appropriate period over which to provide its viability statement. While the Board believes that the Group will be viable over a much longer period, as demonstrated by the thirty-year forecast that is performed annually, a four-year period has been chosen as it has a much greater degree of certainty and provides an appropriate longer-term outlook.
The business planning process includes the Group’s most recent budgets, operational plans and a review of external factors. The operational plans provide long-term direction and are reviewed on at least an annual basis. The base strategy is tested through rigorous sensitivity analysis and stress testing using a series of robust downside financial scenarios which result in a financial impact. The testing also identifies the principal risks that may adversely impact the Group which include operational, political, business, liquidity, market and credit risk. The results of the testing ensure potential mitigating actions are appropriately developed.
Due to the inherent uncertainty involved in all business planning, it is not possible for the review to consider every risk that the Group may face. However, the Board considers that the stress testing performed includes all known risks and therefore provides strong assurance of the Group’s financial viability. These risks include the expected impact of welfare reform on our tenants, further reductions in social rents and uncertainty around Brexit, as discussed in the Group Chair’s Statement on page 4.
Also key is the maintenance of a Group-wide assets and liabilities register and risk management processes that flow through to all of the Group’s subsidiaries and operations.
The Board has therefore concluded, based on the extent of the business planning process and strong financial position, that there is a reasonable expectation the Group and the Association have adequate resources and will continue to operate and meet their liabilities as they fall due over the period of their assessment.
The Board can also confirm that it has complied with the Governance and Financial Viability Standard set out by the Homes and Communities Agency.
During the year the Homes and Communities Agency confirmed the G1 and V1 governance and financial viability ratings.
Strategic report Financial statem
ents
43
PRINCIPAL RISKS AND UNCERTAINTIES
The Group operates a comprehensive risk mapping process as part of its annual business planning cycle, which is monitored at each Board meeting. Furthermore, each report provided at Group and subsidiary board meetings must reference the relevant risks addressed on the appropriate risk map.
The principal risks affecting the Group are set out below, along with their movement in the year and examples of key controls and mitigating factors.
Risk and potential impact Change from Key controls and mitigating factors
Government policy, legislation and regulation
Failure to comply with or react to regulations and Government announcements, for example around welfare reform and rent reduction, leading to reputation damage and financial impacts such as cash flow deterioration.
• Income services support to our tenants has been increased.
• Joint working with Government agencies and participation in a pilot to assess the impact of welfare changes.
• Number of self-funders in our care homes to increase to mitigate the New Living Wage cost pressures.
• Updated financial projections have been prepared incorporating a revised growth strategy.
Funding and financial viability
Gearing constraints can limit the Group’s capacity for further borrowing.
Downgrades to the sector’s credit ratings may increase the cost of future borrowing.
Failure to obtain funding could undermine the Group’s long-term growth plans.
• The Group retains high credit quality and ratings enabling access to financial markets. The Group provides regulators with key treasury reports, long-term business plans and sensitivity scenarios.
• Quarterly financial updates for lenders are published on our website and relationships with existing and potential funders are maintained to promote our activities and identify further funding sources.
• Development programmes have capital requirement limits and commitments are monitored against total liquidity.
• Committed developments are forward-funded via bond issues and bank facilities.
• Available funding in place including shorter-term Revolving Credit Facilities to manage a more variable cash flow requirement for the 30,000 plus unit development plan to 2027.
• Longer-term projections and multi-variance stress testing are updated regularly.
• Unencumbered assets are monitored on a continual programme to support future funding requirements.
• Cash flows, covenant compliance and future funding requirements are monitored, incorporating multi-variant sensitivity analyses to assess the impact of cumulating risks.
• Annual funding strategy is approved by the Group Board at the same time as long-term projections are updated.
2015/2016
PRINCIPAL RISKS AND UNCERTAINTIES
GO
VE
RN
AN
CE
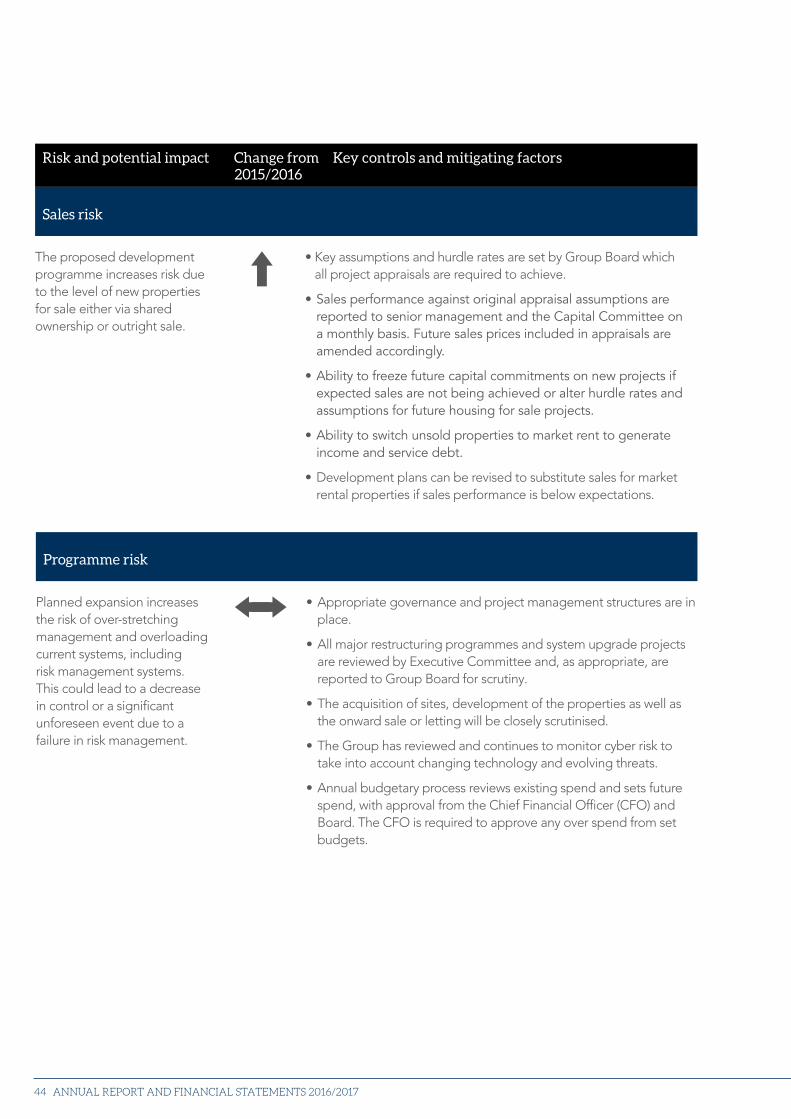
ANNUAL REPORT AND FINANCIAL STATEMENTS 2016/201744
Risk and potential impact Change from Key controls and mitigating factors
Sales risk
The proposed development programme increases risk due to the level of new properties for sale either via shared ownership or outright sale.
• Key assumptions and hurdle rates are set by Group Board which all project appraisals are required to achieve.
• Sales performance against original appraisal assumptions are reported to senior management and the Capital Committee on a monthly basis. Future sales prices included in appraisals are amended accordingly.
• Ability to freeze future capital commitments on new projects if expected sales are not being achieved or alter hurdle rates and assumptions for future housing for sale projects.
• Ability to switch unsold properties to market rent to generate income and service debt.
• Development plans can be revised to substitute sales for market rental properties if sales performance is below expectations.
2015/2016
Programme risk
Planned expansion increases the risk of over-stretching management and overloading current systems, including risk management systems. This could lead to a decrease in control or a significant unforeseen event due to a failure in risk management.
• Appropriate governance and project management structures are in place.
• All major restructuring programmes and system upgrade projects are reviewed by Executive Committee and, as appropriate, are reported to Group Board for scrutiny.
• The acquisition of sites, development of the properties as well as the onward sale or letting will be closely scrutinised.
• The Group has reviewed and continues to monitor cyber risk to take into account changing technology and evolving threats.
• Annual budgetary process reviews existing spend and sets future spend, with approval from the Chief Financial Officer (CFO) and Board. The CFO is required to approve any over spend from set budgets.
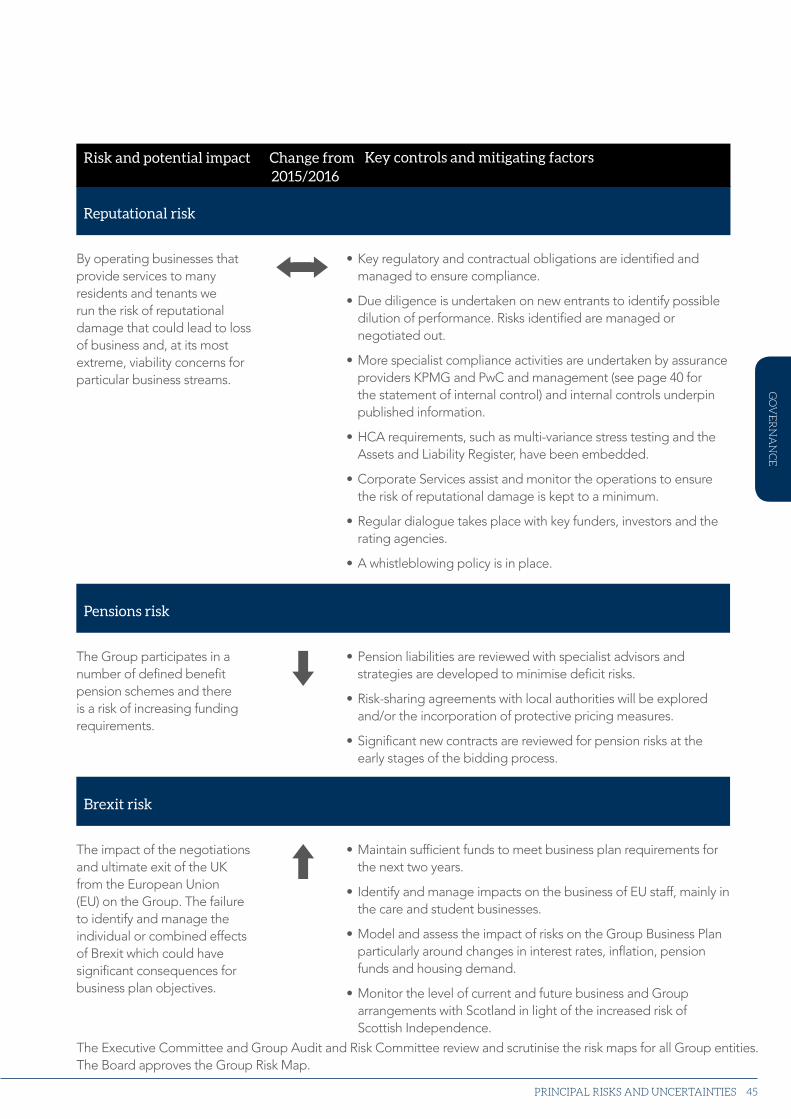
Strategic report Financial statem
ents
45
Pensions risk
The Group participates in a number of defined benefit pension schemes and there is a risk of increasing funding requirements.
• Pension liabilities are reviewed with specialist advisors and strategies are developed to minimise deficit risks.
• Risk-sharing agreements with local authorities will be explored and/or the incorporation of protective pricing measures.
• Significant new contracts are reviewed for pension risks at the early stages of the bidding process.
Brexit risk
The impact of the negotiations and ultimate exit of the UK from the European Union (EU) on the Group. The failure to identify and manage the individual or combined effects of Brexit which could have significant consequences for business plan objectives.
• Maintain sufficient funds to meet business plan requirements for the next two years.
• Identify and manage impacts on the business of EU staff, mainly in the care and student businesses.
• Model and assess the impact of risks on the Group Business Plan particularly around changes in interest rates, inflation, pension funds and housing demand.
• Monitor the level of current and future business and Group arrangements with Scotland in light of the increased risk of Scottish Independence.
The Executive Committee and Group Audit and Risk Committee review and scrutinise the risk maps for all Group entities. The Board approves the Group Risk Map.
Reputational risk
By operating businesses that provide services to many residents and tenants we run the risk of reputational damage that could lead to loss of business and, at its most extreme, viability concerns for particular business streams.
• Key regulatory and contractual obligations are identified and managed to ensure compliance.
• Due diligence is undertaken on new entrants to identify possible dilution of performance. Risks identified are managed or negotiated out.
• More specialist compliance activities are undertaken by assurance providers KPMG and PwC and management (see page 40 for the statement of internal control) and internal controls underpin published information.
• HCA requirements, such as multi-variance stress testing and the Assets and Liability Register, have been embedded.
• Corporate Services assist and monitor the operations to ensure the risk of reputational damage is kept to a minimum.
• Regular dialogue takes place with key funders, investors and the rating agencies.
• A whistleblowing policy is in place.
Risk and potential impact Change from 2015/2016
Key controls and mitigating factors
PRINCIPAL RISKS AND UNCERTAINTIES
GO
VE
RN
AN
CE
ANNUAL REPORT AND FINANCIAL STATEMENTS 2016/201746
STATEMENT OF BOARD’S RESPONSIBILITIES IN RESPECT OF THE BOARD’S REPORT AND THE FINANCIAL STATEMENTS
The Board is responsible for preparing the Board’s Report and the financial statements in accordance with applicable law and regulations.
Co-operative and Community Benefit Society law requires the Board to prepare the Group and the Association’s financial statements for each financial year. Under these regulations, the Board has elected to prepare the Group and the Association’s financial statements in accordance with International Financial Reporting Standards (IFRS) as adopted by the EU and applicable law.
The financial statements are required by law to give a true and fair view of the state of affairs of the Group and the Association and of the surplus of the Group and the Association for that period.
In preparing these financial statements, the Board is required to:
• select suitable accounting policies and then apply them consistently;
• make judgements and estimates that are reasonable and prudent;
• state whether applicable UK Accounting Standards and the Statement of Recommended Practice have been followed, subject to any material departures disclosed and explained in the financial statements; and
• prepare the financial statements on the going concern basis unless it is inappropriate to presume that the Association will continue in business.
The Board is responsible for keeping proper books of account that disclose with reasonable accuracy at any time the financial position of the Association and enable them to ensure that its financial statements comply with the Co-operative and Community Benefit Societies Act 2014, the Housing and Regeneration Act 2008 and the Accounting Direction for Private Registered Providers of Social Housing 2015. The Board has general responsibility for taking such steps as are reasonably open to it to safeguard the assets of the Association and to prevent and detect fraud and other irregularities.
The Board is responsible for the maintenance and integrity of the corporate and financial information included on the Association’s website. Legislation in the UK governing the preparation and dissemination of financial statements may differ from legislation in other jurisdictions.
Disclosure of information to auditor
In the case of each of the persons who are members of the Board at the date when this report was approved:
• so far as each of the members of the Board is aware, there is no relevant audit information of which the Group and Association’s auditor is unaware; and
• each of the members of the Board has taken all the steps that he/she ought to have taken as a member of the Board to make himself/herself aware of any relevant audit information and to establish that the Group and Association’s auditor is aware of that information.
Independent auditor
KPMG LLP has indicated its willingness to continue in office. A resolution concerning the appointment of the auditor will be proposed at the Annual General Meeting.
By order of the Board.
Sophie Atkinson Secretary 28 June 2017 Registered office: Sanctuary House, Chamber Court, Castle Street, Worcester, WR1 3ZQ
Strategic report Financial statem
ents
47
INDEPENDENT AUDITOR’S REPORT TO SANCTUARY HOUSING ASSOCIATION
We have audited the financial statements of Sanctuary Housing Association for the year ended 31 March 2017 set out on pages 48 to 117. The financial reporting framework that has been applied in their preparation is applicable law and International Financial Reporting Standards (IFRS) as adopted by the EU and, as regards the parent company financial statements, as applied in accordance with the provisions of the Companies Act 2006.
This report is made solely to the Association in accordance with section 87 of the Co-operative and Community Benefit Societies Act 2014 and section 128 of the Housing and Regeneration Act 2008. Our audit work has been undertaken so that we might state to the Association those matters we are required to state to them in an auditor’s report and for no other purpose. To the fullest extent permitted by law, we do not accept or assume responsibility to anyone other than the Association as a body, for our audit work, for this report, or for the opinions we have formed.
Respective responsibilities of Board and auditor
As explained more fully in the Statement of Board’s Responsibilities set out on page 46, the Association’s Board is responsible for the preparation of the financial statements which give a true and fair view. Our responsibility is to audit, and express an opinion on, the financial statements in accordance with applicable law and International Standards on Auditing (UK and Ireland). Those standards require us to comply with the Auditing Practices Board’s Ethical Standards for Auditors.
Scope of the audit of the financial statements
A description of the scope of an audit of financial statements is provided on the Financial Reporting Council’s website at www.frc.org.uk/auditscopeukprivate.
Opinion on financial statements
In our opinion the financial statements:
• give a true and fair view, in accordance with IFRSs as adopted by the EU, of the state of the Group’s and the Association’s affairs as at 31 March 2017 and of the surplus of the Group and the Association for the year then ended;
• comply with the requirements of the Co-operative and Community Benefit Societies Act 2014; and
• have been properly prepared in accordance with the Housing and Regeneration Act 2008 and the Accounting Direction for Private Registered Providers of Social Housing 2015.
Matters on which we are required to report by exception
We have nothing to report in respect of the following matters where the Co-operative and Community Benefit Societies Act 2014 requires us to report to you if, in our opinion:
• the Association has not kept proper books of account; or
• the Association has not maintained a satisfactory system of control over transactions; or
• the financial statements are not in agreement with the Association’s books of account; or
• we have not received all the information and explanations we need for our audit.
Darren Turner (Senior Statutory Auditor)
for and on behalf of KPMG LLP, Statutory Auditor
Chartered Accountants, One Snowhill, Snow Hill Queensway, Birmingham, B4 6GH
28 June 2017
INDEPENDENT AUDITOR’S REPORT
FIN
AN
CIA
L ST
AT
EM
EN
TS
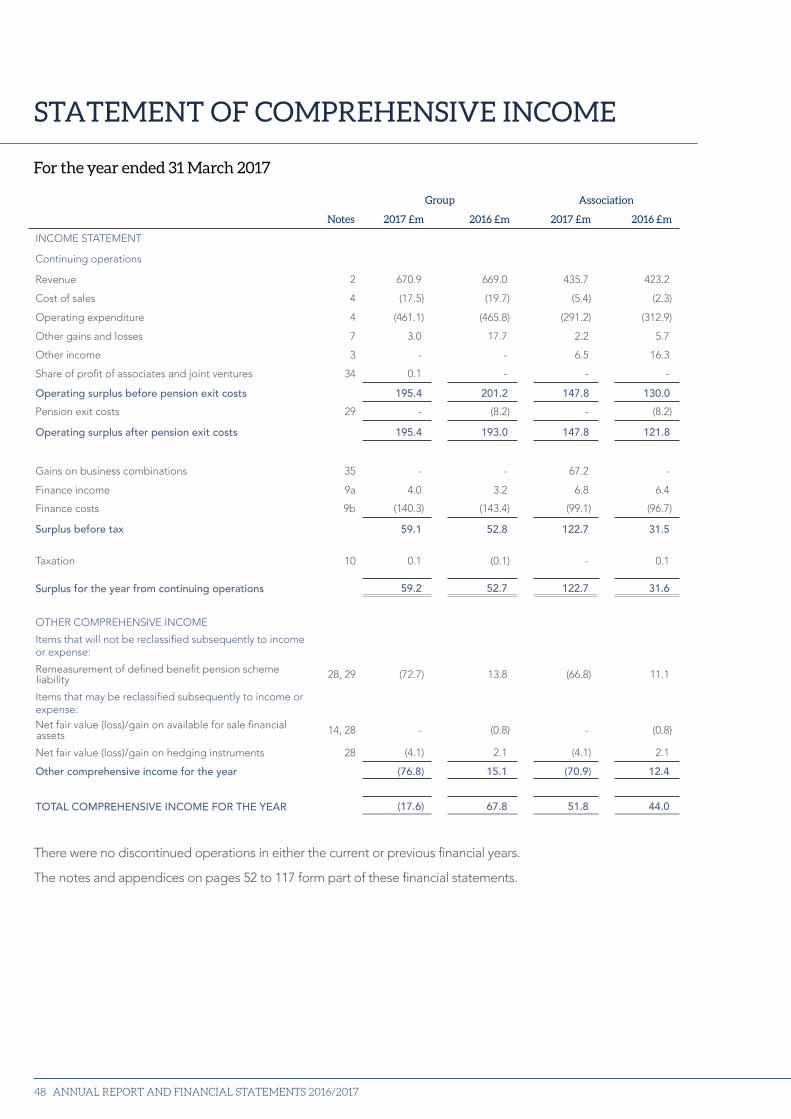
ANNUAL REPORT AND FINANCIAL STATEMENTS 2016/201748
There were no discontinued operations in either the current or previous financial years.
The notes and appendices on pages 52 to 117 form part of these financial statements.
Group Association
Notes 2017 £m 2016 £m 2017 £m 2016 £m
INCOME STATEMENT
Continuing operations
Revenue 2 670.9 669.0 435.7 423.2
Cost of sales 4 (17.5) (19.7) (5.4) (2.3)
Operating expenditure 4 (461.1) (465.8) (291.2) (312.9)
Other gains and losses 7 3.0 17.7 2.2 5.7
Other income 3 - - 6.5 16.3
Share of profit of associates and joint ventures 34 0.1 - - -
Operating surplus before pension exit costs 195.4 201.2 147.8 130.0
Pension exit costs 29 - (8.2) - (8.2)
Operating surplus after pension exit costs 195.4 193.0 147.8 121.8
Gains on business combinations 35 - - 67.2 -
Finance income 9a 4.0 3.2 6.8 6.4
Finance costs 9b (140.3) (143.4) (99.1) (96.7)
Surplus before tax 59.1 52.8 122.7 31.5
Taxation 10 0.1 (0.1) - 0.1
Surplus for the year from continuing operations 59.2 52.7 122.7 31.6
OTHER COMPREHENSIVE INCOME
Items that will not be reclassified subsequently to incomeor expense:
Remeasurement of defined benefit pension scheme liability 28, 29 (72.7) 13.8 (66.8) 11.1
Items that may be reclassified subsequently to income orexpense:Net fair value (loss)/gain on available for sale financial assets 14, 28 - (0.8) - (0.8)
Net fair value (loss)/gain on hedging instruments 28 (4.1) 2.1 (4.1) 2.1
Other comprehensive income for the year (76.8) 15.1 (70.9) 12.4
TOTAL COMPREHENSIVE INCOME FOR THE YEAR (17.6) 67.8 51.8 44.0
STATEMENT OF COMPREHENSIVE INCOME
For the year ended 31 March 2017
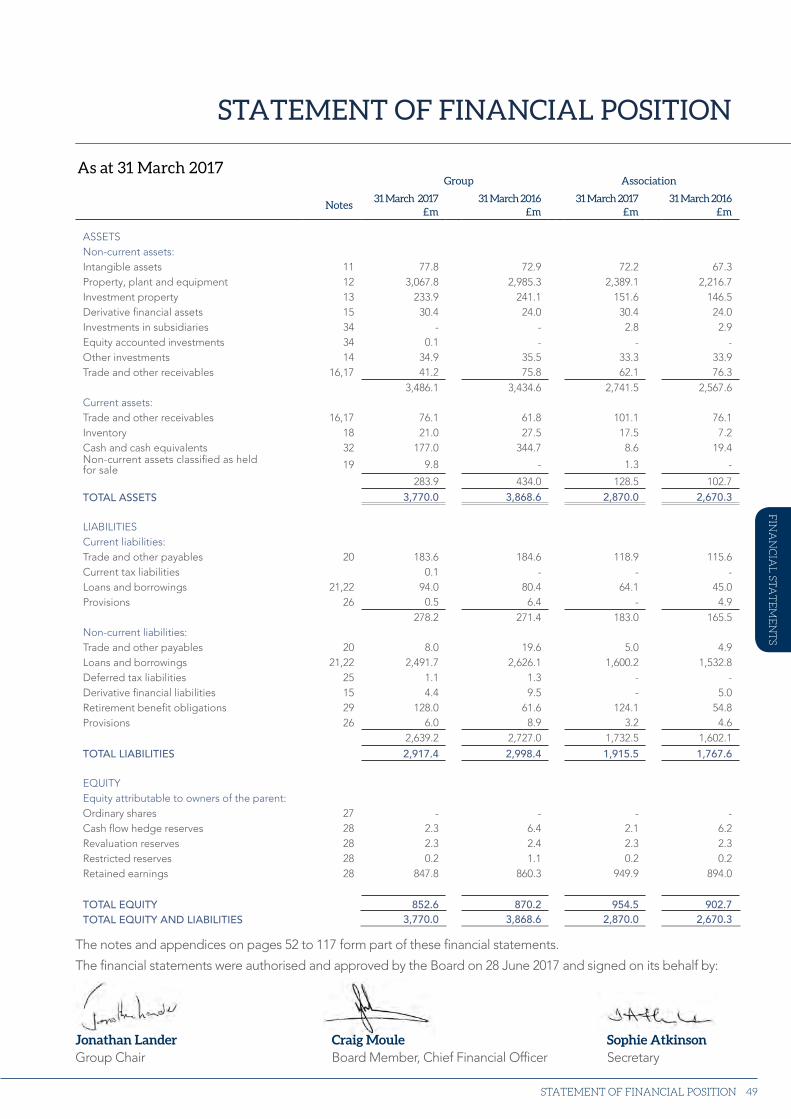
Strategic report Financial statem
ents
49
Group Association
Notes31 March 2017
£m31 March 2016
£m31 March 2017
£m31 March 2016
£m
ASSETS Non-current assets:Intangible assets 11 77.8 72.9 72.2 67.3Property, plant and equipment 12 3,067.8 2,985.3 2,389.1 2,216.7Investment property 13 233.9 241.1 151.6 146.5Derivative financial assets 15 30.4 24.0 30.4 24.0Investments in subsidiaries 34 - - 2.8 2.9Equity accounted investments 34 0.1 - - -Other investments 14 34.9 35.5 33.3 33.9Trade and other receivables 16,17 41.2 75.8 62.1 76.3
3,486.1 3,434.6 2,741.5 2,567.6Current assets:Trade and other receivables 16,17 76.1 61.8 101.1 76.1Inventory 18 21.0 27.5 17.5 7.2Cash and cash equivalents 32 177.0 344.7 8.6 19.4Non-current assets classified as heldfor sale 19 9.8 - 1.3 -
283.9 434.0 128.5 102.7
TOTAL ASSETS 3,770.0 3,868.6 2,870.0 2,670.3
LIABILITIESCurrent liabilities:Trade and other payables 20 183.6 184.6 118.9 115.6Current tax liabilities 0.1 - - -Loans and borrowings 21,22 94.0 80.4 64.1 45.0Provisions 26 0.5 6.4 - 4.9
278.2 271.4 183.0 165.5Non-current liabilities:Trade and other payables 20 8.0 19.6 5.0 4.9Loans and borrowings 21,22 2,491.7 2,626.1 1,600.2 1,532.8Deferred tax liabilities 25 1.1 1.3 - -Derivative financial liabilities 15 4.4 9.5 - 5.0Retirement benefit obligations 29 128.0 61.6 124.1 54.8Provisions 26 6.0 8.9 3.2 4.6
2,639.2 2,727.0 1,732.5 1,602.1
TOTAL LIABILITIES 2,917.4 2,998.4 1,915.5 1,767.6
EQUITYEquity attributable to owners of the parent:Ordinary shares 27 - - - -Cash flow hedge reserves 28 2.3 6.4 2.1 6.2Revaluation reserves 28 2.3 2.4 2.3 2.3Restricted reserves 28 0.2 1.1 0.2 0.2Retained earnings 28 847.8 860.3 949.9 894.0
TOTAL EQUITY 852.6 870.2 954.5 902.7TOTAL EQUITY AND LIABILITIES 3,770.0 3,868.6 2,870.0 2,670.3
Sophie Atkinson Secretary
As at 31 March 2017
STATEMENT OF FINANCIAL POSITION
STATEMENT OF FINANCIAL POSITION
FIN
AN
CIA
L ST
AT
EM
EN
TS
Jonathan LanderGroup Chair
Craig MouleBoard Member, Chief Financial Officer
The notes and appendices on pages 52 to 117 form part of these financial statements.
The financial statements were authorised and approved by the Board on 28 June 2017 and signed on its behalf by:
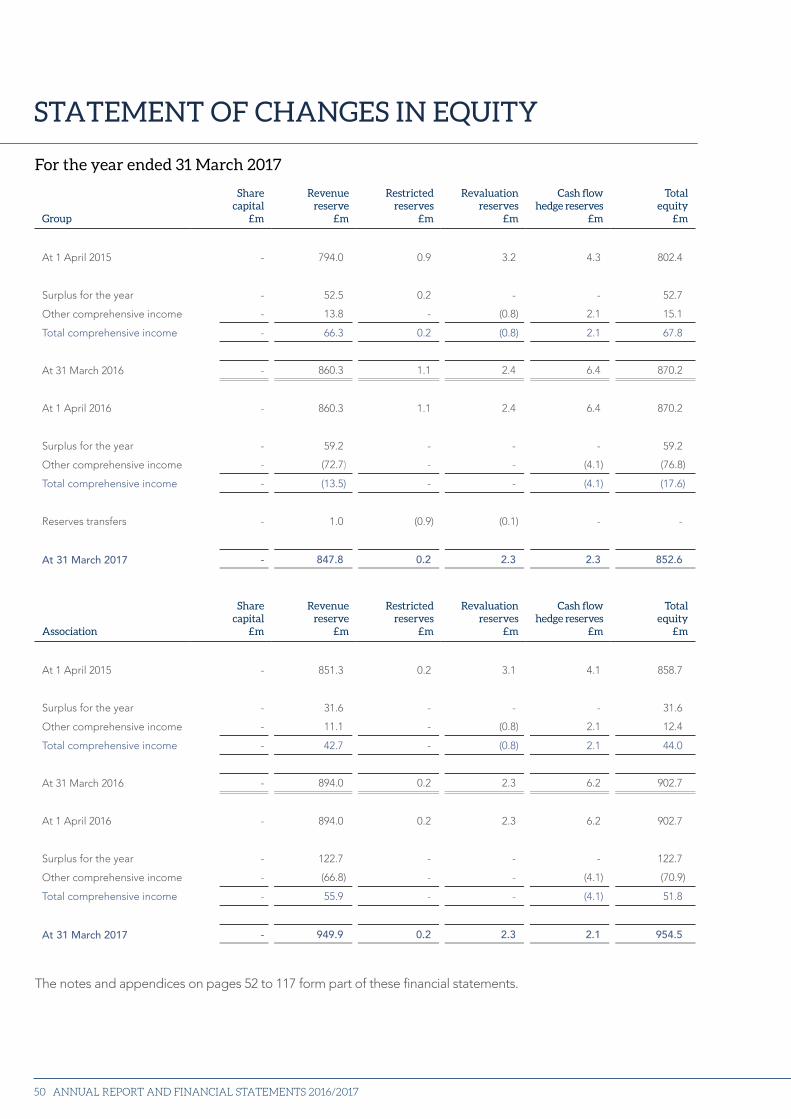
ANNUAL REPORT AND FINANCIAL STATEMENTS 2016/201750
Group
Share capital
£m
Revenue reserve
£m
Restricted reserves
£m
Revaluation reserves
£m
Cash flow hedge reserves
£m
Total equity
£m
At 1 April 2015 - 794.0 0.9 3.2 4.3 802.4
Surplus for the year - 52.5 0.2 - - 52.7
Other comprehensive income - 13.8 - (0.8) 2.1 15.1
Total comprehensive income - 66.3 0.2 (0.8) 2.1 67.8
At 31 March 2016 - 860.3 1.1 2.4 6.4 870.2
At 1 April 2016 - 860.3 1.1 2.4 6.4 870.2
Surplus for the year - 59.2 - - - 59.2
Other comprehensive income - (72.7) - - (4.1) (76.8)
Total comprehensive income - (13.5) - - (4.1) (17.6)
Reserves transfers - 1.0 (0.9) (0.1) - -
At 31 March 2017 - 847.8 0.2 2.3 2.3 852.6
Association
Share capital
£m
Revenue reserve
£m
Restricted reserves
£m
Revaluation reserves
£m
Cash flow hedge reserves
£m
Total equity
£m
At 1 April 2015 - 851.3 0.2 3.1 4.1 858.7
Surplus for the year - 31.6 - - - 31.6
Other comprehensive income - 11.1 - (0.8) 2.1 12.4
Total comprehensive income - 42.7 - (0.8) 2.1 44.0
At 31 March 2016 - 894.0 0.2 2.3 6.2 902.7
At 1 April 2016 - 894.0 0.2 2.3 6.2 902.7
Surplus for the year - 122.7 - - - 122.7
Other comprehensive income - (66.8) - - (4.1) (70.9)
Total comprehensive income - 55.9 - - (4.1) 51.8
At 31 March 2017 - 949.9 0.2 2.3 2.1 954.5
The notes and appendices on pages 52 to 117 form part of these financial statements.
For the year ended 31 March 2017
STATEMENT OF CHANGES IN EQUITY
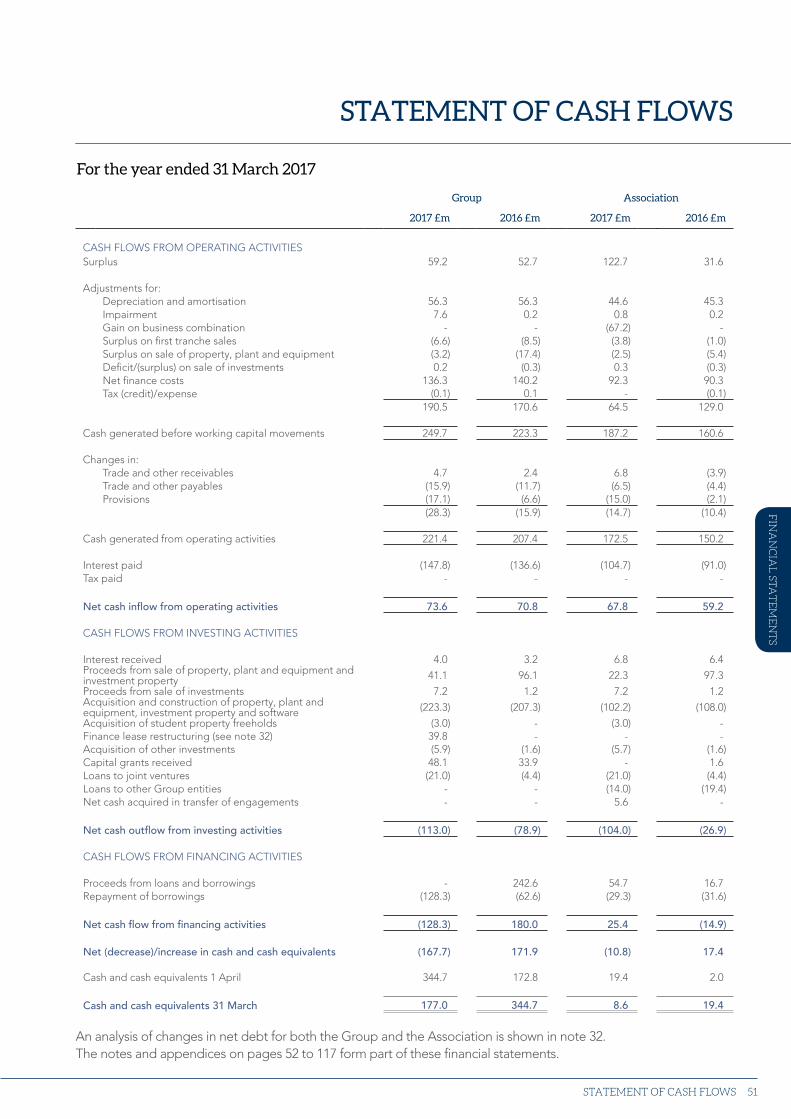
Strategic report Financial statem
ents
51
Group Association
2017 £m 2016 £m 2017 £m 2016 £m
CASH FLOWS FROM OPERATING ACTIVITIESSurplus 59.2 52.7 122.7 31.6
Adjustments for:Depreciation and amortisation 56.3 56.3 44.6 45.3Impairment 7.6 0.2 0.8 0.2Gain on business combination - - (67.2) -Surplus on first tranche sales (6.6) (8.5) (3.8) (1.0)Surplus on sale of property, plant and equipment (3.2) (17.4) (2.5) (5.4)Deficit/(surplus) on sale of investments 0.2 (0.3) 0.3 (0.3)Net finance costs 136.3 140.2 92.3 90.3Tax (credit)/expense (0.1) 0.1 - (0.1)
190.5 170.6 64.5 129.0
Cash generated before working capital movements 249.7 223.3 187.2 160.6
Changes in:Trade and other receivables 4.7 2.4 6.8 (3.9)Trade and other payables (15.9) (11.7) (6.5) (4.4)Provisions (17.1) (6.6) (15.0) (2.1)
(28.3) (15.9) (14.7) (10.4)
Cash generated from operating activities 221.4 207.4 172.5 150.2
Interest paid (147.8) (136.6) (104.7) (91.0)Tax paid - - - -
Net cash inflow from operating activities 73.6 70.8 67.8 59.2
CASH FLOWS FROM INVESTING ACTIVITIES
Interest received 4.0 3.2 6.8 6.4Proceeds from sale of property, plant and equipment and investment property 41.1 96.1 22.3 97.3
Proceeds from sale of investments 7.2 1.2 7.2 1.2Acquisition and construction of property, plant and equipment, investment property and software (223.3) (207.3) (102.2) (108.0)
Acquisition of student property freeholds (3.0) - (3.0) -Finance lease restructuring (see note 32) 39.8 - - -Acquisition of other investments (5.9) (1.6) (5.7) (1.6)Capital grants received 48.1 33.9 - 1.6Loans to joint ventures (21.0) (4.4) (21.0) (4.4)Loans to other Group entities - - (14.0) (19.4)Net cash acquired in transfer of engagements - - 5.6 -
Net cash outflow from investing activities (113.0) (78.9) (104.0) (26.9)
CASH FLOWS FROM FINANCING ACTIVITIES
Proceeds from loans and borrowings - 242.6 54.7 16.7Repayment of borrowings (128.3) (62.6) (29.3) (31.6)
Net cash flow from financing activities (128.3) 180.0 25.4 (14.9)
Net (decrease)/increase in cash and cash equivalents (167.7) 171.9 (10.8) 17.4
Cash and cash equivalents 1 April 344.7 172.8 19.4 2.0
Cash and cash equivalents 31 March 177.0 344.7 8.6 19.4
An analysis of changes in net debt for both the Group and the Association is shown in note 32.The notes and appendices on pages 52 to 117 form part of these financial statements.
STATEMENT OF CASH FLOWS
For the year ended 31 March 2017
STATEMENT OF CASH FLOWS
FIN
AN
CIA
L ST
AT
EM
EN
TS
ANNUAL REPORT AND FINANCIAL STATEMENTS 2016/201752
NOTES TO THE FINANCIAL STATEMENTS
1. Principal accounting policies
General information
The Association is registered in England as a Registered Society (Number 19059R) and with the Homes and Communities Agency (Number L0247); it is the ultimate parent undertaking within the Group. The Association’s separate financial statements are presented alongside those of the Group, which consolidates the financial statements of the Association and entities controlled by the Association.
The financial statements are presented in pounds sterling which is the Group’s functional currency. Unless otherwise stated, amounts are denominated in millions (£m) rounded to the nearest £0.1 million.
Basis of accounting
The Group’s and Association’s financial statements (the financial statements) have been prepared and approved by the Directors in accordance with International Financial Reporting Standards as adopted by the EU (IFRS). They are also prepared in accordance with the Co-operative and Community Benefit Societies Act 2014, Schedule 1 to the Housing and Regeneration Act 2008 and the Accounting Direction for Social Housing in England 2015. Additional guidance is taken from the Statement of Recommended Practice: Accounting by Registered Social Housing Providers 2014 (the SORP) where this does not conflict with IFRS.
Going concern
The Group’s operations, together with the factors likely to affect its future performance and financial position, are set out in the Strategic Report of the Board and Operating and Financial Review on pages 4 to 31. Included within this, the Chief Financial Officer’s Review discusses the Group’s financial position in terms of borrowing strategy and capacity.
The exposure to risk is managed effectively by the Group Audit and Risk Committee, with the key risks being faced by the Group and the internal control measures implemented being discussed in more detail on pages 43 to 45. Note 23 of the financial statements also discusses the Group’s liquidity and credit risk.
The Group’s core operations, although expanding, are built on a solid base with strong relationships forged over the years with local authorities. The Group prepares robust business plans which are reviewed by the Homes and Communities Agency (HCA), as well as 30-year long-term projections in order to map the growth of the business.
Despite the challenges presented by recent Government announcements, the Group’s strategy and core strength is reflected in the external ratings with the HCA and credit agencies, with a V1 viability status from the HCA as well as maintaining A1 status from Moody’s and A+ status from Standard & Poor’s.
In conjunction with the business plan and the stress testing discussed in the viability statement on page 42, the Board has a reasonable expectation that the Group has adequate resources to continue in operational existence for a period of at least 12 months. Accordingly, it continues to adopt the going concern basis in preparing the Group and Association’s financial statements.
Strategic report Financial statem
ents
53
IFRS not yet applied
The below list details new standards, amendments and interpretations which are either not effective or not yet endorsed by the EU, which may have an impact on the accounting within the Group’s financial statements in future periods:
• Amendments to IAS 7 Statement of cash flows (effective for annual periods beginning on or after 1 January 2017).• Amendments resulting from Annual Improvements 2014–2016 Cycle (effective for annual periods beginning on or
after 1 January 2018).• Amendments to IAS 40 Investment property (effective for annual periods beginning on or after 1 January 2018).• IFRS 9 Financial instruments and the amendment on general hedge accounting (effective for annual periods
beginning on or after 1 January 2018).• IFRS 15 Revenue from contracts with customers (effective for annual periods beginning on or after 1 January 2018).• IFRS 16 Leases (issued in January 2016 and applies to annual reporting periods beginning on or after 1 January
2019).
In January 2016 the IASB issued IFRS 16 on accounting for leases which is yet to be endorsed by the European Union. This standard will have a material impact on the Group because of the value of operating leases entered into (see note 24). The Group is in the process of determining what the effect may be.
The Group is currently also reviewing the impact of IFRS 9 and IFRS 15 to determine both the accounting and disclosure implications.
The Group has yet to assess the full impact of the remainder of these new standards and amendments; however initial indications are that they will not significantly impact the financial statements of the Group.
Other forthcoming standards, amendments or interpretations which are not covered within the above are highly unlikely to impact the financial statements of the Group.
Critical accounting judgements
In the process of applying the Group’s and Association’s accounting policies, management has made certain judgements which have a significant impact upon the financial statements, these are detailed below.
Classification of property
A degree of judgement is required over whether property held by the Group is treated as property, plant and equipment or as investment property.
Investment property is property held to earn rentals or for capital appreciation or both. The Group considers all of its commercial property and its property held for student lettings to fall under this definition.
Property held for use in the production or supply of goods or services or for administrative purposes is treated as property, plant and equipment. The Group has therefore classified its office buildings (held for administrative purposes) and its care homes (held for the provision of care services) as property, plant and equipment.
A greater degree of judgement is required over the classification of housing property held for social lettings. It is the Group’s opinion that while rental income is received from the provision of social housing, the primary purpose is to provide social benefits. The provision of social housing is therefore akin to supplying a service and so property held for this purpose has been accounted for as property, plant and equipment. This treatment is consistent with housing associations that have chosen the alternative option of applying the revised UK GAAP (FRS 102), which contains explicit provisions for this scenario and arrives at a similar conclusion; it is also consistent with guidance contained in the Statement of Recommended Practice: Accounting by Registered Social Housing Providers 2014 (the SORP).
NOTES TO THE FINANCIAL STATEMENTS
FIN
AN
CIA
L ST
AT
EM
EN
TS
ANNUAL REPORT AND FINANCIAL STATEMENTS 2016/201754
Critical accounting estimates and assumptions
The preparation of the Group’s and Association’s financial statements requires management to make estimates and assumptions that affect reported carrying amounts of assets and liabilities.
Estimates and assumptions are continually evaluated based on historical experience and other factors, including expectations of future events that are believed to be reasonable under the circumstances. Actual experience may differ from these estimates and assumptions. The estimates and assumptions that have a significant risk of causing a material adjustment to the carrying amounts of assets and liabilities within the next financial year are discussed below.
Retirement benefit obligation valuations
In determining the valuation of defined benefit schemes’ assets and liabilities, a number of key assumptions have been made. The key assumptions, which are given below, are largely dependent on factors outside the control of the Group:
• inflation rate;• life expectancy;• discount rate; and• salary and pension growth rates.
The Group is exposed to risks through its defined benefit schemes if actual experience differs to the assumptions used and through volatility in the plan assets. Details of the assumptions used, and associated sensitivities, are included in note 29.
Fair value measurement
A number of assets and liabilities included in the Group’s financial statements require measurement at, and/or disclosure of, fair value.
The fair value measurement of the Group’s financial and non-financial assets and liabilities utilises market observable inputs and data as far as possible.
The Group measures (or discloses) the following items at fair value:
- investment property – disclosure only (note 13)- available for sale financial assets – listed investments (notes 14 and 23)- derivative financial instruments (notes 15 and 23)- retirement benefit obligations (see separate comments above and note 29).
Strategic report Financial statem
ents
55
Basis of consolidation
The consolidated financial statements incorporate the financial statements of the Association and entities controlled by the Association.
Subsidiaries
Subsidiaries are entities controlled by the Group. The Group controls an entity when it is exposed to, or has rights to, variable returns from its involvement with the entity and has the ability to affect those returns through its power over the entity. In assessing control, the Group takes into consideration potential voting rights that are currently exercisable. The acquisition date is the date on which control is transferred to the acquirer. The financial statements of subsidiaries are included in the consolidated financial statements from the date that control commences until the date that control ceases. Business combinations are accounted for using the acquisition method.
Investments in subsidiaries are accounted for at cost less any impairment for permanent diminutions in value.
Joint arrangements
A joint arrangement is an arrangement over which the Group and one or more third parties have joint control. These joint arrangements are in turn classified as:
• joint ventures whereby the Group has rights to the net assets of the arrangement, rather than rights to its assets and obligations for its liabilities; and
• joint operations whereby the Group has rights to the assets and obligations for the liabilities relating to the arrangement.
Application of the equity method to joint ventures
Joint ventures are accounted for using the equity method (equity accounted investees) and are initially recognised at cost. The consolidated financial statements include the Group’s share of the total comprehensive income and equity movements of equity accounted investees, from the date that joint control commences until the date that joint control ceases. When the Group’s share of losses exceeds its interest in an equity accounted investee, the Group’s carrying amount is reduced to £nil and recognition of further losses is discontinued except to the extent that the Group has incurred legal or constructive obligations or made payments on behalf of an investee.
Transactions eliminated on consolidation
Intra-Group balances and transactions, and any unrealised income and expenses arising from intra-Group transactions, are eliminated. Unrealised gains arising from transactions with equity-accounted investees are eliminated against the investment to the extent of the Group’s interest in the investee. Unrealised losses are eliminated in the same way as unrealised gains, but only to the extent that there is no evidence of impairment.
Goodwill arising on business combinations
Goodwill is calculated as the difference between the fair value of the aggregate of the consideration transferred and the net fair value of identifiable assets acquired and liabilities assumed.
If the difference calculated above is positive, the amount is treated as an intangible asset in the Statement of Financial Position and is stated at cost less any accumulated impairment losses. Goodwill is allocated to cash-generating units and is not amortised but is tested annually for impairment with any impairment losses recognised in the Statement of Comprehensive Income.
If the amount calculated above is negative then a gain on bargain purchase arises and the gain is recognised in the Statement of Comprehensive Income on the acquisition date. This situation is common in relation to acquisitions of social housing businesses that are in substance the gift of one business to another.
NOTES TO THE FINANCIAL STATEMENTS
FIN
AN
CIA
L ST
AT
EM
EN
TS
ANNUAL REPORT AND FINANCIAL STATEMENTS 2016/201756
Transfers of engagements
A transfer of engagements is treated as an acquisition in the receiving entity with assets and liabilities being fair valued using external data available and any gains on business combinations presented in the receiver. Should there be a contractual obligation to transfer an acquired entity’s engagements at the time of initial acquisition, there are no fair value movements on transfer. There is no consideration paid.
Any adjustments which would otherwise adjust the overall Group fair value of the same assets or the associated gains on business combinations are removed through a consolidation adjustment so as not to impact the Group position which remains unchanged as a result of the transfer.
Investments treated as non-current assets
Where the investments in listed or unlisted securities are held as a condition of financing arrangements, with the result that the Group’s ability to utilise these funds is restricted in the long-term, the investments are treated as non-current assets.
Listed investments are classified as being available for sale and are stated at fair value with any resultant gain or loss being recognised directly in reserves, except for impairment losses. Unlisted investments are classified as loans and receivables and are stated at amortised cost less impairment.
Segmental reporting
The Group’s reportable segments are based on its operational divisions which offer distinguishable services, are managed separately and are regularly assessed by the chief operating decision maker, identified as the Executive Committee, comprising the Group Chief Executive and the Chief Financial Officer.
Operating division results include items directly attributable to the segment, together with apportioned centralised costs. Central costs are allocated based on a number of factors including headcounts, desk spaces, asset values and turnover within each of the respective divisions.
Revenue
Revenue represents rental and service charge income receivable (net of void losses), fees receivable, proceeds from first tranche sales of low-cost home ownership properties and from properties developed for open market sales at the point of sale completion. Revenue is measured at the fair value of the consideration received or receivable in relation to the sale of goods or provision of services in the normal course of business, net of discounts, VAT and other sales-related taxes.
Rental income is credited to revenue on a straight-line basis over the period of the tenancy agreement. Where tenancy agreements include rent free periods, income is accrued or deferred in order to recognise the rent free periods on a straight-line basis.
Revenue from the rendering of services and from Supporting People contracts is recognised when the service concerned has been provided. Grants made as contributions to revenue expenditure are credited to income in the period in which the related expenditure is incurred.
Where the Group and Association use managing agents to run supported housing but overall control and risk of financial loss is retained by the Group or Association, the income from the supported housing is included in revenue.
Where management charges are receivable from other Group entities by the Association, the income is recognised in revenue.
Strategic report Financial statem
ents
57
Intangible assets – Software
Software acquisition costs, licence costs and development costs are treated as intangible assets and stated at cost less accumulated amortisation and accumulated impairment losses.
Amortisation is charged to the Statement of Comprehensive Income on a straight-line basis over the estimated useful lives of the software from the date it is available for use.
The estimated useful lives used for software are between 4 to 10 years. Management judge this to be a reasonable reflection of the economic life of the system.
Property, plant and equipment and depreciation
Property, plant and equipment are stated at cost less accumulated depreciation and accumulated impairment losses. Where parts of an item of property, plant and equipment have different useful lives, they are accounted for as separate items of property, plant and equipment.
Leases in which the Group assumes substantially all the risks and rewards of ownership of the leased asset are classified as finance leases. Where land and buildings are held under leases the accounting treatment of the land is considered separately from that of the buildings. Leased assets acquired by way of finance lease are stated at an amount equal to the lower of their fair value and the present value of the minimum lease payments at inception of the lease, less accumulated depreciation and less accumulated impairment losses.
Land and buildings:
Land and buildings consists of housing properties for social rent (including care homes) and shared ownership properties. The provision of social housing is akin to supplying a service and therefore property held for the primary purpose of providing social benefits should be excluded from the scope of Investment Property and accounted for as property, plant and equipment. Housing properties are stated at historical cost less accumulated depreciation. Historical cost includes expenditure that is directly attributable to the acquisition of the items. The cost of such properties includes the following:
a) cost of acquiring land and buildings;b) construction costs including internal equipment and fitting;c) directly attributable development administration costs;d) cost of capital employed during the development period; e) expenditure incurred in respect of improvements and extensions to existing properties; andf) construction costs incurred but not yet certified at the reporting date.
Subsequent costs are included in the asset’s carrying amount or recognised as a separate asset, as appropriate, only when it is probable that future economic or social benefits associated with the item will flow to the Group and the cost of the item can be measured reliably.
Expenditure on housing properties which is capable of generating increased future rents, extends their useful life, or significantly reduces future maintenance costs, is capitalised. All other repairs and maintenance are charged to the Statement of Comprehensive Income during the financial year in which they are incurred.
NOTES TO THE FINANCIAL STATEMENTS
FIN
AN
CIA
L ST
AT
EM
EN
TS
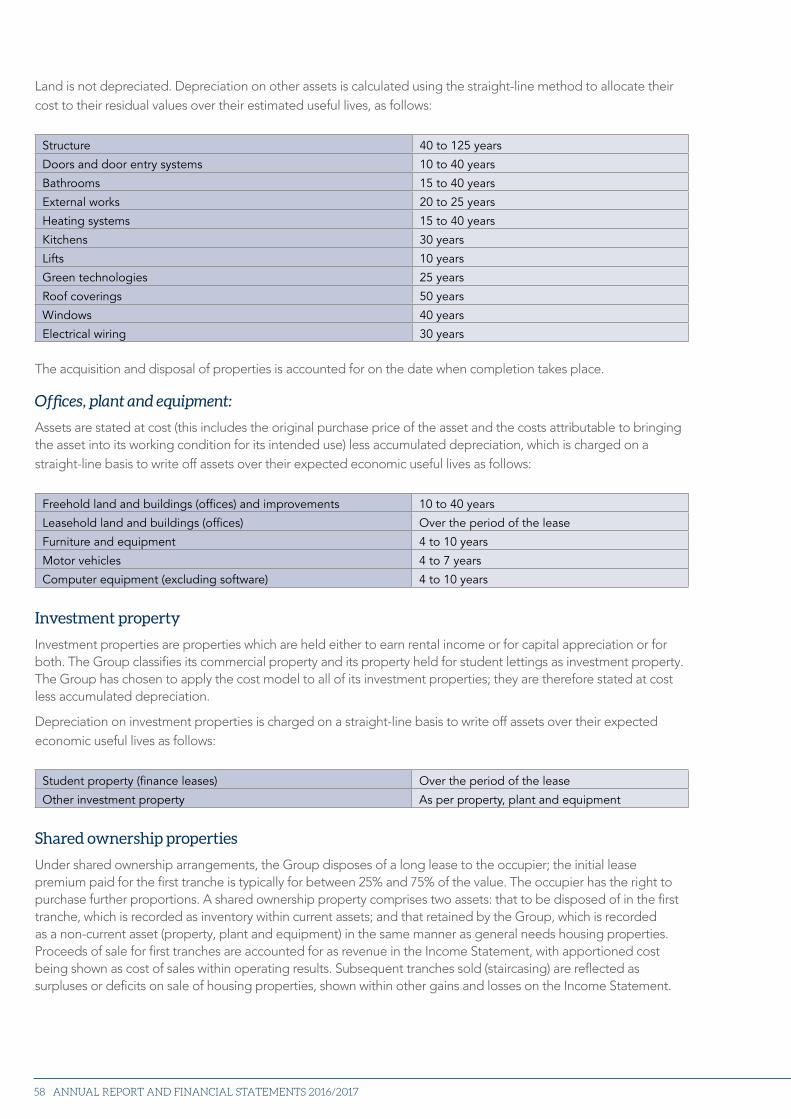
ANNUAL REPORT AND FINANCIAL STATEMENTS 2016/201758
Land is not depreciated. Depreciation on other assets is calculated using the straight-line method to allocate their cost to their residual values over their estimated useful lives, as follows:
Structure 40 to 125 years
Doors and door entry systems 10 to 40 years
Bathrooms 15 to 40 years
External works 20 to 25 years
Heating systems 15 to 40 years
Kitchens 30 years
Lifts 10 years
Green technologies 25 years
Roof coverings 50 years
Windows 40 years
Electrical wiring 30 years The acquisition and disposal of properties is accounted for on the date when completion takes place.
Offices, plant and equipment:
Assets are stated at cost (this includes the original purchase price of the asset and the costs attributable to bringing the asset into its working condition for its intended use) less accumulated depreciation, which is charged on a straight-line basis to write off assets over their expected economic useful lives as follows:
Freehold land and buildings (offices) and improvements 10 to 40 years
Leasehold land and buildings (offices) Over the period of the lease
Furniture and equipment 4 to 10 years
Motor vehicles 4 to 7 years
Computer equipment (excluding software) 4 to 10 years
Investment property
Investment properties are properties which are held either to earn rental income or for capital appreciation or for both. The Group classifies its commercial property and its property held for student lettings as investment property. The Group has chosen to apply the cost model to all of its investment properties; they are therefore stated at cost less accumulated depreciation.
Depreciation on investment properties is charged on a straight-line basis to write off assets over their expected economic useful lives as follows:
Student property (finance leases) Over the period of the lease
Other investment property As per property, plant and equipment
Shared ownership properties
Under shared ownership arrangements, the Group disposes of a long lease to the occupier; the initial lease premium paid for the first tranche is typically for between 25% and 75% of the value. The occupier has the right to purchase further proportions. A shared ownership property comprises two assets: that to be disposed of in the first tranche, which is recorded as inventory within current assets; and that retained by the Group, which is recorded as a non-current asset (property, plant and equipment) in the same manner as general needs housing properties. Proceeds of sale for first tranches are accounted for as revenue in the Income Statement, with apportioned cost being shown as cost of sales within operating results. Subsequent tranches sold (staircasing) are reflected as surpluses or deficits on sale of housing properties, shown within other gains and losses on the Income Statement.
Strategic report Financial statem
ents
59
Finance leases
Housing properties held under finance leases are recorded in the Statement of Financial Position on inception at a value equal to the discounted minimum lease payments over the lease period. The discount rate applied is that which is implicit in the lease from the lessor’s perspective. If the discount rate cannot be identified, a rate from a similar arrangement is applied. The asset is depreciated on a straight-line basis over the lease period to its deemed residual value, or to £nil if there is no option to acquire the asset at the end of the lease term. The corresponding liability is recorded as a payable and the interest element of the finance charge is charged to the Statement of Comprehensive Income over the primary lease period on a constant rate basis.
Amounts receivable under finance leases are recorded in the Statement of Financial Position at the present value of the future contractual cash flows from the lessee. Annual amounts received in respect of interest on finance leases are recognised in the Statement of Comprehensive Income.
Borrowing costs and development administration costs
Interest on the Group’s and Association’s borrowings to finance developments is capitalised in properties under construction to the extent it accrues in respect of the period of development. The interest is either on borrowings specifically financing a scheme (after deduction of interest on Social Housing Grant (SHG) received in advance) or the weighted average borrowing rate across net borrowings deemed to be financing a scheme. Where a scheme has SHG in excess of costs, interest receivable is accrued against the balance.
Directly attributable development administration costs capitalised are the labour costs of the Group’s and Association’s own employees arising directly from the construction or acquisition of properties, and the incremental costs that would have been avoided only if the properties had not been constructed or acquired.
Social Housing Grant (SHG) and other public grant
Where developments have been financed wholly or partly by SHG and/or other public grant, the amount of grant received is offset against the cost of developments on the face of the Statement of Financial Position. In instances where grant for the development programme exceeds development costs, an amount equal to the excess is held in payables. Where grants are receivable for the development programme in arrears, the amounts are accrued within receivables. Where grants are repayable and the associated asset is sold, the grant is held within the recycled capital grant fund (RCGF) or disposal proceeds fund (DPF) within payables until it is recycled or repaid to the issuer.
Where acquired entities have grant, the gross book value has been uplifted by the grant amount to show both the cost and grant element within the Group Statement of Financial Position.
Recycled capital grant fund and disposal proceeds fund
In certain circumstances the Group and Association are permitted to retain the SHG relating to properties sold and to apply this to further property development within a certain time frame. If this time frame is exceeded the grant may be repayable. In these circumstances it is included within the RCGF or DPF within payables.
Impairment
Financial assets
A financial asset not carried at fair value through the Income Statement is assessed at each reporting date to determine whether there is objective evidence that it is impaired. A financial asset is impaired if objective evidence indicates that a loss event has occurred after the initial recognition of the asset, and that the loss event had a negative effect on the estimated future cash flows of that asset that can be estimated reliably.
An impairment loss in respect of a financial asset measured at amortised cost is calculated as the difference between its carrying amount and the present value of the estimated future cash flows discounted at the asset’s original effective interest rate. Interest on the impaired asset continues to be recognised through the unwinding of the discount. When a subsequent event causes the amount of impairment loss to decrease, the decrease in impairment loss is reversed through the Statement of Comprehensive Income.
NOTES TO THE FINANCIAL STATEMENTS
FIN
AN
CIA
L ST
AT
EM
EN
TS
ANNUAL REPORT AND FINANCIAL STATEMENTS 2016/201760
Non-financial assets
The carrying amounts of the Group’s non-financial assets, other than inventories, are reviewed at each reporting date to determine whether there is any indication of impairment. If any such indication exists, then the asset’s recoverable amount is estimated.
An impairment loss is recognised if the carrying amount of an asset or its cash-generating unit (CGU) exceeds its estimated recoverable amount. Impairment losses are recognised in the Statement of Comprehensive Income. Impairment losses recognised in respect of CGUs are allocated first to reduce the carrying amount of any goodwill allocated to the units, and then to reduce the carrying amounts of the other assets in the unit (group of units) on a pro rata basis.
The recoverable amount of an asset or CGU is the greater of its value in use and its fair value less costs to sell. In assessing value in use, the estimated future cash flows are discounted to their present value using a pre-tax discount rate that reflects current market assessments of the time value of money and the risks specific to the asset. For the purpose of impairment testing, assets that cannot be tested individually are grouped together into the smallest group of assets that generates cash inflows from continuing use that are largely independent of the cash inflows of other assets or groups of assets (the ‘cash-generating unit’). The goodwill acquired in a business combination, for the purpose of impairment testing, is allocated to CGUs.
Impairment testing – property
When an impairment indicator is identified, an impairment review is performed at an individual property level and compared against the higher of:
• the fair value less selling costs of the property, or• its value in use (VIU).
Should the net book value of the property exceed the higher of these measures, it is impaired to this value, with the movement going through the Statement of Comprehensive Income.
Fair value is deemed to be the market value of the property based on its current use. For social housing, this will be the existing use value – social housing (EUV-SH). For other property types, open market valuations are used as an indicator of this value. VIU is based on the property’s recoverable amount. The recoverable amount is calculated using an assessment of future discounted cash flows or other valuation methods deemed appropriate. For this purpose, discounted cash flows are assessed over a period of up to 30 years.
Discounted cash flows use the cost of borrowing for the asset owning entity and an appropriate retail price inflation rate. Sensitivity analysis is undertaken on these assumptions to ensure calculations are robust.
Another measure of VIU permitted by the SORP for social housing is the depreciated replacement cost (DRC) of the property. To determine the DRC, the Group uses information on current and recently completed developments in order to establish a build cost relevant to the property being tested, based on size, location, and other factors.
Impairment testing – goodwill and other intangible assets
The Group tests goodwill and other intangible assets annually for impairment or more frequently if there are indications that items might be impaired. The carrying value of the relevant CGU is compared to the recoverable amount to ascertain if impairment is required. Recoverable amounts for CGUs are based on the higher of value in use and fair value less costs of disposal. Value in use is determined by calculating the present value of future cash flows of the CGU, using discount rates that reflect the time value of money and risks specific to the CGU. Discount rates are derived from the Group’s weighted average cost of capital, as adjusted for the specific risks relating to each CGU.
Strategic report Financial statem
ents
61
Impairment reversals
An impairment loss in respect of goodwill is not reversed. In respect of other assets, impairment losses recognised in prior periods are assessed at each reporting date for any indications that the loss has decreased or no longer exists. An impairment loss is reversed if there has been a change in the estimates used to determine the recoverable amount. An impairment loss is reversed only to the extent that the asset’s carrying amount does not exceed the carrying amount that would have been determined, net of depreciation or amortisation, if no impairment loss had been recognised.
Inventories
Inventories are stated at the lower of cost and net realisable value and comprise properties held for sale and consumables used by the Group’s maintenance operations. Properties held for sale include properties held for outright sale and proportions of shared ownership properties allocated as first tranche sales; costs include direct materials, direct labour and other direct costs that have been incurred in bringing the inventories to their present location and condition. Net realisable value represents the estimated selling price less any anticipated selling costs. Maintenance consumables are valued on a first in, first out basis.
Non-current assets classified as held for sale
A non-current asset is classified as held for sale if its carrying amount will be recovered principally through sale rather than through continuing use, it is available for immediate sale and sale is highly probable within one year. On initial classification as held for sale, non-current assets are measured at the lower of previous carrying amount and fair value less costs to sell with any adjustments taken to the Income Statement.
Operating leases
Payments made under operating leases are recognised in the Statement of Comprehensive Income on a straight-line basis over the term of the lease.
Financial instruments
Financial assets
There are three categories of financial assets held by the Group:
• financial assets at fair value through the Income Statement;• loans and receivables; and• available-for-sale financial assets.
Financial assets at fair value through the Income Statement are initially measured at fair value, not including transaction costs. At each reporting date they are remeasured at fair value. Any change in value is recognised in the Income Statement unless hedge accounting is effective.
Derivatives are measured at fair value and, where they are part of an effective hedging relationship, the effective portion of the changes in the fair value are taken to the cash flow hedge reserve. If the hedging relationship is deemed not to be effective, changes in fair value are recognised in the Income Statement.
The cash flow hedge reserve relating to terminated hedge relationships is reclassified to the Income Statement, specifically finance costs, in the same period and in the same proportion as the hedged instrument impacts the Income Statement.
Loans and receivables are assets with fixed or determinable payments that are not quoted on an active market, other than those that are categorised as financial assets at fair value through the Income Statement or available-for-sale assets. These are initially recognised at fair value plus transaction costs, and subsequently at amortised cost. Examples of loans and receivables include tenant rental arrears, unlisted investments, sundry receivables and cash at bank and in hand.
Available-for-sale financial assets are initially recognised at fair value plus transaction costs, which is effectively historical cost. At each reporting date they are remeasured at fair value and movements are recorded in equity reserves and in the Income Statement when the reserves are fully utilised. The Group considers listed investments to be available-for-sale assets.
NOTES TO THE FINANCIAL STATEMENTS
FIN
AN
CIA
L ST
AT
EM
EN
TS
ANNUAL REPORT AND FINANCIAL STATEMENTS 2016/201762
Financial liabilities
There are two categories of financial liability:
• financial liabilities at fair value through the Income Statement; and• other financial liabilities.
Financial liabilities at fair value through the Income Statement are derivative liabilities. These are initially measured at fair value, not including transaction costs. At each reporting date they are remeasured at fair value. Any change in value is recognised in the Income Statement unless hedge accounting is effective, in which case movements are treated as described in the financial assets section on the previous page.
Other financial liabilities are all financial liabilities that have value to the supplying party and do not fall into the previous category, for instance debt finance, trade payables, other payables and accruals. They are valued at fair value at inception and then amortised cost subsequently.
Provisions for liabilities and charges
A provision is recognised in the Statement of Financial Position when the Group has a present legal or constructive obligation as a result of a past event, that can be reliably measured and it is probable that an outflow of economic benefits will be required to settle the obligation.
Financing costs
Costs which are incurred directly in connection with the raising of private finance are deducted from the liability and amortised over the term of the loan on a consistent periodic rate of charge. Premiums or discounts on financial instruments are amortised using the effective interest rate basis or a straight-line basis where it can be demonstrated that there is no material difference between the two methods.
Leasehold service charge sinking funds
The Group and Association are required to set aside sums for future maintenance of certain properties subject to leasehold arrangements. These sums are held in a separate bank account to which interest is added. Amounts accumulated in the fund are included within trade and other receivables and within trade and other payables.
Unutilised contributions to sinking funds and over recovery of service costs repayable to tenants/leaseholders are shown in liabilities (including any interest). Where there has been an under recovery of variable service charges, the balance is included within receivables to the extent it is recoverable.
Retirement benefits
The Group’s and Association’s pension arrangements comprise various defined benefit and defined contribution schemes. Where the underlying assets and liabilities of the defined benefit schemes can be separately identified the Group recognises in full the schemes’ surpluses or deficits on the Statement of Financial Position. Actuarial gains and losses for these schemes are included within Other Comprehensive Income. Current and past service costs, curtailments and settlements are recognised within operating surplus. Interest on net pension liabilities is recognised as a finance expense.
Key assumptions used in determining the valuation of defined benefit schemes are given within critical accounting estimates and assumptions.
For defined benefit pension schemes where a debt has been, or is soon to be, crystallised, the Group and Association recognise the full liability on the Statement of Financial Position based upon a cessation valuation.
For defined contribution arrangements, the cost charged to the Statement of Comprehensive Income represents the Group’s contributions to those schemes in the financial year in which they fall due.
Strategic report Financial statem
ents
63
2. Revenue
The following is an analysis of the Group’s revenue for the year from continuing operations. This excludes investment income, which is included within finance income (see note 9a), and other income (see note 3).
Group Association
2017 £m 2016 £m 2017 £m 2016 £m
Revenue from the sale of properties 24.1 28.2 9.1 3.3
Revenue from the rendering of services 646.8 640.8 426.6 419.9
670.9 669.0 435.7 423.2
3. Other income
Group Association
2017 £m 2016 £m 2017 £m 2016 £m
Gift aid and distribution of reserves - - 6.5 16.3
- - 6.5 16.3
4. Surplus for the year
Cost of sales relates to the cost of properties sold in the ordinary course of business (see note 2). Expenditure relating to the provision of services, which forms the majority of the Group’s activities, is shown within operating expenditure.
Group Association
The surplus is arrived at after charging/(crediting): 2017 £m 2016 £m 2017 £m 2016 £m
Cost of sales
Cost of inventories recognised as an expense 17.5 19.7 5.4 2.3
Operating expenditure
Rented and sheltered bad debts (note 23) 5.6 0.8 4.6 0.8
Other bad debts (note 23) (0.2) 1.1 (0.6) 0.4
Depreciation and impairment of property, plant and equipment (note 12) 38.8 40.9 33.4 33.3
Depreciation of investment property (note 13) 3.0 1.9 1.1 (0.4)
Accelerated depreciation on replaced components (included in disposals in note 12) 6.9 7.1 2.5 6.0
Amortisation of intangible assets (software) (note 11) 8.4 6.4 8.4 6.4
Impairment of goodwill (note 11) - 0.2 - 0.2
Impairment of investment property (note 13) 6.8 - - -
Operating lease rentals 2.8 1.9 2.8 1.6
Other gains and losses
Surplus on sale of property, plant and equipment (note 7) 3.2 17.4 2.5 5.4
(Deficit)/surplus on sale of investments (note 7) (0.2) 0.3 (0.3) 0.3
Gains on business combinations
Net gains on business combinations (note 35) - - 67.2 -
NOTES TO THE FINANCIAL STATEMENTS
FIN
AN
CIA
L ST
AT
EM
EN
TS
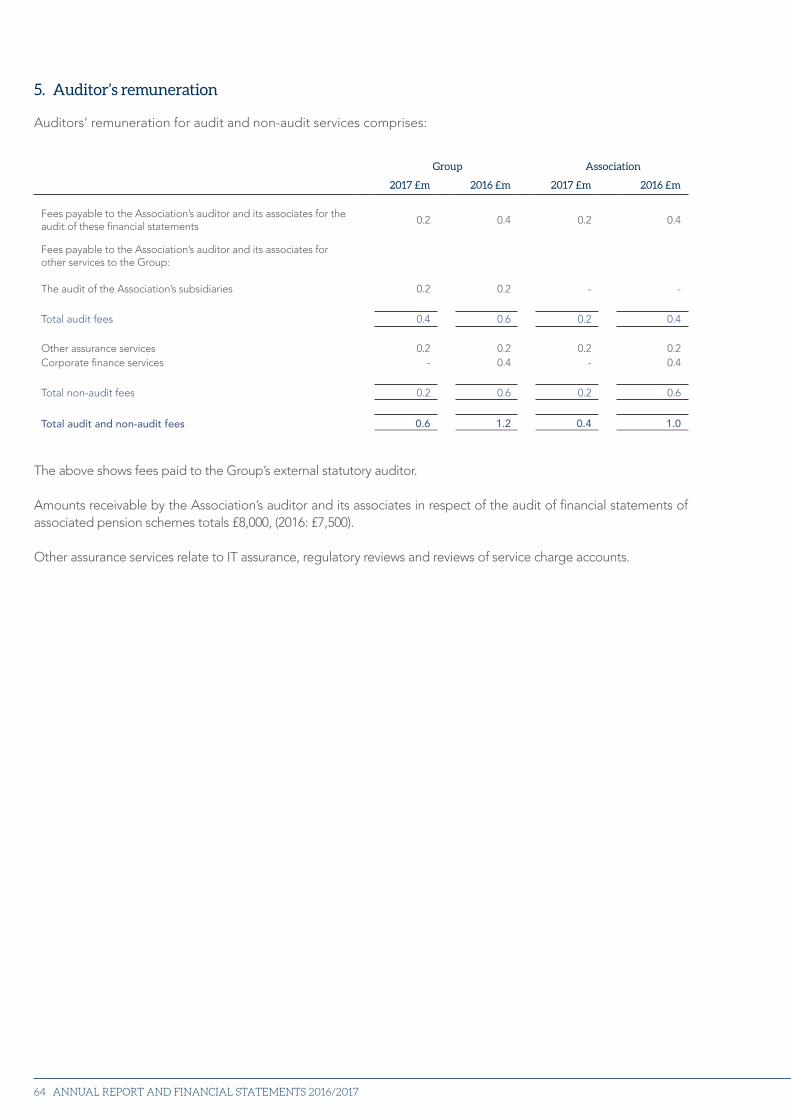
ANNUAL REPORT AND FINANCIAL STATEMENTS 2016/201764
5. Auditor’s remuneration
Auditors’ remuneration for audit and non-audit services comprises:
Group Association
2017 £m 2016 £m 2017 £m 2016 £m
Fees payable to the Association’s auditor and its associates for the audit of these financial statements
0.2 0.4 0.2 0.4
Fees payable to the Association’s auditor and its associates for other services to the Group:
The audit of the Association’s subsidiaries 0.2 0.2 - -
Total audit fees 0.4 0.6 0.2 0.4
Other assurance services 0.2 0.2 0.2 0.2Corporate finance services - 0.4 - 0.4
Total non-audit fees 0.2 0.6 0.2 0.6
Total audit and non-audit fees 0.6 1.2 0.4 1.0
The above shows fees paid to the Group’s external statutory auditor.
Amounts receivable by the Association’s auditor and its associates in respect of the audit of financial statements of associated pension schemes totals £8,000, (2016: £7,500).
Other assurance services relate to IT assurance, regulatory reviews and reviews of service charge accounts.
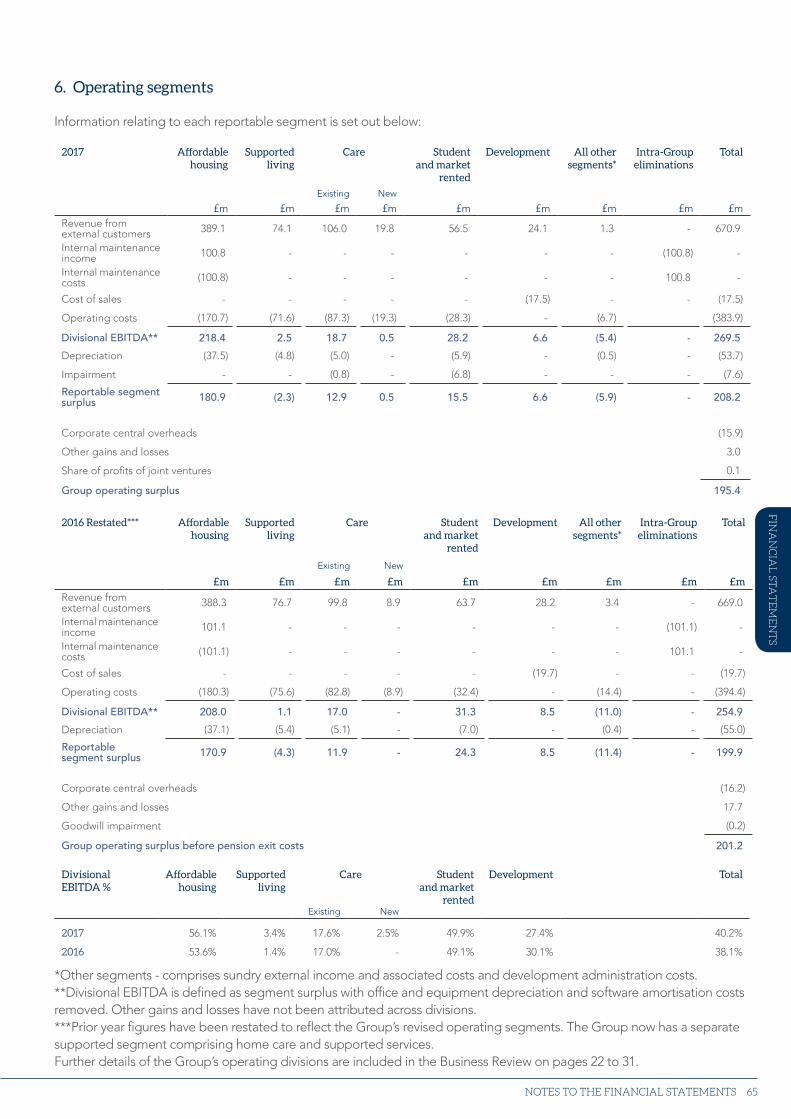
Strategic report Financial statem
ents
65
6. Operating segments
Information relating to each reportable segment is set out below:
2017 Affordable housing
Supported living
Care Student and market
rented
Development All other segments*
Intra-Group eliminations
Total
Existing New
£m £m £m £m £m £m £m £m £mRevenue from external customers 389.1 74.1 106.0 19.8 56.5 24.1 1.3 - 670.9
Internal maintenance income 100.8 - - - - - - (100.8) -
Internal maintenance costs (100.8) - - - - - - 100.8 -
Cost of sales - - - - - (17.5) - - (17.5)
Operating costs (170.7) (71.6) (87.3) (19.3) (28.3) - (6.7) (383.9)
Divisional EBITDA** 218.4 2.5 18.7 0.5 28.2 6.6 (5.4) - 269.5
Depreciation (37.5) (4.8) (5.0) - (5.9) - (0.5) - (53.7)
Impairment - - (0.8) - (6.8) - - - (7.6)
Reportable segment surplus 180.9 (2.3) 12.9 0.5 15.5 6.6 (5.9) - 208.2
Corporate central overheads (15.9)
Other gains and losses 3.0
Share of profits of joint ventures 0.1
Group operating surplus 195.4
2016 Restated*** Affordable
housingSupported
living Care Student
and market rented
Development All other segments*
Intra-Group eliminations
Total
Existing New
£m £m £m £m £m £m £m £m £m
Revenue from external customers 388.3 76.7 99.8 8.9 63.7 28.2 3.4 - 669.0
Internal maintenance income 101.1 - - - - - - (101.1) -
Internal maintenance costs (101.1) - - - - - - 101.1 -
Cost of sales - - - - - (19.7) - - (19.7)
Operating costs (180.3) (75.6) (82.8) (8.9) (32.4) - (14.4) - (394.4)
Divisional EBITDA** 208.0 1.1 17.0 - 31.3 8.5 (11.0) - 254.9
Depreciation (37.1) (5.4) (5.1) - (7.0) - (0.4) - (55.0)
Reportable segment surplus 170.9 (4.3) 11.9 - 24.3 8.5 (11.4) - 199.9
Corporate central overheads (16.2)
Other gains and losses 17.7
Goodwill impairment (0.2)
Group operating surplus before pension exit costs 201.2
Divisional EBITDA %
Affordable housing
Supported living
Care Student and market
rented
Development Total
Existing New
2017 56.1% 3.4% 17.6% 2.5% 49.9% 27.4% 40.2%
2016 53.6% 1.4% 17.0% - 49.1% 30.1% 38.1%
*Other segments - comprises sundry external income and associated costs and development administration costs.**Divisional EBITDA is defined as segment surplus with office and equipment depreciation and software amortisation costs removed. Other gains and losses have not been attributed across divisions.***Prior year figures have been restated to reflect the Group’s revised operating segments. The Group now has a separate supported segment comprising home care and supported services.Further details of the Group’s operating divisions are included in the Business Review on pages 22 to 31.
NOTES TO THE FINANCIAL STATEMENTS
FIN
AN
CIA
L ST
AT
EM
EN
TS
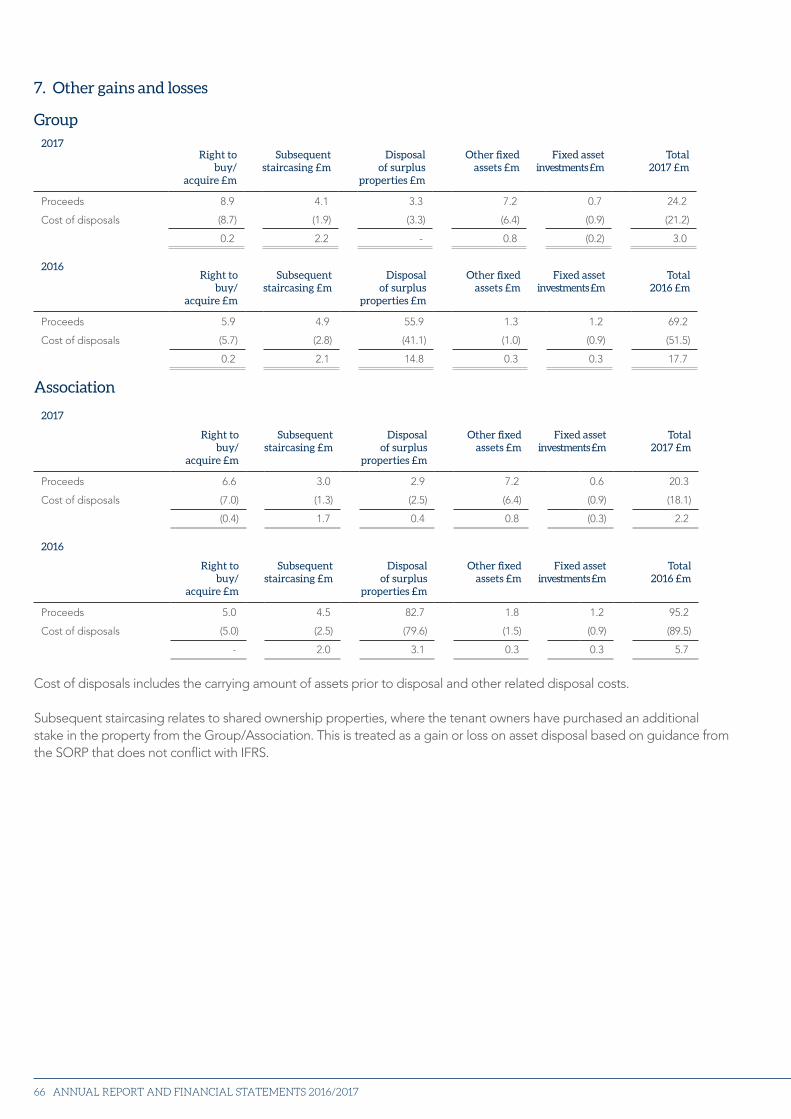
ANNUAL REPORT AND FINANCIAL STATEMENTS 2016/201766
7. Other gains and losses
Group2017
Right to buy/
acquire £m
Subsequent staircasing £m
Disposal of surplus
properties £m
Other fixed assets £m
Fixed asset investments £m
Total2017 £m
Proceeds 8.9 4.1 3.3 7.2 0.7 24.2
Cost of disposals (8.7) (1.9) (3.3) (6.4) (0.9) (21.2)
0.2 2.2 - 0.8 (0.2) 3.0
2016Right to
buy/acquire £m
Subsequent staircasing £m
Disposal of surplus
properties £m
Other fixed assets £m
Fixed asset investments £m
Total2016 £m
Proceeds 5.9 4.9 55.9 1.3 1.2 69.2
Cost of disposals (5.7) (2.8) (41.1) (1.0) (0.9) (51.5)
0.2 2.1 14.8 0.3 0.3 17.7
Association
2017
Right to buy/
acquire £m
Subsequent staircasing £m
Disposal of surplus
properties £m
Other fixed assets £m
Fixed asset investments £m
Total2017 £m
Proceeds 6.6 3.0 2.9 7.2 0.6 20.3
Cost of disposals (7.0) (1.3) (2.5) (6.4) (0.9) (18.1)
(0.4) 1.7 0.4 0.8 (0.3) 2.2
2016
Right to buy/
acquire £m
Subsequent staircasing £m
Disposal of surplus
properties £m
Other fixed assets £m
Fixed asset investments £m
Total2016 £m
Proceeds 5.0 4.5 82.7 1.8 1.2 95.2
Cost of disposals (5.0) (2.5) (79.6) (1.5) (0.9) (89.5)
- 2.0 3.1 0.3 0.3 5.7
Cost of disposals includes the carrying amount of assets prior to disposal and other related disposal costs.
Subsequent staircasing relates to shared ownership properties, where the tenant owners have purchased an additional stake in the property from the Group/Association. This is treated as a gain or loss on asset disposal based on guidance from the SORP that does not conflict with IFRS.
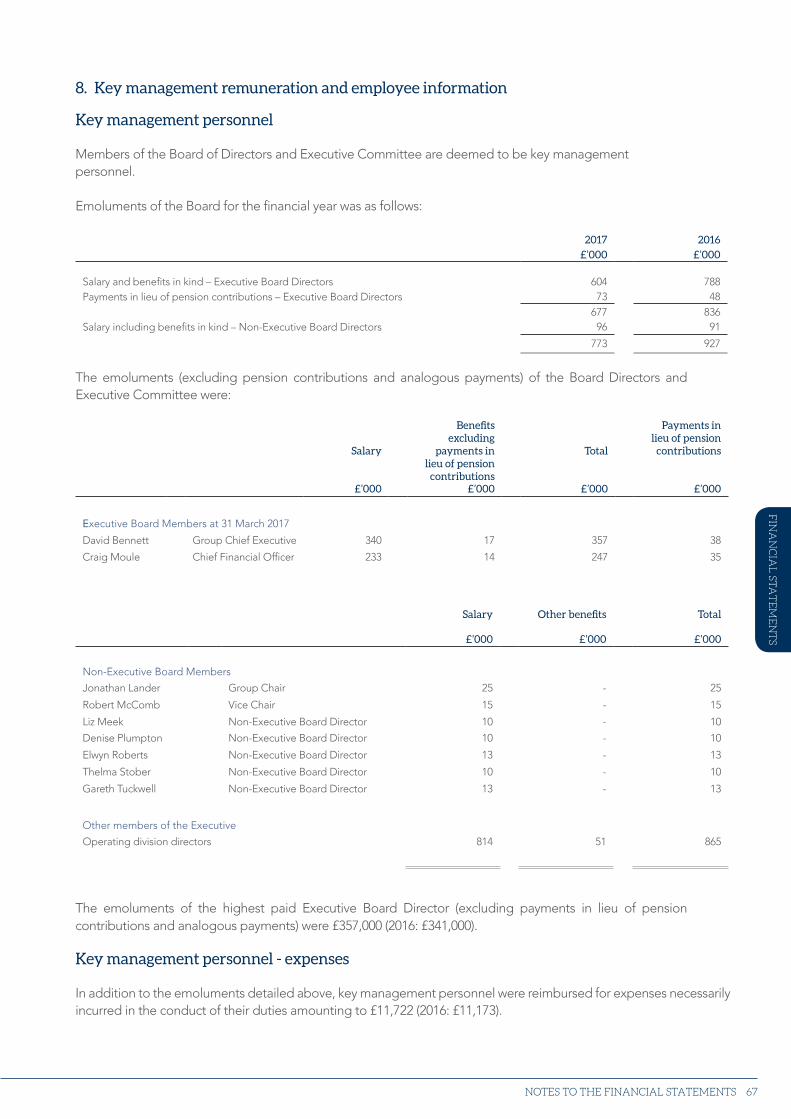
Strategic report Financial statem
ents
67
8. Key management remuneration and employee information
Key management personnel
Members of the Board of Directors and Executive Committee are deemed to be key management personnel.
Emoluments of the Board for the financial year was as follows:
2017 2016
£’000 £’000
Salary and benefits in kind – Executive Board Directors 604 788Payments in lieu of pension contributions – Executive Board Directors 73 48
677 836Salary including benefits in kind – Non-Executive Board Directors 96 91
773 927
The emoluments (excluding pension contributions and analogous payments) of the Board Directors and Executive Committee were:
Salary
Benefits excluding
payments in lieu of pension
contributions
Total
Payments in lieu of pension
contributions
£’000 £’000 £’000 £’000
Executive Board Members at 31 March 2017
David Bennett Group Chief Executive 340 17 357 38
Craig Moule Chief Financial Officer 233 14 247 35
Salary Other benefits Total
£’000 £’000 £’000
Non-Executive Board Members
Jonathan Lander Group Chair 25 - 25
Robert McComb Vice Chair 15 - 15
Liz Meek Non-Executive Board Director 10 - 10
Denise Plumpton Non-Executive Board Director 10 - 10
Elwyn Roberts Non-Executive Board Director 13 - 13
Thelma Stober Non-Executive Board Director 10 - 10
Gareth Tuckwell Non-Executive Board Director 13 - 13
Other members of the Executive Operating division directors 814 51 865
The emoluments of the highest paid Executive Board Director (excluding payments in lieu of pension contributions and analogous payments) were £357,000 (2016: £341,000).
FIN
AN
CIA
L ST
AT
EM
EN
TS
NOTES TO THE FINANCIAL STATEMENTS
Key management personnel - expenses
In addition to the emoluments detailed above, key management personnel were reimbursed for expenses necessarily incurred in the conduct of their duties amounting to £11,722 (2016: £11,173).
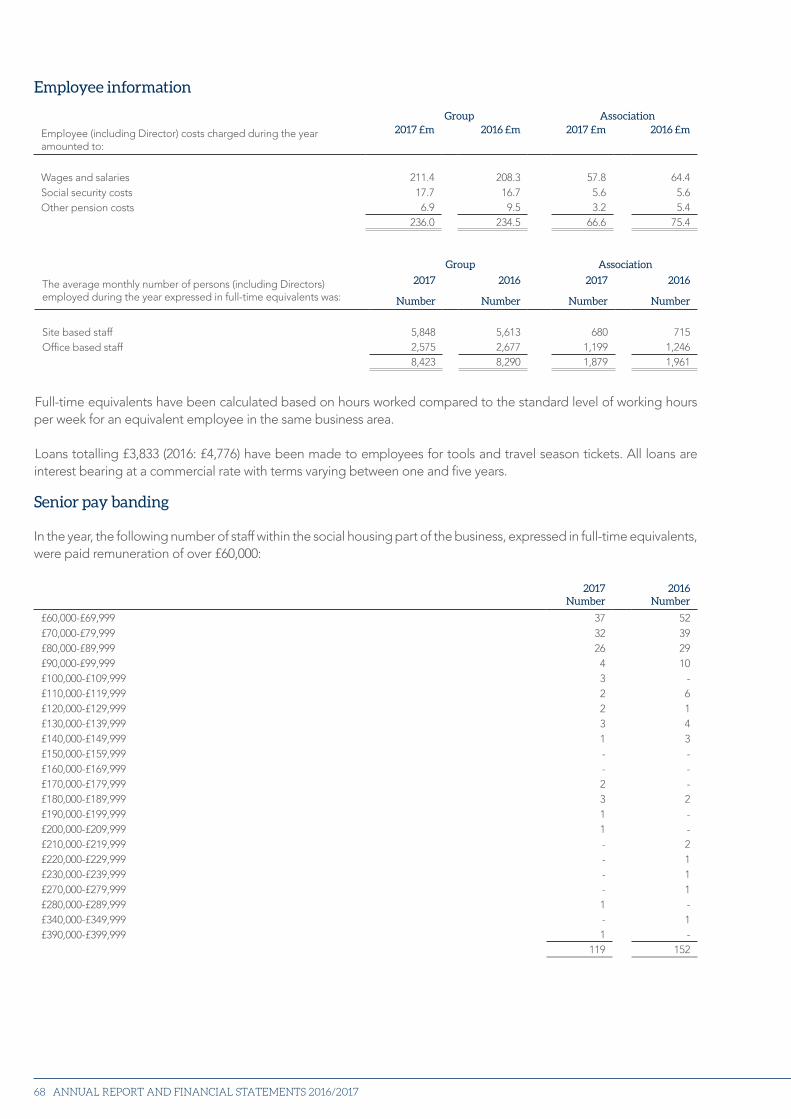
ANNUAL REPORT AND FINANCIAL STATEMENTS 2016/201768
Employee information
Group Association
Employee (including Director) costs charged during the year amounted to:
2017 £m 2016 £m 2017 £m 2016 £m
Wages and salaries 211.4 208.3 57.8 64.4Social security costs 17.7 16.7 5.6 5.6Other pension costs 6.9 9.5 3.2 5.4
236.0 234.5 66.6 75.4
Group Association
The average monthly number of persons (including Directors) employed during the year expressed in full-time equivalents was:
2017
Number
2016
Number
2017
Number
2016
Number
Site based staff 5,848 5,613 680 715Office based staff 2,575 2,677 1,199 1,246
8,423 8,290 1,879 1,961
Full-time equivalents have been calculated based on hours worked compared to the standard level of working hours per week for an equivalent employee in the same business area.
Loans totalling £3,833 (2016: £4,776) have been made to employees for tools and travel season tickets. All loans are interest bearing at a commercial rate with terms varying between one and five years.
Senior pay banding
In the year, the following number of staff within the social housing part of the business, expressed in full-time equivalents, were paid remuneration of over £60,000:
2017 Number
2016 Number
£60,000-£69,999 37 52£70,000-£79,999 32 39£80,000-£89,999 26 29£90,000-£99,999 4 10£100,000-£109,999 3 -£110,000-£119,999 2 6£120,000-£129,999 2 1£130,000-£139,999 3 4£140,000-£149,999 1 3£150,000-£159,999 - -£160,000-£169,999 - -£170,000-£179,999 2 -£180,000-£189,999 3 2£190,000-£199,999 1 -£200,000-£209,999 1 -£210,000-£219,999 - 2£220,000-£229,999 - 1£230,000-£239,999 - 1£270,000-£279,999 - 1£280,000-£289,999 1 -£340,000-£349,999 - 1£390,000-£399,999 1 -
119 152
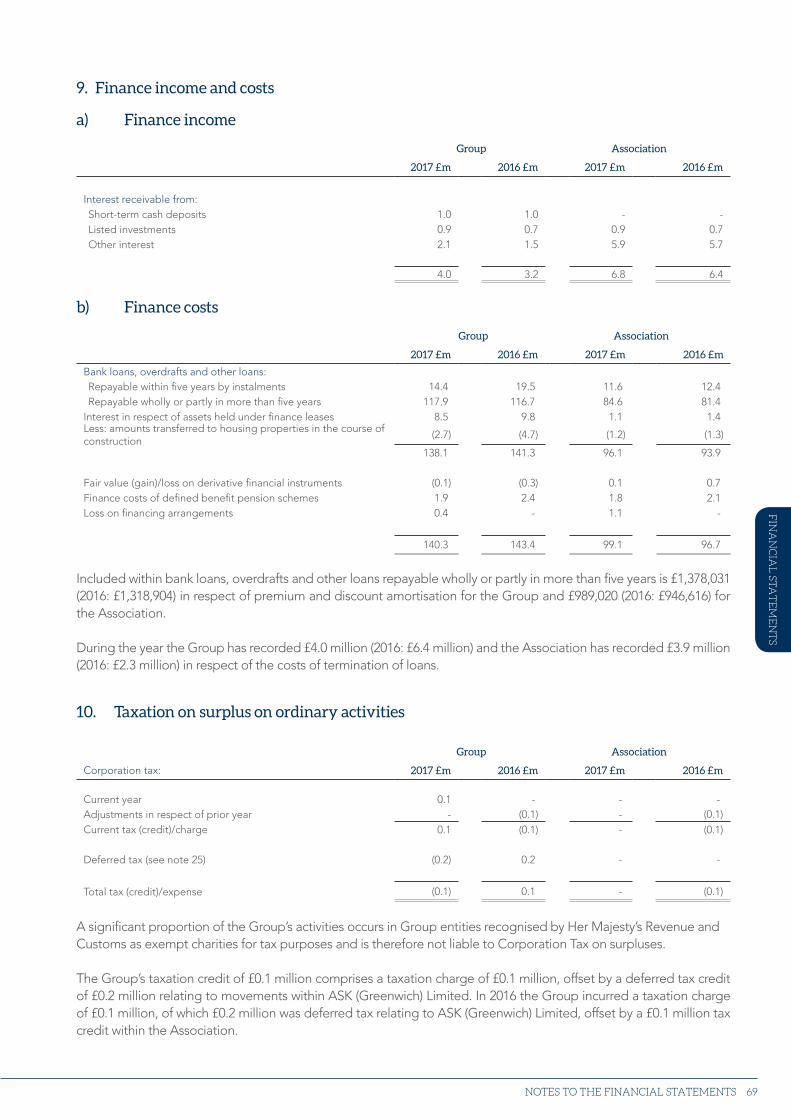
Strategic report Financial statem
ents
69
9. Finance income and costs
a) Finance income
Group Association
2017 £m 2016 £m 2017 £m 2016 £m
Interest receivable from:Short-term cash deposits 1.0 1.0 - -Listed investments 0.9 0.7 0.9 0.7Other interest 2.1 1.5 5.9 5.7
4.0 3.2 6.8 6.4
b) Finance costs
Group Association
2017 £m 2016 £m 2017 £m 2016 £m
Bank loans, overdrafts and other loans:Repayable within five years by instalments 14.4 19.5 11.6 12.4Repayable wholly or partly in more than five years 117.9 116.7 84.6 81.4
Interest in respect of assets held under finance leases 8.5 9.8 1.1 1.4Less: amounts transferred to housing properties in the course of construction
(2.7) (4.7) (1.2) (1.3)
138.1 141.3 96.1 93.9
Fair value (gain)/loss on derivative financial instruments (0.1) (0.3) 0.1 0.7Finance costs of defined benefit pension schemes 1.9 2.4 1.8 2.1Loss on financing arrangements 0.4 - 1.1 -
140.3 143.4 99.1 96.7
Included within bank loans, overdrafts and other loans repayable wholly or partly in more than five years is £1,378,031 (2016: £1,318,904) in respect of premium and discount amortisation for the Group and £989,020 (2016: £946,616) for the Association.
During the year the Group has recorded £4.0 million (2016: £6.4 million) and the Association has recorded £3.9 million (2016: £2.3 million) in respect of the costs of termination of loans.
10. Taxation on surplus on ordinary activities
Group Association
Corporation tax: 2017 £m 2016 £m 2017 £m 2016 £m
Current year 0.1 - - -Adjustments in respect of prior year - (0.1) - (0.1)Current tax (credit)/charge 0.1 (0.1) - (0.1)
Deferred tax (see note 25) (0.2) 0.2 - -
Total tax (credit)/expense (0.1) 0.1 - (0.1)
A significant proportion of the Group’s activities occurs in Group entities recognised by Her Majesty’s Revenue and Customs as exempt charities for tax purposes and is therefore not liable to Corporation Tax on surpluses.
The Group’s taxation credit of £0.1 million comprises a taxation charge of £0.1 million, offset by a deferred tax credit of £0.2 million relating to movements within ASK (Greenwich) Limited. In 2016 the Group incurred a taxation charge of £0.1 million, of which £0.2 million was deferred tax relating to ASK (Greenwich) Limited, offset by a £0.1 million tax credit within the Association.
NOTES TO THE FINANCIAL STATEMENTS
FIN
AN
CIA
L ST
AT
EM
EN
TS
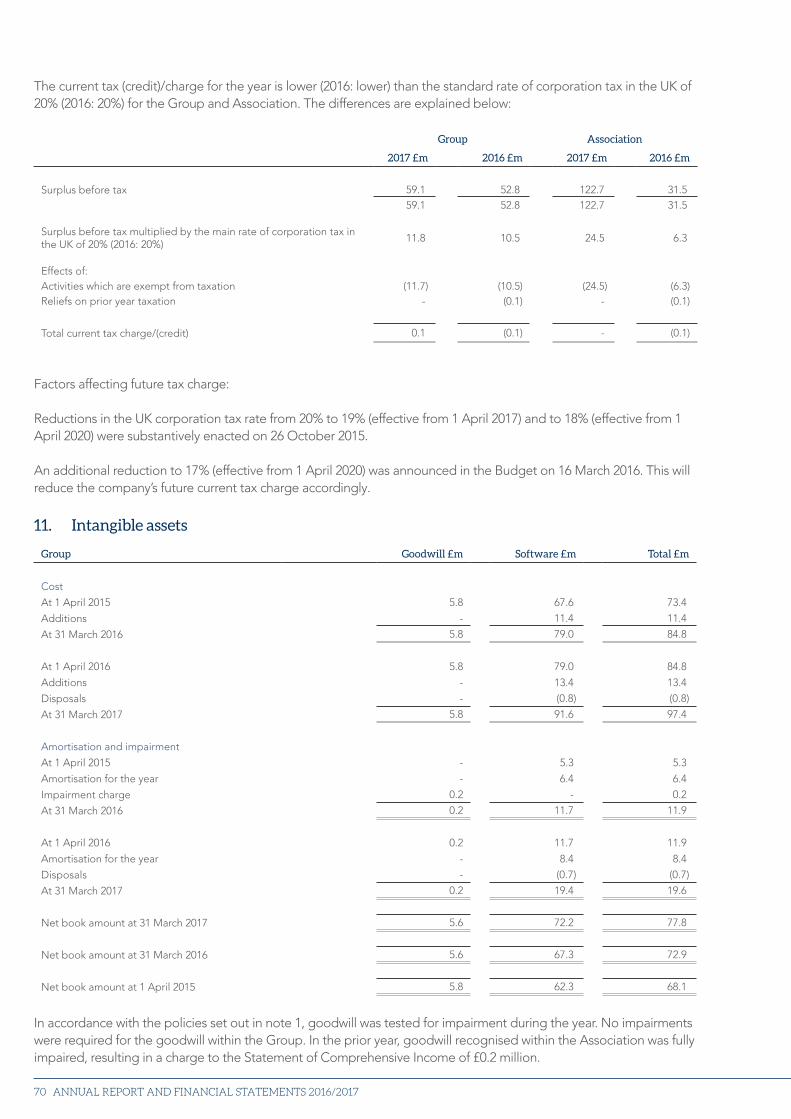
ANNUAL REPORT AND FINANCIAL STATEMENTS 2016/201770
The current tax (credit)/charge for the year is lower (2016: lower) than the standard rate of corporation tax in the UK of 20% (2016: 20%) for the Group and Association. The differences are explained below:
Group Association
2017 £m 2016 £m 2017 £m 2016 £m
Surplus before tax 59.1 52.8 122.7 31.559.1 52.8 122.7 31.5
Surplus before tax multiplied by the main rate of corporation tax in the UK of 20% (2016: 20%)
11.8 10.5 24.5 6.3
Effects of:Activities which are exempt from taxation (11.7) (10.5) (24.5) (6.3)Reliefs on prior year taxation - (0.1) - (0.1)
Total current tax charge/(credit) 0.1 (0.1) - (0.1)
Factors affecting future tax charge:
Reductions in the UK corporation tax rate from 20% to 19% (effective from 1 April 2017) and to 18% (effective from 1 April 2020) were substantively enacted on 26 October 2015.
An additional reduction to 17% (effective from 1 April 2020) was announced in the Budget on 16 March 2016. This will reduce the company’s future current tax charge accordingly.
11. Intangible assets
Group Goodwill £m Software £m Total £m
Cost
At 1 April 2015 5.8 67.6 73.4
Additions - 11.4 11.4
At 31 March 2016 5.8 79.0 84.8
At 1 April 2016 5.8 79.0 84.8
Additions - 13.4 13.4
Disposals - (0.8) (0.8)
At 31 March 2017 5.8 91.6 97.4
Amortisation and impairment
At 1 April 2015 - 5.3 5.3
Amortisation for the year - 6.4 6.4
Impairment charge 0.2 - 0.2
At 31 March 2016 0.2 11.7 11.9
At 1 April 2016 0.2 11.7 11.9
Amortisation for the year - 8.4 8.4
Disposals - (0.7) (0.7)
At 31 March 2017 0.2 19.4 19.6
Net book amount at 31 March 2017 5.6 72.2 77.8
Net book amount at 31 March 2016 5.6 67.3 72.9
Net book amount at 1 April 2015 5.8 62.3 68.1
In accordance with the policies set out in note 1, goodwill was tested for impairment during the year. No impairments were required for the goodwill within the Group. In the prior year, goodwill recognised within the Association was fully impaired, resulting in a charge to the Statement of Comprehensive Income of £0.2 million.
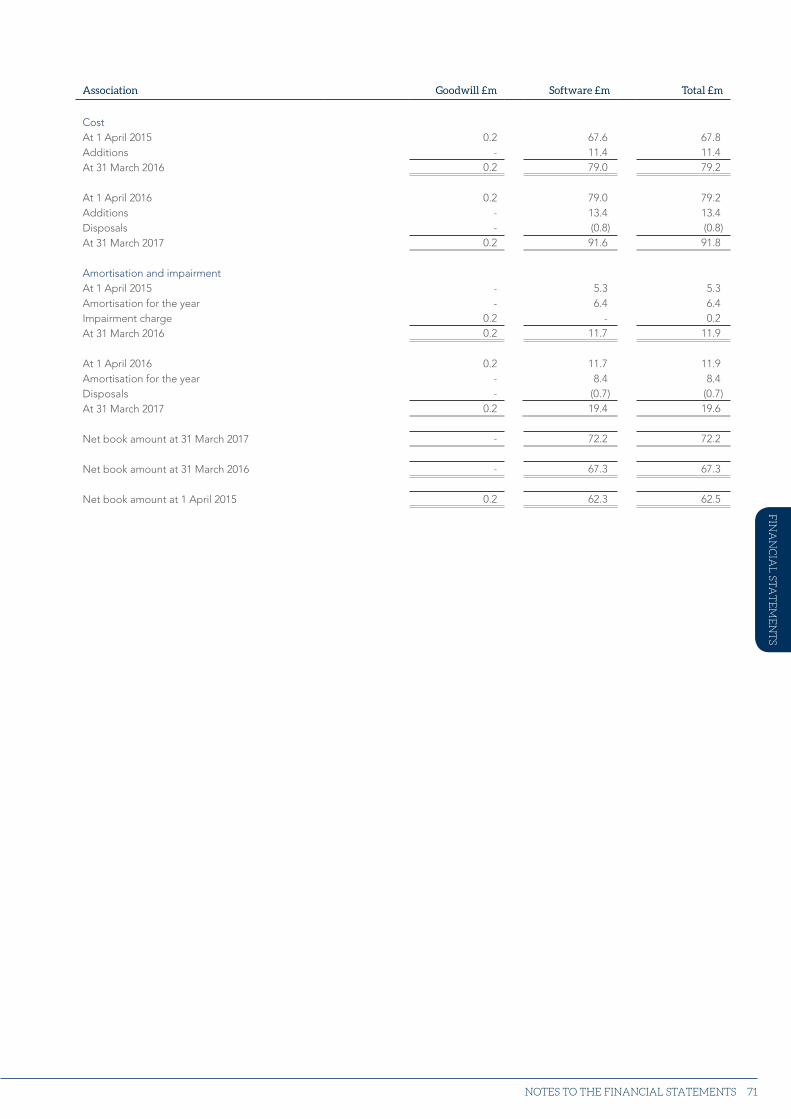
Strategic report Financial statem
ents
71
Association Goodwill £m Software £m Total £m
CostAt 1 April 2015 0.2 67.6 67.8Additions - 11.4 11.4At 31 March 2016 0.2 79.0 79.2
At 1 April 2016 0.2 79.0 79.2Additions - 13.4 13.4Disposals - (0.8) (0.8)At 31 March 2017 0.2 91.6 91.8
Amortisation and impairmentAt 1 April 2015 - 5.3 5.3Amortisation for the year - 6.4 6.4Impairment charge 0.2 - 0.2At 31 March 2016 0.2 11.7 11.9
At 1 April 2016 0.2 11.7 11.9Amortisation for the year - 8.4 8.4Disposals - (0.7) (0.7)At 31 March 2017 0.2 19.4 19.6
Net book amount at 31 March 2017 - 72.2 72.2
Net book amount at 31 March 2016 - 67.3 67.3
Net book amount at 1 April 2015 0.2 62.3 62.5
NOTES TO THE FINANCIAL STATEMENTS
FIN
AN
CIA
L ST
AT
EM
EN
TS
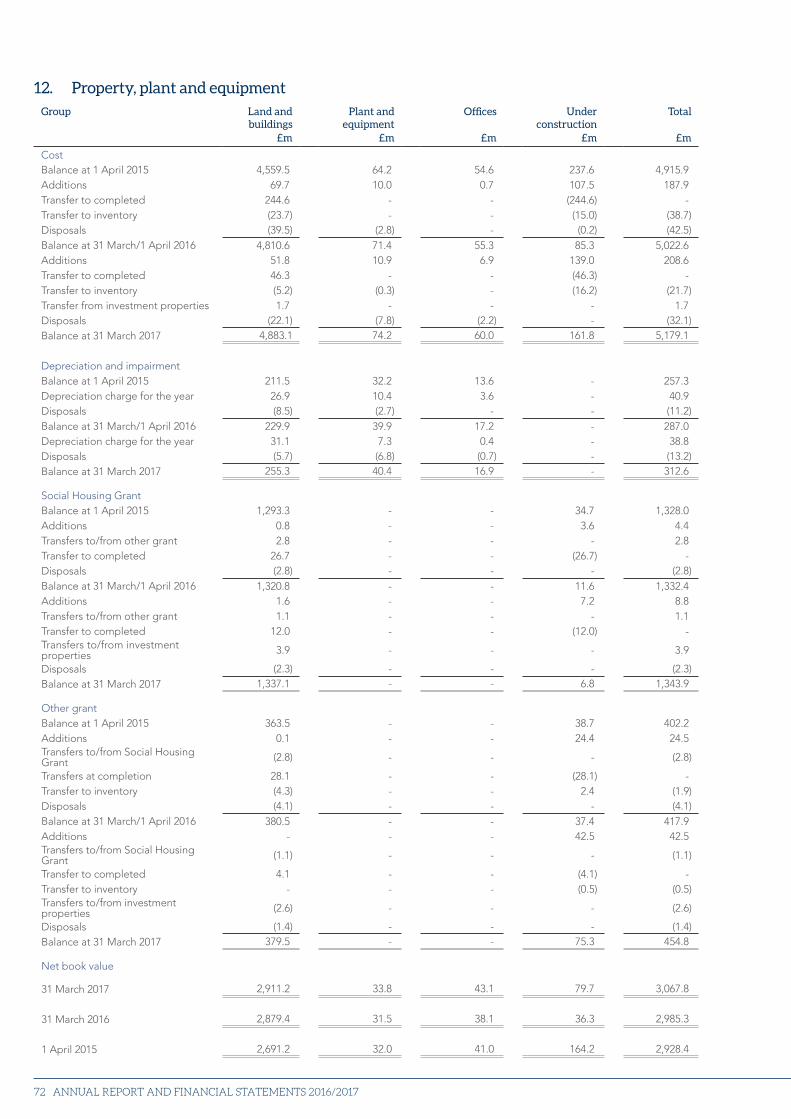
ANNUAL REPORT AND FINANCIAL STATEMENTS 2016/201772
12. Property, plant and equipmentGroup Land and
buildingsPlant and
equipmentOffices Under
constructionTotal
£m £m £m £m £m
CostBalance at 1 April 2015 4,559.5 64.2 54.6 237.6 4,915.9Additions 69.7 10.0 0.7 107.5 187.9Transfer to completed 244.6 - - (244.6) -Transfer to inventory (23.7) - - (15.0) (38.7)Disposals (39.5) (2.8) - (0.2) (42.5)Balance at 31 March/1 April 2016 4,810.6 71.4 55.3 85.3 5,022.6Additions 51.8 10.9 6.9 139.0 208.6Transfer to completed 46.3 - - (46.3) -Transfer to inventory (5.2) (0.3) - (16.2) (21.7)Transfer from investment properties 1.7 - - - 1.7Disposals (22.1) (7.8) (2.2) - (32.1)Balance at 31 March 2017 4,883.1 74.2 60.0 161.8 5,179.1
Depreciation and impairmentBalance at 1 April 2015 211.5 32.2 13.6 - 257.3Depreciation charge for the year 26.9 10.4 3.6 - 40.9Disposals (8.5) (2.7) - - (11.2)Balance at 31 March/1 April 2016 229.9 39.9 17.2 - 287.0Depreciation charge for the year 31.1 7.3 0.4 - 38.8Disposals (5.7) (6.8) (0.7) - (13.2)Balance at 31 March 2017 255.3 40.4 16.9 - 312.6
Social Housing GrantBalance at 1 April 2015 1,293.3 - - 34.7 1,328.0Additions 0.8 - - 3.6 4.4Transfers to/from other grant 2.8 - - - 2.8Transfer to completed 26.7 - - (26.7) -Disposals (2.8) - - - (2.8)Balance at 31 March/1 April 2016 1,320.8 - - 11.6 1,332.4Additions 1.6 - - 7.2 8.8Transfers to/from other grant 1.1 - - - 1.1Transfer to completed 12.0 - - (12.0) -Transfers to/from investmentproperties 3.9 - - - 3.9
Disposals (2.3) - - - (2.3)Balance at 31 March 2017 1,337.1 - - 6.8 1,343.9
Other grantBalance at 1 April 2015 363.5 - - 38.7 402.2Additions 0.1 - - 24.4 24.5Transfers to/from Social HousingGrant (2.8) - - - (2.8)
Transfers at completion 28.1 - - (28.1) -Transfer to inventory (4.3) - - 2.4 (1.9)Disposals (4.1) - - - (4.1)Balance at 31 March/1 April 2016 380.5 - - 37.4 417.9Additions - - - 42.5 42.5Transfers to/from Social Housing Grant (1.1) - - - (1.1)
Transfer to completed 4.1 - - (4.1) -Transfer to inventory - - - (0.5) (0.5)Transfers to/from investmentproperties (2.6) - - - (2.6)
Disposals (1.4) - - - (1.4)Balance at 31 March 2017 379.5 - - 75.3 454.8
Net book value
31 March 2017 2,911.2 33.8 43.1 79.7 3,067.8
31 March 2016 2,879.4 31.5 38.1 36.3 2,985.3
1 April 2015 2,691.2 32.0 41.0 164.2 2,928.4
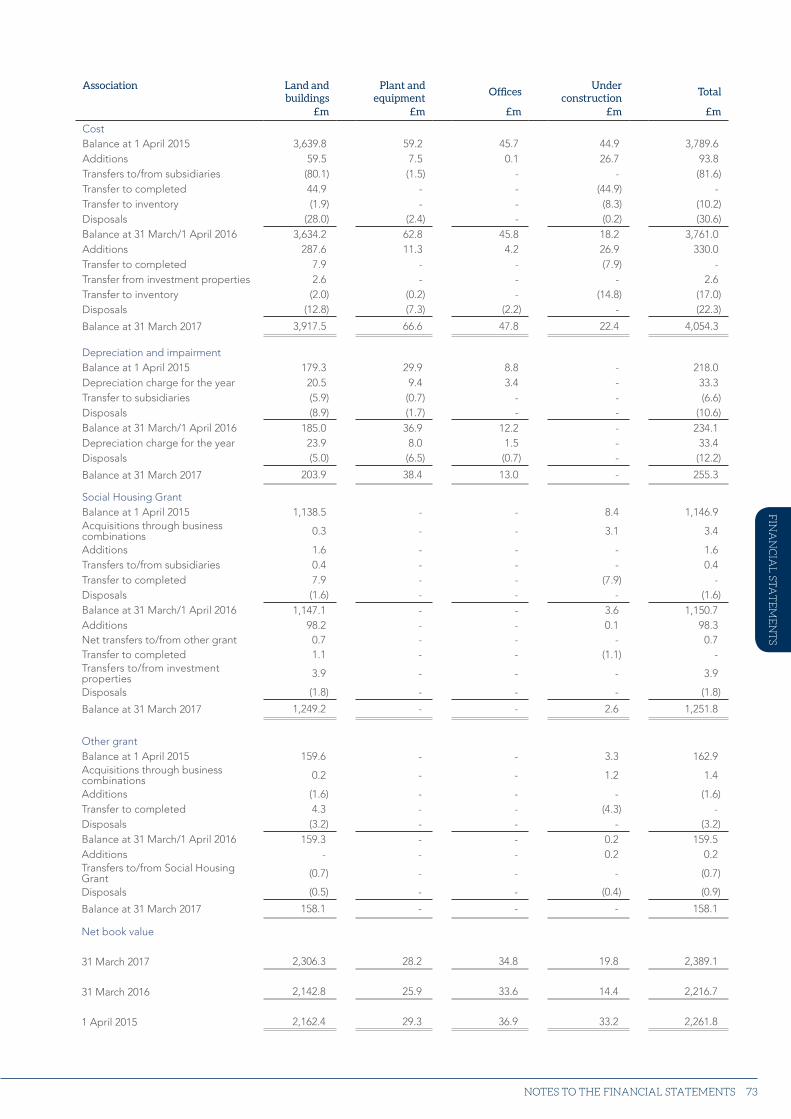
Strategic report Financial statem
ents
73
Association Land and buildings
Plant and equipment
OfficesUnder
constructionTotal
£m £m £m £m £m
CostBalance at 1 April 2015 3,639.8 59.2 45.7 44.9 3,789.6Additions 59.5 7.5 0.1 26.7 93.8Transfers to/from subsidiaries (80.1) (1.5) - - (81.6)Transfer to completed 44.9 - - (44.9) -Transfer to inventory (1.9) - - (8.3) (10.2)Disposals (28.0) (2.4) - (0.2) (30.6)Balance at 31 March/1 April 2016 3,634.2 62.8 45.8 18.2 3,761.0Additions 287.6 11.3 4.2 26.9 330.0Transfer to completed 7.9 - - (7.9) -Transfer from investment properties 2.6 - - - 2.6Transfer to inventory (2.0) (0.2) - (14.8) (17.0)Disposals (12.8) (7.3) (2.2) - (22.3)
Balance at 31 March 2017 3,917.5 66.6 47.8 22.4 4,054.3
Depreciation and impairmentBalance at 1 April 2015 179.3 29.9 8.8 - 218.0Depreciation charge for the year 20.5 9.4 3.4 - 33.3Transfer to subsidiaries (5.9) (0.7) - - (6.6)Disposals (8.9) (1.7) - - (10.6)Balance at 31 March/1 April 2016 185.0 36.9 12.2 - 234.1Depreciation charge for the year 23.9 8.0 1.5 - 33.4Disposals (5.0) (6.5) (0.7) - (12.2)
Balance at 31 March 2017 203.9 38.4 13.0 - 255.3
Social Housing GrantBalance at 1 April 2015 1,138.5 - - 8.4 1,146.9Acquisitions through businesscombinations 0.3 - - 3.1 3.4
Additions 1.6 - - - 1.6Transfers to/from subsidiaries 0.4 - - - 0.4Transfer to completed 7.9 - - (7.9) -Disposals (1.6) - - - (1.6)Balance at 31 March/1 April 2016 1,147.1 - - 3.6 1,150.7Additions 98.2 - - 0.1 98.3Net transfers to/from other grant 0.7 - - - 0.7Transfer to completed 1.1 - - (1.1) -Transfers to/from investmentproperties 3.9 - - - 3.9
Disposals (1.8) - - - (1.8)
Balance at 31 March 2017 1,249.2 - - 2.6 1,251.8
Other grantBalance at 1 April 2015 159.6 - - 3.3 162.9Acquisitions through businesscombinations 0.2 - - 1.2 1.4
Additions (1.6) - - - (1.6)Transfer to completed 4.3 - - (4.3) -Disposals (3.2) - - - (3.2)Balance at 31 March/1 April 2016 159.3 - - 0.2 159.5Additions - - - 0.2 0.2Transfers to/from Social HousingGrant (0.7) - - - (0.7)
Disposals (0.5) - - (0.4) (0.9)
Balance at 31 March 2017 158.1 - - - 158.1
Net book value
31 March 2017 2,306.3 28.2 34.8 19.8 2,389.1
31 March 2016 2,142.8 25.9 33.6 14.4 2,216.7
1 April 2015 2,162.4 29.3 36.9 33.2 2,261.8
NOTES TO THE FINANCIAL STATEMENTS
FIN
AN
CIA
L ST
AT
EM
EN
TS
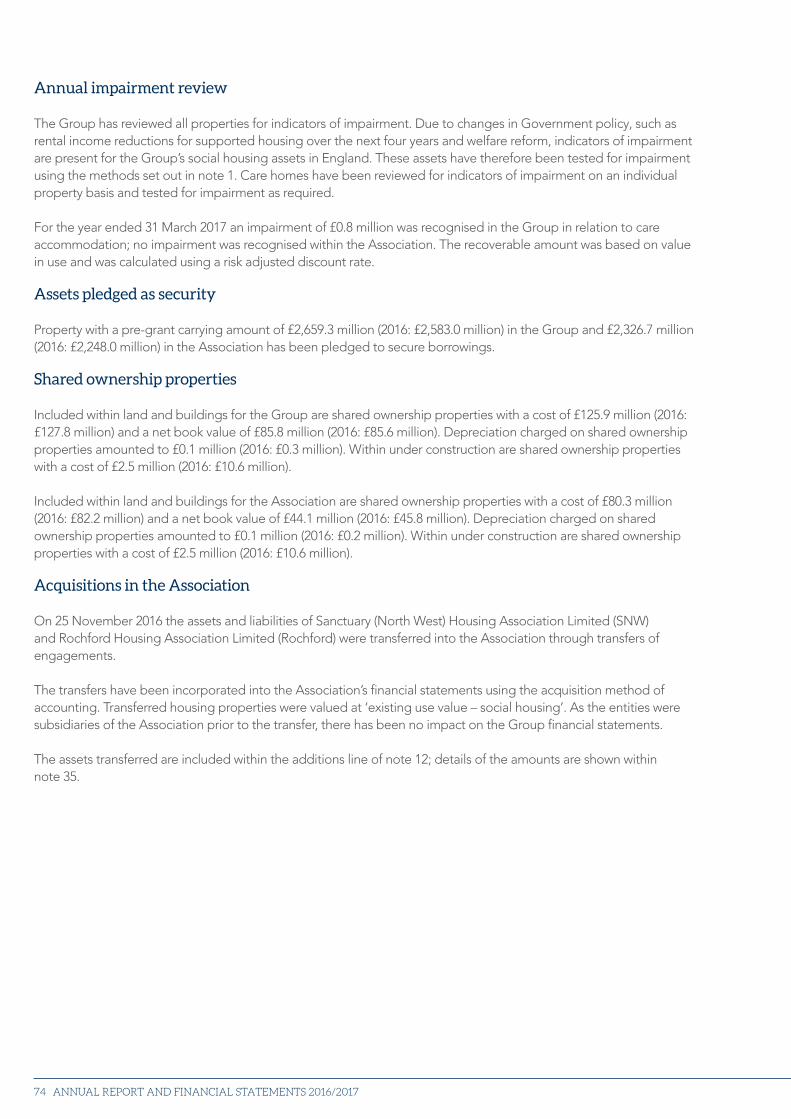
ANNUAL REPORT AND FINANCIAL STATEMENTS 2016/201774
Annual impairment review
The Group has reviewed all properties for indicators of impairment. Due to changes in Government policy, such as rental income reductions for supported housing over the next four years and welfare reform, indicators of impairment are present for the Group’s social housing assets in England. These assets have therefore been tested for impairment using the methods set out in note 1. Care homes have been reviewed for indicators of impairment on an individual property basis and tested for impairment as required.
For the year ended 31 March 2017 an impairment of £0.8 million was recognised in the Group in relation to care accommodation; no impairment was recognised within the Association. The recoverable amount was based on value in use and was calculated using a risk adjusted discount rate.
Assets pledged as security
Property with a pre-grant carrying amount of £2,659.3 million (2016: £2,583.0 million) in the Group and £2,326.7 million (2016: £2,248.0 million) in the Association has been pledged to secure borrowings.
Shared ownership properties
Included within land and buildings for the Group are shared ownership properties with a cost of £125.9 million (2016: £127.8 million) and a net book value of £85.8 million (2016: £85.6 million). Depreciation charged on shared ownership properties amounted to £0.1 million (2016: £0.3 million). Within under construction are shared ownership properties with a cost of £2.5 million (2016: £10.6 million).
Included within land and buildings for the Association are shared ownership properties with a cost of £80.3 million (2016: £82.2 million) and a net book value of £44.1 million (2016: £45.8 million). Depreciation charged on shared ownership properties amounted to £0.1 million (2016: £0.2 million). Within under construction are shared ownership properties with a cost of £2.5 million (2016: £10.6 million).
Acquisitions in the Association
On 25 November 2016 the assets and liabilities of Sanctuary (North West) Housing Association Limited (SNW) and Rochford Housing Association Limited (Rochford) were transferred into the Association through transfers of engagements.
The transfers have been incorporated into the Association’s financial statements using the acquisition method of accounting. Transferred housing properties were valued at ‘existing use value – social housing’. As the entities were subsidiaries of the Association prior to the transfer, there has been no impact on the Group financial statements.
The assets transferred are included within the additions line of note 12; details of the amounts are shown within note 35.
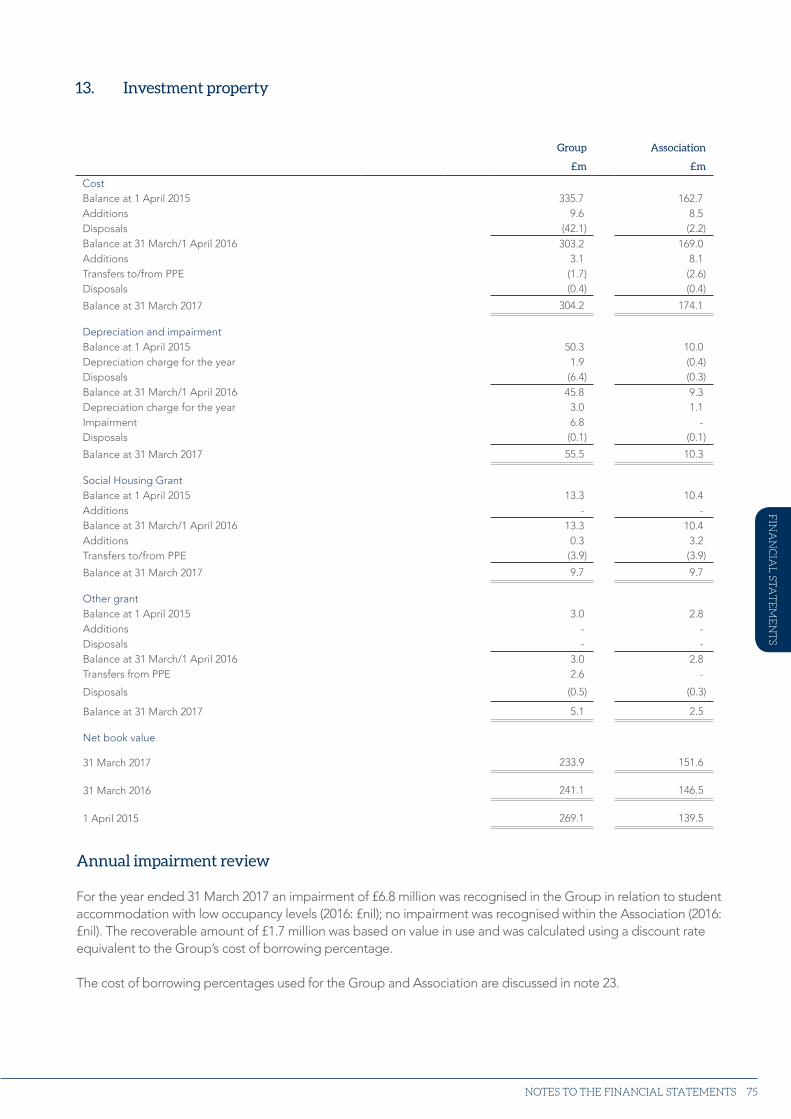
Strategic report Financial statem
ents
75
13. Investment property
Group Association
£m £m
CostBalance at 1 April 2015 335.7 162.7Additions 9.6 8.5Disposals (42.1) (2.2)Balance at 31 March/1 April 2016 303.2 169.0Additions 3.1 8.1Transfers to/from PPE (1.7) (2.6)Disposals (0.4) (0.4)
Balance at 31 March 2017 304.2 174.1
Depreciation and impairmentBalance at 1 April 2015 50.3 10.0Depreciation charge for the year 1.9 (0.4)Disposals (6.4) (0.3)Balance at 31 March/1 April 2016 45.8 9.3Depreciation charge for the year 3.0 1.1Impairment 6.8 -Disposals (0.1) (0.1)
Balance at 31 March 2017 55.5 10.3
Social Housing GrantBalance at 1 April 2015 13.3 10.4Additions - -Balance at 31 March/1 April 2016 13.3 10.4Additions 0.3 3.2Transfers to/from PPE (3.9) (3.9)
Balance at 31 March 2017 9.7 9.7
Other grantBalance at 1 April 2015 3.0 2.8Additions - -Disposals - -Balance at 31 March/1 April 2016 3.0 2.8Transfers from PPE 2.6 -
Disposals (0.5) (0.3)
Balance at 31 March 2017 5.1 2.5
Net book value
31 March 2017 233.9 151.6
31 March 2016 241.1 146.5
1 April 2015 269.1 139.5
Annual impairment review
For the year ended 31 March 2017 an impairment of £6.8 million was recognised in the Group in relation to student accommodation with low occupancy levels (2016: £nil); no impairment was recognised within the Association (2016: £nil). The recoverable amount of £1.7 million was based on value in use and was calculated using a discount rate equivalent to the Group’s cost of borrowing percentage.
The cost of borrowing percentages used for the Group and Association are discussed in note 23.
NOTES TO THE FINANCIAL STATEMENTS
FIN
AN
CIA
L ST
AT
EM
EN
TS
ANNUAL REPORT AND FINANCIAL STATEMENTS 2016/201776
Fair value of investment property
The estimated fair value of the investment property is £441.5 million (2016: £383.9 million) for the Group and £282.2 million (2016: £199.0 million) for the Association. Of this fair value, £278.8 million (2016: £184.0 million) for the Group and £256.3 million (2016: £nil) for the Association has been determined by independent valuations in accordance with RICS and the Red Book, with the remainder determined by net present value calculations based on current rent levels and expected increases. In accordance with the fair value measurement hierarchy discussed in note 23, these are deemed to be Level 3 valuations.
Restrictions
At 31 March 2017, there were no restrictions on the realisability of investment property or the remittance of income and proceeds of disposal for the Group or Association (2016: none).
Assets pledged as security
Investment property with a pre-grant carrying amount of £39.1 million (2016: £99.7 million) in the Group and £14.3 million (2016: £89.0 million) in the Association has been pledged to secure borrowings.
Assets held under finance leases
Included within investment properties for the Group are assets held under finance leases at a cost of £88.3 million (2016: £88.3 million) and a net book value of £79.4 million (2016: £80.4 million).
For the Association, included are assets held under finance leases at a cost of £20.7 million (2016: £17.8 million) and a net book value of £19.5 million (2016: £16.9 million).
Items recognised in the Statement of Comprehensive Income
Rental income from investment property during the year amounted to £42.9 million (2016: £53.8 million) for the Group and £18.8 million (2016: £18.1 million) for the Association.
The majority of the rental income detailed above relates to student property which is let on a short-term basis. The Group and Association, as lessors, do not therefore have any material future minimum lease payments receivable in respect of non-cancellable operating leases.
Direct operating expenses (including repairs and maintenance) arising from investment property that generated rental income during the year amounted to £30.5 million (2016: £32.7 million) for the Group and £13.9 million (2016: £14.9 million) for the Association.
Direct operating expenses (including repairs and maintenance) arising from investment property that did not generate rental income during the year amounted to £nil (2016: £nil) for both the Group and Association.
Strategic report Financial statem
ents
77
14. Other investments
Group Association
2017 £m 2016 £m 2017 £m 2016 £m
Available for sale assets carried at fair value
Listed investments 19.7 20.7 19.6 20.619.7 20.7 19.6 20.6
Loans and receivables carried at amortised cost
Unlisted investments 15.2 14.8 13.7 13.3
Homebuy - Investment 5.1 5.4 3.5 3.8- Grant (5.1) (5.4) (3.5) (3.8)
15.2 14.8 13.7 13.3
Total other investments 34.9 35.5 33.3 33.9
The Directors believe that the carrying value of investments is supported by their underlying net assets. The historic cost of the Group’s and Association’s listed investments is £17.2 million and £17.2 million respectively (2016: £19.4 million and £19.4 million respectively). These investments comprise gilt edged stock and other registered provider debenture stocks, which are held in accordance with the terms of certain Group loans. The security trustee has a charge over these investments.
The unlisted investments represent cash reserves held as security against borrowings either as required under the terms of the loan agreements or as substitutes for charges on stock. These reserves cannot be utilised for any other purpose than servicing the associated debt.
Reconciliation of movement in listed investments
Group Association
£m £m
As at 1 April 2015 21.5 21.4Additions 1.2 1.2Disposal (1.2) (1.2)Revaluations (0.8) (0.8)As at 31 March 2016 20.7 20.6
As at 1 April 2016 20.7 20.6Additions 4.0 4.0Disposal (5.0) (5.0)Revaluations - -As at 31 March 2017 19.7 19.6
NOTES TO THE FINANCIAL STATEMENTS
FIN
AN
CIA
L ST
AT
EM
EN
TS
ANNUAL REPORT AND FINANCIAL STATEMENTS 2016/201778
15. Derivative financial instruments
Fair value of derivative assets Group and Association
2017 £m 2016 £m
US Private Placements 3 30.4 24.030.4 24.0
The derivative financial instruments represent the fair value of the currency related swaps in place to hedge the foreign currency risk arising from interest and principal payments. They relate to $20 million 5.42% senior notes issued in April 2007 and due in 2017 and $80 million 5.83% senior notes also issued in April 2007 and due in 2037 (US Private Placements 3).
Fair value of derivative liabilities Group Association
2017 £m 2016 £m 2017 £m 2016 £m
Interest rate swap (4.4) (4.5) - -
Forward fix rate instrument - (5.0) - (5.0)
(4.4) (9.5) - (5.0)
The derivative financial instrument represents the fair value of an interest rate swap drawn under a facility agreement dated September 2002; this was put in place to hedge the interest rate risk arising from a variable rate loan. The forward fix rate instruments held in the Association were terminated in December 2016.
Further details of derivative financial instruments are provided in note 23.
16. Trade and other receivables
Group Association
2017 £m 2016 £m 2017 £m 2016 £m
Current:Tenant rental receivables (note 23d) 14.3 10.6 12.1 8.7Other trade receivables (note 23d) 12.3 10.6 4.0 1.9Amounts due from subsidiary undertakings - - 58.2 39.2Prepayments 14.7 14.1 10.9 10.6Accrued income 9.9 10.5 1.3 1.2Amounts due under finance lease (note 17) 0.5 0.7 - -Other receivables 24.4 15.3 14.6 14.5
76.1 61.8 101.1 76.1Non-current:Amounts due under finance lease (note 17) 15.7 71.4 - -Amounts due from subsidiary undertakings - - 36.6 71.9Amounts due from joint venture 25.5 4.4 25.5 4.4
41.2 75.8 62.1 76.3
Total trade and other receivables 117.3 137.6 163.2 152.4
Tenant rental receivables are stated net of a provision of £11.9 million for the Group (2016: £7.1 million) and £10.4 million for the Association (2016: £6.2 million). Further information on rental receivables is contained in note 23d.
Strategic report Financial statem
ents
79
17. Finance lease receivable
Group Association
2017 £m 2016 £m 2017 £m 2016 £m
Land and buildings:Under one year 0.5 0.7 - -In the second to fifth year inclusive 3.1 6.1 - -In more than five years 12.6 65.3 - -
16.2 72.1 - -
The amounts receivable in respect of finance leases relate to an agreement between ASK (Greenwich) Limited and Royal Borough of Greenwich. The amounts to be received are based upon repayment schedules agreed by the relevant parties. All amounts are expected to be received over the next 17 years. During the year, student accommodation owned by Glasgow Student Villages Limited and leased to the University of Glasgow was acquired by the University and the finance lease cancelled.
18. Inventory
Group Association
2017 £m 2016 £m 2017 £m 2016 £m
Materials and consumables 0.7 0.7 - -Properties held for sale – completed 18.6 19.6 17.3 2.1Properties held for sale – under construction 1.7 7.2 0.2 5.1
21.0 27.5 17.5 7.2
Properties held for sale include properties held for outright sale and proportions of shared ownership properties allocated as first tranche sales; movements in the year are shown in the reconciliation on the following page.
No inventories have been written off during the year and none are carried at fair value less costs to sell.
NOTES TO THE FINANCIAL STATEMENTS
FIN
AN
CIA
L ST
AT
EM
EN
TS
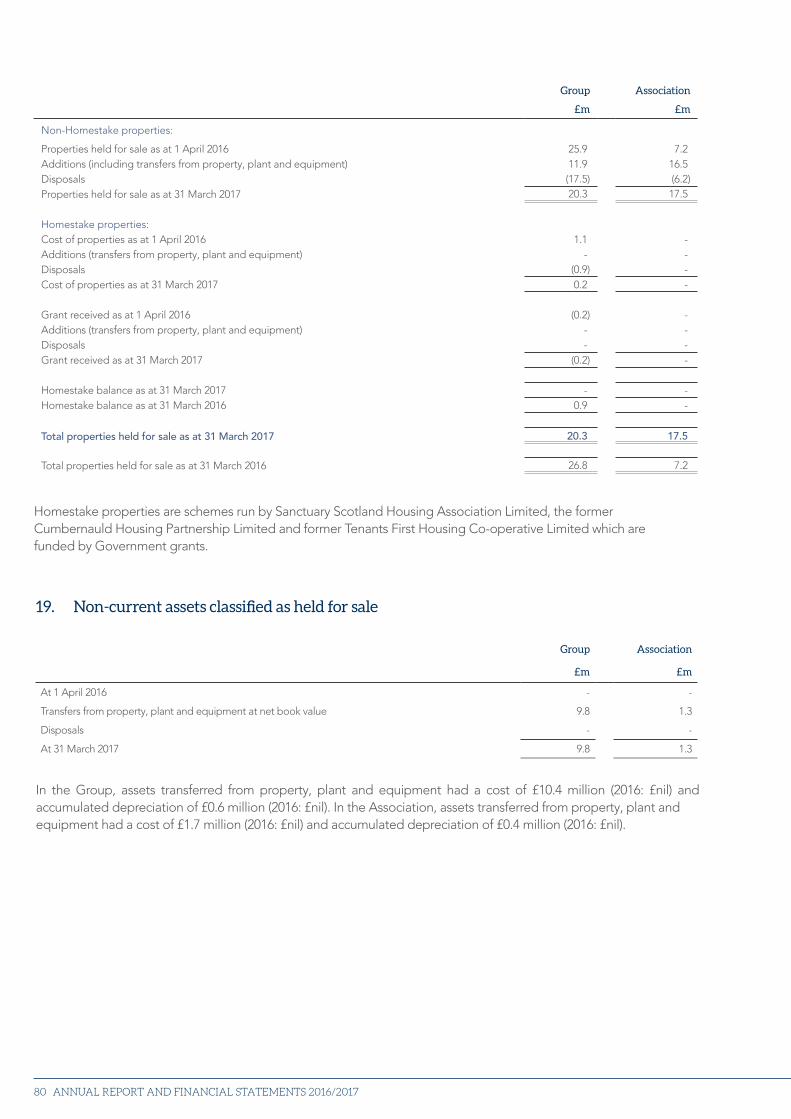
ANNUAL REPORT AND FINANCIAL STATEMENTS 2016/201780
Group Association
£m £m
Non-Homestake properties:
Properties held for sale as at 1 April 2016 25.9 7.2Additions (including transfers from property, plant and equipment) 11.9 16.5Disposals (17.5) (6.2)Properties held for sale as at 31 March 2017 20.3 17.5
Homestake properties:Cost of properties as at 1 April 2016 1.1 -Additions (transfers from property, plant and equipment) - -Disposals (0.9) -Cost of properties as at 31 March 2017 0.2 -
Grant received as at 1 April 2016 (0.2) -Additions (transfers from property, plant and equipment) - -Disposals - -Grant received as at 31 March 2017 (0.2) -
Homestake balance as at 31 March 2017 - -Homestake balance as at 31 March 2016 0.9 -
Total properties held for sale as at 31 March 2017 20.3 17.5
Total properties held for sale as at 31 March 2016 26.8 7.2
Homestake properties are schemes run by Sanctuary Scotland Housing Association Limited, the former Cumbernauld Housing Partnership Limited and former Tenants First Housing Co-operative Limited which are funded by Government grants.
19. Non-current assets classified as held for sale
In the Group, assets transferred from property, plant and equipment had a cost of £10.4 million (2016: £nil) and accumulated depreciation of £0.6 million (2016: £nil). In the Association, assets transferred from property, plant andequipment had a cost of £1.7 million (2016: £nil) and accumulated depreciation of £0.4 million (2016: £nil).
Group Association
£m £m
At 1 April 2016 - -
Transfers from property, plant and equipment at net book value 9.8 1.3
Disposals - -
At 31 March 2017 9.8 1.3
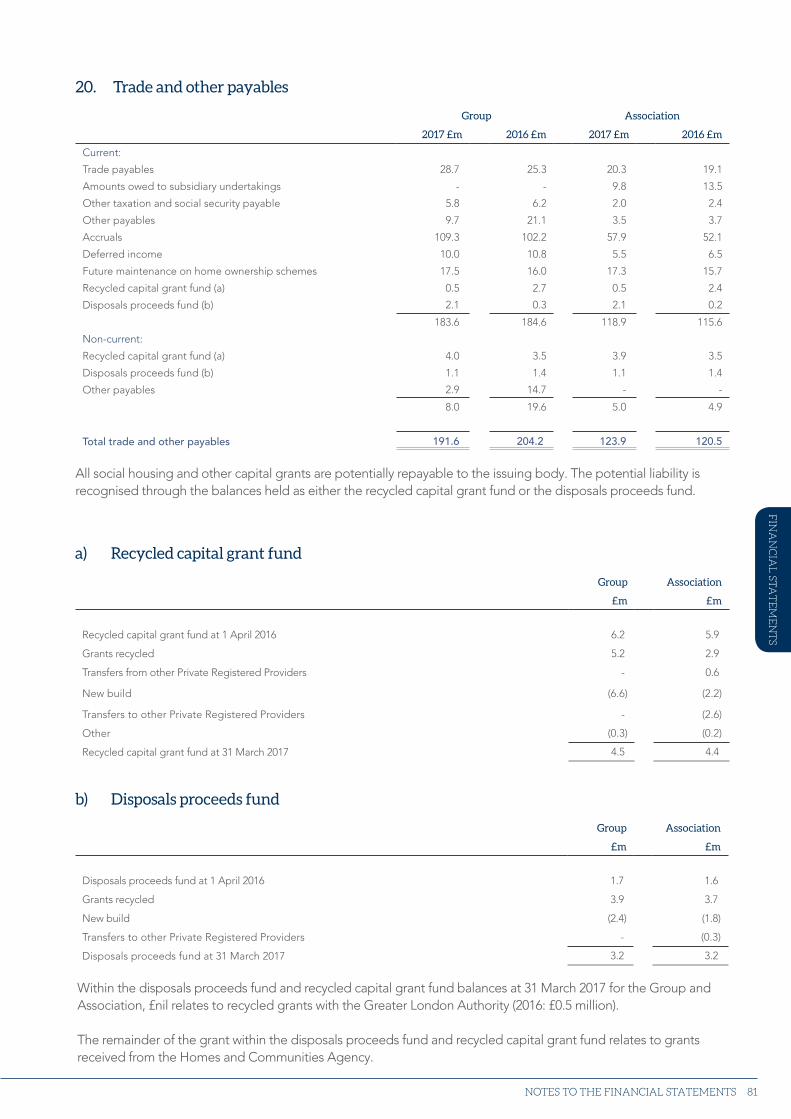
Strategic report Financial statem
ents
81
20. Trade and other payables
Group Association
2017 £m 2016 £m 2017 £m 2016 £m
Current:
Trade payables 28.7 25.3 20.3 19.1
Amounts owed to subsidiary undertakings - - 9.8 13.5
Other taxation and social security payable 5.8 6.2 2.0 2.4
Other payables 9.7 21.1 3.5 3.7
Accruals 109.3 102.2 57.9 52.1
Deferred income 10.0 10.8 5.5 6.5
Future maintenance on home ownership schemes 17.5 16.0 17.3 15.7
Recycled capital grant fund (a) 0.5 2.7 0.5 2.4
Disposals proceeds fund (b) 2.1 0.3 2.1 0.2
183.6 184.6 118.9 115.6
Non-current:
Recycled capital grant fund (a) 4.0 3.5 3.9 3.5
Disposals proceeds fund (b) 1.1 1.4 1.1 1.4
Other payables 2.9 14.7 - -
8.0 19.6 5.0 4.9
Total trade and other payables 191.6 204.2 123.9 120.5
All social housing and other capital grants are potentially repayable to the issuing body. The potential liability is recognised through the balances held as either the recycled capital grant fund or the disposals proceeds fund.
Within the disposals proceeds fund and recycled capital grant fund balances at 31 March 2017 for the Group and Association, £nil relates to recycled grants with the Greater London Authority (2016: £0.5 million).
The remainder of the grant within the disposals proceeds fund and recycled capital grant fund relates to grants received from the Homes and Communities Agency.
a) Recycled capital grant fund
Group Association
£m £m
Recycled capital grant fund at 1 April 2016 6.2 5.9
Grants recycled 5.2 2.9
Transfers from other Private Registered Providers - 0.6
New build (6.6) (2.2)
Transfers to other Private Registered Providers - (2.6)
Other (0.3) (0.2)
Recycled capital grant fund at 31 March 2017 4.5 4.4
b) Disposals proceeds fund
Group Association
£m £m
Disposals proceeds fund at 1 April 2016 1.7 1.6
Grants recycled 3.9 3.7
New build (2.4) (1.8)
Transfers to other Private Registered Providers - (0.3)
Disposals proceeds fund at 31 March 2017 3.2 3.2
NOTES TO THE FINANCIAL STATEMENTS
FIN
AN
CIA
L ST
AT
EM
EN
TS
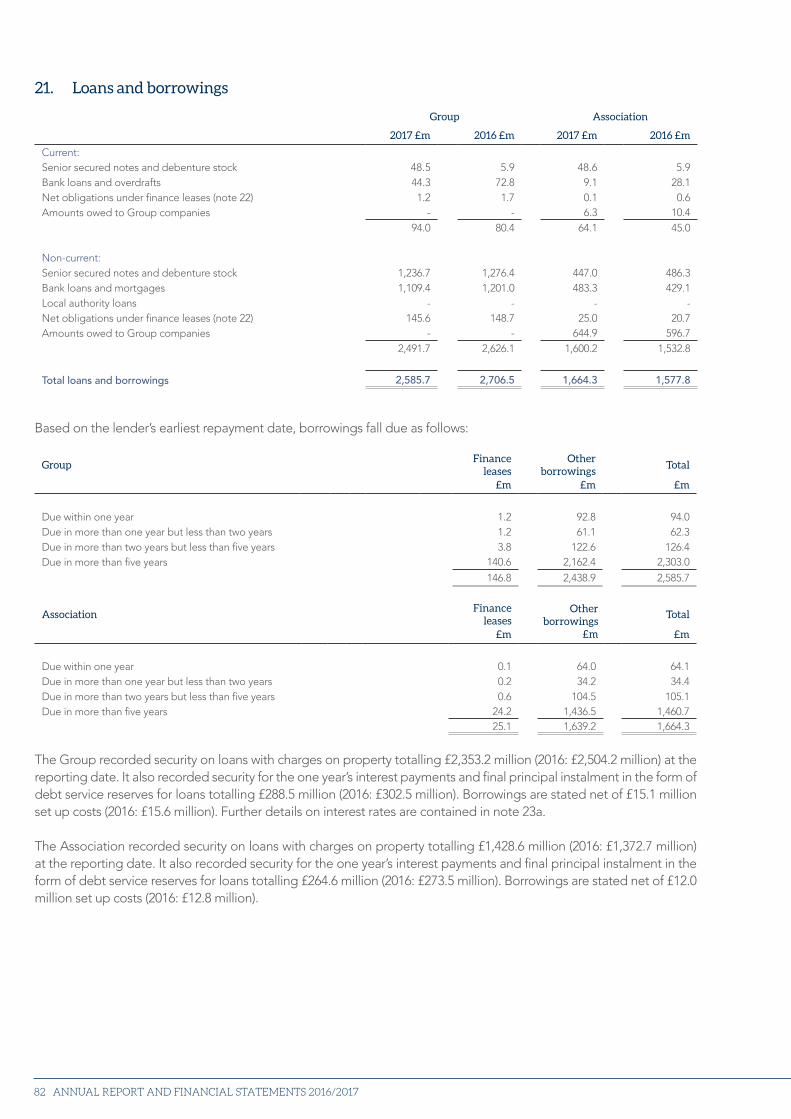
ANNUAL REPORT AND FINANCIAL STATEMENTS 2016/201782
21. Loans and borrowings
Group Association
2017 £m 2016 £m 2017 £m 2016 £m
Current:Senior secured notes and debenture stock 48.5 5.9 48.6 5.9Bank loans and overdrafts 44.3 72.8 9.1 28.1Net obligations under finance leases (note 22) 1.2 1.7 0.1 0.6Amounts owed to Group companies - - 6.3 10.4
94.0 80.4 64.1 45.0
Non-current:Senior secured notes and debenture stock 1,236.7 1,276.4 447.0 486.3Bank loans and mortgages 1,109.4 1,201.0 483.3 429.1Local authority loans - - - -Net obligations under finance leases (note 22) 145.6 148.7 25.0 20.7Amounts owed to Group companies - - 644.9 596.7
2,491.7 2,626.1 1,600.2 1,532.8
Total loans and borrowings 2,585.7 2,706.5 1,664.3 1,577.8
Based on the lender’s earliest repayment date, borrowings fall due as follows:
GroupFinance
leasesOther
borrowingsTotal
£m £m £m
Due within one year 1.2 92.8 94.0Due in more than one year but less than two years 1.2 61.1 62.3Due in more than two years but less than five years 3.8 122.6 126.4Due in more than five years 140.6 2,162.4 2,303.0
146.8 2,438.9 2,585.7
AssociationFinance
leases Total
£m £m
Due within one year 0.1 64.0 64.1Due in more than one year but less than two years 0.2 34.2 34.4Due in more than two years but less than five years 0.6 104.5 105.1Due in more than five years 24.2 1,436.5 1,460.7
25.1 1,639.2 1,664.3
The Group recorded security on loans with charges on property totalling £2,353.2 million (2016: £2,504.2 million) at the reporting date. It also recorded security for the one year’s interest payments and final principal instalment in the form of debt service reserves for loans totalling £288.5 million (2016: £302.5 million). Borrowings are stated net of £15.1 million set up costs (2016: £15.6 million). Further details on interest rates are contained in note 23a.
The Association recorded security on loans with charges on property totalling £1,428.6 million (2016: £1,372.7 million) at the reporting date. It also recorded security for the one year’s interest payments and final principal instalment in the form of debt service reserves for loans totalling £264.6 million (2016: £273.5 million). Borrowings are stated net of £12.0 million set up costs (2016: £12.8 million).
Other borrowings
£m
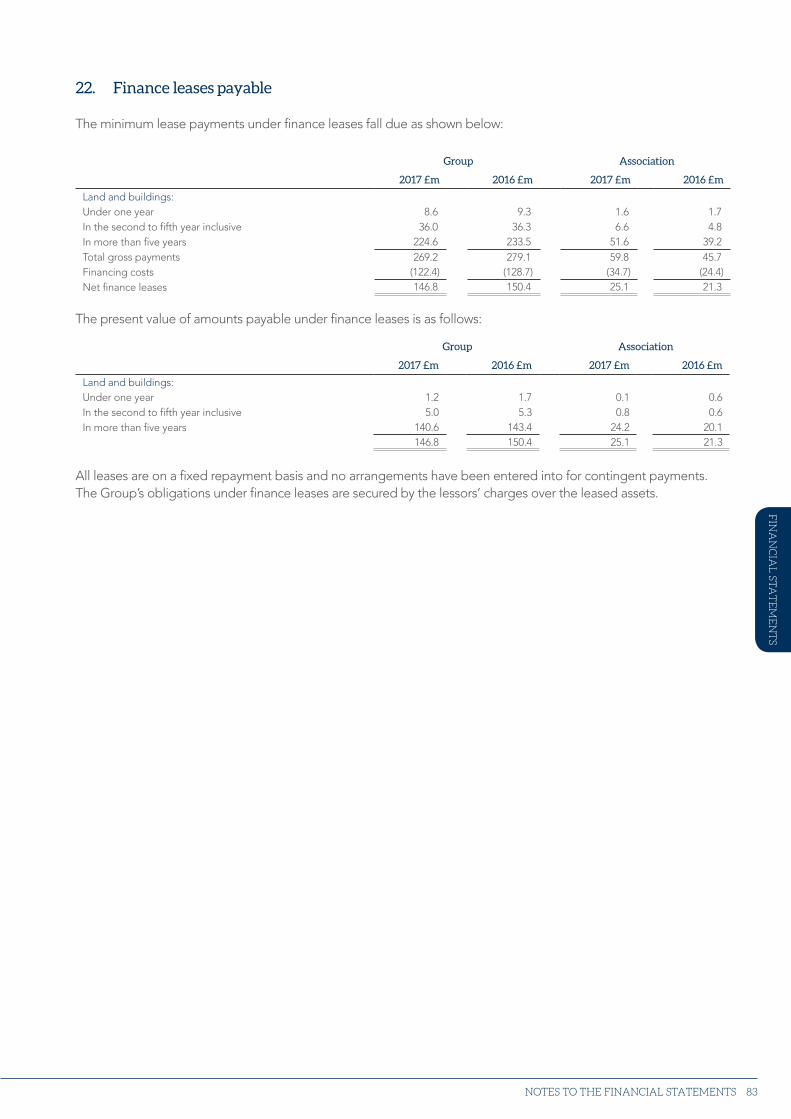
Strategic report Financial statem
ents
83
22. Finance leases payable
The minimum lease payments under finance leases fall due as shown below:
Group Association
2017 £m 2016 £m 2017 £m 2016 £m
Land and buildings:Under one year 8.6 9.3 1.6 1.7In the second to fifth year inclusive 36.0 36.3 6.6 4.8In more than five years 224.6 233.5 51.6 39.2Total gross payments 269.2 279.1 59.8 45.7Financing costs (122.4) (128.7) (34.7) (24.4)Net finance leases 146.8 150.4 25.1 21.3
The present value of amounts payable under finance leases is as follows:
Group Association
2017 £m 2016 £m 2017 £m 2016 £m
Land and buildings:Under one year 1.2 1.7 0.1 0.6In the second to fifth year inclusive 5.0 5.3 0.8 0.6In more than five years 140.6 143.4 24.2 20.1
146.8 150.4 25.1 21.3
All leases are on a fixed repayment basis and no arrangements have been entered into for contingent payments. The Group’s obligations under finance leases are secured by the lessors’ charges over the leased assets.
NOTES TO THE FINANCIAL STATEMENTS
FIN
AN
CIA
L ST
AT
EM
EN
TS
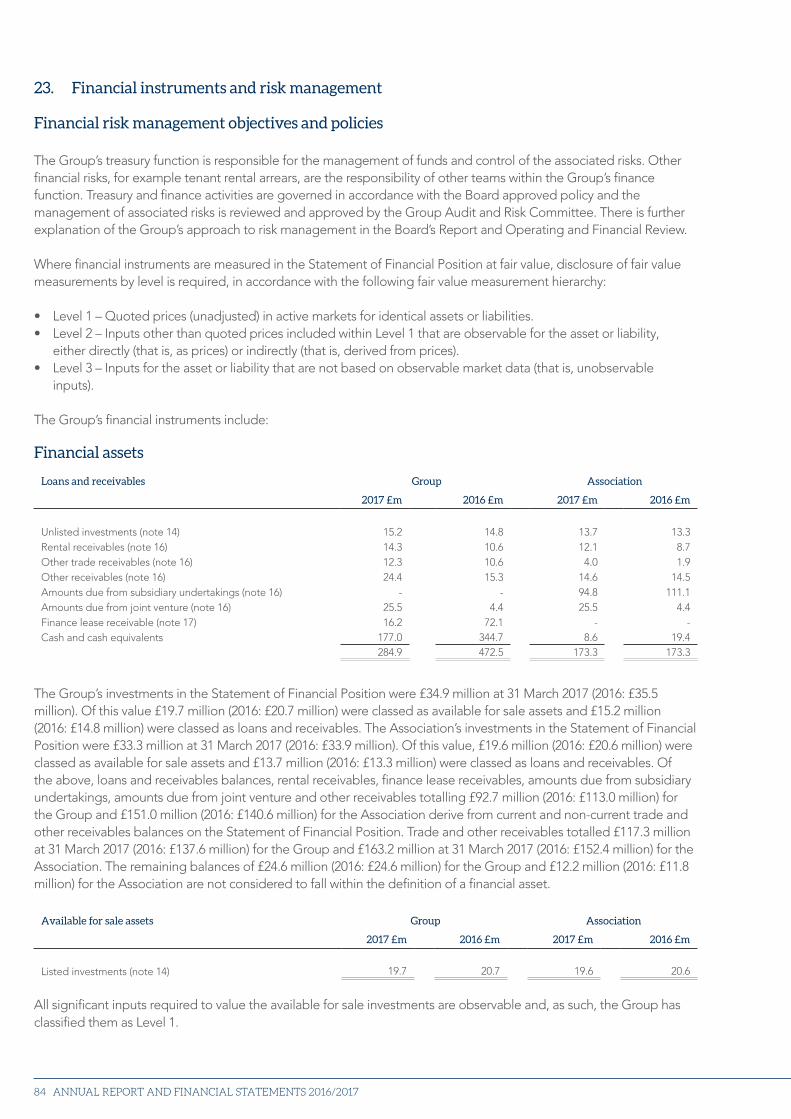
ANNUAL REPORT AND FINANCIAL STATEMENTS 2016/201784
Financial assets
Loans and receivables Group Association
2017 £m 2016 £m 2017 £m 2016 £m
Unlisted investments (note 14) 15.2 14.8 13.7 13.3Rental receivables (note 16) 14.3 10.6 12.1 8.7Other trade receivables (note 16) 12.3 10.6 4.0 1.9Other receivables (note 16) 24.4 15.3 14.6 14.5Amounts due from subsidiary undertakings (note 16) - - 94.8 111.1Amounts due from joint venture (note 16) 25.5 4.4 25.5 4.4Finance lease receivable (note 17) 16.2 72.1 - -Cash and cash equivalents 177.0 344.7 8.6 19.4
284.9 472.5 173.3 173.3
The Group’s investments in the Statement of Financial Position were £34.9 million at 31 March 2017 (2016: £35.5 million). Of this value £19.7 million (2016: £20.7 million) were classed as available for sale assets and £15.2 million (2016: £14.8 million) were classed as loans and receivables. The Association’s investments in the Statement of Financial Position were £33.3 million at 31 March 2017 (2016: £33.9 million). Of this value, £19.6 million (2016: £20.6 million) were classed as available for sale assets and £13.7 million (2016: £13.3 million) were classed as loans and receivables. Of the above, loans and receivables balances, rental receivables, finance lease receivables, amounts due from subsidiary undertakings, amounts due from joint venture and other receivables totalling £92.7 million (2016: £113.0 million) for the Group and £151.0 million (2016: £140.6 million) for the Association derive from current and non-current trade and other receivables balances on the Statement of Financial Position. Trade and other receivables totalled £117.3 million at 31 March 2017 (2016: £137.6 million) for the Group and £163.2 million at 31 March 2017 (2016: £152.4 million) for the Association. The remaining balances of £24.6 million (2016: £24.6 million) for the Group and £12.2 million (2016: £11.8 million) for the Association are not considered to fall within the definition of a financial asset.
Available for sale assets Group Association
2017 £m 2016 £m 2017 £m 2016 £m
Listed investments (note 14) 19.7 20.7 19.6 20.6
All significant inputs required to value the available for sale investments are observable and, as such, the Group has classified them as Level 1.
23. Financial instruments and risk management
Financial risk management objectives and policies
The Group’s treasury function is responsible for the management of funds and control of the associated risks. Other financial risks, for example tenant rental arrears, are the responsibility of other teams within the Group’s finance function. Treasury and finance activities are governed in accordance with the Board approved policy and the management of associated risks is reviewed and approved by the Group Audit and Risk Committee. There is further explanation of the Group’s approach to risk management in the Board’s Report and Operating and Financial Review.
Where financial instruments are measured in the Statement of Financial Position at fair value, disclosure of fair value measurements by level is required, in accordance with the following fair value measurement hierarchy:
• Level 1 – Quoted prices (unadjusted) in active markets for identical assets or liabilities.• Level 2 – Inputs other than quoted prices included within Level 1 that are observable for the asset or liability,
either directly (that is, as prices) or indirectly (that is, derived from prices).• Level 3 – Inputs for the asset or liability that are not based on observable market data (that is, unobservable
inputs).
The Group’s financial instruments include:
Strategic report Financial statem
ents
85
Financial liabilities
As at 31 March the Group and Association’s financial liability balances were as follows:
Other financial liabilities - current Group Association
2017 £m 2016 £m 2017 £m 2016 £m
Debt finance excluding set up costs 94.1 79.9 64.8 45.2Trade payables (note 20) 28.7 25.3 20.3 19.1Net obligations under finance leases (note 22) 1.2 1.7 0.1 0.6Amounts due to subsidiary undertakings (note 20) - - 9.8 13.5Other payables (note 20) 33.0 43.3 22.8 21.8
157.0 150.2 117.8 100.2
Other payables include other tax and social security, other payables, future maintenance on home ownership schemes, and SHG and other grants in advance. Current trade and other payables as disclosed in the Statement of Financial Position totalled £183.6 million (2016: £184.6 million) for the Group and £118.9 million (2016: £115.6 million) for the Association. The difference between the Statement of Financial Position and the amounts disclosed above is £121.9 million (2016: £116.0 million) for the Group and £66.0 million (2016: £61.2 million) for the Association and relates to balances that are not considered to fall within the definition of a financial liability. Debt finance consists of loans and mortgages and is presented above before deduction of set up costs.
Other financial liabilities – non-current Group Association
2017 £m 2016 £m 2017 £m 2016 £m
Debt finance excluding set up costs 2,359.9 2,491.8 1,586.4 1,524.1Net obligations under finance leases (note 22) 145.6 148.7 25.0 20.7Other payables (note 20) 2.9 14.7 - -
2,508.4 2,655.2 1,611.4 1,544.8
Non-current trade and other payables as disclosed in the Statement of Financial Position totalled £8.0 million (2016: £19.6 million) for the Group and £5.0 million (2016: £4.9 million) for the Association. The difference between the Statement of Financial Position and the amounts disclosed above is £5.1 million (2016: £4.9 million) for the Group and £5.0 million (2016: £4.9 million) for the Association and relates to balances that are not considered to fall within the definition of a financial liability. Debt finance consists of loans and mortgages and is presented above before deduction of set up costs.
Total current and non-current other financial liabilities at 31 March 2017 were £2,665.4 million (2016: £2,805.4 million) for the Group and £1,729.2 million (2016: £1,645.0 million) for the Association. All significant inputs required to value the above instruments are observable and, as such, the Group has classified them as Level 2.
Financial liabilities at fair value through the Income Statement Group Association
2017 £m 2016 £m 2017 £m 2016 £m
Derivative financial instruments – interest rate swaps 0.2 1.0 - -Derivative financial instruments – forward fixed rate instruments (0.1) (0.7) (0.1) (0.7)
0.1 0.3 (0.1) (0.7)
The derivative financial instruments relating to interest rate swaps valued at fair value through the Income Statement were entered into by the Group under a facility agreement dated September 2002. Forward fixed rate instruments were terminated in December 2016. Fair value movements totalling £0.1 million (2016: £0.3 million) for the Group and £(0.1) million (2016: £(0.7) million) for the Association are shown as a credit/(debit) to the Income Statement (note 9).
NOTES TO THE FINANCIAL STATEMENTS
FIN
AN
CIA
L ST
AT
EM
EN
TS
ANNUAL REPORT AND FINANCIAL STATEMENTS 2016/201786
The purpose of the derivative financial instruments is to hedge the interest rate risk associated with the variability of cash flows on variable rate loans.
All significant inputs required to value the above interest rate swap are observable and, as such, the Group has classified them as Level 2.
Valuation
Balances are valued in accordance with note 1 Principal Accounting Policies – Financial Instruments. Fair value equates to book value except in the following cases:
Derivative financial instruments are measured at fair value.
The fair value of the cross currency derivative financial instruments is arrived at by discounting future cash flows associated with each swap and comparing, for each swap, the cumulative total discounted sterling future cash flows with the total discounted dollar future cash flows translated at the year end exchange rate. The swap rate data used for discounting the flows is provided to the Group by external advisors. For the balances at 31 March 2017 the range of discount rates used was 1.24% to 2.08% (2016: 1.52% to 2.41%).
The fair value of the interest rate swap is arrived at by discounting the fixed leg and variable leg cash flows using interpolated yield curves provided to the Group by external advisors.
Listed investments are measured at fair value. The fair value equates to the market value of these listed investments at the reporting date.
All assets and liabilities at fair value through the Income Statement have been designated as such on initial recognition.
Senior secured notes and debenture stock, bank loans and mortgages, and net obligations under finance leases are measured at book value. However, fair value can be calculated and these are disclosed in note 23a. The variance between the fair value and the book value of the Group and Association’s long-term borrowings is driven by the discount rates and weighted average life of the fixed rate financial liabilities, which is 20.3 years (2016: 20.6 years) for the Group and 18.6 years (2016: 17.6 years) for the Association.
Loans denominated in foreign currency are translated at year end exchange rates.
Analysis of risks
a) Interest rate risk and exposure
Interest rate risk is defined as the risk that interest rates may change in the future materially affecting the Group’s liabilities and cash flows. The interest rate exposure of the Group and Association net debt at 31 March 2017 after hedging instruments was:
Group Association
£m % £m %
Fixed rate financial liabilities 2,426.2 93.8 1,615.6 97.1Floating rate financial liabilities 159.5 6.2 48.7 2.9
2,585.7 100.0 1,664.3 100.0
The cost of borrowing of the Group fixed rate financial liabilities is 5.21% (2016: 5.24%) and for the Association 5.27% (2016: 5.53%). The cost of borrowing of the Group’s total financial liabilities is 4.96% (2016: 4.93%) and for the Association 5.15% (2016: 5.44%). The weighted average life of fixed rate financial liabilities for the Group is 20.3 years (2016: 20.6 years) and for the Association is 18.6 years (2016: 17.6 years). The Group operates an interest rate policy designed to minimise interest cost and reduce volatility in cash flow and debt service costs. Group borrowings currently comprise 93.8% fixed rate debt (2016: 93.5%) and 6.2% floating rate debt (2016: 6.5%). Association borrowings comprise 97.1% fixed rate debt (2016: 97.7%) and 2.9% floating rate debt (2016: 2.3%).
Strategic report Financial statem
ents
87
The Group’s cash flow interest rate risk relates to:
• variable rate financial instruments which are subject to rate changes – a 10% increase in interest costs would result in an additional charge to the Statement of Comprehensive Income of £0.2 million (2016: £0.2 million).
• fixed rate financial instruments where benefits of interest rate reductions are lost – a 0.25% rate reduction would result in a lost benefit of £6.0 million (2016: £6.1 million).
A comparison of the book value to fair value of the Group’s and Association’s long-term borrowings at 31 March 2017 is set out below.
Group Association
2017 Book value
2017 Fair value
2017 Book value
2017 Fair value
£m £m £m £m
Senior secured notes and debenture stock (note 21) 1,236.7 1,827.9 447.0 533.2Bank loans and mortgages (note 21) 1,109.4 1,383.0 483.3 681.9Net obligations under finance leases (notes 21, 22) 145.6 145.6 25.0 25.0Amounts owed to Group companies - - 644.9 1,002.1
2,491.7 3,356.5 1,600.2 2,242.2
The following methods and assumptions have been applied in determining the value of the financial instruments in the table above.
(i) The book value of loans with a maturity of less than one year is assumed to equate to their carrying value. (ii) The fair value of loans greater than one year is established by utilising discounted cash flow valuation models or
listed market prices where available.(iii) The fair value of balances shown above at a variable rate of interest is assumed to approximate to their book
value.
The fair values of the swaps at the year end would decrease by the following amounts, if an increase of 1% occurred:
Group LiabilityStatement of
Comprehensive Income
£m £m
In sterling swap rates only (1.1) 1.1
Interest rate risk applies to debt finance.
Management considers the sensitivity analysis, in relation to the remaining interest rate swaps not included above, to be not material.
b) Currency rate risk and exposure
Currency rate risk is the risk that foreign currency arrangements that the Group has entered into will be adversely affected by exchange rate movements. Hedging is defined as the practice of offsetting such risks and the organisation applies such practices. The hedge put in place by the organisation removes completely the currency risk, as explained below.
In 2007 the Group borrowed $20 million, $80 million and £8 million through an issue of three senior secured notes at interest rates of 5.42%, 5.83% and 5.54% repayable in 2017, 2037 and 2017 respectively. The foreign currency funds have been swapped through derivative financial instruments with the counterparty of the arrangement described above.
NOTES TO THE FINANCIAL STATEMENTS
FIN
AN
CIA
L ST
AT
EM
EN
TS
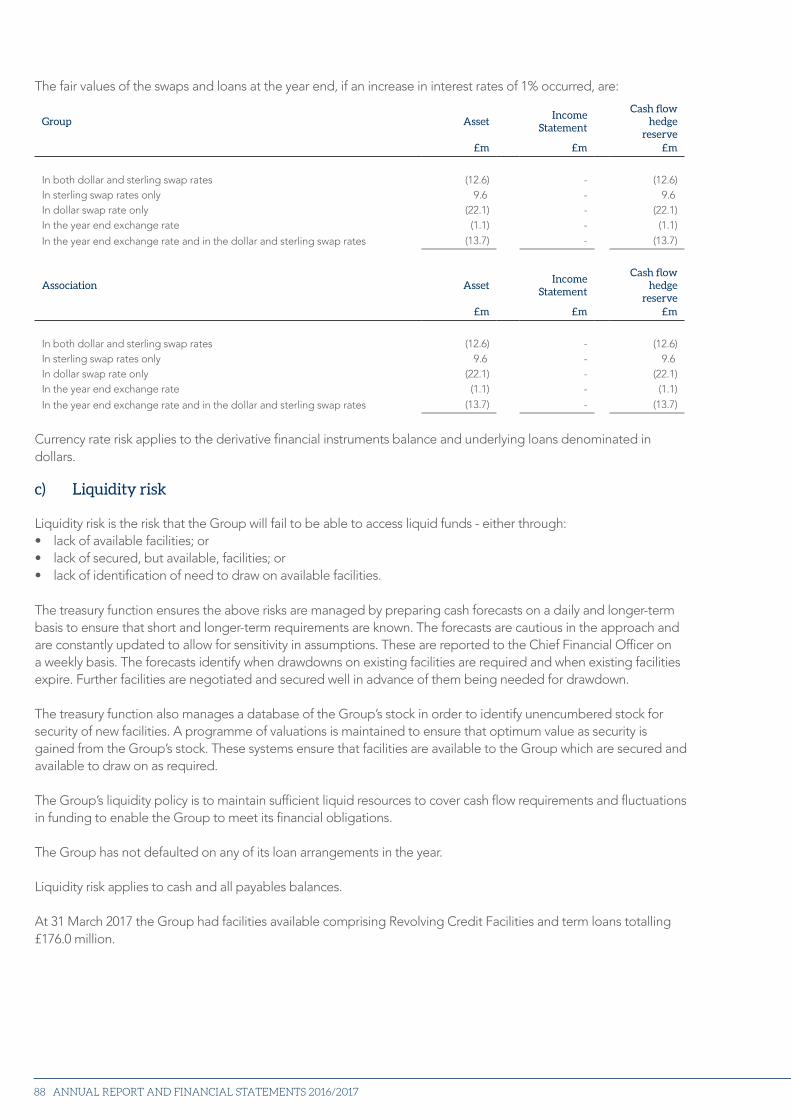
ANNUAL REPORT AND FINANCIAL STATEMENTS 2016/201788
The fair values of the swaps and loans at the year end, if an increase in interest rates of 1% occurred, are:
Group AssetIncome
Statement
Cash flow hedge
reserve£m £m £m
In both dollar and sterling swap rates (12.6) - (12.6)In sterling swap rates only 9.6 - 9.6In dollar swap rate only (22.1) - (22.1) In the year end exchange rate (1.1) - (1.1)
In the year end exchange rate and in the dollar and sterling swap rates (13.7) - (13.7)
Association AssetIncome
Statement
Cash flow hedge
reserve£m £m £m
In both dollar and sterling swap rates (12.6) - (12.6)In sterling swap rates only 9.6 - 9.6In dollar swap rate only (22.1) - (22.1)In the year end exchange rate (1.1) - (1.1)
In the year end exchange rate and in the dollar and sterling swap rates (13.7) - (13.7)
Currency rate risk applies to the derivative financial instruments balance and underlying loans denominated in dollars.
c) Liquidity risk
Liquidity risk is the risk that the Group will fail to be able to access liquid funds - either through:• lack of available facilities; or• lack of secured, but available, facilities; or• lack of identification of need to draw on available facilities.
The treasury function ensures the above risks are managed by preparing cash forecasts on a daily and longer-term basis to ensure that short and longer-term requirements are known. The forecasts are cautious in the approach and are constantly updated to allow for sensitivity in assumptions. These are reported to the Chief Financial Officer on a weekly basis. The forecasts identify when drawdowns on existing facilities are required and when existing facilities expire. Further facilities are negotiated and secured well in advance of them being needed for drawdown.
The treasury function also manages a database of the Group’s stock in order to identify unencumbered stock for security of new facilities. A programme of valuations is maintained to ensure that optimum value as security is gained from the Group’s stock. These systems ensure that facilities are available to the Group which are secured and available to draw on as required.
The Group’s liquidity policy is to maintain sufficient liquid resources to cover cash flow requirements and fluctuations in funding to enable the Group to meet its financial obligations.
The Group has not defaulted on any of its loan arrangements in the year.
Liquidity risk applies to cash and all payables balances.
At 31 March 2017 the Group had facilities available comprising Revolving Credit Facilities and term loans totalling £176.0 million.
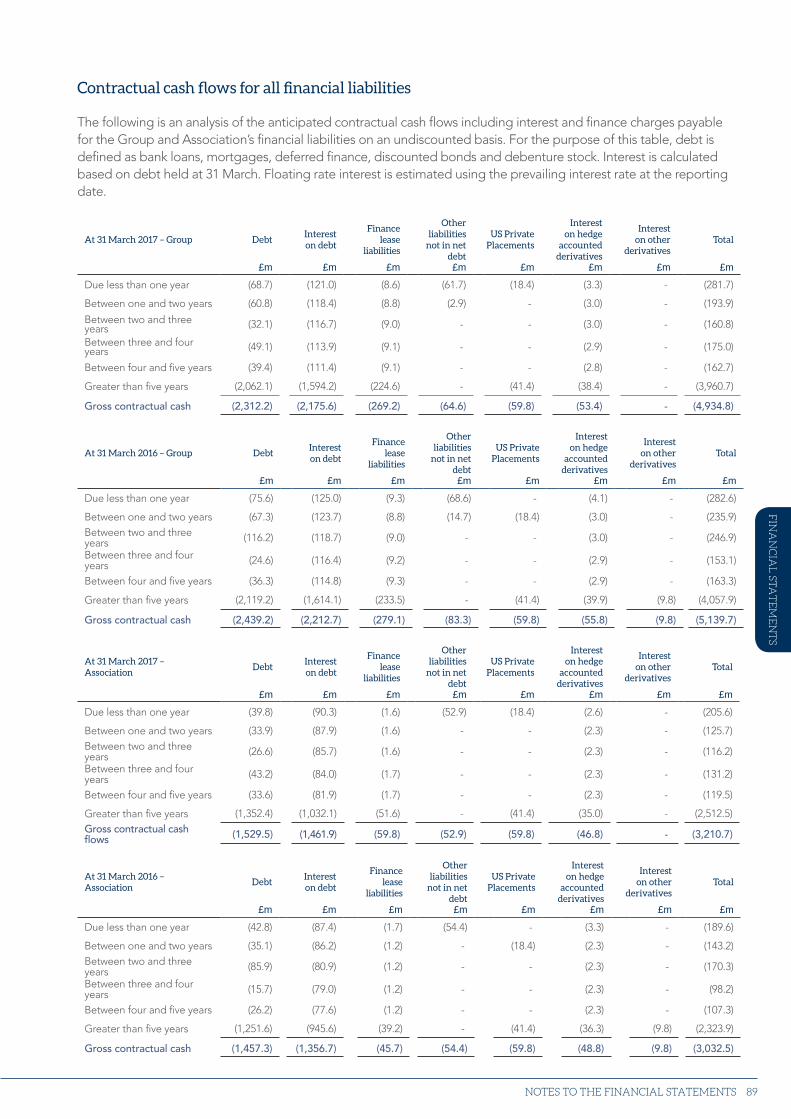
Strategic report Financial statem
ents
89
Contractual cash flows for all financial liabilities
The following is an analysis of the anticipated contractual cash flows including interest and finance charges payable for the Group and Association’s financial liabilities on an undiscounted basis. For the purpose of this table, debt is defined as bank loans, mortgages, deferred finance, discounted bonds and debenture stock. Interest is calculated based on debt held at 31 March. Floating rate interest is estimated using the prevailing interest rate at the reporting date.
At 31 March 2017 – Group DebtInterest on debt
Finance lease
liabilities
Other liabilities
not in net debt
US Private Placements
Interest on hedge
accounted derivatives
Interest on other
derivativesTotal
£m £m £m £m £m £m £m £m
Due less than one year (68.7) (121.0) (8.6) (61.7) (18.4) (3.3) - (281.7)
Between one and two years (60.8) (118.4) (8.8) (2.9) - (3.0) - (193.9)
Between two and three years (32.1) (116.7) (9.0) - - (3.0) - (160.8)
Between three and four years (49.1) (113.9) (9.1) - - (2.9) - (175.0)
Between four and five years (39.4) (111.4) (9.1) - - (2.8) - (162.7)
Greater than five years (2,062.1) (1,594.2) (224.6) - (41.4) (38.4) - (3,960.7)
Gross contractual cash (2,312.2) (2,175.6) (269.2) (64.6) (59.8) (53.4) - (4,934.8)
At 31 March 2016 – Group DebtInterest on debt
Finance lease
liabilities
Other liabilities
not in net debt
US Private Placements
Interest on hedge
accounted derivatives
Interest on other
derivativesTotal
£m £m £m £m £m £m £m £m
Due less than one year (75.6) (125.0) (9.3) (68.6) - (4.1) - (282.6)
Between one and two years (67.3) (123.7) (8.8) (14.7) (18.4) (3.0) - (235.9)Between two and three years (116.2) (118.7) (9.0) - - (3.0) - (246.9)
Between three and four years (24.6) (116.4) (9.2) - - (2.9) - (153.1)
Between four and five years (36.3) (114.8) (9.3) - - (2.9) - (163.3)
Greater than five years (2,119.2) (1,614.1) (233.5) - (41.4) (39.9) (9.8) (4,057.9)
Gross contractual cash (2,439.2) (2,212.7) (279.1) (83.3) (59.8) (55.8) (9.8) (5,139.7)
At 31 March 2017 – Association
DebtInterest on debt
Finance lease
liabilities
Other liabilities
not in net debt
US Private Placements
Interest on hedge
accounted derivatives
Interest on other
derivativesTotal
£m £m £m £m £m £m £m £m
Due less than one year (39.8) (90.3) (1.6) (52.9) (18.4) (2.6) - (205.6)
Between one and two years (33.9) (87.9) (1.6) - - (2.3) - (125.7)Between two and three years (26.6) (85.7) (1.6) - - (2.3) - (116.2)
Between three and four years (43.2) (84.0) (1.7) - - (2.3) - (131.2)
Between four and five years (33.6) (81.9) (1.7) - - (2.3) - (119.5)
Greater than five years (1,352.4) (1,032.1) (51.6) - (41.4) (35.0) - (2,512.5)Gross contractual cash flows (1,529.5) (1,461.9) (59.8) (52.9) (59.8) (46.8) - (3,210.7)
At 31 March 2016 – Association
DebtInterest on debt
Finance lease
liabilities
Other liabilities
not in net debt
US Private Placements
Interest on hedge
accounted derivatives
Interest on other
derivativesTotal
£m £m £m £m £m £m £m £m
Due less than one year (42.8) (87.4) (1.7) (54.4) - (3.3) - (189.6)
Between one and two years (35.1) (86.2) (1.2) - (18.4) (2.3) - (143.2)Between two and three years (85.9) (80.9) (1.2) - - (2.3) - (170.3)
Between three and four years (15.7) (79.0) (1.2) - - (2.3) - (98.2)
Between four and five years (26.2) (77.6) (1.2) - - (2.3) - (107.3)
Greater than five years (1,251.6) (945.6) (39.2) - (41.4) (36.3) (9.8) (2,323.9)
Gross contractual cash (1,457.3) (1,356.7) (45.7) (54.4) (59.8) (48.8) (9.8) (3,032.5)
NOTES TO THE FINANCIAL STATEMENTS
FIN
AN
CIA
L ST
AT
EM
EN
TS
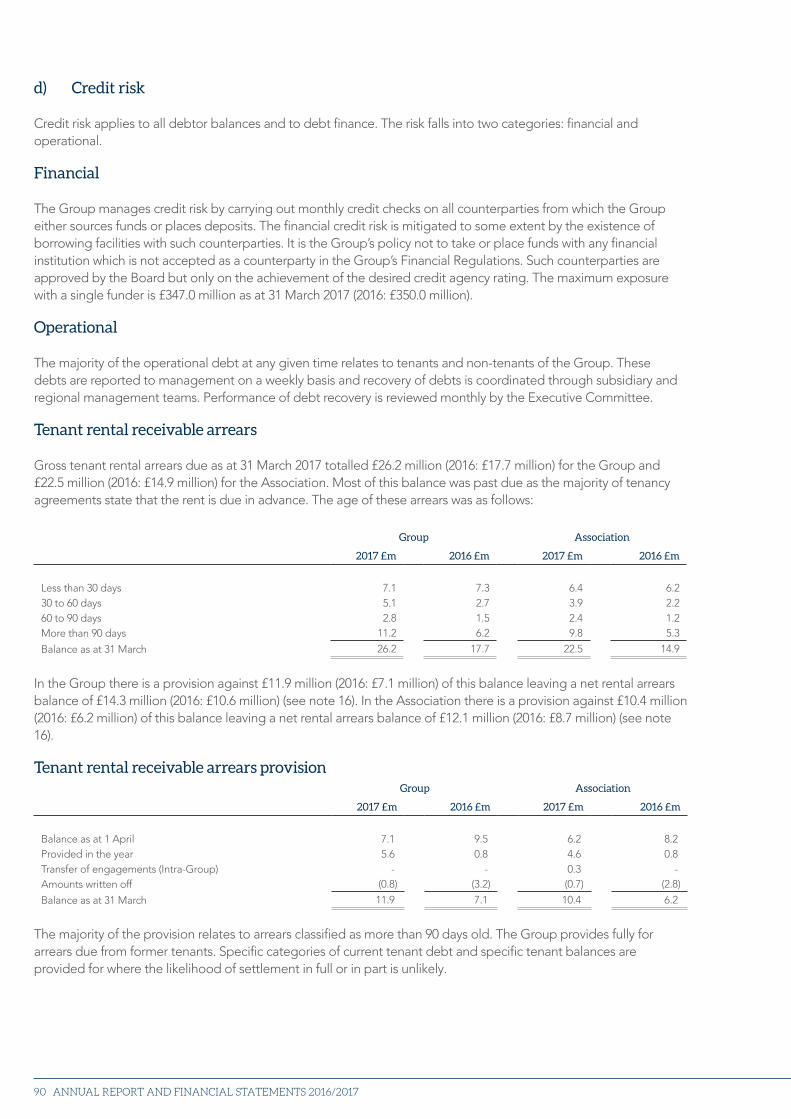
ANNUAL REPORT AND FINANCIAL STATEMENTS 2016/201790
d) Credit risk
Credit risk applies to all debtor balances and to debt finance. The risk falls into two categories: financial and operational.
Financial
The Group manages credit risk by carrying out monthly credit checks on all counterparties from which the Group either sources funds or places deposits. The financial credit risk is mitigated to some extent by the existence of borrowing facilities with such counterparties. It is the Group’s policy not to take or place funds with any financial institution which is not accepted as a counterparty in the Group’s Financial Regulations. Such counterparties are approved by the Board but only on the achievement of the desired credit agency rating. The maximum exposure with a single funder is £347.0 million as at 31 March 2017 (2016: £350.0 million).
Operational
The majority of the operational debt at any given time relates to tenants and non-tenants of the Group. These debts are reported to management on a weekly basis and recovery of debts is coordinated through subsidiary and regional management teams. Performance of debt recovery is reviewed monthly by the Executive Committee.
Tenant rental receivable arrears
Gross tenant rental arrears due as at 31 March 2017 totalled £26.2 million (2016: £17.7 million) for the Group and £22.5 million (2016: £14.9 million) for the Association. Most of this balance was past due as the majority of tenancy agreements state that the rent is due in advance. The age of these arrears was as follows:
Group Association
2017 £m 2016 £m 2017 £m 2016 £m
Less than 30 days 7.1 7.3 6.4 6.230 to 60 days 5.1 2.7 3.9 2.260 to 90 days 2.8 1.5 2.4 1.2More than 90 days 11.2 6.2 9.8 5.3
Balance as at 31 March 26.2 17.7 22.5 14.9
In the Group there is a provision against £11.9 million (2016: £7.1 million) of this balance leaving a net rental arrears balance of £14.3 million (2016: £10.6 million) (see note 16). In the Association there is a provision against £10.4 million (2016: £6.2 million) of this balance leaving a net rental arrears balance of £12.1 million (2016: £8.7 million) (see note 16).
Tenant rental receivable arrears provisionGroup Association
2017 £m 2016 £m 2017 £m 2016 £m
Balance as at 1 April 7.1 9.5 6.2 8.2Provided in the year 5.6 0.8 4.6 0.8Transfer of engagements (Intra-Group) - - 0.3 -Amounts written off (0.8) (3.2) (0.7) (2.8)
Balance as at 31 March 11.9 7.1 10.4 6.2
The majority of the provision relates to arrears classified as more than 90 days old. The Group provides fully for arrears due from former tenants. Specific categories of current tenant debt and specific tenant balances are provided for where the likelihood of settlement in full or in part is unlikely.
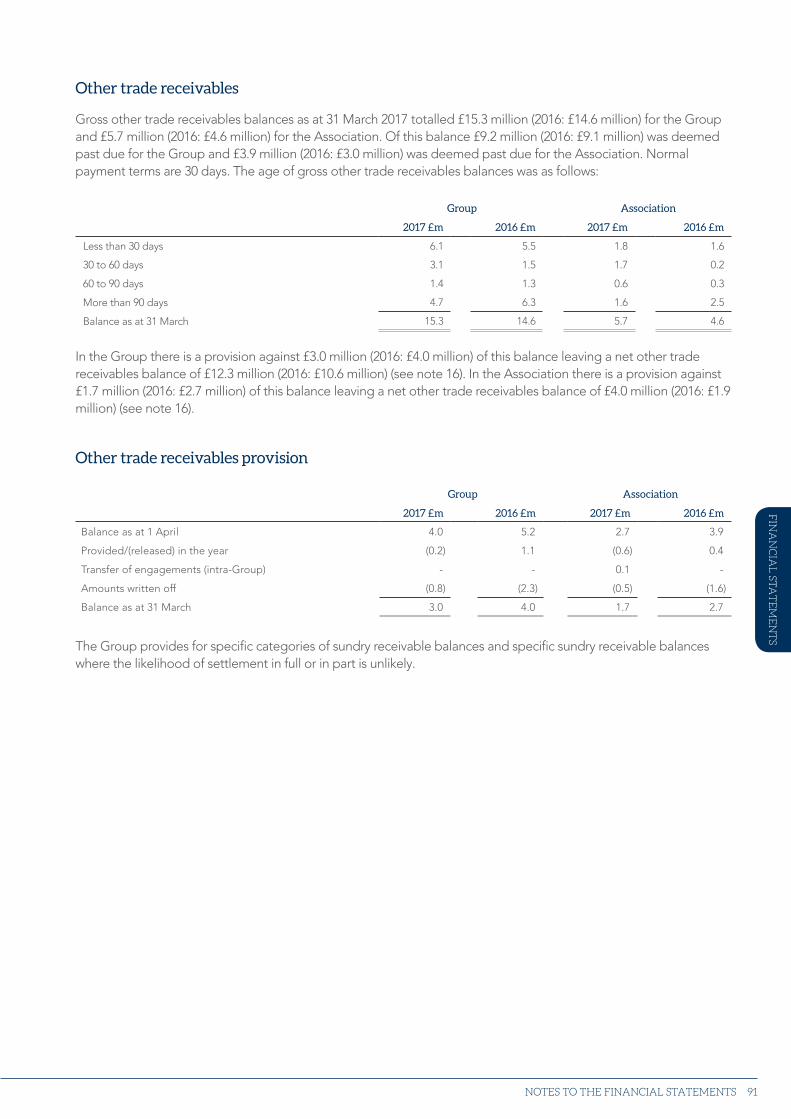
Strategic report Financial statem
ents
91
Other trade receivables
Gross other trade receivables balances as at 31 March 2017 totalled £15.3 million (2016: £14.6 million) for the Group and £5.7 million (2016: £4.6 million) for the Association. Of this balance £9.2 million (2016: £9.1 million) was deemed past due for the Group and £3.9 million (2016: £3.0 million) was deemed past due for the Association. Normal payment terms are 30 days. The age of gross other trade receivables balances was as follows:
Group Association
2017 £m 2016 £m 2017 £m 2016 £m
Less than 30 days 6.1 5.5 1.8 1.6
30 to 60 days 3.1 1.5 1.7 0.2
60 to 90 days 1.4 1.3 0.6 0.3
More than 90 days 4.7 6.3 1.6 2.5
Balance as at 31 March 15.3 14.6 5.7 4.6
In the Group there is a provision against £3.0 million (2016: £4.0 million) of this balance leaving a net other trade receivables balance of £12.3 million (2016: £10.6 million) (see note 16). In the Association there is a provision against £1.7 million (2016: £2.7 million) of this balance leaving a net other trade receivables balance of £4.0 million (2016: £1.9 million) (see note 16).
Other trade receivables provision
The Group provides for specific categories of sundry receivable balances and specific sundry receivable balances where the likelihood of settlement in full or in part is unlikely.
Group Association
2017 £m 2016 £m 2017 £m 2016 £m
Balance as at 1 April 4.0 5.2 2.7 3.9
Provided/(released) in the year (0.2) 1.1 (0.6) 0.4
Transfer of engagements (intra-Group) - - 0.1 -
Amounts written off (0.8) (2.3) (0.5) (1.6)
Balance as at 31 March 3.0 4.0 1.7 2.7
NOTES TO THE FINANCIAL STATEMENTS
FIN
AN
CIA
L ST
AT
EM
EN
TS
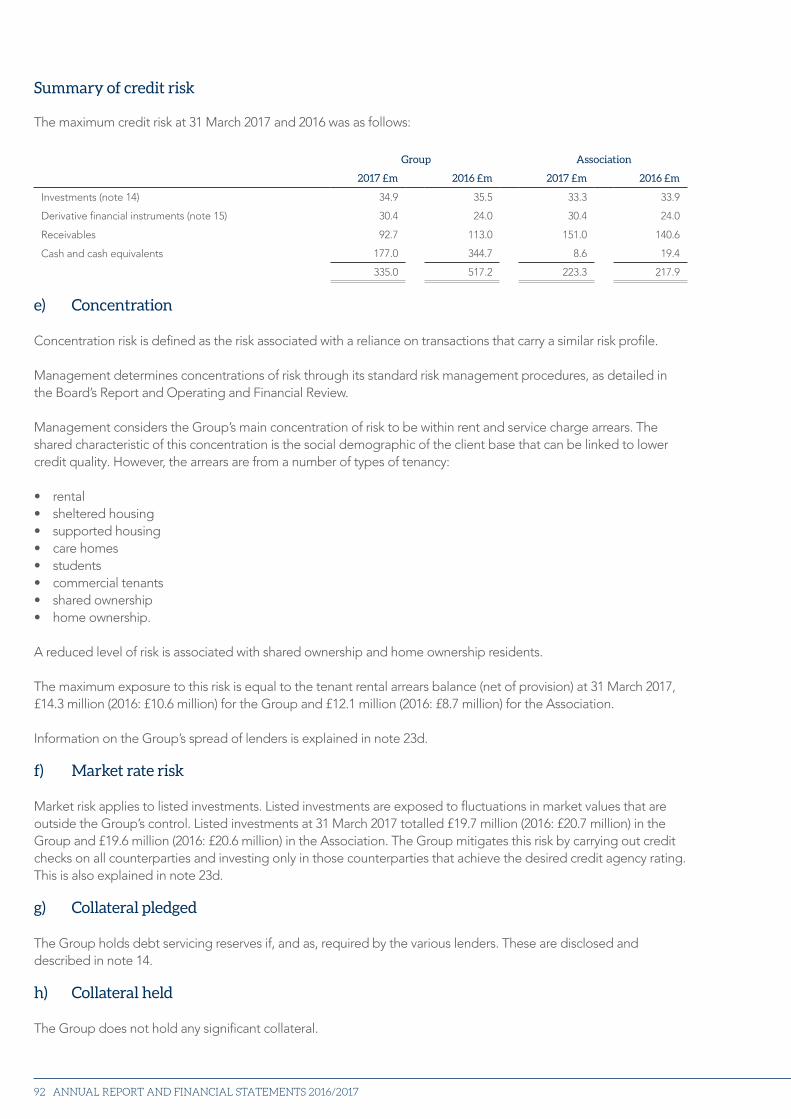
ANNUAL REPORT AND FINANCIAL STATEMENTS 2016/201792
Summary of credit risk
The maximum credit risk at 31 March 2017 and 2016 was as follows:
Group Association
2017 £m 2016 £m 2017 £m 2016 £m
Investments (note 14) 34.9 35.5 33.3 33.9
Derivative financial instruments (note 15) 30.4 24.0 30.4 24.0
Receivables 92.7 113.0 151.0 140.6
Cash and cash equivalents 177.0 344.7 8.6 19.4
335.0 517.2 223.3 217.9
e) Concentration
Concentration risk is defined as the risk associated with a reliance on transactions that carry a similar risk profile.
Management determines concentrations of risk through its standard risk management procedures, as detailed in the Board’s Report and Operating and Financial Review.
Management considers the Group’s main concentration of risk to be within rent and service charge arrears. The shared characteristic of this concentration is the social demographic of the client base that can be linked to lower credit quality. However, the arrears are from a number of types of tenancy:
• rental• sheltered housing• supported housing• care homes• students• commercial tenants• shared ownership• home ownership.
A reduced level of risk is associated with shared ownership and home ownership residents.
The maximum exposure to this risk is equal to the tenant rental arrears balance (net of provision) at 31 March 2017, £14.3 million (2016: £10.6 million) for the Group and £12.1 million (2016: £8.7 million) for the Association.
Information on the Group’s spread of lenders is explained in note 23d.
f) Market rate risk
Market risk applies to listed investments. Listed investments are exposed to fluctuations in market values that are outside the Group’s control. Listed investments at 31 March 2017 totalled £19.7 million (2016: £20.7 million) in the Group and £19.6 million (2016: £20.6 million) in the Association. The Group mitigates this risk by carrying out credit checks on all counterparties and investing only in those counterparties that achieve the desired credit agency rating. This is also explained in note 23d.
g) Collateral pledged
The Group holds debt servicing reserves if, and as, required by the various lenders. These are disclosed and described in note 14.
h) Collateral held
The Group does not hold any significant collateral.
Strategic report Financial statem
ents
93
i) Capital
The Group considers its capital balances to be share capital (note 27) and reserves (note 28). The revaluation reserve balance is entirely governed by market rates for listed investments. The revenue reserve is formed of Group surpluses and deficits from each year since the Group’s formation and it also contains gains on business combinations that have arisen following the acquisition of subsidiaries. Acquisitions of social housing businesses that are in substance the gift of one business to another are treated as non-exchange transactions. The fair value of the gift of the recognised assets and liabilities is treated as a gain or loss in the Statement of Comprehensive Income.
None of these capital balances has a significant degree of active management, other than in the case of current year Income Statement movement that contributes to revenue reserves, nor are there any restrictions on the Group in their use except for £0.2 million (2016: £0.2 million) in relation to Carr-Gomm which was acquired by the Group in 2010 and then transferred its engagements to the Association on 31 March 2011 (see note 28 regarding restricted reserves).
Within the Group, the reserves of a subsidiary, Glasgow Student Villages Limited, were previously treated as restricted in application; however during the year a revised business model was agreed between both parties and brought forward restricted reserves totalling £0.9 million were transferred to revenue reserves.
24. Operating leases
Non-cancellable operating lease rentals are payable as follows:
Group Association
2017£m
2016 Restated £m
2017 £m
2016 Restated £m
Land and buildings:
Under one year 3.2 3.3 3.2 3.3
In the second to fifth year inclusive 11.3 11.8 11.2 11.7
In more than five years 109.1 111.5 108.0 110.4
123.6 126.6 122.4 125.4
25. Deferred tax liabilities
A deferred tax liability exists within ASK (Greenwich) Limited, a 100% owned subsidiary of the Association.
Group Association
2017 £m 2016 £m 2017 £m 2016 £m
As at 1 April 1.3 1.1 - -
(Credit)/Charge to Income Statement (0.2) 0.2 - -
As at 31 March 1.1 1.3 - -
The balance relates to timing differences on taxation of unitary charge. Unitary charge refers to amounts due from Royal Borough of Greenwich under the terms of a Project Agreement.
Deferred tax is provided on temporary differences between the carrying amounts of assets and liabilities for financial reporting purposes and the amounts used for taxation purposes. The amount of deferred tax provided is based on the expected manner of realisation or settlement of the carrying amount of assets and liabilities, using tax rates enacted or substantively enacted at the reporting date.
A deferred tax asset is recognised only to the extent that it is probable that future taxable profits will be available against which the temporary difference can be utilised.
NOTES TO THE FINANCIAL STATEMENTS
FIN
AN
CIA
L ST
AT
EM
EN
TS
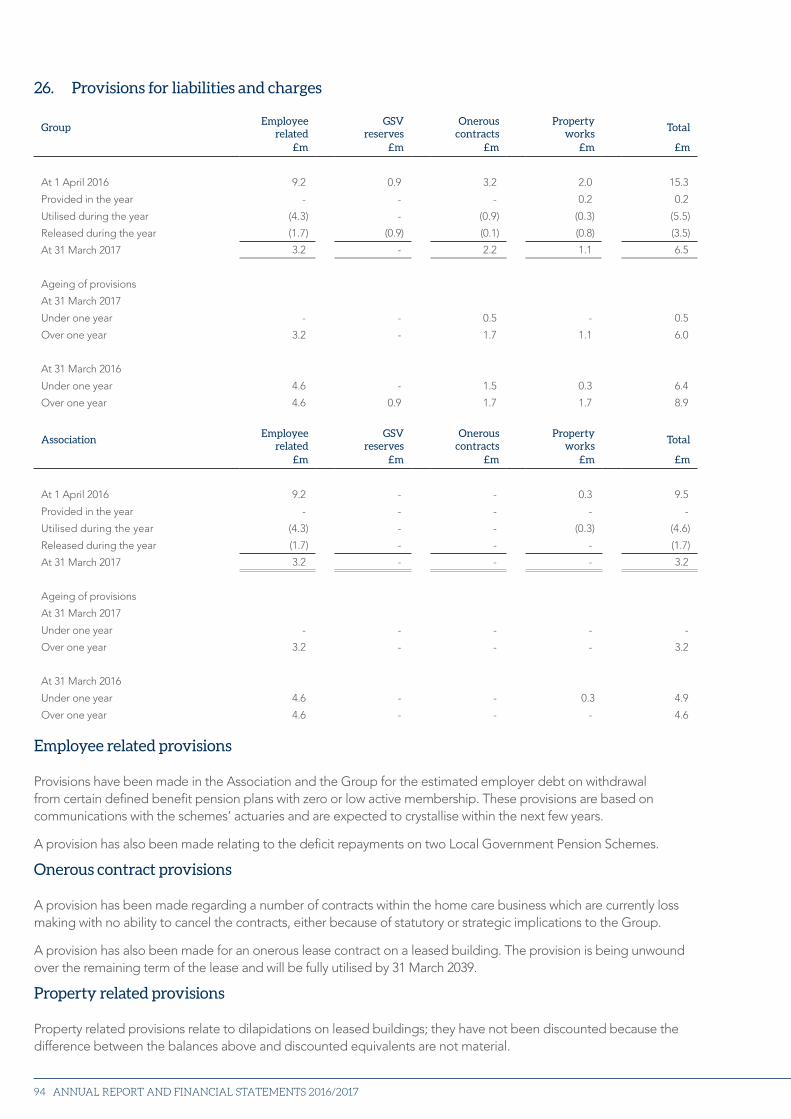
ANNUAL REPORT AND FINANCIAL STATEMENTS 2016/201794
26. Provisions for liabilities and charges
GroupEmployee
related GSV
reservesOnerous
contractsProperty
worksTotal
£m £m £m £m £m
At 1 April 2016 9.2 0.9 3.2 2.0 15.3
Provided in the year - - - 0.2 0.2
Utilised during the year (4.3) - (0.9) (0.3) (5.5)
Released during the year (1.7) (0.9) (0.1) (0.8) (3.5)
At 31 March 2017 3.2 - 2.2 1.1 6.5
Ageing of provisions
At 31 March 2017
Under one year - - 0.5 - 0.5
Over one year 3.2 - 1.7 1.1 6.0
At 31 March 2016
Under one year 4.6 - 1.5 0.3 6.4
Over one year 4.6 0.9 1.7 1.7 8.9
AssociationEmployee
related GSV
reservesOnerous
contractsProperty
worksTotal
£m £m £m £m £m
At 1 April 2016 9.2 - - 0.3 9.5
Provided in the year - - - - -
Utilised during the year (4.3) - - (0.3) (4.6)
Released during the year (1.7) - - - (1.7)
At 31 March 2017 3.2 - - - 3.2
Ageing of provisions
At 31 March 2017
Under one year - - - - -
Over one year 3.2 - - - 3.2
At 31 March 2016
Under one year 4.6 - - 0.3 4.9
Over one year 4.6 - - - 4.6
Employee related provisions
Provisions have been made in the Association and the Group for the estimated employer debt on withdrawal from certain defined benefit pension plans with zero or low active membership. These provisions are based on communications with the schemes’ actuaries and are expected to crystallise within the next few years.
A provision has also been made relating to the deficit repayments on two Local Government Pension Schemes.
Onerous contract provisions
A provision has been made regarding a number of contracts within the home care business which are currently loss making with no ability to cancel the contracts, either because of statutory or strategic implications to the Group.
A provision has also been made for an onerous lease contract on a leased building. The provision is being unwound over the remaining term of the lease and will be fully utilised by 31 March 2039.
Property related provisions
Property related provisions relate to dilapidations on leased buildings; they have not been discounted because the difference between the balances above and discounted equivalents are not material.
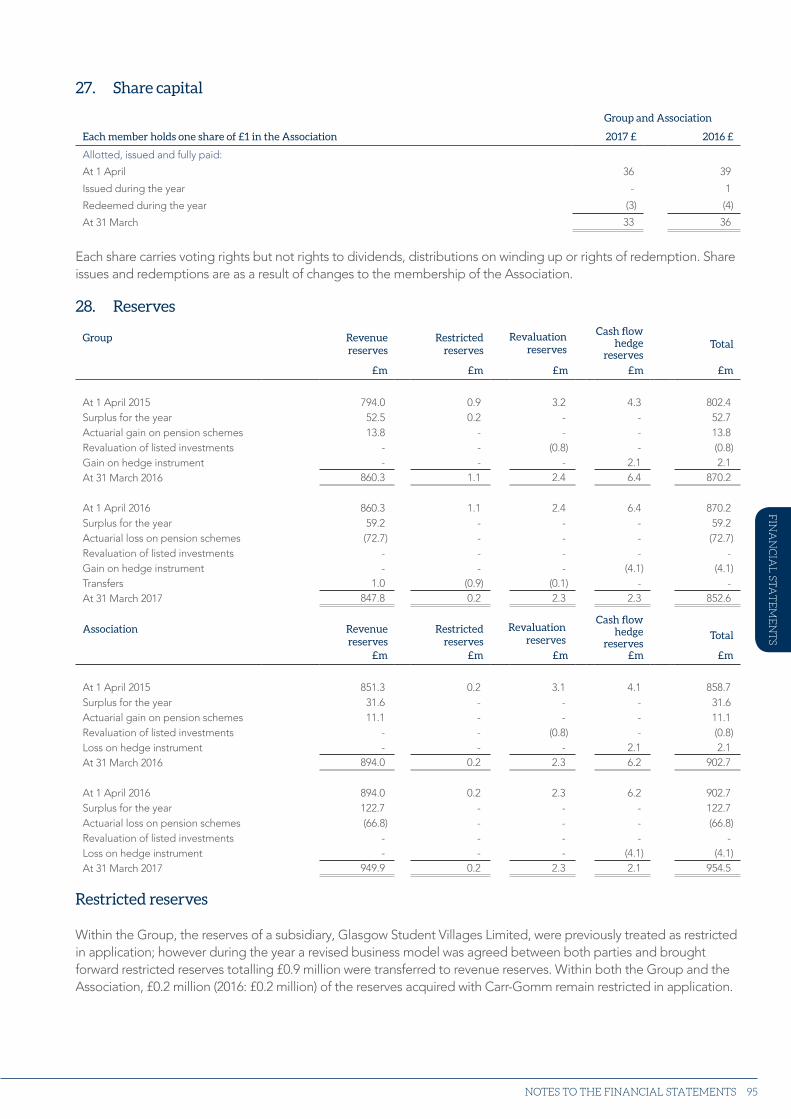
Strategic report Financial statem
ents
95
27. Share capital
Group and Association
Each member holds one share of £1 in the Association 2017 £ 2016 £
Allotted, issued and fully paid:
At 1 April 36 39
Issued during the year - 1
Redeemed during the year (3) (4)
At 31 March 33 36
Each share carries voting rights but not rights to dividends, distributions on winding up or rights of redemption. Share issues and redemptions are as a result of changes to the membership of the Association.
28. Reserves
Group Revenue reserves
Restricted reserves
Total
£m £m £m £m £m
At 1 April 2015 794.0 0.9 3.2 4.3 802.4Surplus for the year 52.5 0.2 - - 52.7Actuarial gain on pension schemes 13.8 - - - 13.8Revaluation of listed investments - - (0.8) - (0.8)Gain on hedge instrument - - - 2.1 2.1At 31 March 2016 860.3 1.1 2.4 6.4 870.2
At 1 April 2016 860.3 1.1 2.4 6.4 870.2Surplus for the year 59.2 - - - 59.2Actuarial loss on pension schemes (72.7) - - - (72.7)Revaluation of listed investments - - - - -Gain on hedge instrument - - - (4.1) (4.1)Transfers 1.0 (0.9) (0.1) - -At 31 March 2017 847.8 0.2 2.3 2.3 852.6
Association Revenue reserves
Restricted reserves
Total
£m £m £m £m £m
At 1 April 2015 851.3 0.2 3.1 4.1 858.7Surplus for the year 31.6 - - - 31.6Actuarial gain on pension schemes 11.1 - - - 11.1Revaluation of listed investments - - (0.8) - (0.8)Loss on hedge instrument - - - 2.1 2.1At 31 March 2016 894.0 0.2 2.3 6.2 902.7
At 1 April 2016 894.0 0.2 2.3 6.2 902.7Surplus for the year 122.7 - - - 122.7Actuarial loss on pension schemes (66.8) - - - (66.8)Revaluation of listed investments - - - - -Loss on hedge instrument - - - (4.1) (4.1)At 31 March 2017 949.9 0.2 2.3 2.1 954.5
Restricted reserves
Within the Group, the reserves of a subsidiary, Glasgow Student Villages Limited, were previously treated as restricted in application; however during the year a revised business model was agreed between both parties and brought forward restricted reserves totalling £0.9 million were transferred to revenue reserves. Within both the Group and the Association, £0.2 million (2016: £0.2 million) of the reserves acquired with Carr-Gomm remain restricted in application.
Revaluation reserves
Cash flow hedge
reserves
Revaluation reserves
Cash flow hedge
reserves
NOTES TO THE FINANCIAL STATEMENTS
wFIN
AN
CIA
L ST
AT
EM
EN
TS
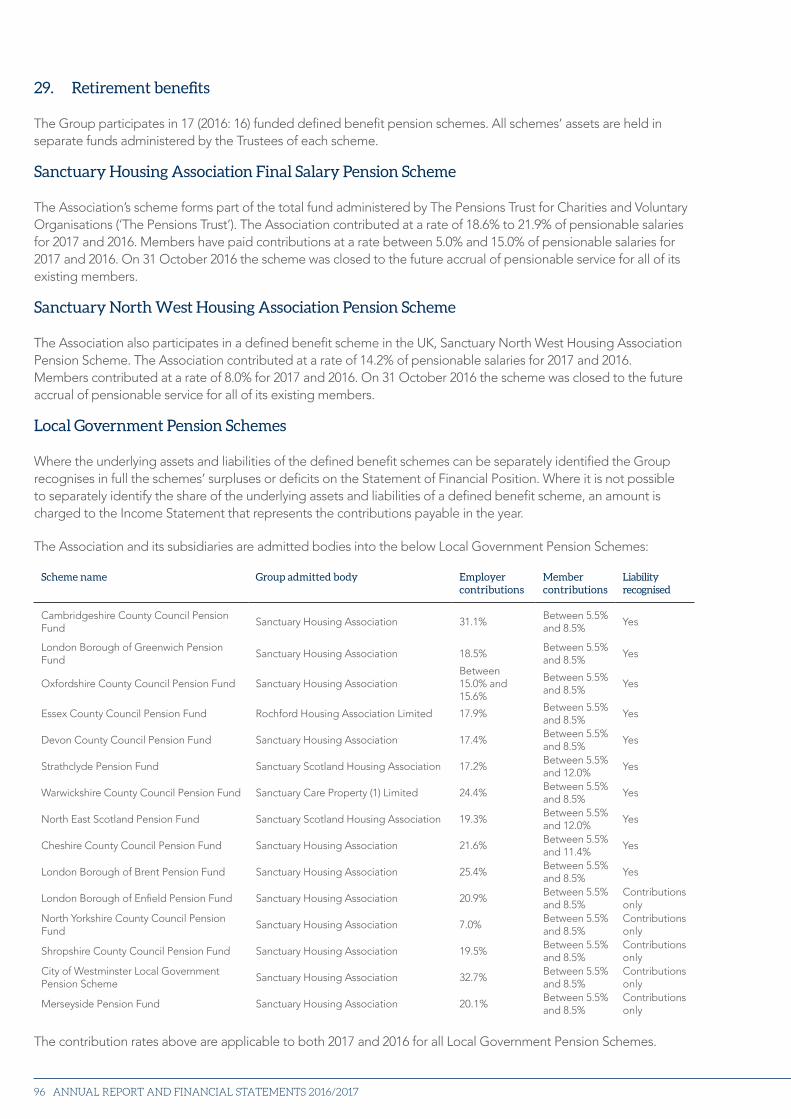
ANNUAL REPORT AND FINANCIAL STATEMENTS 2016/201796
29. Retirement benefits
The Group participates in 17 (2016: 16) funded defined benefit pension schemes. All schemes’ assets are held in separate funds administered by the Trustees of each scheme.
Sanctuary Housing Association Final Salary Pension Scheme
The Association’s scheme forms part of the total fund administered by The Pensions Trust for Charities and Voluntary Organisations (‘The Pensions Trust’). The Association contributed at a rate of 18.6% to 21.9% of pensionable salaries for 2017 and 2016. Members have paid contributions at a rate between 5.0% and 15.0% of pensionable salaries for 2017 and 2016. On 31 October 2016 the scheme was closed to the future accrual of pensionable service for all of its existing members.
Sanctuary North West Housing Association Pension Scheme
The Association also participates in a defined benefit scheme in the UK, Sanctuary North West Housing Association Pension Scheme. The Association contributed at a rate of 14.2% of pensionable salaries for 2017 and 2016. Members contributed at a rate of 8.0% for 2017 and 2016. On 31 October 2016 the scheme was closed to the future accrual of pensionable service for all of its existing members.
Local Government Pension Schemes
Where the underlying assets and liabilities of the defined benefit schemes can be separately identified the Group recognises in full the schemes’ surpluses or deficits on the Statement of Financial Position. Where it is not possible to separately identify the share of the underlying assets and liabilities of a defined benefit scheme, an amount is charged to the Income Statement that represents the contributions payable in the year.
The Association and its subsidiaries are admitted bodies into the below Local Government Pension Schemes:
Scheme name Group admitted body Employer contributions
Member contributions
Liability recognised
Cambridgeshire County Council Pension Fund
Sanctuary Housing Association 31.1%Between 5.5% and 8.5%
Yes
London Borough of Greenwich Pension Fund
Sanctuary Housing Association 18.5%Between 5.5% and 8.5%
Yes
Oxfordshire County Council Pension Fund Sanctuary Housing AssociationBetween 15.0% and 15.6%
Between 5.5% and 8.5%
Yes
Essex County Council Pension Fund Rochford Housing Association Limited 17.9%Between 5.5% and 8.5%
Yes
Devon County Council Pension Fund Sanctuary Housing Association 17.4%Between 5.5% and 8.5%
Yes
Strathclyde Pension Fund Sanctuary Scotland Housing Association 17.2%Between 5.5% and 12.0%
Yes
Warwickshire County Council Pension Fund Sanctuary Care Property (1) Limited 24.4%Between 5.5% and 8.5%
Yes
North East Scotland Pension Fund Sanctuary Scotland Housing Association 19.3%Between 5.5% and 12.0%
Yes
Cheshire County Council Pension Fund Sanctuary Housing Association 21.6%Between 5.5% and 11.4%
Yes
London Borough of Brent Pension Fund Sanctuary Housing Association 25.4%Between 5.5% and 8.5%
Yes
London Borough of Enfield Pension Fund Sanctuary Housing Association 20.9%Between 5.5% and 8.5%
Contributions only
North Yorkshire County Council Pension Fund
Sanctuary Housing Association 7.0%Between 5.5% and 8.5%
Contributions only
Shropshire County Council Pension Fund Sanctuary Housing Association 19.5%Between 5.5% and 8.5%
Contributions only
City of Westminster Local Government Pension Scheme
Sanctuary Housing Association 32.7%Between 5.5% and 8.5%
Contributions only
Merseyside Pension Fund Sanctuary Housing Association 20.1%Between 5.5% and 8.5%
Contributions only
The contribution rates above are applicable to both 2017 and 2016 for all Local Government Pension Schemes.
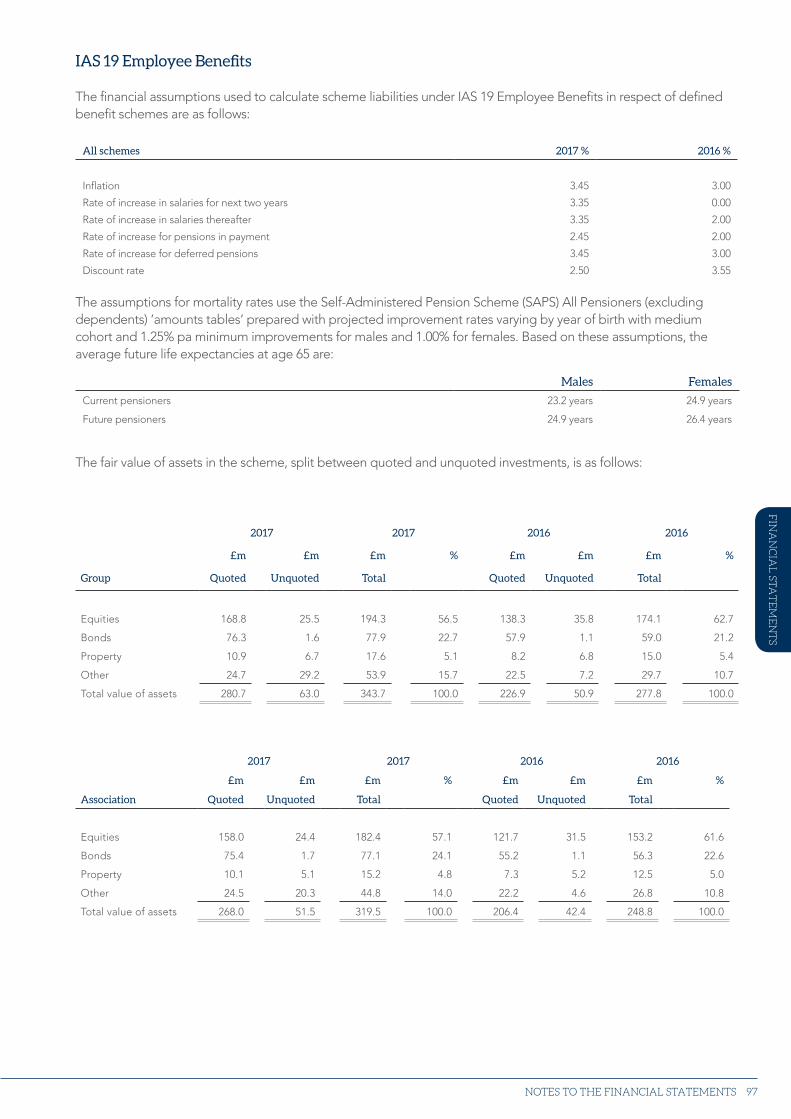
Strategic report Financial statem
ents
97
IAS 19 Employee Benefits
The financial assumptions used to calculate scheme liabilities under IAS 19 Employee Benefits in respect of defined benefit schemes are as follows:
All schemes 2017 % 2016 %
Inflation 3.45 3.00
Rate of increase in salaries for next two years 3.35 0.00
Rate of increase in salaries thereafter 3.35 2.00
Rate of increase for pensions in payment 2.45 2.00
Rate of increase for deferred pensions 3.45 3.00
Discount rate 2.50 3.55
The assumptions for mortality rates use the Self-Administered Pension Scheme (SAPS) All Pensioners (excluding dependents) ‘amounts tables‘ prepared with projected improvement rates varying by year of birth with medium cohort and 1.25% pa minimum improvements for males and 1.00% for females. Based on these assumptions, the average future life expectancies at age 65 are:
Males Females
Current pensioners 23.2 years 24.9 years
Future pensioners 24.9 years 26.4 years
NOTES TO THE FINANCIAL STATEMENTS
FIN
AN
CIA
L ST
AT
EM
EN
TS
The fair value of assets in the scheme, split between quoted and unquoted investments, is as follows:
2017 2017 2016 2016
£m £m £m % £m £m £m %
Group Quoted Unquoted Total Quoted Unquoted Total
Equities 168.8 25.5 194.3 56.5 138.3 35.8 174.1 62.7
Bonds 76.3 1.6 77.9 22.7 57.9 1.1 59.0 21.2
Property 10.9 6.7 17.6 5.1 8.2 6.8 15.0 5.4
Other 24.7 29.2 53.9 15.7 22.5 7.2 29.7 10.7
Total value of assets 280.7 63.0 343.7 100.0 226.9 50.9 277.8 100.0
2017 2017 2016 2016
£m £m £m % £m £m £m %
Association Quoted Unquoted Total Quoted Unquoted Total
Equities 158.0 24.4 182.4 57.1 121.7 31.5 153.2 61.6
Bonds 75.4 1.7 77.1 24.1 55.2 1.1 56.3 22.6
Property 10.1 5.1 15.2 4.8 7.3 5.2 12.5 5.0
Other 24.5 20.3 44.8 14.0 22.2 4.6 26.8 10.8
Total value of assets 268.0 51.5 319.5 100.0 206.4 42.4 248.8 100.0
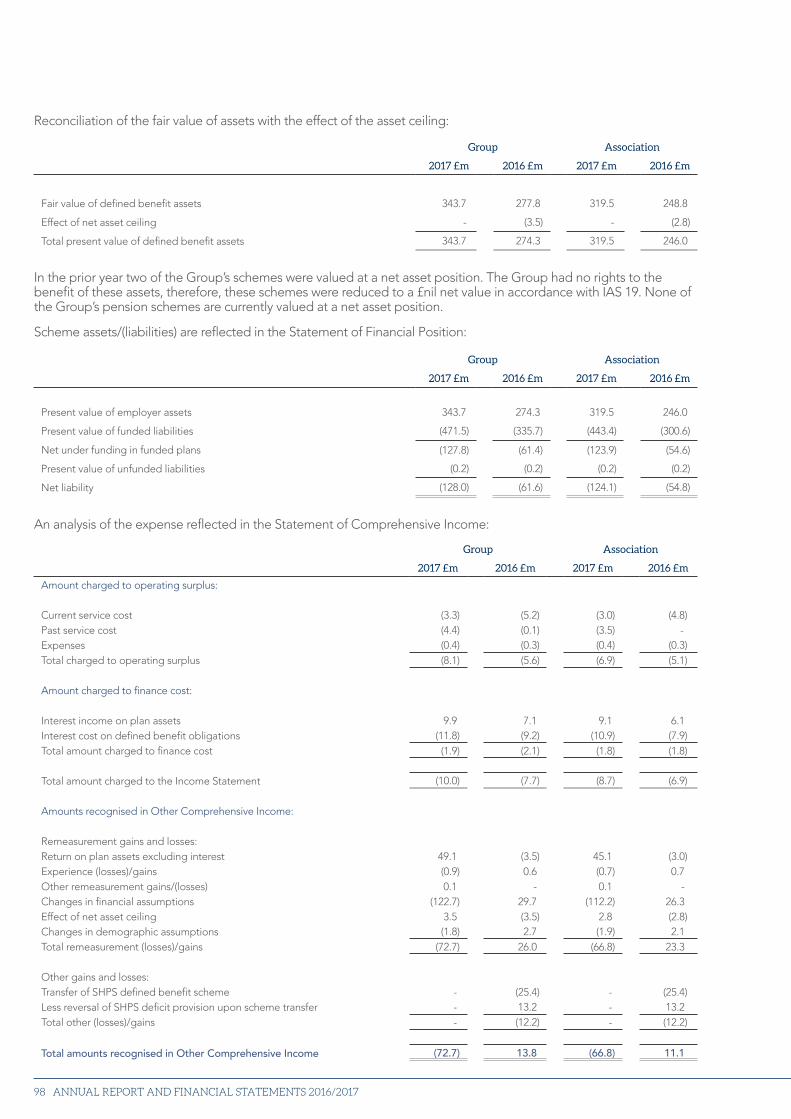
ANNUAL REPORT AND FINANCIAL STATEMENTS 2016/201798
An analysis of the expense reflected in the Statement of Comprehensive Income:
Group Association
2017 £m 2016 £m 2017 £m 2016 £m
Amount charged to operating surplus:
Current service cost (3.3) (5.2) (3.0) (4.8)Past service cost (4.4) (0.1) (3.5) -Expenses (0.4) (0.3) (0.4) (0.3)Total charged to operating surplus (8.1) (5.6) (6.9) (5.1)
Amount charged to finance cost:
Interest income on plan assets 9.9 7.1 9.1 6.1Interest cost on defined benefit obligations (11.8) (9.2) (10.9) (7.9)Total amount charged to finance cost (1.9) (2.1) (1.8) (1.8)
Total amount charged to the Income Statement (10.0) (7.7) (8.7) (6.9)
Amounts recognised in Other Comprehensive Income:
Remeasurement gains and losses:Return on plan assets excluding interest 49.1 (3.5) 45.1 (3.0)Experience (losses)/gains (0.9) 0.6 (0.7) 0.7Other remeasurement gains/(losses) 0.1 - 0.1 -Changes in financial assumptions (122.7) 29.7 (112.2) 26.3Effect of net asset ceiling 3.5 (3.5) 2.8 (2.8)Changes in demographic assumptions (1.8) 2.7 (1.9) 2.1Total remeasurement (losses)/gains (72.7) 26.0 (66.8) 23.3
Other gains and losses:Transfer of SHPS defined benefit scheme - (25.4) - (25.4)Less reversal of SHPS deficit provision upon scheme transfer - 13.2 - 13.2Total other (losses)/gains - (12.2) - (12.2)
Total amounts recognised in Other Comprehensive Income (72.7) 13.8 (66.8) 11.1
Reconciliation of the fair value of assets with the effect of the asset ceiling:
Group Association
2017 £m 2016 £m 2017 £m 2016 £m
Fair value of defined benefit assets 343.7 277.8 319.5 248.8
Effect of net asset ceiling - (3.5) - (2.8)
Total present value of defined benefit assets 343.7 274.3 319.5 246.0
In the prior year two of the Group’s schemes were valued at a net asset position. The Group had no rights to the benefit of these assets, therefore, these schemes were reduced to a £nil net value in accordance with IAS 19. None of the Group’s pension schemes are currently valued at a net asset position.
Scheme assets/(liabilities) are reflected in the Statement of Financial Position:
Group Association
2017 £m 2016 £m 2017 £m 2016 £m
Present value of employer assets 343.7 274.3 319.5 246.0
Present value of funded liabilities (471.5) (335.7) (443.4) (300.6)
Net under funding in funded plans (127.8) (61.4) (123.9) (54.6)
Present value of unfunded liabilities (0.2) (0.2) (0.2) (0.2)
Net liability (128.0) (61.6) (124.1) (54.8)
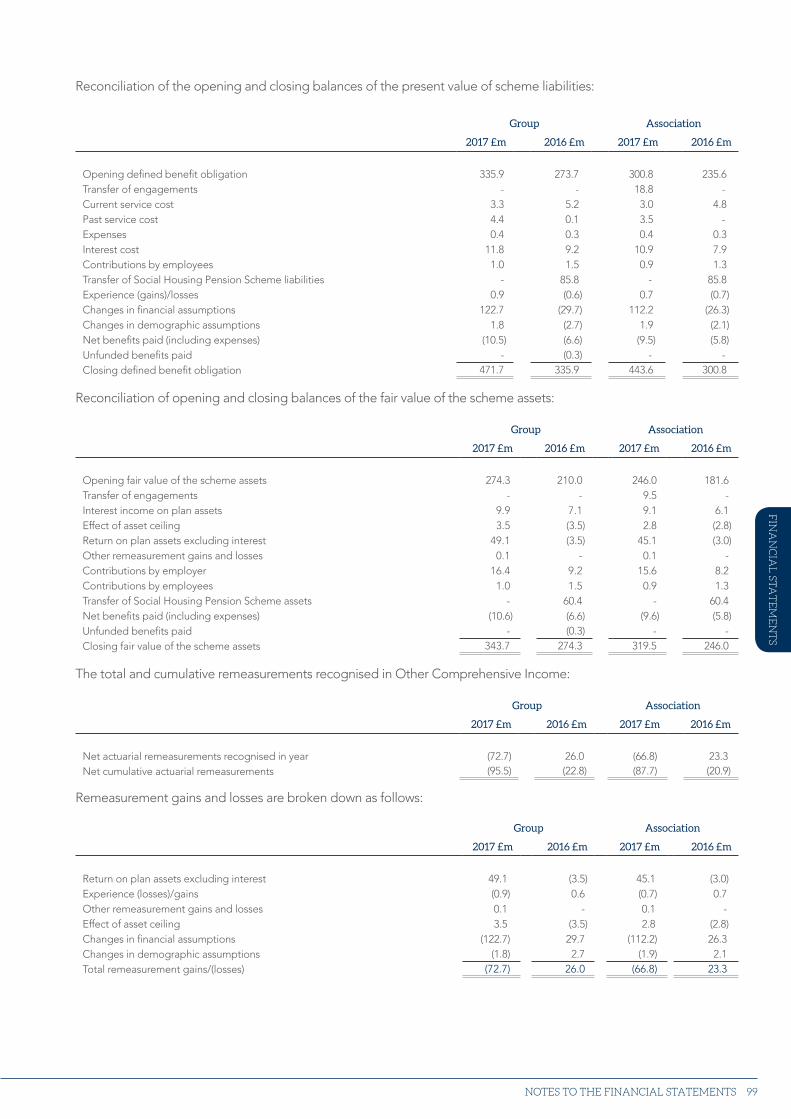
Strategic report Financial statem
ents
99
Reconciliation of the opening and closing balances of the present value of scheme liabilities:
Group Association
2017 £m 2016 £m 2017 £m 2016 £m
Opening defined benefit obligation 335.9 273.7 300.8 235.6Transfer of engagements - - 18.8 -Current service cost 3.3 5.2 3.0 4.8Past service cost 4.4 0.1 3.5 -Expenses 0.4 0.3 0.4 0.3Interest cost 11.8 9.2 10.9 7.9Contributions by employees 1.0 1.5 0.9 1.3Transfer of Social Housing Pension Scheme liabilities - 85.8 - 85.8Experience (gains)/losses 0.9 (0.6) 0.7 (0.7)Changes in financial assumptions 122.7 (29.7) 112.2 (26.3)Changes in demographic assumptions 1.8 (2.7) 1.9 (2.1)Net benefits paid (including expenses) (10.5) (6.6) (9.5) (5.8)Unfunded benefits paid - (0.3) - -Closing defined benefit obligation 471.7 335.9 443.6 300.8
Reconciliation of opening and closing balances of the fair value of the scheme assets:
Group Association
2017 £m 2016 £m 2017 £m 2016 £m
Opening fair value of the scheme assets 274.3 210.0 246.0 181.6Transfer of engagements - - 9.5 -Interest income on plan assets 9.9 7.1 9.1 6.1Effect of asset ceiling 3.5 (3.5) 2.8 (2.8)Return on plan assets excluding interest 49.1 (3.5) 45.1 (3.0)Other remeasurement gains and losses 0.1 - 0.1 -Contributions by employer 16.4 9.2 15.6 8.2Contributions by employees 1.0 1.5 0.9 1.3Transfer of Social Housing Pension Scheme assets - 60.4 - 60.4Net benefits paid (including expenses) (10.6) (6.6) (9.6) (5.8)Unfunded benefits paid - (0.3) - -Closing fair value of the scheme assets 343.7 274.3 319.5 246.0
The total and cumulative remeasurements recognised in Other Comprehensive Income:
Group Association
2017 £m 2016 £m 2017 £m 2016 £m
Net actuarial remeasurements recognised in year (72.7) 26.0 (66.8) 23.3Net cumulative actuarial remeasurements (95.5) (22.8) (87.7) (20.9)
Remeasurement gains and losses are broken down as follows:
Group Association
2017 £m 2016 £m 2017 £m 2016 £m
Return on plan assets excluding interest 49.1 (3.5) 45.1 (3.0)Experience (losses)/gains (0.9) 0.6 (0.7) 0.7Other remeasurement gains and losses 0.1 - 0.1 -Effect of asset ceiling 3.5 (3.5) 2.8 (2.8)Changes in financial assumptions (122.7) 29.7 (112.2) 26.3Changes in demographic assumptions (1.8) 2.7 (1.9) 2.1Total remeasurement gains/(losses) (72.7) 26.0 (66.8) 23.3
NOTES TO THE FINANCIAL STATEMENTS
FIN
AN
CIA
L ST
AT
EM
EN
TS
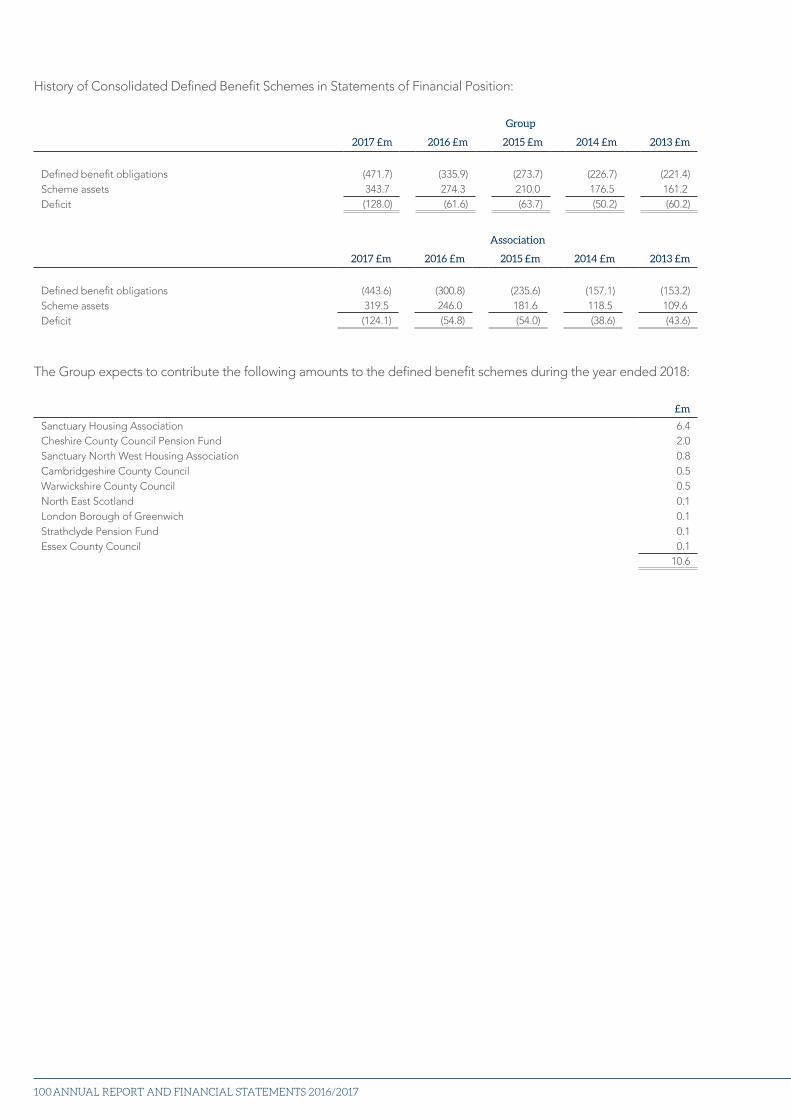
ANNUAL REPORT AND FINANCIAL STATEMENTS 2016/2017100
History of Consolidated Defined Benefit Schemes in Statements of Financial Position:
Group
2017 £m 2016 £m 2015 £m 2014 £m 2013 £m
Defined benefit obligations (471.7) (335.9) (273.7) (226.7) (221.4)Scheme assets 343.7 274.3 210.0 176.5 161.2Deficit (128.0) (61.6) (63.7) (50.2) (60.2)
Association
2017 £m 2016 £m 2015 £m 2014 £m 2013 £m
Defined benefit obligations (443.6) (300.8) (235.6) (157.1) (153.2)Scheme assets 319.5 246.0 181.6 118.5 109.6Deficit (124.1) (54.8) (54.0) (38.6) (43.6)
The Group expects to contribute the following amounts to the defined benefit schemes during the year ended 2018:
£m
Sanctuary Housing Association 6.4Cheshire County Council Pension Fund 2.0Sanctuary North West Housing Association 0.8Cambridgeshire County Council 0.5Warwickshire County Council 0.5North East Scotland 0.1London Borough of Greenwich 0.1Strathclyde Pension Fund 0.1Essex County Council 0.1
10.6
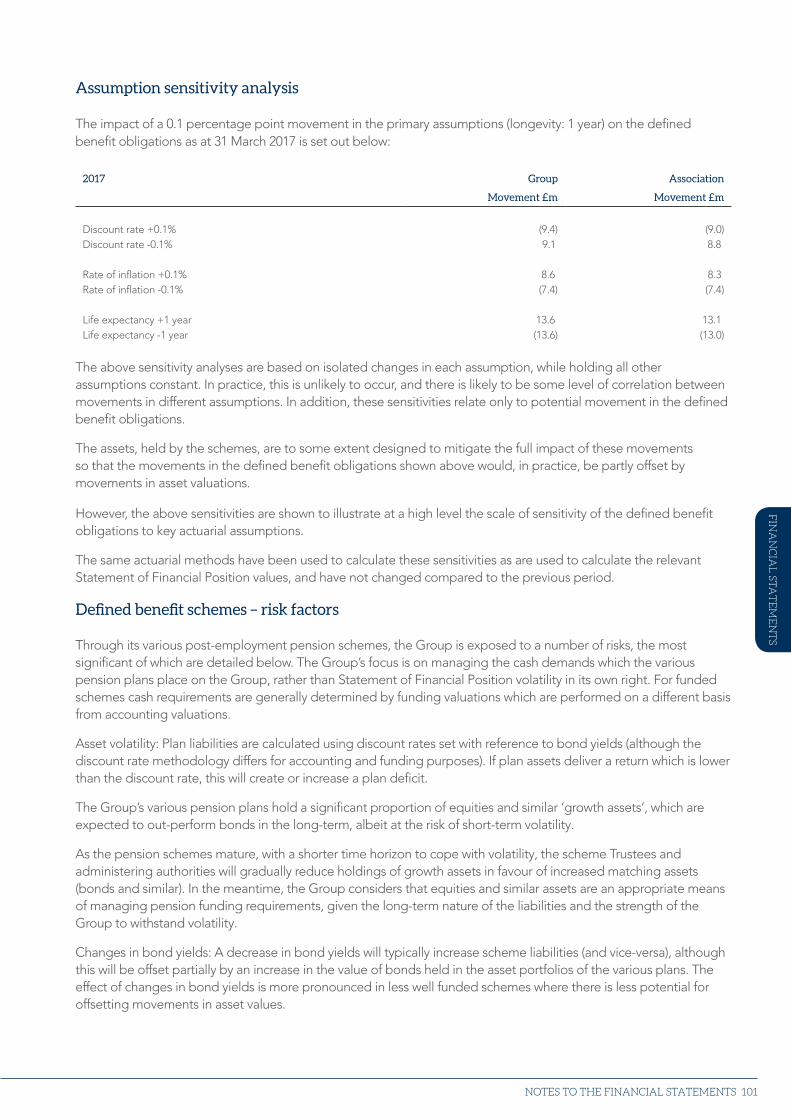
Strategic report Financial statem
ents
101
Assumption sensitivity analysis
The impact of a 0.1 percentage point movement in the primary assumptions (longevity: 1 year) on the defined benefit obligations as at 31 March 2017 is set out below:
2017 Group Association
Movement £m Movement £m
Discount rate +0.1% (9.4) (9.0)Discount rate -0.1% 9.1 8.8
Rate of inflation +0.1% 8.6 8.3 Rate of inflation -0.1% (7.4) (7.4)
Life expectancy +1 year 13.6 13.1Life expectancy -1 year (13.6) (13.0)
The above sensitivity analyses are based on isolated changes in each assumption, while holding all other assumptions constant. In practice, this is unlikely to occur, and there is likely to be some level of correlation between movements in different assumptions. In addition, these sensitivities relate only to potential movement in the defined benefit obligations.
The assets, held by the schemes, are to some extent designed to mitigate the full impact of these movements so that the movements in the defined benefit obligations shown above would, in practice, be partly offset by movements in asset valuations.
However, the above sensitivities are shown to illustrate at a high level the scale of sensitivity of the defined benefit obligations to key actuarial assumptions.
The same actuarial methods have been used to calculate these sensitivities as are used to calculate the relevant Statement of Financial Position values, and have not changed compared to the previous period.
Defined benefit schemes – risk factors
Through its various post-employment pension schemes, the Group is exposed to a number of risks, the most significant of which are detailed below. The Group’s focus is on managing the cash demands which the various pension plans place on the Group, rather than Statement of Financial Position volatility in its own right. For funded schemes cash requirements are generally determined by funding valuations which are performed on a different basis from accounting valuations.
Asset volatility: Plan liabilities are calculated using discount rates set with reference to bond yields (although the discount rate methodology differs for accounting and funding purposes). If plan assets deliver a return which is lower than the discount rate, this will create or increase a plan deficit.
The Group’s various pension plans hold a significant proportion of equities and similar ‘growth assets’, which are expected to out-perform bonds in the long-term, albeit at the risk of short-term volatility.
As the pension schemes mature, with a shorter time horizon to cope with volatility, the scheme Trustees and administering authorities will gradually reduce holdings of growth assets in favour of increased matching assets (bonds and similar). In the meantime, the Group considers that equities and similar assets are an appropriate means of managing pension funding requirements, given the long-term nature of the liabilities and the strength of the Group to withstand volatility.
Changes in bond yields: A decrease in bond yields will typically increase scheme liabilities (and vice-versa), although this will be offset partially by an increase in the value of bonds held in the asset portfolios of the various plans. The effect of changes in bond yields is more pronounced in less well funded schemes where there is less potential for offsetting movements in asset values.
NOTES TO THE FINANCIAL STATEMENTS
FIN
AN
CIA
L ST
AT
EM
EN
TS
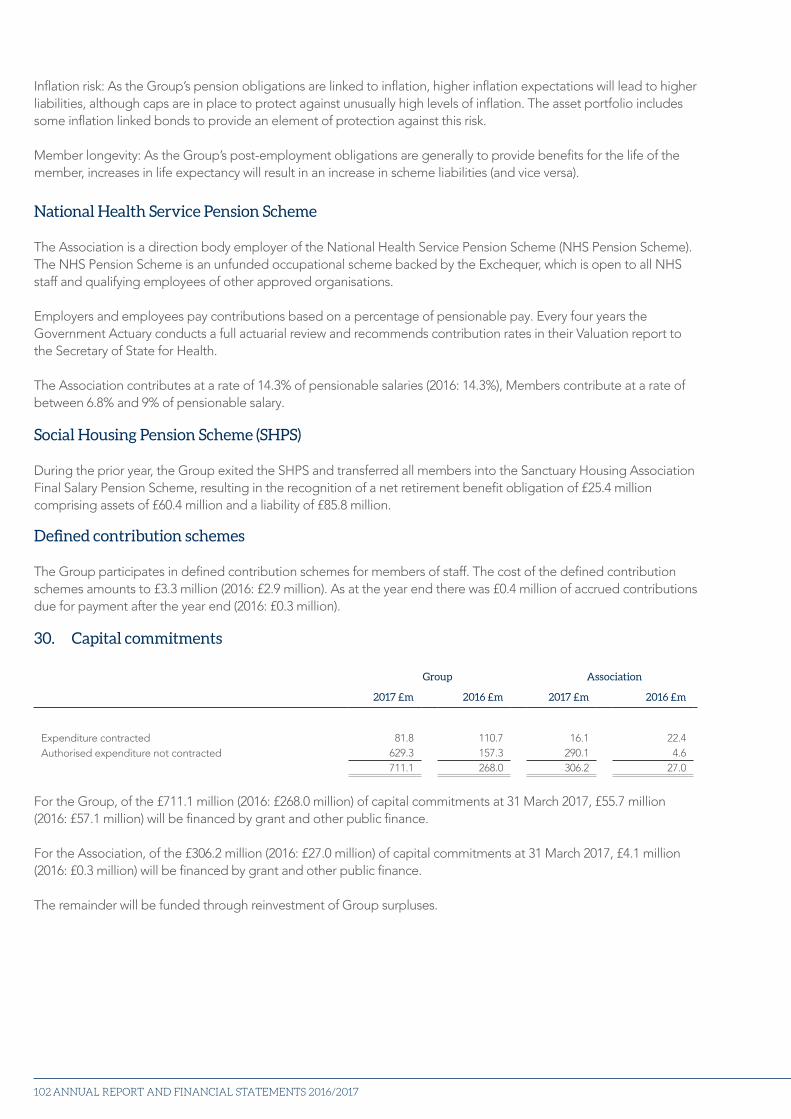
ANNUAL REPORT AND FINANCIAL STATEMENTS 2016/2017102
Inflation risk: As the Group’s pension obligations are linked to inflation, higher inflation expectations will lead to higher liabilities, although caps are in place to protect against unusually high levels of inflation. The asset portfolio includes some inflation linked bonds to provide an element of protection against this risk.
Member longevity: As the Group’s post-employment obligations are generally to provide benefits for the life of the member, increases in life expectancy will result in an increase in scheme liabilities (and vice versa).
National Health Service Pension Scheme
The Association is a direction body employer of the National Health Service Pension Scheme (NHS Pension Scheme). The NHS Pension Scheme is an unfunded occupational scheme backed by the Exchequer, which is open to all NHS staff and qualifying employees of other approved organisations.
Employers and employees pay contributions based on a percentage of pensionable pay. Every four years the Government Actuary conducts a full actuarial review and recommends contribution rates in their Valuation report to the Secretary of State for Health.
The Association contributes at a rate of 14.3% of pensionable salaries (2016: 14.3%), Members contribute at a rate of between 6.8% and 9% of pensionable salary.
Social Housing Pension Scheme (SHPS)
During the prior year, the Group exited the SHPS and transferred all members into the Sanctuary Housing Association Final Salary Pension Scheme, resulting in the recognition of a net retirement benefit obligation of £25.4 million comprising assets of £60.4 million and a liability of £85.8 million.
Defined contribution schemes
The Group participates in defined contribution schemes for members of staff. The cost of the defined contribution schemes amounts to £3.3 million (2016: £2.9 million). As at the year end there was £0.4 million of accrued contributions due for payment after the year end (2016: £0.3 million).
30. Capital commitments
Group Association
2017 £m 2016 £m 2017 £m 2016 £m
Expenditure contracted 81.8 110.7 16.1 22.4Authorised expenditure not contracted 629.3 157.3 290.1 4.6
711.1 268.0 306.2 27.0
For the Group, of the £711.1 million (2016: £268.0 million) of capital commitments at 31 March 2017, £55.7 million (2016: £57.1 million) will be financed by grant and other public finance.
For the Association, of the £306.2 million (2016: £27.0 million) of capital commitments at 31 March 2017, £4.1 million (2016: £0.3 million) will be financed by grant and other public finance.
The remainder will be funded through reinvestment of Group surpluses.
Strategic report Financial statem
ents
103
31. Agreements to improve existing properties
Where the Group and Association have entered into agreements to purchase property from a third party and subsequently enter into a sub-contracting agreement to carry out improvement works to the properties, the related assets and liabilities are shown at gross values unless the right of net settlement exists.
The Group has, in recent years, received a number of stock transfers from local authorities. As part of these transfers, each local authority has made a commitment to the Group to have the properties refurbished and modernised and brought into a good state of repair. Immediately prior to the transfer, each local authority contracted with the Group to carry out the refurbishment works on its behalf. Each local authority’s obligation to carry out the works is in effect matched by the Group’s obligation to carry out the works. As a specific right of set off exists, a net basis has been adopted in respect of these obligations and neither the asset nor the liability has been recognised. At 31 March 2017, the gross values of the balances that have been offset are £9.7 million (2016: £12.1 million).
NOTES TO THE FINANCIAL STATEMENTS
FIN
AN
CIA
L ST
AT
EM
EN
TS
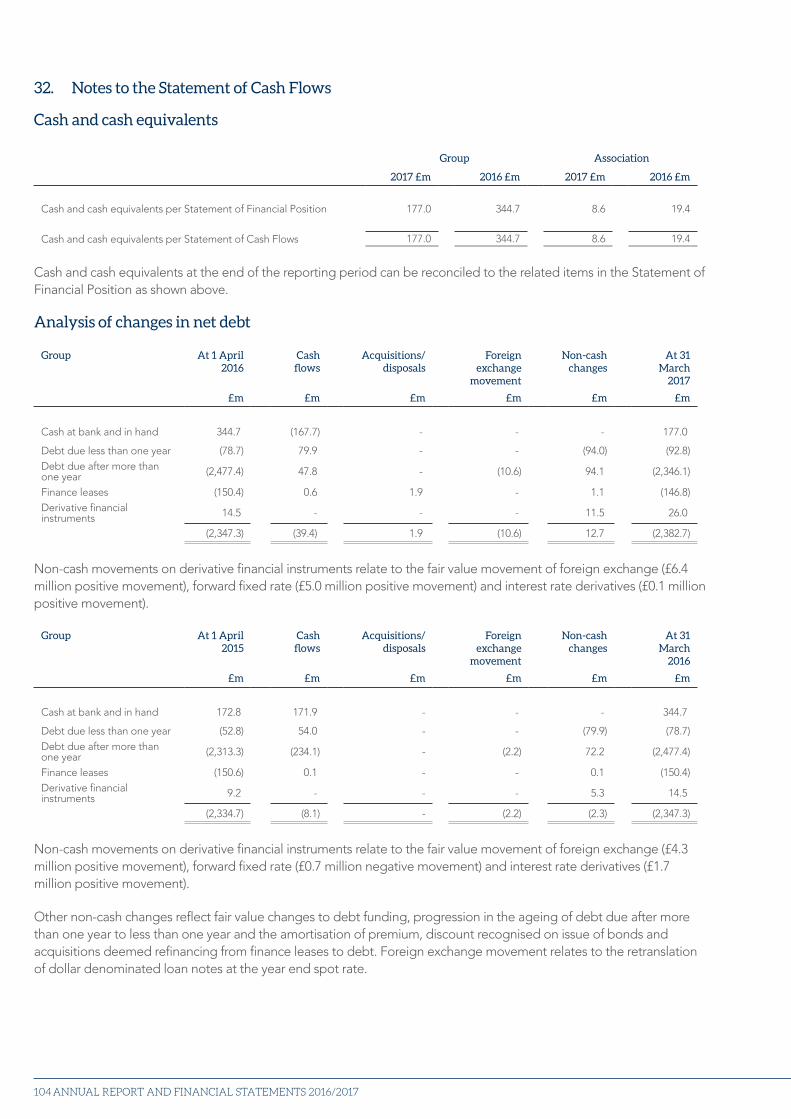
ANNUAL REPORT AND FINANCIAL STATEMENTS 2016/2017104
32. Notes to the Statement of Cash Flows
Cash and cash equivalents
Group Association
2017 £m 2016 £m 2017 £m 2016 £m
Cash and cash equivalents per Statement of Financial Position 177.0 344.7 8.6 19.4
Cash and cash equivalents per Statement of Cash Flows 177.0 344.7 8.6 19.4
Cash and cash equivalents at the end of the reporting period can be reconciled to the related items in the Statement of Financial Position as shown above.
Analysis of changes in net debt
Group At 1 April 2016
Cash flows
Acquisitions/ disposals
Foreign exchange
movement
Non-cash changes
At 31 March
2017
£m £m £m £m £m £m
Cash at bank and in hand 344.7 (167.7) - - - 177.0
Debt due less than one year (78.7) 79.9 - - (94.0) (92.8)Debt due after more than one year (2,477.4) 47.8 - (10.6) 94.1 (2,346.1)
Finance leases (150.4) 0.6 1.9 - 1.1 (146.8)Derivative financial instruments 14.5 - - - 11.5 26.0
(2,347.3) (39.4) 1.9 (10.6) 12.7 (2,382.7)
Non-cash movements on derivative financial instruments relate to the fair value movement of foreign exchange (£6.4 million positive movement), forward fixed rate (£5.0 million positive movement) and interest rate derivatives (£0.1 million positive movement).
Group At 1 April 2015
Cash flows
Acquisitions/ disposals
Foreign exchange
movement
Non-cash changes
At 31 March
2016
£m £m £m £m £m £m
Cash at bank and in hand 172.8 171.9 - - - 344.7
Debt due less than one year (52.8) 54.0 - - (79.9) (78.7)Debt due after more than one year (2,313.3) (234.1) - (2.2) 72.2 (2,477.4)
Finance leases (150.6) 0.1 - - 0.1 (150.4)Derivative financial instruments 9.2 - - - 5.3 14.5
(2,334.7) (8.1) - (2.2) (2.3) (2,347.3)
Non-cash movements on derivative financial instruments relate to the fair value movement of foreign exchange (£4.3 million positive movement), forward fixed rate (£0.7 million negative movement) and interest rate derivatives (£1.7 million positive movement).
Other non-cash changes reflect fair value changes to debt funding, progression in the ageing of debt due after more than one year to less than one year and the amortisation of premium, discount recognised on issue of bonds and acquisitions deemed refinancing from finance leases to debt. Foreign exchange movement relates to the retranslation of dollar denominated loan notes at the year end spot rate.
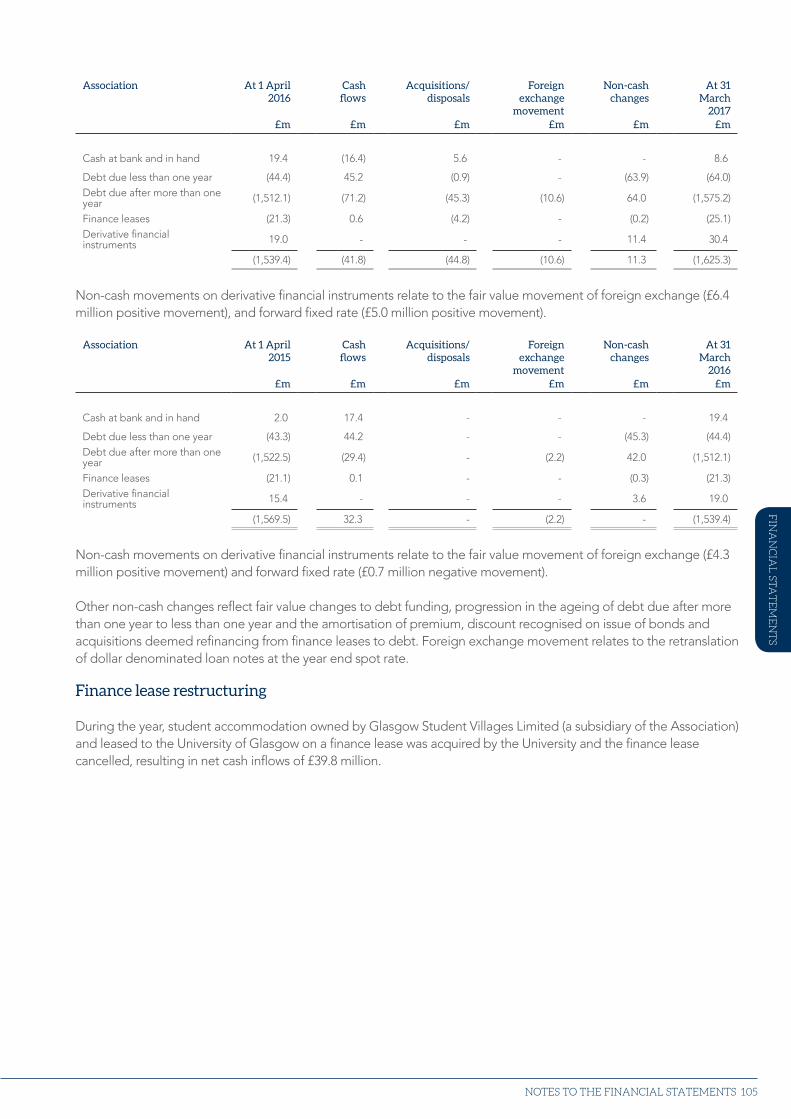
Strategic report Financial statem
ents
105
Association At 1 April 2016
Cash flows
Acquisitions/ disposals
Foreign exchange
movement
Non-cash changes
At 31 March
2017£m £m £m £m £m £m
Cash at bank and in hand 19.4 (16.4) 5.6 - - 8.6
Debt due less than one year (44.4) 45.2 (0.9) - (63.9) (64.0)Debt due after more than one year (1,512.1) (71.2) (45.3) (10.6) 64.0 (1,575.2)
Finance leases (21.3) 0.6 (4.2) - (0.2) (25.1)Derivative financial instruments 19.0 - - - 11.4 30.4
(1,539.4) (41.8) (44.8) (10.6) 11.3 (1,625.3)
Non-cash movements on derivative financial instruments relate to the fair value movement of foreign exchange (£6.4 million positive movement), and forward fixed rate (£5.0 million positive movement).
Association At 1 April 2015
Cash flows
Acquisitions/ disposals
Foreign exchange
movement
Non-cash changes
At 31 March
2016£m £m £m £m £m £m
Cash at bank and in hand 2.0 17.4 - - - 19.4
Debt due less than one year (43.3) 44.2 - - (45.3) (44.4)Debt due after more than one year (1,522.5) (29.4) - (2.2) 42.0 (1,512.1)
Finance leases (21.1) 0.1 - - (0.3) (21.3)Derivative financial instruments 15.4 - - - 3.6 19.0
(1,569.5) 32.3 - (2.2) - (1,539.4)
Non-cash movements on derivative financial instruments relate to the fair value movement of foreign exchange (£4.3 million positive movement) and forward fixed rate (£0.7 million negative movement).
Other non-cash changes reflect fair value changes to debt funding, progression in the ageing of debt due after more than one year to less than one year and the amortisation of premium, discount recognised on issue of bonds and acquisitions deemed refinancing from finance leases to debt. Foreign exchange movement relates to the retranslation of dollar denominated loan notes at the year end spot rate.
Finance lease restructuring
During the year, student accommodation owned by Glasgow Student Villages Limited (a subsidiary of the Association) and leased to the University of Glasgow on a finance lease was acquired by the University and the finance lease cancelled, resulting in net cash inflows of £39.8 million.
NOTES TO THE FINANCIAL STATEMENTS
FIN
AN
CIA
L ST
AT
EM
EN
TS
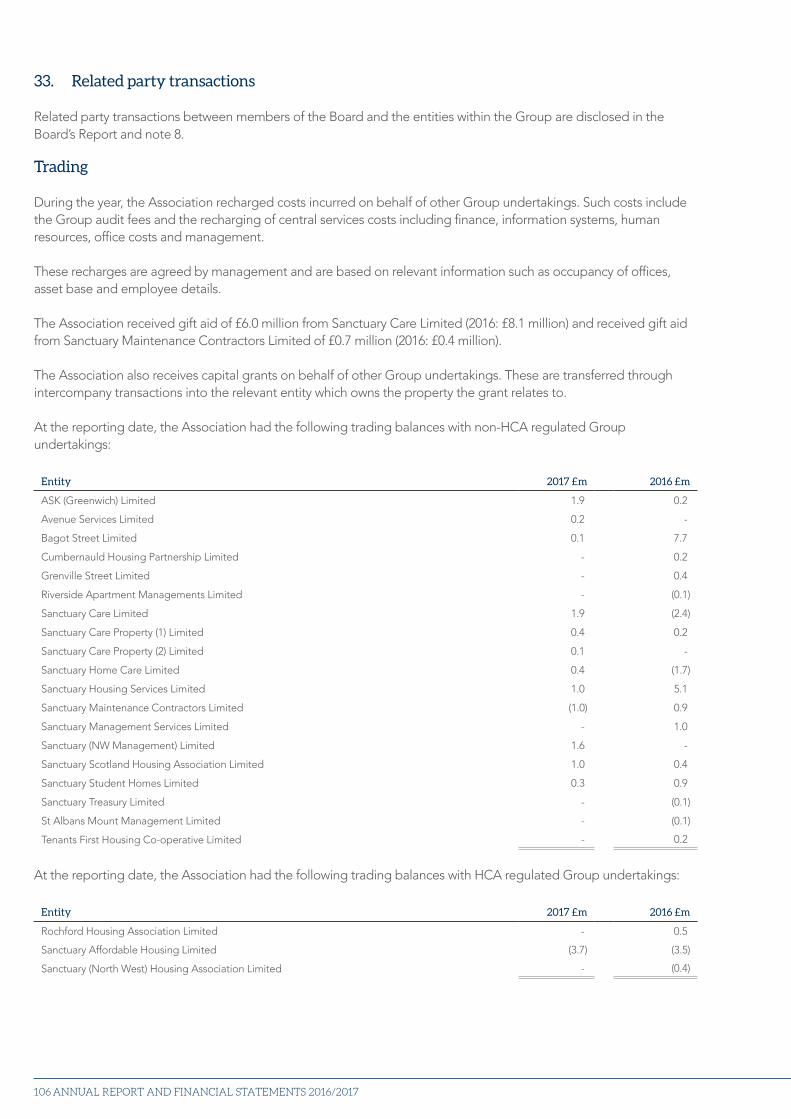
ANNUAL REPORT AND FINANCIAL STATEMENTS 2016/2017106
33. Related party transactions
Related party transactions between members of the Board and the entities within the Group are disclosed in the Board’s Report and note 8.
Trading
During the year, the Association recharged costs incurred on behalf of other Group undertakings. Such costs include the Group audit fees and the recharging of central services costs including finance, information systems, human resources, office costs and management.
These recharges are agreed by management and are based on relevant information such as occupancy of offices, asset base and employee details.
The Association received gift aid of £6.0 million from Sanctuary Care Limited (2016: £8.1 million) and received gift aid from Sanctuary Maintenance Contractors Limited of £0.7 million (2016: £0.4 million).
The Association also receives capital grants on behalf of other Group undertakings. These are transferred through intercompany transactions into the relevant entity which owns the property the grant relates to.
At the reporting date, the Association had the following trading balances with non-HCA regulated Group undertakings:
Entity 2017 £m 2016 £m
ASK (Greenwich) Limited 1.9 0.2
Avenue Services Limited 0.2 -
Bagot Street Limited 0.1 7.7
Cumbernauld Housing Partnership Limited - 0.2
Grenville Street Limited - 0.4
Riverside Apartment Managements Limited - (0.1)
Sanctuary Care Limited 1.9 (2.4)
Sanctuary Care Property (1) Limited 0.4 0.2
Sanctuary Care Property (2) Limited 0.1 -
Sanctuary Home Care Limited 0.4 (1.7)
Sanctuary Housing Services Limited 1.0 5.1
Sanctuary Maintenance Contractors Limited (1.0) 0.9
Sanctuary Management Services Limited - 1.0
Sanctuary (NW Management) Limited 1.6 -
Sanctuary Scotland Housing Association Limited 1.0 0.4
Sanctuary Student Homes Limited 0.3 0.9
Sanctuary Treasury Limited - (0.1)
St Albans Mount Management Limited - (0.1)
Tenants First Housing Co-operative Limited - 0.2
At the reporting date, the Association had the following trading balances with HCA regulated Group undertakings:
Entity 2017 £m 2016 £m
Rochford Housing Association Limited - 0.5
Sanctuary Affordable Housing Limited (3.7) (3.5)
Sanctuary (North West) Housing Association Limited - (0.4)
Strategic report Financial statem
ents
107
Loans
The Association has loan balances with other Group undertakings at the reporting date.
The Association both receives and allocates funds to other Group undertakings. These loans are arranged at commercial terms and, as appropriate, secured against the assets of each entity.
At the reporting date, the Association had the following loan and finance lease balances with non-HCA regulated Group undertakings:
Entity 2017 £m 2016 £m
Loans
ASK (Holdings) Limited 1.2 1.3
Cumbernauld Housing Partnership Limited - 4.9
Sanctuary Care Property (1) Limited - 0.3
Sanctuary Care Property (2) Limited 26.0 26.0
Grenville Street Limited 5.5 5.5
Sanctuary Home Care Limited - 1.3
Sanctuary Scotland Housing Association Limited 1.5 1.6
Sanctuary Student Homes Limited 19.4 12.6
Sanctuary Student Properties Limited 26.9 26.9
Sanctuary Treasury Limited* (651.2) (607.1)
Finance leasesSanctuary Student Properties Limited (4.4) -
*Sanctuary Treasury Limited is an onward lender of bond monies drawn down by its subsidiary company, Sanctuary Capital Plc, to the rest of the Group, including the Association.
At the reporting date, the Association had the following loan balances with HCA regulated Group undertakings:
Entity 2017 £m 2016 £m
Rochford Housing Association Limited - 9.0
Accrued interest
Related party loan net interest accrued in the Association with non-HCA regulated Group entities at the reporting date is as follows:
Entity 2017 £m 2016 £m
ASK (Holdings) Limited 0.1 0.1
Grenville Street Limited 0.1 0.1
Sanctuary Care Property (2) Limited 2.7 1.3
Sanctuary Student Properties Limited 2.6 2.4
Sanctuary Treasury Limited* (5.0) (5.2)
*Accrued interest payable on loan balances owed to Sanctuary Treasury Limited.
Related party loan net interest accrued in the Association with HCA regulated Group entities at the reporting date is as follows:
Entity 2017 £m 2016 £m
Rochford Housing Association Limited - 0.1
Related party transactions between members of the Board and the entities within the Group are disclosed in the Board’s Report and note 8. Transactions between the Group and joint ventures, associates and trade investments are disclosed on the following pages.
NOTES TO THE FINANCIAL STATEMENTS
FIN
AN
CIA
L ST
AT
EM
EN
TS
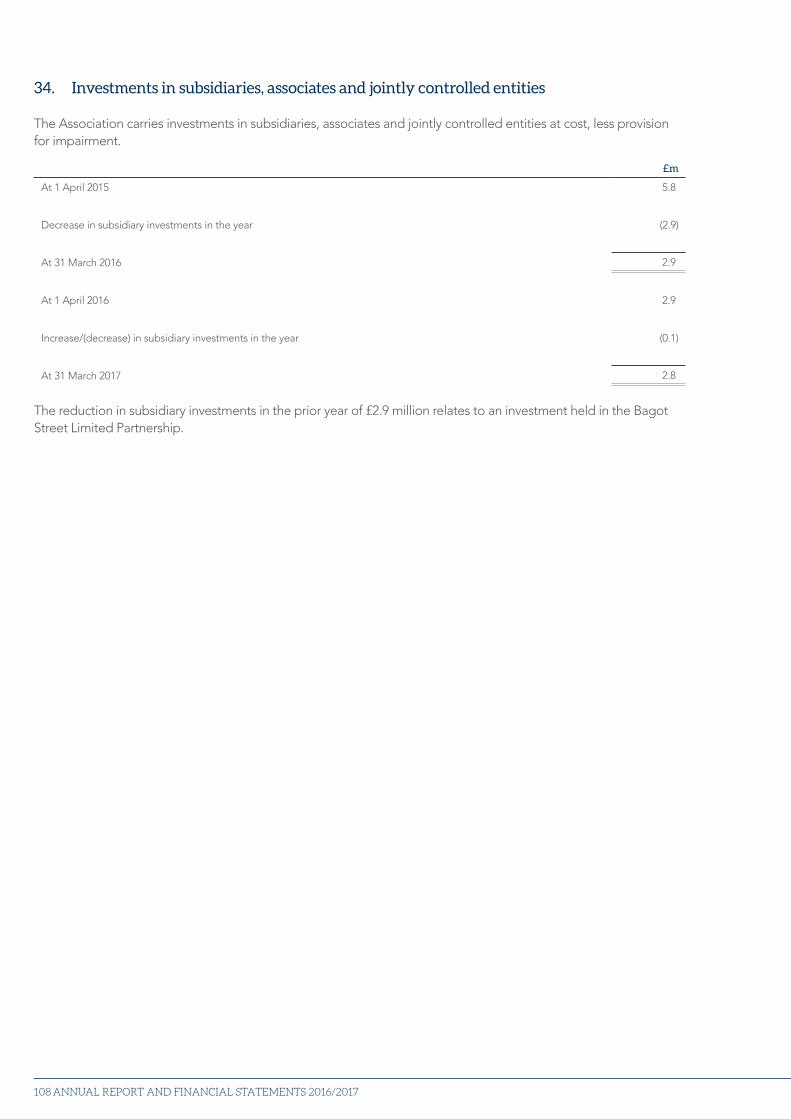
ANNUAL REPORT AND FINANCIAL STATEMENTS 2016/2017108
34. Investments in subsidiaries, associates and jointly controlled entities
The Association carries investments in subsidiaries, associates and jointly controlled entities at cost, less provision for impairment.
£m
At 1 April 2015 5.8
Decrease in subsidiary investments in the year (2.9)
At 31 March 2016 2.9
At 1 April 2016 2.9
Increase/(decrease) in subsidiary investments in the year (0.1)
At 31 March 2017 2.8
The reduction in subsidiary investments in the prior year of £2.9 million relates to an investment held in the Bagot Street Limited Partnership.
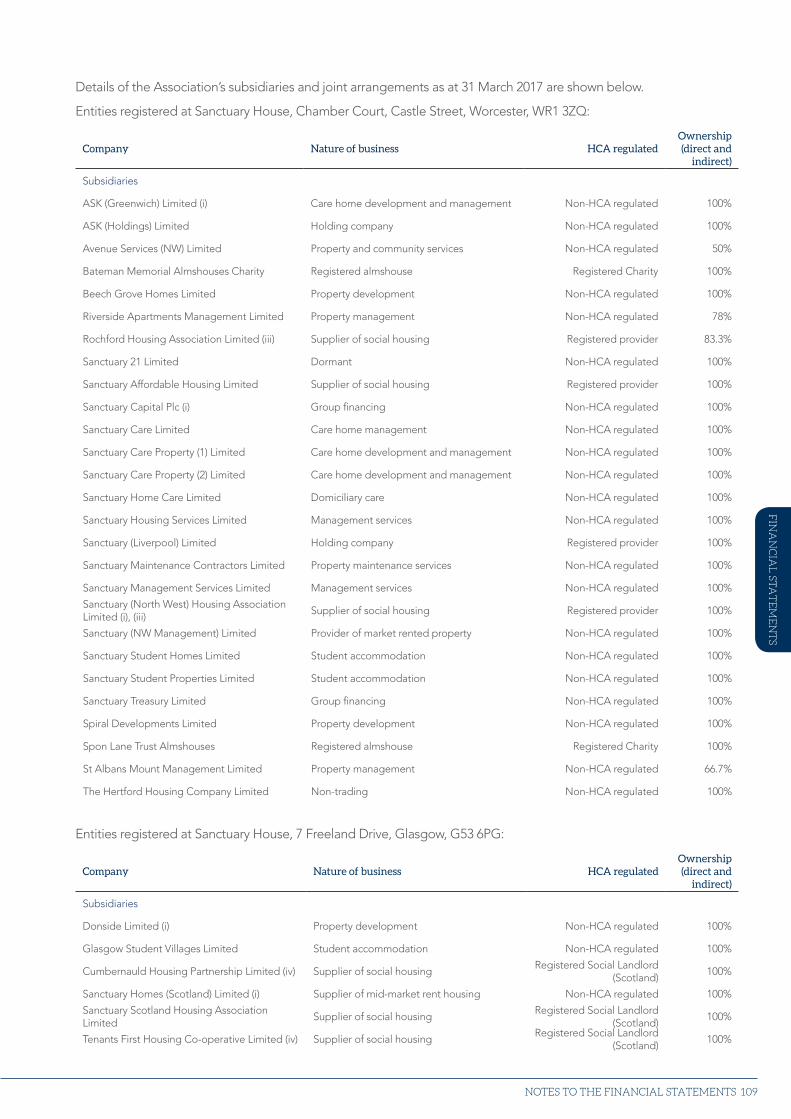
Strategic report Financial statem
ents
109
Details of the Association’s subsidiaries and joint arrangements as at 31 March 2017 are shown below.
Entities registered at Sanctuary House, Chamber Court, Castle Street, Worcester, WR1 3ZQ:
Company Nature of business HCA regulatedOwnership (direct and
indirect)
Subsidiaries
ASK (Greenwich) Limited (i) Care home development and management Non-HCA regulated 100%
ASK (Holdings) Limited Holding company Non-HCA regulated 100%
Avenue Services (NW) Limited Property and community services Non-HCA regulated 50%
Bateman Memorial Almshouses Charity Registered almshouse Registered Charity 100%
Beech Grove Homes Limited Property development Non-HCA regulated 100%
Riverside Apartments Management Limited Property management Non-HCA regulated 78%
Rochford Housing Association Limited (iii) Supplier of social housing Registered provider 83.3%
Sanctuary 21 Limited Dormant Non-HCA regulated 100%
Sanctuary Affordable Housing Limited Supplier of social housing Registered provider 100%
Sanctuary Capital Plc (i) Group financing Non-HCA regulated 100%
Sanctuary Care Limited Care home management Non-HCA regulated 100%
Sanctuary Care Property (1) Limited Care home development and management Non-HCA regulated 100%
Sanctuary Care Property (2) Limited Care home development and management Non-HCA regulated 100%
Sanctuary Home Care Limited Domiciliary care Non-HCA regulated 100%
Sanctuary Housing Services Limited Management services Non-HCA regulated 100%
Sanctuary (Liverpool) Limited Holding company Registered provider 100%
Sanctuary Maintenance Contractors Limited Property maintenance services Non-HCA regulated 100%
Sanctuary Management Services Limited Management services Non-HCA regulated 100%
Sanctuary (North West) Housing Association Limited (i), (iii)
Supplier of social housing Registered provider 100%
Sanctuary (NW Management) Limited Provider of market rented property Non-HCA regulated 100%
Sanctuary Student Homes Limited Student accommodation Non-HCA regulated 100%
Sanctuary Student Properties Limited Student accommodation Non-HCA regulated 100%
Sanctuary Treasury Limited Group financing Non-HCA regulated 100%
Spiral Developments Limited Property development Non-HCA regulated 100%
Spon Lane Trust Almshouses Registered almshouse Registered Charity 100%
St Albans Mount Management Limited Property management Non-HCA regulated 66.7%
The Hertford Housing Company Limited Non-trading Non-HCA regulated 100%
Entities registered at Sanctuary House, 7 Freeland Drive, Glasgow, G53 6PG:
Company Nature of business HCA regulatedOwnership (direct and
indirect)
Subsidiaries
Donside Limited (i) Property development Non-HCA regulated 100%
Glasgow Student Villages Limited Student accommodation Non-HCA regulated 100%
Cumbernauld Housing Partnership Limited (iv) Supplier of social housingRegistered Social Landlord
(Scotland)100%
Sanctuary Homes (Scotland) Limited (i) Supplier of mid-market rent housing Non-HCA regulated 100%
Sanctuary Scotland Housing Association Limited
Supplier of social housingRegistered Social Landlord
(Scotland)100%
Tenants First Housing Co-operative Limited (iv) Supplier of social housingRegistered Social Landlord
(Scotland)100%
NOTES TO THE FINANCIAL STATEMENTS
FIN
AN
CIA
L ST
AT
EM
EN
TS
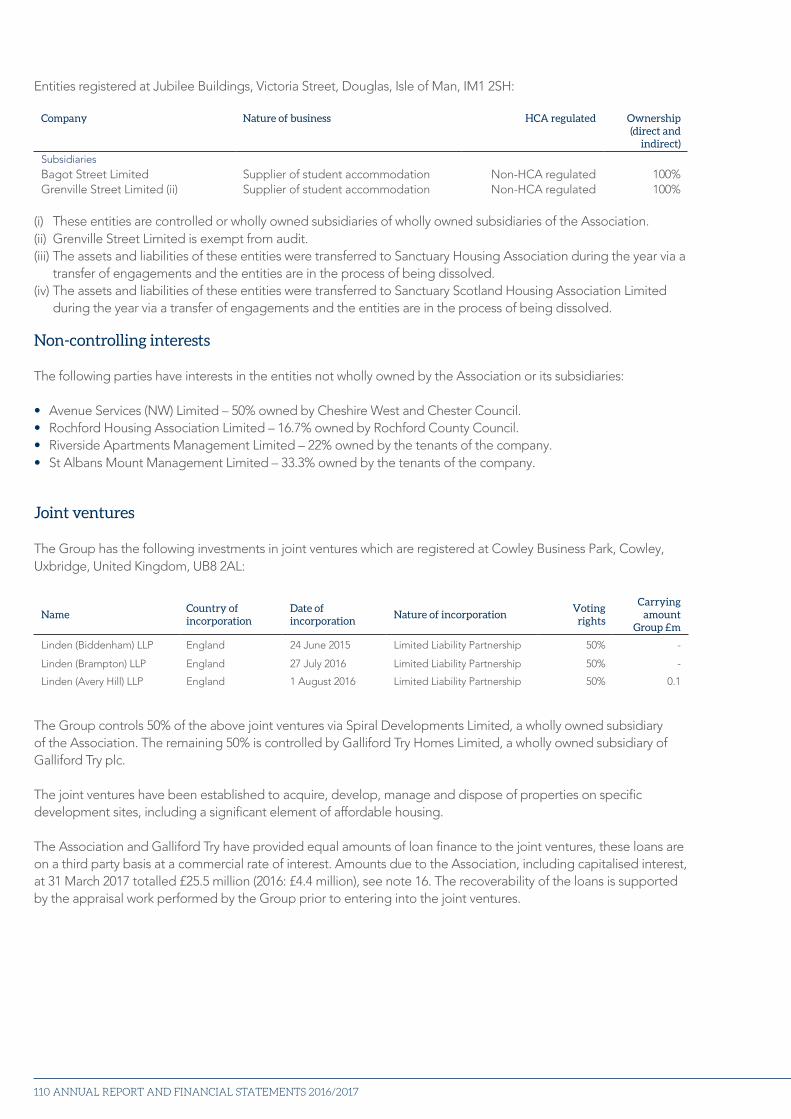
ANNUAL REPORT AND FINANCIAL STATEMENTS 2016/2017110
Entities registered at Jubilee Buildings, Victoria Street, Douglas, Isle of Man, IM1 2SH:
Company Nature of business HCA regulated Ownership (direct and
indirect)
SubsidiariesBagot Street Limited Supplier of student accommodation Non-HCA regulated 100%Grenville Street Limited (ii) Supplier of student accommodation Non-HCA regulated 100%
(i) These entities are controlled or wholly owned subsidiaries of wholly owned subsidiaries of the Association. (ii) Grenville Street Limited is exempt from audit.(iii) The assets and liabilities of these entities were transferred to Sanctuary Housing Association during the year via a
transfer of engagements and the entities are in the process of being dissolved.(iv) The assets and liabilities of these entities were transferred to Sanctuary Scotland Housing Association Limited
during the year via a transfer of engagements and the entities are in the process of being dissolved.
Non-controlling interests
The following parties have interests in the entities not wholly owned by the Association or its subsidiaries:
• Avenue Services (NW) Limited – 50% owned by Cheshire West and Chester Council.• Rochford Housing Association Limited – 16.7% owned by Rochford County Council.• Riverside Apartments Management Limited – 22% owned by the tenants of the company.• St Albans Mount Management Limited – 33.3% owned by the tenants of the company.
Joint ventures
The Group has the following investments in joint ventures which are registered at Cowley Business Park, Cowley, Uxbridge, United Kingdom, UB8 2AL:
NameCountry of incorporation
Date of incorporation
Nature of incorporationVoting
rights
Carrying amount
Group £m
Linden (Biddenham) LLP England 24 June 2015 Limited Liability Partnership 50% -
Linden (Brampton) LLP England 27 July 2016 Limited Liability Partnership 50% -
Linden (Avery Hill) LLP England 1 August 2016 Limited Liability Partnership 50% 0.1
The Group controls 50% of the above joint ventures via Spiral Developments Limited, a wholly owned subsidiary of the Association. The remaining 50% is controlled by Galliford Try Homes Limited, a wholly owned subsidiary of Galliford Try plc.
The joint ventures have been established to acquire, develop, manage and dispose of properties on specific development sites, including a significant element of affordable housing.
The Association and Galliford Try have provided equal amounts of loan finance to the joint ventures, these loans are on a third party basis at a commercial rate of interest. Amounts due to the Association, including capitalised interest, at 31 March 2017 totalled £25.5 million (2016: £4.4 million), see note 16. The recoverability of the loans is supported by the appraisal work performed by the Group prior to entering into the joint ventures.
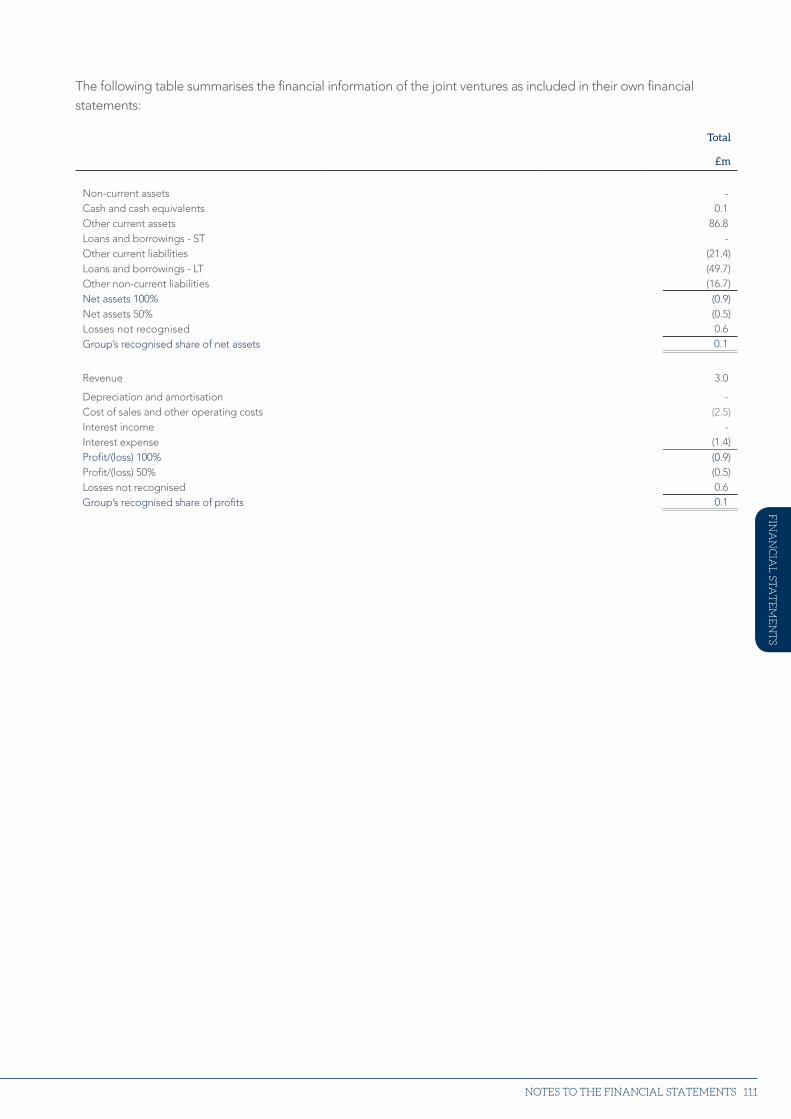
Strategic report Financial statem
ents
111
The following table summarises the financial information of the joint ventures as included in their own financial statements:
Total
£m
Non-current assets -Cash and cash equivalents 0.1Other current assets 86.8Loans and borrowings - ST -Other current liabilities (21.4)Loans and borrowings - LT (49.7)Other non-current liabilities (16.7)Net assets 100% (0.9)Net assets 50% (0.5)Losses not recognised 0.6Group’s recognised share of net assets 0.1
Revenue 3.0
Depreciation and amortisation -Cost of sales and other operating costs (2.5)Interest income -Interest expense (1.4)Profit/(loss) 100% (0.9)Profit/(loss) 50% (0.5)Losses not recognised 0.6Group’s recognised share of profits 0.1
NOTES TO THE FINANCIAL STATEMENTS
FIN
AN
CIA
L ST
AT
EM
EN
TS
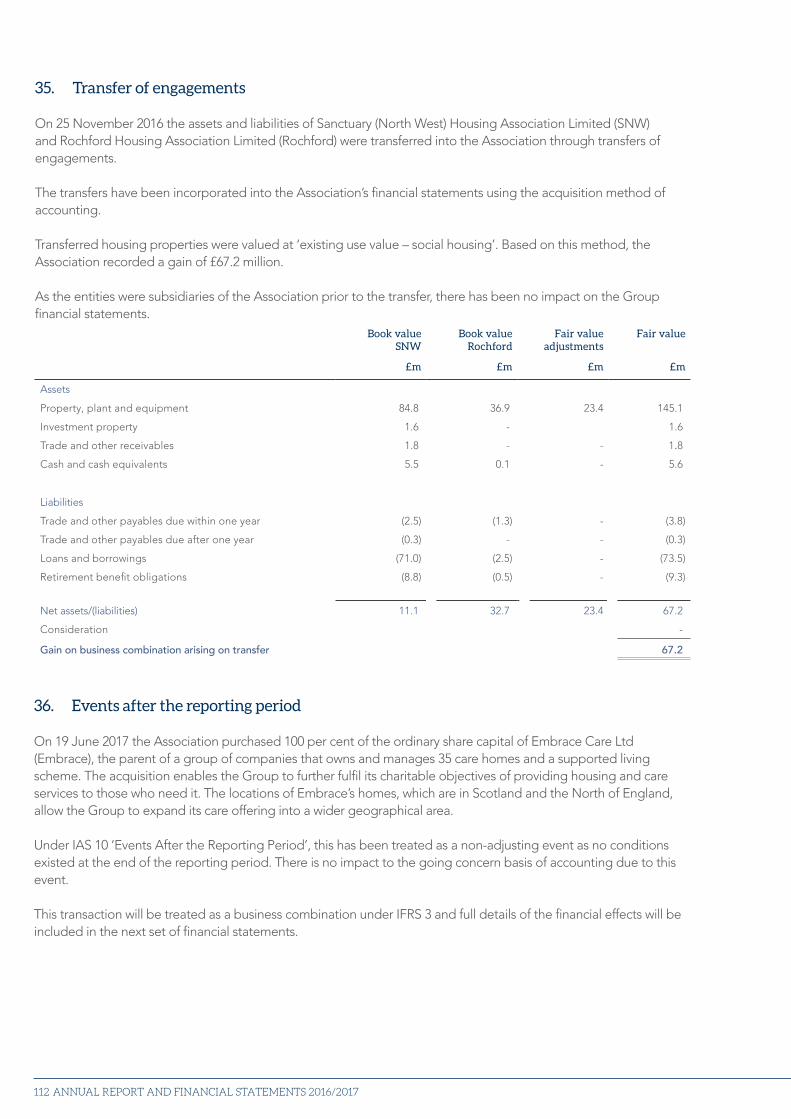
ANNUAL REPORT AND FINANCIAL STATEMENTS 2016/2017112
36. Events after the reporting period
On 19 June 2017 the Association purchased 100 per cent of the ordinary share capital of Embrace Care Ltd (Embrace), the parent of a group of companies that owns and manages 35 care homes and a supported living scheme. The acquisition enables the Group to further fulfil its charitable objectives of providing housing and care services to those who need it. The locations of Embrace’s homes, which are in Scotland and the North of England, allow the Group to expand its care offering into a wider geographical area.
Under IAS 10 ‘Events After the Reporting Period’, this has been treated as a non-adjusting event as no conditions existed at the end of the reporting period. There is no impact to the going concern basis of accounting due to this event.
This transaction will be treated as a business combination under IFRS 3 and full details of the financial effects will be included in the next set of financial statements.
35. Transfer of engagements
On 25 November 2016 the assets and liabilities of Sanctuary (North West) Housing Association Limited (SNW) and Rochford Housing Association Limited (Rochford) were transferred into the Association through transfers of engagements.
The transfers have been incorporated into the Association’s financial statements using the acquisition method of accounting.
Transferred housing properties were valued at ‘existing use value – social housing’. Based on this method, the Association recorded a gain of £67.2 million.
As the entities were subsidiaries of the Association prior to the transfer, there has been no impact on the Group financial statements.
Book valueSNW
Book value Rochford
Fair value adjustments
Fair value
£m £m £m £m
Assets
Property, plant and equipment 84.8 36.9 23.4 145.1
Investment property 1.6 - 1.6
Trade and other receivables 1.8 - - 1.8
Cash and cash equivalents 5.5 0.1 - 5.6
Liabilities
Trade and other payables due within one year (2.5) (1.3) - (3.8)
Trade and other payables due after one year (0.3) - - (0.3)
Loans and borrowings (71.0) (2.5) - (73.5)
Retirement benefit obligations (8.8) (0.5) - (9.3)
Net assets/(liabilities) 11.1 32.7 23.4 67.2
Consideration -
Gain on business combination arising on transfer 67.2
Strategic report Financial statem
ents
113
37. Contingent liabilities
The Association has provided a guarantee under a Security Trust Deed amounting to £nil at fair value in respect ofsubsidiary undertakings. Where the Association enters into financial contracts to guarantee the indebtedness of other companies within the Group, the Association considers these to be insurance arrangements, and accounts for them as such. In this respect, the Association treats the guarantee contract as a contingent liability until such time as it becomes probable that the Association will be required to make a payment under the guarantee.
The Association has entered into counter-indemnities in respect of Surety Bonds for £10.7 million of pension liabilities. The Association considers these Surety Bonds to be insurance arrangements, and accounts for them as such. The Association treats the counter-indemnities as a contingent liability and until such time as it becomes probable that the Company is required to claim, any accompanying payment for the counter-indemnity has a fair value of £nil.
NOTES TO THE FINANCIAL STATEMENTS
FIN
AN
CIA
L ST
AT
EM
EN
TS
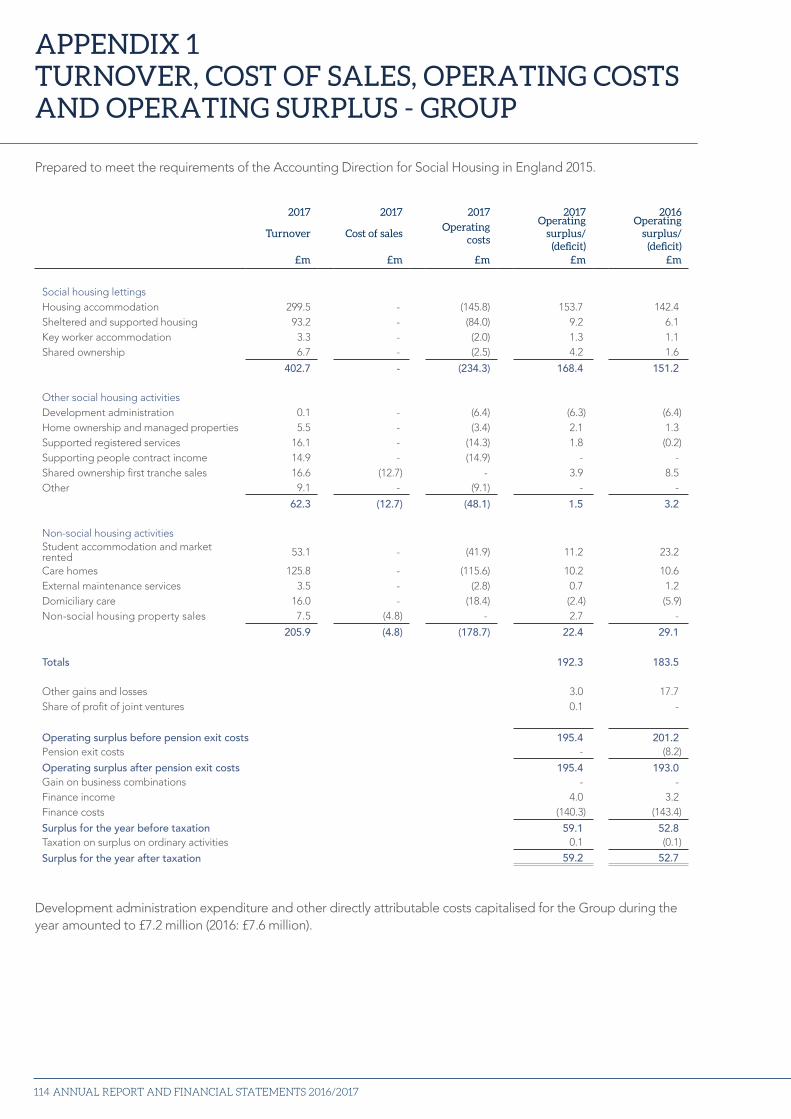
ANNUAL REPORT AND FINANCIAL STATEMENTS 2016/2017114
Prepared to meet the requirements of the Accounting Direction for Social Housing in England 2015.
2017 2017 2017 2017 2016
Turnover Cost of salesOperating
costs
Operating surplus/
(deficit)
Operatingsurplus/
(deficit)£m £m £m £m £m
Social housing lettings Housing accommodation 299.5 - (145.8) 153.7 142.4Sheltered and supported housing 93.2 - (84.0) 9.2 6.1Key worker accommodation 3.3 - (2.0) 1.3 1.1Shared ownership 6.7 - (2.5) 4.2 1.6
402.7 - (234.3) 168.4 151.2
Other social housing activitiesDevelopment administration 0.1 - (6.4) (6.3) (6.4)Home ownership and managed properties 5.5 - (3.4) 2.1 1.3Supported registered services 16.1 - (14.3) 1.8 (0.2)Supporting people contract income 14.9 - (14.9) - -Shared ownership first tranche sales 16.6 (12.7) - 3.9 8.5Other 9.1 - (9.1) - -
62.3 (12.7) (48.1) 1.5 3.2
Non-social housing activitiesStudent accommodation and market rented 53.1 - (41.9) 11.2 23.2
Care homes 125.8 - (115.6) 10.2 10.6External maintenance services 3.5 - (2.8) 0.7 1.2Domiciliary care 16.0 - (18.4) (2.4) (5.9)Non-social housing property sales 7.5 (4.8) - 2.7 -
205.9 (4.8) (178.7) 22.4 29.1
Totals 192.3 183.5
Other gains and losses 3.0 17.7Share of profit of joint ventures 0.1 -
Operating surplus before pension exit costs 195.4 201.2Pension exit costs - (8.2)
Operating surplus after pension exit costs 195.4 193.0Gain on business combinations - -Finance income 4.0 3.2Finance costs (140.3) (143.4)
Surplus for the year before taxation 59.1 52.8Taxation on surplus on ordinary activities 0.1 (0.1)
Surplus for the year after taxation 59.2 52.7
Development administration expenditure and other directly attributable costs capitalised for the Group during the year amounted to £7.2 million (2016: £7.6 million).
APPENDIX 1TURNOVER, COST OF SALES, OPERATING COSTS AND OPERATING SURPLUS - GROUP
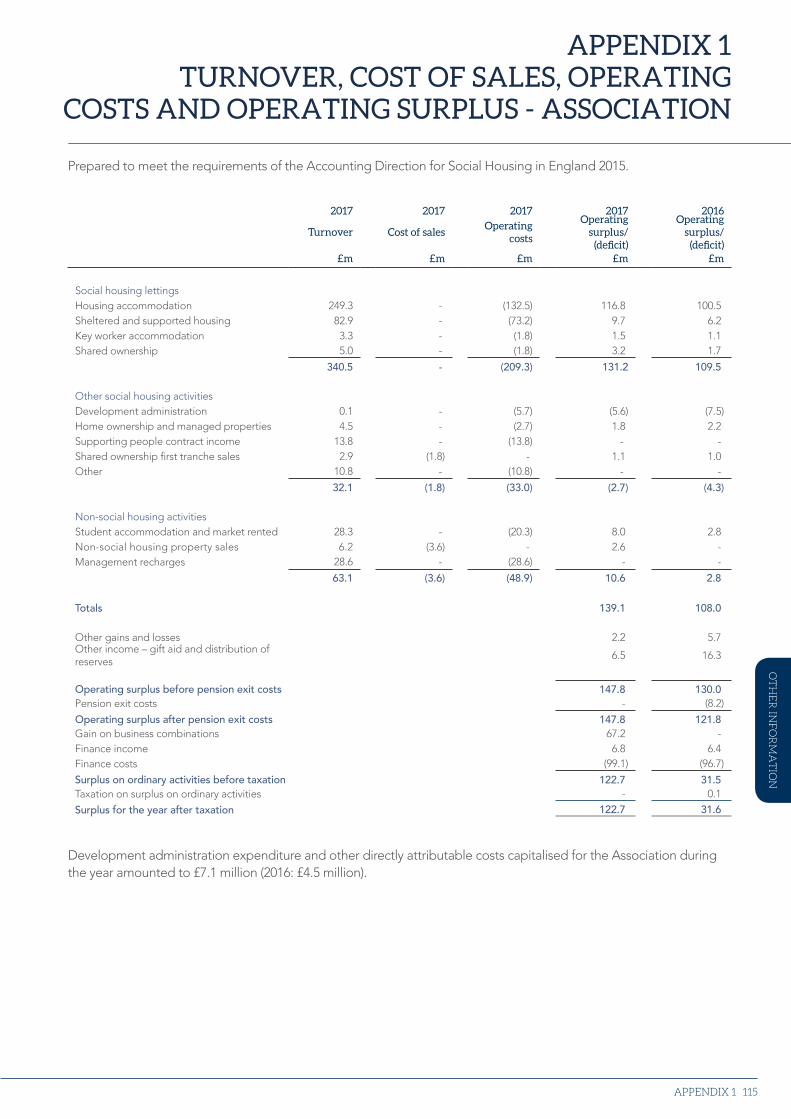
Strategic report Financial statem
ents
115
Prepared to meet the requirements of the Accounting Direction for Social Housing in England 2015.
2017 2017 2017 2017 2016
Turnover Cost of salesOperating
costs
Operating surplus/
(deficit)
Operatingsurplus/
(deficit)£m £m £m £m £m
Social housing lettings Housing accommodation 249.3 - (132.5) 116.8 100.5Sheltered and supported housing 82.9 - (73.2) 9.7 6.2Key worker accommodation 3.3 - (1.8) 1.5 1.1Shared ownership 5.0 - (1.8) 3.2 1.7
340.5 - (209.3) 131.2 109.5
Other social housing activitiesDevelopment administration 0.1 - (5.7) (5.6) (7.5)Home ownership and managed properties 4.5 - (2.7) 1.8 2.2Supporting people contract income 13.8 - (13.8) - -Shared ownership first tranche sales 2.9 (1.8) - 1.1 1.0Other 10.8 - (10.8) - -
32.1 (1.8) (33.0) (2.7) (4.3)
Non-social housing activitiesStudent accommodation and market rented 28.3 - (20.3) 8.0 2.8Non-social housing property sales 6.2 (3.6) - 2.6 -Management recharges 28.6 - (28.6) - -
63.1 (3.6) (48.9) 10.6 2.8
Totals 139.1 108.0
Other gains and losses 2.2 5.7Other income – gift aid and distribution of reserves
6.5 16.3
Operating surplus before pension exit costs 147.8 130.0Pension exit costs - (8.2)
Operating surplus after pension exit costs 147.8 121.8Gain on business combinations 67.2 -Finance income 6.8 6.4Finance costs (99.1) (96.7)
Surplus on ordinary activities before taxation 122.7 31.5Taxation on surplus on ordinary activities - 0.1
Surplus for the year after taxation 122.7 31.6
Development administration expenditure and other directly attributable costs capitalised for the Association during the year amounted to £7.1 million (2016: £4.5 million).
APPENDIX 1 TURNOVER, COST OF SALES, OPERATING
COSTS AND OPERATING SURPLUS - ASSOCIATION
APPENDIX 1
OT
HE
R IN
FO
RM
AT
ION
ANNUAL REPORT AND FINANCIAL STATEMENTS 2016/2017116
Prepared to meet the requirements of the Accounting Direction for Social Housing in England 2015.
Group Housing accommodation
Sheltered and
supportedhousing
Key workeraccommodation
Sharedownership
2017Total
2016Total
£m £m £m £m £m £m
Income from lettingsRents 285.3 63.4 3.1 5.7 357.5 353.2Service charges 14.2 29.8 0.2 1.0 45.2 44.7Turnover from social housing lettings
299.5 93.2 3.3 6.7 402.7 397.9
Expenditure on lettingsManagement (33.5) (19.4) (0.5) (1.3) (54.7) (56.5)Services (13.7) (28.7) (0.6) (0.6) (43.6) (45.9)Routine maintenance (49.3) (19.2) (0.4) - (68.9) (68.4)Planned maintenance (21.5) (7.6) (0.1) - (29.2) (29.4)Rent losses from bad debts (2.9) (1.5) - - (4.4) (2.4)
Property lease charges (1.8) (0.1) - - (1.9) (1.7)Depreciation of properties (21.2) (6.3) (0.4) (0.5) (28.4) (27.8)Other costs (1.9) (1.2) - (0.1) (3.2) (14.6)Operating costs from social housing lettings (145.8) (84.0) (2.0) (2.5) (234.3) (246.7)
Operating surplus from social housing lettings
153.7 9.2 1.3 4.2 168.4 151.2
Voids (2.4) (3.2) (0.1) - (5.7) (5.0)
Income and expenditure from social housing lettings
Association Housing accommodation
Sheltered and
supportedhousing
Key workeraccommodation
Sharedownership
2017Total
2016Total
£m £m £m £m £m £m
Income from lettingsRents 237.0 57.4 3.1 4.3 301.8 295.6Service charges 12.3 25.5 0.2 0.7 38.7 38.7Turnover from social housing lettings 249.3 82.9 3.3 5.0 340.5 334.3
Expenditure on lettingsManagement (32.4) (15.8) (0.4) (1.2) (49.8) (51.2)Services (12.0) (24.9) (0.6) (0.4) (37.9) (41.1)Routine maintenance (46.5) (17.9) (0.3) - (64.7) (64.7)Planned maintenance (19.6) (7.0) (0.1) - (26.7) (27.7)Rent losses from bad debts
(1.8) (1.1) - - (2.9) (2.1)
Property lease charges (1.8) - - - (1.8) (1.6)Depreciation of properties (16.5) (5.3) (0.4) (0.1) (22.3) (21.8)Other costs (1.9) (1.2) - (0.1) (3.2) (14.6)Operating costs from social housing lettings
(132.5) (73.2) (1.8) (1.8) (209.3) (224.8)
Operating surplus from social housing lettings
116.8 9.7 1.5 3.2 131.2 109.5
Voids (2.0) (2.6) (0.1) - (4.7) (3.7)
APPENDIX 2INCOME AND EXPENDITURE FROM SOCIAL HOUSING LETTINGS
Strategic report Financial statem
ents
117
The notes below show the calculation methodology for the five-year summary on page 16.
Profitability
Operating margin % – operating surplus before pension exit costs, excluding other gains and losses, as a percentage of revenue.
2017 £m 2016 £m
Revenue 670.9 669.0
Operating surplus before pension exit costs 195.4 201.2
Other gains and losses (3.0) (17.7)
192.4 183.5
Operating margin 28.7% 27.4%
Operating costs as a % of revenue – operating expenditure as a percentage of revenue (does not include cost of sales or other gains and losses).
Net margin % – surplus for the year before tax as a percentage of revenue, excluding any gains or losses on business combinations.
EBITDA – total divisional EBITDA* as shown in note 6 Operating Segments.
EBITDA % – total divisional EBITDA* as a percentage of revenue as shown in note 6 Operating Segments.
*Divisional EBITDA is a key measure of operational performance for the Group and is regularly monitored by senior management.
Revenue – total revenue per Income Statement.
Debt
Interest cover – operating surplus plus depreciation/net interest payable, excluding pension finance costs and gains/losses on refinancing.
Gearing – net debt/properties’ depreciated cost.
Asset efficiency
ROCE – total divisional EBITDA as shown in note 6 operating segments/carrying value of properties.
Information for periods prior to the transition date has not been prepared under IFRS and is shown as previously reported under UK GAAP. The main adjustments required that would make this information compliant with IFRS relate to revisions to the depreciation charged on Property, Plant and Equipment.
Under IFRS, surpluses on sale of Property, Plant and Equipment fall within operating surpluses.
APPENDIX 3FIVE-YEAR SUMMARY NOTES
APPENDIX 3
OT
HE
R IN
FO
RM
AT
ION
ANNUAL REPORT AND FINANCIAL STATEMENTS 2016/2017118
Independent statutory auditor KPMG LLP One Snowhill Snow Hill Queensway Birmingham B4 6GH Internal auditor PricewaterhouseCoopers LLP Cornwall Court 19 Cornwall Street Birmingham B3 2DT Bankers Barclays Bank plc Barclays Corporate Social Housing Team Level 27 1 Churchill Place London E14 5HP
Legal advisors Gowling WLG (UK) LLP Two Snow Hill Birmingham B4 6WR Registered office Chamber Court Castle Street Worcester WR1 3ZQ
Registration numbers Homes and Communities Agency L0247
Registered Society 19059R
Sanctuary Housing Association is an exempt charity under the Charities Act 2011
ADVISORS AND OTHER INFORMATION

Strategic report Financial statem
ents
119ADVISORS AND OTHER INFORMATION
ANNUAL REPORT AND FINANCIAL STATEMENTS 2016/2017120
Sanctuary GroupSanctuary HouseChamber CourtCastle StreetWorcesterWR1 3ZQ
Tel: 01905 334000Fax: 01905 334958www.sanctuary-group.co.uk
Sanctuary Group is a trading name of Sanctuary Housing Association, an exempt charity
Registered office: Chamber Court, Castle Street, Worcester WR1 3ZQ
Registered as a provider of social housing with the Homes and Communities Agency No. L0247
Registered Society No. 19059R
Published: June 2017
sanctuary-group +sanctuarygroup
If you would like this publication in analternative format or language, pleasetelephone 01905 334344or email [email protected]