annual report 2013...4 | miga annual report 2013 miga annual report 2013 | 5 the world bank group is...
TRANSCRIPT
A N N U A L R E P O R T 2 0 1 3
InsurIng Investments r ensurIng opportunItIes
MIGA ANNUAL REPORT 2013 | 1B | MIGA ANNUAL REPORT 2013
contents 2 MIGA Fiscal Year 2013 Highlights 4 World Bank Group Fiscal Year 2013 Highlights 5 Message from World Bank Group President 7 MIGA Board 8 Message from MIGA Executive Vice President 11 MIGA Management Team 12 MIGA Development Impact 20 MIGA Business Operational Overview Research and Knowledge Regional Activities Technical Assistance Independent Evaluation Group Compliance Advisor/Ombudsman 58 Management’s Discussion and Analysis and Financial Statements 108 Appendices 122 MIGA Contact Information
acronymsCAO Compliance Advisor/OmbudsmanCUP Cooperative Underwriting ProgramDEIS Development Effectiveness Indicator SystemDIFC Dubai International Financial CentreFDI Foreign Direct InvestmentFIAS Facility for Investment Climate Advisory ServicesIBRD International Bank for Reconstruction and DevelopmentICSID International Centre for Settlement of Investment DisputesIDA International Development AssociationIEG Independent Evaluation GroupIFC International Finance CorporationMD&A Management’s Discussion and AnalysisMENA Middle East and North AfricaOPIC Overseas Private Investment CorporationPRI Political Risk InsuranceSIP Small Investment ProgramSSA Sub-Saharan Africa SOE State-Owned Enterprise
MIGA’s Mission
To promote foreign direct
investment into developing
countries to support economic
growth, reduce poverty, and
improve people’s lives.
MIGA ANNUAL REPORT 2013 | 32 | MIGA ANNUAL REPORT 2013
Highlights
fiscal year 2013
AR chapter box colors
0 10 20 30 40
Increased marketopportunities
One year ofpolitical stability
Improvedmacroeconomic
stability
Decrease in corruption
More favorablegov’t regulations
Increased accessto financing
Improved infrastructurecapacity
Increased accessto qualified staff
Other
Over the next 12 months
Macroeconomicinstability
Access to financing
Access to qualified staff
Political risk
Infrastructure capacity
Limited market opportunities
Corruption
Increased governmentregulation in the aftermath
of the global financial crisis
Other
0 10 20 30
Over the next three years
Political risk
Macroeconomic instability
Access to qualified staff
Access to financing
Corruption
Infrastructure capacity
Limited market opportunities
Increased governmentregulation in the aftermathof the global financial crisis
Other
0 10 20 30
AustriaUnited Kingdom
FranceUnited States
GermanySouth AfricaLuxembourg
FinlandSwitzerland
GreeceSingapore
United Arab EmiratesCanada
MauritiusKorea, Republic of
SpainCayman Islands
SloveniaBermuda
SenegalEgypt, Arab Republic of
CyprusNetherlands
SwedenJapan
Others
Others: Nigeria, Poland, China, Thailand, Norway, Ecuador, Tanzania, Turkey, Romania, Kenya, Ireland, Belgium, Mali, India, Lebanon, Tunisia, Italy, St. Kitts and Nevis, Denmark, Panama, Virgin Islands (British), Colombia
* Numbers may not add to 100 percent due to guarantee holders domiciled in two different countries
23.912.510.09.27.35.34.12.82.62.32.32.11.61.51.41.31.11.00.90.70.70.70.70.70.72.7
2013
2012
2011
2010
2009
Eearned premium
Fig 2
Fig 4
Fig 6
Fig 5
Fig 1 fin
Figure 8
Figure 9 Figure 7Figure 1
33.6
36.9
13.9
24.1
36.9
Premium and fee incomeInvestment income
46% Infrastructure
23% Oil, gas, and mining
17% Financial
14% Agribusiness, manufacturing, and services
59% Infrastructure
22% Oil, gas, and mining
10% Agribusiness, manufacturing, and services
9% Financial
54% Sub-Saharan Africa
19% Europe and Central Asia
18% Asia and the Pacific
6% Middle East and North Africa*
3% Latin America and the Caribbean
31% Money Market/Cash
19% Mortgage-backed Securities
17% Domestic Government
16% Global Equities
10% Agency
4% Asset-backed Securities
3% Sovereign/Govt Guarantee
47% Sub-Saharan Africa
20% Europe and Central Asia
13% Asia and the Pacific
10% Middle East and North Africa*
10% Latin America and the Caribbean
41% Europe and Central Asia26% Sub-Saharan Africa
15% Asia and the Pacific
10% Latin America and the Caribbean
8% Middle East and North Africa
66.3
61.7
50.8
46.0
43.6
Fig 3
03 04 05 06 07 08 09 10 11 12 13
gross exposure
net exposure
12
10
8
6
4
2
0
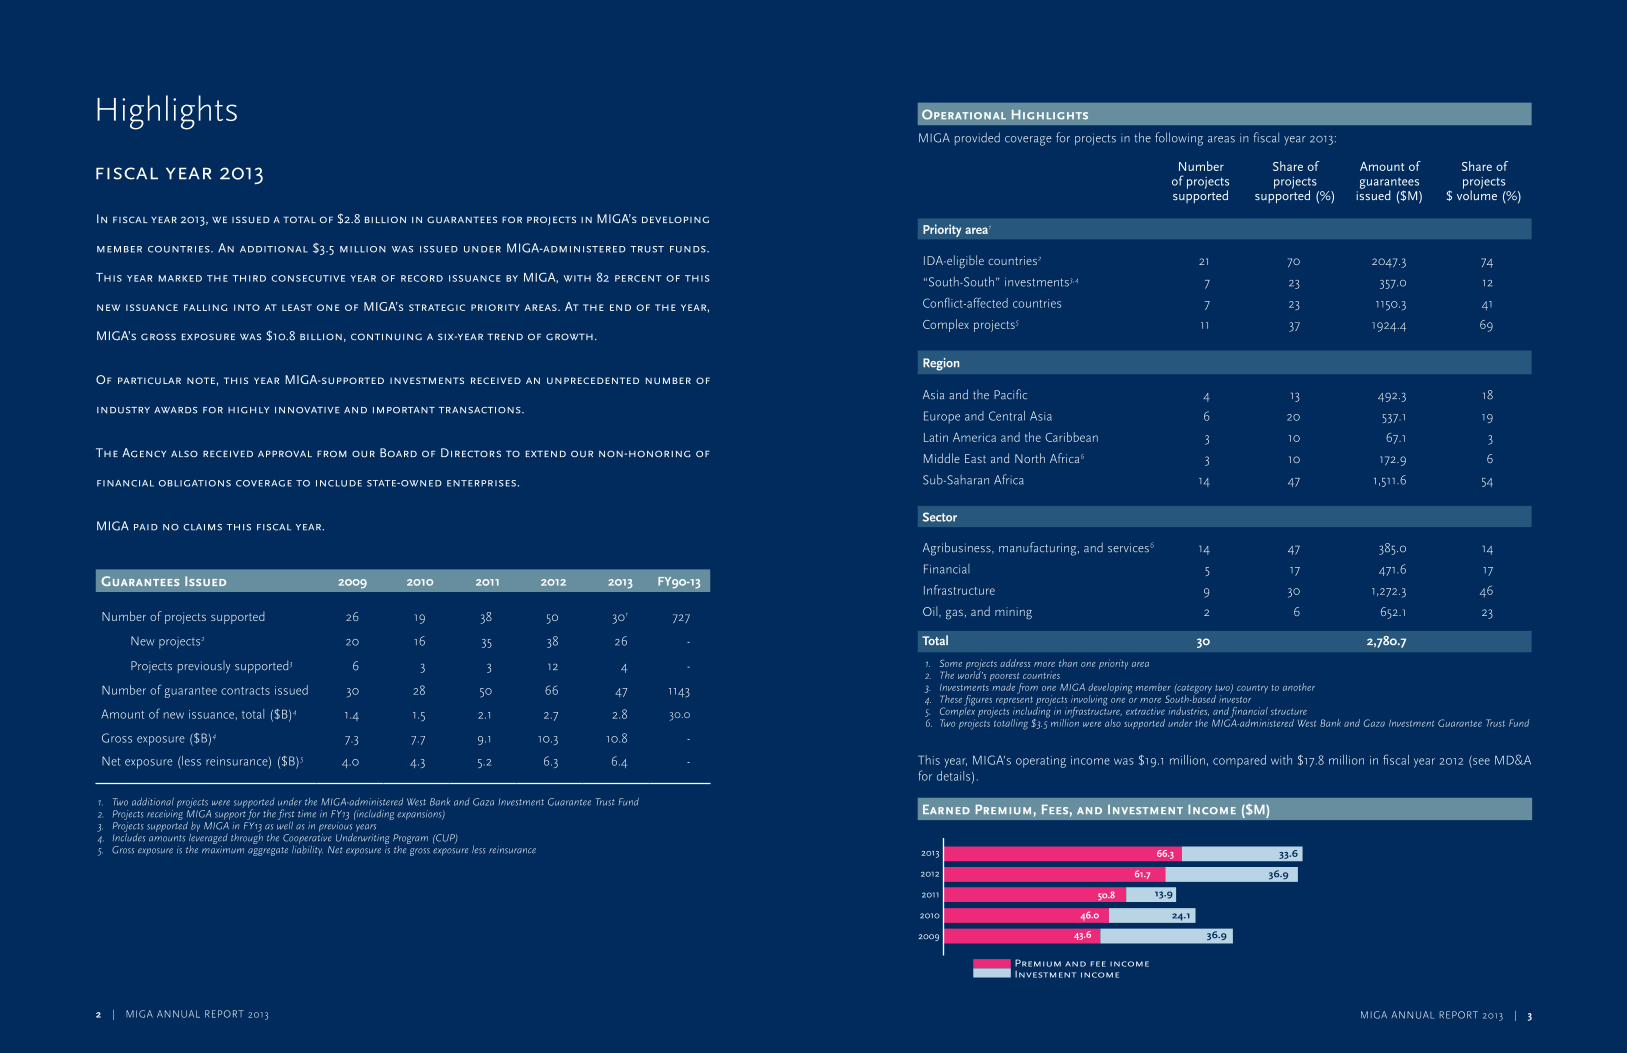
This year, MIGA’s operating income was $19.1 million, compared with $17.8 million in fiscal year 2012 (see MD&A for details).
Earned Premium, Fees, and Investment Income ($M)
In fiscal year 2013, we issued a total of $2.8 billion in guarantees for projects in mIgA’s developing
member countries. An additional $3.5 million was issued under mIgA-administered trust funds.
this year marked the third consecutive year of record issuance by mIgA, with 82 percent of this
new issuance falling into at least one of mIgA’s strategic priority areas. At the end of the year,
mIgA’s gross exposure was $10.8 billion, continuing a six-year trend of growth.
of particular note, this year mIgA-supported investments received an unprecedented number of
industry awards for highly innovative and important transactions.
the Agency also received approval from our Board of Directors to extend our non-honoring of
financial obligations coverage to include state-owned enterprises.
mIgA paid no claims this fiscal year.
Guarantees Issued 2009 2010 2011 2012 2013 FY90-13
Number of projects supported 26 19 38 50 301 727
New projects2 20 16 35 38 26 -
Projects previously supported3 6 3 3 12 4 -
Number of guarantee contracts issued 30 28 50 66 47 1143
Amount of new issuance, total ($B)4 1.4 1.5 2.1 2.7 2.8 30.0
Gross exposure ($B)4 7.3 7.7 9.1 10.3 10.8 -
Net exposure (less reinsurance) ($B)5 4.0 4.3 5.2 6.3 6.4 -
1. TwoadditionalprojectsweresupportedundertheMIGA-administeredWestBankandGazaInvestmentGuaranteeTrustFund2. ProjectsreceivingMIGAsupportforthefirsttimeinFY13(includingexpansions)3. ProjectssupportedbyMIGAinFY13aswellasinpreviousyears4. IncludesamountsleveragedthroughtheCooperativeUnderwritingProgram(CUP)5. Grossexposureisthemaximumaggregateliability.Netexposureisthegrossexposurelessreinsurance
Operational Highlights
MIGA provided coverage for projects in the following areas in fiscal year 2013:
Number of projects supported
Share of projects
supported (%)
Amount of guarantees
issued ($M)
Share of projects
$ volume (%)
Priority area1
IDA-eligible countries2 21 70 2047.3 74
“South-South” investments3,4 7 23 357.0 12
Conflict-affected countries 7 23 1150.3 41
Complex projects5 11 37 1924.4 69
Region
Asia and the Pacific 4 13 492.3 18
Europe and Central Asia 6 20 537.1 19
Latin America and the Caribbean 3 10 67.1 3
Middle East and North Africa6 3 10 172.9 6
Sub-Saharan Africa 14 47 1,511.6 54
Sector
Agribusiness, manufacturing, and services6 14 47 385.0 14
Financial 5 17 471.6 17
Infrastructure 9 30 1,272.3 46
Oil, gas, and mining 2 6 652.1 23
Total 30 2,780.7
1. Someprojectsaddressmorethanonepriorityarea2. Theworld’spoorestcountries3. InvestmentsmadefromoneMIGAdevelopingmember(categorytwo)countrytoanother4. ThesefiguresrepresentprojectsinvolvingoneormoreSouth-basedinvestor5. Complexprojectsincludingininfrastructure,extractiveindustries,andfinancialstructure6. Twoprojectstotalling$3.5millionwerealsosupportedundertheMIGA-administeredWestBankandGazaInvestmentGuaranteeTrustFund
MIGA ANNUAL REPORT 2013 | 54 | MIGA ANNUAL REPORT 2013
the World Bank group is a major source of financial and technical assistance to developing
countries around the world. Its member institutions work together and complement each
other’s activities to achieve their shared goals of ending extreme poverty and promoting shared
prosperity. the Bank group shares knowledge and supports projects in agriculture, trade,
finance, health, poverty reduction, education, infrastructure, governance, climate change, and
in other areas to benefit people in developing countries.
world bank group fiscal year 2013 highlights
Leadership Perspectives
The World Bank Group committed $52.6 billion in fiscal year 2013.
The World Bank, comprising IDA and IBRD, committed $31.5 billion in loans and grants to its member countries. Of this, IDA commitments to the world’s poorest countries were $16.3 billion.
IFC committed $18.3 billion and mobilized an additional $6.5 billion for private sector development in developing countries. Nearly half of the total went to IDA countries.
MIGA issued $2.8 billion in guarantees in support of investments in developing countries. Nearly three-quarters of the guarantees went to IDA countries. The Agency welcomed two new members, São Tomé and Principe and Comoros, during the fiscal year.
World Bank Group Cooperation
Joint projects and programs of the Bank Group’s insti-tutions focus on promoting sustainable development by expanding financial markets, issuing guarantees to investors and commercial lenders, and providing advisory services to create better investment conditions in developing countries. Working together, the World Bank, IFC, and MIGA catalyze projects that make resources available to clients through greater innovation and respon-siveness. A number of these are highlighted in this report.
The World Bank Group comprises five closely associated institutions:
International Bank for Reconstruction and Development (IBRD), which lends to governments of middle-income and creditworthy low-income countries
International Development Association (IDA), which provides interest-free loans, or credits, and grants to governments of the poorest countries
International Finance Corporation (IFC), which provides loans, equity, and advisory services to stimulate private sector investment in developing countries
Multilateral Investment Guarantee Agency (MIGA), which provides political risk insurance or guarantees against losses caused by non-commercial risks to facilitate foreign direct investment (FDI) in developing countries
International Centre for Settlement of Investment Disputes (ICSID), which provides international facilities for conciliation and arbitration of investment disputes.
INTERNATIONAL BANK
FOR
WORLD BANK
RE
CO
NSTRUCTIO N A N D D EVELO
PME
NT
INTERNATIONAL
D EVELOPMENTASSOCIATION
INTERNATI ON
A LF I N A N C
E
CORPORATIONIN
TERNATI ON
A LF I N A N C
E
CORPORATION
•MULTIL
AT E
R A L I N V E
STMENT
•
GUA
RA N T E E A G E
NCY
SE
TT
LE
ME
N
T O F I N V E S T M E NT D
I SP
UT
ES
•IN
TERNATIONAL CENTRE
FOR
•
I C S I D
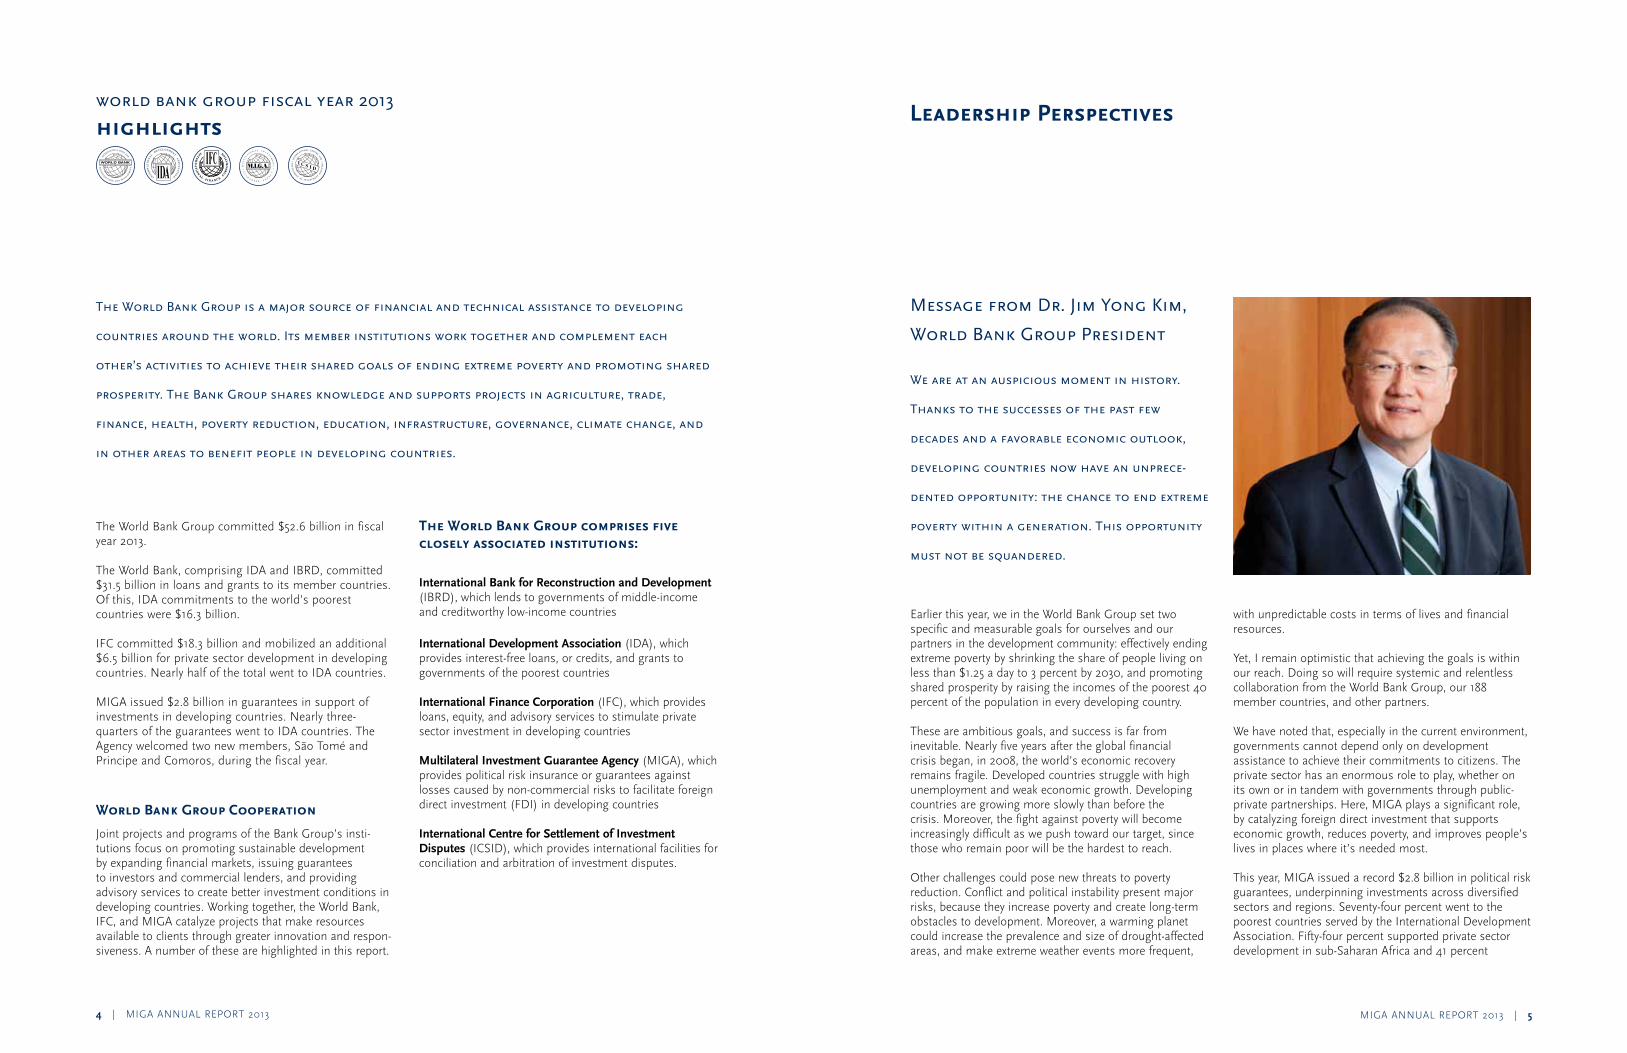
message from Dr. Jim Yong Kim,
World Bank group president
We are at an auspicious moment in history.
thanks to the successes of the past few
decades and a favorable economic outlook,
developing countries now have an unprece-
dented opportunity: the chance to end extreme
poverty within a generation. this opportunity
must not be squandered.
Earlier this year, we in the World Bank Group set two specific and measurable goals for ourselves and our partners in the development community: effectively ending extreme poverty by shrinking the share of people living on less than $1.25 a day to 3 percent by 2030, and promoting shared prosperity by raising the incomes of the poorest 40 percent of the population in every developing country.
These are ambitious goals, and success is far from inevitable. Nearly five years after the global financial crisis began, in 2008, the world’s economic recovery remains fragile. Developed countries struggle with high unemployment and weak economic growth. Developing countries are growing more slowly than before the crisis. Moreover, the fight against poverty will become increasingly difficult as we push toward our target, since those who remain poor will be the hardest to reach.
Other challenges could pose new threats to poverty reduction. Conflict and political instability present major risks, because they increase poverty and create long-term obstacles to development. Moreover, a warming planet could increase the prevalence and size of drought-affected areas, and make extreme weather events more frequent,
with unpredictable costs in terms of lives and financial resources.
Yet, I remain optimistic that achieving the goals is within our reach. Doing so will require systemic and relentless collaboration from the World Bank Group, our 188 member countries, and other partners.
We have noted that, especially in the current environment, governments cannot depend only on development assistance to achieve their commitments to citizens. The private sector has an enormous role to play, whether on its own or in tandem with governments through public-private partnerships. Here, MIGA plays a significant role, by catalyzing foreign direct investment that supports economic growth, reduces poverty, and improves people’s lives in places where it’s needed most.
This year, MIGA issued a record $2.8 billion in political risk guarantees, underpinning investments across diversified sectors and regions. Seventy-four percent went to the poorest countries served by the International Development Association. Fifty-four percent supported private sector development in sub-Saharan Africa and 41 percent
MIGA ANNUAL REPORT 2013 | 76 | MIGA ANNUAL REPORT 2013
supported transformational projects in fragile or conflict-affected countries. This Annual Report demonstrates the considerable development impact of MIGA’s support, and its ability to build effective partnerships, both externally and across the World Bank Group.
Several MIGA projects over the past year underscore the World Bank Group’s strengthened collaboration to achieve our objectives. The outcomes of this collaboration demonstrate how, together, we can use our considerable expertise and resources to help countries and other partners find creative and integrated solutions to development challenges.
MIGA’s support of transformational projects in Côte d’Ivoire is particularly noteworthy. This year, the Agency, along with IFC and IDA, supported the Azito thermal power plant that brings energy capacity to the country. Along with IDA, MIGA also supported the construction and operation of an offshore oil and gas facility that will reduce the country’s energy costs and limit the use of foreign reserves for energy imports. These transformational projects complemented the Henri Konan Bedié toll bridge in Abidjan—the first public-private partnership since the end of the civil conflict in 2011—that MIGA supported last year. MIGA’s support for these investments alone has catalyzed over $2 billion in foreign direct investment, a significant amount for this conflict-affected country.
MIGA’s performance this year has made a strong contribution to helping us reach our goals of ending extreme poverty by 2030 and promoting shared prosperity. I particularly want to thank Izumi Kobayashi, whose
tenure at the helm of MIGA recently came to an end. Her innovative and tireless leadership, coupled with the professionalism and commitment of MIGA’s management and staff, allowed the Agency to achieve extraordinary results. I look forward to working with Keiko Honda, Izumi’s successor, to continue MIGA’s strong momentum in the years to come.
JimYongKimWorldBankGroupPresident
June30,2013
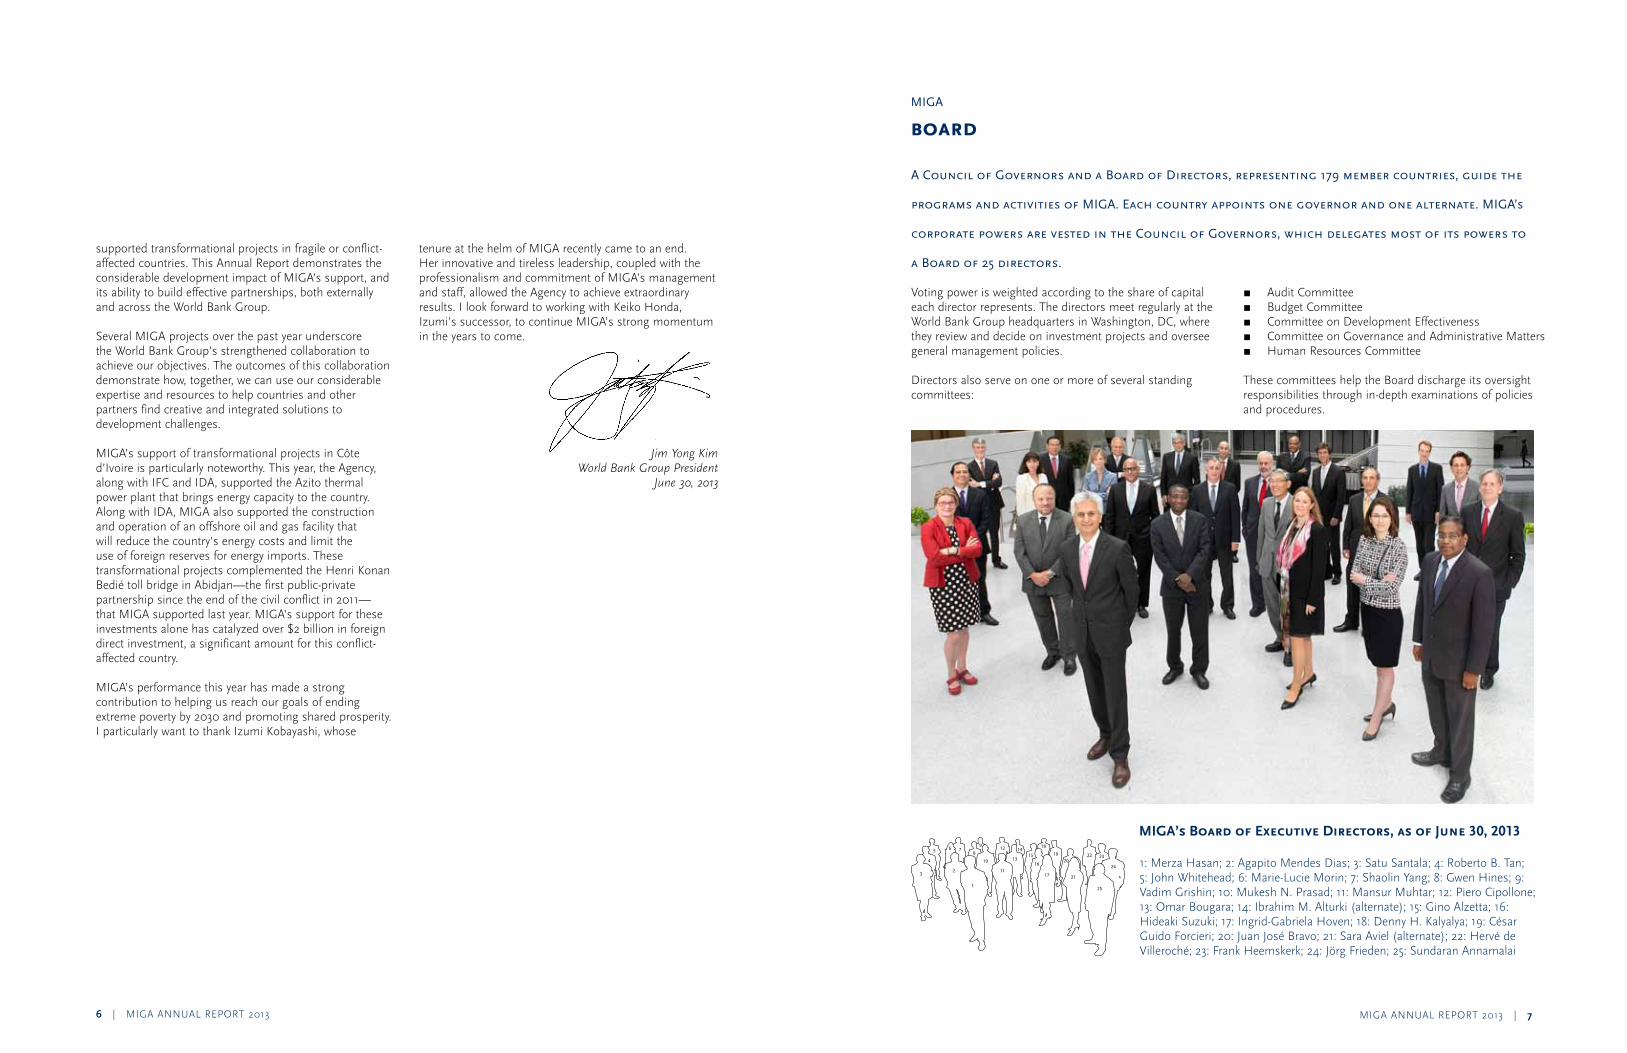
A Council of governors and a Board of Directors, representing 179 member countries, guide the
programs and activities of mIgA. each country appoints one governor and one alternate. mIgA’s
corporate powers are vested in the Council of governors, which delegates most of its powers to
a Board of 25 directors.
1: Merza Hasan; 2: Agapito Mendes Dias; 3: Satu Santala; 4: Roberto B. Tan; 5: John Whitehead; 6: Marie-Lucie Morin; 7: Shaolin Yang; 8: Gwen Hines; 9: Vadim Grishin; 10: Mukesh N. Prasad; 11: Mansur Muhtar; 12: Piero Cipollone; 13: Omar Bougara; 14: Ibrahim M. Alturki (alternate); 15: Gino Alzetta; 16: Hideaki Suzuki; 17: Ingrid-Gabriela Hoven; 18: Denny H. Kalyalya; 19: César Guido Forcieri; 20: Juan José Bravo; 21: Sara Aviel (alternate); 22: Hervé de Villeroché; 23: Frank Heemskerk; 24: Jörg Frieden; 25: Sundaran Annamalai
Voting power is weighted according to the share of capital each director represents. The directors meet regularly at the World Bank Group headquarters in Washington, DC, where they review and decide on investment projects and oversee general management policies.
Directors also serve on one or more of several standing committees:
r Audit Committee r Budget Committee r Committee on Development Effectiveness r Committee on Governance and Administrative Matters r Human Resources Committee
These committees help the Board discharge its oversight responsibilities through in-depth examinations of policies and procedures.
miga
board
1
23
4
5 6 78
9
10
11
12
13
1415
16
18
1920
21
22 23
24
25
17
1
23
4
5 6 78
9
10
11
12
13
1415
16
18
1920
21
22 23
24
25
17
MIGA’s Board of Executive Directors, as of June 30, 2013
MIGA ANNUAL REPORT 2013 | 98 | MIGA ANNUAL REPORT 2013
The Agency’s sector diversification shows strong gains with complex projects in infrastructure and extractive industries rising to 69 percent of new volume compared to 60 percent in fiscal year 2012. Underlying these strong business results is the transformational nature of many of these projects, which help bring power, transportation, and more efficient technologies into our developing member countries, and are particularly important for fragile and conflict-affected economies that have the greatest need for investment.
The impact of the projects we support again demonstrates the powerful role the private sector can play in alleviating poverty by mobilizing private capital into sectors with broad developmental impact, such as infrastructure, agribusiness, and manufacturing. With the private sector stepping in to provide these much-needed investments, host-government efforts are complemented in building the foundation for more productive economic activity that creates jobs and growth. Additionally, these investments are playing an important role in contributing to economic and social sustainability in surrounding communities.
We also reached out to existing and new external partners to share knowledge on industry practices and devel-opment solutions. This outreach included activities such as conferences on managing global political risk, senior executive outreach, and visits to projects that we have sup-ported—including a trip I made to Iraq and the Palestinian Territories, both areas hit by conflict and fragility. We also participated in the World Bank Group’s groundbreaking mission to Myanmar and together we hope to help reduce poverty and boost growth through energy infrastructure development and other reforms.
This past fiscal year we further strengthened our part-nerships across the World Bank Group, working on ways to enhance collaboration in our strategic priority areas. In par-ticular, the IFC/MIGA Business Development Partnership has matured into a strong business model that has helped stimulate joint business development and knowledge-sharing while providing optimal solutions to our clients.
Internally, we remained focused on strengthening our information technology systems to serve anticipated
needs and streamlining processes to enable more flex-ibility and responsiveness to our clients. We continued to place an emphasis on building a diverse and talented staff of professionals. This past year we welcomed four new staff members under our successful MIGA Professionals Program.
I have come to the end of my tenure at MIGA. I want to thank the Board of Directors and other partners, as well as our clients, for their guidance and support in advancing the work of this important institution. As I leave, I feel confident that MIGA is well-positioned to fulfill our mandate of facilitating investment that furthers growth and improves people’s lives. I want to thank President Jim Yong Kim for his leadership. Most of all, I want to express my sincere gratitude to MIGA’s management and staff for their professionalism and commitment throughout my term to deliver MIGA’s mission in the countries we serve. It has been my privilege to work with you.
IzumiKobayashiJune30,2013
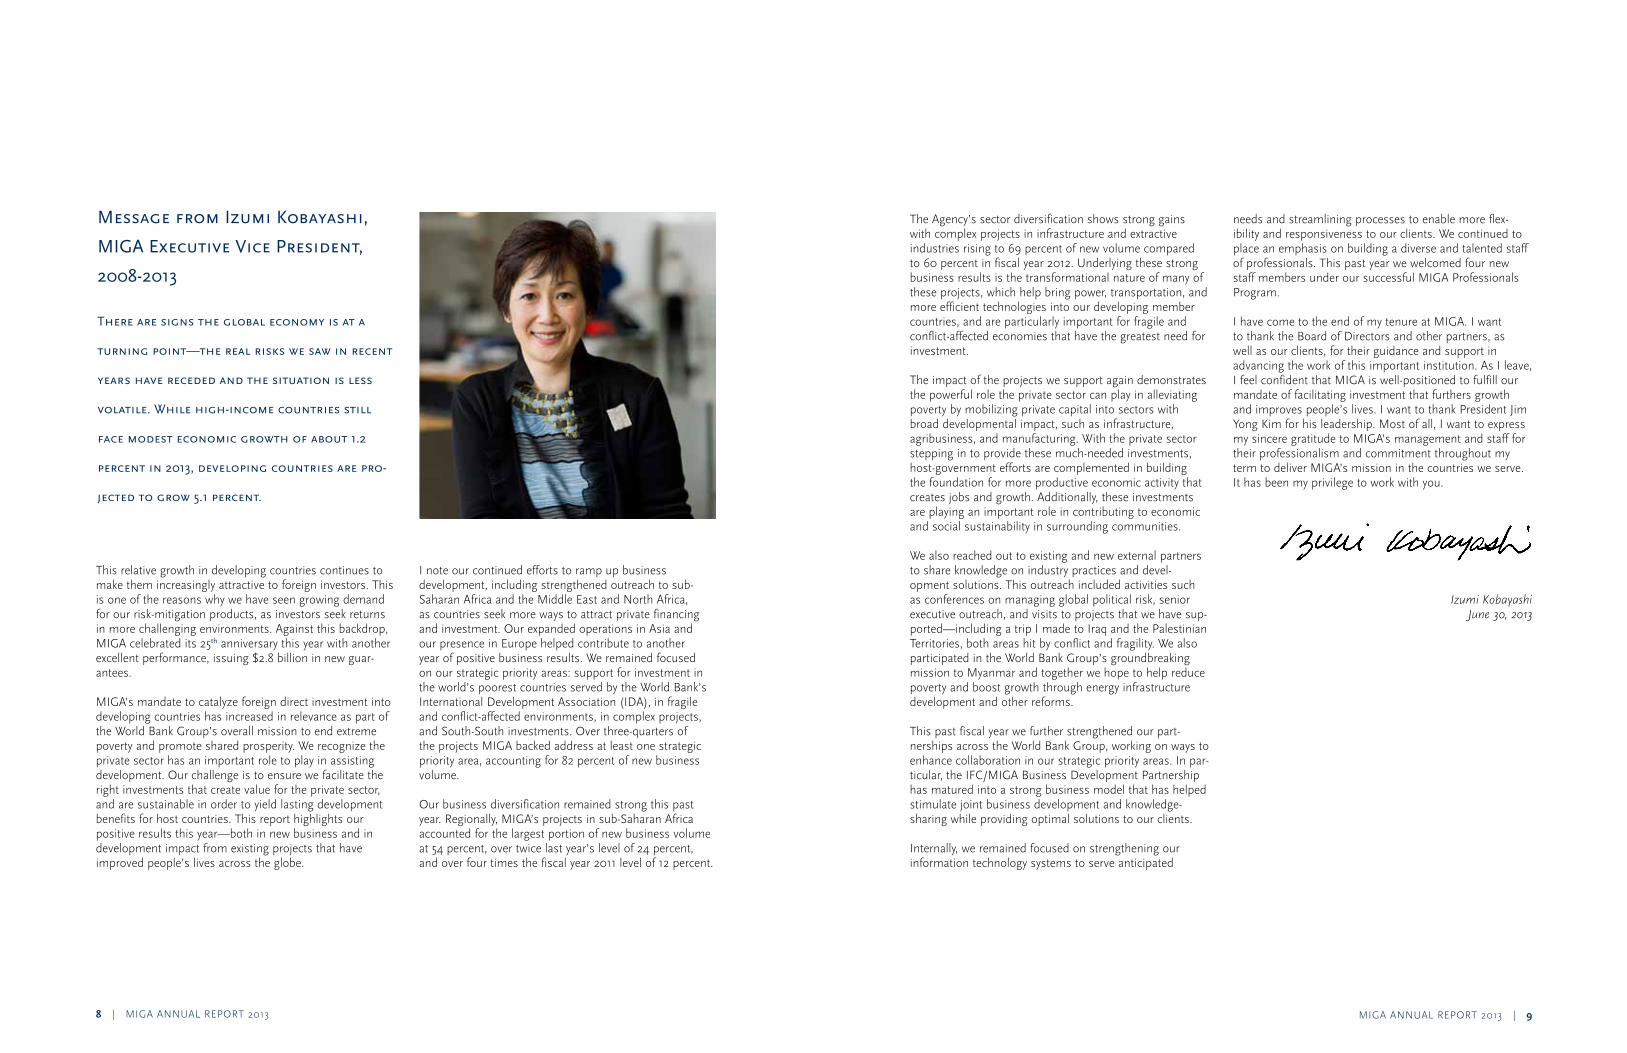
message from Izumi Kobayashi,
mIgA executive vice president,
2008-2013
there are signs the global economy is at a
turning point—the real risks we saw in recent
years have receded and the situation is less
volatile. While high-income countries still
face modest economic growth of about 1.2
percent in 2013, developing countries are pro-
jected to grow 5.1 percent.
This relative growth in developing countries continues to make them increasingly attractive to foreign investors. This is one of the reasons why we have seen growing demand for our risk-mitigation products, as investors seek returns in more challenging environments. Against this backdrop, MIGA celebrated its 25th anniversary this year with another excellent performance, issuing $2.8 billion in new guar-antees.
MIGA’s mandate to catalyze foreign direct investment into developing countries has increased in relevance as part of the World Bank Group’s overall mission to end extreme poverty and promote shared prosperity. We recognize the private sector has an important role to play in assisting development. Our challenge is to ensure we facilitate the right investments that create value for the private sector, and are sustainable in order to yield lasting development benefits for host countries. This report highlights our positive results this year—both in new business and in development impact from existing projects that have improved people’s lives across the globe.
I note our continued efforts to ramp up business development, including strengthened outreach to sub-Saharan Africa and the Middle East and North Africa, as countries seek more ways to attract private financing and investment. Our expanded operations in Asia and our presence in Europe helped contribute to another year of positive business results. We remained focused on our strategic priority areas: support for investment in the world’s poorest countries served by the World Bank’s International Development Association (IDA), in fragile and conflict-affected environments, in complex projects, and South-South investments. Over three-quarters of the projects MIGA backed address at least one strategic priority area, accounting for 82 percent of new business volume.
Our business diversification remained strong this past year. Regionally, MIGA’s projects in sub-Saharan Africa accounted for the largest portion of new business volume at 54 percent, over twice last year’s level of 24 percent, and over four times the fiscal year 2011 level of 12 percent.

MIGA ANNUAL REPORT 2013 | 1110 | MIGA ANNUAL REPORT 2013
miga management team
Izumi Kobayashi Executive Vice President
edith p. Quintrell Director, Operations
michel Wormser Vice President and Chief Operating Officer
Lakshmi shyam-sunder Director and Chief Financial Officer, Finance and Risk Management
Ana-mita Betancourt Director and General Counsel, Legal Affairs and Claims
Kevin W. Lu Regional Director, Asia Pacific
ravi vish Chief Economist and Director, Economics and Sustainability
marcus s. D. Williams Chief, Strategy, Communications and Partnerships
message from Keiko Honda,
mIgA executive vice president
I am pleased to transmit mIgA’s 2013 Annual
report, which highlights the Agency’s
strong performance over the past year.
This is a very exciting time to be joining the World Bank Group and sharing in the noble purpose of ending extreme poverty and promoting shared prosperity.
We are committed to working with our clients and devel-opment partners to deliver the solutions that will help us achieve these goals. MIGA’s risk-mitigation instruments can play an essential role in mobilizing the financing nec-essary to deliver transformational infrastructure projects, build job-generating enterprises, and provide access to finance.
I look forward to working with our Board, our partners, and staff to meet these goals. I am honored to contribute to this important work.
KeikoHondaJuly15,2013
MIGA ANNUAL REPORT 2013 | 13
12 | MIGA ANNUAL REPORT 2013
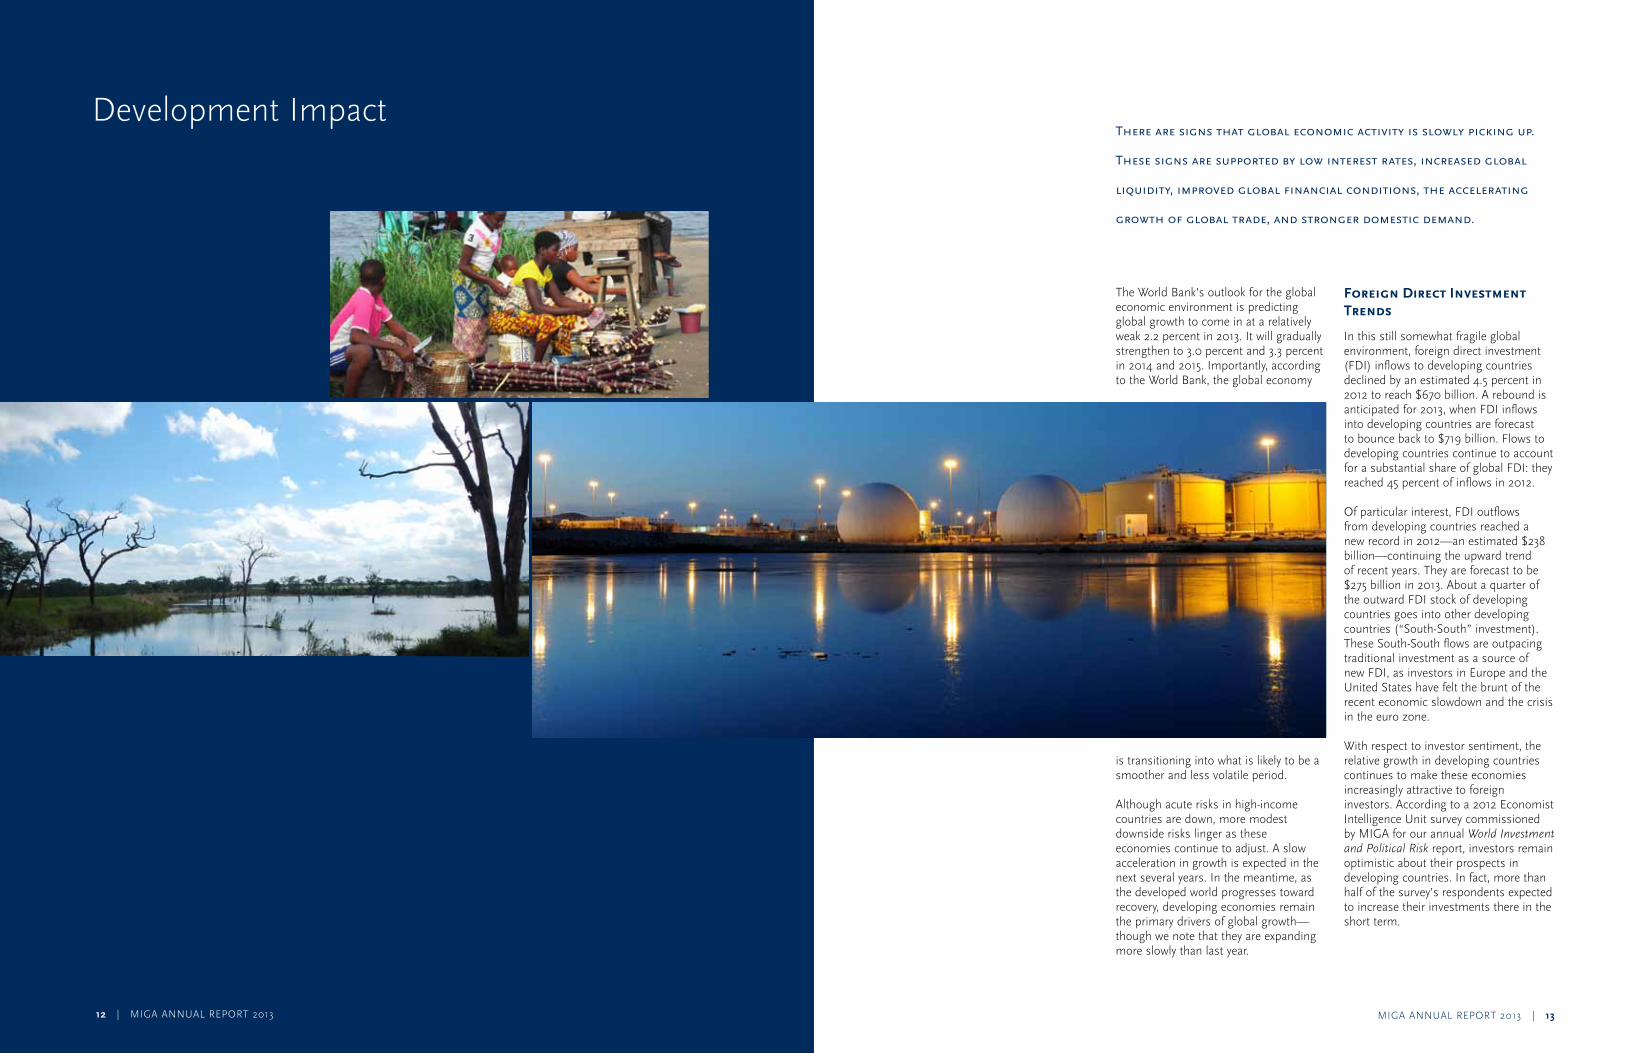
there are signs that global economic activity is slowly picking up.
these signs are supported by low interest rates, increased global
liquidity, improved global financial conditions, the accelerating
growth of global trade, and stronger domestic demand.
Development Impact
The World Bank’s outlook for the global economic environment is predicting global growth to come in at a relatively weak 2.2 percent in 2013. It will gradually strengthen to 3.0 percent and 3.3 percent in 2014 and 2015. Importantly, according to the World Bank, the global economy
is transitioning into what is likely to be a smoother and less volatile period.
Although acute risks in high-income countries are down, more modest downside risks linger as these economies continue to adjust. A slow acceleration in growth is expected in the next several years. In the meantime, as the developed world progresses toward recovery, developing economies remain the primary drivers of global growth—though we note that they are expanding more slowly than last year.
Foreign Direct Investment Trends
In this still somewhat fragile global environment, foreign direct investment (FDI) inflows to developing countries declined by an estimated 4.5 percent in 2012 to reach $670 billion. A rebound is anticipated for 2013, when FDI inflows into developing countries are forecast to bounce back to $719 billion. Flows to developing countries continue to account for a substantial share of global FDI: they reached 45 percent of inflows in 2012.
Of particular interest, FDI outflows from developing countries reached a new record in 2012—an estimated $238 billion—continuing the upward trend of recent years. They are forecast to be $275 billion in 2013. About a quarter of the outward FDI stock of developing countries goes into other developing countries (“South-South” investment). These South-South flows are outpacing traditional investment as a source of new FDI, as investors in Europe and the United States have felt the brunt of the recent economic slowdown and the crisis in the euro zone.
With respect to investor sentiment, the relative growth in developing countries continues to make these economies increasingly attractive to foreign investors. According to a 2012 Economist Intelligence Unit survey commissioned by MIGA for our annual WorldInvestmentandPoliticalRisk report, investors remain optimistic about their prospects in developing countries. In fact, more than half of the survey’s respondents expected to increase their investments there in the short term.
MIGA ANNUAL REPORT 2013 | 1514 | MIGA ANNUAL REPORT 2013
MIGA’s Role
MIGA’s insurance against noncommercial risks in developing countries is a powerful tool for many investors and lenders as they enter these markets. In many cases, MIGA guarantees help them address hesitations that may affect the decision to move forward with an investment, particularly in countries perceived as high-risk. Indeed, the presence of MIGA guarantees can often make the difference between a go and a no-go decision for some investments. Increasingly, MIGA guarantees are also being used as a credit-enhancement tool that helps clients secure financing with better terms and longer tenors.
MIGA promotes the flow of FDI into developing countries in service of our mission: supporting economic growth, reducing poverty, and improving people’s lives. With our World Bank Group colleagues, we work with investors to structure projects in ways that benefit all parties and foster positive relationships with local communities. MIGA’s collaboration with the World Bank and the International Finance Corporation (IFC) has borne fruit in several highly developmental projects including the Bujagali hydropower dam in Uganda commissioned this year and the Azito thermal power plant expansion in Côte d’Ivoire (see box 1). At a broader level, MIGA’s collaboration across the World Bank Group ensures that the Agency’s support to any investment is consistent with the Group’s strategy for the host country. Our ability to leverage the Group’s expertise on environmental and social standards is often a sig-nificant value to our clients and to the development impact of the investments we insure.
This year, MIGA is pleased to celebrate our 25th anniversary (see box 3). This milestone is a good occasion to reflect on our achievements up until now and oportunities for the next 25 years. Since our inception we have issued $30 billion in guarantees for projects in a wide variety of sectors, covering all regions of the world. Going forward, we will continue to focus on insuring projects where we have the most impact, especially those that are in line with our strategic priorities detailed next.
Strategic Focus
Four strategic priorities guide MIGA’s work. These pri-orities have been shaped by the World Bank Group’s mission to end extreme poverty and promote shared prosperity, the development needs of MIGA’s member countries, and the need for the Agency to focus on its comparative advantage and complement other insurers.
MIGA’s first priority is encouraging FDI into the world’s poorest countries. In fiscal year 2013, 74 percent of our guarantee volume fell into this category. Examples that address this priority include MIGA’s support to power generation in Uganda and Bangladesh, a commercial bamboo plantation in Nicaragua (see box 2), customs
inspection services in Madagascar and Niger, and several agribusiness investments in Zambia.
Our strategic focus on conflict-affected and fragile economies underlines MIGA’s key role in these countries’ rebuilding efforts, particularly during the crucial period of transition as they seek to establish stability after years of turmoil. This focus also points to MIGA’s ability to guarantee projects where other insurers may be off-cover. Three transformational projects in Côte d’Ivoire—detailed later in this report—show how MIGA is prepared to act as a catalyst for private sector investment very soon after conflict wanes. Also this year, our support to manufacturing projects in the West Bank and Gaza demonstrates the Agency’s commitment to this priority area. Projects in conflict-affected and fragile countries and territories represented 41 percent of MIGA’s new volume this year.
MIGA received approval from our Board of Directors this fiscal year to create a Conflict-Affected and Fragile Economies Facility to even further deepen the Agency’s support to this priority area. In addition to MIGA guarantees, the facility will use donor contributions and guarantees to provide an initial loss layer to insure investment projects in difficult contexts. The facility was launched in June, together with the governments of Canada and Sweden, which committed funding in support of this initiative. Discussions are advanced with other potential donors to support the facility.
Another priority area where we have a distinct competitive advantage is complex projects. This year, in addition to issuing guarantees for oil and gas as well as power generation investments in Côte d’Ivoire, MIGA supported power generation in Angola. These complex projects are often transformational for countries and may increasingly include the participation of several parts of the World Bank Group. In these cases, MIGA guarantees can complement IFC financing and the World Bank’s lending and guarantee instruments to bring the full suite of products to bear so that these projects can be realized. MIGA’s support to complex projects accounted for 69 percent of 2013’s volume.
As South-South investments become an increasingly important source of FDI, MIGA continues to support them as another strategic priority. This year, 13 percent of our business involved FDI from one developing country to another. Examples of MIGA-insured South-South investments include a manufacturing plant in Libya and a power project in Kenya.
Put together, projects in MIGA’s priority areas accounted for 82 percent of new business volume for 2013.
From a regional perspective, MIGA focused on sub-Saharan Africa as well as the Middle East and North Africa this year.
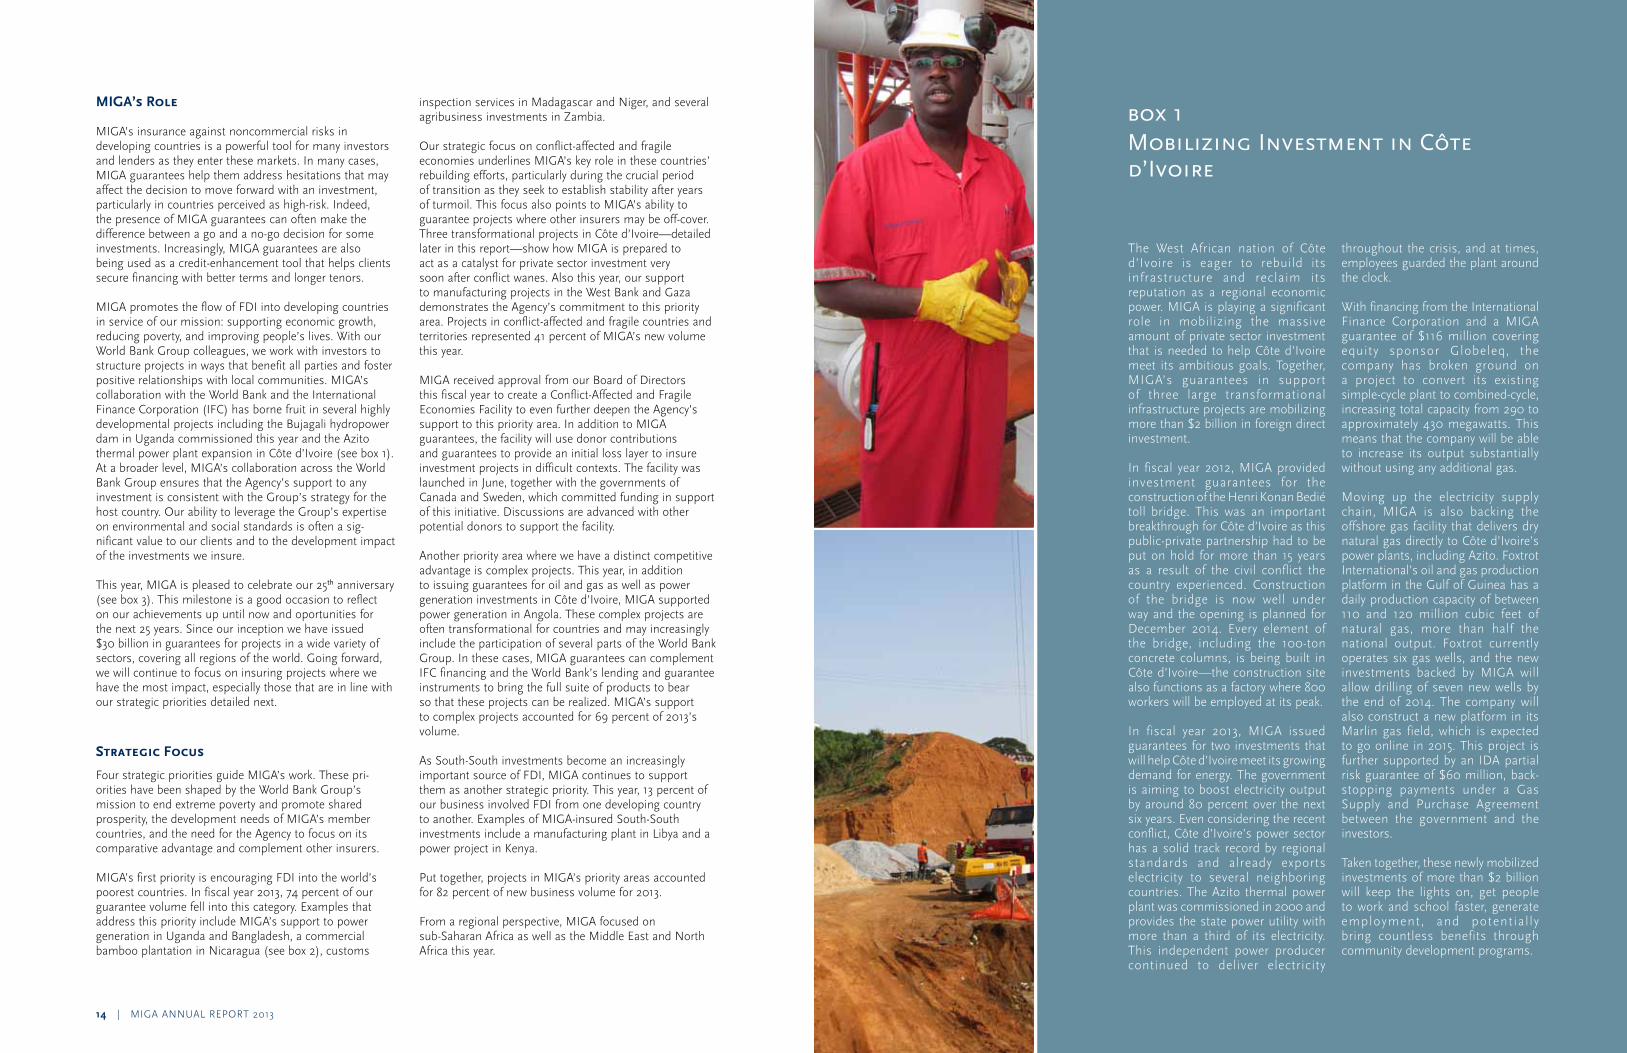
The West African nation of Côte d’Ivoire is eager to rebuild its infrastructure and reclaim its reputation as a regional economic power. MIGA is playing a significant role in mobilizing the massive amount of private sector investment that is needed to help Côte d’Ivoire meet its ambitious goals. Together, MIGA’s guarantees in support of three large transformational infrastructure projects are mobilizing more than $2 billion in foreign direct investment.
In fiscal year 2012, MIGA provided investment guarantees for the construction of the Henri Konan Bedié toll bridge. This was an important breakthrough for Côte d’Ivoire as this public-private partnership had to be put on hold for more than 15 years as a result of the civil conflict the country experienced. Construction of the bridge is now well under way and the opening is planned for December 2014. Every element of the bridge, including the 100-ton concrete columns, is being built in Côte d’Ivoire—the construction site also functions as a factory where 800 workers will be employed at its peak.
In fiscal year 2013, MIGA issued guarantees for two investments that will help Côte d’Ivoire meet its growing demand for energy. The government is aiming to boost electricity output by around 80 percent over the next six years. Even considering the recent conflict, Côte d’Ivoire’s power sector has a solid track record by regional standards and already exports electricity to several neighboring countries. The Azito thermal power plant was commissioned in 2000 and provides the state power utility with more than a third of its electricity. This independent power producer continued to deliver electricity
throughout the crisis, and at times, employees guarded the plant around the clock.
With financing from the International Finance Corporation and a MIGA guarantee of $116 million covering equity sponsor Globeleq, the company has broken ground on a project to convert its existing simple-cycle plant to combined-cycle, increasing total capacity from 290 to approximately 430 megawatts. This means that the company will be able to increase its output substantially without using any additional gas.
Moving up the electricity supply chain, MIGA is also backing the offshore gas facility that delivers dry natural gas directly to Côte d’Ivoire’s power plants, including Azito. Foxtrot International’s oil and gas production platform in the Gulf of Guinea has a daily production capacity of between 110 and 120 million cubic feet of natural gas, more than half the national output. Foxtrot currently operates six gas wells, and the new investments backed by MIGA will allow drilling of seven new wells by the end of 2014. The company will also construct a new platform in its Marlin gas field, which is expected to go online in 2015. This project is further supported by an IDA partial risk guarantee of $60 million, back-stopping payments under a Gas Supply and Purchase Agreement between the government and the investors.
Taken together, these newly mobilized investments of more than $2 billion will keep the lights on, get people to work and school faster, generate employment, and potential ly bring countless benefits through community development programs.
box 1 mobilizing Investment in Côte d’Ivoire
MIGA ANNUAL REPORT 2013 | 1716 | MIGA ANNUAL REPORT 2013
box 2 When Business is good for the environment: ecoplanet Bamboo in nicaragua
Sub-Saharan Africa is a top priority for the World Bank Group and MIGA guarantees play a significant role in mobilizing developmentally beneficial FDI to the region. The Agency has a strong focus on closing the energy and infrastructure gaps that are exacerbated by limited public funding sources. The World Bank estimates that Africa needs to spend $38 billion a year to address its infra-structure deficit. By facilitating access to private capital and using innovative structures like public-private partnerships, MIGA has helped direct investment toward projects that affect large parts of the continent’s population. Fifty-four percent of MIGA’s volume was for projects in the region this year.
This fiscal year we also continued our focus on the Middle East and North Africa (MENA). The region’s recent uncer-tainties are compounded by the fact that many countries have traditionally relied on investment from Europe, which has been grappling with its own financial challenges. As a result, the need for capital that creates jobs and oppor-tunity is greater than ever. For MIGA, this has been an important moment for the Agency to fill in gaps that the private sector cannot address. At the end of fiscal year 2011 we made a commitment to mobilize $1 billion in insurance capacity to retain and encourage FDI into the region. With $605.8 million of guarantees in MENA issued since then, MIGA is making strong progress toward that goal. This year, MIGA supported five projects in the region, including two manufacturing projects through the West Bank and Gaza Investment Guarantee Trust Fund. These projects will bring jobs and business activity to this difficult context.
Lowering Carbon Footprints
Countries are making significant investments and developing expertise in renewable energy and efficiency as well as low-carbon urban transport. The private sector is essential to delivering solutions to support these countries’ efforts. Yet, high up-front costs and perceived political risks often affect investors’ decisions to move forward in many markets.
From geothermal energy in Kenya, waste-to-energy in China, and hydropower in Albania, Angola, and Pakistan—MIGA is supporting energy transformation by insuring sustainable power investments in all regions of the world. MIGA has also recently supported mass transit projects in Panama and Turkey.
This fiscal year the Agency signed guarantees for a wind energy project in Nicaragua in addition to projects in Côte d’Ivoire and Bangladesh that involve the conversion of power plants from simple-cycle to combined-cycle. The latter projects produce more electricity for those countries without additional use of gas, resulting in significant carbon dioxide emissions avoidance per year.
Environmental and Social Standards
Sound environmental performance, sustainability with respect to natural resource management, and social responsibility are critical to an investment’s success and its contribution to the host country’s development. MIGA applies a comprehensive set of performance standards for all guaranteed investments and the Agency’s envi-ronmental and social specialists evaluate the potential impacts of MIGA-supported projects, advising clients as to how to minimize and mitigate them. In an effort to achieve harmonization across the private-sector arms of the World Bank Group, MIGA is updating its policy and performance standards following a similar review undertaken by the IFC.
The MIGA-administered Environmental and Social Challenges Fund for Africa financed by the Japanese gov-ernment continues to serve as a mechanism to provide technical advice to cross-border investors in the region. The fund is open on a case-by-case basis to investors already receiving MIGA guarantees or being considered for support. Through it, investors can receive expert advice from MIGA and external consultants with the aim to ensure that projects improve their environmental and social performance. This fiscal year, the Environmental and Social Challenges Fund for Africa supported two MIGA projects in Ethiopia: africaJUICE developed a fair trade farmers union and National Cement created a robust envi-ronmental and social management system.
Development Effectiveness
By having a better understanding of the development outcomes of the investments that MIGA insures, the Agency is able to focus our efforts more sharply and achieve a higher level of impact. As a result, we continue to strengthen and measure our development effectiveness, as well as learn valuable lessons from previous projects that can be applied to our current work.
This fiscal year is the third anniversary of the launch of MIGA’s Development Effectiveness Indicator System (DEIS) devised to measure and track the development impact of projects that the Agency insures. Through this, MIGA measures a common set of indicators across all projects: investment supported, direct employment, training expenditures, locally procured goods, and com-munity investments. We also measure sector-specific indi-cators. Results show that MIGA mobilized $5.4 billion in investment in fiscal year 2013, representing nearly double the value of guarantees issued.
The DEIS also puts into place a process to measure projects’ actual development outcomes three years from the time of contract signing. Starting in fiscal year 2014, we will begin reporting this data for the cohort of active guar-antees that MIGA signed in fiscal year 2011.
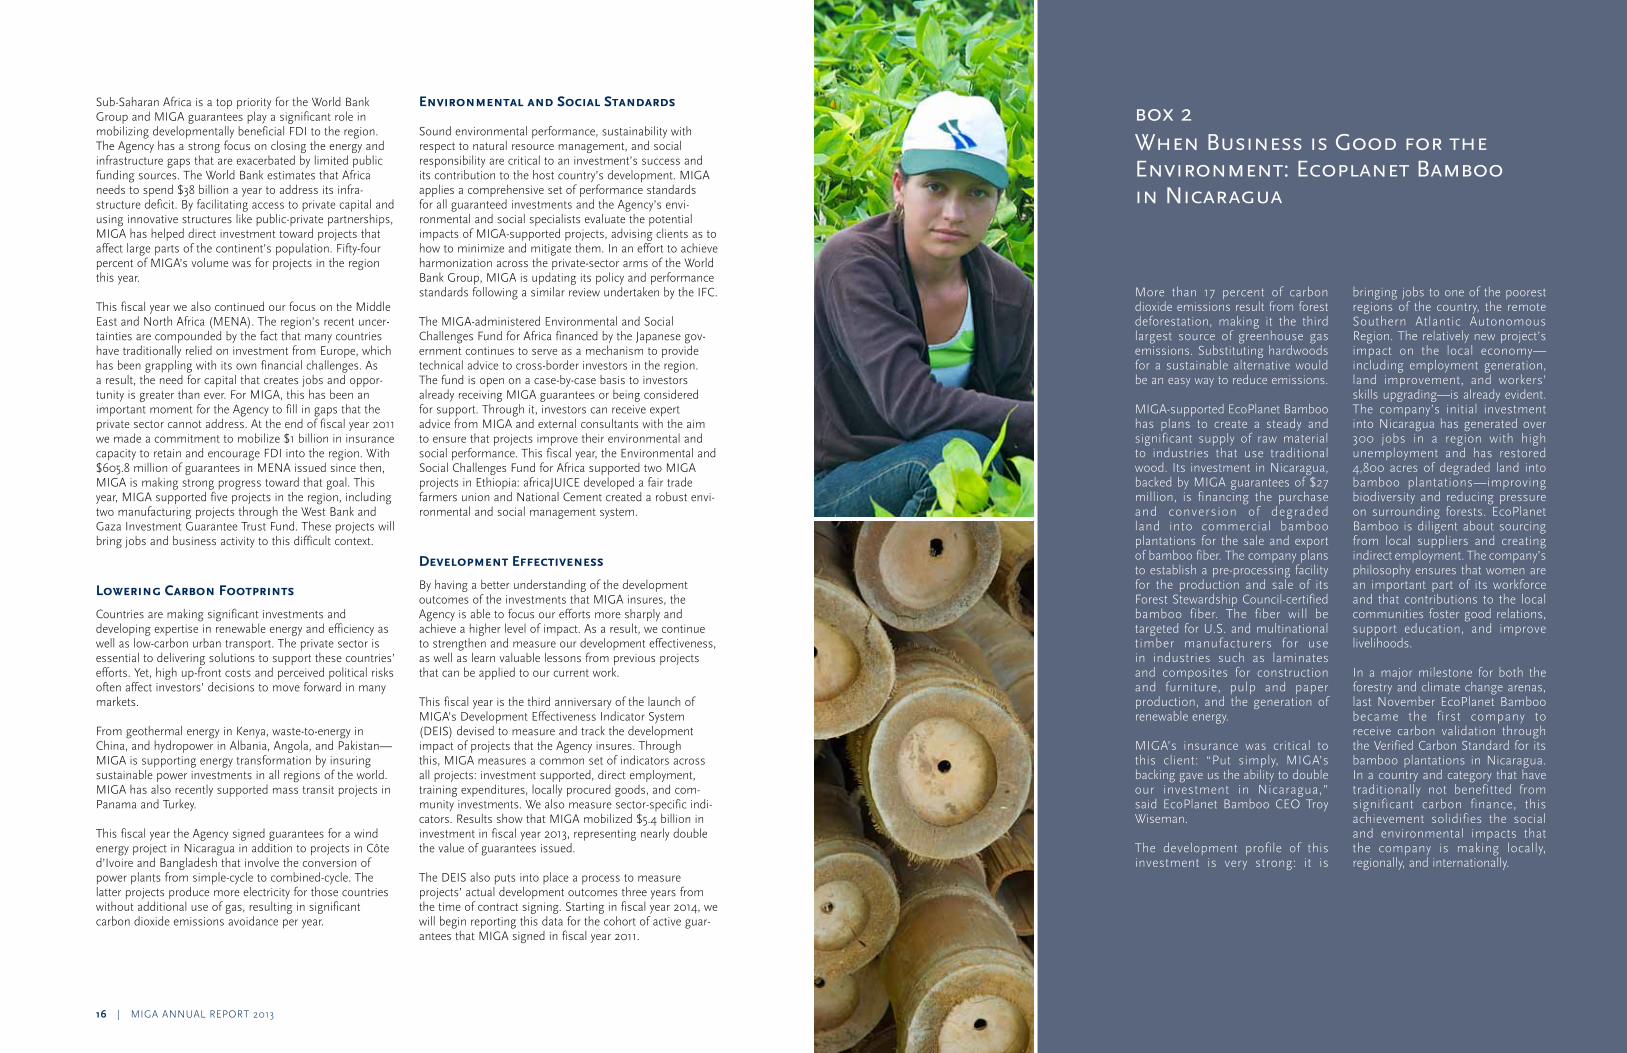
More than 17 percent of carbon dioxide emissions result from forest deforestation, making it the third largest source of greenhouse gas emissions. Substituting hardwoods for a sustainable alternative would be an easy way to reduce emissions.
MIGA-supported EcoPlanet Bamboo has plans to create a steady and significant supply of raw material to industries that use traditional wood. Its investment in Nicaragua, backed by MIGA guarantees of $27 million, is financing the purchase and conversion of degraded land into commercial bamboo plantations for the sale and export of bamboo fiber. The company plans to establish a pre-processing facility for the production and sale of its Forest Stewardship Council-certified bamboo fiber. The fiber will be targeted for U.S. and multinational timber manufacturers for use in industries such as laminates and composites for construction and furniture, pulp and paper production, and the generation of renewable energy.
MIGA’s insurance was critical to this client: “Put simply, MIGA’s backing gave us the ability to double our investment in Nicaragua,” said EcoPlanet Bamboo CEO Troy Wiseman.
The development profile of this investment is very strong: it is
bringing jobs to one of the poorest regions of the country, the remote Southern Atlantic Autonomous Region. The relatively new project’s impact on the local economy—including employment generation, land improvement, and workers’ skills upgrading—is already evident. The company’s initial investment into Nicaragua has generated over 300 jobs in a region with high unemployment and has restored 4,800 acres of degraded land into bamboo plantations—improving biodiversity and reducing pressure on surrounding forests. EcoPlanet Bamboo is diligent about sourcing from local suppliers and creating indirect employment. The company’s philosophy ensures that women are an important part of its workforce and that contributions to the local communities foster good relations, support education, and improve livelihoods.
In a major milestone for both the forestry and climate change arenas, last November EcoPlanet Bamboo became the first company to receive carbon validation through the Verified Carbon Standard for its bamboo plantations in Nicaragua. In a country and category that have traditionally not benefitted from significant carbon finance, this achievement solidifies the social and environmental impacts that the company is making locally, regionally, and internationally.
18 | MIGA ANNUAL REPORT 2013
MIGA continues to improve its measurement of devel-opment effectiveness. The Agency is also collaborating with other development finance institutions in an effort to standardize indicators.
Another useful tool in enhancing MIGA’s understanding of development effectiveness is the Agency’s self-evaluation program. These evaluations include in-depth monitoring of project results looking at the following criteria: business performance, economic sustainability, private sector development impact, development outcomes, and envi-ronmental and social outcomes. These are undertaken in addition to evaluations conducted by the World Bank’s Independent Evaluation Group (IEG)—discussed later in this report—and ongoing monitoring of projects by MIGA staff. This year, the Agency conducted self-evaluations of six projects.
This past year, IEG conducted an evaluation on WorldBankGroupSupportforInnovationandEntrepreneurship in developing countries. The report underscored that inno-vation is not only critical for economic growth, but is also becoming increasingly important for addressing major development challenges, such as those related to inclusion and sustainability. IEG found many cases where MIGA’s support for firm-level technology upgrading (through tech-nology transfer, technology diffusion, and acquisition of new technology) helped promote innovation, skills devel-opment, and growth of the private sector. The report also highlighted how MIGA’s guarantees helped jump start FDI in post-conflict situations, and supported South-South technology transfer and knowledge flows.
MIGA and Corporate Integrity
According to one recent estimate, $20-$40 billion is siphoned from developing countries each year as a result of corruption. Corruption also adds to the cost of doing business in many countries, undermines their investment climate, and weakens their rule of law. This recognition of the impact of corruption has inspired the conventions, laws, and policies that now govern business activities around the world, MIGA’s clients, as well as host and originating countries.
Applying high standards of corporate integrity is an important way MIGA supports positive sustainable FDI. MIGA developed an integrity strategy in 2011 to help safeguard the development impact of investments we insure. In 2012, MIGA formalized a framework as part of our underwriting process to identify potential risks asso-ciated with unethical or illegal activities such as bribery, corruption, fraud, collusion, and money laundering. MIGA’s integrity due diligence requires consideration of the specifics of the transaction, but always includes an analysis of the project structure, its licensing or tendering process, and potential integrity or reputational risks presented by the project enterprise and the project’s par-ticipants.
MIGA’s integrity due diligence procedures help reduce the possibility of corruption in projects we support. In addition, the Agency’s anti-corruption provisions are integrated into our contract of guarantee. MIGA expects our clients and partners to abide by national laws, comply with relevant trade and procurement rules, and also adhere to World Bank Group anti-corruption standards.
In 2012, information about projects supported by MIGA was included in a newly developed mobile application that enables users to confidentially report concerns of fraud and corruption in its projects to the World Bank Group’s Integrity Vice Presidency. The mobile application also enables users to identify projects based on country, type of activity, or keyword and send images. In addition, the mobile application provides access to the World Bank Group’s list of debarred firms and individuals.
The idea for a multilateral political risk insurance provider was floated long before MIGA’s establishment—as far back as 1948. But it was not until September 1985 that this idea started to become a reality. At that time the World Bank’s Board of Governors began the process of creating a new investment insurance affiliate by endorsing the MIGA convention that defined its core mission: “to enhance the flow to developing countries of capital and technology for productive purposes under conditions consistent with their developmental needs, policies and objectives, on the basis of fair and stable standards to the treatment of foreign investment.”
On April 12, 1988 an international convention established MIGA as the newest member of the World Bank Group. The Agency opened for business as a legally separate and financially independent entity. Membership was open to all IBRD members, and the Agency began with capital stock of $1 billion.
MIGA’s original 29 members were: Bahrain, Bangladesh, Barbados, Canada, Chile, Cyprus, Denmark, Ecuador, Egypt, Germany, Grenada, Indonesia, Jamaica, Japan, Jordan, Korea, Kuwait, Lesotho, Malawi, Netherlands, Nigeria, Pakistan, Samoa, Saudi Arabia, Senegal, Sweden, Switzerland, United Kingdom, and United States.
MIGA was created to complement public and private sources of investment insurance against non-commercial risks in developing countries. MIGA’s multilateral character and joint sponsorship by developed and developing countries were seen as significantly enhancing confidence among cross-border investors.
Today, MIGA’s mission remains straightforward: to promote foreign direct investment into developing countries to support economic growth, reduce poverty, and improve people’s lives.
box 3 mIgA History
MIGA ANNUAL REPORT 2013 | 21
20 | MIGA ANNUAL REPORT 2013
Operational Overview
In fiscal year 2013, mIgA issued $2.8 billion in new guarantees. of
this, $1.3 billion was ceded to mIgA’s reinsurance partners. An
additional $3.5 million in coverage was issued through the mIgA-
administered West Bank and gaza Investment guarantee trust Fund.
total portfolio runoff (contract cancellations, expiries, reductions,
and translation adjustment) for the fiscal year was $2.4 billion.
An increased volume of cancellations this year was largely the result of loan repayments for shareholder loans insured during the peak of the financial crisis.
At the close of the fiscal year, the Agency’s gross exposure was $10.8 billion, another all-time high continuing a three-year trend (see figure 1).
MIGA’s Operating Environment
The global financial crisis shaped much of MIGA’s business over the past several years. The Agency provided much-needed
support to the financial sector in 2009 and 2010, particularly in Europe and Central Asia, a region severely impacted by the crisis that began in 2008. From 2010, as the global economy gradually showed signs of recovery, MIGA saw renewed interest from investors in other sectors, particularly infrastructure, manufacturing, and extractive industries.
In 2011, overall foreign direct investment (FDI) flows to emerging markets declined because of the sovereign debt crisis in Europe, ongoing political turmoil in the Middle East, and volatility in certain parts of Africa. Yet even as global perceptions of risks worsened, investors searched for opportunities in frontier markets, attracted by the prospect of higher returns. This trend, coupled with recent amendments to MIGA’s Convention that expanded the scope of investments the Agency could support, has resulted in a doubling of MIGA’s business volume in the last four years.
This year MIGA’s Board of Executive Directors further broadened the scope of MIGA’s product offerings by authorizing the Agency to extend our non-honoring of financial obligations cover for lending to credit-worthy state-owned enterprises (SOEs). This occurred in response to demand from commercial and investment banks seeking to fund projects carried out by financially sound SOEs without a government guarantee. MIGA continues to see high demand for the non-honoring product introduced in 2009, which allows governments, and now SOEs, to access long-term commercial
Business
MIGA ANNUAL REPORT 2013 | 2322 | MIGA ANNUAL REPORT 2013
AR chapter box colors
0 10 20 30 40
Increased marketopportunities
One year ofpolitical stability
Improvedmacroeconomic
stability
Decrease in corruption
More favorablegov’t regulations
Increased accessto financing
Improved infrastructurecapacity
Increased accessto qualified staff
Other
Over the next 12 months
Macroeconomicinstability
Access to financing
Access to qualified staff
Political risk
Infrastructure capacity
Limited market opportunities
Corruption
Increased governmentregulation in the aftermath
of the global financial crisis
Other
0 10 20 30
Over the next three years
Political risk
Macroeconomic instability
Access to qualified staff
Access to financing
Corruption
Infrastructure capacity
Limited market opportunities
Increased governmentregulation in the aftermathof the global financial crisis
Other
0 10 20 30
AustriaUnited Kingdom
FranceUnited States
GermanySouth AfricaLuxembourg
FinlandSwitzerland
GreeceSingapore
United Arab EmiratesCanada
MauritiusKorea, Republic of
SpainCayman Islands
SloveniaBermuda
SenegalEgypt, Arab Republic of
CyprusNetherlands
SwedenJapan
Others
Others: Nigeria, Poland, China, Thailand, Norway, Ecuador, Tanzania, Turkey, Romania, Kenya, Ireland, Belgium, Mali, India, Lebanon, Tunisia, Italy, St. Kitts and Nevis, Denmark, Panama, Virgin Islands (British), Colombia
* Numbers may not add to 100 percent due to guarantee holders domiciled in two different countries
23.912.510.09.27.35.34.12.82.62.32.32.11.61.51.41.31.11.00.90.70.70.70.70.70.72.7
2013
2012
2011
2010
2009
Eearned premium
Fig 2
Fig 4
Fig 6
Fig 5
Fig 1 fin
Figure 8
Figure 9 Figure 7Figure 1
33.6
36.9
13.9
24.1
36.9
Premium and fee incomeInvestment income
46% Infrastructure
23% Oil, gas, and mining
17% Financial
14% Agribusiness, manufacturing, and services
59% Infrastructure
22% Oil, gas, and mining
10% Agribusiness, manufacturing, and services
9% Financial
54% Sub-Saharan Africa
19% Europe and Central Asia
18% Asia and the Pacific
6% Middle East and North Africa*
3% Latin America and the Caribbean
31% Money Market/Cash
19% Mortgage-backed Securities
17% Domestic Government
16% Global Equities
10% Agency
4% Asset-backed Securities
3% Sovereign/Govt Guarantee
47% Sub-Saharan Africa
20% Europe and Central Asia
13% Asia and the Pacific
10% Middle East and North Africa*
10% Latin America and the Caribbean
41% Europe and Central Asia26% Sub-Saharan Africa
15% Asia and the Pacific
10% Latin America and the Caribbean
8% Middle East and North Africa
66.3
61.7
50.8
46.0
43.6
Fig 3
03 04 05 06 07 08 09 10 11 12 13
gross exposure
net exposure
12
10
8
6
4
2
0
in countries eligible for concessional lending from the International Development Association (IDA), investments in fragile and conflict-affected economies, investments in complex projects, and South-South investments.
In terms of regional diversification, MIGA’s projects in sub-Saharan Africa again accounted for the largest portion of new business volume in fiscal year 2013 at 54 percent, more than double the fiscal year 2012 volume of 24 percent (see figure 3).
New business by sector has shifted dramatically from the financial sector (at 17 percent of new volume this year compared to 89 percent in 2009) to infrastructure (at 46 percent of new volume this year) and oil and gas (23 percent). See figure 2 for this breakdown.
Underlying these results is the transformational nature of many of these projects that help bring power, transpor-tation, and more efficient technologies into countries that have the greatest need for investment. Governments also have demonstrated increased interest and need to engage with the private sector in public-private partnerships in order to achieve their development goals.
Figure 5 – Outstanding Portfolio Distribution by Host Region Percent of Gross Exposure
MIGA-Supported Investments Receive Industry Awards
This year MIGA-supported investments received an unprecedented number of industry awards for pioneering and innovative transactions. ProjectFinanceInternationaland InfrastructureJournal both recognized the Azito Thermal Power Plant and Expansion in Côte d’Ivoire. The transaction, involving the expansion of the plant from single to combined cycle, was named African Power Deal of the Year 2012 and Power Deal of the Year 2012, respec-tively. Another transformational project in Côte d’Ivoire, the Henri Konan Bedié Bridge was named African Transport
Deal of the Year 2012 by ProjectFinance magazine. This transaction is the first public-private partnership in Africa to use a minimum revenue guarantee.
TradeFinance magazineacknowledged two MIGA-supported investments. The magazine awarded the Asia Pacific Deal of the Year to the Ashuganj Power Station Company Ltd. in Bangladesh. The project was recognized as pioneering in many respects, particularly for the broad participation of commercial lenders, export credit agencies, and MIGA (see box 2). The Panama Metro Line One was named Americas Deal of the Year in 2012, with the innovative use of a MIGA guarantee by the project’s com-mercial lenders deemed particularly noteworthy.
ThisisAfrica magazine recently launched its “Beyond Business Awards,” recognizing the companies that are developing the sustainable business practices, including attention to corporate and social responsibility. MIGA client Chayton Africa was recognized for work in Zambia where they are introducing modern and sustainable farming practices and improving adoption of these practices by small-scale farmers.
Strengthening Partnerships, Expanding Global Presence
MIGA has undertaken several initiatives to expand our client base and increase our impact in the countries with the greatest need. These include growing the Agency’s presence outside our Washington headquarters to be closer to both investors and host countries. We have also strengthened our collaboration with World Bank Group counterparts and other development partners.
MIGA’s Asia hub, based in Singapore, continues to broaden its reach with the appointment of a represen-tative in Seoul where the World Bank Group has opened a new office focused on strengthening its efforts to work in tandem with the government of Korea to find sustainable development solutions for emerging countries. MIGA also has staff in Beijing; Hong Kong SAR, China; and Tokyo. The Asia hub contributes to guarantee operations in terms of both underwriting and business development, and supports the Agency’s knowledge agenda in the region, working closely with colleagues from the World Bank and IFC.
The hub carries out systematic discussions with host-country governments as well as World Bank Group country offices to identify priority needs. Hub staff also work to identify projects where private sector financing may be needed and where MIGA could add value by addressing the perception of country risks. In addition to its part-nerships with the governments of the Philippines and Indonesia, MIGA has entered into high-level talks with
debt for critical infrastructure projects (see box 2). Availability of commercial debt is particularly important for IDA-eligible countries in light of decreased aid budgets. MIGA is also beginning to see new structures combining the non-honoring product with capital market transactions underpinned by an eligible infrastructure investment. This approach widens MIGA’s business from the traditional application of guarantees that directly support infra-structure investments.
Against this backdrop, the political risk insurance industry continues to enjoy robust growth and overall capacity is ample. Investment insurance provided by Berne Union members has increased by 40 percent since 2008. However, private insurers remain closed for business or work under very narrow terms with limited tenors in many countries, especially those experiencing instability. MIGA is often able to fill this gap in the market because of its devel-opment mandate (see box 1).
Figure 1 – Guarantees Portfolio, Gross and Net Outstanding Exposure ($M)
MIGA’s Portfolio
In addition to shifting global demand and new product offerings, the transformation of MIGA’s portfolio has been shaped by stepped-up business development efforts focusing on the Agency’s strategic priority areas. Twenty-seven out of 32 projects supported by MIGA (including the West Bank and Gaza Trust Fund) this year fell into one or more of these priorities: investments
AR chapter box colors
0 10 20 30 40
Increased marketopportunities
One year ofpolitical stability
Improvedmacroeconomic
stability
Decrease in corruption
More favorablegov’t regulations
Increased accessto financing
Improved infrastructurecapacity
Increased accessto qualified staff
Other
Over the next 12 months
Macroeconomicinstability
Access to financing
Access to qualified staff
Political risk
Infrastructure capacity
Limited market opportunities
Corruption
Increased governmentregulation in the aftermath
of the global financial crisis
Other
0 10 20 30
Over the next three years
Political risk
Macroeconomic instability
Access to qualified staff
Access to financing
Corruption
Infrastructure capacity
Limited market opportunities
Increased governmentregulation in the aftermathof the global financial crisis
Other
0 10 20 30
AustriaUnited Kingdom
FranceUnited States
GermanySouth AfricaLuxembourg
FinlandSwitzerland
GreeceSingapore
United Arab EmiratesCanada
MauritiusKorea, Republic of
SpainCayman Islands
SloveniaBermuda
SenegalEgypt, Arab Republic of
CyprusNetherlands
SwedenJapan
Others
Others: Nigeria, Poland, China, Thailand, Norway, Ecuador, Tanzania, Turkey, Romania, Kenya, Ireland, Belgium, Mali, India, Lebanon, Tunisia, Italy, St. Kitts and Nevis, Denmark, Panama, Virgin Islands (British), Colombia
* Numbers may not add to 100 percent due to guarantee holders domiciled in two different countries
23.912.510.09.27.35.34.12.82.62.32.32.11.61.51.41.31.11.00.90.70.70.70.70.70.72.7
2013
2012
2011
2010
2009
Eearned premium
Fig 2
Fig 4
Fig 6
Fig 5
Fig 1 fin
Figure 8
Figure 9 Figure 7Figure 1
33.6
36.9
13.9
24.1
36.9
Premium and fee incomeInvestment income
46% Infrastructure
23% Oil, gas, and mining
17% Financial
14% Agribusiness, manufacturing, and services
59% Infrastructure
22% Oil, gas, and mining
10% Agribusiness, manufacturing, and services
9% Financial
54% Sub-Saharan Africa
19% Europe and Central Asia
18% Asia and the Pacific
6% Middle East and North Africa*
3% Latin America and the Caribbean
31% Money Market/Cash
19% Mortgage-backed Securities
17% Domestic Government
16% Global Equities
10% Agency
4% Asset-backed Securities
3% Sovereign/Govt Guarantee
47% Sub-Saharan Africa
20% Europe and Central Asia
13% Asia and the Pacific
10% Middle East and North Africa*
10% Latin America and the Caribbean
41% Europe and Central Asia26% Sub-Saharan Africa
15% Asia and the Pacific
10% Latin America and the Caribbean
8% Middle East and North Africa
66.3
61.7
50.8
46.0
43.6
Fig 3
03 04 05 06 07 08 09 10 11 12 13
gross exposure
net exposure
12
10
8
6
4
2
0
Figure 2 – Guarantees Issued in FY 13, by sector (by $ volume)
Figure 3 – Guarantees Issued in FY 13, by region (by $ volume)
*ExcludestwoprojectssupportedundertheMIGA-administeredWestBankandGazaInvestmentGuaranteeTrustFund
Figure 4 – Guarantees Issued in FY 13, by region (by number of projects)
*ExcludestwoprojectssupportedundertheMIGA-administeredWestBankandGazaInvestmentGuaranteeTrustFund
AR chapter box colors
0 10 20 30 40
Increased marketopportunities
One year ofpolitical stability
Improvedmacroeconomic
stability
Decrease in corruption
More favorablegov’t regulations
Increased accessto financing
Improved infrastructurecapacity
Increased accessto qualified staff
Other
Over the next 12 months
Macroeconomicinstability
Access to financing
Access to qualified staff
Political risk
Infrastructure capacity
Limited market opportunities
Corruption
Increased governmentregulation in the aftermath
of the global financial crisis
Other
0 10 20 30
Over the next three years
Political risk
Macroeconomic instability
Access to qualified staff
Access to financing
Corruption
Infrastructure capacity
Limited market opportunities
Increased governmentregulation in the aftermathof the global financial crisis
Other
0 10 20 30
AustriaUnited Kingdom
FranceUnited States
GermanySouth AfricaLuxembourg
FinlandSwitzerland
GreeceSingapore
United Arab EmiratesCanada
MauritiusKorea, Republic of
SpainCayman Islands
SloveniaBermuda
SenegalEgypt, Arab Republic of
CyprusNetherlands
SwedenJapan
Others
Others: Nigeria, Poland, China, Thailand, Norway, Ecuador, Tanzania, Turkey, Romania, Kenya, Ireland, Belgium, Mali, India, Lebanon, Tunisia, Italy, St. Kitts and Nevis, Denmark, Panama, Virgin Islands (British), Colombia
* Numbers may not add to 100 percent due to guarantee holders domiciled in two different countries
23.912.510.09.27.35.34.12.82.62.32.32.11.61.51.41.31.11.00.90.70.70.70.70.70.72.7
2013
2012
2011
2010
2009
Eearned premium
Fig 2
Fig 4
Fig 6
Fig 5
Fig 1 fin
Figure 8
Figure 9 Figure 7Figure 1
33.6
36.9
13.9
24.1
36.9
Premium and fee incomeInvestment income
46% Infrastructure
23% Oil, gas, and mining
17% Financial
14% Agribusiness, manufacturing, and services
59% Infrastructure
22% Oil, gas, and mining
10% Agribusiness, manufacturing, and services
9% Financial
54% Sub-Saharan Africa
19% Europe and Central Asia
18% Asia and the Pacific
6% Middle East and North Africa*
3% Latin America and the Caribbean
31% Money Market/Cash
19% Mortgage-backed Securities
17% Domestic Government
16% Global Equities
10% Agency
4% Asset-backed Securities
3% Sovereign/Govt Guarantee
47% Sub-Saharan Africa
20% Europe and Central Asia
13% Asia and the Pacific
10% Middle East and North Africa*
10% Latin America and the Caribbean
41% Europe and Central Asia26% Sub-Saharan Africa
15% Asia and the Pacific
10% Latin America and the Caribbean
8% Middle East and North Africa
66.3
61.7
50.8
46.0
43.6
Fig 3
03 04 05 06 07 08 09 10 11 12 13
gross exposure
net exposure
12
10
8
6
4
2
0

MIGA ANNUAL REPORT 2013 | 2524 | MIGA ANNUAL REPORT 2013
box 1Filling the private market gap in egypt
Egypt had long been perceived by investors as a relatively stable place to do business. This all changed with the onset of the civil uprising in 2011. That year brought a net divestment in Egypt of $483 million. Apache Corporation, an oil and gas exploration and production company based in the United States , had an ex is t ing investment in the country that was covered by the Overseas Private Investment Corporation (OPIC) of the United States. When the company wanted continued coverage for its existing investment as well as future exploration, development, and production of crude oil, natural gas, and condensate, OPIC approached MIGA for
long-term reinsurance because the private insurance market had partially withdrawn from Egypt as a result of political unrest.
MIGA is now providing $150 million in reinsurance for this project for a period of up to 13 years against the risks of expropriation and breach of contract. Although the coverage was for an existing investment, the investor had demonstrated a long-term commitment to the country and the investment had a high development impact. These characteristics made the investment eligible under MIGA’s Convention, which was amended in 2010 to broaden the pool of eligible investments.
government officials of Mongolia, Myanmar, Vietnam, and other countries in the region.
The hub also focuses on building long-term client rela-tionships based on frequent interactions with investors and banks aimed at developing business with potential South-South investors, such as those from China and India, as well as new investor bases such as Korea. MIGA has already seen an increase in inquiries from Korean investors for projects around the world, including in Africa, the Middle East, and South Asia. Korean outbound investment accounted for $20 billion in 2011—the fifth largest source of outbound FDI from Asia.
MIGA established our Europe, Middle East, and Africa hub in Paris in fiscal year 2012. The hub is located with the World Bank and IFC offices, and MIGA works closely with our World Bank Group partners to effectively leverage our shared presence in the region. MIGA’s presence in Europe allows the Agency to more effectively serve and develop our client base. Many of these European project sponsors are focused on countries that are within MIGA’s strategic priority areas, especially in sub-Saharan Africa.
The IFC/MIGA Business Development Partnership launched in fiscal year 2012 has matured into a strong business model for World Bank Group collaboration that has helped stimulate joint business development and knowledge-sharing while providing exceptional solutions to our clients.
Following a strong fiscal year 2012, the volume of joint IFC and MIGA projects has continued its upward trend to reach $584.7 million in 2013. The partnership will continue to focus its efforts in strategic priority areas including IDA-eligible countries, fragile and conflict-affected economies, and South-South investment, with an emphasis on agri-business, financial, and infrastructure sectors.
There is also increasing collaboration across the World Bank Group institutions. Together, we offer financial instruments and technical assistance that countries need to achieve their development goals. Many of the projects supported by MIGA this year involved extensive World Bank Group cooperation during the underwriting process or the use of MIGA guarantees alongside IFC loans or World Bank guarantee instruments. These include transformative projects such as the Azito thermal power plant and the Foxtrot and Marlin oil and gas production platforms in Côte d’Ivoire. MIGA, IFC, and the World Bank also undertook a joint country visit to Myanmar in order to understand the country’s needs and present the World Bank Group’s capabilities to assist the government as it continues its integration with the global economy.
Reinsurance Partners
MIGA uses reinsurance to increase the amount of coverage we can provide, to manage the risk profile of our portfolio, and to cooperate with other insurers as required under the Agency’s Convention. The primary benefits of reinsurance accrue to our clients, the investors who gain access to increased capacity to insure projects in developing countries, and the recipient countries that benefit from higher levels of FDI.
Reinsurance arrangements increase our capacity to support large projects. As a result of our risk-mitigation effect, MIGA’s involvement encourages other insurers to participate in projects in frontier markets. It also enables other insurers to underwrite transactions with longer tenors than they would normally consider. These insurers benefit from our expertise in risk analysis and dispute reso-lution, as well as claims handling and recovery procedures. As of June 30, 2013, $4.3 billion of MIGA’s total gross exposure was reinsured.
MIGA is an active member of the Berne Union, the leading international association for the export credit and investment insurance industry. In fiscal year 2013, MIGA participated in the Berne Union’s annual meetings as well as in a number of technical panel discussions for the Investment Insurance Committee. During the fiscal year, MIGA continued to work with its treaty reinsurance partners, ACE Bermuda Insurance Co. Ltd., XL Re Ltd, Hannover Re, and ONDD —the Belgian export credit agency.
MIGA’s Capital Position
Our measures of capital adequacy and risk-bearing capacity include economic capital consumed by the guarantee portfolio. Modeled economic capital is the portion of MIGA’s capital that is placed at risk by the guarantee portfolio exposure (see figure 6 for consumption of economic capital by sector). The guarantee portfolio as a whole consumed 44 percent of MIGA’s available capital as of June 30, 2013.
Figure 6 – Consumption of MIGA’s Economic Capital by Sector in FY13
AR chapter box colors
0 10 20 30 40
Increased marketopportunities
One year ofpolitical stability
Improvedmacroeconomic
stability
Decrease in corruption
More favorablegov’t regulations
Increased accessto financing
Improved infrastructurecapacity
Increased accessto qualified staff
Other
Over the next 12 months
Macroeconomicinstability
Access to financing
Access to qualified staff
Political risk
Infrastructure capacity
Limited market opportunities
Corruption
Increased governmentregulation in the aftermath
of the global financial crisis
Other
0 10 20 30
Over the next three years
Political risk
Macroeconomic instability
Access to qualified staff
Access to financing
Corruption
Infrastructure capacity
Limited market opportunities
Increased governmentregulation in the aftermathof the global financial crisis
Other
0 10 20 30
AustriaUnited Kingdom
FranceUnited States
GermanySouth AfricaLuxembourg
FinlandSwitzerland
GreeceSingapore
United Arab EmiratesCanada
MauritiusKorea, Republic of
SpainCayman Islands
SloveniaBermuda
SenegalEgypt, Arab Republic of
CyprusNetherlands
SwedenJapan
Others
Others: Nigeria, Poland, China, Thailand, Norway, Ecuador, Tanzania, Turkey, Romania, Kenya, Ireland, Belgium, Mali, India, Lebanon, Tunisia, Italy, St. Kitts and Nevis, Denmark, Panama, Virgin Islands (British), Colombia
* Numbers may not add to 100 percent due to guarantee holders domiciled in two different countries
23.912.510.09.27.35.34.12.82.62.32.32.11.61.51.41.31.11.00.90.70.70.70.70.70.72.7
2013
2012
2011
2010
2009
Eearned premium
Fig 2
Fig 4
Fig 6
Fig 5
Fig 1 fin
Figure 8
Figure 9 Figure 7Figure 1
33.6
36.9
13.9
24.1
36.9
Premium and fee incomeInvestment income
46% Infrastructure
23% Oil, gas, and mining
17% Financial
14% Agribusiness, manufacturing, and services
59% Infrastructure
22% Oil, gas, and mining
10% Agribusiness, manufacturing, and services
9% Financial
54% Sub-Saharan Africa
19% Europe and Central Asia
18% Asia and the Pacific
6% Middle East and North Africa*
3% Latin America and the Caribbean
31% Money Market/Cash
19% Mortgage-backed Securities
17% Domestic Government
16% Global Equities
10% Agency
4% Asset-backed Securities
3% Sovereign/Govt Guarantee
47% Sub-Saharan Africa
20% Europe and Central Asia
13% Asia and the Pacific
10% Middle East and North Africa*
10% Latin America and the Caribbean
41% Europe and Central Asia26% Sub-Saharan Africa
15% Asia and the Pacific
10% Latin America and the Caribbean
8% Middle East and North Africa
66.3
61.7
50.8
46.0
43.6
Fig 3
03 04 05 06 07 08 09 10 11 12 13
gross exposure
net exposure
12
10
8
6
4
2
0

MIGA ANNUAL REPORT 2013 | 2726 | MIGA ANNUAL REPORT 2013
Dispute Resolution and Pre-Claims Assistance: Keeping Investments and Benefits on Track
When problems or disputes have a potentially adverse impact on MIGA-supported investments or the host country’s ability to attract future investment, we collaborate closely with all parties involved. In fiscal year 2013, we continued to effectively assist member governments and investors in resolving long-standing disputes, whether or not those disputes could have resulted in valid claims. Since inception, MIGA has participated in discussions on more than 100 disputes of this type. Our work on these matters has helped the parties to mitigate concerns that could have led to failure of the project, withdrawal of the investment and, possibly, a claim. Our management of potential claims and similar matters enables MIGA-supported projects to continue operating in host countries, preserving value for the investor and ensuring that projects continue to contribute to economies throughout the world.
While we encourage investors to seek a resolution of a dispute when possible, if a claim is made, MIGA’s pro-cedures ensure that it is evaluated promptly and that the claimant is given an adequate opportunity to present an argument in full. As a result of this approach, MIGA has never had a dispute with a claimant regarding our determi-nation.
An expropriation claim that had been pending at the beginning of the year was withdrawn after the parties finalized a settlement that was reached with MIGA’s active assistance.
There were no claims payments during fiscal year 2013.
box 2 Bringing power to Countries that need it most
Angola has vast indigenous energy resources, but the country’s energy infrastructure is underdeveloped, and only 30 percent of the country’s population has access to electric power. MIGA is providing coverage against non-honoring of sovereign f inancia l obl igat ions to the commercial lenders financing the expansion of the Cambambe hydroelectric power plant.
HSBC Bank plc, Société Générale, and BHF-Bank Aktiengesellschaft have arranged €391.7 million in debt financing to the government of Angola for the Cambambe plant, one of two hydroelectric power stations operating on the Kwanza River. The expansion involves the construction of a second powerhouse with four additional turbine generators with a total additional capacity of 700 megawatts.
This expansion will bring a clean source of energy to a country that is still rebuilding after conflict and contribute to Angola’s effort to diversify its economy.
In Bangladesh, MIGA is backing a financing package arranged by HSBC of the United Kingdom to Ashuganj
Power Station Company Limited (APSCL), a state-owned utility. The financing is for the construction of the 450-megawatt combined-cycle gas-fired Ashuganj South power plant, which is expected to provide nearly 12,000 households with electricity.
MIGA’s guarantees of $251.4 million are providing coverage against the risk of non-honoring of sovereign financial obligations for a period of up to 13 and a half years. The Ministry of Finance of Bangladesh has provided an unconditional sovereign guarantee cover ing payment obligations of APSCL under its debt financing and swap arrangement with HSBC. This transaction represented the country’s first power sector credit facility agreement.
The project wi l l contr ibute enormously to the country’s power sector objectives, adding clean generation capacity through an indigenous fuel source. MIGA’s involvement was crucial for this important project to move forward, as insurance in the private market was limited due to the lengthy tenor of the loan.
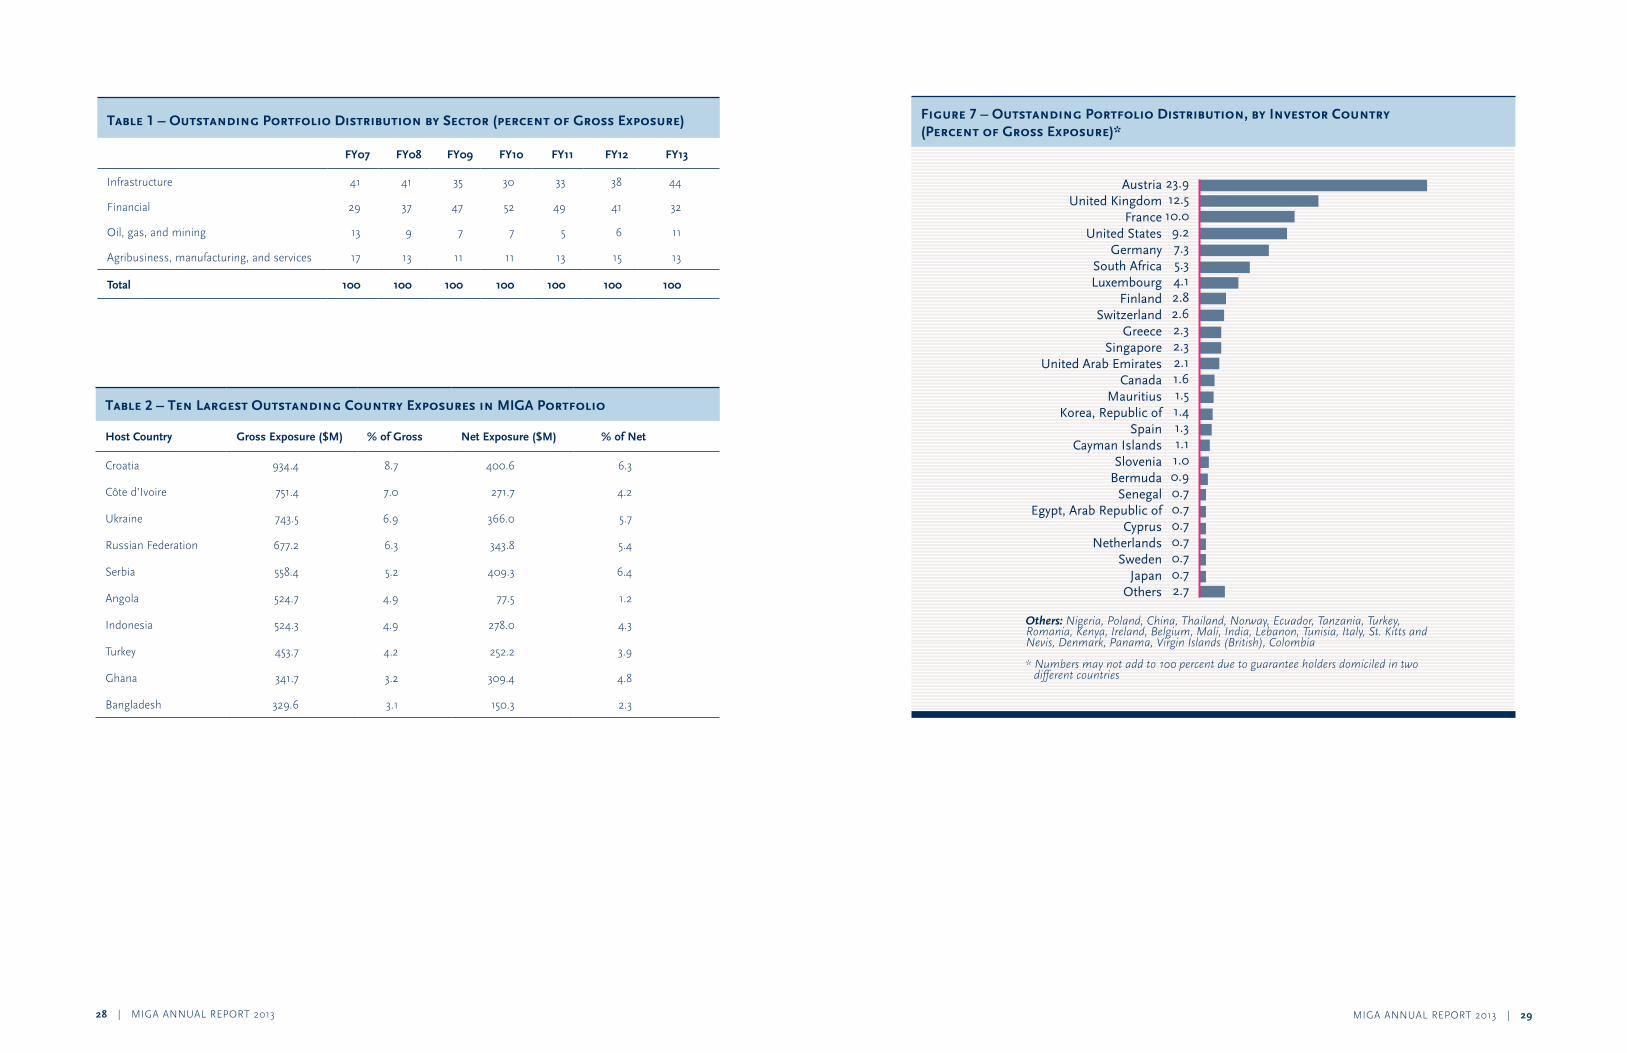
MIGA ANNUAL REPORT 2013 | 2928 | MIGA ANNUAL REPORT 2013
Figure 7 – Outstanding Portfolio Distribution, by Investor Country (Percent of Gross Exposure)*
AR chapter box colors
0 10 20 30 40
Increased marketopportunities
One year ofpolitical stability
Improvedmacroeconomic
stability
Decrease in corruption
More favorablegov’t regulations
Increased accessto financing
Improved infrastructurecapacity
Increased accessto qualified staff
Other
Over the next 12 months
Macroeconomicinstability
Access to financing
Access to qualified staff
Political risk
Infrastructure capacity
Limited market opportunities
Corruption
Increased governmentregulation in the aftermath
of the global financial crisis
Other
0 10 20 30
Over the next three years
Political risk
Macroeconomic instability
Access to qualified staff
Access to financing
Corruption
Infrastructure capacity
Limited market opportunities
Increased governmentregulation in the aftermathof the global financial crisis
Other
0 10 20 30
AustriaUnited Kingdom
FranceUnited States
GermanySouth AfricaLuxembourg
FinlandSwitzerland
GreeceSingapore
United Arab EmiratesCanada
MauritiusKorea, Republic of
SpainCayman Islands
SloveniaBermuda
SenegalEgypt, Arab Republic of
CyprusNetherlands
SwedenJapan
Others
Others: Nigeria, Poland, China, Thailand, Norway, Ecuador, Tanzania, Turkey, Romania, Kenya, Ireland, Belgium, Mali, India, Lebanon, Tunisia, Italy, St. Kitts and Nevis, Denmark, Panama, Virgin Islands (British), Colombia
* Numbers may not add to 100 percent due to guarantee holders domiciled in two different countries
23.912.510.09.27.35.34.12.82.62.32.32.11.61.51.41.31.11.00.90.70.70.70.70.70.72.7
2013
2012
2011
2010
2009
Eearned premium
Fig 2
Fig 4
Fig 6
Fig 5
Fig 1 fin
Figure 8
Figure 9 Figure 7Figure 1
33.6
36.9
13.9
24.1
36.9
Premium and fee incomeInvestment income
46% Infrastructure
23% Oil, gas, and mining
17% Financial
14% Agribusiness, manufacturing, and services
59% Infrastructure
22% Oil, gas, and mining
10% Agribusiness, manufacturing, and services
9% Financial
54% Sub-Saharan Africa
19% Europe and Central Asia
18% Asia and the Pacific
6% Middle East and North Africa*
3% Latin America and the Caribbean
31% Money Market/Cash
19% Mortgage-backed Securities
17% Domestic Government
16% Global Equities
10% Agency
4% Asset-backed Securities
3% Sovereign/Govt Guarantee
47% Sub-Saharan Africa
20% Europe and Central Asia
13% Asia and the Pacific
10% Middle East and North Africa*
10% Latin America and the Caribbean
41% Europe and Central Asia26% Sub-Saharan Africa
15% Asia and the Pacific
10% Latin America and the Caribbean
8% Middle East and North Africa
66.3
61.7
50.8
46.0
43.6
Fig 3
03 04 05 06 07 08 09 10 11 12 13
gross exposure
net exposure
12
10
8
6
4
2
0
Table 2 – Ten Largest Outstanding Country Exposures in MIGA Portfolio
Host Country Gross Exposure ($M) % of Gross Net Exposure ($M) % of Net
Croatia 934.4 8.7 400.6 6.3
Côte d’Ivoire 751.4 7.0 271.7 4.2
Ukraine 743.5 6.9 366.0 5.7
Russian Federation 677.2 6.3 343.8 5.4
Serbia 558.4 5.2 409.3 6.4
Angola 524.7 4.9 77.5 1.2
Indonesia 524.3 4.9 278.0 4.3
Turkey 453.7 4.2 252.2 3.9
Ghana 341.7 3.2 309.4 4.8
Bangladesh 329.6 3.1 150.3 2.3
Table 1 – Outstanding Portfolio Distribution by Sector (percent of Gross Exposure)
FY07 FY08 FY09 FY10 FY11 FY12 FY13
Infrastructure 41 41 35 30 33 38 44
Financial 29 37 47 52 49 41 32
Oil, gas, and mining 13 9 7 7 5 6 11
Agribusiness, manufacturing, and services 17 13 11 11 13 15 13
Total 100 100 100 100 100 100 100
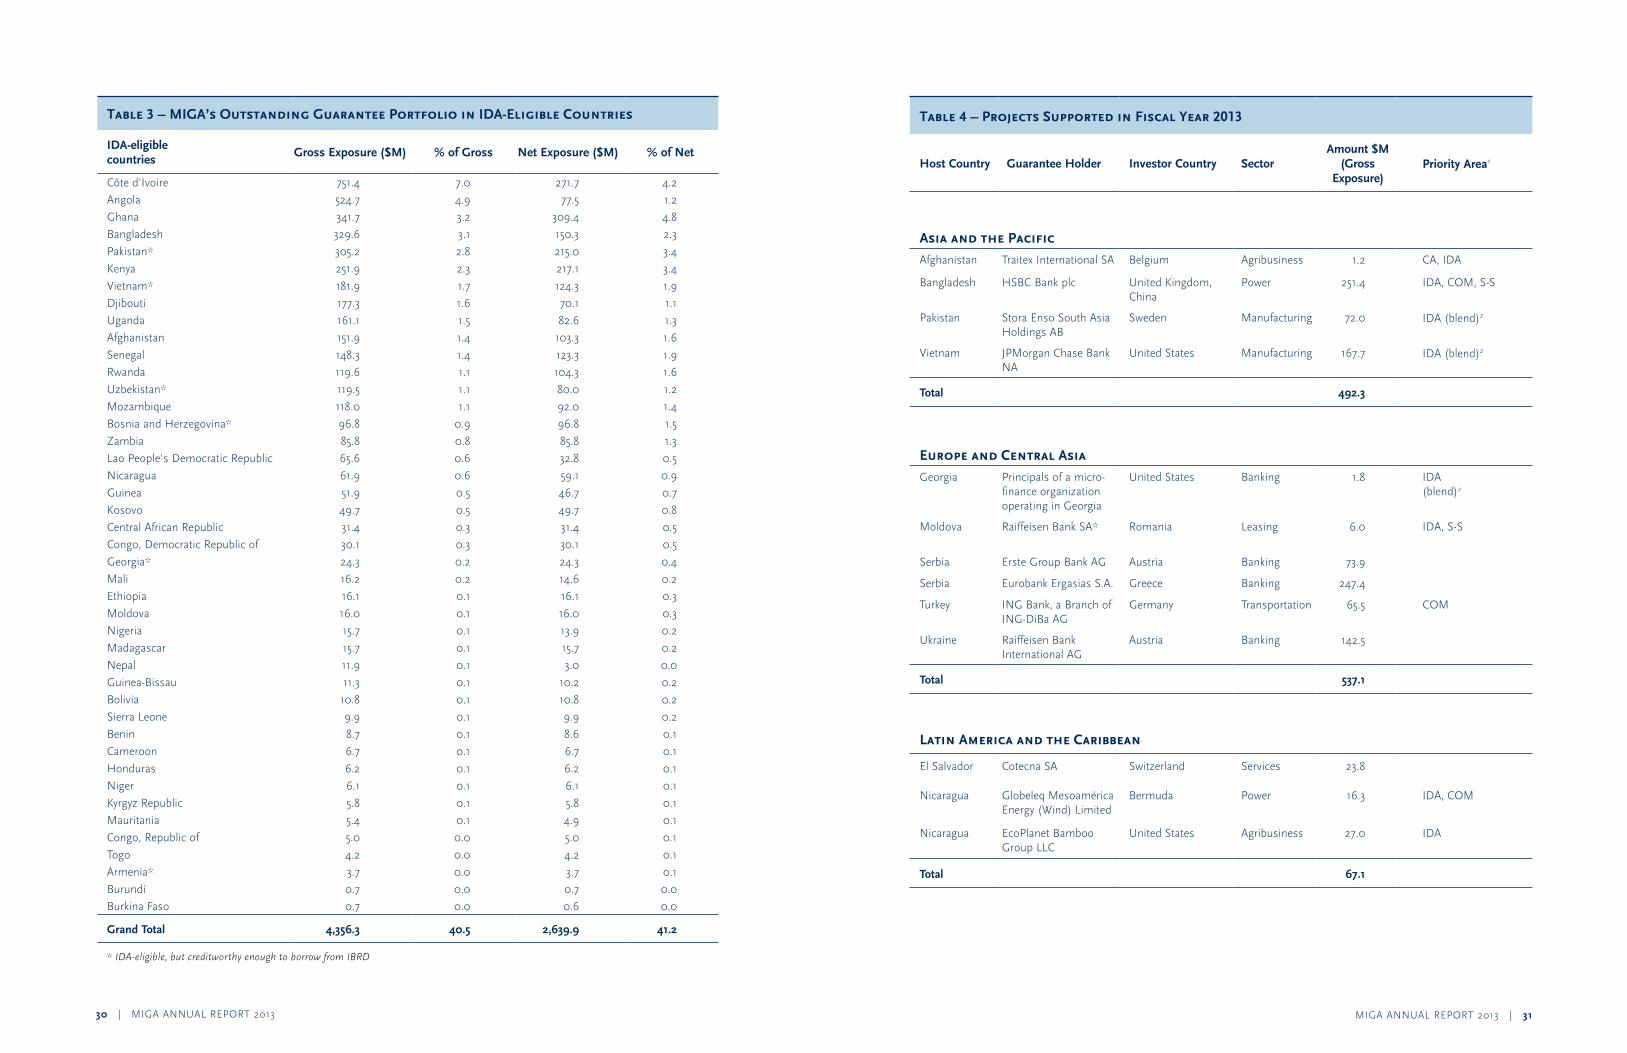
MIGA ANNUAL REPORT 2013 | 3130 | MIGA ANNUAL REPORT 2013
Table 4 – Projects Supported in Fiscal Year 2013
Host Country Guarantee Holder Investor Country SectorAmount $M
(Gross Exposure)
Priority Area1
Asia and the PacificAfghanistan Traitex International SA Belgium Agribusiness 1.2 CA, IDA
Bangladesh HSBC Bank plc United Kingdom, China
Power 251.4 IDA, COM, S-S
Pakistan Stora Enso South Asia Holdings AB
Sweden Manufacturing 72.0 IDA (blend)2
Vietnam JPMorgan Chase Bank NA
United States Manufacturing 167.7 IDA (blend)2
Total 492.3
Europe and Central AsiaGeorgia Principals of a micro-
finance organization operating in Georgia
United States Banking 1.8 IDA (blend)2
Moldova Raiffeisen Bank SA* Romania Leasing 6.0 IDA, S-S
Serbia Erste Group Bank AG Austria Banking 73.9
Serbia Eurobank Ergasias S.A. Greece Banking 247.4
Turkey ING Bank, a Branch of ING-DiBa AG
Germany Transportation 65.5 COM
Ukraine Raiffeisen Bank International AG
Austria Banking 142.5
Total 537.1
Latin America and the Caribbean
El Salvador Cotecna SA Switzerland Services 23.8
Nicaragua Globeleq Mesoamérica Energy (Wind) Limited
Bermuda Power 16.3 IDA, COM
Nicaragua EcoPlanet Bamboo Group LLC
United States Agribusiness 27.0 IDA
Total 67.1
Table 3 – MIGA’s Outstanding Guarantee Portfolio in IDA-Eligible Countries
IDA-eligible countries
Gross Exposure ($M) % of Gross Net Exposure ($M) % of Net
Côte d'Ivoire 751.4 7.0 271.7 4.2
Angola 524.7 4.9 77.5 1.2
Ghana 341.7 3.2 309.4 4.8
Bangladesh 329.6 3.1 150.3 2.3
Pakistan* 305.2 2.8 215.0 3.4
Kenya 251.9 2.3 217.1 3.4
Vietnam* 181.9 1.7 124.3 1.9
Djibouti 177.3 1.6 70.1 1.1
Uganda 161.1 1.5 82.6 1.3
Afghanistan 151.9 1.4 103.3 1.6
Senegal 148.3 1.4 123.3 1.9
Rwanda 119.6 1.1 104.3 1.6
Uzbekistan* 119.5 1.1 80.0 1.2
Mozambique 118.0 1.1 92.0 1.4
Bosnia and Herzegovina* 96.8 0.9 96.8 1.5
Zambia 85.8 0.8 85.8 1.3
Lao People's Democratic Republic 65.6 0.6 32.8 0.5
Nicaragua 61.9 0.6 59.1 0.9
Guinea 51.9 0.5 46.7 0.7
Kosovo 49.7 0.5 49.7 0.8
Central African Republic 31.4 0.3 31.4 0.5
Congo, Democratic Republic of 30.1 0.3 30.1 0.5
Georgia* 24.3 0.2 24.3 0.4
Mali 16.2 0.2 14.6 0.2
Ethiopia 16.1 0.1 16.1 0.3
Moldova 16.0 0.1 16.0 0.3
Nigeria 15.7 0.1 13.9 0.2
Madagascar 15.7 0.1 15.7 0.2
Nepal 11.9 0.1 3.0 0.0
Guinea-Bissau 11.3 0.1 10.2 0.2
Bolivia 10.8 0.1 10.8 0.2
Sierra Leone 9.9 0.1 9.9 0.2
Benin 8.7 0.1 8.6 0.1
Cameroon 6.7 0.1 6.7 0.1
Honduras 6.2 0.1 6.2 0.1
Niger 6.1 0.1 6.1 0.1
Kyrgyz Republic 5.8 0.1 5.8 0.1
Mauritania 5.4 0.1 4.9 0.1
Congo, Republic of 5.0 0.0 5.0 0.1
Togo 4.2 0.0 4.2 0.1
Armenia* 3.7 0.0 3.7 0.1
Burundi 0.7 0.0 0.7 0.0
Burkina Faso 0.7 0.0 0.6 0.0
Grand Total 4,356.3 40.5 2,639.9 41.2
*IDA-eligible,butcreditworthyenoughtoborrowfromIBRD
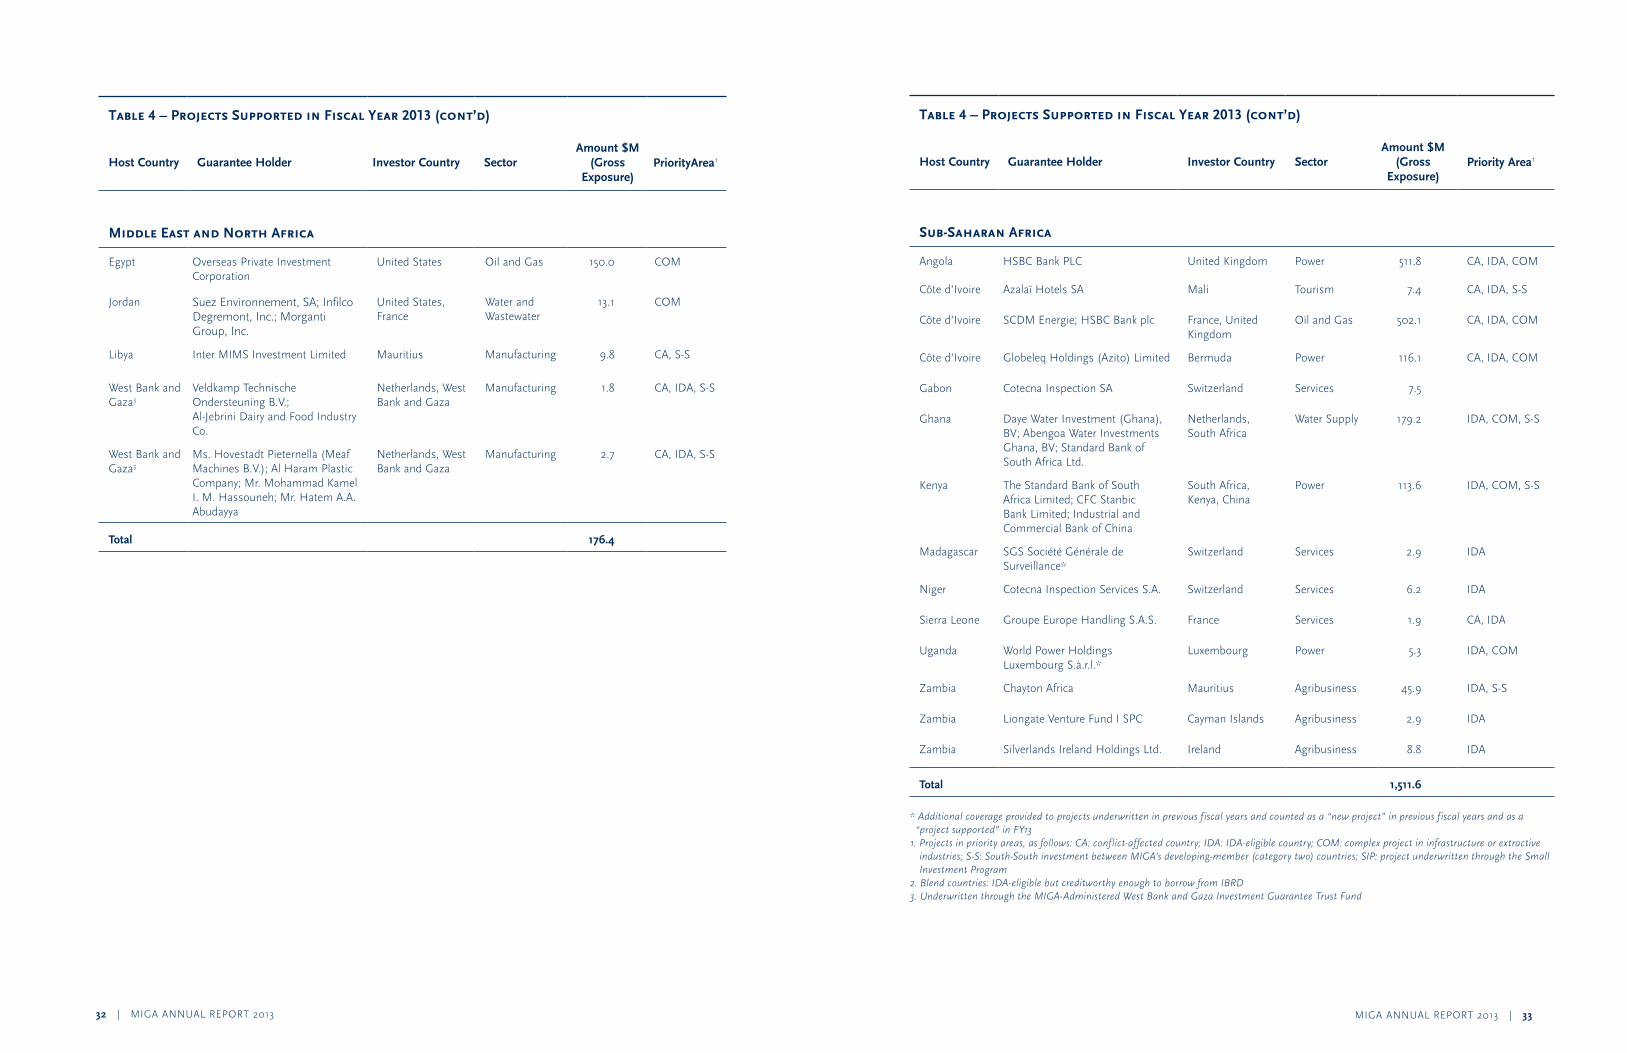
MIGA ANNUAL REPORT 2013 | 3332 | MIGA ANNUAL REPORT 2013
Table 4 – Projects Supported in Fiscal Year 2013 (cont’d)
Host Country Guarantee Holder Investor Country SectorAmount $M
(Gross Exposure)
Priority Area1
Sub-Saharan Africa
Angola HSBC Bank PLC United Kingdom Power 511.8 CA, IDA, COM
Côte d’Ivoire Azalaï Hotels SA Mali Tourism 7.4 CA, IDA, S-S
Côte d’Ivoire SCDM Energie; HSBC Bank plc France, United Kingdom
Oil and Gas 502.1 CA, IDA, COM
Côte d’Ivoire Globeleq Holdings (Azito) Limited Bermuda Power 116.1 CA, IDA, COM
Gabon Cotecna Inspection SA Switzerland Services 7.5
Ghana Daye Water Investment (Ghana), BV; Abengoa Water Investments Ghana, BV; Standard Bank of South Africa Ltd.
Netherlands, South Africa
Water Supply 179.2 IDA, COM, S-S
Kenya The Standard Bank of South Africa Limited; CFC Stanbic Bank Limited; Industrial and Commercial Bank of China
South Africa, Kenya, China
Power 113.6 IDA, COM, S-S
Madagascar SGS Société Générale de Surveillance*
Switzerland Services 2.9 IDA
Niger Cotecna Inspection Services S.A. Switzerland Services 6.2 IDA
Sierra Leone Groupe Europe Handling S.A.S. France Services 1.9 CA, IDA
Uganda World Power Holdings Luxembourg S.à.r.l.*
Luxembourg Power 5.3 IDA, COM
Zambia Chayton Africa Mauritius Agribusiness 45.9 IDA, S-S
Zambia Liongate Venture Fund I SPC Cayman Islands Agribusiness 2.9 IDA
Zambia Silverlands Ireland Holdings Ltd. Ireland Agribusiness 8.8 IDA
Total 1,511.6
*Additionalcoverageprovidedtoprojectsunderwritteninpreviousfiscalyearsandcountedasa“newproject”inpreviousfiscalyearsandasa“projectsupported”inFY13
1.Projectsinpriorityareas,asfollows:CA:conflict-affectedcountry;IDA:IDA-eligiblecountry;COM:complexprojectininfrastructureorextractiveindustries;S-S:South-SouthinvestmentbetweenMIGA’sdeveloping-member(categorytwo)countries;SIP:projectunderwrittenthroughtheSmallInvestmentProgram
2.Blendcountries:IDA-eligiblebutcreditworthyenoughtoborrowfromIBRD3.UnderwrittenthroughtheMIGA-AdministeredWestBankandGazaInvestmentGuaranteeTrustFund
Table 4 – Projects Supported in Fiscal Year 2013 (cont’d)
Host Country Guarantee Holder Investor Country SectorAmount $M
(Gross Exposure)
PriorityArea1
Middle East and North Africa
Egypt Overseas Private Investment Corporation
United States Oil and Gas 150.0 COM
Jordan Suez Environnement, SA; Infilco Degremont, Inc.; Morganti Group, Inc.
United States, France
Water and Wastewater
13.1 COM
Libya Inter MIMS Investment Limited Mauritius Manufacturing 9.8 CA, S-S
West Bank and Gaza3
Veldkamp Technische Ondersteuning B.V.;Al-Jebrini Dairy and Food Industry Co.
Netherlands, West Bank and Gaza
Manufacturing 1.8 CA, IDA, S-S
West Bank and Gaza3
Ms. Hovestadt Pieternella (Meaf Machines B.V.); Al Haram Plastic Company; Mr. Mohammad Kamel I. M. Hassouneh; Mr. Hatem A.A. Abudayya
Netherlands, West Bank and Gaza
Manufacturing 2.7 CA, IDA, S-S
Total 176.4
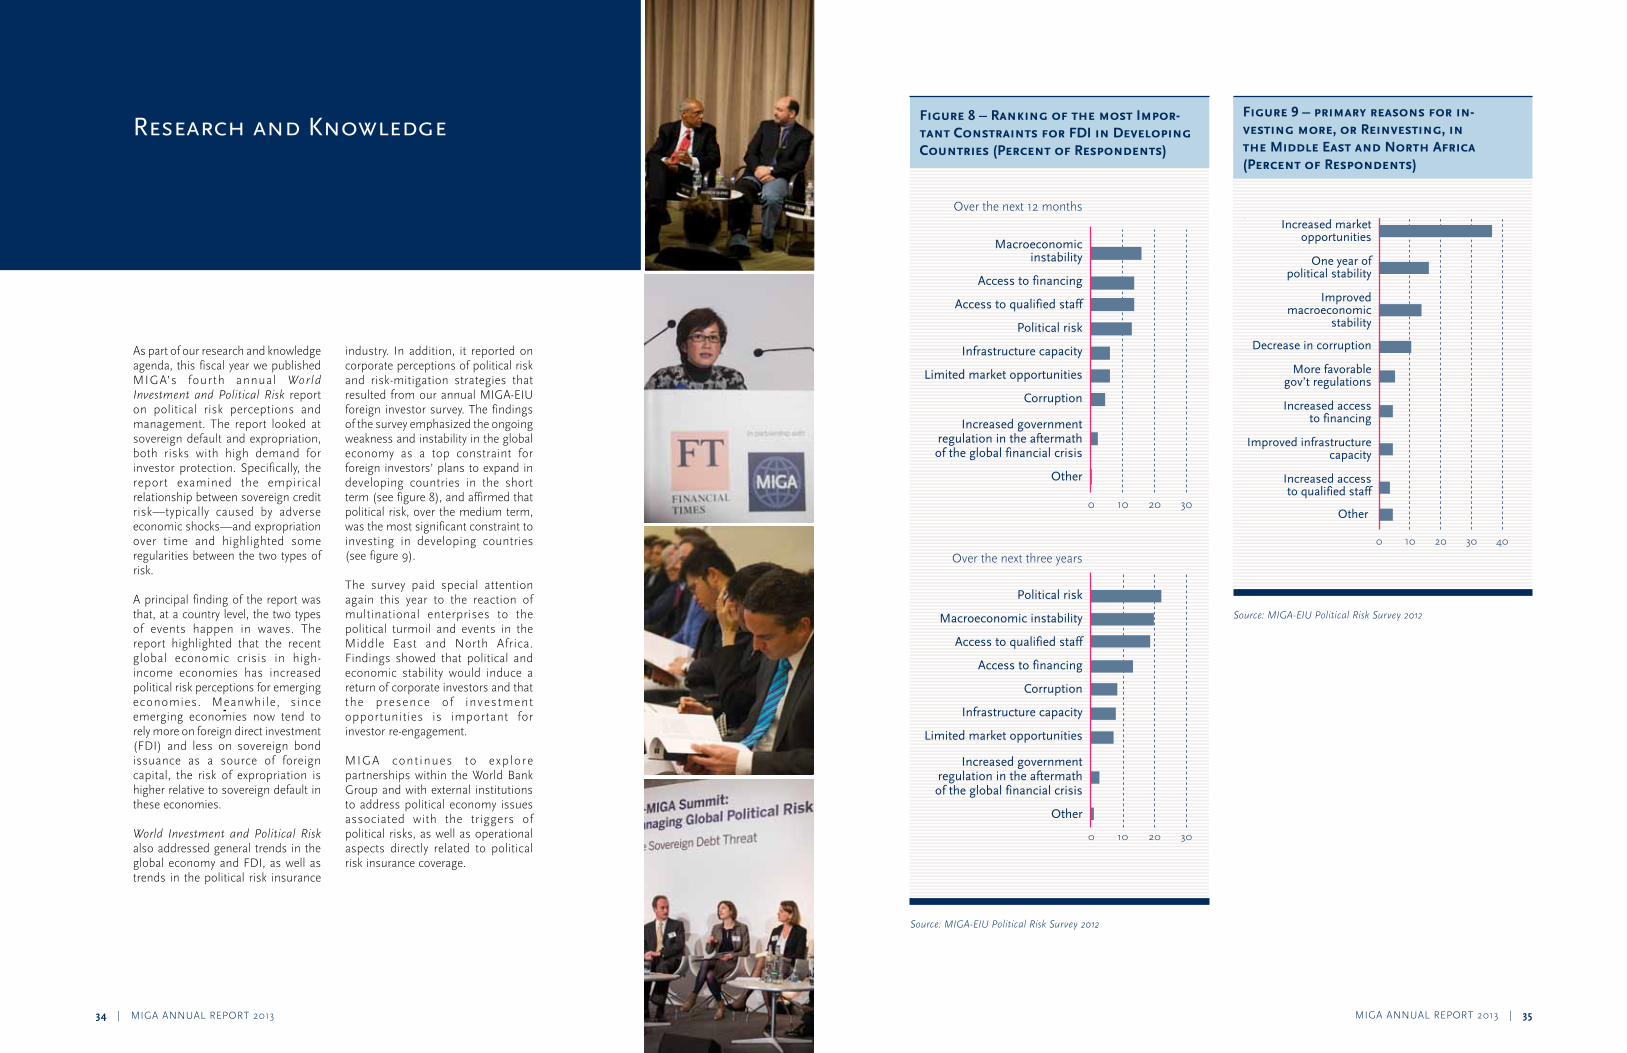
MIGA ANNUAL REPORT 2013 | 3534 | MIGA ANNUAL REPORT 2013
research and KnowledgeFigure 8 – Ranking of the most Impor-tant Constraints for FDI in Developing Countries (Percent of Respondents)
Source:MIGA-EIUPoliticalRiskSurvey2012
Figure 9 – primary reasons for in-vesting more, or Reinvesting, in the Middle East and North Africa (Percent of Respondents)
Source:MIGA-EIUPoliticalRiskSurvey2012
AR chapter box colors
0 10 20 30 40
Increased marketopportunities
One year ofpolitical stability
Improvedmacroeconomic
stability
Decrease in corruption
More favorablegov’t regulations
Increased accessto financing
Improved infrastructurecapacity
Increased accessto qualified staff
Other
Over the next 12 months
Macroeconomicinstability
Access to financing
Access to qualified staff
Political risk
Infrastructure capacity
Limited market opportunities
Corruption
Increased governmentregulation in the aftermath
of the global financial crisis
Other
0 10 20 30
Over the next three years
Political risk
Macroeconomic instability
Access to qualified staff
Access to financing
Corruption
Infrastructure capacity
Limited market opportunities
Increased governmentregulation in the aftermathof the global financial crisis
Other
0 10 20 30
AustriaUnited Kingdom
FranceUnited States
GermanySouth AfricaLuxembourg
FinlandSwitzerland
GreeceSingapore
United Arab EmiratesCanada
MauritiusKorea, Republic of
SpainCayman Islands
SloveniaBermuda
SenegalEgypt, Arab Republic of
CyprusNetherlands
SwedenJapan
Others
Others: Nigeria, Poland, China, Thailand, Norway, Ecuador, Tanzania, Turkey, Romania, Kenya, Ireland, Belgium, Mali, India, Lebanon, Tunisia, Italy, St. Kitts and Nevis, Denmark, Panama, Virgin Islands (British), Colombia
* Numbers may not add to 100 percent due to guarantee holders domiciled in two different countries
23.912.510.09.27.35.34.12.82.62.32.32.11.61.51.41.31.11.00.90.70.70.70.70.70.72.7
2013
2012
2011
2010
2009
Eearned premium
Fig 2
Fig 4
Fig 6
Fig 5
Fig 1 fin
Figure 8
Figure 9 Figure 7Figure 1
33.6
36.9
13.9
24.1
36.9
Premium and fee incomeInvestment income
46% Infrastructure
23% Oil, gas, and mining
17% Financial
14% Agribusiness, manufacturing, and services
59% Infrastructure
22% Oil, gas, and mining
10% Agribusiness, manufacturing, and services
9% Financial
54% Sub-Saharan Africa
19% Europe and Central Asia
18% Asia and the Pacific
6% Middle East and North Africa*
3% Latin America and the Caribbean
31% Money Market/Cash
19% Mortgage-backed Securities
17% Domestic Government
16% Global Equities
10% Agency
4% Asset-backed Securities
3% Sovereign/Govt Guarantee
47% Sub-Saharan Africa
20% Europe and Central Asia
13% Asia and the Pacific
10% Middle East and North Africa*
10% Latin America and the Caribbean
41% Europe and Central Asia26% Sub-Saharan Africa
15% Asia and the Pacific
10% Latin America and the Caribbean
8% Middle East and North Africa
66.3
61.7
50.8
46.0
43.6
Fig 3
03 04 05 06 07 08 09 10 11 12 13
gross exposure
net exposure
12
10
8
6
4
2
0AR chapter box colors
0 10 20 30 40
Increased marketopportunities
One year ofpolitical stability
Improvedmacroeconomic
stability
Decrease in corruption
More favorablegov’t regulations
Increased accessto financing
Improved infrastructurecapacity
Increased accessto qualified staff
Other
Over the next 12 months
Macroeconomicinstability
Access to financing
Access to qualified staff
Political risk
Infrastructure capacity
Limited market opportunities
Corruption
Increased governmentregulation in the aftermath
of the global financial crisis
Other
0 10 20 30
Over the next three years
Political risk
Macroeconomic instability
Access to qualified staff
Access to financing
Corruption
Infrastructure capacity
Limited market opportunities
Increased governmentregulation in the aftermathof the global financial crisis
Other
0 10 20 30
AustriaUnited Kingdom
FranceUnited States
GermanySouth AfricaLuxembourg
FinlandSwitzerland
GreeceSingapore
United Arab EmiratesCanada
MauritiusKorea, Republic of
SpainCayman Islands
SloveniaBermuda
SenegalEgypt, Arab Republic of
CyprusNetherlands
SwedenJapan
Others
Others: Nigeria, Poland, China, Thailand, Norway, Ecuador, Tanzania, Turkey, Romania, Kenya, Ireland, Belgium, Mali, India, Lebanon, Tunisia, Italy, St. Kitts and Nevis, Denmark, Panama, Virgin Islands (British), Colombia
* Numbers may not add to 100 percent due to guarantee holders domiciled in two different countries
23.912.510.09.27.35.34.12.82.62.32.32.11.61.51.41.31.11.00.90.70.70.70.70.70.72.7
2013
2012
2011
2010
2009
Eearned premium
Fig 2
Fig 4
Fig 6
Fig 5
Fig 1 fin
Figure 8
Figure 9 Figure 7Figure 1
33.6
36.9
13.9
24.1
36.9
Premium and fee incomeInvestment income
46% Infrastructure
23% Oil, gas, and mining
17% Financial
14% Agribusiness, manufacturing, and services
59% Infrastructure
22% Oil, gas, and mining
10% Agribusiness, manufacturing, and services
9% Financial
54% Sub-Saharan Africa
19% Europe and Central Asia
18% Asia and the Pacific
6% Middle East and North Africa*
3% Latin America and the Caribbean
31% Money Market/Cash
19% Mortgage-backed Securities
17% Domestic Government
16% Global Equities
10% Agency
4% Asset-backed Securities
3% Sovereign/Govt Guarantee
47% Sub-Saharan Africa
20% Europe and Central Asia
13% Asia and the Pacific
10% Middle East and North Africa*
10% Latin America and the Caribbean
41% Europe and Central Asia26% Sub-Saharan Africa
15% Asia and the Pacific
10% Latin America and the Caribbean
8% Middle East and North Africa
66.3
61.7
50.8
46.0
43.6
Fig 3
03 04 05 06 07 08 09 10 11 12 13
gross exposure
net exposure
12
10
8
6
4
2
0
As part of our research and knowledge agenda, this fiscal year we published MIGA’s fourth annual WorldInvestmentandPoliticalRisk report on political risk perceptions and management. The report looked at sovereign default and expropriation, both risks with high demand for investor protection. Specifically, the report examined the empirical relationship between sovereign credit risk—typically caused by adverse economic shocks—and expropriation over time and highlighted some regularities between the two types of risk.
A principal finding of the report was that, at a country level, the two types of events happen in waves. The report highlighted that the recent global economic crisis in high-income economies has increased political risk perceptions for emerging economies. Meanwhile, since emerging economies now tend to rely more on foreign direct investment (FDI) and less on sovereign bond issuance as a source of foreign capital, the risk of expropriation is higher relative to sovereign default in these economies.
World Investment and Political Risk also addressed general trends in the global economy and FDI, as well as trends in the political risk insurance
industry. In addition, it reported on corporate perceptions of political risk and risk-mitigation strategies that resulted from our annual MIGA-EIU foreign investor survey. The findings of the survey emphasized the ongoing weakness and instability in the global economy as a top constraint for foreign investors’ plans to expand in developing countries in the short term (see figure 8), and affirmed that political risk, over the medium term, was the most significant constraint to investing in developing countries (see figure 9).
The survey paid special attention again this year to the reaction of multinational enterprises to the political turmoil and events in the Middle East and North Africa. Findings showed that political and economic stability would induce a return of corporate investors and that the presence of investment opportunities is important for investor re-engagement.
MIGA cont inues to explore partnerships within the World Bank Group and with external institutions to address political economy issues associated with the triggers of political risks, as well as operational aspects directly related to political risk insurance coverage.
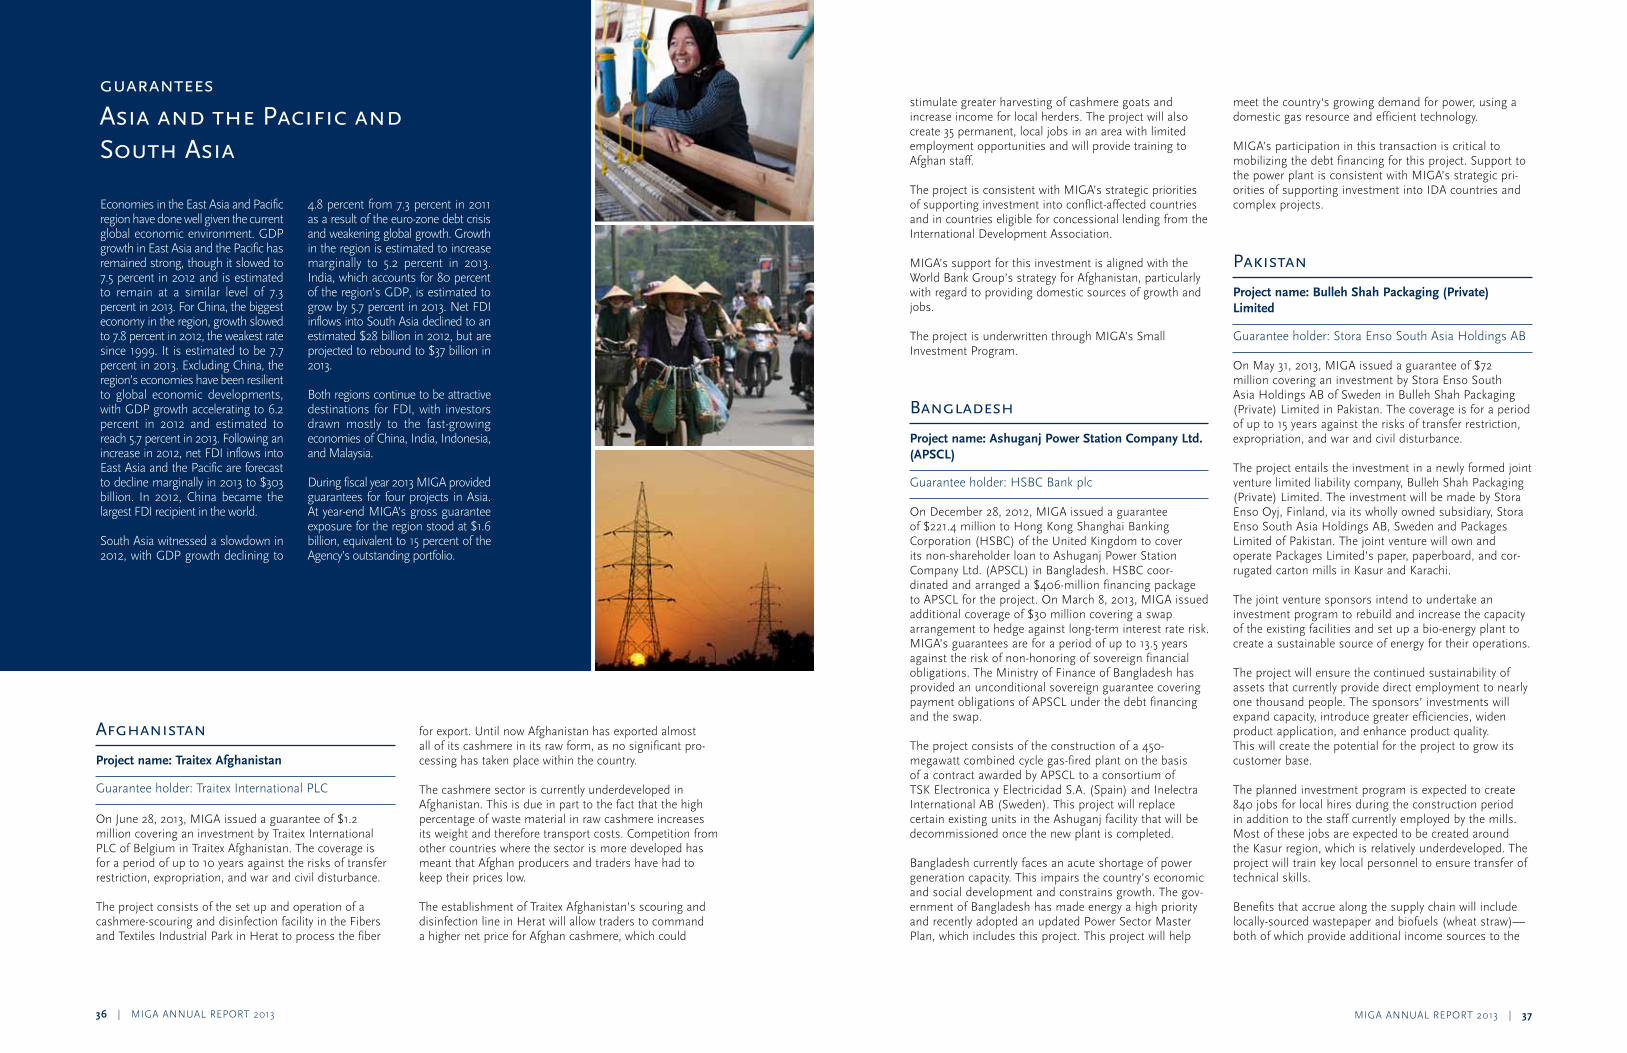
MIGA ANNUAL REPORT 2013 | 3736 | MIGA ANNUAL REPORT 2013
Afghanistan
Project name: Traitex Afghanistan
Guarantee holder: Traitex International PLC
On June 28, 2013, MIGA issued a guarantee of $1.2 million covering an investment by Traitex International PLC of Belgium in Traitex Afghanistan. The coverage is for a period of up to 10 years against the risks of transfer restriction, expropriation, and war and civil disturbance.
The project consists of the set up and operation of a cashmere-scouring and disinfection facility in the Fibers and Textiles Industrial Park in Herat to process the fiber
for export. Until now Afghanistan has exported almost all of its cashmere in its raw form, as no significant pro-cessing has taken place within the country.
The cashmere sector is currently underdeveloped in Afghanistan. This is due in part to the fact that the high percentage of waste material in raw cashmere increases its weight and therefore transport costs. Competition from other countries where the sector is more developed has meant that Afghan producers and traders have had to keep their prices low.
The establishment of Traitex Afghanistan’s scouring and disinfection line in Herat will allow traders to command a higher net price for Afghan cashmere, which could
stimulate greater harvesting of cashmere goats and increase income for local herders. The project will also create 35 permanent, local jobs in an area with limited employment opportunities and will provide training to Afghan staff.
The project is consistent with MIGA’s strategic priorities of supporting investment into conflict-affected countries and in countries eligible for concessional lending from the International Development Association.
MIGA’s support for this investment is aligned with the World Bank Group’s strategy for Afghanistan, particularly with regard to providing domestic sources of growth and jobs.
The project is underwritten through MIGA’s Small Investment Program.
Bangladesh
Project name: Ashuganj Power Station Company Ltd. (APSCL)
Guarantee holder: HSBC Bank plc
On December 28, 2012, MIGA issued a guarantee of $221.4 million to Hong Kong Shanghai Banking Corporation (HSBC) of the United Kingdom to cover its non-shareholder loan to Ashuganj Power Station Company Ltd. (APSCL) in Bangladesh. HSBC coor-dinated and arranged a $406-million financing package to APSCL for the project. On March 8, 2013, MIGA issued additional coverage of $30 million covering a swap arrangement to hedge against long-term interest rate risk. MIGA’s guarantees are for a period of up to 13.5 years against the risk of non-honoring of sovereign financial obligations. The Ministry of Finance of Bangladesh has provided an unconditional sovereign guarantee covering payment obligations of APSCL under the debt financing and the swap.
The project consists of the construction of a 450-megawatt combined cycle gas-fired plant on the basis of a contract awarded by APSCL to a consortium of TSK Electronica y Electricidad S.A. (Spain) and Inelectra International AB (Sweden). This project will replace certain existing units in the Ashuganj facility that will be decommissioned once the new plant is completed.
Bangladesh currently faces an acute shortage of power generation capacity. This impairs the country’s economic and social development and constrains growth. The gov-ernment of Bangladesh has made energy a high priority and recently adopted an updated Power Sector Master Plan, which includes this project. This project will help
meet the country‘s growing demand for power, using a domestic gas resource and efficient technology.
MIGA’s participation in this transaction is critical to mobilizing the debt financing for this project. Support to the power plant is consistent with MIGA’s strategic pri-orities of supporting investment into IDA countries and complex projects.
pakistan
Project name: Bulleh Shah Packaging (Private) Limited
Guarantee holder: Stora Enso South Asia Holdings AB
On May 31, 2013, MIGA issued a guarantee of $72 million covering an investment by Stora Enso South Asia Holdings AB of Sweden in Bulleh Shah Packaging (Private) Limited in Pakistan. The coverage is for a period of up to 15 years against the risks of transfer restriction, expropriation, and war and civil disturbance.
The project entails the investment in a newly formed joint venture limited liability company, Bulleh Shah Packaging (Private) Limited. The investment will be made by Stora Enso Oyj, Finland, via its wholly owned subsidiary, Stora Enso South Asia Holdings AB, Sweden and Packages Limited of Pakistan. The joint venture will own and operate Packages Limited’s paper, paperboard, and cor-rugated carton mills in Kasur and Karachi.
The joint venture sponsors intend to undertake an investment program to rebuild and increase the capacity of the existing facilities and set up a bio-energy plant to create a sustainable source of energy for their operations.
The project will ensure the continued sustainability of assets that currently provide direct employment to nearly one thousand people. The sponsors’ investments will expand capacity, introduce greater efficiencies, widen product application, and enhance product quality. This will create the potential for the project to grow its customer base.
The planned investment program is expected to create 840 jobs for local hires during the construction period in addition to the staff currently employed by the mills. Most of these jobs are expected to be created around the Kasur region, which is relatively underdeveloped. The project will train key local personnel to ensure transfer of technical skills.
Benefits that accrue along the supply chain will include locally-sourced wastepaper and biofuels (wheat straw)—both of which provide additional income sources to the
guarantees
Asia and the pacific and south Asia
Economies in the East Asia and Pacific region have done well given the current global economic environment. GDP growth in East Asia and the Pacific has remained strong, though it slowed to 7.5 percent in 2012 and is estimated to remain at a similar level of 7.3 percent in 2013. For China, the biggest economy in the region, growth slowed to 7.8 percent in 2012, the weakest rate since 1999. It is estimated to be 7.7 percent in 2013. Excluding China, the region’s economies have been resilient to global economic developments, with GDP growth accelerating to 6.2 percent in 2012 and estimated to reach 5.7 percent in 2013. Following an increase in 2012, net FDI inflows into East Asia and the Pacific are forecast to decline marginally in 2013 to $303 billion. In 2012, China became the largest FDI recipient in the world.
South Asia witnessed a slowdown in 2012, with GDP growth declining to
4.8 percent from 7.3 percent in 2011 as a result of the euro-zone debt crisis and weakening global growth. Growth in the region is estimated to increase marginally to 5.2 percent in 2013. India, which accounts for 80 percent of the region’s GDP, is estimated to grow by 5.7 percent in 2013. Net FDI inflows into South Asia declined to an estimated $28 billion in 2012, but are projected to rebound to $37 billion in 2013.
Both regions continue to be attractive destinations for FDI, with investors drawn mostly to the fast-growing economies of China, India, Indonesia, and Malaysia.
During fiscal year 2013 MIGA provided guarantees for four projects in Asia. At year-end MIGA’s gross guarantee exposure for the region stood at $1.6 billion, equivalent to 15 percent of the Agency’s outstanding portfolio.
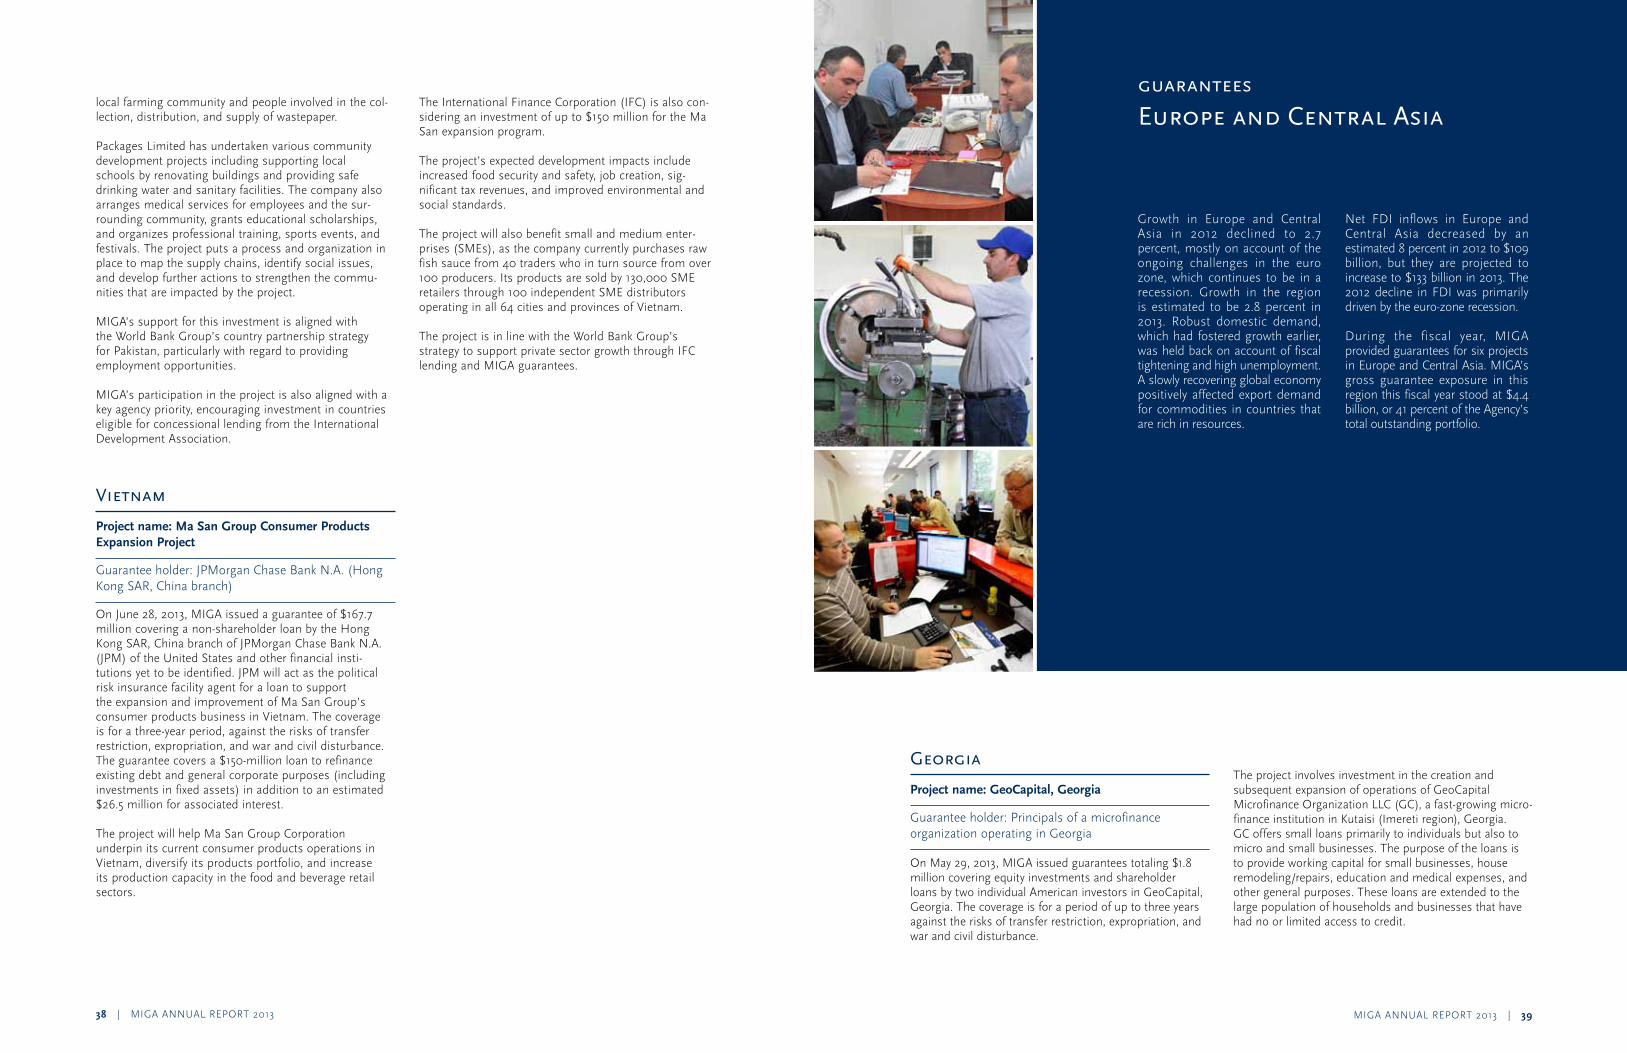
MIGA ANNUAL REPORT 2013 | 3938 | MIGA ANNUAL REPORT 2013
local farming community and people involved in the col-lection, distribution, and supply of wastepaper.
Packages Limited has undertaken various community development projects including supporting local schools by renovating buildings and providing safe drinking water and sanitary facilities. The company also arranges medical services for employees and the sur-rounding community, grants educational scholarships, and organizes professional training, sports events, and festivals. The project puts a process and organization in place to map the supply chains, identify social issues, and develop further actions to strengthen the commu-nities that are impacted by the project.
MIGA’s support for this investment is aligned with the World Bank Group’s country partnership strategy for Pakistan, particularly with regard to providing employment opportunities.
MIGA’s participation in the project is also aligned with a key agency priority, encouraging investment in countries eligible for concessional lending from the International Development Association.
vietnam
Project name: Ma San Group Consumer Products Expansion Project
Guarantee holder: JPMorgan Chase Bank N.A. (Hong Kong SAR, China branch)
On June 28, 2013, MIGA issued a guarantee of $167.7 million covering a non-shareholder loan by the Hong Kong SAR, China branch of JPMorgan Chase Bank N.A. (JPM) of the United States and other financial insti-tutions yet to be identified. JPM will act as the political risk insurance facility agent for a loan to support the expansion and improvement of Ma San Group’s consumer products business in Vietnam. The coverage is for a three-year period, against the risks of transfer restriction, expropriation, and war and civil disturbance. The guarantee covers a $150-million loan to refinance existing debt and general corporate purposes (including investments in fixed assets) in addition to an estimated $26.5 million for associated interest.
The project will help Ma San Group Corporation underpin its current consumer products operations in Vietnam, diversify its products portfolio, and increase its production capacity in the food and beverage retail sectors.
The International Finance Corporation (IFC) is also con-sidering an investment of up to $150 million for the Ma San expansion program.
The project’s expected development impacts include increased food security and safety, job creation, sig-nificant tax revenues, and improved environmental and social standards.
The project will also benefit small and medium enter-prises (SMEs), as the company currently purchases raw fish sauce from 40 traders who in turn source from over 100 producers. Its products are sold by 130,000 SME retailers through 100 independent SME distributors operating in all 64 cities and provinces of Vietnam.
The project is in line with the World Bank Group’s strategy to support private sector growth through IFC lending and MIGA guarantees.
georgia
Project name: GeoCapital, Georgia
Guarantee holder: Principals of a microfinance organization operating in Georgia
On May 29, 2013, MIGA issued guarantees totaling $1.8 million covering equity investments and shareholder loans by two individual American investors in GeoCapital, Georgia. The coverage is for a period of up to three years against the risks of transfer restriction, expropriation, and war and civil disturbance.
The project involves investment in the creation and subsequent expansion of operations of GeoCapital Microfinance Organization LLC (GC), a fast-growing micro-finance institution in Kutaisi (Imereti region), Georgia. GC offers small loans primarily to individuals but also to micro and small businesses. The purpose of the loans is to provide working capital for small businesses, house remodeling/repairs, education and medical expenses, and other general purposes. These loans are extended to the large population of households and businesses that have had no or limited access to credit.
Growth in Europe and Central Asia in 2012 declined to 2.7 percent, mostly on account of the ongoing challenges in the euro zone, which continues to be in a recession. Growth in the region is estimated to be 2.8 percent in 2013. Robust domestic demand, which had fostered growth earlier, was held back on account of fiscal tightening and high unemployment. A slowly recovering global economy positively affected export demand for commodities in countries that are rich in resources.
Net FDI inflows in Europe and Central Asia decreased by an estimated 8 percent in 2012 to $109 billion, but they are projected to increase to $133 billion in 2013. The 2012 decline in FDI was primarily driven by the euro-zone recession.
During the fiscal year, MIGA provided guarantees for six projects in Europe and Central Asia. MIGA’s gross guarantee exposure in this region this fiscal year stood at $4.4 billion, or 41 percent of the Agency’s total outstanding portfolio.
guarantees
europe and Central Asia
MIGA ANNUAL REPORT 2013 | 4140 | MIGA ANNUAL REPORT 2013
In Georgia, access to finance is one of the main con-straints for both companies and individuals. GC is helping a part of the “unbankable” population gain access to credit and loans for purposes ranging from home equity loans to medical, educational, and income-generation loans. As a large portion of these loans are extended to individuals, they enhance Georgians’ capacity to pay for social services.
GC’s loans carry a lower interest rate than other micro-finance institutions operating in the country. This compe-tition has resulted in other institutions’ reductions in their rates by an annual average of 20 percent—to the benefit of low-income consumers.
Since its establishment in 2011, GC has opened three branches and employs 30 people. The company has plans to open 17 new branches within the next three years.
The World Bank Group Country Partnership Strategy for Georgia recognizes that credit constraints are severe in the country, and the project addresses this concern. MIGA’s support for this investment is also aligned with the Agency’s strategy of supporting investments into countries eligible for concessional lending from the International Development Association.
The project is underwritten through MIGA’s Small Investment Program.
moldova
Project name: I.C.S. Raiffeisen Leasing S.R.L.
Guarantee holder: Raiffeisen Bank S.A.
On November 9, 2012, MIGA issued a guarantee totaling €4.75 million ($6.0 million) covering a shareholder loan by Raiffeisen Bank S.A. of Romania to I.C.S. Raiffeisen Leasing S.R.L in Moldova (RLMD). The coverage is for a period of up to five years against the risks of war and civil disturbance, transfer restriction, and expropriation.
Raiffeisen Bank S.A.’s shareholder loan of €5.0 million is aimed at enhancing the capacity of I.C.S. Raiffeisen Leasing S.R.L. to provide operating leases for motor vehicles, machinery, and equipment in the Moldovan market. MIGA has provided earlier support for RLMD’s start up and expansion.
This project is expected to contribute to further devel-opment of the financial sector in Moldova by widening financing sources, particularly to segments of the economy that are currently underserved. Moldova’s credit pen-etration is low compared to other countries in the region. It is also aligned with the World Bank Group’s Country Partnership Strategy for Moldova that emphasizes the need to enhance competitiveness of the country’s
enterprise sector, encourage more investment activity, and promote the expansion of small and medium enterprises.
The project underscores MIGA’s strategy of promoting investments into countries eligible for concessional lending from the International Development Association and South-South investments.
The project is underwritten through MIGA’s Small Investment Program.
serbia
Project name: Erste Bank a.d. Novi Sad
Guarantee holder: Erste Group Bank AG
On May 24, 2013, MIGA issued guarantees totaling $73.9 million covering loan guarantees by Erste Group Bank AG of Austria (Erste) issued in support of funding raised by its Serbian subsidiary Erste Bank a.d. Novi Sad (Erste Serbia). The coverage is for a period of up to 15 years against the risks of transfer restriction, expropriation, and war and civil disturbance.
The project involves the expansion of lending by Erste Serbia, targeting primarily micro, small, and medium enterprises (MSMEs) and other priority segments in the Serbian market. The project is financed by a €60 million funding package, consisting of two loans: €50 million from the European Investment Bank and €10 million from KfW. These loans are supported by two loan guarantees from Erste, which will be covered by MIGA.
The package is expected to improve access to finance at favorable conditions for projects undertaken by MSMEs and for projects in several priority areas in the Serbian economy, contributing to economic growth and job creation.
Erste Serbia will earmark a minimum of €40 million for projects promoted by MSMEs as well as mid-cap enterprises. In addition, up to €20 million will be slated for investments in areas that are key for the country’s economic and social development and fundamental to strengthening its competitiveness as Serbia prepares for European Union accession. These areas are knowledge economy/innovation capacity; environmental protection and sustainability; energy efficiency and renewable energy; health; and education.
The financial conditions applied to most on-lending will reflect the financial advantage of this funding package, making the loans more affordable. Supporting productive businesses through the extension of affordable credit will stimulate growth, generate employment, and reduce poverty in the country. In addition, the project demon-
strates Erste Serbia’s ability to find alternate sources of funding in a credit-constrained environment.
MIGA’s coverage to Erste is consistent with the goals of the second Joint IFI Action Plan for Europe and Central Asia, through which MIGA seeks to support banks active in the region. The project also contributes to the World Bank Group’s strategy of encouraging private sector devel-opment in the country.
serbia
Project name: Eurobank AD Beograd – Central Bank Mandatory Reserves Coverage
Guarantee holder: Eurobank Ergasias S.A.
On March 1, 2013, MIGA issued a guarantee totaling €190.0 million ($247.4 million) covering an investment by Eurobank Ergasias S.A. (Eurobank) of Greece in its Serbian subsidiary, Eurobank AD Beograd. The coverage is for a period of three years against the risk of expropriation of funds for mandatory reserves held by the subsidiary in the central bank of its jurisdiction.
Eurobank is a universal banking group with a significant network of retail banks across Central, Eastern, and Southeastern Europe. The group’s subsidiary banks are required to maintain mandatory reserves at the central banks of their respective jurisdictions, generally based on the volume of customer deposits that these subsid-iaries hold. The banks are thereby exposed to the risk of expropriation of funds by the respective central bank. This exposure leads to higher risk weights on these assets at the consolidated level, resulting in increased capital allo-cation for country risk exposure. At the consolidated group level, the risk weighting determines the amount of equity required to maintain a specified capital adequacy ratio (CAR) in accordance with Greek banking law.
MIGA’s guarantee will help Eurobank obtain capital relief from the CAR requirements. By obtaining MIGA’s insurance against the risk of expropriation of funds, the risk weighting for mandatory reserves held at the central bank can be reduced. This will free up equity tied up for country risk purposes, which can be deployed to support its subsidiary’s franchise in Serbia. Eurobank Beograd’s role in supporting productive businesses, including small and medium enterprises, through credit extension helps stimulate growth, employment generation, and—ulti-mately—poverty reduction in Serbia.
As a participant of the European Bank Coordination Initiative (also known as the Vienna initiative), Eurobank pledged to support its Serbian subsidiary, keeping it well capitalized. Eurobank’s continuing support for its sys-
temically important subsidiary contributed to supporting the Serbian economy in the aftermath of the financial crisis. Capital adequacy well in excess of the regulatory requirement provides Eurobank Beograd in Serbia with a cushion to withstand potential shocks and helps position the bank for future growth.
MIGA’s coverage to Eurobank is consistent with the goals of the crisis response initiative for the ECA region launched by the World Bank Group in January 2012. As part of the initiative, MIGA seeks to support capital-constrained banks active in the region. The project is also aligned with the World Bank Group’s strategy for Serbia as it seeks to address the spillover from the financial crisis.
turkey
Project name: Izmir Marine Transportation Project
Guarantee holder: ING Bank, a Branch of ING-DiBa AG
On June 27, 2013, MIGA issued guarantees of $65.5 million covering non-shareholder loans by ING Bank, a branch of ING-DiBa AG (ING) of Germany, to the Metropolitan Municipality of Izmir (MMI) for the Izmir Marine Transportation Project in Turkey. The coverage is for a period of up to 10 years against the risk of non-honoring of sovereign financial obligations. The ING loan will finance up to six ferries in support of the project.
This project is part of a larger effort to acquire ferries and renovate wharves in the Metropolitan Municipality of Izmir (MMI). The World Bank’s International Finance Corporation (IFC) acted as the loan arranger for this project. Other lenders include the European Bank of Reconstruction and Development (EBRD) and Agence Française de Développement (AFD).
The current ferries in service in Izmir have reached the end of their operating lives and therefore have high main-tenance costs and outdated technology. The new ferries will be significantly faster, more fuel efficient, environ-mentally friendlier, and safer. As a result, ferry boat service will increase the share of sea transportation in Izmir’s integrated public transportation system, easing road traffic congestion and pollution, as well as enhancing public safety and security.
The project is aligned with the World Bank Group’s Country Partnership Strategy for Turkey. Improving trans-portation infrastructure is a key component of the Bank Group’s focus on helping Turkey improve its competi-tiveness and employment opportunities.
MIGA’s support for this investment is also aligned with the Agency’s strategy of supporting complex projects.
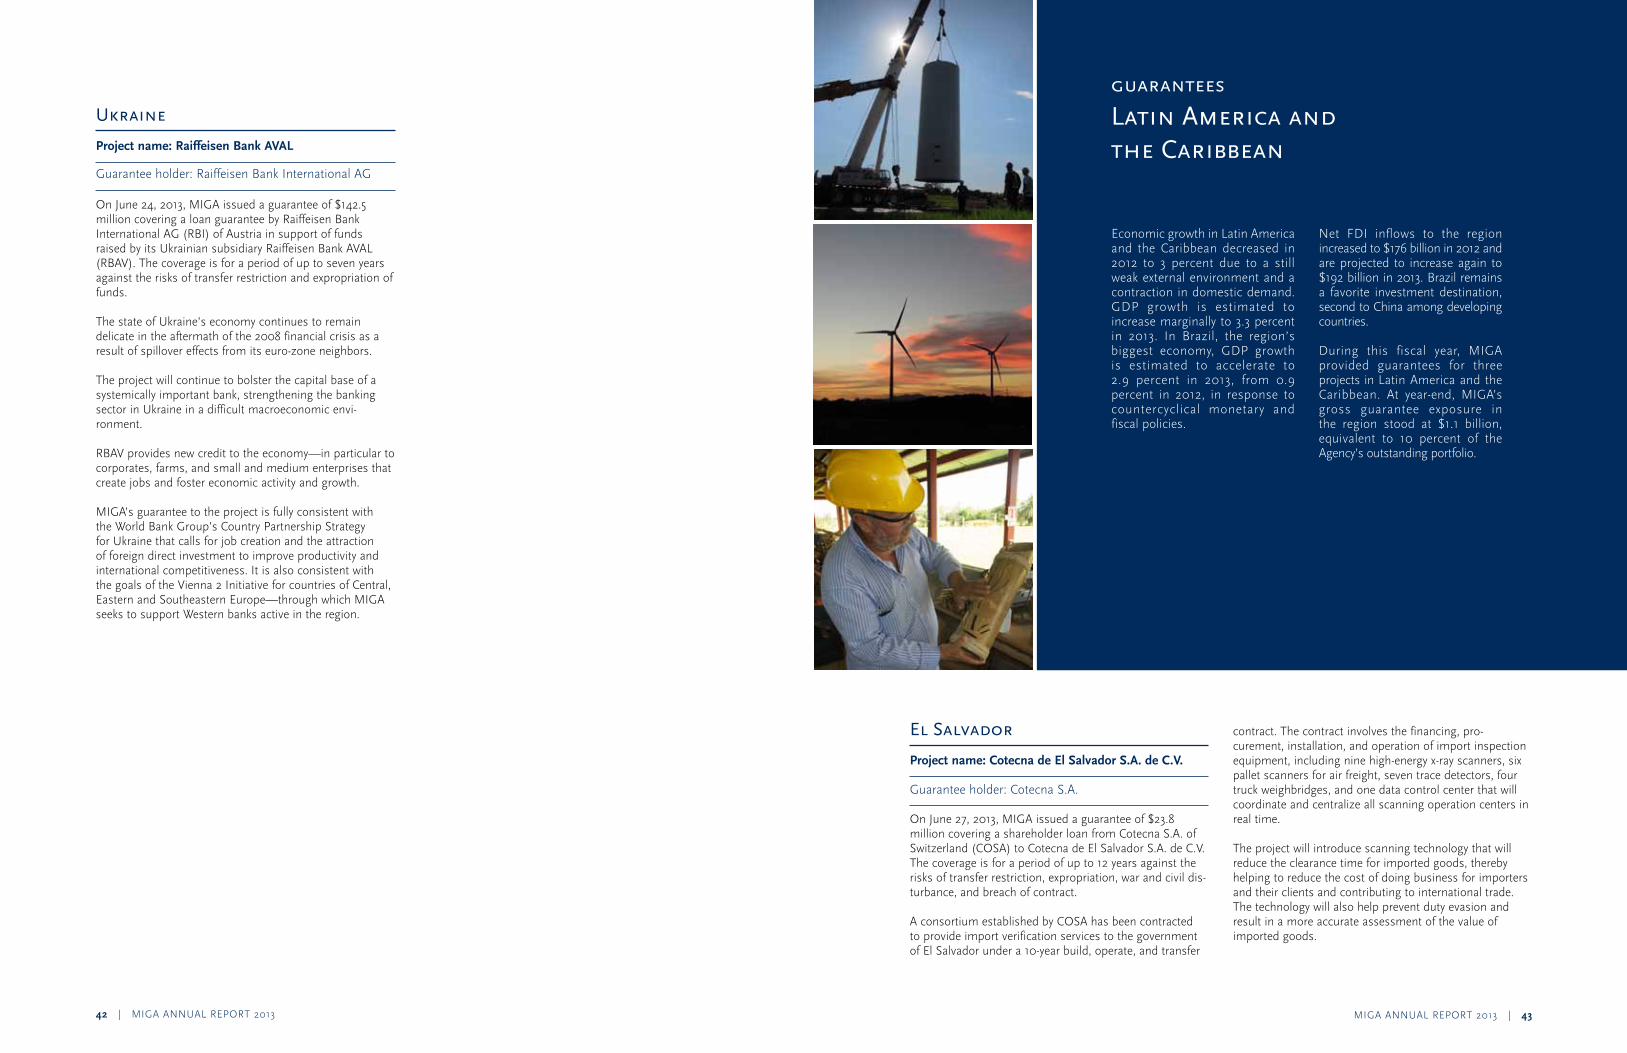
MIGA ANNUAL REPORT 2013 | 4342 | MIGA ANNUAL REPORT 2013
ukraine
Project name: Raiffeisen Bank AVAL
Guarantee holder: Raiffeisen Bank International AG
On June 24, 2013, MIGA issued a guarantee of $142.5 million covering a loan guarantee by Raiffeisen Bank International AG (RBI) of Austria in support of funds raised by its Ukrainian subsidiary Raiffeisen Bank AVAL (RBAV). The coverage is for a period of up to seven years against the risks of transfer restriction and expropriation of funds.
The state of Ukraine’s economy continues to remain delicate in the aftermath of the 2008 financial crisis as a result of spillover effects from its euro-zone neighbors.
The project will continue to bolster the capital base of a systemically important bank, strengthening the banking sector in Ukraine in a difficult macroeconomic envi-ronment.
RBAV provides new credit to the economy—in particular to corporates, farms, and small and medium enterprises that create jobs and foster economic activity and growth.
MIGA’s guarantee to the project is fully consistent with the World Bank Group’s Country Partnership Strategy for Ukraine that calls for job creation and the attraction of foreign direct investment to improve productivity and international competitiveness. It is also consistent with the goals of the Vienna 2 Initiative for countries of Central, Eastern and Southeastern Europe—through which MIGA seeks to support Western banks active in the region.
el salvador
Project name: Cotecna de El Salvador S.A. de C.V.
Guarantee holder: Cotecna S.A.
On June 27, 2013, MIGA issued a guarantee of $23.8 million covering a shareholder loan from Cotecna S.A. of Switzerland (COSA) to Cotecna de El Salvador S.A. de C.V. The coverage is for a period of up to 12 years against the risks of transfer restriction, expropriation, war and civil dis-turbance, and breach of contract.
A consortium established by COSA has been contracted to provide import verification services to the government of El Salvador under a 10-year build, operate, and transfer
contract. The contract involves the financing, pro-curement, installation, and operation of import inspection equipment, including nine high-energy x-ray scanners, six pallet scanners for air freight, seven trace detectors, four truck weighbridges, and one data control center that will coordinate and centralize all scanning operation centers in real time.
The project will introduce scanning technology that will reduce the clearance time for imported goods, thereby helping to reduce the cost of doing business for importers and their clients and contributing to international trade. The technology will also help prevent duty evasion and result in a more accurate assessment of the value of imported goods.
guarantees
Latin America and the Caribbean
Economic growth in Latin America and the Caribbean decreased in 2012 to 3 percent due to a still weak external environment and a contraction in domestic demand. GDP growth is estimated to increase marginally to 3.3 percent in 2013. In Brazil, the region’s biggest economy, GDP growth is estimated to accelerate to 2.9 percent in 2013, from 0.9 percent in 2012, in response to countercyclical monetary and fiscal policies.
Net FDI inflows to the region increased to $176 billion in 2012 and are projected to increase again to $192 billion in 2013. Brazil remains a favorite investment destination, second to China among developing countries.
During this fiscal year, MIGA provided guarantees for three projects in Latin America and the Caribbean. At year-end, MIGA’s gross guarantee exposure in the region stood at $1.1 billion, equivalent to 10 percent of the Agency’s outstanding portfolio.
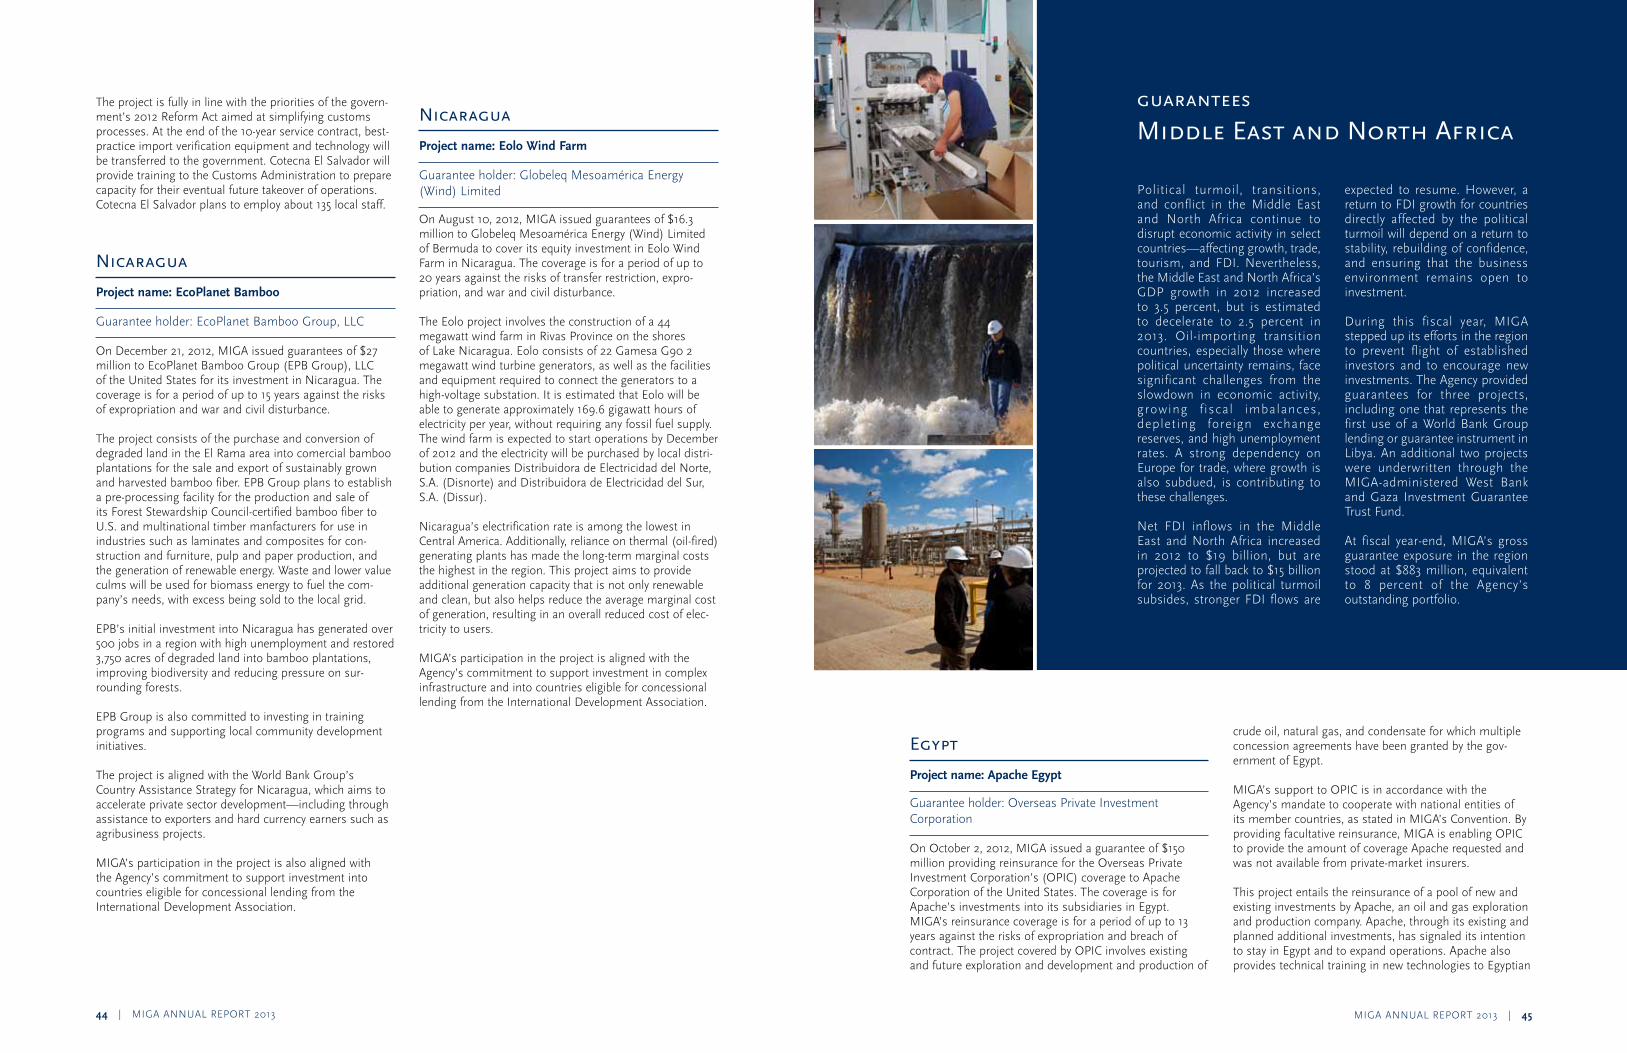
MIGA ANNUAL REPORT 2013 | 4544 | MIGA ANNUAL REPORT 2013
The project is fully in line with the priorities of the govern-ment’s 2012 Reform Act aimed at simplifying customs processes. At the end of the 10-year service contract, best-practice import verification equipment and technology will be transferred to the government. Cotecna El Salvador will provide training to the Customs Administration to prepare capacity for their eventual future takeover of operations. Cotecna El Salvador plans to employ about 135 local staff.
nicaragua
Project name: EcoPlanet Bamboo
Guarantee holder: EcoPlanet Bamboo Group, LLC
On December 21, 2012, MIGA issued guarantees of $27 million to EcoPlanet Bamboo Group (EPB Group), LLC of the United States for its investment in Nicaragua. The coverage is for a period of up to 15 years against the risks of expropriation and war and civil disturbance.
The project consists of the purchase and conversion of degraded land in the El Rama area into comercial bamboo plantations for the sale and export of sustainably grown and harvested bamboo fiber. EPB Group plans to establish a pre-processing facility for the production and sale of its Forest Stewardship Council-certified bamboo fiber to U.S. and multinational timber manfacturers for use in industries such as laminates and composites for con-struction and furniture, pulp and paper production, and the generation of renewable energy. Waste and lower value culms will be used for biomass energy to fuel the com-pany’s needs, with excess being sold to the local grid.
EPB’s initial investment into Nicaragua has generated over 500 jobs in a region with high unemployment and restored 3,750 acres of degraded land into bamboo plantations, improving biodiversity and reducing pressure on sur-rounding forests.
EPB Group is also committed to investing in training programs and supporting local community development initiatives.
The project is aligned with the World Bank Group’s Country Assistance Strategy for Nicaragua, which aims to accelerate private sector development—including through assistance to exporters and hard currency earners such as agribusiness projects.
MIGA’s participation in the project is also aligned with the Agency’s commitment to support investment into countries eligible for concessional lending from the International Development Association.
nicaragua
Project name: Eolo Wind Farm
Guarantee holder: Globeleq Mesoamérica Energy (Wind) Limited
On August 10, 2012, MIGA issued guarantees of $16.3 million to Globeleq Mesoamérica Energy (Wind) Limited of Bermuda to cover its equity investment in Eolo Wind Farm in Nicaragua. The coverage is for a period of up to 20 years against the risks of transfer restriction, expro-priation, and war and civil disturbance.
The Eolo project involves the construction of a 44 megawatt wind farm in Rivas Province on the shores of Lake Nicaragua. Eolo consists of 22 Gamesa G90 2 megawatt wind turbine generators, as well as the facilities and equipment required to connect the generators to a high-voltage substation. It is estimated that Eolo will be able to generate approximately 169.6 gigawatt hours of electricity per year, without requiring any fossil fuel supply. The wind farm is expected to start operations by December of 2012 and the electricity will be purchased by local distri-bution companies Distribuidora de Electricidad del Norte, S.A. (Disnorte) and Distribuidora de Electricidad del Sur, S.A. (Dissur).
Nicaragua’s electrification rate is among the lowest in Central America. Additionally, reliance on thermal (oil-fired) generating plants has made the long-term marginal costs the highest in the region. This project aims to provide additional generation capacity that is not only renewable and clean, but also helps reduce the average marginal cost of generation, resulting in an overall reduced cost of elec-tricity to users.
MIGA’s participation in the project is aligned with the Agency’s commitment to support investment in complex infrastructure and into countries eligible for concessional lending from the International Development Association.
egypt
Project name: Apache Egypt
Guarantee holder: Overseas Private Investment Corporation
On October 2, 2012, MIGA issued a guarantee of $150 million providing reinsurance for the Overseas Private Investment Corporation’s (OPIC) coverage to Apache Corporation of the United States. The coverage is for Apache’s investments into its subsidiaries in Egypt. MIGA’s reinsurance coverage is for a period of up to 13 years against the risks of expropriation and breach of contract. The project covered by OPIC involves existing and future exploration and development and production of
crude oil, natural gas, and condensate for which multiple concession agreements have been granted by the gov-ernment of Egypt.
MIGA’s support to OPIC is in accordance with the Agency’s mandate to cooperate with national entities of its member countries, as stated in MIGA’s Convention. By providing facultative reinsurance, MIGA is enabling OPIC to provide the amount of coverage Apache requested and was not available from private-market insurers.
This project entails the reinsurance of a pool of new and existing investments by Apache, an oil and gas exploration and production company. Apache, through its existing and planned additional investments, has signaled its intention to stay in Egypt and to expand operations. Apache also provides technical training in new technologies to Egyptian
guarantees
middle east and north Africa
Political turmoil, transitions, and conflict in the Middle East and North Africa continue to disrupt economic activity in select countries—affecting growth, trade, tourism, and FDI. Nevertheless, the Middle East and North Africa’s GDP growth in 2012 increased to 3.5 percent, but is estimated to decelerate to 2.5 percent in 2013. Oil-importing transition countries, especially those where political uncertainty remains, face significant challenges from the slowdown in economic activity, growing f iscal imbalances, depleting foreign exchange reserves, and high unemployment rates. A strong dependency on Europe for trade, where growth is also subdued, is contributing to these challenges.
Net FDI inflows in the Middle East and North Africa increased in 2012 to $19 billion, but are projected to fall back to $15 billion for 2013. As the political turmoil subsides, stronger FDI flows are
expected to resume. However, a return to FDI growth for countries directly affected by the political turmoil will depend on a return to stability, rebuilding of confidence, and ensuring that the business environment remains open to investment.
During this fiscal year, MIGA stepped up its efforts in the region to prevent flight of established investors and to encourage new investments. The Agency provided guarantees for three projects, including one that represents the first use of a World Bank Group lending or guarantee instrument in Libya. An additional two projects were underwritten through the MIGA-administered West Bank and Gaza Investment Guarantee Trust Fund.
At fiscal year-end, MIGA’s gross guarantee exposure in the region stood at $883 million, equivalent to 8 percent of the Agency’s outstanding portfolio.
MIGA ANNUAL REPORT 2013 | 4746 | MIGA ANNUAL REPORT 2013
nationals working in the joint ventures, contributes to the modernization and efficiency of the oil and gas production sector, and is playing a critical role in helping Egypt’s supply of energy products keep up with domestic demand. By supporting these investments, MIGA is underscoring its support for companies investing in Egypt during a time of transition.
The project is also consistent with MIGA’s efforts to mobilize $1 billion in insurance capacity to support foreign direct investment into the Middle East and North Africa.
Jordan
Project name: AS Samra Wastewater Treatment Project
Guarantee holders: Suez Environnement, SA; Infilco Degremont, Inc.; Morganti Group, Inc.
On June 27, 2013, MIGA issued guarantees of $13.1 million covering equity investments (including future retained earnings and performance bond) by Suez Environnement, SA (Suez), Infilco Degremont, Inc. (IDI), and Morganti Group Inc. (Morganti) in the AS Samra Wastewater Treatment Project in Jordan. The coverage is for a period of up to 20 years against the risk of breach of contract.
The project involves the expansion of the existing wastewater treatment plant at AS-Samra, northeast of Amman, by Samra Wastewater Treatment Plant Company, Ltd. on an extended 25-year build-operate-transfer (BOT) basis. The total investment for the expansion is estimated at $205.3 million. The project will increase the wastewater treatment capacity by some 37 percent, from the current 267,000 m³ per day to 365,000 m³ per day, to meet the needs of the population from 2015 to 2025. The expansion will include the addition of two more treatment lines to the existing four treatment lines. The sludge treatment capacity will also be increased by approximately 80 percent. Construction of the expansion is scheduled for completion by the end of June 2015.
Jordan is one of the water-poorest countries in the world. The best use of its very limited water resources, including renewable water resources, is a top priority for the gov-ernment. Wastewater used for irrigation or discharged into rivers and other water bodies has caused major envi-ronmental and health concerns. The existing AS Samra Wastewater Treatment Project built in 2008 has played a critical role in wastewater treatment. However, given its limited capacity, the plant can only meet the demand of the population through 2015.
The project will have a strong development impact by increasing wastewater treatment capacity and sludge treatment capacity; introducing additional investment; improving the local environment; promoting re-use of treated wastewater to meet increasing water demand;
generating employment; transferring skills and technology; contributing to government revenues; and increasing demand for local goods and services.
The project is aligned with the World Bank Group’s Country Partnership Strategy for Jordan, which calls for promotion of private sector development. This project is also aligned with MIGA’s strategic priority of supporting investments in complex infrastructure projects and with the Agency’s efforts to mobilize $1 billion in insurance capacity to support foreign direct investment into the Middle East and North Africa.
Libya
Project name: Jafara Co. for Food Production
Guarantee holder: Inter MIMS Investment Limited
On September 28, 2012, MIGA issued a guarantee of $9.8 million to Inter MIMS Investment Limited of Mauritius for its shareholder loan to Jafara Group Limited in Libya. The coverage is for a period of up to 10 years against the risks of transfer restriction, expropriation, and war and civil disturbance.
Jafara is a company involved in the production, bottling, and distribution of drinking water and juice products in Libya. The company is now the fourth largest manufacturer of juices in the Libyan market and has established two Tetra Pak juice lines, a polyethylene terephthalate (PET) mineral water production line, and canned fruit juices/sodas. Inter MIMS is a wholly-owned subsidiary of the MIMS group of Bosnia and Herzegovina. The company’s shareholder loan will support the expansion of Jafara’s production capacity. Planned improvements include the construction of an additional warehouse, the purchase of equipment for glass bottling, and a new air conditioning system for the factory.
The project’s key development impacts include the addition of new permanent jobs (158 staff employed by the project in total), taxes paid to the government after the expiration of the tax holiday, and significant local sourcing. Inputs sourced in the local market include sugar, pre-forms, caps, cartons, stretch folio, pallets, and glue. The company estimates that it spends €6.5 million yearly on the purchase of local goods and services. In addition, Jafara provides free water and juice to local hospitals and schools.
This project will also have an important catalyzing effect for foreign direct investment into Libya. Investment into the country dropped dramatically as the 2011 civil war unfolded and is only now at the very early stages of recovery. MIGA’s guarantee will help signal that Libya is a viable investment destination, despite the ongoing chal-lenges the country is facing.
In this regard, the project is consistent with MIGA’s strategic priorities of supporting investment into conflict-affected countries and South-South investments, as well as the Agency’s commitment to the Middle East and North Africa given recent events in the region.
The project was underwritten through MIGA’s Small Investment Program.
West Bank and gaza
Project name: Al Haram Modern Plastic Products Industry Company
Guarantee holders: Ms. Hovestadt Pieternella (Meaf Machines B.V.); Al Haram Plastic Company; Mr. Mohammad Kamel I. M. Hassouneh; Mr. Hatem A.A. Abudayya
The MIGA-administered West Bank and Gaza Investment Guarantee Trust Fund has issued a guarantee of €1.35 million (approximately $1.7 million) covering an equity investment by Ms. Hovestadt Pieternella (Meaf Machines B.V.) of the Netherlands and Al Haram Plastic Company, Mr. Mohammad Kamel I. M. Hassouneh, and Mr. Hatem A.A. Abudayya of the West Bank and Gaza in Al Haram Modern Plastic Products Industry Company. The coverage is for a period of up to three years against the risks of transfer restriction, expropriation, and war and civil dis-turbance.
The project involves the establishment of a greenfield company in the Tarqumiya Industrial Zone that will produce and supply plastic cups and containers in various sizes for local dairy products. The company will use a new technology, “extrusion and thermoforming,” to produce high-quality plastic dairy packaging.
There is a flourishing dairy industry in the West Bank, but Palestinian dairy companies have to import plastic packaging materials from Turkey, Israel, and Europe as there are currently no local companies able to produce high-quality plastic cups for dairy products. A study con-ducted by one of the investors estimates that the annual volume of imports is over 53 million plastic cups with a value of about $2.7 million. This adds significantly to the dairy industry’s production costs.
This project is supported by the PSI Plus program of the Netherlands Ministry of Foreign Affairs with a grant to cover up to 60 percent of the project cost and an addi-tional amount to cover the MIGA political risk insurance premium for the first three years.
The project will create approximately 30 local jobs and transfer skills and modern technologies for plastic pro-duction. It will also strengthen the dairy industry by reducing the need for costly imported packaging materials.
This project is aligned with MIGA’s objective of facilitating investments in conflict-affected environments as well as entities eligible for assistance from the International Development Association.
The project was underwritten through MIGA’s Small Investment Program.
West Bank and gaza
Project name: Al Jebrini Cheese Industry
Guarantee holders: Veldkamp Technische Ondersteuning B.V.; Al-Jebrini Dairy and Food Industry Co.
The MIGA-administered West Bank and Gaza Investment Guarantee Trust Fund has issued two guarantees totalling €1.35 million (approximately $1.7 million) covering an investment by Veldkamp Technische Ondersteuning B.V. of the Netherlands and Al-Jebrini Dairy and Food Industries of the West Bank and Gaza in Al Jebrini Cheese Industry in the West Bank. The coverage is for a period of up to 10 years against the risks of transfer restriction, expropriation, and war and civil disturbance.
The project involves the establishment of a greenfield company, Al Jebrini Cheese Industry, in the West Bank by Veldkamp Technische Ondersteuning B.V. of the Netherlands and Al Jebrini Dairy and Food Industries, a local investor in the West Bank. The company will produce and supply high-quality dairy products, including cheese and cream cheese.
This project is supported by the PSI Plus program of the Netherlands Ministry of Foreign Affairs with a grant to cover up to 60 percent of the project cost and an addi-tional amount to cover the MIGA political risk insurance premium for the first three years.
The project is expected to have a positive impact on the local economy by expanding the dairy sector and creating approximately 50 local jobs. It will also bring technical know-how to the local food-processing industry. There are currently no companies in the West Bank that can produce processed cheese products due to lack of technological knowledge, lack of required quality and hygiene standards, and high investment costs. The project will produce healthy processed cheese products by using state-of-the-art technologies and ensuring high quality and hygiene standards, and sell these products on the domestic market at lower prices than imported processed cheese products.
This project is aligned with MIGA’s objective of facilitating investments in conflict-affected environments as well as entities eligible for assistance from the International Development Association.
The project was underwritten through MIGA’s Small Investment Program.
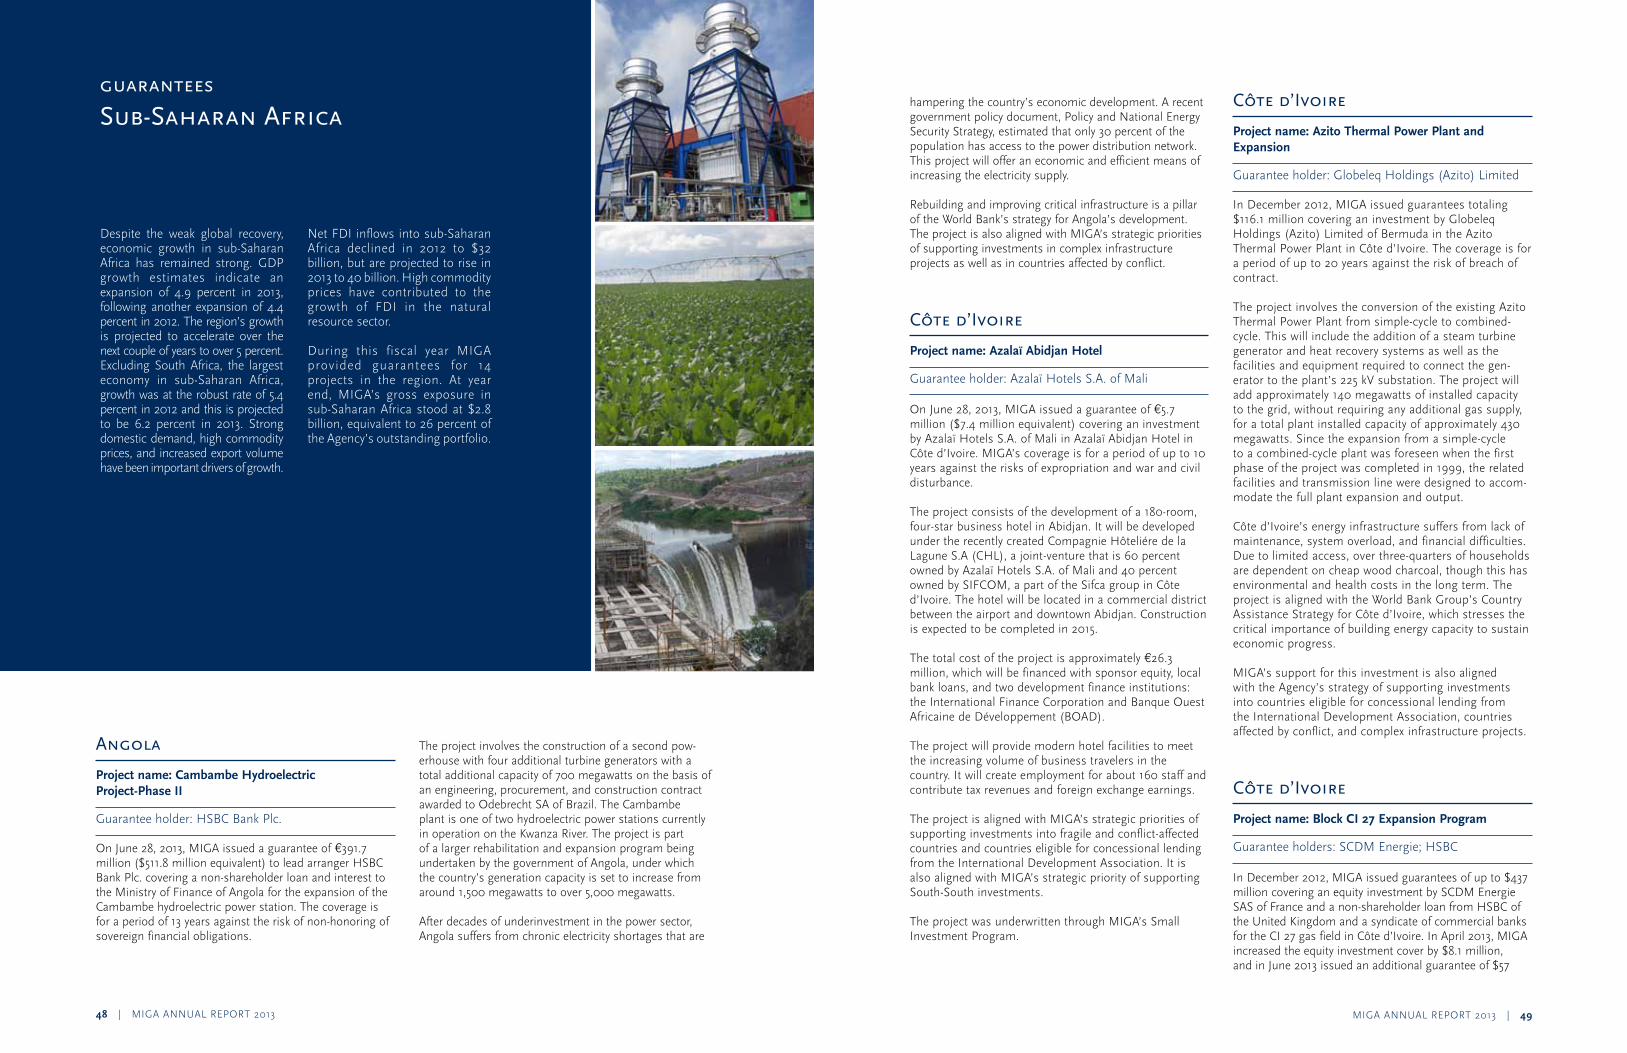
MIGA ANNUAL REPORT 2013 | 4948 | MIGA ANNUAL REPORT 2013
Angola
Project name: Cambambe Hydroelectric Project-Phase II
Guarantee holder: HSBC Bank Plc.
On June 28, 2013, MIGA issued a guarantee of €391.7 million ($511.8 million equivalent) to lead arranger HSBC Bank Plc. covering a non-shareholder loan and interest to the Ministry of Finance of Angola for the expansion of the Cambambe hydroelectric power station. The coverage is for a period of 13 years against the risk of non-honoring of sovereign financial obligations.
The project involves the construction of a second pow-erhouse with four additional turbine generators with a total additional capacity of 700 megawatts on the basis of an engineering, procurement, and construction contract awarded to Odebrecht SA of Brazil. The Cambambe plant is one of two hydroelectric power stations currently in operation on the Kwanza River. The project is part of a larger rehabilitation and expansion program being undertaken by the government of Angola, under which the country’s generation capacity is set to increase from around 1,500 megawatts to over 5,000 megawatts.
After decades of underinvestment in the power sector, Angola suffers from chronic electricity shortages that are
hampering the country’s economic development. A recent government policy document, Policy and National Energy Security Strategy, estimated that only 30 percent of the population has access to the power distribution network. This project will offer an economic and efficient means of increasing the electricity supply.
Rebuilding and improving critical infrastructure is a pillar of the World Bank’s strategy for Angola’s development. The project is also aligned with MIGA’s strategic priorities of supporting investments in complex infrastructure projects as well as in countries affected by conflict.
Côte d’Ivoire
Project name: Azalaï Abidjan Hotel
Guarantee holder: Azalaï Hotels S.A. of Mali
On June 28, 2013, MIGA issued a guarantee of €5.7 million ($7.4 million equivalent) covering an investment by Azalaï Hotels S.A. of Mali in Azalaï Abidjan Hotel in Côte d’Ivoire. MIGA’s coverage is for a period of up to 10 years against the risks of expropriation and war and civil disturbance.
The project consists of the development of a 180-room, four-star business hotel in Abidjan. It will be developed under the recently created Compagnie Hôteliére de la Lagune S.A (CHL), a joint-venture that is 60 percent owned by Azalaï Hotels S.A. of Mali and 40 percent owned by SIFCOM, a part of the Sifca group in Côte d’Ivoire. The hotel will be located in a commercial district between the airport and downtown Abidjan. Construction is expected to be completed in 2015.
The total cost of the project is approximately €26.3 million, which will be financed with sponsor equity, local bank loans, and two development finance institutions: the International Finance Corporation and Banque Ouest Africaine de Développement (BOAD).
The project will provide modern hotel facilities to meet the increasing volume of business travelers in the country. It will create employment for about 160 staff and contribute tax revenues and foreign exchange earnings.
The project is aligned with MIGA’s strategic priorities of supporting investments into fragile and conflict-affected countries and countries eligible for concessional lending from the International Development Association. It is also aligned with MIGA’s strategic priority of supporting South-South investments.
The project was underwritten through MIGA’s Small Investment Program.
Côte d’Ivoire
Project name: Azito Thermal Power Plant and Expansion
Guarantee holder: Globeleq Holdings (Azito) Limited
In December 2012, MIGA issued guarantees totaling $116.1 million covering an investment by Globeleq Holdings (Azito) Limited of Bermuda in the Azito Thermal Power Plant in Côte d’Ivoire. The coverage is for a period of up to 20 years against the risk of breach of contract.
The project involves the conversion of the existing Azito Thermal Power Plant from simple-cycle to combined-cycle. This will include the addition of a steam turbine generator and heat recovery systems as well as the facilities and equipment required to connect the gen-erator to the plant’s 225 kV substation. The project will add approximately 140 megawatts of installed capacity to the grid, without requiring any additional gas supply, for a total plant installed capacity of approximately 430 megawatts. Since the expansion from a simple-cycle to a combined-cycle plant was foreseen when the first phase of the project was completed in 1999, the related facilities and transmission line were designed to accom-modate the full plant expansion and output.
Côte d’Ivoire’s energy infrastructure suffers from lack of maintenance, system overload, and financial difficulties. Due to limited access, over three-quarters of households are dependent on cheap wood charcoal, though this has environmental and health costs in the long term. The project is aligned with the World Bank Group’s Country Assistance Strategy for Côte d’Ivoire, which stresses the critical importance of building energy capacity to sustain economic progress.
MIGA’s support for this investment is also aligned with the Agency’s strategy of supporting investments into countries eligible for concessional lending from the International Development Association, countries affected by conflict, and complex infrastructure projects.
Côte d’Ivoire
Project name: Block CI 27 Expansion Program
Guarantee holders: SCDM Energie; HSBC
In December 2012, MIGA issued guarantees of up to $437 million covering an equity investment by SCDM Energie SAS of France and a non-shareholder loan from HSBC of the United Kingdom and a syndicate of commercial banks for the CI 27 gas field in Côte d’Ivoire. In April 2013, MIGA increased the equity investment cover by $8.1 million, and in June 2013 issued an additional guarantee of $57
guarantees
sub-saharan Africa
Despite the weak global recovery, economic growth in sub-Saharan Africa has remained strong. GDP growth estimates indicate an expansion of 4.9 percent in 2013, following another expansion of 4.4 percent in 2012. The region’s growth is projected to accelerate over the next couple of years to over 5 percent. Excluding South Africa, the largest economy in sub-Saharan Africa, growth was at the robust rate of 5.4 percent in 2012 and this is projected to be 6.2 percent in 2013. Strong domestic demand, high commodity prices, and increased export volume have been important drivers of growth.
Net FDI inflows into sub-Saharan Africa declined in 2012 to $32 billion, but are projected to rise in 2013 to 40 billion. High commodity prices have contributed to the growth of FDI in the natural resource sector.
During this fiscal year MIGA provided guarantees for 14 projects in the region. At year end, MIGA’s gross exposure in sub-Saharan Africa stood at $2.8 billion, equivalent to 26 percent of the Agency’s outstanding portfolio.
MIGA ANNUAL REPORT 2013 | 5150 | MIGA ANNUAL REPORT 2013
million covering SCDM’s shareholder loan to the project enterprise. The coverage is for a period of up to seven years against the risks of transfer restriction, expropriation, war and civil disturbance, and breach of contract.
The project consists of the construction and operation of Block CI 27 on/offshore oil and gas facilities including an existing production platform (Foxtrot), gas transportation and onshore facilities, and a greenfield platform (Marlin).
The Block CI 27 expansion project aims to meet the country’s growing energy demand. Côte d’Ivoire’s energy sector has suffered from a lack of investment during the last 10 years, as the country struggled with civil conflict. Now that the country’s situation is improving, a significant increase in energy investment is necessary to meet the population’s needs and support further development. Tapping Côte d’Ivoire’s gas resources will reduce the country’s energy costs and limit the use of foreign reserves for energy imports.
The project is aligned with the World Bank Group’s Country Assistance Strategy for Côte d’Ivoire, which stresses the critical importance of building energy capacity to sustain economic progress.
MIGA’s support for this investment is also aligned with the Agency’s strategy of supporting investments in countries eligible for concessional financing by the International Development Association, countries affected by conflict, and complex infrastructure projects.
gabon
Project name: Société de Scanning du Gabon S.A.
Guarantee holder: Cotecna Inspection S.A.
On June 27, 2013, MIGA issued guarantees of €5.8 million ($7.5 million equivalent) covering Cotecna Inspections S.A. of Switzerland (COINS)’ equity investment in, and shareholder loan to, Société de Scanning du Gabon S.A, a joint venture between COINS and the government of Gabon. The coverage is for a period of up to 10 years against the risks of transfer restriction, expropriation, war and civil disturbance, and breach of contract.
COINS has been contracted to provide inspection services to the government of Gabon under a six-year build, operate, and transfer contract. This contract involves the financing, procurement, installation, and operation of import inspection equipment, including two high-energy mobile x-ray scanners at the Ports of Libreville-Owendo and Gentil; maintenance and technical assistance to the operation; and training and transfer to the government at the end of the six-year contract.
The project is expected to contribute to trade facili-tation through a more efficient and rapid verification of imported goods, which replaces in most cases the tradi-tional physical inspection. It also will protect government revenues through the reduction of opportunities for fraud and fiscal evasion; strengthen security at the ports by ensuring that containerized goods are not illegal; create some 50 local jobs, and transfer technology at the end of the project.
The project is aligned with the World Bank Group’s Country Partnership Strategy for Gabon, which calls for improved governance and public sector capacity and increasing the country’s competitiveness and creating employment.
ghana
Project name: Seawater Desalination Project
Guarantee holders: Abengoa Water Investments Ghana, BV; Daye Water Investment (Ghana), BV; Standard Bank of South Africa Ltd.
On October 25, 2012, MIGA issued guarantees totaling $179.2 million covering an equity investment and a share-holder loan by Abengoa Water Investments Ghana, BV of the Netherlands; an equity investment and a share-holder loan by Daye Water Investment (Ghana), BV of the Netherlands; and a non-shareholder loan and an interest rate swap agreement by Standard Bank of South Africa for the Seawater Desalination Project in Ghana.
The coverage is against the risks of transfer restriction, expropriation, breach of contract, and war and civil disturbance. The tenors are 20 years for the equity investments, 14 years for the shareholder loans, and 12 years for the non-shareholder loans (including interest and swap).
The project involves the construction and operation of a seawater desalination plant in Accra by Befesa Desalination Developments Ghana Ltd, a joint venture company of Abengoa Water Investments Ghana, BV; Daye Water Investment (Ghana), BV; and their local partner Hydrocol Ltd. The plant will be built on a 25-year build-own-operate-transfer (BOOT) basis and is expected to supply 60,000 cubic meters of potable water per day to the residents and businesses in the project area.
Accra is one of the major cities in Ghana that is experi-encing rapid urbanization and population growth. Many residents in the city lack access to piped or safe water, and many old settlement areas and urban suburbs are facing water shortages. The project will provide potable water to up to 500,000 residents in the Teshie-Nungua catchment of Accra and help meet some of the immense
need resulting from rapid urbanization. It will also improve the security and quality of the water supply. The project will generate other development impacts, such as the intro-duction of seawater treatment technology and increased employment and government revenues.
The project supports MIGA’s strategy of promoting South-South investments, investment in complex infra-structure projects, and investments in countries eligible for assistance from the International Development Association.
Kenya
Project name: Triumph Power Generating Company Limited
Guarantee holders: Industrial and Commercial Bank of China, Standard Bank of South Africa, CfC Stanbic Bank
On June 27, 2013, MIGA issued guarantees of $102.5 million to Industrial and Commercial Bank of China and Standard Bank of South Africa covering their-non share-holder loans to Triumph Power Generating Company Limited in Kenya. MIGA also issued a guarantee of $11.1 million to CfC Stanbic Bank, a subsidiary of Standard Bank of South Africa, covering its swap arrangement with Triumph to hedge against long-term interest rate risk. The coverage to all guarantee holders is for a period of up to 12 years against the risk of breach of contract.
The project consists of the construction of an 83 megawatt heavy fuel oil plant on a build, own, and operate basis. The plant will be located at Kitengela, near the Athi River, approximately 25 kilometers from Nairobi. Triumph will enter into a 20-year power purchase agreement with Kenya Power and Lighting Company.
The World Bank’s Africa Infrastructure Country Diagnostic found that the lack of adequate, reliable elec-tricity supply is Kenya’s largest infrastructure challenge and a key constraint to economic growth (contributing to economic losses of an estimated 2 percent of GDP). The project will help Kenya achieve a more diversified energy mix and stability to its power generation. The country remains heavily dependent on hydropower, which is frequently negatively impacted by drought. Installed thermal capacity provides a less expensive alternative to investments in emergency diesel-fired plants.
The project is further supported by a partial risk guarantee from the World Bank’s International Development Association that backstops a letter of credit from JP Morgan Bank of London.
MIGA’s guarantees are aligned with the Agency’s strategy of supporting investments in countries eligible
for lending from the International Development Association, investments in complex projects, and South-South investments.
madagascar
Project name: Malagasy Community Network Services S.A. – GasyNet
Guarantee holder: SGS S.A.
On April 26, 2013, MIGA issued a guarantee of $2.9 million to SGS S.A. of Switzerland covering its loan guarantee to BNI-Madagascar for its loan to Malagasy Community Network Services S.A. – Gasynet in Madagascar. The coverage is for a period of up to 12 months against the risks of transfer restriction, expro-priation, war and civil disturbance, and breach of contract.
The project involves the provision of import and export good verification and the deployment of TradeNet software application to the government of Madagascar. The MIGA coverage is for an existing project approved by MIGA’s Board of Directors in October 2007.
MIGA’s continued support for the project will help to improve port governance and transparency of the country’s trade transactions. The project is also consistent with MIGA’s strategic priority of supporting investments into countries eligible for concessional financing from the International Development Association.
niger
Project name: Cotecna Inspection S.A., Niamey Liaison Office
Guarantee holder: Cotecna Inspection Services S.A.
On December 19, 2012 MIGA issued a guarantee of $6.2 million covering an investment by Cotecna Inspection Services S.A. (COINS) of Switzerland in Cotecna Inspection S.A., Niamey Liaison Office in Niger. The coverage is for a period of up to six years against the risks of transfer restriction, expropriation, war and civil dis-turbance, and breach of contract.
COINS will provide services to the government of Niger on a build-operate-transfer basis in return for a monthly operating and management service fee. These services include pre-shipment inspection and document verifi-cation at origin; the provision, installation, operation, and maintenance of three high-energy scanners at three sites (Niamey Route, Niamey Rive Droite, and Maradi); goods verification, inspection, and valuation; training and logistic assistance to the government for the modernization of
MIGA ANNUAL REPORT 2013 | 5352 | MIGA ANNUAL REPORT 2013
national customs with the objective of enhancing bud-getary revenues and security; and the eventual transfer of the scanners to the government.
The project will introduce greater transparency and effi-ciency into Niger’s import verification processes. The transparent audit trail provided by scanning data will also help the government secure revenues through the elimination of opportunities for fraud and fiscal evasion. Security at points of entry will also be enhanced by ensuring that containerized goods are not illegal. In addition, the proposed project will facilitate trade through more efficient and rapid verification of imported goods.
COINS will provide training and build capacity for the government’s future takeover of operations and improve public resource management. The operations will sustain 136 local jobs.
The World Bank Group’s areas of focus in Niger include increasing transparency and governance as well as improving cross-border trade. This project supports both these objectives. It is also aligned with MIGA’s strategic priority of supporting investments into countries eligible for concessional lending from the International Development Association. This is the first guarantee MIGA has issued for an investment in Niger since the country became a MIGA member in 2012.
sierra Leone
Project name: Sky Handling Partner Sierra Leone Limited
Guarantee holder: Groupe Europe Handling S.A.S.
On December 6, 2012, MIGA issued a guarantee of €1.43 million ($1.9 million) covering a shareholder loan from Groupe Europe Handling S.A.S. of France to Sky Handling Partner Sierra Leone Limited. The coverage is for a period of up to 10 years against the risks of transfer restriction, expropriation, and war and civil disturbance.
The project involves modernization and expansion of the current cargo-handling services in the Freetown-Lungi International Airport (FNA) by Sky Handling Partner Sierra Leone Limited. The new cargo terminal is being built to international standards and will accommodate a maximum capacity of 7,000 tons of cargo per year. The terminal will have a separate import and export area, where cold tem-perature rooms, dangerous goods storage, and security rooms will be installed.
The project is expected to have a positive catalytic effect on local businesses by providing the country’s first airport cargo handling and storage facilities and services meeting international standards.
MIGA’s support for this investment is aligned with the World Bank Group’s country partnership strategy for Sierra Leone, particularly with regard to supporting the devel-opment of a competitive private sector.
MIGA’s participation in the project is also aligned with key Agency priorities, which include encouraging investment in post-conflict countries and countries eligible for con-cessional lending from the International Development Association. The project was underwritten through MIGA’s Small Investment Program.
uganda
Project name: Bujagali Energy Ltd.
Guarantee holder: World Power Holdings Luxembourg S.à.r.l.
On July 27, 2012, MIGA amended an existing guarantee by $5.3 million for World Power Holdings Luxembourg S.à.r.l. (WPH), an affiliate of Sithe Global (USA), covering their additional equity investment in the Bujagali hydropower project. In 2007, MIGA issued a guarantee of $115 million covering WPH’s initial investment in the plant. The investor has increased its equity investment due to addi-tional costs associated with the project. The coverage is for a period of up to 20 years against the risk of breach of contract. This additional coverage brings MIGA’s gross exposure under the project to $120.3 million.
The project consists of the construction and operation of a 250 megawatt, run-of-the-river hydropower plant on the Victoria Nile by Bujagali Energy Ltd. (BEL), of which WPH is a partner. It was developed on a build-own-operate-transfer basis and reuses water flowing from two existing upstream facilities to generate electricity. The first generating unit was commissioned in February 2012 and the project reached full capacity in June 2012. The project also includes an associated Interconnection Project, which consists of a series of transmission lines to be owned and operated by the Uganda Electricity Transmission Company.
Reliable and accessible electricity is critical for Uganda’s social and economic development. Daily power shortages have stunted economic growth by an estimated one percent of the country’s gross domestic product. The Bujagali project has increased supply to the national power grid and reduced the need for more costly thermal power.
In addition to MIGA’s guarantee, the World Bank Group is supporting the project with $130 million in loans from the IFC and a partial risk guarantee of up to $115 million from the International Development Association. MIGA’s guarantee was essential to securing Sithe Global’s investment.
Zambia
Project name: Chobe Agrivision Company Ltd.
Guarantee holder: Chayton Africa
On June 27, 2013, MIGA issued a guarantee of $45.9 million to Chayton Africa of Mauritius covering its investment in Chobe Agrivision Company Ltd. in Zambia. MIGA’s coverage is for a period of up to 15 years against the risks of transfer restriction, expropriation, war and civil disturbance, and breach of contract.
The project involves an investment by Chayton Africa (CA) to acquire and improve Somawhe Estates, an existing 12,822 hectare commercial farm in the Mpongwe Farm Block in the Copperbelt Province of Zambia. Approximately 2,874 hectares of land are cleared with 2,611 hectares under pivot irrigation. CA intends to bring an additional 1,800 hectares under irrigation. The farm cultivates soya, maize, wheat, and barley for consumption in Zambia.
CA plans to implement efficient agricultural practices such as crop rotation and zero tillage, soil and water man-agement, and additional improvements to increase pro-ductivity and sustainable crop yields. As well as improving productivity of the land, the introduction of new tech-nologies and methods offers the chance for substantial demonstration effects. The agricultural sector has been identified by both the Zambian government (in its national development plan) and in the World Bank’s Country Partnership Strategy as a key area where there is potential to contribute to development and economic growth. Although 58 percent of the land in Zambia (75 million hectares) is classified as having medium to high potential for agriculture, only about 14 percent of arable land is cul-tivated. The project will also contribute to increased food security in the region. According to the World Bank, food production in Africa needs to double by 2050 to avoid widespread starvation.
The project is aligned with MIGA’s strategic priorities of supporting investments into countries eligible for assistance from the International Development Association and South-South investments.
Zambia
Project name: Silverlands Ranching Limited
Guarantee holder: Silverlands Ireland Holdings (Z2) Limited
On May 22, 2013, MIGA issued a guarantee of $8.8 million covering an equity investment by Silverlands Ireland Holdings (Z2) Limited of Ireland in Silverlands Ranching Limited in Zambia. The coverage is for a period of up to 10 years against the risks of transfer restriction, expropriation, and war and civil disturbance.
The project involves the acquisition of the assets of Foresythe Estates Limited, an existing 19,090 hectare cattle farm, located in Zimba, in the southern province of Zambia. The farm has been in operation for over 100 years and exclusively breeds, rears, and sells live cattle. The new owners intend to improve and expand the farm’s operations, including enlarging the current cattle herd and adding irrigation and feedlots.
Promoting agricultural growth and diversification has been identified as a key development challenge in the World Bank Group’s Country Partnership Strategy for Zambia. The vast majority of the very poor derive their livelihoods from subsistence smallholder agriculture, and overall agricultural productivity remains low. The Zambian govern-ment’s Sixth National Development Plan specifically iden-tifies agriculture and livestock as potential growth areas that could unlock Zambia’s natural resource endowments to provide a basis for development.
In addition to contributing to Zambia’s overall agricultural development strategy, Silverlands Ranching Limited will offer assistance to smallholder farmers regarding immu-nization strategies for cattle belonging to local villagers, where mortality rates are much higher and calving rates are lower than commercial farms. This assistance to small-scale farmers in the area will help improve the quality of traditional cattle and will have a significant impact on Zambia’s overall production.
The new owners will also make significant investments to improve the farm’s infrastructure, including improving staff housing and sanitation and enhanced environmental management measures. The farm is expected to employ 125 local staff.
The project was underwritten through MIGA’s Small Investment Program and is aligned with MIGA’s strategic priority of supporting investments into countries eligible for assistance from the International Development Association.
MIGA ANNUAL REPORT 2013 | 5554 | MIGA ANNUAL REPORT 2013
Zambia
Project name: Yalelo Limited
Guarantee holder: Liongate Venture Fund I SPC
On March 12, 2013, MIGA issued a guarantee of $2.9 million covering an equity investment by Liongate Venture Fund I SPC of the Cayman Islands in Yalelo Limited in Zambia. The coverage is for a period of up to 10 years against the risks of transfer restriction, expropriation, and war and civil disturbance.
The project involves the establishment of an aquaculture facility on the Zambian side of Lake Kariba in Siovonga province. The project will harvest the local species of tilapia for sale in Lusaka. The project is expected to produce 2,500 tons of tilapia in the first year, increasing to 7,600 tons by year three.
Fish production in Zambia is not meeting local demand and the country imports over 40,000 tons of frozen fish per year. Yalelo will contribute to Zambian food security by providing a local source of tilapia on a commercial scale. The project is also expected to generate 100 local jobs.
The project was underwritten through MIGA’s Small Investment Program and is aligned with MIGA’s strategic priorities of supporting investments into countries eligible for concessional lending from the International Development Association.
mIgA’s technical assistance mandate is implemented under the
umbrella of FIAs, the World Bank group’s multi-donor Facility
for Investment Climate Advisory services.
Through its financial support to this partnership and funding vehicle, MIGA contributed to advisory services that help developing countries level the playing field for businesses, make markets more competitive, deliver reforms in strategic sectors, and facilitate international trade and investment.
In calendar year 2012, FIAS projects contributed to 76 sig-nificant investment climate improvements in 41 countries. Of these improvements, 72 percent were in IDA countries and 34 percent in conflict-affected states—both MIGA priority areas. FIAS’ strategy over the next four years emphasizes sector-specific investment climate reform and is designed to unlock investment opportunities in MIGA and World Bank Group priority sectors and industries, especially in fragile and conflict-affected countries where MIGA’s guarantee services are of particular relevance to investors.
For example, with FIAS support the fragile state of Comoros deepened reform efforts and became a member of MIGA this fiscal year. The FIAS-supported team directly
advised the government on the ratification of the MIGA Convention, which had been signed two years before. Together with MIGA, the team provided technical infor-mation and facilitation during several stages of the mem-bership process.
Another example is Rwanda, an IDA-eligible country, where the FIAS team is helping the government attract investments in horticulture and tea to boost employment opportunities and exports in these key sectors. It helped develop crucial reform proposals on a green leaf pricing mechanism expected to strengthen sustainability of the tea sector and help pave the way for a $200-million expansion plan that could result in doubling the area under pro-duction and export volume. The reform is also expected to significantly improve the income of 65,000 farmers and their families active in the sector.
Technical Assistance
MIGA ANNUAL REPORT 2013 | 5756 | MIGA ANNUAL REPORT 2013
the office of the Compliance Advisor ombudsman (CAo) is the independent
accountability mechanism for mIgA and IFC and reports directly to the president
of the World Bank group.
The CAO responds to complaints from people affected by MIGA and IFC-supported business activities, with the goal of enhancing social and environmental outcomes on the ground and fostering greater public accountability of both agencies.
The CAO has three roles. The CAO’s dispute resolution arm works to identify the causes of conflict and helps stakeholders resolve concerns using a flexible, problem-solving approach. The CAO’s compliance arm oversees investigations of MIGA’s and IFC’s social and environ-mental performance to ensure compliance with applicable policies, guidelines, procedures, and systems. In its advisory role, the CAO provides independent advice to the World Bank Group President as well as MIGA and IFC management on systemic environmental and social issues.
The CAO released a compliance audit in April 2013 related to a 2010 complaint regarding the Mozal Aluminum Smelter in Mozambique, which MIGA guaranteed in 1998. The complaint raised concerns about the impacts of increased emissions during a period when the smelter’s fume treatment centers were shut down for maintenance. Agreement was not reached through a CAO mediation process and the case was transferred to the CAO’s com-pliance function in December 2011. The compliance audit found that more proactive supervision of risks related to the failure of Mozal’s fume treatment centers would have been appropriate. MIGA’s involvement in this project came to an end during the audit process. In its response IFC, which provided financing, acknowledged that the issues identified by the audit are important ones and warrant
further consideration. The CAO is monitoring actions in response to the audit findings.
In 2011, the CAO received two complaints regarding the Bujagali power plant in Uganda, supported by IFC and by MIGA in 2007 and by MIGA in 2013. The first complaint was filed by former employees involved in the construction of the project regarding injuries sustained in the course of their work; the second was filed by local community members concerned about project impacts during construction. The company and complainants agreed to undertake a collaborative process to address the concerns, and the CAO continues to work with the parties to help them resolve the remaining issues raised in the complaints. In April of this fiscal year, the CAO received a third complaint about the project from former construction workers raising concerns about unpaid wages and benefits. This complaint is in assessment.
In October 2012 and February 2013, the CAO received two complaints from local communities regarding the Oyu Tolgoi mining project in Mongolia, for which MIGA and IFC have disclosed plans to support. During the CAO’s assessment, the parties expressed an interest in partici-pating in a dispute resolution process facilitated by the CAO to help address their concerns. The CAO is currently working with the parties to finalize the way forward in this regard.
Visit www.cao-ombudsman.org for more information about these cases and the CAO’s activities.
Compliance Advisor/Ombudsman
the Independent evaluation group (Ieg) assesses mIgA’s strategies, policies, and
projects to improve the Agency’s development results. Ieg is independent of
mIgA management and reports its findings to mIgA’s Board of Directors and the
Committee on Development effectiveness.
In fiscal year 2013 IEG included evaluation of MIGA’s work in its country program evaluations for Afghanistan. MIGA’s work was also assessed in IEG’s evaluations of World Bank Group support to forestry, infrastructure, and innovation. IEG’s BiennialReportonOperationsEvaluation focusing on the private sector noted that MIGA has upgraded its development performance assessment system, while also emphasizing the need to find a cost-effective way of mea-suring the development effectiveness of MIGA projects consistent with MIGA’s business model as a political risk insurer.
IEG’s most recent review of the World Bank Group’s results and performance concluded that 69 percent of a sample of 26 evaluated MIGA projects had achieved satis-factory development outcomes or better—that is, they met or exceeded MIGA’s financial, economic, environmental, and social benchmarks. Successful projects provided services and products unavailable in local markets and showed high levels of productivity.
IEG continues to validate MIGA’s self-evaluations of its guarantee projects using a methodology that was jointly developed by IEG and MIGA. IEG also conducts inde-pendent evaluations of MIGA as part of its micro-eval-uation work. During this fiscal year, IEG reviewed six MIGA self-evaluations and completed two direct evaluations of MIGA-supported projects.
IEG and MIGA continue to collaborate on a joint working group to strengthen MIGA’s self-evaluation system. IEG conducted several events for MIGA staff on topics covering
findings and lessons from its evaluation work. IEG and MIGA continued work on refining practice standards for MIGA evaluations, using the Good Practice Standards developed by the Evaluation Cooperation Group.
IEG also started conducting cluster evaluations of projects underwritten though MIGA’s Small Investment Program.
IEG’s reports and recommendations are publicly disclosed on its website at http://ieg.worldbankgroup.org.
Independent Evaluation Group
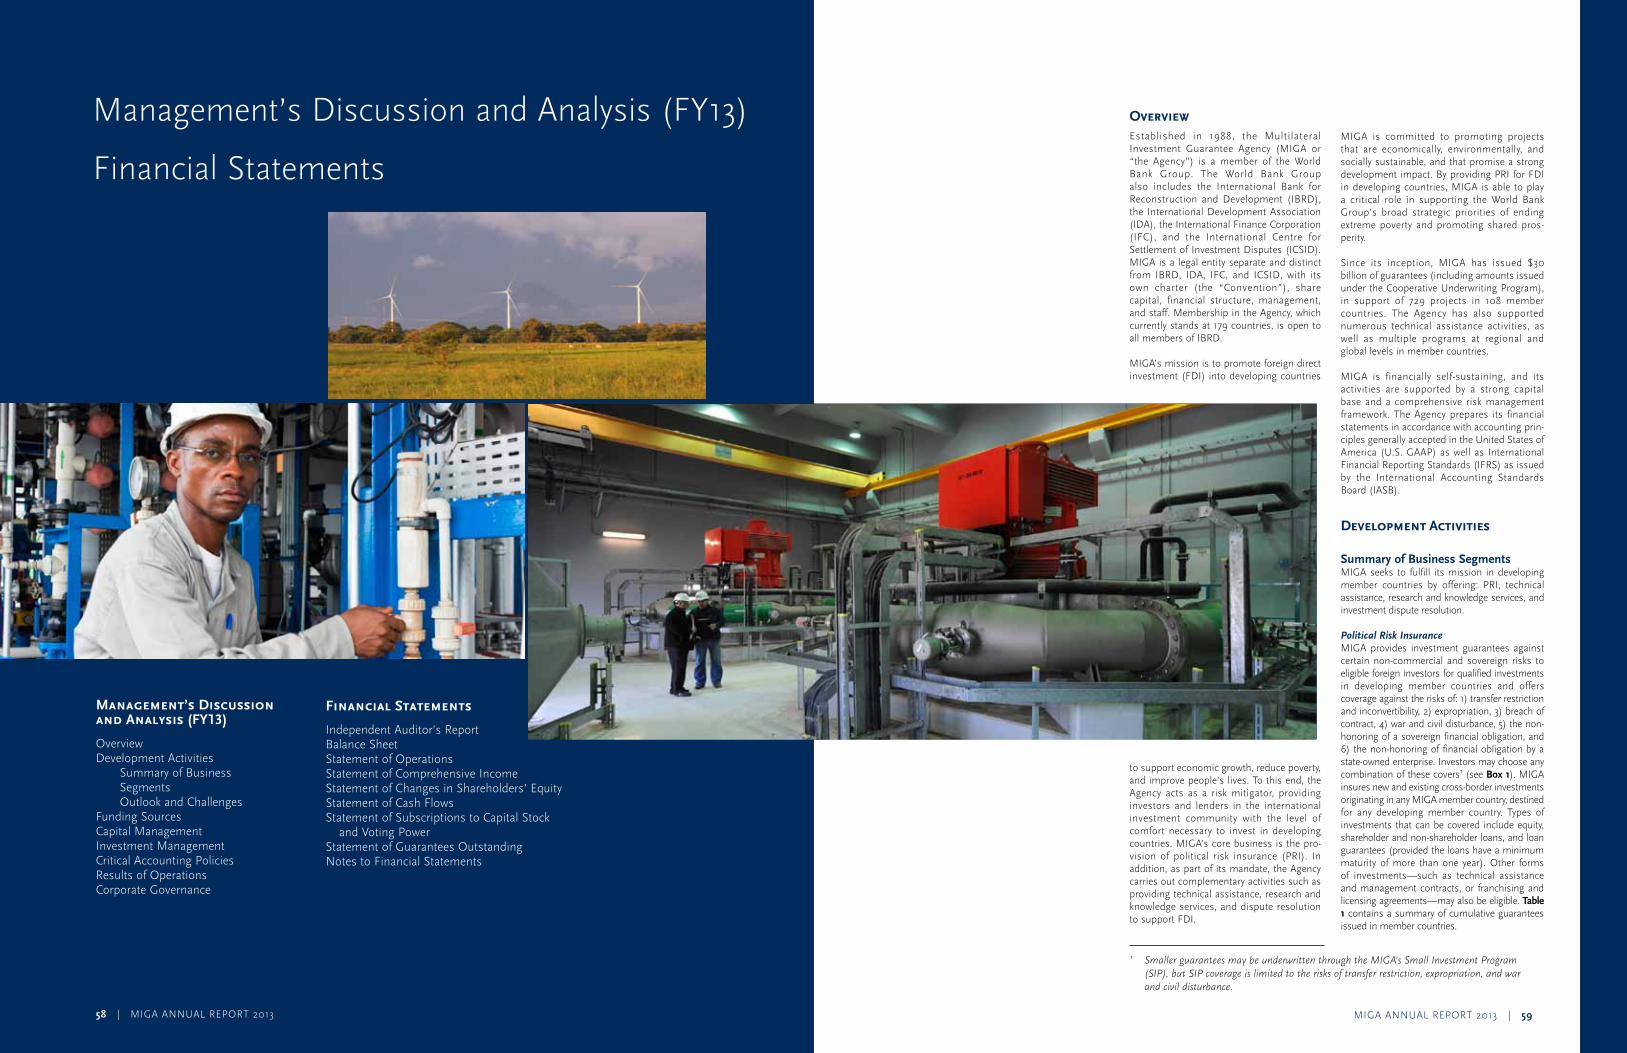
MIGA ANNUAL REPORT 2013 | 59
58 | MIGA ANNUAL REPORT 2013
Management’s Discussion and Analysis (FY13)
Overview Development Activities
Summary of Business Segments
Outlook and ChallengesFunding SourcesCapital ManagementInvestment ManagementCritical Accounting PoliciesResults of OperationsCorporate Governance
Financial Statements
Independent Auditor’s Report Balance Sheet Statement of Operations Statement of Comprehensive IncomeStatement of Changes in Shareholders’ Equity Statement of Cash Flows Statement of Subscriptions to Capital Stock
and Voting PowerStatement of Guarantees OutstandingNotes to Financial Statements
Management’s Discussion and Analysis (FY13)
Financial Statements
1 SmallerguaranteesmaybeunderwrittenthroughtheMIGA’sSmallInvestmentProgram(SIP),butSIPcoverageislimitedtotherisksoftransferrestriction,expropriation,andwarandcivildisturbance.
OverviewEstablished in 1988, the Multilateral Investment Guarantee Agency (MIGA or “the Agency”) is a member of the World Bank Group. The World Bank Group also includes the International Bank for Reconstruction and Development (IBRD), the International Development Association (IDA), the International Finance Corporation (IFC), and the International Centre for Settlement of Investment Disputes (ICSID). MIGA is a legal entity separate and distinct from IBRD, IDA, IFC, and ICSID, with its own charter (the “Convention”), share capital, financial structure, management, and staff. Membership in the Agency, which currently stands at 179 countries, is open to all members of IBRD.
MIGA’s mission is to promote foreign direct investment (FDI) into developing countries
to support economic growth, reduce poverty, and improve people’s lives. To this end, the Agency acts as a risk mitigator, providing investors and lenders in the international investment community with the level of comfort necessary to invest in developing countries. MIGA’s core business is the pro-vision of political risk insurance (PRI). In addition, as part of its mandate, the Agency carries out complementary activities such as providing technical assistance, research and knowledge services, and dispute resolution to support FDI.
MIGA is committed to promoting projects that are economically, environmentally, and socially sustainable, and that promise a strong development impact. By providing PRI for FDI in developing countries, MIGA is able to play a critical role in supporting the World Bank Group’s broad strategic priorities of ending extreme poverty and promoting shared pros-perity.
Since its inception, MIGA has issued $30 billion of guarantees (including amounts issued under the Cooperative Underwriting Program), in support of 729 projects in 108 member countries. The Agency has also supported numerous technical assistance activities, as well as multiple programs at regional and global levels in member countries.
MIGA is financially self-sustaining, and its activities are supported by a strong capital base and a comprehensive risk management framework. The Agency prepares its financial statements in accordance with accounting prin-ciples generally accepted in the United States of America (U.S. GAAP) as well as International Financial Reporting Standards (IFRS) as issued by the International Accounting Standards Board (IASB).
Development Activities
Summary of Business SegmentsMIGA seeks to fulfill its mission in developing member countries by offering: PRI, technical assistance, research and knowledge services, and investment dispute resolution.
Political Risk InsuranceMIGA provides investment guarantees against certain non-commercial and sovereign risks to eligible foreign investors for qualified investments in developing member countries and offers coverage against the risks of: 1) transfer restriction and inconvertibility, 2) expropriation, 3) breach of contract, 4) war and civil disturbance, 5) the non-honoring of a sovereign financial obligation, and 6) the non-honoring of financial obligation by a state-owned enterprise. Investors may choose any combination of these covers1 (see Box 1). MIGA insures new and existing cross-border investments originating in any MIGA member country, destined for any developing member country. Types of investments that can be covered include equity, shareholder and non-shareholder loans, and loan guarantees (provided the loans have a minimum maturity of more than one year). Other forms of investments—such as technical assistance and management contracts, or franchising and licensing agreements—may also be eligible. Table 1 contains a summary of cumulative guarantees issued in member countries.
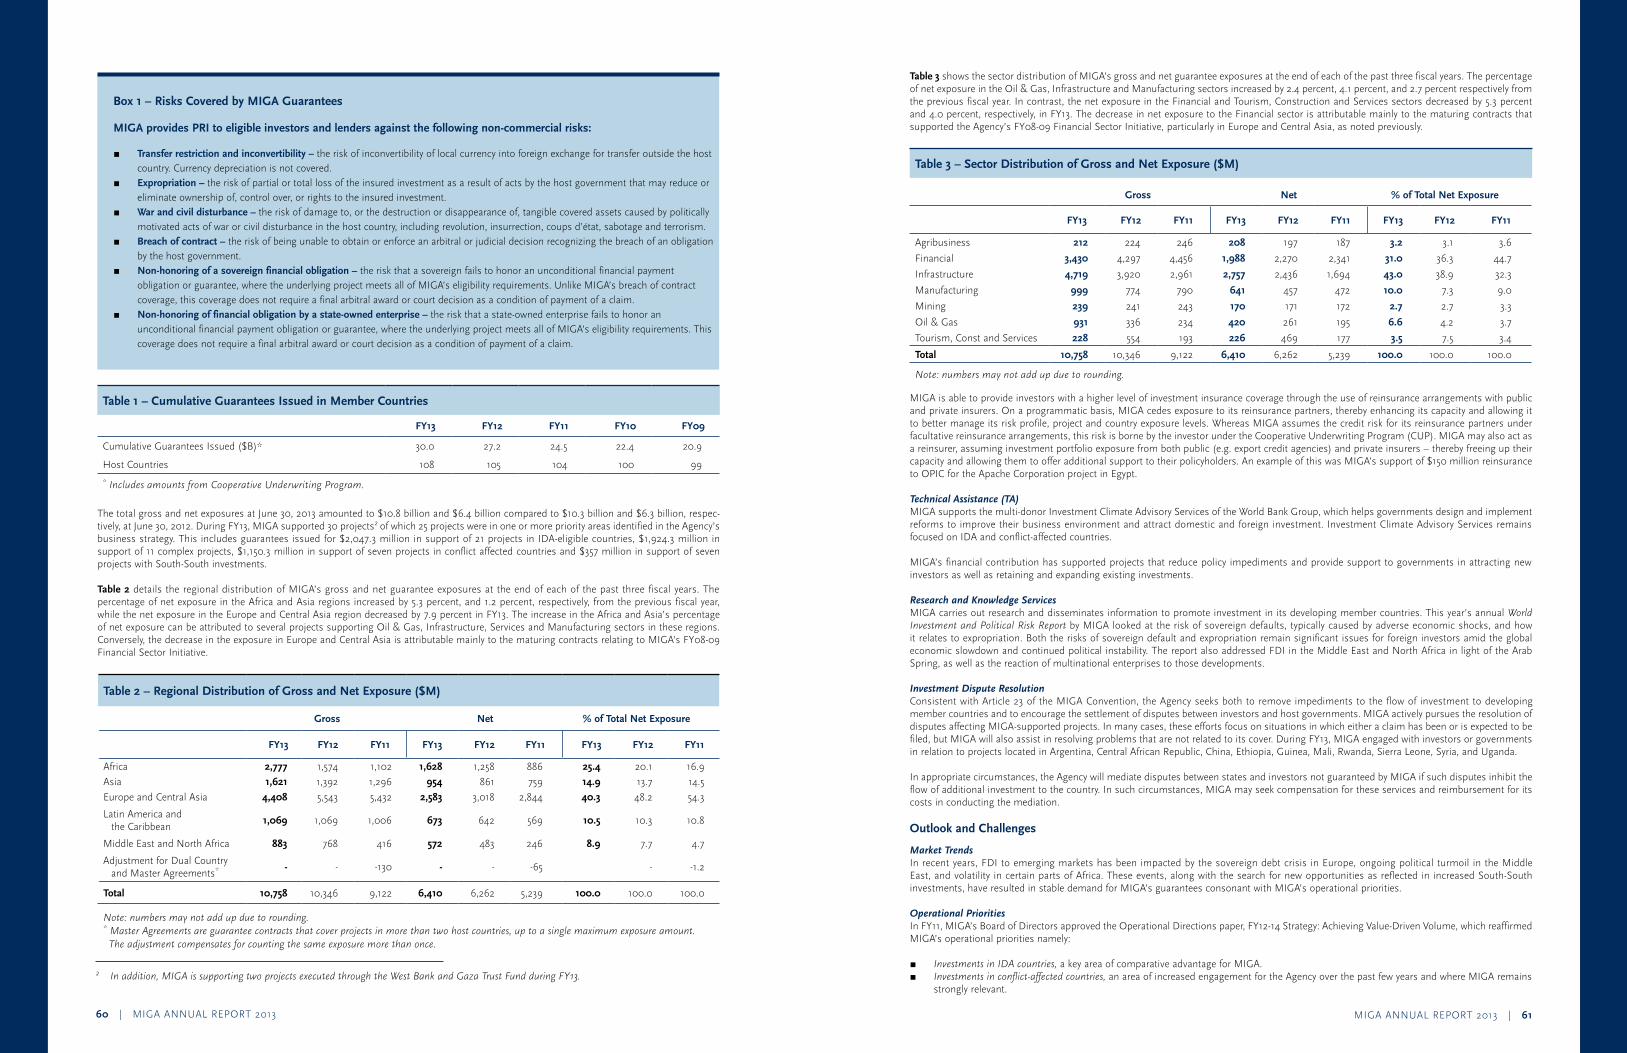
MIGA ANNUAL REPORT 2013 | 6160 | MIGA ANNUAL REPORT 2013
Box 1 – Risks Covered by MIGA Guarantees
MIGA provides PRI to eligible investors and lenders against the following non-commercial risks:
r Transfer restriction and inconvertibility – the risk of inconvertibility of local currency into foreign exchange for transfer outside the host country. Currency depreciation is not covered.
r Expropriation – the risk of partial or total loss of the insured investment as a result of acts by the host government that may reduce or eliminate ownership of, control over, or rights to the insured investment.
r War and civil disturbance – the risk of damage to, or the destruction or disappearance of, tangible covered assets caused by politically motivated acts of war or civil disturbance in the host country, including revolution, insurrection, coups d’état, sabotage and terrorism.
r Breach of contract – the risk of being unable to obtain or enforce an arbitral or judicial decision recognizing the breach of an obligation by the host government.
r Non-honoring of a sovereign financial obligation – the risk that a sovereign fails to honor an unconditional financial payment obligation or guarantee, where the underlying project meets all of MIGA’s eligibility requirements. Unlike MIGA’s breach of contract coverage, this coverage does not require a final arbitral award or court decision as a condition of payment of a claim.
r Non-honoring of financial obligation by a state-owned enterprise – the risk that a state-owned enterprise fails to honor an unconditional financial payment obligation or guarantee, where the underlying project meets all of MIGA’s eligibility requirements. This coverage does not require a final arbitral award or court decision as a condition of payment of a claim.
Table 1 – Cumulative Guarantees Issued in Member Countries
FY13 FY12 FY11 FY10 FY09
Cumulative Guarantees Issued ($B)* 30.0 27.2 24.5 22.4 20.9
Host Countries 108 105 104 100 99
*IncludesamountsfromCooperativeUnderwritingProgram.
The total gross and net exposures at June 30, 2013 amounted to $10.8 billion and $6.4 billion compared to $10.3 billion and $6.3 billion, respec-tively, at June 30, 2012. During FY13, MIGA supported 30 projects2 of which 25 projects were in one or more priority areas identified in the Agency’s business strategy. This includes guarantees issued for $2,047.3 million in support of 21 projects in IDA-eligible countries, $1,924.3 million in support of 11 complex projects, $1,150.3 million in support of seven projects in conflict affected countries and $357 million in support of seven projects with South-South investments.
Table 2 details the regional distribution of MIGA’s gross and net guarantee exposures at the end of each of the past three fiscal years. The percentage of net exposure in the Africa and Asia regions increased by 5.3 percent, and 1.2 percent, respectively, from the previous fiscal year, while the net exposure in the Europe and Central Asia region decreased by 7.9 percent in FY13. The increase in the Africa and Asia’s percentage of net exposure can be attributed to several projects supporting Oil & Gas, Infrastructure, Services and Manufacturing sectors in these regions. Conversely, the decrease in the exposure in Europe and Central Asia is attributable mainly to the maturing contracts relating to MIGA’s FY08-09 Financial Sector Initiative.
Table 2 – Regional Distribution of Gross and Net Exposure ($M)
Gross Net % of Total Net Exposure
FY13 FY12 FY11 FY13 FY12 FY11 FY13 FY12 FY11
Africa 2,777 1,574 1,102 1,628 1,258 886 25.4 20.1 16.9
Asia 1,621 1,392 1,296 954 861 759 14.9 13.7 14.5
Europe and Central Asia 4,408 5,543 5,432 2,583 3,018 2,844 40.3 48.2 54.3
Latin America and the Caribbean
1,069 1,069 1,006 673 642 569 10.5 10.3 10.8
Middle East and North Africa 883 768 416 572 483 246 8.9 7.7 4.7
Adjustment for Dual Countryand Master Agreements* - - -130 - - -65 - -1.2
Total 10,758 10,346 9,122 6,410 6,262 5,239 100.0 100.0 100.0
Note:numbersmaynotaddupduetorounding.*MasterAgreementsareguaranteecontractsthatcoverprojectsinmorethantwohostcountries,uptoasinglemaximumexposureamount.
Theadjustmentcompensatesforcountingthesameexposuremorethanonce.
Table 3 shows the sector distribution of MIGA’s gross and net guarantee exposures at the end of each of the past three fiscal years. The percentage of net exposure in the Oil & Gas, Infrastructure and Manufacturing sectors increased by 2.4 percent, 4.1 percent, and 2.7 percent respectively from the previous fiscal year. In contrast, the net exposure in the Financial and Tourism, Construction and Services sectors decreased by 5.3 percent and 4.0 percent, respectively, in FY13. The decrease in net exposure to the Financial sector is attributable mainly to the maturing contracts that supported the Agency’s FY08-09 Financial Sector Initiative, particularly in Europe and Central Asia, as noted previously.
Table 3 – Sector Distribution of Gross and Net Exposure ($M)
Gross Net % of Total Net Exposure
FY13 FY12 FY11 FY13 FY12 FY11 FY13 FY12 FY11
Agribusiness 212 224 246 208 197 187 3.2 3.1 3.6
Financial 3,430 4,297 4,456 1,988 2,270 2,341 31.0 36.3 44.7
Infrastructure 4,719 3,920 2,961 2,757 2,436 1,694 43.0 38.9 32.3
Manufacturing 999 774 790 641 457 472 10.0 7.3 9.0
Mining 239 241 243 170 171 172 2.7 2.7 3.3
Oil & Gas 931 336 234 420 261 195 6.6 4.2 3.7
Tourism, Const and Services 228 554 193 226 469 177 3.5 7.5 3.4
Total 10,758 10,346 9,122 6,410 6,262 5,239 100.0 100.0 100.0
Note:numbersmaynotaddupduetorounding.
MIGA is able to provide investors with a higher level of investment insurance coverage through the use of reinsurance arrangements with public and private insurers. On a programmatic basis, MIGA cedes exposure to its reinsurance partners, thereby enhancing its capacity and allowing it to better manage its risk profile, project and country exposure levels. Whereas MIGA assumes the credit risk for its reinsurance partners under facultative reinsurance arrangements, this risk is borne by the investor under the Cooperative Underwriting Program (CUP). MIGA may also act as a reinsurer, assuming investment portfolio exposure from both public (e.g. export credit agencies) and private insurers – thereby freeing up their capacity and allowing them to offer additional support to their policyholders. An example of this was MIGA’s support of $150 million reinsurance to OPIC for the Apache Corporation project in Egypt.
Technical Assistance (TA)MIGA supports the multi-donor Investment Climate Advisory Services of the World Bank Group, which helps governments design and implement reforms to improve their business environment and attract domestic and foreign investment. Investment Climate Advisory Services remains focused on IDA and conflict-affected countries.
MIGA’s financial contribution has supported projects that reduce policy impediments and provide support to governments in attracting new investors as well as retaining and expanding existing investments.
Research and Knowledge Services MIGA carries out research and disseminates information to promote investment in its developing member countries. This year’s annual WorldInvestmentandPoliticalRiskReport by MIGA looked at the risk of sovereign defaults, typically caused by adverse economic shocks, and how it relates to expropriation. Both the risks of sovereign default and expropriation remain significant issues for foreign investors amid the global economic slowdown and continued political instability. The report also addressed FDI in the Middle East and North Africa in light of the Arab Spring, as well as the reaction of multinational enterprises to those developments.
Investment Dispute ResolutionConsistent with Article 23 of the MIGA Convention, the Agency seeks both to remove impediments to the flow of investment to developing member countries and to encourage the settlement of disputes between investors and host governments. MIGA actively pursues the resolution of disputes affecting MIGA-supported projects. In many cases, these efforts focus on situations in which either a claim has been or is expected to be filed, but MIGA will also assist in resolving problems that are not related to its cover. During FY13, MIGA engaged with investors or governments in relation to projects located in Argentina, Central African Republic, China, Ethiopia, Guinea, Mali, Rwanda, Sierra Leone, Syria, and Uganda.
In appropriate circumstances, the Agency will mediate disputes between states and investors not guaranteed by MIGA if such disputes inhibit the flow of additional investment to the country. In such circumstances, MIGA may seek compensation for these services and reimbursement for its costs in conducting the mediation.
Outlook and Challenges
Market TrendsIn recent years, FDI to emerging markets has been impacted by the sovereign debt crisis in Europe, ongoing political turmoil in the Middle East, and volatility in certain parts of Africa. These events, along with the search for new opportunities as reflected in increased South-South investments, have resulted in stable demand for MIGA’s guarantees consonant with MIGA’s operational priorities.
Operational Priorities In FY11, MIGA’s Board of Directors approved the Operational Directions paper, FY12-14 Strategy: Achieving Value-Driven Volume, which reaffirmed MIGA’s operational priorities namely:
r InvestmentsinIDAcountries, a key area of comparative advantage for MIGA. r Investmentsinconflict-affectedcountries, an area of increased engagement for the Agency over the past few years and where MIGA remains
strongly relevant.
2 Inaddition,MIGAissupportingtwoprojectsexecutedthroughtheWestBankandGazaTrustFundduringFY13.
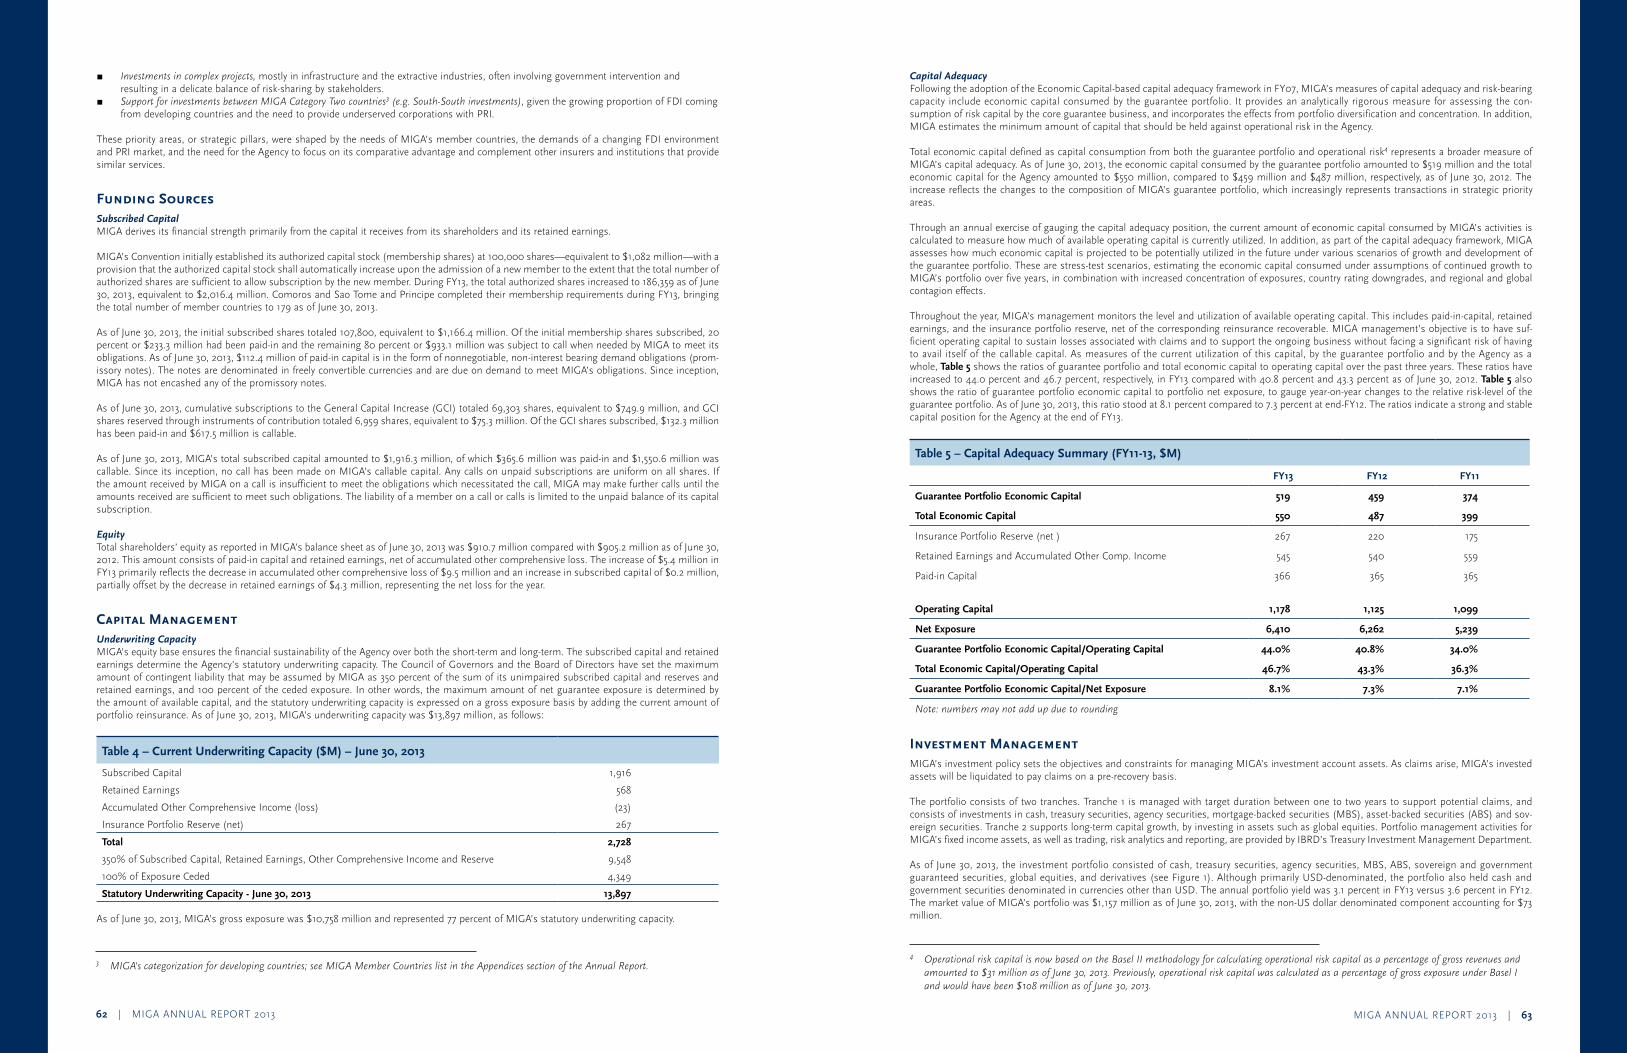
MIGA ANNUAL REPORT 2013 | 6362 | MIGA ANNUAL REPORT 2013
r Investmentsincomplexprojects, mostly in infrastructure and the extractive industries, often involving government intervention and resulting in a delicate balance of risk-sharing by stakeholders.
r SupportforinvestmentsbetweenMIGACategoryTwocountries3 (e.g.South-Southinvestments), given the growing proportion of FDI coming from developing countries and the need to provide underserved corporations with PRI.
These priority areas, or strategic pillars, were shaped by the needs of MIGA’s member countries, the demands of a changing FDI environment and PRI market, and the need for the Agency to focus on its comparative advantage and complement other insurers and institutions that provide similar services.
Funding SourcesSubscribed CapitalMIGA derives its financial strength primarily from the capital it receives from its shareholders and its retained earnings.
MIGA’s Convention initially established its authorized capital stock (membership shares) at 100,000 shares—equivalent to $1,082 million—with a provision that the authorized capital stock shall automatically increase upon the admission of a new member to the extent that the total number of authorized shares are sufficient to allow subscription by the new member. During FY13, the total authorized shares increased to 186,359 as of June 30, 2013, equivalent to $2,016.4 million. Comoros and Sao Tome and Principe completed their membership requirements during FY13, bringing the total number of member countries to 179 as of June 30, 2013.
As of June 30, 2013, the initial subscribed shares totaled 107,800, equivalent to $1,166.4 million. Of the initial membership shares subscribed, 20 percent or $233.3 million had been paid-in and the remaining 80 percent or $933.1 million was subject to call when needed by MIGA to meet its obligations. As of June 30, 2013, $112.4 million of paid-in capital is in the form of nonnegotiable, non-interest bearing demand obligations (prom-issory notes). The notes are denominated in freely convertible currencies and are due on demand to meet MIGA’s obligations. Since inception, MIGA has not encashed any of the promissory notes.
As of June 30, 2013, cumulative subscriptions to the General Capital Increase (GCI) totaled 69,303 shares, equivalent to $749.9 million, and GCI shares reserved through instruments of contribution totaled 6,959 shares, equivalent to $75.3 million. Of the GCI shares subscribed, $132.3 million has been paid-in and $617.5 million is callable.
As of June 30, 2013, MIGA’s total subscribed capital amounted to $1,916.3 million, of which $365.6 million was paid-in and $1,550.6 million was callable. Since its inception, no call has been made on MIGA’s callable capital. Any calls on unpaid subscriptions are uniform on all shares. If the amount received by MIGA on a call is insufficient to meet the obligations which necessitated the call, MIGA may make further calls until the amounts received are sufficient to meet such obligations. The liability of a member on a call or calls is limited to the unpaid balance of its capital subscription.
Equity Total shareholders’ equity as reported in MIGA’s balance sheet as of June 30, 2013 was $910.7 million compared with $905.2 million as of June 30, 2012. This amount consists of paid-in capital and retained earnings, net of accumulated other comprehensive loss. The increase of $5.4 million in FY13 primarily reflects the decrease in accumulated other comprehensive loss of $9.5 million and an increase in subscribed capital of $0.2 million, partially offset by the decrease in retained earnings of $4.3 million, representing the net loss for the year.
Capital Management Underwriting Capacity MIGA’s equity base ensures the financial sustainability of the Agency over both the short-term and long-term. The subscribed capital and retained earnings determine the Agency’s statutory underwriting capacity. The Council of Governors and the Board of Directors have set the maximum amount of contingent liability that may be assumed by MIGA as 350 percent of the sum of its unimpaired subscribed capital and reserves and retained earnings, and 100 percent of the ceded exposure. In other words, the maximum amount of net guarantee exposure is determined by the amount of available capital, and the statutory underwriting capacity is expressed on a gross exposure basis by adding the current amount of portfolio reinsurance. As of June 30, 2013, MIGA’s underwriting capacity was $13,897 million, as follows:
Table 4 – Current Underwriting Capacity ($M) – June 30, 2013
Subscribed Capital 1,916
Retained Earnings 568
Accumulated Other Comprehensive Income (loss) (23)
Insurance Portfolio Reserve (net) 267
Total 2,728
350% of Subscribed Capital, Retained Earnings, Other Comprehensive Income and Reserve 9,548
100% of Exposure Ceded 4,349
Statutory Underwriting Capacity - June 30, 2013 13,897
As of June 30, 2013, MIGA’s gross exposure was $10,758 million and represented 77 percent of MIGA’s statutory underwriting capacity.
Capital Adequacy Following the adoption of the Economic Capital-based capital adequacy framework in FY07, MIGA’s measures of capital adequacy and risk-bearing capacity include economic capital consumed by the guarantee portfolio. It provides an analytically rigorous measure for assessing the con-sumption of risk capital by the core guarantee business, and incorporates the effects from portfolio diversification and concentration. In addition, MIGA estimates the minimum amount of capital that should be held against operational risk in the Agency.
Total economic capital defined as capital consumption from both the guarantee portfolio and operational risk4 represents a broader measure of MIGA’s capital adequacy. As of June 30, 2013, the economic capital consumed by the guarantee portfolio amounted to $519 million and the total economic capital for the Agency amounted to $550 million, compared to $459 million and $487 million, respectively, as of June 30, 2012. The increase reflects the changes to the composition of MIGA’s guarantee portfolio, which increasingly represents transactions in strategic priority areas.
Through an annual exercise of gauging the capital adequacy position, the current amount of economic capital consumed by MIGA’s activities is calculated to measure how much of available operating capital is currently utilized. In addition, as part of the capital adequacy framework, MIGA assesses how much economic capital is projected to be potentially utilized in the future under various scenarios of growth and development of the guarantee portfolio. These are stress-test scenarios, estimating the economic capital consumed under assumptions of continued growth to MIGA’s portfolio over five years, in combination with increased concentration of exposures, country rating downgrades, and regional and global contagion effects.
Throughout the year, MIGA’s management monitors the level and utilization of available operating capital. This includes paid-in-capital, retained earnings, and the insurance portfolio reserve, net of the corresponding reinsurance recoverable. MIGA management’s objective is to have suf-ficient operating capital to sustain losses associated with claims and to support the ongoing business without facing a significant risk of having to avail itself of the callable capital. As measures of the current utilization of this capital, by the guarantee portfolio and by the Agency as a whole, Table 5 shows the ratios of guarantee portfolio and total economic capital to operating capital over the past three years. These ratios have increased to 44.0 percent and 46.7 percent, respectively, in FY13 compared with 40.8 percent and 43.3 percent as of June 30, 2012. Table 5 also shows the ratio of guarantee portfolio economic capital to portfolio net exposure, to gauge year-on-year changes to the relative risk-level of the guarantee portfolio. As of June 30, 2013, this ratio stood at 8.1 percent compared to 7.3 percent at end-FY12. The ratios indicate a strong and stable capital position for the Agency at the end of FY13.
Table 5 – Capital Adequacy Summary (FY11-13, $M)
FY13 FY12 FY11
Guarantee Portfolio Economic Capital 519 459 374
Total Economic Capital 550 487 399
Insurance Portfolio Reserve (net ) 267 220 175
Retained Earnings and Accumulated Other Comp. Income 545 540 559
Paid-in Capital 366 365 365
Operating Capital 1,178 1,125 1,099
Net Exposure 6,410 6,262 5,239
Guarantee Portfolio Economic Capital/Operating Capital 44.0% 40.8% 34.0%
Total Economic Capital/Operating Capital 46.7% 43.3% 36.3%
Guarantee Portfolio Economic Capital/Net Exposure 8.1% 7.3% 7.1%
Note:numbersmaynotaddupduetorounding
Investment ManagementMIGA’s investment policy sets the objectives and constraints for managing MIGA’s investment account assets. As claims arise, MIGA’s invested assets will be liquidated to pay claims on a pre-recovery basis.
The portfolio consists of two tranches. Tranche 1 is managed with target duration between one to two years to support potential claims, and consists of investments in cash, treasury securities, agency securities, mortgage-backed securities (MBS), asset-backed securities (ABS) and sov-ereign securities. Tranche 2 supports long-term capital growth, by investing in assets such as global equities. Portfolio management activities for MIGA’s fixed income assets, as well as trading, risk analytics and reporting, are provided by IBRD’s Treasury Investment Management Department.
As of June 30, 2013, the investment portfolio consisted of cash, treasury securities, agency securities, MBS, ABS, sovereign and government guaranteed securities, global equities, and derivatives (see Figure 1). Although primarily USD-denominated, the portfolio also held cash and government securities denominated in currencies other than USD. The annual portfolio yield was 3.1 percent in FY13 versus 3.6 percent in FY12. The market value of MIGA’s portfolio was $1,157 million as of June 30, 2013, with the non-US dollar denominated component accounting for $73 million.
4 OperationalriskcapitalisnowbasedontheBaselIImethodologyforcalculatingoperationalriskcapitalasapercentageofgrossrevenuesandamountedto$31millionasofJune30,2013.Previously,operationalriskcapitalwascalculatedasapercentageofgrossexposureunderBaselIandwouldhavebeen$108millionasofJune30,2013.
3 MIGA’scategorizationfordevelopingcountries;seeMIGAMemberCountrieslistintheAppendicessectionoftheAnnualReport.
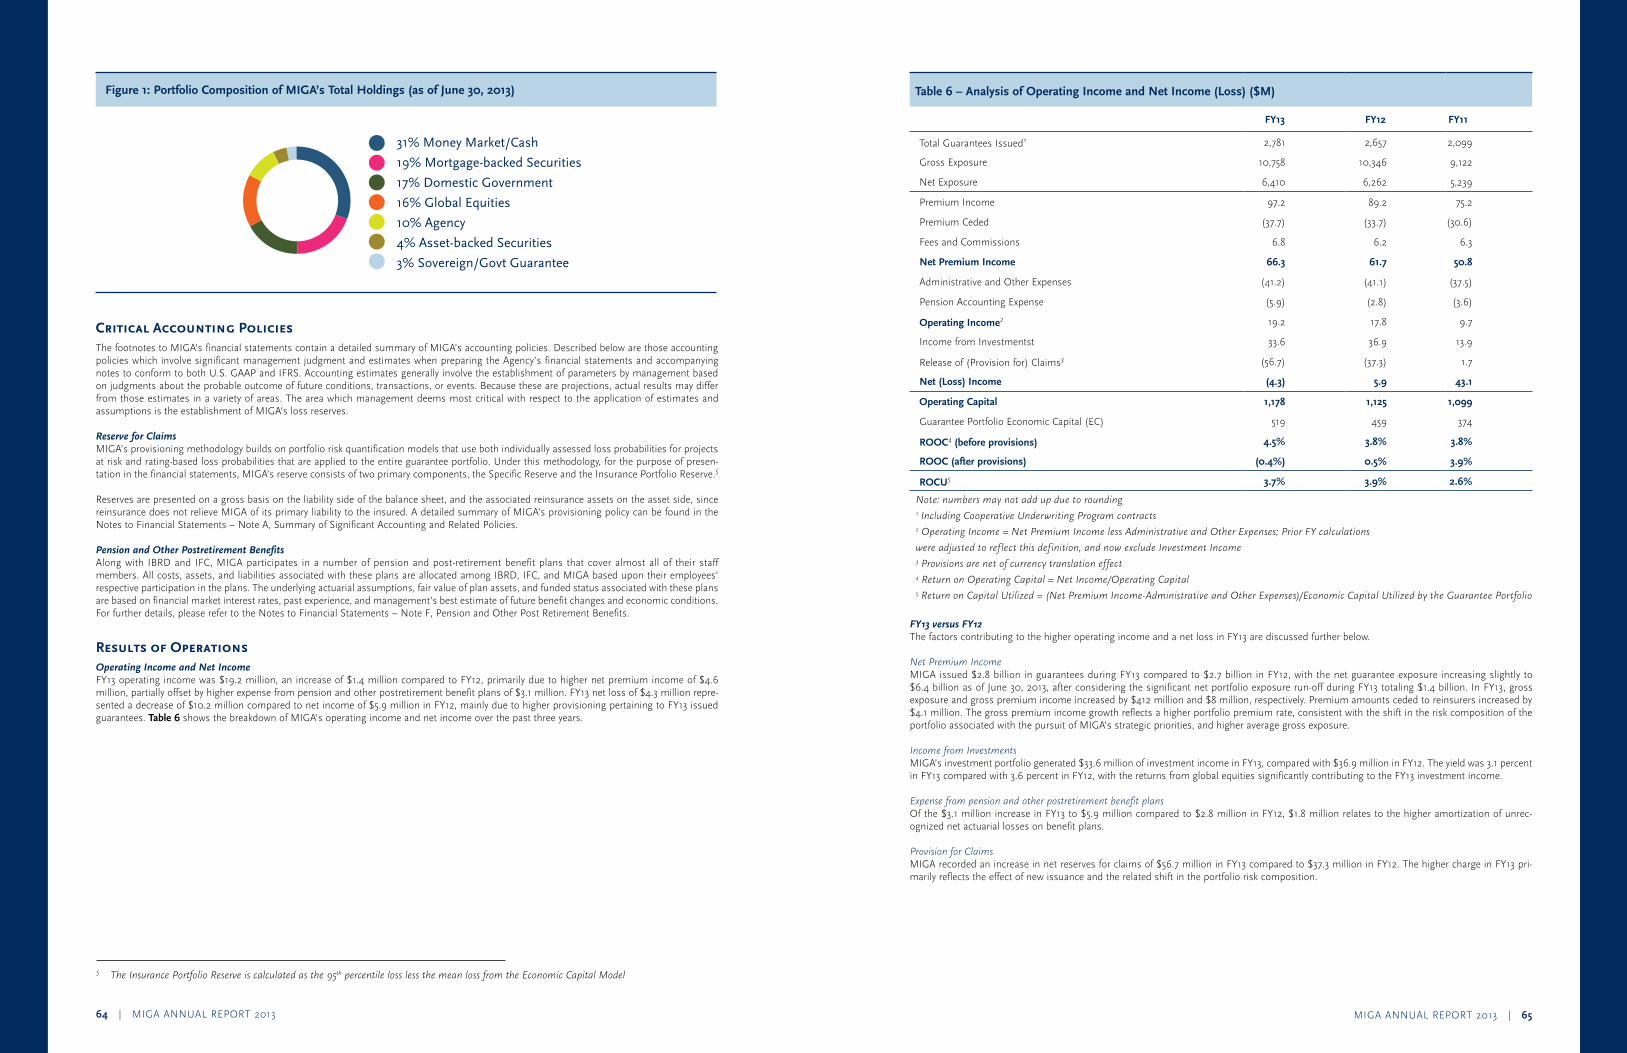
MIGA ANNUAL REPORT 2013 | 6564 | MIGA ANNUAL REPORT 2013
Table 6 – Analysis of Operating Income and Net Income (Loss) ($M)
FY13 FY12 FY11
Total Guarantees Issued1 2,781 2,657 2,099
Gross Exposure 10,758 10,346 9,122
Net Exposure 6,410 6,262 5,239
Premium Income 97.2 89.2 75.2
Premium Ceded (37.7) (33.7) (30.6)
Fees and Commissions 6.8 6.2 6.3
Net Premium Income 66.3 61.7 50.8
Administrative and Other Expenses (41.2) (41.1) (37.5)
Pension Accounting Expense (5.9) (2.8) (3.6)
Operating Income2 19.2 17.8 9.7
Income from Investmentst 33.6 36.9 13.9
Release of (Provision for) Claims3 (56.7) (37.3) 1.7
Net (Loss) Income (4.3) 5.9 43.1
Operating Capital 1,178 1,125 1,099
Guarantee Portfolio Economic Capital (EC) 519 459 374
ROOC4 (before provisions) 4.5% 3.8% 3.8%
ROOC (after provisions) (0.4%) 0.5% 3.9%
ROCU5 3.7% 3.9% 2.6%
Note:numbersmaynotaddupduetorounding1IncludingCooperativeUnderwritingProgramcontracts2OperatingIncome=NetPremiumIncomelessAdministrativeandOtherExpenses;PriorFYcalculations
wereadjustedtoreflectthisdefinition,andnowexcludeInvestmentIncome3Provisionsarenetofcurrencytranslationeffect4ReturnonOperatingCapital=NetIncome/OperatingCapital5ReturnonCapitalUtilized=(NetPremiumIncome-AdministrativeandOtherExpenses)/EconomicCapitalUtilizedbytheGuaranteePortfolio
FY13 versus FY12The factors contributing to the higher operating income and a net loss in FY13 are discussed further below.
NetPremiumIncomeMIGA issued $2.8 billion in guarantees during FY13 compared to $2.7 billion in FY12, with the net guarantee exposure increasing slightly to $6.4 billion as of June 30, 2013, after considering the significant net portfolio exposure run-off during FY13 totaling $1.4 billion. In FY13, gross exposure and gross premium income increased by $412 million and $8 million, respectively. Premium amounts ceded to reinsurers increased by $4.1 million. The gross premium income growth reflects a higher portfolio premium rate, consistent with the shift in the risk composition of the portfolio associated with the pursuit of MIGA’s strategic priorities, and higher average gross exposure.
IncomefromInvestmentsMIGA’s investment portfolio generated $33.6 million of investment income in FY13, compared with $36.9 million in FY12. The yield was 3.1 percent in FY13 compared with 3.6 percent in FY12, with the returns from global equities significantly contributing to the FY13 investment income.
ExpensefrompensionandotherpostretirementbenefitplansOf the $3.1 million increase in FY13 to $5.9 million compared to $2.8 million in FY12, $1.8 million relates to the higher amortization of unrec-ognized net actuarial losses on benefit plans.
ProvisionforClaimsMIGA recorded an increase in net reserves for claims of $56.7 million in FY13 compared to $37.3 million in FY12. The higher charge in FY13 pri-marily reflects the effect of new issuance and the related shift in the portfolio risk composition.
Figure 1: Portfolio Composition of MIGA’s Total Holdings (as of June 30, 2013)
Critical Accounting Policies The footnotes to MIGA’s financial statements contain a detailed summary of MIGA’s accounting policies. Described below are those accounting policies which involve significant management judgment and estimates when preparing the Agency’s financial statements and accompanying notes to conform to both U.S. GAAP and IFRS. Accounting estimates generally involve the establishment of parameters by management based on judgments about the probable outcome of future conditions, transactions, or events. Because these are projections, actual results may differ from those estimates in a variety of areas. The area which management deems most critical with respect to the application of estimates and assumptions is the establishment of MIGA’s loss reserves.
Reserve for ClaimsMIGA’s provisioning methodology builds on portfolio risk quantification models that use both individually assessed loss probabilities for projects at risk and rating-based loss probabilities that are applied to the entire guarantee portfolio. Under this methodology, for the purpose of presen-tation in the financial statements, MIGA’s reserve consists of two primary components, the Specific Reserve and the Insurance Portfolio Reserve.5
Reserves are presented on a gross basis on the liability side of the balance sheet, and the associated reinsurance assets on the asset side, since reinsurance does not relieve MIGA of its primary liability to the insured. A detailed summary of MIGA’s provisioning policy can be found in the Notes to Financial Statements – Note A, Summary of Significant Accounting and Related Policies.
Pension and Other Postretirement BenefitsAlong with IBRD and IFC, MIGA participates in a number of pension and post-retirement benefit plans that cover almost all of their staff members. All costs, assets, and liabilities associated with these plans are allocated among IBRD, IFC, and MIGA based upon their employees’ respective participation in the plans. The underlying actuarial assumptions, fair value of plan assets, and funded status associated with these plans are based on financial market interest rates, past experience, and management’s best estimate of future benefit changes and economic conditions. For further details, please refer to the Notes to Financial Statements – Note F, Pension and Other Post Retirement Benefits.
Results of OperationsOperating Income and Net IncomeFY13 operating income was $19.2 million, an increase of $1.4 million compared to FY12, primarily due to higher net premium income of $4.6 million, partially offset by higher expense from pension and other postretirement benefit plans of $3.1 million. FY13 net loss of $4.3 million repre-sented a decrease of $10.2 million compared to net income of $5.9 million in FY12, mainly due to higher provisioning pertaining to FY13 issued guarantees. Table 6 shows the breakdown of MIGA’s operating income and net income over the past three years.
AR chapter box colors
0 10 20 30 40
Increased marketopportunities
One year ofpolitical stability
Improvedmacroeconomic
stability
Decrease in corruption
More favorablegov’t regulations
Increased accessto financing
Improved infrastructurecapacity
Increased accessto qualified staff
Other
Over the next 12 months
Macroeconomicinstability
Access to financing
Access to qualified staff
Political risk
Infrastructure capacity
Limited market opportunities
Corruption
Increased governmentregulation in the aftermath
of the global financial crisis
Other
0 10 20 30
Over the next three years
Political risk
Macroeconomic instability
Access to qualified staff
Access to financing
Corruption
Infrastructure capacity
Limited market opportunities
Increased governmentregulation in the aftermathof the global financial crisis
Other
0 10 20 30
AustriaUnited Kingdom
FranceUnited States
GermanySouth AfricaLuxembourg
FinlandSwitzerland
GreeceSingapore
United Arab EmiratesCanada
MauritiusKorea, Republic of
SpainCayman Islands
SloveniaBermuda
SenegalEgypt, Arab Republic of
CyprusNetherlands
SwedenJapan
Others
Others: Nigeria, Poland, China, Thailand, Norway, Ecuador, Tanzania, Turkey, Romania, Kenya, Ireland, Belgium, Mali, India, Lebanon, Tunisia, Italy, St. Kitts and Nevis, Denmark, Panama, Virgin Islands (British), Colombia
* Numbers may not add to 100 percent due to guarantee holders domiciled in two different countries
23.912.510.09.27.35.34.12.82.62.32.32.11.61.51.41.31.11.00.90.70.70.70.70.70.72.7
2013
2012
2011
2010
2009
Eearned premium
Fig 2
Fig 4
Fig 6
Fig 5
Fig 1 fin
Figure 8
Figure 9 Figure 7Figure 1
33.6
36.9
13.9
24.1
36.9
Premium and fee incomeInvestment income
46% Infrastructure
23% Oil, gas, and mining
17% Financial
14% Agribusiness, manufacturing, and services
59% Infrastructure
22% Oil, gas, and mining
10% Agribusiness, manufacturing, and services
9% Financial
54% Sub-Saharan Africa
19% Europe and Central Asia
18% Asia and the Pacific
6% Middle East and North Africa*
3% Latin America and the Caribbean
31% Money Market/Cash
19% Mortgage-backed Securities
17% Domestic Government
16% Global Equities
10% Agency
4% Asset-backed Securities
3% Sovereign/Govt Guarantee
47% Sub-Saharan Africa
20% Europe and Central Asia
13% Asia and the Pacific
10% Middle East and North Africa*
10% Latin America and the Caribbean
41% Europe and Central Asia26% Sub-Saharan Africa
15% Asia and the Pacific
10% Latin America and the Caribbean
8% Middle East and North Africa
66.3
61.7
50.8
46.0
43.6
Fig 3
03 04 05 06 07 08 09 10 11 12 13
gross exposure
net exposure
12
10
8
6
4
2
0
5 TheInsurancePortfolioReserveiscalculatedasthe95thpercentilelosslessthemeanlossfromtheEconomicCapitalModel
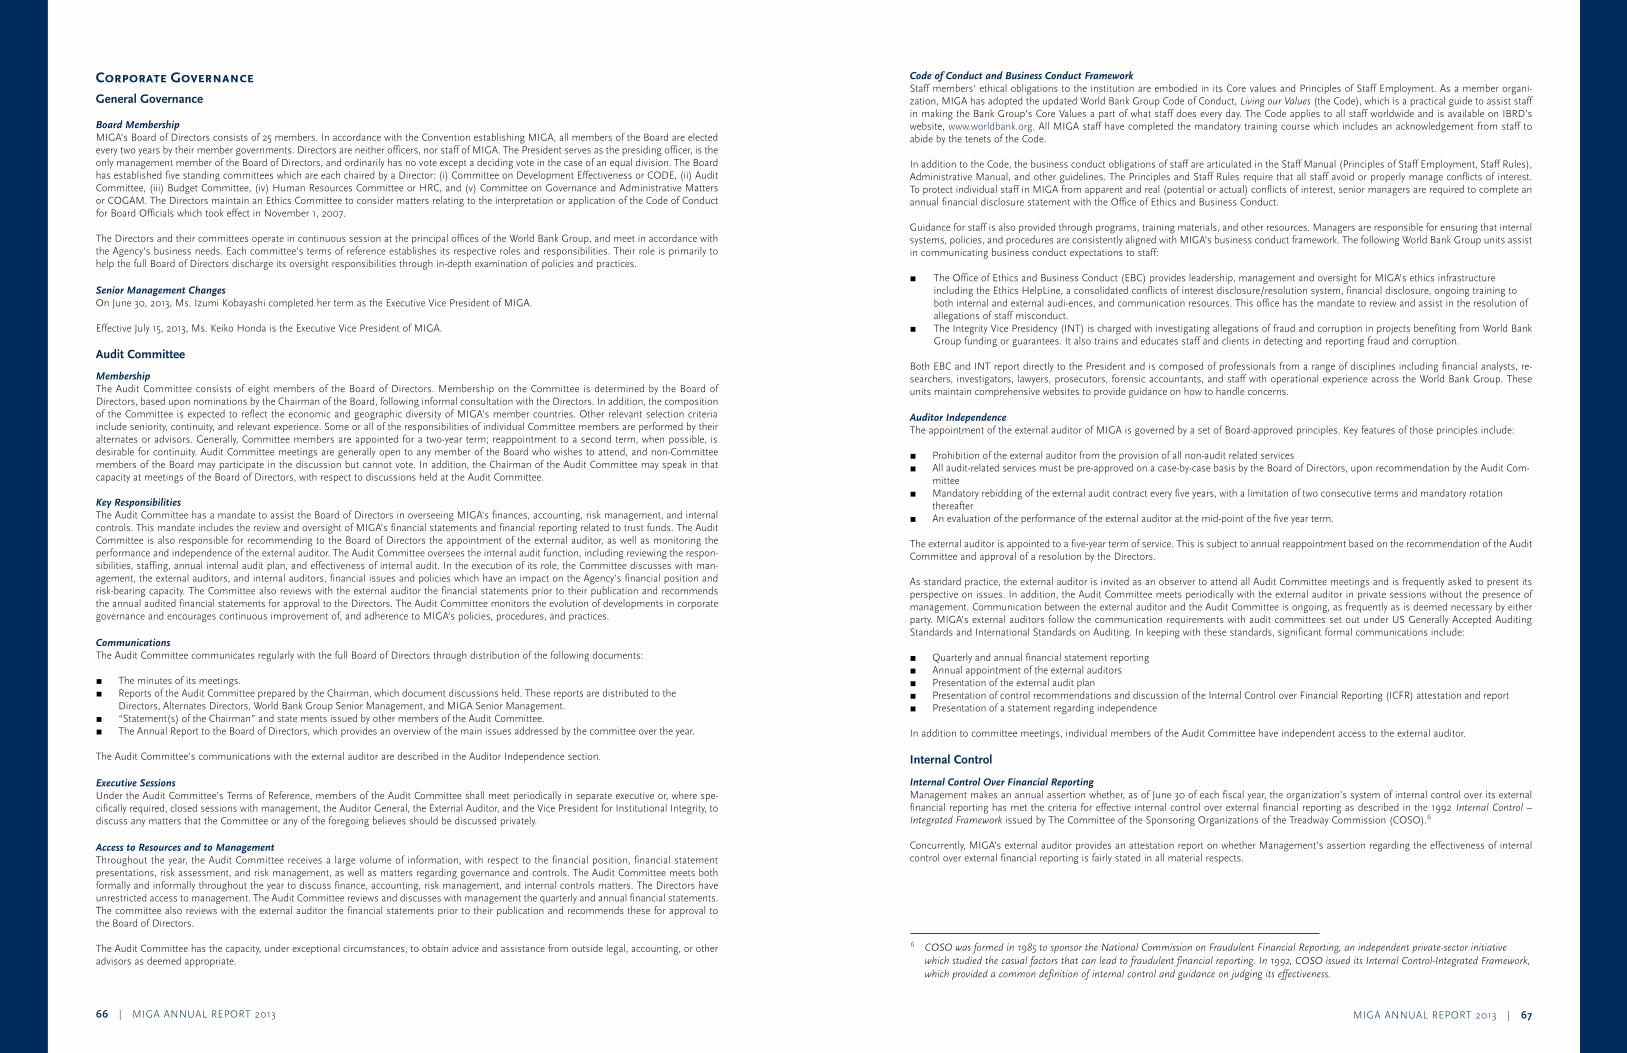
MIGA ANNUAL REPORT 2013 | 6766 | MIGA ANNUAL REPORT 2013
Corporate GovernanceGeneral Governance
Board Membership MIGA’s Board of Directors consists of 25 members. In accordance with the Convention establishing MIGA, all members of the Board are elected every two years by their member governments. Directors are neither officers, nor staff of MIGA. The President serves as the presiding officer, is the only management member of the Board of Directors, and ordinarily has no vote except a deciding vote in the case of an equal division. The Board has established five standing committees which are each chaired by a Director: (i) Committee on Development Effectiveness or CODE, (ii) Audit Committee, (iii) Budget Committee, (iv) Human Resources Committee or HRC, and (v) Committee on Governance and Administrative Matters or COGAM. The Directors maintain an Ethics Committee to consider matters relating to the interpretation or application of the Code of Conduct for Board Officials which took effect in November 1, 2007.
The Directors and their committees operate in continuous session at the principal offices of the World Bank Group, and meet in accordance with the Agency’s business needs. Each committee’s terms of reference establishes its respective roles and responsibilities. Their role is primarily to help the full Board of Directors discharge its oversight responsibilities through in-depth examination of policies and practices.
Senior Management ChangesOn June 30, 2013, Ms. Izumi Kobayashi completed her term as the Executive Vice President of MIGA.
Effective July 15, 2013, Ms. Keiko Honda is the Executive Vice President of MIGA.
Audit Committee
MembershipThe Audit Committee consists of eight members of the Board of Directors. Membership on the Committee is determined by the Board of Directors, based upon nominations by the Chairman of the Board, following informal consultation with the Directors. In addition, the composition of the Committee is expected to reflect the economic and geographic diversity of MIGA’s member countries. Other relevant selection criteria include seniority, continuity, and relevant experience. Some or all of the responsibilities of individual Committee members are performed by their alternates or advisors. Generally, Committee members are appointed for a two-year term; reappointment to a second term, when possible, is desirable for continuity. Audit Committee meetings are generally open to any member of the Board who wishes to attend, and non-Committee members of the Board may participate in the discussion but cannot vote. In addition, the Chairman of the Audit Committee may speak in that capacity at meetings of the Board of Directors, with respect to discussions held at the Audit Committee.
Key ResponsibilitiesThe Audit Committee has a mandate to assist the Board of Directors in overseeing MIGA’s finances, accounting, risk management, and internal controls. This mandate includes the review and oversight of MIGA’s financial statements and financial reporting related to trust funds. The Audit Committee is also responsible for recommending to the Board of Directors the appointment of the external auditor, as well as monitoring the performance and independence of the external auditor. The Audit Committee oversees the internal audit function, including reviewing the respon-sibilities, staffing, annual internal audit plan, and effectiveness of internal audit. In the execution of its role, the Committee discusses with man-agement, the external auditors, and internal auditors, financial issues and policies which have an impact on the Agency’s financial position and risk-bearing capacity. The Committee also reviews with the external auditor the financial statements prior to their publication and recommends the annual audited financial statements for approval to the Directors. The Audit Committee monitors the evolution of developments in corporate governance and encourages continuous improvement of, and adherence to MIGA’s policies, procedures, and practices.
CommunicationsThe Audit Committee communicates regularly with the full Board of Directors through distribution of the following documents:
r The minutes of its meetings. r Reports of the Audit Committee prepared by the Chairman, which document discussions held. These reports are distributed to the
Directors, Alternates Directors, World Bank Group Senior Management, and MIGA Senior Management. r “Statement(s) of the Chairman” and state¬ments issued by other members of the Audit Committee. r The Annual Report to the Board of Directors, which provides an overview of the main issues addressed by the committee over the year.
The Audit Committee’s communications with the external auditor are described in the Auditor Independence section.
Executive SessionsUnder the Audit Committee’s Terms of Reference, members of the Audit Committee shall meet periodically in separate executive or, where spe-cifically required, closed sessions with management, the Auditor General, the External Auditor, and the Vice President for Institutional Integrity, to discuss any matters that the Committee or any of the foregoing believes should be discussed privately.
Access to Resources and to ManagementThroughout the year, the Audit Committee receives a large volume of information, with respect to the financial position, financial statement presentations, risk assessment, and risk management, as well as matters regarding governance and controls. The Audit Committee meets both formally and informally throughout the year to discuss finance, accounting, risk management, and internal controls matters. The Directors have unrestricted access to management. The Audit Committee reviews and discusses with management the quarterly and annual financial statements. The committee also reviews with the external auditor the financial statements prior to their publication and recommends these for approval to the Board of Directors.
The Audit Committee has the capacity, under exceptional circumstances, to obtain advice and assistance from outside legal, accounting, or other advisors as deemed appropriate.
Code of Conduct and Business Conduct FrameworkStaff members’ ethical obligations to the institution are embodied in its Core values and Principles of Staff Employment. As a member organi-zation, MIGA has adopted the updated World Bank Group Code of Conduct, LivingourValues (the Code), which is a practical guide to assist staff in making the Bank Group’s Core Values a part of what staff does every day. The Code applies to all staff worldwide and is available on IBRD’s website, www.worldbank.org. All MIGA staff have completed the mandatory training course which includes an acknowledgement from staff to abide by the tenets of the Code.
In addition to the Code, the business conduct obligations of staff are articulated in the Staff Manual (Principles of Staff Employment, Staff Rules), Administrative Manual, and other guidelines. The Principles and Staff Rules require that all staff avoid or properly manage conflicts of interest. To protect individual staff in MIGA from apparent and real (potential or actual) conflicts of interest, senior managers are required to complete an annual financial disclosure statement with the Office of Ethics and Business Conduct.
Guidance for staff is also provided through programs, training materials, and other resources. Managers are responsible for ensuring that internal systems, policies, and procedures are consistently aligned with MIGA’s business conduct framework. The following World Bank Group units assist in communicating business conduct expectations to staff:
r The Office of Ethics and Business Conduct (EBC) provides leadership, management and oversight for MIGA’s ethics infrastructure including the Ethics HelpLine, a consolidated conflicts of interest disclosure/resolution system, financial disclosure, ongoing training to both internal and external audi-ences, and communication resources. This office has the mandate to review and assist in the resolution of allegations of staff misconduct.
r The Integrity Vice Presidency (INT) is charged with investigating allegations of fraud and corruption in projects benefiting from World Bank Group funding or guarantees. It also trains and educates staff and clients in detecting and reporting fraud and corruption.
Both EBC and INT report directly to the President and is composed of professionals from a range of disciplines including financial analysts, re-searchers, investigators, lawyers, prosecutors, forensic accountants, and staff with operational experience across the World Bank Group. These units maintain comprehensive websites to provide guidance on how to handle concerns.
Auditor IndependenceThe appointment of the external auditor of MIGA is governed by a set of Board-approved principles. Key features of those principles include:
r Prohibition of the external auditor from the provision of all non-audit related services r All audit-related services must be pre-approved on a case-by-case basis by the Board of Directors, upon recommendation by the Audit Com-
mittee r Mandatory rebidding of the external audit contract every five years, with a limitation of two consecutive terms and mandatory rotation
thereafter r An evaluation of the performance of the external auditor at the mid-point of the five year term.
The external auditor is appointed to a five-year term of service. This is subject to annual reappointment based on the recommendation of the Audit Committee and approval of a resolution by the Directors.
As standard practice, the external auditor is invited as an observer to attend all Audit Committee meetings and is frequently asked to present its perspective on issues. In addition, the Audit Committee meets periodically with the external auditor in private sessions without the presence of management. Communication between the external auditor and the Audit Committee is ongoing, as frequently as is deemed necessary by either party. MIGA’s external auditors follow the communication requirements with audit committees set out under US Generally Accepted Auditing Standards and International Standards on Auditing. In keeping with these standards, significant formal communications include:
r Quarterly and annual financial statement reporting r Annual appointment of the external auditors r Presentation of the external audit plan r Presentation of control recommendations and discussion of the Internal Control over Financial Reporting (ICFR) attestation and report r Presentation of a statement regarding independence
In addition to committee meetings, individual members of the Audit Committee have independent access to the external auditor.
Internal Control
Internal Control Over Financial ReportingManagement makes an annual assertion whether, as of June 30 of each fiscal year, the organization’s system of internal control over its external financial reporting has met the criteria for effective internal control over external financial reporting as described in the 1992 InternalControl–IntegratedFramework issued by The Committee of the Sponsoring Organizations of the Treadway Commission (COSO).6
Concurrently, MIGA’s external auditor provides an attestation report on whether Management’s assertion regarding the effectiveness of internal control over external financial reporting is fairly stated in all material respects.
6 COSOwasformedin1985tosponsortheNationalCommissiononFraudulentFinancialReporting,anindependentprivate-sectorinitiativewhichstudiedthecasualfactorsthatcanleadtofraudulentfinancialreporting.In1992,COSOissueditsInternalControl-IntegratedFramework,whichprovidedacommondefinitionofinternalcontrolandguidanceonjudgingitseffectiveness.
MIGA ANNUAL REPORT 2013 | 6968 | MIGA ANNUAL REPORT 2013
Management’s Report Regarding Effectiveness of Internal Controls Over External Financial Reporting Management’s Report Regarding Effectiveness of Internal Controls Over External Financial Reporting (cont’d)
MIGA ANNUAL REPORT 2013 | 7170 | MIGA ANNUAL REPORT 2013
Report of Independent Auditors on Management Assertion Regarding Effectiveness of Internal Controls Over External Financial Reporting
Report Of Independent Auditors on Management Assertion Regarding Effectiveness Of Internal Controls Over External Financial Reporting (cont’d)
Report of Independent Auditors on Management Assertion Regarding Effectiveness of Internal Controls Over External Financial Reporting
Independent Auditors’ Report
President and Board of Directors Multilateral Investment Guarantee Agency:
We have examined management’s assertion, included in the accompanying Management’s Report Regarding Effectiveness of Internal Control Over External Financial Reporting, that the Multilateral Investment Guarantee Agency (MIGA) maintained effective internal control over financial reporting as of June 30, 2013, based on criteria established in the 1992 Internal Control – Integrated Framework issued by the Committee of Sponsoring Organizations of the Treadway Commission (COSO). MIGA’s management is responsible for maintaining effective internal control over financial reporting, and for its assertion on the effectiveness of internal control over financial reporting, included in the accompanying Management’s Report Regarding Effectiveness of Internal Control Over External Financial Reporting. Our responsibility is to express an opinion on management’s assertion based on our examination.
We conducted our examination in accordance with attestation standards established by the American Institute of Certified Public Accountants. Those standards require that we plan and perform the examination to obtain reasonable assurance about whether effective internal control over financial reporting was maintained in all material respects. Our examination included obtaining an understanding of internal control over financial reporting, assessing the risk that a material weakness exists, and testing and evaluating the design and operating effectiveness of internal control based on the assessed risk. Our examination also included performing such other procedures as we considered necessary in the circumstances. We believe that our examination provides a reasonable basis for our opinion.
An entity’s internal control over financial reporting is a process effected by those charged with governance, management, and other personnel, designed to provide reasonable assurance regarding the preparation of reliable financial statements in accordance with accounting principles generally accepted in the United States of America and International Financial Reporting Standards as issued by the International Accounting Standards Board. An entity’s internal control over financial reporting includes those policies and procedures that (1) pertain to the maintenance of records that, in reasonable detail, accurately and fairly reflect the transactions and dispositions of the assets of the entity; (2) provide reasonable assurance that transactions are recorded as necessary to permit preparation of financial statements in accordance with accounting principles generally accepted in the United States of America and International Financial Reporting Standards as issued by the International Accounting Standards Board, and that receipts and expenditures of the entity are being made only in accordance with authorizations of management and those charged with governance; and (3) provide reasonable assurance regarding prevention, or timely detection and correction of unauthorized acquisition, use, or disposition of the entity’s assets that could have a material effect on the financial statements.
Because of its inherent limitations, internal control over financial reporting may not prevent, or detect and correct misstatements. Also, projections of any evaluation of effectiveness to future periods are subject to the risk that controls may become inadequate because of changes in conditions, or that the degree of compliance with the policies or procedures may deteriorate.
KPMG LLPSuite 120001801 K Street, NW Washington, DC 20006
KPMG LLP is a Delaware limited liability partnership,the U.S. member firm of KPMG International Cooperative(“KPMG International”), a Swiss entity.
Multilateral Investment Guarantee AgencyAugust 7, 2013
In our opinion, management’s assertion that MIGA maintained effective internal control over financial reporting as of June 30, 2013 is fairly stated, in all material respects, based on criteria established in the1992 Internal Control – Integrated Framework issued by the Committee of Sponsoring Organizations of the Treadway Commission (COSO).
We also have audited, in accordance with auditing standards generally accepted in the United States of America and International Standards on Auditing, the financial statements of MIGA, which comprise the balance sheets as of June 30, 2013 and 2012, and the related statements of operations, comprehensive income, changes in shareholders’ equity, and cash flows for the years then ended, and our report dated August 7, 2013 expressed an unqualified opinion on those financial statements.
Washington, D.C. August 7, 2013
MIGA ANNUAL REPORT 2013 | 7372 | MIGA ANNUAL REPORT 2013
Independent Auditors’ Report Independent Auditors’ Report (cont’d)
Independent Auditors’ Report
President and Board of DirectorsMultilateral Investment Guarantee Agency:
Report on the Financial Statements
We have audited the accompanying financial statements of the Multilateral Investment Guarantee Agency (MIGA), which comprise the balance sheets as of June 30, 2013 and 2012, and the related statements of operations, comprehensive income, changes in shareholders’ equity, and cash flows for the years then ended, and the related notes to the financial statements.
Management’s Responsibility for the Financial Statements
Management is responsible for the preparation and fair presentation of these financial statements in accordance with accounting principles generally accepted in the United States of America and International Financial Reporting Standards as issued by the International Accounting Standards Board; this includes the design, implementation, and maintenance of internal control relevant to the preparation and fair presentation of financial statements that are free from material misstatement, whether due to fraud or error.
Auditors’ Responsibility
Our responsibility is to express an opinion on these financial statements based on our audits. We conducted our audits in accordance with auditing standards generally accepted in the United States of America and in accordance with International Standards on Auditing. Those standards require that we plan and perform the audit to obtain reasonable assurance about whether the financial statements are free from material misstatement.
An audit involves performing procedures to obtain audit evidence about the amounts and disclosures in the financial statements. The procedures selected depend on the auditors’ judgment, including the assessment of the risks of material misstatement of the financial statements, whether due to fraud or error. In making those risk assessments, the auditor considers internal control relevant to the entity’s preparation and fair presentation of the financial statements in order to design audit procedures that are appropriate in the circumstances. An audit also includes evaluating the appropriateness of accounting policies used and the reasonableness of significant accounting estimates made by management, as well as evaluating the overall presentation of the financial statements.
We believe that the audit evidence we have obtained is sufficient and appropriate to provide a basis for our audit opinion.
Opinion
In our opinion, the financial statements referred to above present fairly, in all material respects, the financial position of MIGA as of June 30, 2013 and 2012, and the results of its operations and its cash flows for the years then ended in accordance with accounting principles generally accepted in the United States of America and International Financial Reporting Standards as issued by the International Accounting Standards Board.
KPMG LLPSuite 120001801 K Street, NW Washington, DC 20006
KPMG LLP is a Delaware limited liability partnership,the U.S. member firm of KPMG International Cooperative(“KPMG International”), a Swiss entity.
Other Matters
Our audit was conducted for the purpose of forming an opinion on the financial statements as a whole. The statement of subscriptions to capital stock and voting power and the statement of guarantees outstanding asof June 30, 2013 are presented for purposes of additional analysis and are not a required part of the financial statements. Such information is the responsibility of management and was derived from and relates directly to the underlying accounting and other records used to prepare the financial statements. The information has been subjected to the auditing procedures applied in the audit of the financial statements and certain additional procedures, including comparing and reconciling such information directly to the underlying accounting and other records used to prepare the financial statements or to the financial statements themselves, and other additional procedures in accordance with auditing standards generally accepted in the United States of America and International Standards on Auditing. In our opinion, the information is fairly stated in all material respects in relation to the financial statements as a whole.
We also have examined in accordance with attestation standards established by the American Institute of Certified Public Accountants, management’s assertion, included in the accompanying Management’s Report Regarding Effectiveness of Internal Control Over External Financial Reporting, that MIGA maintained effective internal control over financial reporting as of June 30, 2013, based on criteria established in the 1992 Internal Control – Integrated Framework issued by the Committee of Sponsoring Organizations of the Treadway Commission (COSO) and our report dated August 7, 2013 expressed an unqualified opinion on management’s assertion.
Washington, D.C. August 7, 2013
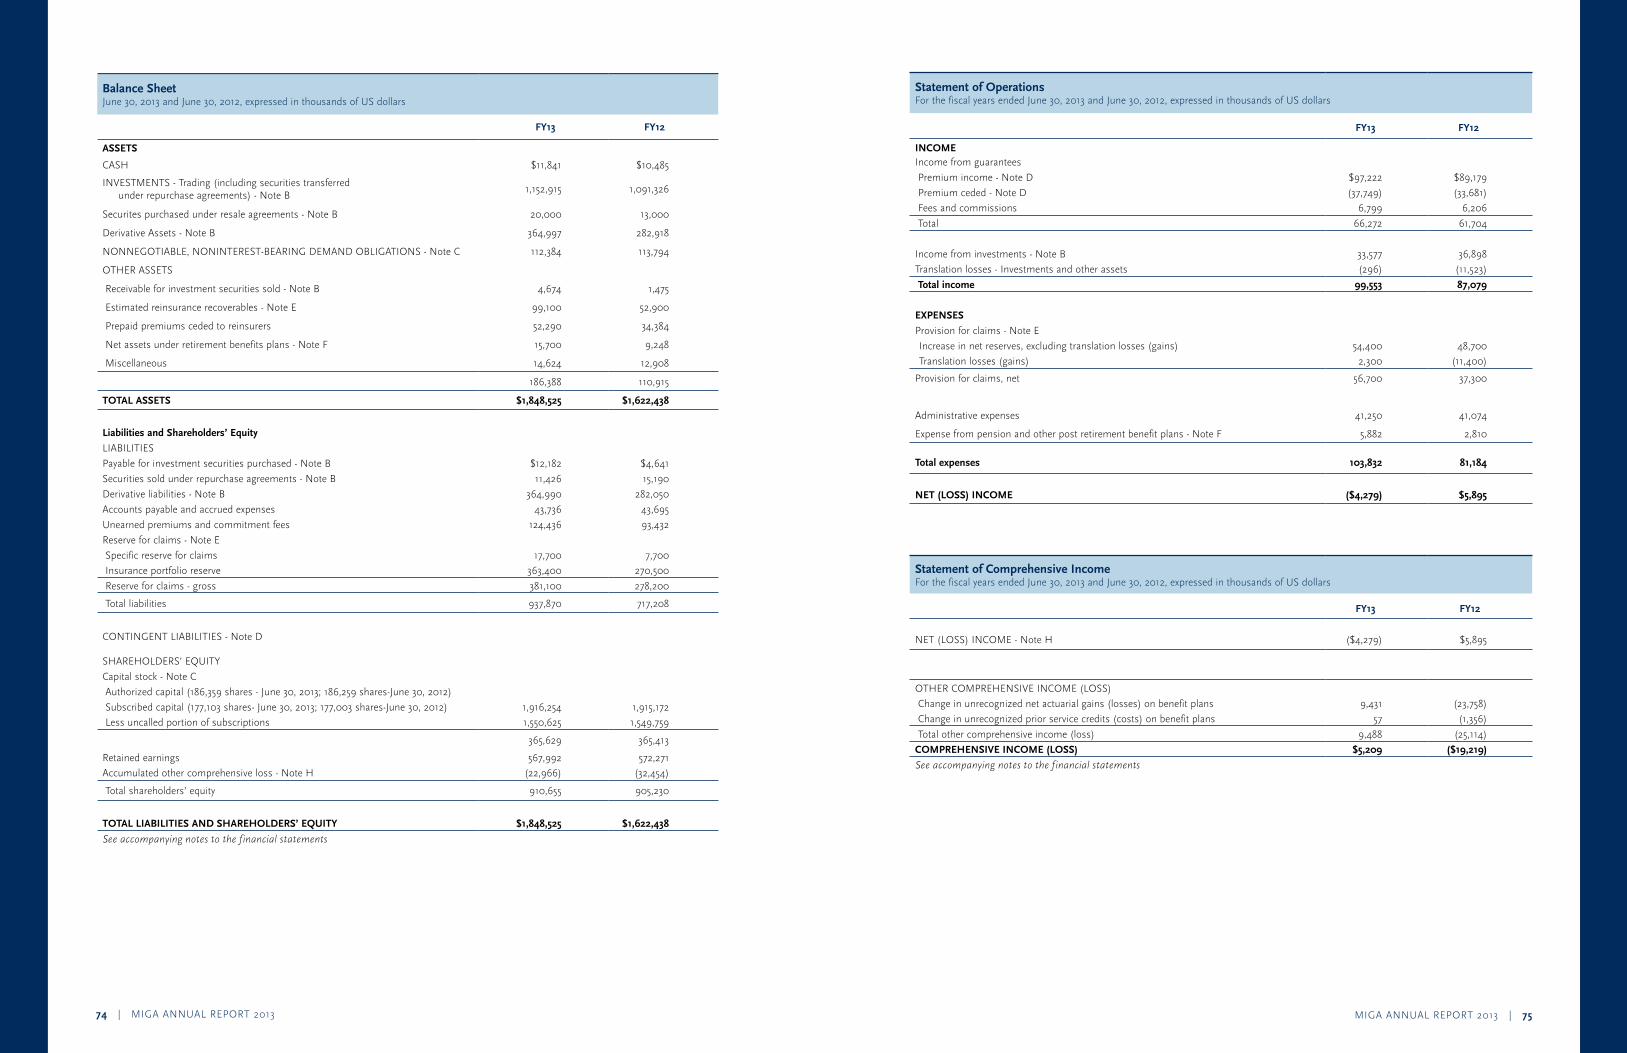
MIGA ANNUAL REPORT 2013 | 7574 | MIGA ANNUAL REPORT 2013
Statement of Operations For the fiscal years ended June 30, 2013 and June 30, 2012, expressed in thousands of US dollars
FY13 FY12
INCOMEIncome from guarantees
Premium income - Note D $97,222 $89,179
Premium ceded - Note D (37,749) (33,681)
Fees and commissions 6,799 6,206
Total 66,272 61,704
Income from investments - Note B 33,577 36,898
Translation losses - Investments and other assets (296) (11,523)
Total income 99,553 87,079
EXPENSES
Provision for claims - Note E
Increase in net reserves, excluding translation losses (gains) 54,400 48,700
Translation losses (gains) 2,300 (11,400)
Provision for claims, net 56,700 37,300
Administrative expenses 41,250 41,074
Expense from pension and other post retirement benefit plans - Note F 5,882 2,810
Total expenses 103,832 81,184
NET (LOSS) INCOME ($4,279) $5,895
Statement of Comprehensive Income For the fiscal years ended June 30, 2013 and June 30, 2012, expressed in thousands of US dollars
FY13 FY12
NET (LOSS) INCOME - Note H ($4,279) $5,895
OTHER COMPREHENSIVE INCOME (LOSS)
Change in unrecognized net actuarial gains (losses) on benefit plans 9,431 (23,758)
Change in unrecognized prior service credits (costs) on benefit plans 57 (1,356)
Total other comprehensive income (loss) 9,488 (25,114)
COMPREHENSIVE INCOME (LOSS) $5,209 ($19,219)
Seeaccompanyingnotestothefinancialstatements
Balance Sheet June 30, 2013 and June 30, 2012, expressed in thousands of US dollars
FY13 FY12
ASSETS
CASH $11,841 $10,485
INVESTMENTS - Trading (including securities transferred under repurchase agreements) - Note B
1,152,915 1,091,326
Securites purchased under resale agreements - Note B 20,000 13,000
Derivative Assets - Note B 364,997 282,918
NONNEGOTIABLE, NONINTEREST-BEARING DEMAND OBLIGATIONS - Note C 112,384 113,794
OTHER ASSETS
Receivable for investment securities sold - Note B 4,674 1,475
Estimated reinsurance recoverables - Note E 99,100 52,900
Prepaid premiums ceded to reinsurers 52,290 34,384
Net assets under retirement benefits plans - Note F 15,700 9,248
Miscellaneous 14,624 12,908
186,388 110,915
TOTAL ASSETS $1,848,525 $1,622,438
Liabilities and Shareholders’ Equity
LIABILITIES
Payable for investment securities purchased - Note B $12,182 $4,641
Securities sold under repurchase agreements - Note B 11,426 15,190
Derivative liabilities - Note B 364,990 282,050
Accounts payable and accrued expenses 43,736 43,695
Unearned premiums and commitment fees 124,436 93,432
Reserve for claims - Note E
Specific reserve for claims 17,700 7,700
Insurance portfolio reserve 363,400 270,500
Reserve for claims - gross 381,100 278,200
Total liabilities 937,870 717,208
CONTINGENT LIABILITIES - Note D
SHAREHOLDERS’ EQUITY
Capital stock - Note C
Authorized capital (186,359 shares - June 30, 2013; 186,259 shares-June 30, 2012)
Subscribed capital (177,103 shares- June 30, 2013; 177,003 shares-June 30, 2012) 1,916,254 1,915,172
Less uncalled portion of subscriptions 1,550,625 1,549,759
365,629 365,413
Retained earnings 567,992 572,271
Accumulated other comprehensive loss - Note H (22,966) (32,454)
Total shareholders’ equity 910,655 905,230
TOTAL LIABILITIES AND SHAREHOLDERS’ EQUITY $1,848,525 $1,622,438
Seeaccompanyingnotestothefinancialstatements
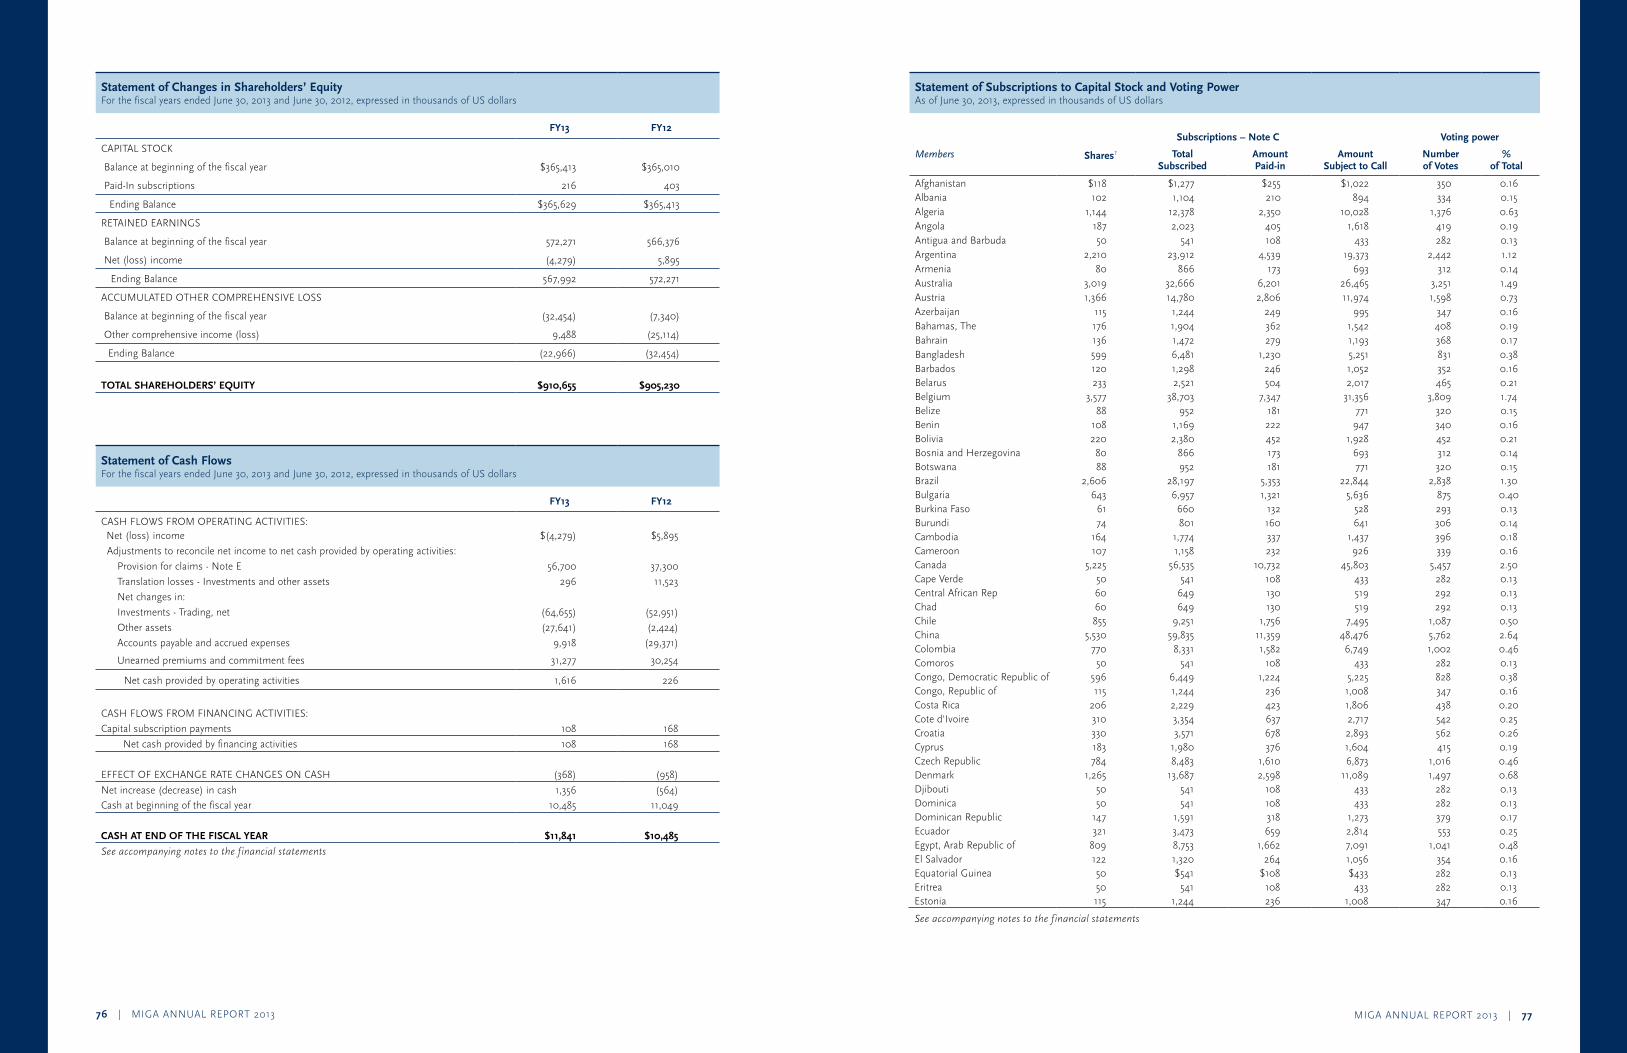
MIGA ANNUAL REPORT 2013 | 7776 | MIGA ANNUAL REPORT 2013
Statement of Subscriptions to Capital Stock and Voting Power As of June 30, 2013, expressed in thousands of US dollars
Subscriptions – Note C Voting power
Members Shares1 Total Subscribed
Amount Paid-in
Amount Subject to Call
Numberof Votes
% of Total
Afghanistan $118 $1,277 $255 $1,022 350 0.16 Albania 102 1,104 210 894 334 0.15 Algeria 1,144 12,378 2,350 10,028 1,376 0.63 Angola 187 2,023 405 1,618 419 0.19 Antigua and Barbuda 50 541 108 433 282 0.13 Argentina 2,210 23,912 4,539 19,373 2,442 1.12 Armenia 80 866 173 693 312 0.14 Australia 3,019 32,666 6,201 26,465 3,251 1.49 Austria 1,366 14,780 2,806 11,974 1,598 0.73 Azerbaijan 115 1,244 249 995 347 0.16 Bahamas, The 176 1,904 362 1,542 408 0.19 Bahrain 136 1,472 279 1,193 368 0.17 Bangladesh 599 6,481 1,230 5,251 831 0.38 Barbados 120 1,298 246 1,052 352 0.16 Belarus 233 2,521 504 2,017 465 0.21 Belgium 3,577 38,703 7,347 31,356 3,809 1.74 Belize 88 952 181 771 320 0.15 Benin 108 1,169 222 947 340 0.16 Bolivia 220 2,380 452 1,928 452 0.21 Bosnia and Herzegovina 80 866 173 693 312 0.14 Botswana 88 952 181 771 320 0.15 Brazil 2,606 28,197 5,353 22,844 2,838 1.30 Bulgaria 643 6,957 1,321 5,636 875 0.40 Burkina Faso 61 660 132 528 293 0.13 Burundi 74 801 160 641 306 0.14 Cambodia 164 1,774 337 1,437 396 0.18 Cameroon 107 1,158 232 926 339 0.16 Canada 5,225 56,535 10,732 45,803 5,457 2.50 Cape Verde 50 541 108 433 282 0.13 Central African Rep 60 649 130 519 292 0.13 Chad 60 649 130 519 292 0.13 Chile 855 9,251 1,756 7,495 1,087 0.50 China 5,530 59,835 11,359 48,476 5,762 2.64 Colombia 770 8,331 1,582 6,749 1,002 0.46 Comoros 50 541 108 433 282 0.13 Congo, Democratic Republic of 596 6,449 1,224 5,225 828 0.38 Congo, Republic of 115 1,244 236 1,008 347 0.16 Costa Rica 206 2,229 423 1,806 438 0.20 Cote d'Ivoire 310 3,354 637 2,717 542 0.25 Croatia 330 3,571 678 2,893 562 0.26 Cyprus 183 1,980 376 1,604 415 0.19 Czech Republic 784 8,483 1,610 6,873 1,016 0.46 Denmark 1,265 13,687 2,598 11,089 1,497 0.68 Djibouti 50 541 108 433 282 0.13 Dominica 50 541 108 433 282 0.13 Dominican Republic 147 1,591 318 1,273 379 0.17 Ecuador 321 3,473 659 2,814 553 0.25 Egypt, Arab Republic of 809 8,753 1,662 7,091 1,041 0.48 El Salvador 122 1,320 264 1,056 354 0.16 Equatorial Guinea 50 $541 $108 $433 282 0.13 Eritrea 50 541 108 433 282 0.13 Estonia 115 1,244 236 1,008 347 0.16
Seeaccompanyingnotestothefinancialstatements
Statement of Changes in Shareholders’ Equity For the fiscal years ended June 30, 2013 and June 30, 2012, expressed in thousands of US dollars
FY13 FY12
CAPITAL STOCK
Balance at beginning of the fiscal year $365,413 $365,010
Paid-In subscriptions 216 403
Ending Balance $365,629 $365,413
RETAINED EARNINGS
Balance at beginning of the fiscal year 572,271 566,376
Net (loss) income (4,279) 5,895
Ending Balance 567,992 572,271
ACCUMULATED OTHER COMPREHENSIVE LOSS
Balance at beginning of the fiscal year (32,454) (7,340)
Other comprehensive income (loss) 9,488 (25,114)
Ending Balance (22,966) (32,454)
TOTAL SHAREHOLDERS’ EQUITY $910,655 $905,230
Statement of Cash Flows For the fiscal years ended June 30, 2013 and June 30, 2012, expressed in thousands of US dollars
FY13 FY12
CASH FLOWS FROM OPERATING ACTIVITIES:Net (loss) income $(4,279) $5,895
Adjustments to reconcile net income to net cash provided by operating activities:
Provision for claims - Note E 56,700 37,300
Translation losses - Investments and other assets 296 11,523
Net changes in:
Investments - Trading, net (64,655) (52,951)
Other assets (27,641) (2,424)
Accounts payable and accrued expenses 9,918 (29,371)
Unearned premiums and commitment fees 31,277 30,254
Net cash provided by operating activities 1,616 226
CASH FLOWS FROM FINANCING ACTIVITIES:
Capital subscription payments 108 168
Net cash provided by financing activities 108 168
EFFECT OF EXCHANGE RATE CHANGES ON CASH (368) (958)
Net increase (decrease) in cash 1,356 (564)
Cash at beginning of the fiscal year 10,485 11,049
CASH AT END OF THE FISCAL YEAR $11,841 $10,485
Seeaccompanyingnotestothefinancialstatements
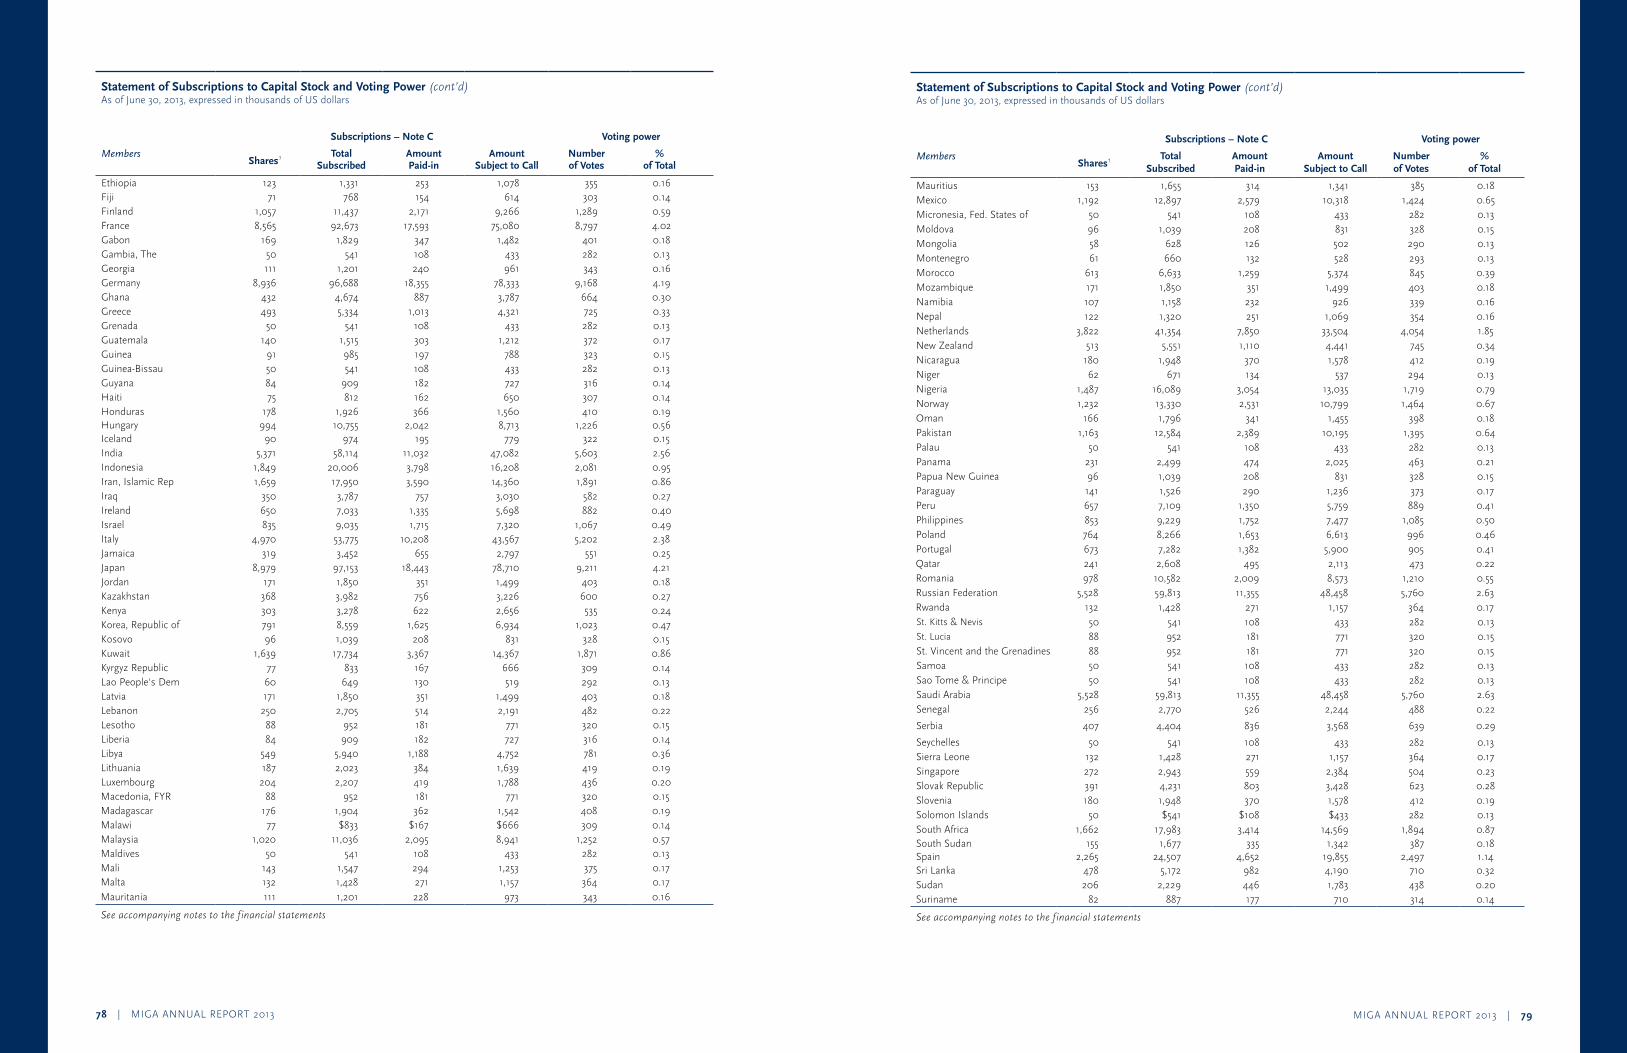
MIGA ANNUAL REPORT 2013 | 7978 | MIGA ANNUAL REPORT 2013
Statement of Subscriptions to Capital Stock and Voting Power (cont’d) As of June 30, 2013, expressed in thousands of US dollars
Subscriptions – Note C Voting power
MembersShares1 Total
SubscribedAmount Paid-in
Amount Subject to Call
Numberof Votes
% of Total
Mauritius 153 1,655 314 1,341 385 0.18 Mexico 1,192 12,897 2,579 10,318 1,424 0.65 Micronesia, Fed. States of 50 541 108 433 282 0.13 Moldova 96 1,039 208 831 328 0.15 Mongolia 58 628 126 502 290 0.13 Montenegro 61 660 132 528 293 0.13 Morocco 613 6,633 1,259 5,374 845 0.39 Mozambique 171 1,850 351 1,499 403 0.18 Namibia 107 1,158 232 926 339 0.16 Nepal 122 1,320 251 1,069 354 0.16 Netherlands 3,822 41,354 7,850 33,504 4,054 1.85 New Zealand 513 5,551 1,110 4,441 745 0.34 Nicaragua 180 1,948 370 1,578 412 0.19 Niger 62 671 134 537 294 0.13 Nigeria 1,487 16,089 3,054 13,035 1,719 0.79 Norway 1,232 13,330 2,531 10,799 1,464 0.67 Oman 166 1,796 341 1,455 398 0.18 Pakistan 1,163 12,584 2,389 10,195 1,395 0.64 Palau 50 541 108 433 282 0.13 Panama 231 2,499 474 2,025 463 0.21 Papua New Guinea 96 1,039 208 831 328 0.15 Paraguay 141 1,526 290 1,236 373 0.17 Peru 657 7,109 1,350 5,759 889 0.41 Philippines 853 9,229 1,752 7,477 1,085 0.50 Poland 764 8,266 1,653 6,613 996 0.46 Portugal 673 7,282 1,382 5,900 905 0.41 Qatar 241 2,608 495 2,113 473 0.22 Romania 978 10,582 2,009 8,573 1,210 0.55 Russian Federation 5,528 59,813 11,355 48,458 5,760 2.63 Rwanda 132 1,428 271 1,157 364 0.17 St. Kitts & Nevis 50 541 108 433 282 0.13 St. Lucia 88 952 181 771 320 0.15 St. Vincent and the Grenadines 88 952 181 771 320 0.15 Samoa 50 541 108 433 282 0.13 Sao Tome & Principe 50 541 108 433 282 0.13 Saudi Arabia 5,528 59,813 11,355 48,458 5,760 2.63 Senegal 256 2,770 526 2,244 488 0.22
Serbia 407 4,404 836 3,568 639 0.29
Seychelles 50 541 108 433 282 0.13 Sierra Leone 132 1,428 271 1,157 364 0.17 Singapore 272 2,943 559 2,384 504 0.23 Slovak Republic 391 4,231 803 3,428 623 0.28 Slovenia 180 1,948 370 1,578 412 0.19 Solomon Islands 50 $541 $108 $433 282 0.13 South Africa 1,662 17,983 3,414 14,569 1,894 0.87 South Sudan 155 1,677 335 1,342 387 0.18 Spain 2,265 24,507 4,652 19,855 2,497 1.14 Sri Lanka 478 5,172 982 4,190 710 0.32 Sudan 206 2,229 446 1,783 438 0.20 Suriname 82 887 177 710 314 0.14
Seeaccompanyingnotestothefinancialstatements
Statement of Subscriptions to Capital Stock and Voting Power (cont’d) As of June 30, 2013, expressed in thousands of US dollars
Subscriptions – Note C Voting power
MembersShares1 Total
SubscribedAmount Paid-in
Amount Subject to Call
Numberof Votes
% of Total
Ethiopia 123 1,331 253 1,078 355 0.16 Fiji 71 768 154 614 303 0.14 Finland 1,057 11,437 2,171 9,266 1,289 0.59 France 8,565 92,673 17,593 75,080 8,797 4.02 Gabon 169 1,829 347 1,482 401 0.18 Gambia, The 50 541 108 433 282 0.13 Georgia 111 1,201 240 961 343 0.16 Germany 8,936 96,688 18,355 78,333 9,168 4.19 Ghana 432 4,674 887 3,787 664 0.30 Greece 493 5,334 1,013 4,321 725 0.33 Grenada 50 541 108 433 282 0.13 Guatemala 140 1,515 303 1,212 372 0.17 Guinea 91 985 197 788 323 0.15 Guinea-Bissau 50 541 108 433 282 0.13 Guyana 84 909 182 727 316 0.14 Haiti 75 812 162 650 307 0.14 Honduras 178 1,926 366 1,560 410 0.19 Hungary 994 10,755 2,042 8,713 1,226 0.56 Iceland 90 974 195 779 322 0.15 India 5,371 58,114 11,032 47,082 5,603 2.56 Indonesia 1,849 20,006 3,798 16,208 2,081 0.95 Iran, Islamic Rep 1,659 17,950 3,590 14,360 1,891 0.86 Iraq 350 3,787 757 3,030 582 0.27 Ireland 650 7,033 1,335 5,698 882 0.40 Israel 835 9,035 1,715 7,320 1,067 0.49 Italy 4,970 53,775 10,208 43,567 5,202 2.38 Jamaica 319 3,452 655 2,797 551 0.25 Japan 8,979 97,153 18,443 78,710 9,211 4.21 Jordan 171 1,850 351 1,499 403 0.18 Kazakhstan 368 3,982 756 3,226 600 0.27 Kenya 303 3,278 622 2,656 535 0.24 Korea, Republic of 791 8,559 1,625 6,934 1,023 0.47 Kosovo 96 1,039 208 831 328 0.15 Kuwait 1,639 17,734 3,367 14,367 1,871 0.86 Kyrgyz Republic 77 833 167 666 309 0.14 Lao People's Dem 60 649 130 519 292 0.13 Latvia 171 1,850 351 1,499 403 0.18 Lebanon 250 2,705 514 2,191 482 0.22 Lesotho 88 952 181 771 320 0.15 Liberia 84 909 182 727 316 0.14 Libya 549 5,940 1,188 4,752 781 0.36 Lithuania 187 2,023 384 1,639 419 0.19 Luxembourg 204 2,207 419 1,788 436 0.20 Macedonia, FYR 88 952 181 771 320 0.15 Madagascar 176 1,904 362 1,542 408 0.19 Malawi 77 $833 $167 $666 309 0.14 Malaysia 1,020 11,036 2,095 8,941 1,252 0.57 Maldives 50 541 108 433 282 0.13 Mali 143 1,547 294 1,253 375 0.17 Malta 132 1,428 271 1,157 364 0.17 Mauritania 111 1,201 228 973 343 0.16
Seeaccompanyingnotestothefinancialstatements

MIGA ANNUAL REPORT 2013 | 8180 | MIGA ANNUAL REPORT 2013
Statement of Guarantees Outstanding As of June 30, 2013, expressed in thousands of US dollars
Gross Exposure – Note D
Host Country US Dollars
Euro Swiss Franc
British Pound
Total Reinsurance – Note D
NetExposure
Afghanistan $151,943 $- $- $- $151,943 $48,676 $103,266 Albania 1,565 183,468 - - 185,033 79,008 106,025 Algeria - - - - - - - Angola 12,900 511,829 - - 524,729 447,180 77,549 Argentina - - - - - - - Armenia - 3,724 - - 3,724 - 3,724 Bangladesh 329,637 - - - 329,637 179,326 150,310 Benin 1,026 7,704 - - 8,730 103 8,627 Bolivia 10,777 - - - 10,777 - 10,777 Bosnia and Herzegovina - 96,781 - - 96,781 - 96,781 Botswana 5,000 - - - 5,000 - 5,000 Brazil - - - - - - - Bulgaria - 104,875 - - 104,875 52,437 52,437 Burkina Faso - 652 - - 652 65 587 Burundi - 665 - - 665 - 665 Cameroon - 6,718 - - 6,718 - 6,718 Central African Republic - 31,367 - - 31,367 - 31,367 China 50,583 - - - 50,583 2,821 47,762 Colombia - 2,607 - - 2,607 - 2,607 Congo, Democratic Republic of
25,150 4,966 - - 30,116 - 30,116
Congo, Republic of - 5,043 - - 5,043 - 5,043 Costa Rica 126,074 - - - 126,074 73,810 52,264 Cote d'Ivoire 674,345 77,092 - - 751,437 479,746 271,691 Croatia - 934,391 - - 934,391 533,821 400,570 Djibouti 177,332 - - - 177,332 107,273 70,059 Dominican Republic 99,635 - - - 99,635 14,945 84,690 Ecuador 11,092 - - - 11,092 - 11,092 Egypt, Arab Republic of 150,000 - - - 150,000 50,000 100,000 El Salvador 46,587 - - - 46,587 - 46,587 Ethiopia 13,344 - - 2,742 16,086 - 16,085 Gabon - 7,540 - - 7,540 - 7,540 Georgia 24,262 - - - 24,262 - 24,262 Ghana 340,035 1,638 - - 341,672 32,231 309,441 Guinea - 51,865 - - 51,865 5,186 46,678 Guinea-Bissau - 11,324 - - 11,324 1,132 10,192 Honduras - 6,207 - - 6,207 - 6,207 Hungary - 248,283 - - 248,283 56,978 191,305 Indonesia 524,333 - - - 524,333 246,370 277,963 Iran, Islamic Republic of 81,852 - - - 81,852 8,185 73,666 Iraq 2,514 - - - 2,514 - 2,514 Jamaica 64,358 - - - 64,358 12,872 51,487 Jordan 212,922 - - - 212,922 79,800 133,122 Kazakhstan 2,264 - - - 2,264 - 2,264 Kenya 194,667 57,245 - - 251,912 34,785 217,126 Kosovo - 49,657 - - 49,657 - 49,657 Kyrgyz Republic 5,763 - - - 5,763 - 5,763 Lao People's Democratic Republic
65,553 - - - 65,553 32,777 32,777
Latvia - 155,177 - - 155,177 - 155,177 Liberia - - - - - - - Libya - 9,931 - - 9,931 - 9,931 Macedonia, FYR - 12,414 - - 12,414 - 12,414
Madagascar - 15,714 - - 15,714 - 15,714
Seeaccompanyingnotestothefinancialstatements
Statement of Subscriptions to Capital Stock and Voting Power (cont’d) As of June 30, 2013, expressed in thousands of US dollars
Subscriptions – Note C Voting power
Members Shares1 Total Subscribed
Amount Paid-in
Amount Subject to Call
Numberof Votes
% of Total
Swaziland 58 628 126 502 290 0.13 Sweden 1,849 20,006 3,798 16,208 2,081 0.95 Switzerland 2,643 28,597 5,429 23,168 2,875 1.32 Syrian Arab Republic 296 3,203 608 2,595 528 0.24 Tajikistan 130 1,407 267 1,140 362 0.17 Tanzania 248 2,683 509 2,174 480 0.22 Thailand 742 8,028 1,524 6,504 974 0.45 Timor-Leste 50 541 108 433 282 0.13 Togo 77 833 167 666 309 0.14 Trinidad and Tobago 358 3,874 735 3,139 590 0.27 Tunisia 275 2,976 565 2,411 507 0.23 Turkey 814 8,807 1,672 7,135 1,046 0.48 Turkmenistan 66 714 143 571 298 0.14 Uganda 233 2,521 479 2,042 465 0.21 Ukraine 1,346 14,564 2,765 11,799 1,578 0.72 United Arab Emirates 656 7,098 1,347 5,751 888 0.41 United Kingdom 8,565 92,673 17,593 75,080 8,797 4.02 United States 32,564 352,342 67,406 284,936 32,796 15.00 Uruguay 202 2,186 437 1,749 434 0.20 Uzbekistan 175 1,894 379 1,515 407 0.19 Vanuatu 50 541 108 433 282 0.13 Venezuela, R.B. de 1,427 15,440 3,088 12,352 1,659 0.76 Vietnam 388 4,198 797 3,401 620 0.28 Yemen, Republic of 155 1,677 335 1,342 387 0.18 Zambia 318 3,441 688 2,753 550 0.25
Zimbabwe 236 2,554 511 2,043 468 0.21
Total – June 30, 20132 177,103 $1,916,254 $365,629 $1,550,625 218,631 100.00
Total – June 30, 2012 177,003 $1,915,172 $365,413 $1,549,759 218,775 100.00
1 SubscribedsharespertainingtotheGeneralCapitalIncreaseincludeonlythosesharesforwhichthesubscriptionprocesshasbeencom-
pleted,i.e.,forwhichrequiredpaymenthasbeenreceived.2 Maydifferfromthesumofindividualfiguresshownbecauseofrounding.
Seeaccompanyingnotestothefinancialstatements
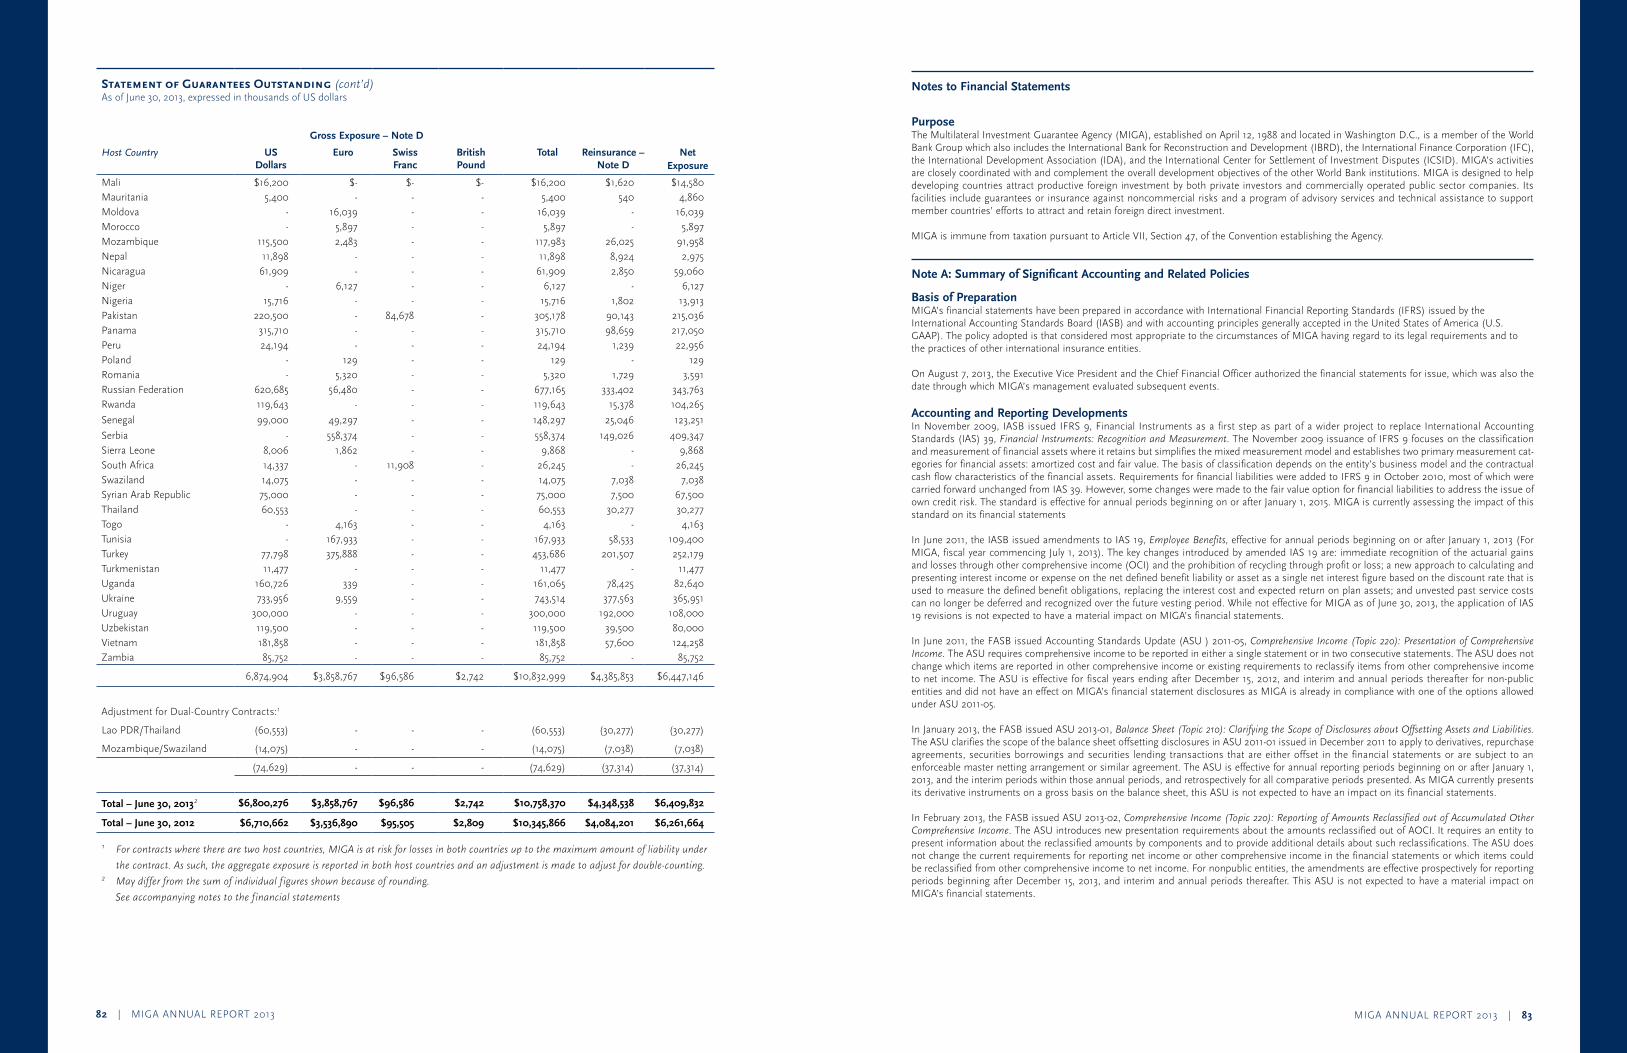
MIGA ANNUAL REPORT 2013 | 8382 | MIGA ANNUAL REPORT 2013
Notes to Financial Statements
PurposeThe Multilateral Investment Guarantee Agency (MIGA), established on April 12, 1988 and located in Washington D.C., is a member of the World Bank Group which also includes the International Bank for Reconstruction and Development (IBRD), the International Finance Corporation (IFC), the International Development Association (IDA), and the International Center for Settlement of Investment Disputes (ICSID). MIGA’s activities are closely coordinated with and complement the overall development objectives of the other World Bank institutions. MIGA is designed to help developing countries attract productive foreign investment by both private investors and commercially operated public sector companies. Its facilities include guarantees or insurance against noncommercial risks and a program of advisory services and technical assistance to support member countries’ efforts to attract and retain foreign direct investment.
MIGA is immune from taxation pursuant to Article VII, Section 47, of the Convention establishing the Agency.
Note A: Summary of Significant Accounting and Related Policies
Basis of Preparation MIGA’s financial statements have been prepared in accordance with International Financial Reporting Standards (IFRS) issued by the International Accounting Standards Board (IASB) and with accounting principles generally accepted in the United States of America (U.S. GAAP). The policy adopted is that considered most appropriate to the circumstances of MIGA having regard to its legal requirements and to the practices of other international insurance entities.
On August 7, 2013, the Executive Vice President and the Chief Financial Officer authorized the financial statements for issue, which was also the date through which MIGA’s management evaluated subsequent events.
Accounting and Reporting DevelopmentsIn November 2009, IASB issued IFRS 9, Financial Instruments as a first step as part of a wider project to replace International Accounting Standards (IAS) 39, FinancialInstruments:RecognitionandMeasurement. The November 2009 issuance of IFRS 9 focuses on the classification and measurement of financial assets where it retains but simplifies the mixed measurement model and establishes two primary measurement cat-egories for financial assets: amortized cost and fair value. The basis of classification depends on the entity’s business model and the contractual cash flow characteristics of the financial assets. Requirements for financial liabilities were added to IFRS 9 in October 2010, most of which were carried forward unchanged from IAS 39. However, some changes were made to the fair value option for financial liabilities to address the issue of own credit risk. The standard is effective for annual periods beginning on or after January 1, 2015. MIGA is currently assessing the impact of this standard on its financial statements
In June 2011, the IASB issued amendments to IAS 19, EmployeeBenefits, effective for annual periods beginning on or after January 1, 2013 (For MIGA, fiscal year commencing July 1, 2013). The key changes introduced by amended IAS 19 are: immediate recognition of the actuarial gains and losses through other comprehensive income (OCI) and the prohibition of recycling through profit or loss; a new approach to calculating and presenting interest income or expense on the net defined benefit liability or asset as a single net interest figure based on the discount rate that is used to measure the defined benefit obligations, replacing the interest cost and expected return on plan assets; and unvested past service costs can no longer be deferred and recognized over the future vesting period. While not effective for MIGA as of June 30, 2013, the application of IAS 19 revisions is not expected to have a material impact on MIGA’s financial statements.
In June 2011, the FASB issued Accounting Standards Update (ASU ) 2011-05, ComprehensiveIncome(Topic220):PresentationofComprehensiveIncome.The ASU requires comprehensive income to be reported in either a single statement or in two consecutive statements. The ASU does not change which items are reported in other comprehensive income or existing requirements to reclassify items from other comprehensive income to net income. The ASU is effective for fiscal years ending after December 15, 2012, and interim and annual periods thereafter for non-public entities and did not have an effect on MIGA’s financial statement disclosures as MIGA is already in compliance with one of the options allowed under ASU 2011-05.
In January 2013, the FASB issued ASU 2013-01, BalanceSheet(Topic210):ClarifyingtheScopeofDisclosuresaboutOffsettingAssetsandLiabilities. The ASU clarifies the scope of the balance sheet offsetting disclosures in ASU 2011-01 issued in December 2011 to apply to derivatives, repurchase agreements, securities borrowings and securities lending transactions that are either offset in the financial statements or are subject to an enforceable master netting arrangement or similar agreement. The ASU is effective for annual reporting periods beginning on or after January 1, 2013, and the interim periods within those annual periods, and retrospectively for all comparative periods presented. As MIGA currently presents its derivative instruments on a gross basis on the balance sheet, this ASU is not expected to have an impact on its financial statements.
In February 2013, the FASB issued ASU 2013-02, ComprehensiveIncome(Topic220):ReportingofAmountsReclassifiedoutofAccumulatedOtherComprehensiveIncome. The ASU introduces new presentation requirements about the amounts reclassified out of AOCI. It requires an entity to present information about the reclassified amounts by components and to provide additional details about such reclassifications. The ASU does not change the current requirements for reporting net income or other comprehensive income in the financial statements or which items could be reclassified from other comprehensive income to net income. For nonpublic entities, the amendments are effective prospectively for reporting periods beginning after December 15, 2013, and interim and annual periods thereafter. This ASU is not expected to have a material impact on MIGA’s financial statements.
Statement of Guarantees Outstanding (cont’d) As of June 30, 2013, expressed in thousands of US dollars
Gross Exposure – Note D
Host Country US Dollars
Euro Swiss Franc
British Pound
Total Reinsurance – Note D
NetExposure
Mali $16,200 $- $- $- $16,200 $1,620 $14,580 Mauritania 5,400 - - - 5,400 540 4,860 Moldova - 16,039 - - 16,039 - 16,039 Morocco - 5,897 - - 5,897 - 5,897 Mozambique 115,500 2,483 - - 117,983 26,025 91,958 Nepal 11,898 - - - 11,898 8,924 2,975 Nicaragua 61,909 - - - 61,909 2,850 59,060 Niger - 6,127 - - 6,127 - 6,127 Nigeria 15,716 - - - 15,716 1,802 13,913 Pakistan 220,500 - 84,678 - 305,178 90,143 215,036 Panama 315,710 - - - 315,710 98,659 217,050 Peru 24,194 - - - 24,194 1,239 22,956 Poland - 129 - - 129 - 129 Romania - 5,320 - - 5,320 1,729 3,591 Russian Federation 620,685 56,480 - - 677,165 333,402 343,763 Rwanda 119,643 - - - 119,643 15,378 104,265
Senegal 99,000 49,297 - - 148,297 25,046 123,251
Serbia - 558,374 - - 558,374 149,026 409,347 Sierra Leone 8,006 1,862 - - 9,868 - 9,868 South Africa 14,337 - 11,908 - 26,245 - 26,245 Swaziland 14,075 - - - 14,075 7,038 7,038 Syrian Arab Republic 75,000 - - - 75,000 7,500 67,500 Thailand 60,553 - - - 60,553 30,277 30,277 Togo - 4,163 - - 4,163 - 4,163 Tunisia - 167,933 - - 167,933 58,533 109,400 Turkey 77,798 375,888 - - 453,686 201,507 252,179 Turkmenistan 11,477 - - - 11,477 - 11,477 Uganda 160,726 339 - - 161,065 78,425 82,640 Ukraine 733,956 9,559 - - 743,514 377,563 365,951 Uruguay 300,000 - - - 300,000 192,000 108,000 Uzbekistan 119,500 - - - 119,500 39,500 80,000 Vietnam 181,858 - - - 181,858 57,600 124,258 Zambia 85,752 - - - 85,752 - 85,752
6,874,904 $3,858,767 $96,586 $2,742 $10,832,999 $4,385,853 $6,447,146
Adjustment for Dual-Country Contracts:1
Lao PDR/Thailand (60,553) - - - (60,553) (30,277) (30,277)
Mozambique/Swaziland (14,075) - - - (14,075) (7,038) (7,038)
(74,629) - - - (74,629) (37,314) (37,314)
Total – June 30, 20132 $6,800,276 $3,858,767 $96,586 $2,742 $10,758,370 $4,348,538 $6,409,832
Total – June 30, 2012 $6,710,662 $3,536,890 $95,505 $2,809 $10,345,866 $4,084,201 $6,261,664
1 Forcontractswheretherearetwohostcountries,MIGAisatriskforlossesinbothcountriesuptothemaximumamountofliabilityunder
thecontract.Assuch,theaggregateexposureisreportedinbothhostcountriesandanadjustmentismadetoadjustfordouble-counting.2 Maydifferfromthesumofindividualfiguresshownbecauseofrounding.
Seeaccompanyingnotestothefinancialstatements
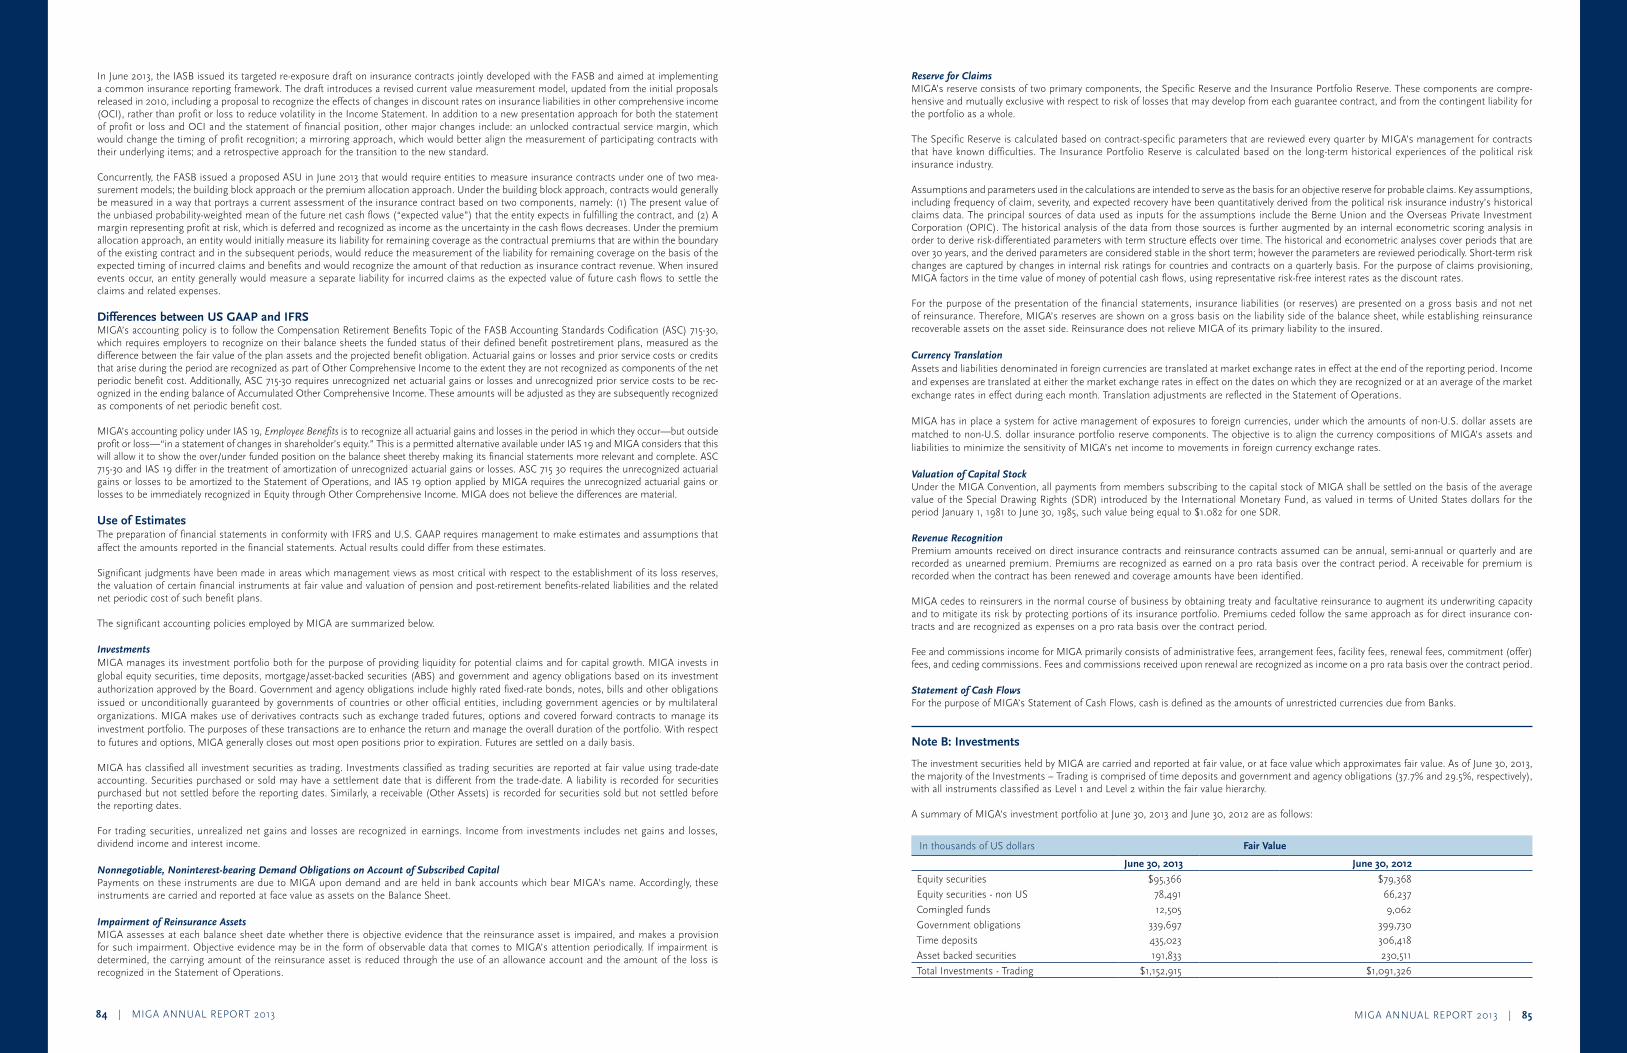
MIGA ANNUAL REPORT 2013 | 8584 | MIGA ANNUAL REPORT 2013
Reserve for ClaimsMIGA’s reserve consists of two primary components, the Specific Reserve and the Insurance Portfolio Reserve. These components are compre-hensive and mutually exclusive with respect to risk of losses that may develop from each guarantee contract, and from the contingent liability for the portfolio as a whole.
The Specific Reserve is calculated based on contract-specific parameters that are reviewed every quarter by MIGA’s management for contracts that have known difficulties. The Insurance Portfolio Reserve is calculated based on the long-term historical experiences of the political risk insurance industry.
Assumptions and parameters used in the calculations are intended to serve as the basis for an objective reserve for probable claims. Key assumptions, including frequency of claim, severity, and expected recovery have been quantitatively derived from the political risk insurance industry’s historical claims data. The principal sources of data used as inputs for the assumptions include the Berne Union and the Overseas Private Investment Corporation (OPIC). The historical analysis of the data from those sources is further augmented by an internal econometric scoring analysis in order to derive risk-differentiated parameters with term structure effects over time. The historical and econometric analyses cover periods that are over 30 years, and the derived parameters are considered stable in the short term; however the parameters are reviewed periodically. Short-term risk changes are captured by changes in internal risk ratings for countries and contracts on a quarterly basis. For the purpose of claims provisioning, MIGA factors in the time value of money of potential cash flows, using representative risk-free interest rates as the discount rates.
For the purpose of the presentation of the financial statements, insurance liabilities (or reserves) are presented on a gross basis and not net of reinsurance. Therefore, MIGA’s reserves are shown on a gross basis on the liability side of the balance sheet, while establishing reinsurance recoverable assets on the asset side. Reinsurance does not relieve MIGA of its primary liability to the insured.
Currency Translation Assets and liabilities denominated in foreign currencies are translated at market exchange rates in effect at the end of the reporting period. Income and expenses are translated at either the market exchange rates in effect on the dates on which they are recognized or at an average of the market exchange rates in effect during each month. Translation adjustments are reflected in the Statement of Operations.
MIGA has in place a system for active management of exposures to foreign currencies, under which the amounts of non-U.S. dollar assets are matched to non-U.S. dollar insurance portfolio reserve components. The objective is to align the currency compositions of MIGA’s assets and liabilities to minimize the sensitivity of MIGA’s net income to movements in foreign currency exchange rates.
Valuation of Capital Stock Under the MIGA Convention, all payments from members subscribing to the capital stock of MIGA shall be settled on the basis of the average value of the Special Drawing Rights (SDR) introduced by the International Monetary Fund, as valued in terms of United States dollars for the period January 1, 1981 to June 30, 1985, such value being equal to $1.082 for one SDR.
Revenue RecognitionPremium amounts received on direct insurance contracts and reinsurance contracts assumed can be annual, semi-annual or quarterly and are recorded as unearned premium. Premiums are recognized as earned on a pro rata basis over the contract period. A receivable for premium is recorded when the contract has been renewed and coverage amounts have been identified.
MIGA cedes to reinsurers in the normal course of business by obtaining treaty and facultative reinsurance to augment its underwriting capacity and to mitigate its risk by protecting portions of its insurance portfolio. Premiums ceded follow the same approach as for direct insurance con-tracts and are recognized as expenses on a pro rata basis over the contract period.
Fee and commissions income for MIGA primarily consists of administrative fees, arrangement fees, facility fees, renewal fees, commitment (offer) fees, and ceding commissions. Fees and commissions received upon renewal are recognized as income on a pro rata basis over the contract period.
Statement of Cash FlowsFor the purpose of MIGA’s Statement of Cash Flows, cash is defined as the amounts of unrestricted currencies due from Banks.
Note B: Investments
The investment securities held by MIGA are carried and reported at fair value, or at face value which approximates fair value. As of June 30, 2013, the majority of the Investments – Trading is comprised of time deposits and government and agency obligations (37.7% and 29.5%, respectively), with all instruments classified as Level 1 and Level 2 within the fair value hierarchy.
A summary of MIGA’s investment portfolio at June 30, 2013 and June 30, 2012 are as follows:
In thousands of US dollars Fair Value
June 30, 2013 June 30, 2012
Equity securities $95,366 $79,368
Equity securities - non US 78,491 66,237
Comingled funds 12,505 9,062
Government obligations 339,697 399,730
Time deposits 435,023 306,418
Asset backed securities 191,833 230,511
Total Investments - Trading $1,152,915 $1,091,326
In June 2013, the IASB issued its targeted re-exposure draft on insurance contracts jointly developed with the FASB and aimed at implementing a common insurance reporting framework. The draft introduces a revised current value measurement model, updated from the initial proposals released in 2010, including a proposal to recognize the effects of changes in discount rates on insurance liabilities in other comprehensive income (OCI), rather than profit or loss to reduce volatility in the Income Statement. In addition to a new presentation approach for both the statement of profit or loss and OCI and the statement of financial position, other major changes include: an unlocked contractual service margin, which would change the timing of profit recognition; a mirroring approach, which would better align the measurement of participating contracts with their underlying items; and a retrospective approach for the transition to the new standard.
Concurrently, the FASB issued a proposed ASU in June 2013 that would require entities to measure insurance contracts under one of two mea-surement models; the building block approach or the premium allocation approach. Under the building block approach, contracts would generally be measured in a way that portrays a current assessment of the insurance contract based on two components, namely: (1) The present value of the unbiased probability-weighted mean of the future net cash flows (“expected value”) that the entity expects in fulfilling the contract, and (2) A margin representing profit at risk, which is deferred and recognized as income as the uncertainty in the cash flows decreases. Under the premium allocation approach, an entity would initially measure its liability for remaining coverage as the contractual premiums that are within the boundary of the existing contract and in the subsequent periods, would reduce the measurement of the liability for remaining coverage on the basis of the expected timing of incurred claims and benefits and would recognize the amount of that reduction as insurance contract revenue. When insured events occur, an entity generally would measure a separate liability for incurred claims as the expected value of future cash flows to settle the claims and related expenses.
Differences between US GAAP and IFRSMIGA’s accounting policy is to follow the Compensation Retirement Benefits Topic of the FASB Accounting Standards Codification (ASC) 715-30, which requires employers to recognize on their balance sheets the funded status of their defined benefit postretirement plans, measured as the difference between the fair value of the plan assets and the projected benefit obligation. Actuarial gains or losses and prior service costs or credits that arise during the period are recognized as part of Other Comprehensive Income to the extent they are not recognized as components of the net periodic benefit cost. Additionally, ASC 715-30 requires unrecognized net actuarial gains or losses and unrecognized prior service costs to be rec-ognized in the ending balance of Accumulated Other Comprehensive Income. These amounts will be adjusted as they are subsequently recognized as components of net periodic benefit cost.
MIGA’s accounting policy under IAS 19, EmployeeBenefits is to recognize all actuarial gains and losses in the period in which they occur—but outside profit or loss—“in a statement of changes in shareholder’s equity.” This is a permitted alternative available under IAS 19 and MIGA considers that this will allow it to show the over/under funded position on the balance sheet thereby making its financial statements more relevant and complete. ASC 715-30 and IAS 19 differ in the treatment of amortization of unrecognized actuarial gains or losses. ASC 715 30 requires the unrecognized actuarial gains or losses to be amortized to the Statement of Operations, and IAS 19 option applied by MIGA requires the unrecognized actuarial gains or losses to be immediately recognized in Equity through Other Comprehensive Income. MIGA does not believe the differences are material.
Use of EstimatesThe preparation of financial statements in conformity with IFRS and U.S. GAAP requires management to make estimates and assumptions that affect the amounts reported in the financial statements. Actual results could differ from these estimates.
Significant judgments have been made in areas which management views as most critical with respect to the establishment of its loss reserves, the valuation of certain financial instruments at fair value and valuation of pension and post-retirement benefits-related liabilities and the related net periodic cost of such benefit plans.
The significant accounting policies employed by MIGA are summarized below.
InvestmentsMIGA manages its investment portfolio both for the purpose of providing liquidity for potential claims and for capital growth. MIGA invests in global equity securities, time deposits, mortgage/asset-backed securities (ABS) and government and agency obligations based on its investment authorization approved by the Board. Government and agency obligations include highly rated fixed-rate bonds, notes, bills and other obligations issued or unconditionally guaranteed by governments of countries or other official entities, including government agencies or by multilateral organizations. MIGA makes use of derivatives contracts such as exchange traded futures, options and covered forward contracts to manage its investment portfolio. The purposes of these transactions are to enhance the return and manage the overall duration of the portfolio. With respect to futures and options, MIGA generally closes out most open positions prior to expiration. Futures are settled on a daily basis.
MIGA has classified all investment securities as trading. Investments classified as trading securities are reported at fair value using trade-date accounting. Securities purchased or sold may have a settlement date that is different from the trade-date. A liability is recorded for securities purchased but not settled before the reporting dates. Similarly, a receivable (Other Assets) is recorded for securities sold but not settled before the reporting dates.
For trading securities, unrealized net gains and losses are recognized in earnings. Income from investments includes net gains and losses, dividend income and interest income.
Nonnegotiable, Noninterest-bearing Demand Obligations on Account of Subscribed CapitalPayments on these instruments are due to MIGA upon demand and are held in bank accounts which bear MIGA’s name. Accordingly, these instruments are carried and reported at face value as assets on the Balance Sheet.
Impairment of Reinsurance AssetsMIGA assesses at each balance sheet date whether there is objective evidence that the reinsurance asset is impaired, and makes a provision for such impairment. Objective evidence may be in the form of observable data that comes to MIGA’s attention periodically. If impairment is determined, the carrying amount of the reinsurance asset is reduced through the use of an allowance account and the amount of the loss is recognized in the Statement of Operations.
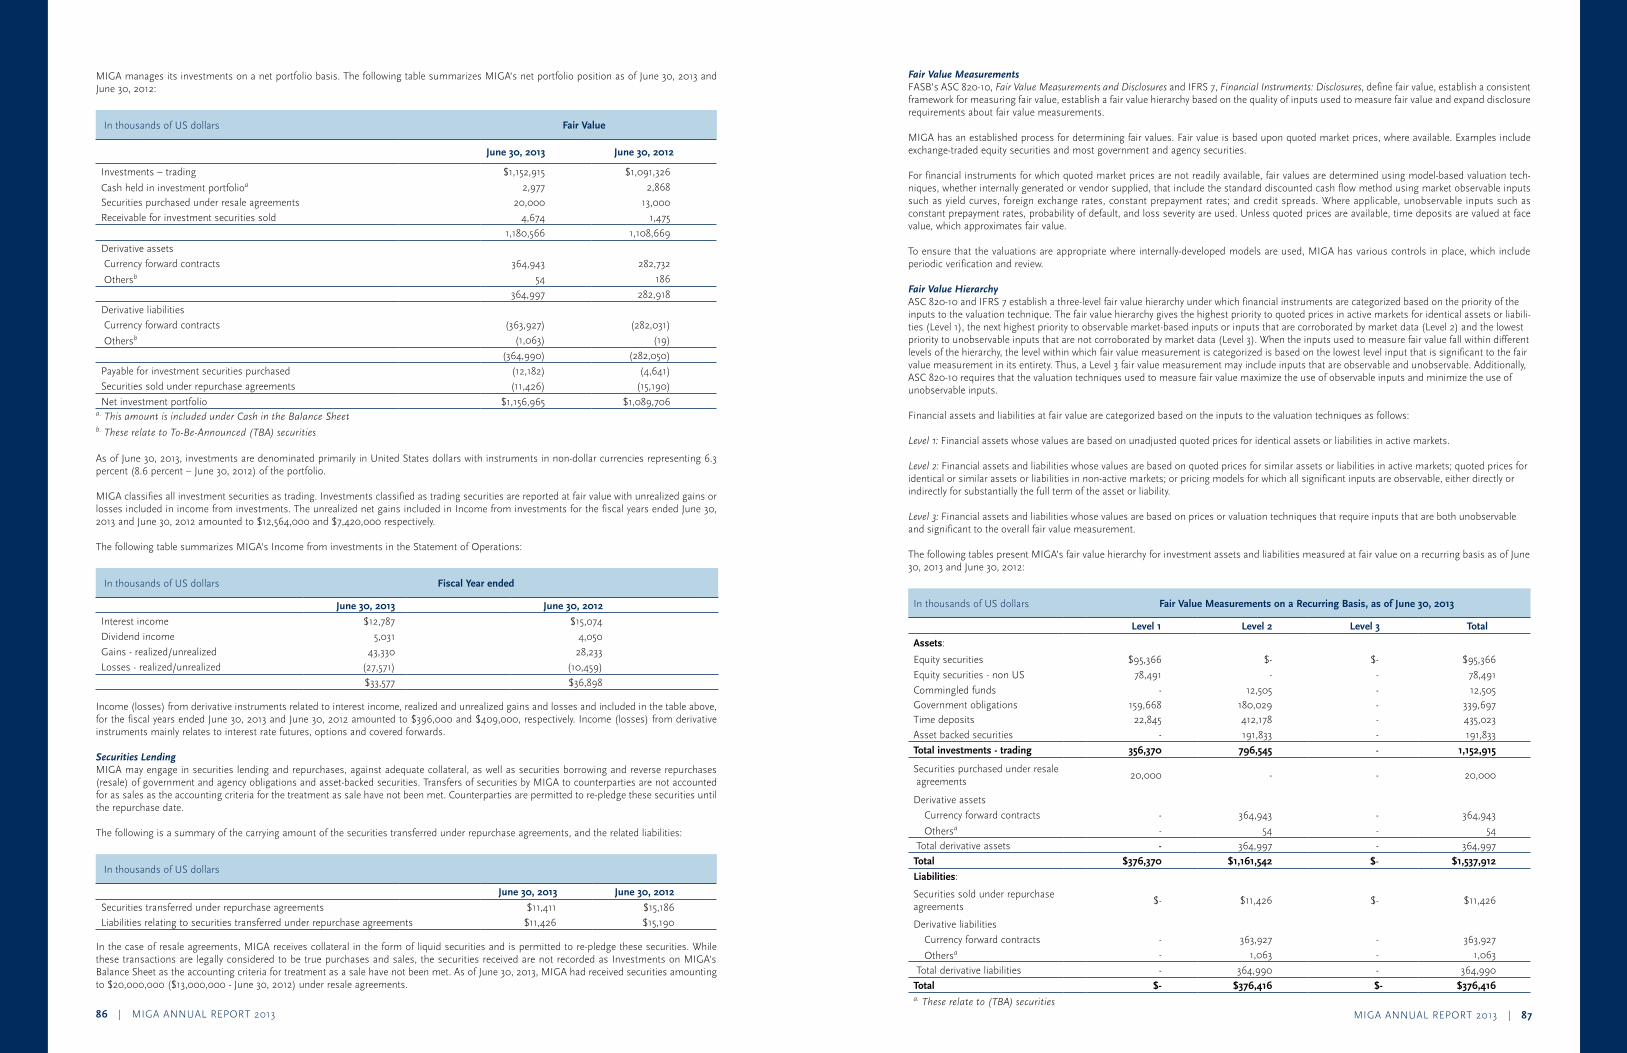
MIGA ANNUAL REPORT 2013 | 8786 | MIGA ANNUAL REPORT 2013
Fair Value Measurements FASB’s ASC 820-10, FairValueMeasurementsandDisclosuresand IFRS 7, FinancialInstruments:Disclosures, define fair value, establish a consistent framework for measuring fair value, establish a fair value hierarchy based on the quality of inputs used to measure fair value and expand disclosure requirements about fair value measurements.
MIGA has an established process for determining fair values. Fair value is based upon quoted market prices, where available. Examples include exchange-traded equity securities and most government and agency securities.
For financial instruments for which quoted market prices are not readily available, fair values are determined using model-based valuation tech-niques, whether internally generated or vendor supplied, that include the standard discounted cash flow method using market observable inputs such as yield curves, foreign exchange rates, constant prepayment rates; and credit spreads. Where applicable, unobservable inputs such as constant prepayment rates, probability of default, and loss severity are used. Unless quoted prices are available, time deposits are valued at face value, which approximates fair value.
To ensure that the valuations are appropriate where internally-developed models are used, MIGA has various controls in place, which include periodic verification and review.
Fair Value HierarchyASC 820-10 and IFRS 7 establish a three-level fair value hierarchy under which financial instruments are categorized based on the priority of the inputs to the valuation technique. The fair value hierarchy gives the highest priority to quoted prices in active markets for identical assets or liabili-ties (Level 1), the next highest priority to observable market-based inputs or inputs that are corroborated by market data (Level 2) and the lowest priority to unobservable inputs that are not corroborated by market data (Level 3). When the inputs used to measure fair value fall within different levels of the hierarchy, the level within which fair value measurement is categorized is based on the lowest level input that is significant to the fair value measurement in its entirety. Thus, a Level 3 fair value measurement may include inputs that are observable and unobservable. Additionally, ASC 820-10 requires that the valuation techniques used to measure fair value maximize the use of observable inputs and minimize the use of unobservable inputs.
Financial assets and liabilities at fair value are categorized based on the inputs to the valuation techniques as follows:
Level1: Financial assets whose values are based on unadjusted quoted prices for identical assets or liabilities in active markets.
Level2: Financial assets and liabilities whose values are based on quoted prices for similar assets or liabilities in active markets; quoted prices for identical or similar assets or liabilities in non-active markets; or pricing models for which all significant inputs are observable, either directly or indirectly for substantially the full term of the asset or liability.
Level3:Financial assets and liabilities whose values are based on prices or valuation techniques that require inputs that are both unobservable and significant to the overall fair value measurement.
The following tables present MIGA’s fair value hierarchy for investment assets and liabilities measured at fair value on a recurring basis as of June 30, 2013 and June 30, 2012:
In thousands of US dollars Fair Value Measurements on a Recurring Basis, as of June 30, 2013
Level 1 Level 2 Level 3 Total
Assets:
Equity securities $95,366 $- $- $95,366
Equity securities - non US 78,491 - - 78,491
Commingled funds - 12,505 - 12,505 Government obligations 159,668 180,029 - 339,697 Time deposits 22,845 412,178 - 435,023
Asset backed securities - 191,833 - 191,833
Total investments - trading 356,370 796,545 - 1,152,915
Securities purchased under resale agreements
20,000 - - 20,000
Derivative assets
Currency forward contracts - 364,943 - 364,943
Othersa - 54 - 54
Total derivative assets - 364,997 - 364,997
Total $376,370 $1,161,542 $- $1,537,912
Liabilities:
Securities sold under repurchase agreements
$- $11,426 $- $11,426
Derivative liabilities
Currency forward contracts - 363,927 - 363,927
Othersa - 1,063 - 1,063
Total derivative liabilities - 364,990 - 364,990
Total $- $376,416 $- $376,416 a.Theserelateto(TBA)securities
MIGA manages its investments on a net portfolio basis. The following table summarizes MIGA’s net portfolio position as of June 30, 2013 and June 30, 2012:
In thousands of US dollars Fair Value
June 30, 2013 June 30, 2012
Investments – trading $1,152,915 $1,091,326
Cash held in investment portfolioa 2,977 2,868
Securities purchased under resale agreements 20,000 13,000
Receivable for investment securities sold 4,674 1,475
1,180,566 1,108,669
Derivative assets
Currency forward contracts 364,943 282,732
Othersb 54 186
364,997 282,918
Derivative liabilities
Currency forward contracts (363,927) (282,031)
Othersb (1,063) (19)
(364,990) (282,050)
Payable for investment securities purchased (12,182) (4,641)
Securities sold under repurchase agreements (11,426) (15,190)
Net investment portfolio $1,156,965 $1,089,706 a.ThisamountisincludedunderCashintheBalanceSheetb.TheserelatetoTo-Be-Announced(TBA)securities
As of June 30, 2013, investments are denominated primarily in United States dollars with instruments in non-dollar currencies representing 6.3 percent (8.6 percent – June 30, 2012) of the portfolio.
MIGA classifies all investment securities as trading. Investments classified as trading securities are reported at fair value with unrealized gains or losses included in income from investments. The unrealized net gains included in Income from investments for the fiscal years ended June 30, 2013 and June 30, 2012 amounted to $12,564,000 and $7,420,000 respectively.
The following table summarizes MIGA’s Income from investments in the Statement of Operations:
In thousands of US dollars Fiscal Year ended
June 30, 2013 June 30, 2012
Interest income $12,787 $15,074
Dividend income 5,031 4,050
Gains - realized/unrealized 43,330 28,233
Losses - realized/unrealized (27,571) (10,459)
$33,577 $36,898
Income (losses) from derivative instruments related to interest income, realized and unrealized gains and losses and included in the table above, for the fiscal years ended June 30, 2013 and June 30, 2012 amounted to $396,000 and $409,000, respectively. Income (losses) from derivative instruments mainly relates to interest rate futures, options and covered forwards.
Securities LendingMIGA may engage in securities lending and repurchases, against adequate collateral, as well as securities borrowing and reverse repurchases (resale) of government and agency obligations and asset-backed securities. Transfers of securities by MIGA to counterparties are not accounted for as sales as the accounting criteria for the treatment as sale have not been met. Counterparties are permitted to re-pledge these securities until the repurchase date.
The following is a summary of the carrying amount of the securities transferred under repurchase agreements, and the related liabilities:
In thousands of US dollars
June 30, 2013 June 30, 2012
Securities transferred under repurchase agreements $11,411 $15,186
Liabilities relating to securities transferred under repurchase agreements $11,426 $15,190
In the case of resale agreements, MIGA receives collateral in the form of liquid securities and is permitted to re-pledge these securities. While these transactions are legally considered to be true purchases and sales, the securities received are not recorded as Investments on MIGA’s Balance Sheet as the accounting criteria for treatment as a sale have not been met. As of June 30, 2013, MIGA had received securities amounting to $20,000,000 ($13,000,000 - June 30, 2012) under resale agreements.
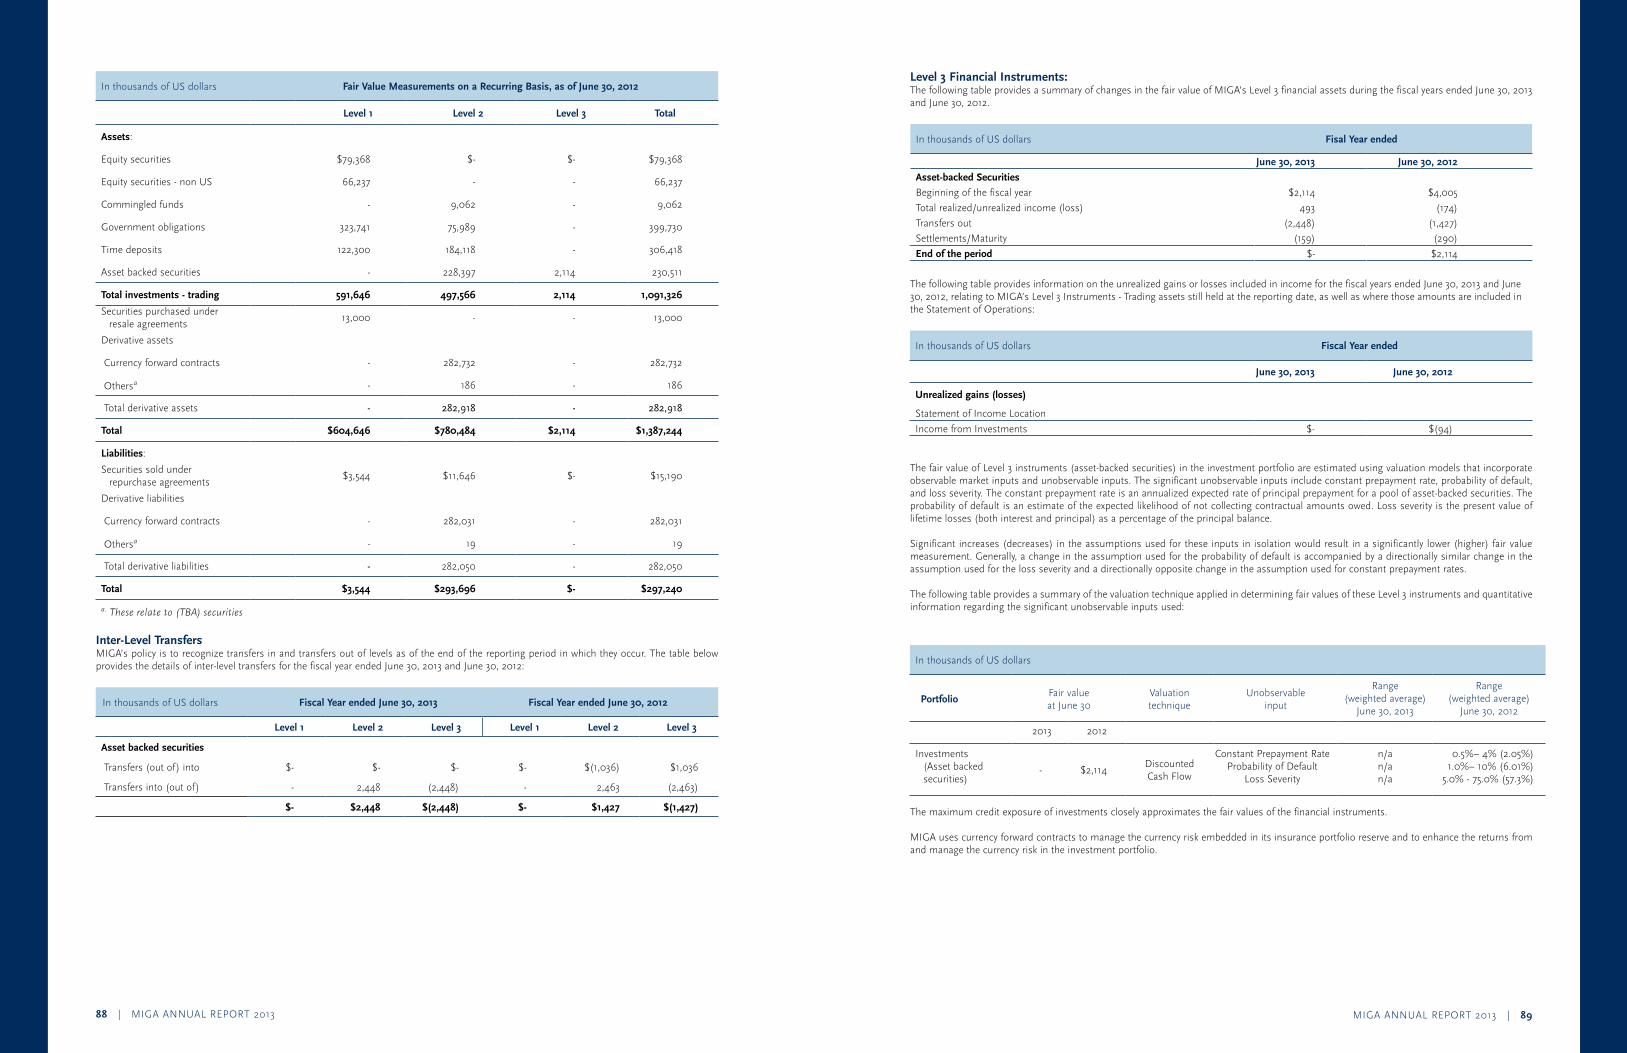
MIGA ANNUAL REPORT 2013 | 8988 | MIGA ANNUAL REPORT 2013
Level 3 Financial Instruments:The following table provides a summary of changes in the fair value of MIGA’s Level 3 financial assets during the fiscal years ended June 30, 2013 and June 30, 2012.
In thousands of US dollars Fisal Year ended
June 30, 2013 June 30, 2012
Asset-backed Securities
Beginning of the fiscal year $2,114 $4,005
Total realized/unrealized income (loss) 493 (174)
Transfers out (2,448) (1,427)
Settlements/Maturity (159) (290)
End of the period $- $2,114
The following table provides information on the unrealized gains or losses included in income for the fiscal years ended June 30, 2013 and June 30, 2012, relating to MIGA’s Level 3 Instruments - Trading assets still held at the reporting date, as well as where those amounts are included in the Statement of Operations:
In thousands of US dollars Fiscal Year ended
June 30, 2013 June 30, 2012
Unrealized gains (losses)
Statement of Income Location
Income from Investments $- $(94)
The fair value of Level 3 instruments (asset-backed securities) in the investment portfolio are estimated using valuation models that incorporate observable market inputs and unobservable inputs. The significant unobservable inputs include constant prepayment rate, probability of default, and loss severity. The constant prepayment rate is an annualized expected rate of principal prepayment for a pool of asset-backed securities. The probability of default is an estimate of the expected likelihood of not collecting contractual amounts owed. Loss severity is the present value of lifetime losses (both interest and principal) as a percentage of the principal balance.
Significant increases (decreases) in the assumptions used for these inputs in isolation would result in a significantly lower (higher) fair value measurement. Generally, a change in the assumption used for the probability of default is accompanied by a directionally similar change in the assumption used for the loss severity and a directionally opposite change in the assumption used for constant prepayment rates.
The following table provides a summary of the valuation technique applied in determining fair values of these Level 3 instruments and quantitative information regarding the significant unobservable inputs used:
In thousands of US dollars
PortfolioFair value at June 30
Valuation technique
Unobservable input
Range (weighted average)
June 30, 2013
Range (weighted average)
June 30, 2012
2013 2012
Investments (Asset backed securities)
- $2,114Discounted Cash Flow
Constant Prepayment Rate Probability of Default
Loss Severity
n/an/an/a
0.5%– 4% (2.05%) 1.0%– 10% (6.01%)
5.0% - 75.0% (57.3%)
The maximum credit exposure of investments closely approximates the fair values of the financial instruments.
MIGA uses currency forward contracts to manage the currency risk embedded in its insurance portfolio reserve and to enhance the returns from and manage the currency risk in the investment portfolio.
In thousands of US dollars Fair Value Measurements on a Recurring Basis, as of June 30, 2012
Level 1 Level 2 Level 3 Total
Assets:
Equity securities $79,368 $- $- $79,368
Equity securities - non US 66,237 - - 66,237
Commingled funds - 9,062 - 9,062
Government obligations 323,741 75,989 - 399,730
Time deposits 122,300 184,118 - 306,418
Asset backed securities - 228,397 2,114 230,511
Total investments - trading 591,646 497,566 2,114 1,091,326
Securities purchased under resale agreements
13,000 - - 13,000
Derivative assets
Currency forward contracts - 282,732 - 282,732
Othersa - 186 - 186
Total derivative assets - 282,918 - 282,918
Total $604,646 $780,484 $2,114 $1,387,244
Liabilities:
Securities sold underrepurchase agreements
$3,544 $11,646 $- $15,190
Derivative liabilities
Currency forward contracts - 282,031 - 282,031
Othersa - 19 - 19
Total derivative liabilities - 282,050 - 282,050
Total $3,544 $293,696 $- $297,240
a.Theserelateto(TBA)securities
Inter-Level TransfersMIGA’s policy is to recognize transfers in and transfers out of levels as of the end of the reporting period in which they occur. The table below provides the details of inter-level transfers for the fiscal year ended June 30, 2013 and June 30, 2012:
In thousands of US dollars Fiscal Year ended June 30, 2013 Fiscal Year ended June 30, 2012
Level 1 Level 2 Level 3 Level 1 Level 2 Level 3
Asset backed securities
Transfers (out of) into $- $- $- $- $(1,036) $1,036
Transfers into (out of) - 2,448 (2,448) - 2,463 (2,463)
$- $2,448 $(2,448) $- $1,427 $(1,427)
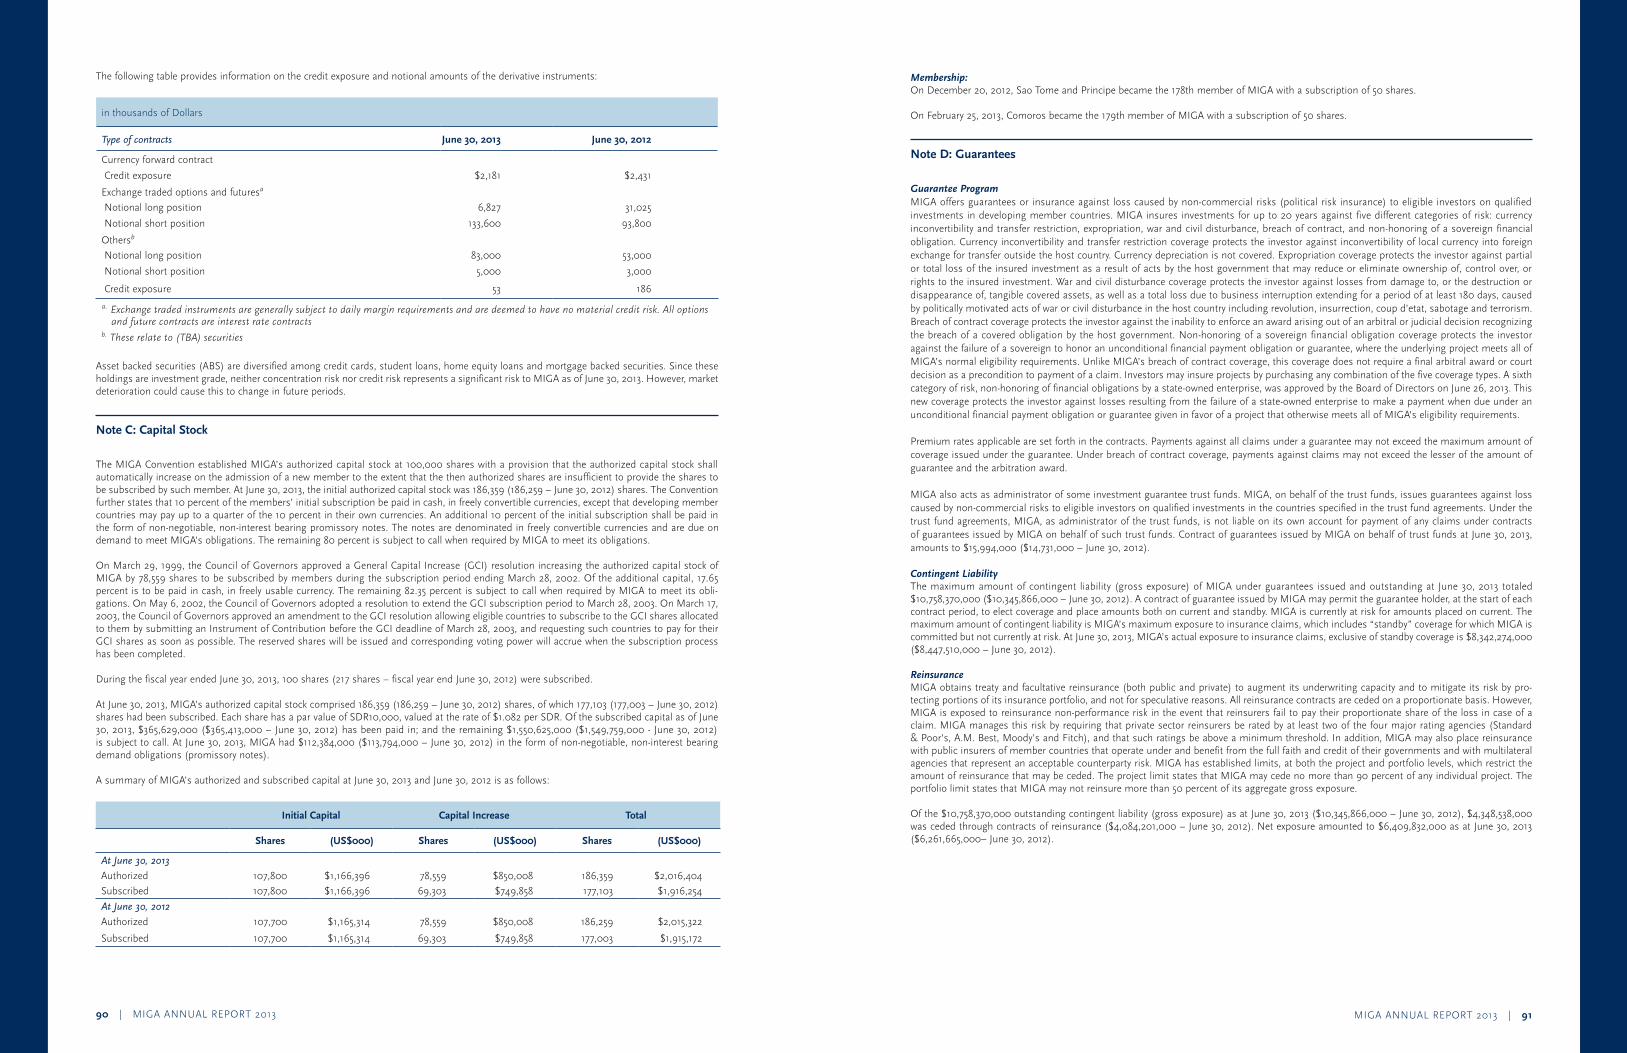
MIGA ANNUAL REPORT 2013 | 9190 | MIGA ANNUAL REPORT 2013
Membership:On December 20, 2012, Sao Tome and Principe became the 178th member of MIGA with a subscription of 50 shares.
On February 25, 2013, Comoros became the 179th member of MIGA with a subscription of 50 shares.
Note D: Guarantees
Guarantee ProgramMIGA offers guarantees or insurance against loss caused by non-commercial risks (political risk insurance) to eligible investors on qualified investments in developing member countries. MIGA insures investments for up to 20 years against five different categories of risk: currency inconvertibility and transfer restriction, expropriation, war and civil disturbance, breach of contract, and non-honoring of a sovereign financial obligation. Currency inconvertibility and transfer restriction coverage protects the investor against inconvertibility of local currency into foreign exchange for transfer outside the host country. Currency depreciation is not covered. Expropriation coverage protects the investor against partial or total loss of the insured investment as a result of acts by the host government that may reduce or eliminate ownership of, control over, or rights to the insured investment. War and civil disturbance coverage protects the investor against losses from damage to, or the destruction or disappearance of, tangible covered assets, as well as a total loss due to business interruption extending for a period of at least 180 days, caused by politically motivated acts of war or civil disturbance in the host country including revolution, insurrection, coup d’etat, sabotage and terrorism. Breach of contract coverage protects the investor against the inability to enforce an award arising out of an arbitral or judicial decision recognizing the breach of a covered obligation by the host government. Non-honoring of a sovereign financial obligation coverage protects the investor against the failure of a sovereign to honor an unconditional financial payment obligation or guarantee, where the underlying project meets all of MIGA’s normal eligibility requirements. Unlike MIGA’s breach of contract coverage, this coverage does not require a final arbitral award or court decision as a precondition to payment of a claim. Investors may insure projects by purchasing any combination of the five coverage types. A sixth category of risk, non-honoring of financial obligations by a state-owned enterprise, was approved by the Board of Directors on June 26, 2013. This new coverage protects the investor against losses resulting from the failure of a state-owned enterprise to make a payment when due under an unconditional financial payment obligation or guarantee given in favor of a project that otherwise meets all of MIGA’s eligibility requirements.
Premium rates applicable are set forth in the contracts. Payments against all claims under a guarantee may not exceed the maximum amount of coverage issued under the guarantee. Under breach of contract coverage, payments against claims may not exceed the lesser of the amount of guarantee and the arbitration award.
MIGA also acts as administrator of some investment guarantee trust funds. MIGA, on behalf of the trust funds, issues guarantees against loss caused by non-commercial risks to eligible investors on qualified investments in the countries specified in the trust fund agreements. Under the trust fund agreements, MIGA, as administrator of the trust funds, is not liable on its own account for payment of any claims under contracts of guarantees issued by MIGA on behalf of such trust funds. Contract of guarantees issued by MIGA on behalf of trust funds at June 30, 2013, amounts to $15,994,000 ($14,731,000 – June 30, 2012).
Contingent LiabilityThe maximum amount of contingent liability (gross exposure) of MIGA under guarantees issued and outstanding at June 30, 2013 totaled $10,758,370,000 ($10,345,866,000 – June 30, 2012). A contract of guarantee issued by MIGA may permit the guarantee holder, at the start of each contract period, to elect coverage and place amounts both on current and standby. MIGA is currently at risk for amounts placed on current. The maximum amount of contingent liability is MIGA’s maximum exposure to insurance claims, which includes “standby” coverage for which MIGA is committed but not currently at risk. At June 30, 2013, MIGA’s actual exposure to insurance claims, exclusive of standby coverage is $8,342,274,000 ($8,447,510,000 – June 30, 2012).
Reinsurance MIGA obtains treaty and facultative reinsurance (both public and private) to augment its underwriting capacity and to mitigate its risk by pro-tecting portions of its insurance portfolio, and not for speculative reasons. All reinsurance contracts are ceded on a proportionate basis. However, MIGA is exposed to reinsurance non-performance risk in the event that reinsurers fail to pay their proportionate share of the loss in case of a claim. MIGA manages this risk by requiring that private sector reinsurers be rated by at least two of the four major rating agencies (Standard & Poor’s, A.M. Best, Moody’s and Fitch), and that such ratings be above a minimum threshold. In addition, MIGA may also place reinsurance with public insurers of member countries that operate under and benefit from the full faith and credit of their governments and with multilateral agencies that represent an acceptable counterparty risk. MIGA has established limits, at both the project and portfolio levels, which restrict the amount of reinsurance that may be ceded. The project limit states that MIGA may cede no more than 90 percent of any individual project. The portfolio limit states that MIGA may not reinsure more than 50 percent of its aggregate gross exposure.
Of the $10,758,370,000 outstanding contingent liability (gross exposure) as at June 30, 2013 ($10,345,866,000 – June 30, 2012), $4,348,538,000 was ceded through contracts of reinsurance ($4,084,201,000 – June 30, 2012). Net exposure amounted to $6,409,832,000 as at June 30, 2013 ($6,261,665,000– June 30, 2012).
The following table provides information on the credit exposure and notional amounts of the derivative instruments:
in thousands of Dollars
Type of contracts June 30, 2013 June 30, 2012
Currency forward contract
Credit exposure $2,181 $2,431
Exchange traded options and futuresa
Notional long position 6,827 31,025
Notional short position 133,600 93,800
Othersb
Notional long position 83,000 53,000
Notional short position 5,000 3,000
Credit exposure 53 186
a.Exchangetradedinstrumentsaregenerallysubjecttodailymarginrequirementsandaredeemedtohavenomaterialcreditrisk.Alloptionsandfuturecontractsareinterestratecontracts
b.Theserelateto(TBA)securities
Asset backed securities (ABS) are diversified among credit cards, student loans, home equity loans and mortgage backed securities. Since these holdings are investment grade, neither concentration risk nor credit risk represents a significant risk to MIGA as of June 30, 2013. However, market deterioration could cause this to change in future periods.
Note C: Capital Stock
The MIGA Convention established MIGA’s authorized capital stock at 100,000 shares with a provision that the authorized capital stock shall automatically increase on the admission of a new member to the extent that the then authorized shares are insufficient to provide the shares to be subscribed by such member. At June 30, 2013, the initial authorized capital stock was 186,359 (186,259 – June 30, 2012) shares. The Convention further states that 10 percent of the members’ initial subscription be paid in cash, in freely convertible currencies, except that developing member countries may pay up to a quarter of the 10 percent in their own currencies. An additional 10 percent of the initial subscription shall be paid in the form of non-negotiable, non-interest bearing promissory notes. The notes are denominated in freely convertible currencies and are due on demand to meet MIGA’s obligations. The remaining 80 percent is subject to call when required by MIGA to meet its obligations.
On March 29, 1999, the Council of Governors approved a General Capital Increase (GCI) resolution increasing the authorized capital stock of MIGA by 78,559 shares to be subscribed by members during the subscription period ending March 28, 2002. Of the additional capital, 17.65 percent is to be paid in cash, in freely usable currency. The remaining 82.35 percent is subject to call when required by MIGA to meet its obli-gations. On May 6, 2002, the Council of Governors adopted a resolution to extend the GCI subscription period to March 28, 2003. On March 17, 2003, the Council of Governors approved an amendment to the GCI resolution allowing eligible countries to subscribe to the GCI shares allocated to them by submitting an Instrument of Contribution before the GCI deadline of March 28, 2003, and requesting such countries to pay for their GCI shares as soon as possible. The reserved shares will be issued and corresponding voting power will accrue when the subscription process has been completed.
During the fiscal year ended June 30, 2013, 100 shares (217 shares – fiscal year end June 30, 2012) were subscribed.
At June 30, 2013, MIGA’s authorized capital stock comprised 186,359 (186,259 – June 30, 2012) shares, of which 177,103 (177,003 – June 30, 2012) shares had been subscribed. Each share has a par value of SDR10,000, valued at the rate of $1.082 per SDR. Of the subscribed capital as of June 30, 2013, $365,629,000 ($365,413,000 – June 30, 2012) has been paid in; and the remaining $1,550,625,000 ($1,549,759,000 - June 30, 2012) is subject to call. At June 30, 2013, MIGA had $112,384,000 ($113,794,000 – June 30, 2012) in the form of non-negotiable, non-interest bearing demand obligations (promissory notes).
A summary of MIGA’s authorized and subscribed capital at June 30, 2013 and June 30, 2012 is as follows:
Initial Capital Capital Increase Total
Shares (US$000) Shares (US$000) Shares (US$000)
At June 30, 2013
Authorized 107,800 $1,166,396 78,559 $850,008 186,359 $2,016,404
Subscribed 107,800 $1,166,396 69,303 $749,858 177,103 $1,916,254
At June 30, 2012
Authorized 107,700 $1,165,314 78,559 $850,008 186,259 $2,015,322
Subscribed 107,700 $1,165,314 69,303 $749,858 177,003 $1,915,172
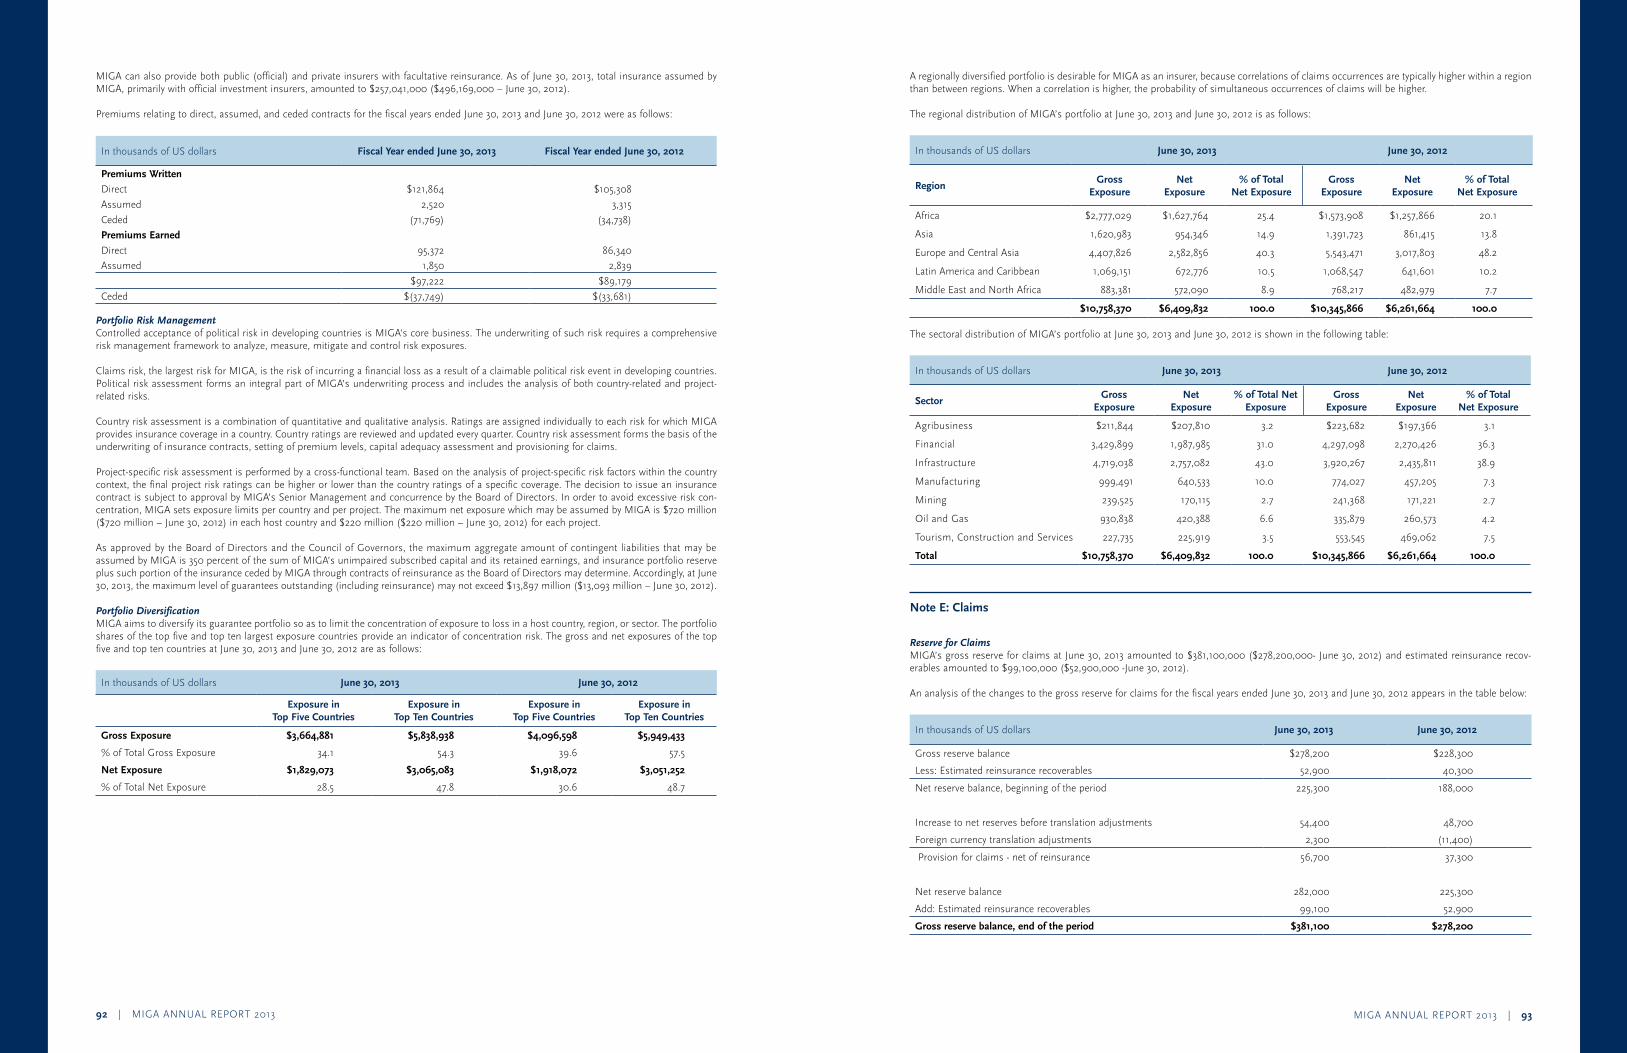
MIGA ANNUAL REPORT 2013 | 9392 | MIGA ANNUAL REPORT 2013
A regionally diversified portfolio is desirable for MIGA as an insurer, because correlations of claims occurrences are typically higher within a region than between regions. When a correlation is higher, the probability of simultaneous occurrences of claims will be higher.
The regional distribution of MIGA’s portfolio at June 30, 2013 and June 30, 2012 is as follows:
In thousands of US dollars June 30, 2013 June 30, 2012
RegionGross
ExposureNet
Exposure% of Total
Net ExposureGross
ExposureNet
Exposure% of Total
Net Exposure
Africa $2,777,029 $1,627,764 25.4 $1,573,908 $1,257,866 20.1
Asia 1,620,983 954,346 14.9 1,391,723 861,415 13.8
Europe and Central Asia 4,407,826 2,582,856 40.3 5,543,471 3,017,803 48.2
Latin America and Caribbean 1,069,151 672,776 10.5 1,068,547 641,601 10.2
Middle East and North Africa 883,381 572,090 8.9 768,217 482,979 7.7
$10,758,370 $6,409,832 100.0 $10,345,866 $6,261,664 100.0
The sectoral distribution of MIGA’s portfolio at June 30, 2013 and June 30, 2012 is shown in the following table:
In thousands of US dollars June 30, 2013 June 30, 2012
SectorGross
ExposureNet
Exposure% of Total Net
ExposureGross
ExposureNet
Exposure% of Total
Net Exposure
Agribusiness $211,844 $207,810 3.2 $223,682 $197,366 3.1
Financial 3,429,899 1,987,985 31.0 4,297,098 2,270,426 36.3
Infrastructure 4,719,038 2,757,082 43.0 3,920,267 2,435,811 38.9
Manufacturing 999,491 640,533 10.0 774,027 457,205 7.3
Mining 239,525 170,115 2.7 241,368 171,221 2.7
Oil and Gas 930,838 420,388 6.6 335,879 260,573 4.2
Tourism, Construction and Services 227,735 225,919 3.5 553,545 469,062 7.5
Total $10,758,370 $6,409,832 100.0 $10,345,866 $6,261,664 100.0
Note E: Claims
Reserve for Claims MIGA’s gross reserve for claims at June 30, 2013 amounted to $381,100,000 ($278,200,000- June 30, 2012) and estimated reinsurance recov-erables amounted to $99,100,000 ($52,900,000 -June 30, 2012).
An analysis of the changes to the gross reserve for claims for the fiscal years ended June 30, 2013 and June 30, 2012 appears in the table below:
In thousands of US dollars June 30, 2013 June 30, 2012
Gross reserve balance $278,200 $228,300
Less: Estimated reinsurance recoverables 52,900 40,300
Net reserve balance, beginning of the period 225,300 188,000
Increase to net reserves before translation adjustments 54,400 48,700
Foreign currency translation adjustments 2,300 (11,400)
Provision for claims - net of reinsurance 56,700 37,300
Net reserve balance 282,000 225,300
Add: Estimated reinsurance recoverables 99,100 52,900
Gross reserve balance, end of the period $381,100 $278,200
MIGA can also provide both public (official) and private insurers with facultative reinsurance. As of June 30, 2013, total insurance assumed by MIGA, primarily with official investment insurers, amounted to $257,041,000 ($496,169,000 – June 30, 2012).
Premiums relating to direct, assumed, and ceded contracts for the fiscal years ended June 30, 2013 and June 30, 2012 were as follows:
In thousands of US dollars Fiscal Year ended June 30, 2013 Fiscal Year ended June 30, 2012
Premiums Written
Direct $121,864 $105,308
Assumed 2,520 3,315
Ceded (71,769) (34,738)
Premiums Earned
Direct 95,372 86,340
Assumed 1,850 2,839
$97,222 $89,179
Ceded $(37,749) $(33,681)
Portfolio Risk Management Controlled acceptance of political risk in developing countries is MIGA’s core business. The underwriting of such risk requires a comprehensive risk management framework to analyze, measure, mitigate and control risk exposures.
Claims risk, the largest risk for MIGA, is the risk of incurring a financial loss as a result of a claimable political risk event in developing countries. Political risk assessment forms an integral part of MIGA’s underwriting process and includes the analysis of both country-related and project-related risks.
Country risk assessment is a combination of quantitative and qualitative analysis. Ratings are assigned individually to each risk for which MIGA provides insurance coverage in a country. Country ratings are reviewed and updated every quarter. Country risk assessment forms the basis of the underwriting of insurance contracts, setting of premium levels, capital adequacy assessment and provisioning for claims.
Project-specific risk assessment is performed by a cross-functional team. Based on the analysis of project-specific risk factors within the country context, the final project risk ratings can be higher or lower than the country ratings of a specific coverage. The decision to issue an insurance contract is subject to approval by MIGA’s Senior Management and concurrence by the Board of Directors. In order to avoid excessive risk con-centration, MIGA sets exposure limits per country and per project. The maximum net exposure which may be assumed by MIGA is $720 million ($720 million – June 30, 2012) in each host country and $220 million ($220 million – June 30, 2012) for each project.
As approved by the Board of Directors and the Council of Governors, the maximum aggregate amount of contingent liabilities that may be assumed by MIGA is 350 percent of the sum of MIGA’s unimpaired subscribed capital and its retained earnings, and insurance portfolio reserve plus such portion of the insurance ceded by MIGA through contracts of reinsurance as the Board of Directors may determine. Accordingly, at June 30, 2013, the maximum level of guarantees outstanding (including reinsurance) may not exceed $13,897 million ($13,093 million – June 30, 2012).
Portfolio Diversification MIGA aims to diversify its guarantee portfolio so as to limit the concentration of exposure to loss in a host country, region, or sector. The portfolio shares of the top five and top ten largest exposure countries provide an indicator of concentration risk. The gross and net exposures of the top five and top ten countries at June 30, 2013 and June 30, 2012 are as follows:
In thousands of US dollars June 30, 2013 June 30, 2012
Exposure in Top Five Countries
Exposure in Top Ten Countries
Exposure in Top Five Countries
Exposure in Top Ten Countries
Gross Exposure $3,664,881 $5,838,938 $4,096,598 $5,949,433
% of Total Gross Exposure 34.1 54.3 39.6 57.5
Net Exposure $1,829,073 $3,065,083 $1,918,072 $3,051,252
% of Total Net Exposure 28.5 47.8 30.6 48.7
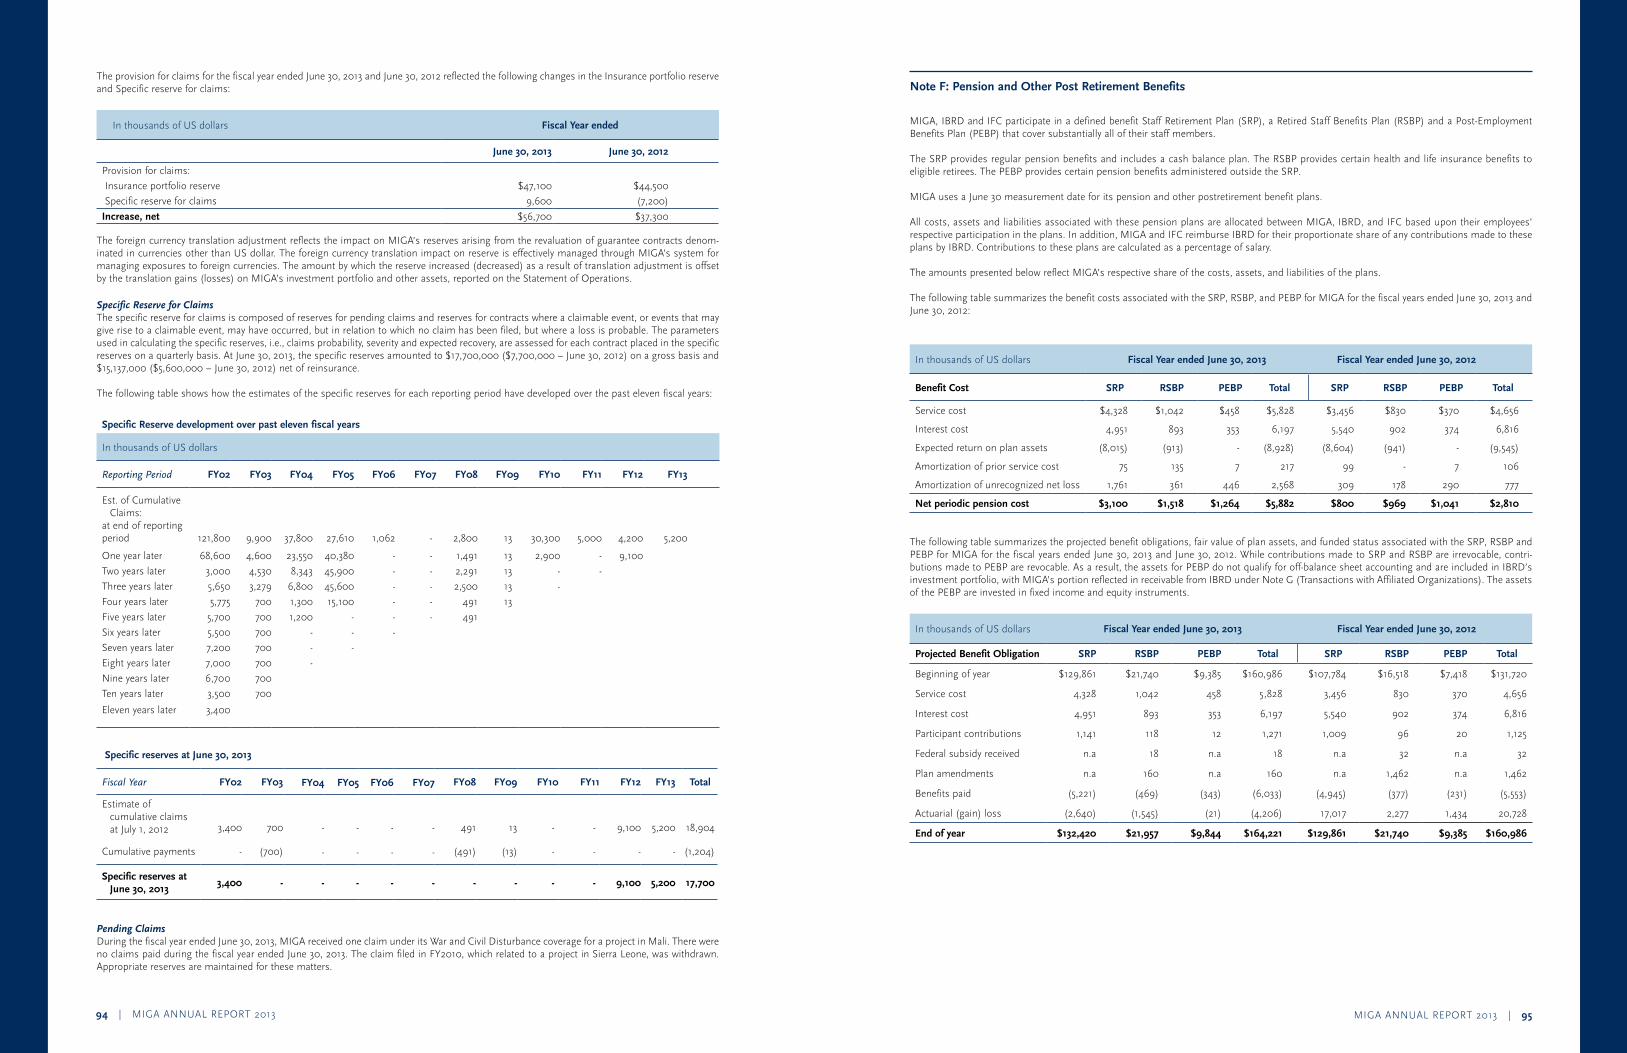
MIGA ANNUAL REPORT 2013 | 9594 | MIGA ANNUAL REPORT 2013
Note F: Pension and Other Post Retirement Benefits
MIGA, IBRD and IFC participate in a defined benefit Staff Retirement Plan (SRP), a Retired Staff Benefits Plan (RSBP) and a Post-Employment Benefits Plan (PEBP) that cover substantially all of their staff members.
The SRP provides regular pension benefits and includes a cash balance plan. The RSBP provides certain health and life insurance benefits to eligible retirees. The PEBP provides certain pension benefits administered outside the SRP.
MIGA uses a June 30 measurement date for its pension and other postretirement benefit plans.
All costs, assets and liabilities associated with these pension plans are allocated between MIGA, IBRD, and IFC based upon their employees’ respective participation in the plans. In addition, MIGA and IFC reimburse IBRD for their proportionate share of any contributions made to these plans by IBRD. Contributions to these plans are calculated as a percentage of salary.
The amounts presented below reflect MIGA’s respective share of the costs, assets, and liabilities of the plans. The following table summarizes the benefit costs associated with the SRP, RSBP, and PEBP for MIGA for the fiscal years ended June 30, 2013 and June 30, 2012:
In thousands of US dollars Fiscal Year ended June 30, 2013 Fiscal Year ended June 30, 2012
Benefit Cost SRP RSBP PEBP Total SRP RSBP PEBP Total
Service cost $4,328 $1,042 $458 $5,828 $3,456 $830 $370 $4,656
Interest cost 4,951 893 353 6,197 5,540 902 374 6,816
Expected return on plan assets (8,015) (913) - (8,928) (8,604) (941) - (9,545)
Amortization of prior service cost 75 135 7 217 99 - 7 106
Amortization of unrecognized net loss 1,761 361 446 2,568 309 178 290 777
Net periodic pension cost $3,100 $1,518 $1,264 $5,882 $800 $969 $1,041 $2,810
The following table summarizes the projected benefit obligations, fair value of plan assets, and funded status associated with the SRP, RSBP and PEBP for MIGA for the fiscal years ended June 30, 2013 and June 30, 2012. While contributions made to SRP and RSBP are irrevocable, contri-butions made to PEBP are revocable. As a result, the assets for PEBP do not qualify for off-balance sheet accounting and are included in IBRD’s investment portfolio, with MIGA’s portion reflected in receivable from IBRD under Note G (Transactions with Affiliated Organizations). The assets of the PEBP are invested in fixed income and equity instruments.
In thousands of US dollars Fiscal Year ended June 30, 2013 Fiscal Year ended June 30, 2012
Projected Benefit Obligation SRP RSBP PEBP Total SRP RSBP PEBP Total
Beginning of year $129,861 $21,740 $9,385 $160,986 $107,784 $16,518 $7,418 $131,720
Service cost 4,328 1,042 458 5,828 3,456 830 370 4,656
Interest cost 4,951 893 353 6,197 5,540 902 374 6,816
Participant contributions 1,141 118 12 1,271 1,009 96 20 1,125
Federal subsidy received n.a 18 n.a 18 n.a 32 n.a 32
Plan amendments n.a 160 n.a 160 n.a 1,462 n.a 1,462
Benefits paid (5,221) (469) (343) (6,033) (4,945) (377) (231) (5,553)
Actuarial (gain) loss (2,640) (1,545) (21) (4,206) 17,017 2,277 1,434 20,728
End of year $132,420 $21,957 $9,844 $164,221 $129,861 $21,740 $9,385 $160,986
The provision for claims for the fiscal year ended June 30, 2013 and June 30, 2012 reflected the following changes in the Insurance portfolio reserve and Specific reserve for claims:
In thousands of US dollars Fiscal Year ended
June 30, 2013 June 30, 2012
Provision for claims:
Insurance portfolio reserve $47,100 $44,500
Specific reserve for claims 9,600 (7,200)
Increase, net $56,700 $37,300
The foreign currency translation adjustment reflects the impact on MIGA’s reserves arising from the revaluation of guarantee contracts denom-inated in currencies other than US dollar. The foreign currency translation impact on reserve is effectively managed through MIGA’s system for managing exposures to foreign currencies. The amount by which the reserve increased (decreased) as a result of translation adjustment is offset by the translation gains (losses) on MIGA’s investment portfolio and other assets, reported on the Statement of Operations.
Specific Reserve for Claims The specific reserve for claims is composed of reserves for pending claims and reserves for contracts where a claimable event, or events that may give rise to a claimable event, may have occurred, but in relation to which no claim has been filed, but where a loss is probable. The parameters used in calculating the specific reserves, i.e., claims probability, severity and expected recovery, are assessed for each contract placed in the specific reserves on a quarterly basis. At June 30, 2013, the specific reserves amounted to $17,700,000 ($7,700,000 – June 30, 2012) on a gross basis and $15,137,000 ($5,600,000 – June 30, 2012) net of reinsurance.
The following table shows how the estimates of the specific reserves for each reporting period have developed over the past eleven fiscal years:
Specific Reserve development over past eleven fiscal years
In thousands of US dollars
Reporting Period FY02 FY03 FY04 FY05 FY06 FY07 FY08 FY09 FY10 FY11 FY12 FY13
Est. of CumulativeClaims:
at end of reportingperiod 121,800 9,900 37,800 27,610 1,062 - 2,800 13 30,300 5,000 4,200 5,200
One year later 68,600 4,600 23,550 40,380 - - 1,491 13 2,900 - 9,100
Two years later 3,000 4,530 8,343 45,900 - - 2,291 13 - -
Three years later 5,650 3,279 6,800 45,600 - - 2,500 13 -
Four years later 5,775 700 1,300 15,100 - - 491 13
Five years later 5,700 700 1,200 - - - 491
Six years later 5,500 700 - - -
Seven years later 7,200 700 - -
Eight years later 7,000 700 -
Nine years later 6,700 700
Ten years later 3,500 700
Eleven years later 3,400
Specific reserves at June 30, 2013
Fiscal Year FY02 FY03 FY04 FY05 FY06 FY07 FY08 FY09 FY10 FY11 FY12 FY13 Total
Estimate of cumulative claimsat July 1, 2012 3,400 700 - - - - 491 13 - - 9,100 5,200 18,904
Cumulative payments - (700) - - - - (491) (13) - - - - (1,204)
Specific reserves atJune 30, 2013
3,400 - - - - - - - - - 9,100 5,200 17,700
Pending Claims During the fiscal year ended June 30, 2013, MIGA received one claim under its War and Civil Disturbance coverage for a project in Mali. There were no claims paid during the fiscal year ended June 30, 2013. The claim filed in FY2010, which related to a project in Sierra Leone, was withdrawn. Appropriate reserves are maintained for these matters.
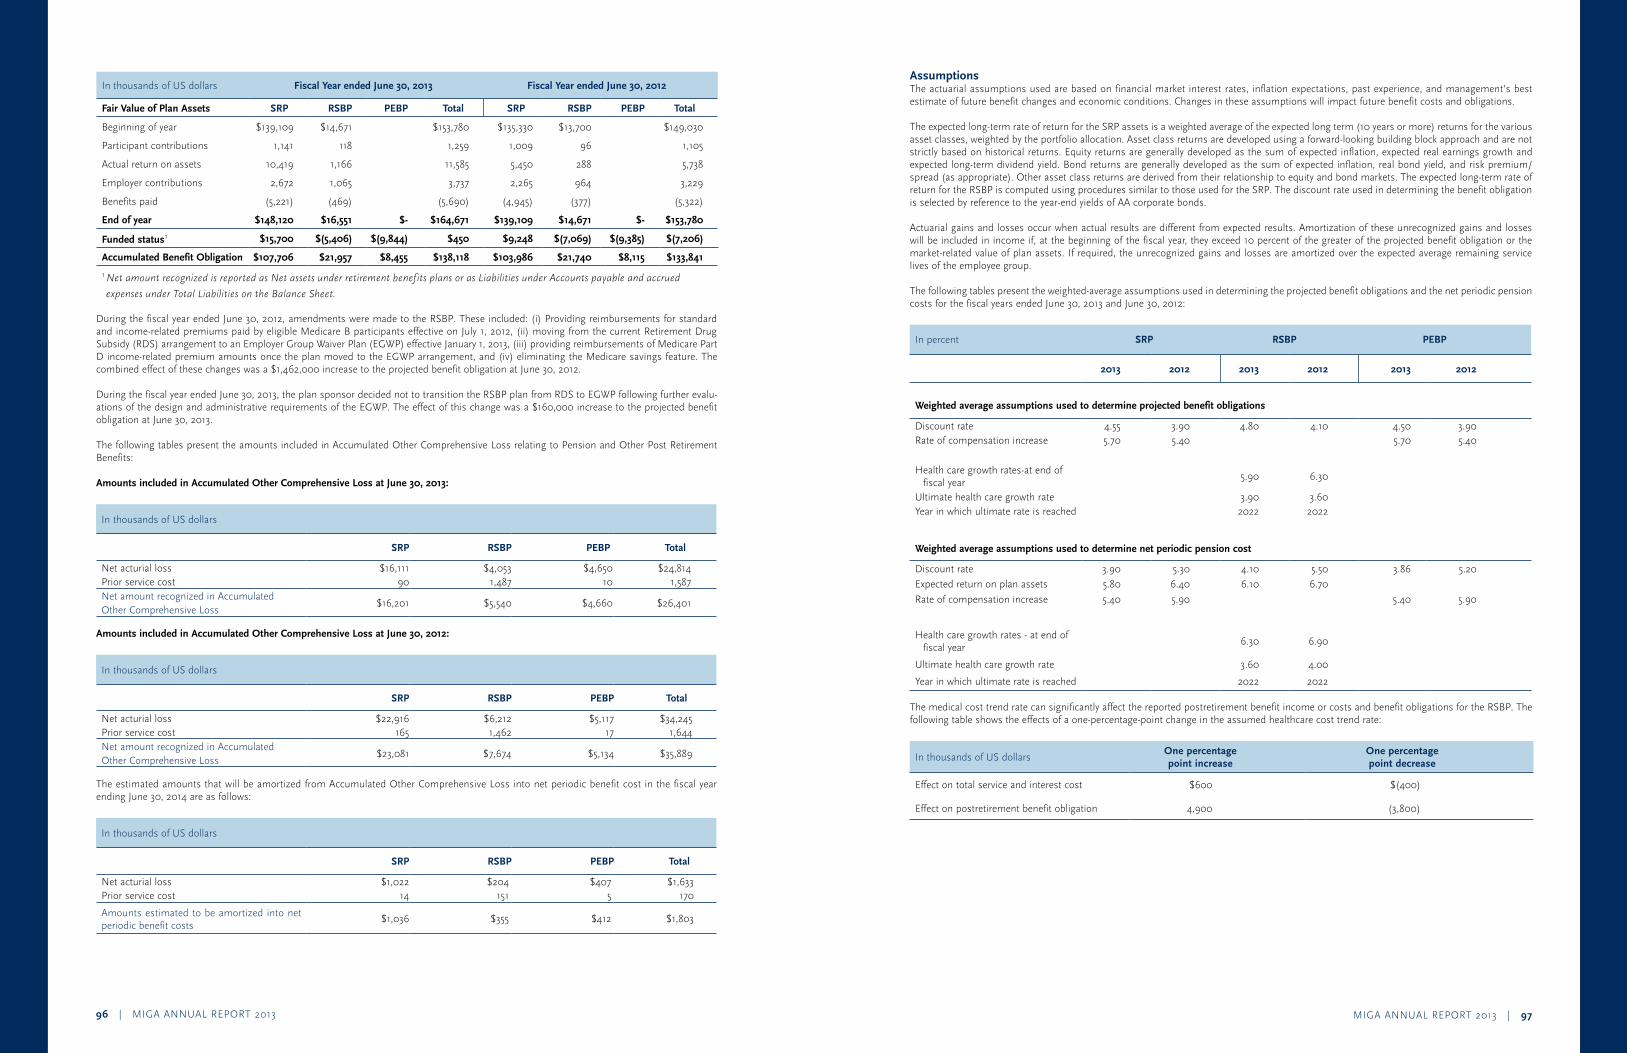
MIGA ANNUAL REPORT 2013 | 9796 | MIGA ANNUAL REPORT 2013
Assumptions The actuarial assumptions used are based on financial market interest rates, inflation expectations, past experience, and management’s best estimate of future benefit changes and economic conditions. Changes in these assumptions will impact future benefit costs and obligations.
The expected long-term rate of return for the SRP assets is a weighted average of the expected long term (10 years or more) returns for the various asset classes, weighted by the portfolio allocation. Asset class returns are developed using a forward-looking building block approach and are not strictly based on historical returns. Equity returns are generally developed as the sum of expected inflation, expected real earnings growth and expected long-term dividend yield. Bond returns are generally developed as the sum of expected inflation, real bond yield, and risk premium/spread (as appropriate). Other asset class returns are derived from their relationship to equity and bond markets. The expected long-term rate of return for the RSBP is computed using procedures similar to those used for the SRP. The discount rate used in determining the benefit obligation is selected by reference to the year-end yields of AA corporate bonds.
Actuarial gains and losses occur when actual results are different from expected results. Amortization of these unrecognized gains and losses will be included in income if, at the beginning of the fiscal year, they exceed 10 percent of the greater of the projected benefit obligation or the market-related value of plan assets. If required, the unrecognized gains and losses are amortized over the expected average remaining service lives of the employee group.
The following tables present the weighted-average assumptions used in determining the projected benefit obligations and the net periodic pension costs for the fiscal years ended June 30, 2013 and June 30, 2012:
In percent SRP RSBP PEBP
2013 2012 2013 2012 2013 2012
Weighted average assumptions used to determine projected benefit obligations
Discount rate 4.55 3.90 4.80 4.10 4.50 3.90 Rate of compensation increase 5.70 5.40 5.70 5.40
Health care growth rates-at end offiscal year
5.90 6.30
Ultimate health care growth rate 3.90 3.60 Year in which ultimate rate is reached 2022 2022
Weighted average assumptions used to determine net periodic pension cost
Discount rate 3.90 5.30 4.10 5.50 3.86 5.20
Expected return on plan assets 5.80 6.40 6.10 6.70
Rate of compensation increase 5.40 5.90 5.40 5.90
Health care growth rates - at end offiscal year
6.30 6.90
Ultimate health care growth rate 3.60 4.00
Year in which ultimate rate is reached 2022 2022
The medical cost trend rate can significantly affect the reported postretirement benefit income or costs and benefit obligations for the RSBP. The following table shows the effects of a one-percentage-point change in the assumed healthcare cost trend rate:
In thousands of US dollarsOne percentage point increase
One percentage point decrease
Effect on total service and interest cost $600 $(400)
Effect on postretirement benefit obligation 4,900 (3,800)
In thousands of US dollars Fiscal Year ended June 30, 2013 Fiscal Year ended June 30, 2012
Fair Value of Plan Assets SRP RSBP PEBP Total SRP RSBP PEBP Total
Beginning of year $139,109 $14,671 $153,780 $135,330 $13,700 $149,030
Participant contributions 1,141 118 1,259 1,009 96 1,105
Actual return on assets 10,419 1,166 11,585 5,450 288 5,738
Employer contributions 2,672 1,065 3,737 2,265 964 3,229
Benefits paid (5,221) (469) (5,690) (4,945) (377) (5,322)
End of year $148,120 $16,551 $- $164,671 $139,109 $14,671 $- $153,780
Funded status1 $15,700 $(5,406) $(9,844) $450 $9,248 $(7,069) $(9,385) $(7,206)
Accumulated Benefit Obligation $107,706 $21,957 $8,455 $138,118 $103,986 $21,740 $8,115 $133,841
1NetamountrecognizedisreportedasNetassetsunderretirementbenefitsplansorasLiabilitiesunderAccountspayableandaccrued
expensesunderTotalLiabilitiesontheBalanceSheet.
During the fiscal year ended June 30, 2012, amendments were made to the RSBP. These included: (i) Providing reimbursements for standard and income-related premiums paid by eligible Medicare B participants effective on July 1, 2012, (ii) moving from the current Retirement Drug Subsidy (RDS) arrangement to an Employer Group Waiver Plan (EGWP) effective January 1, 2013, (iii) providing reimbursements of Medicare Part D income-related premium amounts once the plan moved to the EGWP arrangement, and (iv) eliminating the Medicare savings feature. The combined effect of these changes was a $1,462,000 increase to the projected benefit obligation at June 30, 2012. During the fiscal year ended June 30, 2013, the plan sponsor decided not to transition the RSBP plan from RDS to EGWP following further evalu-ations of the design and administrative requirements of the EGWP. The effect of this change was a $160,000 increase to the projected benefit obligation at June 30, 2013.
The following tables present the amounts included in Accumulated Other Comprehensive Loss relating to Pension and Other Post Retirement Benefits:
Amounts included in Accumulated Other Comprehensive Loss at June 30, 2013:
In thousands of US dollars
SRP RSBP PEBP Total
Net acturial loss $16,111 $4,053 $4,650 $24,814Prior service cost 90 1,487 10 1,587Net amount recognized in Accumulated
$16,201 $5,540 $4,660 $26,401Other Comprehensive Loss
Amounts included in Accumulated Other Comprehensive Loss at June 30, 2012:
In thousands of US dollars
SRP RSBP PEBP Total
Net acturial loss $22,916 $6,212 $5,117 $34,245 Prior service cost 165 1,462 17 1,644 Net amount recognized in Accumulated
$23,081 $7,674 $5,134 $35,889Other Comprehensive Loss
The estimated amounts that will be amortized from Accumulated Other Comprehensive Loss into net periodic benefit cost in the fiscal year ending June 30, 2014 are as follows:
In thousands of US dollars
SRP RSBP PEBP Total
Net acturial loss $1,022 $204 $407 $1,633 Prior service cost 14 151 5 170
Amounts estimated to be amortized into net periodic benefit costs
$1,036 $355 $412 $1,803
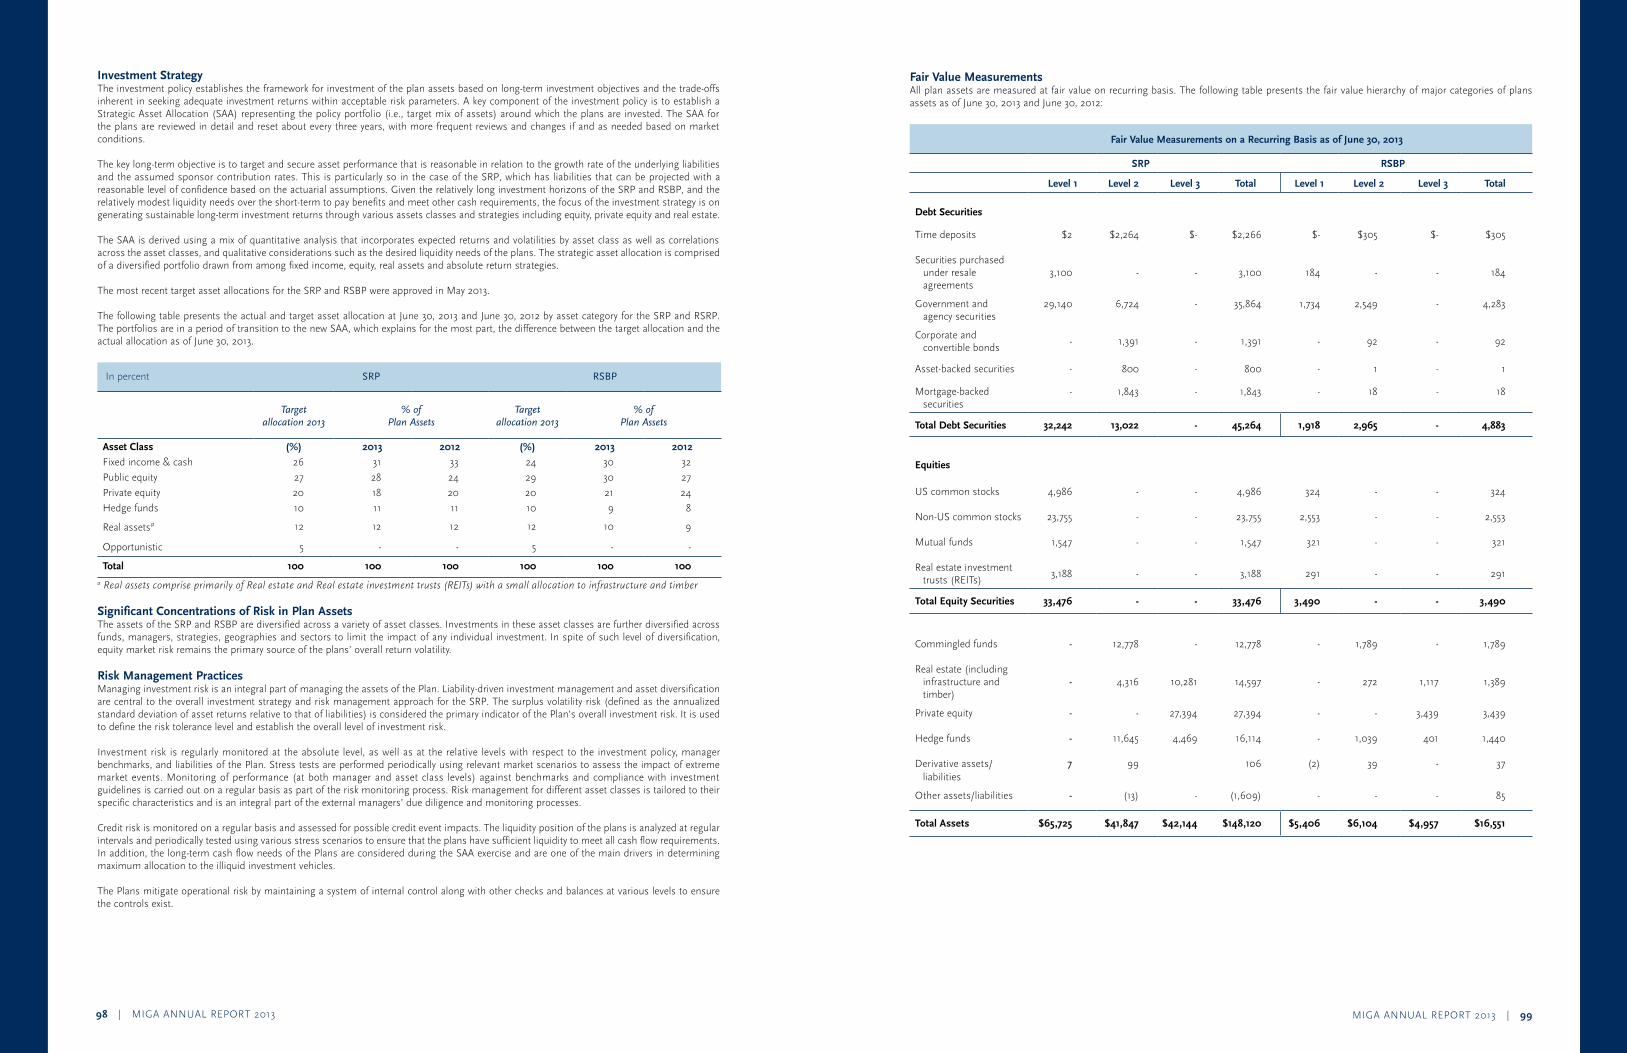
MIGA ANNUAL REPORT 2013 | 9998 | MIGA ANNUAL REPORT 2013
Fair Value MeasurementsAll plan assets are measured at fair value on recurring basis. The following table presents the fair value hierarchy of major categories of plans assets as of June 30, 2013 and June 30, 2012:
Fair Value Measurements on a Recurring Basis as of June 30, 2013
SRP RSBP
Level 1 Level 2 Level 3 Total Level 1 Level 2 Level 3 Total
Debt Securities
Time deposits $2 $2,264 $- $2,266 $- $305 $- $305
Securities purchasedunder resale agreements
3,100 - - 3,100 184 - - 184
Government andagency securities
29,140 6,724 - 35,864 1,734 2,549 - 4,283
Corporate and convertible bonds
- 1,391 - 1,391 - 92 - 92
Asset-backed securities - 800 - 800 - 1 - 1
Mortgage-backedsecurities
- 1,843 - 1,843 - 18 - 18
Total Debt Securities 32,242 13,022 - 45,264 1,918 2,965 - 4,883
Equities
US common stocks 4,986 - - 4,986 324 - - 324
Non-US common stocks 23,755 - - 23,755 2,553 - - 2,553
Mutual funds 1,547 - - 1,547 321 - - 321
Real estate investmenttrusts (REITs)
3,188 - - 3,188 291 - - 291
Total Equity Securities 33,476 - - 33,476 3,490 - - 3,490
Commingled funds - 12,778 - 12,778 - 1,789 - 1,789
Real estate (including infrastructure andtimber)
- 4,316 10,281 14,597 - 272 1,117 1,389
Private equity - - 27,394 27,394 - - 3,439 3,439
Hedge funds - 11,645 4,469 16,114 - 1,039 401 1,440
Derivative assets/ liabilities
7 99 106 (2) 39 - 37
Other assets/liabilities - (13) - (1,609) - - - 85
Total Assets $65,725 $41,847 $42,144 $148,120 $5,406 $6,104 $4,957 $16,551
Investment Strategy The investment policy establishes the framework for investment of the plan assets based on long-term investment objectives and the trade-offs inherent in seeking adequate investment returns within acceptable risk parameters. A key component of the investment policy is to establish a Strategic Asset Allocation (SAA) representing the policy portfolio (i.e., target mix of assets) around which the plans are invested. The SAA for the plans are reviewed in detail and reset about every three years, with more frequent reviews and changes if and as needed based on market conditions.
The key long-term objective is to target and secure asset performance that is reasonable in relation to the growth rate of the underlying liabilities and the assumed sponsor contribution rates. This is particularly so in the case of the SRP, which has liabilities that can be projected with a reasonable level of confidence based on the actuarial assumptions. Given the relatively long investment horizons of the SRP and RSBP, and the relatively modest liquidity needs over the short-term to pay benefits and meet other cash requirements, the focus of the investment strategy is on generating sustainable long-term investment returns through various assets classes and strategies including equity, private equity and real estate.
The SAA is derived using a mix of quantitative analysis that incorporates expected returns and volatilities by asset class as well as correlations across the asset classes, and qualitative considerations such as the desired liquidity needs of the plans. The strategic asset allocation is comprised of a diversified portfolio drawn from among fixed income, equity, real assets and absolute return strategies.
The most recent target asset allocations for the SRP and RSBP were approved in May 2013.
The following table presents the actual and target asset allocation at June 30, 2013 and June 30, 2012 by asset category for the SRP and RSRP. The portfolios are in a period of transition to the new SAA, which explains for the most part, the difference between the target allocation and the actual allocation as of June 30, 2013.
In percent SRP RSBP
Target allocation 2013
% of Plan Assets
Target allocation 2013
% of Plan Assets
Asset Class (%) 2013 2012 (%) 2013 2012
Fixed income & cash 26 31 33 24 30 32
Public equity 27 28 24 29 30 27
Private equity 20 18 20 20 21 24
Hedge funds 10 11 11 10 9 8
Real assetsa 12 12 12 12 10 9
Opportunistic 5 - - 5 - -
Total 100 100 100 100 100 100
aRealassetscompriseprimarilyofRealestateandRealestateinvestmenttrusts(REITs)withasmallallocationtoinfrastructureandtimber
Significant Concentrations of Risk in Plan Assets The assets of the SRP and RSBP are diversified across a variety of asset classes. Investments in these asset classes are further diversified across funds, managers, strategies, geographies and sectors to limit the impact of any individual investment. In spite of such level of diversification, equity market risk remains the primary source of the plans’ overall return volatility.
Risk Management PracticesManaging investment risk is an integral part of managing the assets of the Plan. Liability-driven investment management and asset diversification are central to the overall investment strategy and risk management approach for the SRP. The surplus volatility risk (defined as the annualized standard deviation of asset returns relative to that of liabilities) is considered the primary indicator of the Plan’s overall investment risk. It is used to define the risk tolerance level and establish the overall level of investment risk.
Investment risk is regularly monitored at the absolute level, as well as at the relative levels with respect to the investment policy, manager benchmarks, and liabilities of the Plan. Stress tests are performed periodically using relevant market scenarios to assess the impact of extreme market events. Monitoring of performance (at both manager and asset class levels) against benchmarks and compliance with investment guidelines is carried out on a regular basis as part of the risk monitoring process. Risk management for different asset classes is tailored to their specific characteristics and is an integral part of the external managers’ due diligence and monitoring processes.
Credit risk is monitored on a regular basis and assessed for possible credit event impacts. The liquidity position of the plans is analyzed at regular intervals and periodically tested using various stress scenarios to ensure that the plans have sufficient liquidity to meet all cash flow requirements. In addition, the long-term cash flow needs of the Plans are considered during the SAA exercise and are one of the main drivers in determining maximum allocation to the illiquid investment vehicles.
The Plans mitigate operational risk by maintaining a system of internal control along with other checks and balances at various levels to ensure the controls exist.
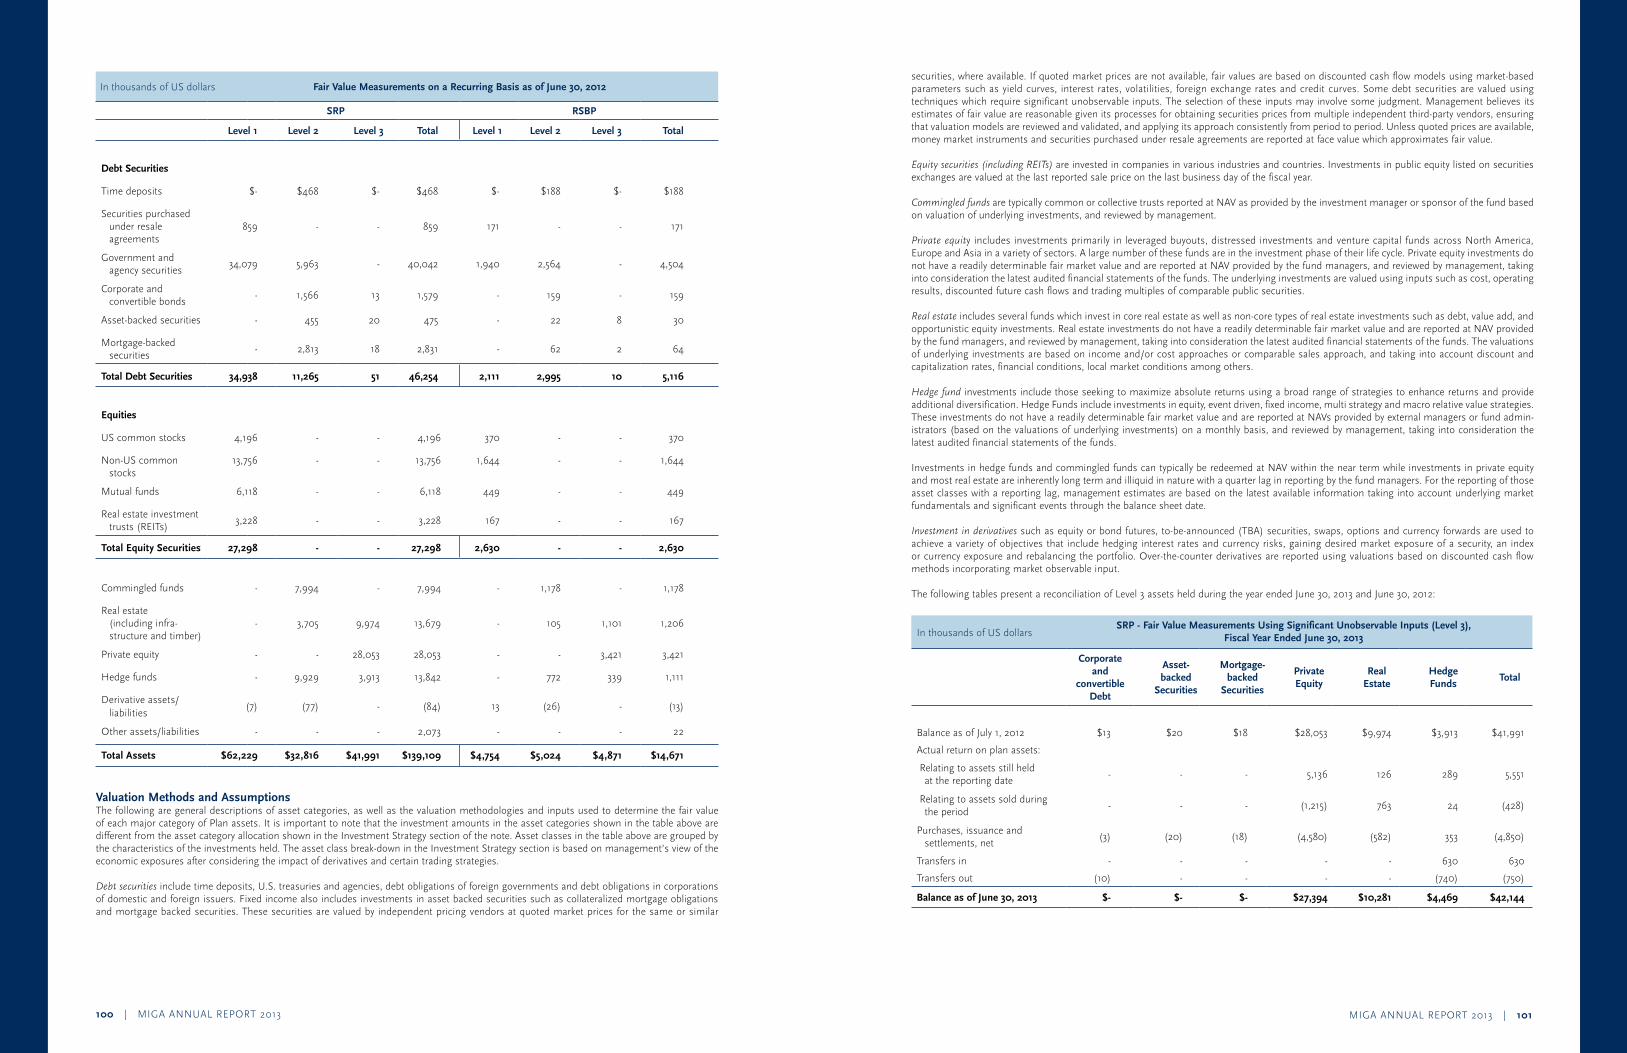
MIGA ANNUAL REPORT 2013 | 101100 | MIGA ANNUAL REPORT 2013
securities, where available. If quoted market prices are not available, fair values are based on discounted cash flow models using market-based parameters such as yield curves, interest rates, volatilities, foreign exchange rates and credit curves. Some debt securities are valued using techniques which require significant unobservable inputs. The selection of these inputs may involve some judgment. Management believes its estimates of fair value are reasonable given its processes for obtaining securities prices from multiple independent third-party vendors, ensuring that valuation models are reviewed and validated, and applying its approach consistently from period to period. Unless quoted prices are available, money market instruments and securities purchased under resale agreements are reported at face value which approximates fair value.
Equitysecurities(includingREITs) are invested in companies in various industries and countries. Investments in public equity listed on securities exchanges are valued at the last reported sale price on the last business day of the fiscal year.
Commingledfunds are typically common or collective trusts reported at NAV as provided by the investment manager or sponsor of the fund based on valuation of underlying investments, and reviewed by management.
Privateequity includes investments primarily in leveraged buyouts, distressed investments and venture capital funds across North America, Europe and Asia in a variety of sectors. A large number of these funds are in the investment phase of their life cycle. Private equity investments do not have a readily determinable fair market value and are reported at NAV provided by the fund managers, and reviewed by management, taking into consideration the latest audited financial statements of the funds. The underlying investments are valued using inputs such as cost, operating results, discounted future cash flows and trading multiples of comparable public securities.
Realestateincludes several funds which invest in core real estate as well as non-core types of real estate investments such as debt, value add, and opportunistic equity investments. Real estate investments do not have a readily determinable fair market value and are reported at NAV provided by the fund managers, and reviewed by management, taking into consideration the latest audited financial statements of the funds. The valuations of underlying investments are based on income and/or cost approaches or comparable sales approach, and taking into account discount and capitalization rates, financial conditions, local market conditions among others.
Hedgefund investments include those seeking to maximize absolute returns using a broad range of strategies to enhance returns and provide additional diversification. Hedge Funds include investments in equity, event driven, fixed income, multi strategy and macro relative value strategies. These investments do not have a readily determinable fair market value and are reported at NAVs provided by external managers or fund admin-istrators (based on the valuations of underlying investments) on a monthly basis, and reviewed by management, taking into consideration the latest audited financial statements of the funds.
Investments in hedge funds and commingled funds can typically be redeemed at NAV within the near term while investments in private equity and most real estate are inherently long term and illiquid in nature with a quarter lag in reporting by the fund managers. For the reporting of those asset classes with a reporting lag, management estimates are based on the latest available information taking into account underlying market fundamentals and significant events through the balance sheet date.
Investmentinderivativessuch as equity or bond futures, to-be-announced (TBA) securities, swaps, options and currency forwards are used to achieve a variety of objectives that include hedging interest rates and currency risks, gaining desired market exposure of a security, an index or currency exposure and rebalancing the portfolio. Over-the-counter derivatives are reported using valuations based on discounted cash flow methods incorporating market observable input.
The following tables present a reconciliation of Level 3 assets held during the year ended June 30, 2013 and June 30, 2012:
In thousands of US dollarsSRP - Fair Value Measurements Using Significant Unobservable Inputs (Level 3),
Fiscal Year Ended June 30, 2013
Corporate and
convertible Debt
Asset- backed
Securities
Mortgage-backed
Securities
Private Equity
Real Estate
Hedge Funds
Total
Balance as of July 1, 2012 $13 $20 $18 $28,053 $9,974 $3,913 $41,991
Actual return on plan assets:
Relating to assets still held at the reporting date
- - - 5,136 126 289 5,551
Relating to assets sold duringthe period
- - - (1,215) 763 24 (428)
Purchases, issuance and settlements, net
(3) (20) (18) (4,580) (582) 353 (4,850)
Transfers in - - - - - 630 630
Transfers out (10) - - - - (740) (750)
Balance as of June 30, 2013 $- $- $- $27,394 $10,281 $4,469 $42,144
In thousands of US dollars Fair Value Measurements on a Recurring Basis as of June 30, 2012
SRP RSBP
Level 1 Level 2 Level 3 Total Level 1 Level 2 Level 3 Total
Debt Securities
Time deposits $- $468 $- $468 $- $188 $- $188
Securities purchased under resaleagreements
859 - - 859 171 - - 171
Government andagency securities
34,079 5,963 - 40,042 1,940 2,564 - 4,504
Corporate and convertible bonds
- 1,566 13 1,579 - 159 - 159
Asset-backed securities - 455 20 475 - 22 8 30
Mortgage-backedsecurities
- 2,813 18 2,831 - 62 2 64
Total Debt Securities 34,938 11,265 51 46,254 2,111 2,995 10 5,116
Equities
US common stocks 4,196 - - 4,196 370 - - 370
Non-US commonstocks
13,756 - - 13,756 1,644 - - 1,644
Mutual funds 6,118 - - 6,118 449 - - 449
Real estate investment trusts (REITs)
3,228 - - 3,228 167 - - 167
Total Equity Securities 27,298 - - 27,298 2,630 - - 2,630
Commingled funds - 7,994 - 7,994 - 1,178 - 1,178
Real estate (including infra-structure and timber)
- 3,705 9,974 13,679 - 105 1,101 1,206
Private equity - - 28,053 28,053 - - 3,421 3,421
Hedge funds - 9,929 3,913 13,842 - 772 339 1,111
Derivative assets/liabilities
(7) (77) - (84) 13 (26) - (13)
Other assets/liabilities - - - 2,073 - - - 22
Total Assets $62,229 $32,816 $41,991 $139,109 $4,754 $5,024 $4,871 $14,671
Valuation Methods and Assumptions The following are general descriptions of asset categories, as well as the valuation methodologies and inputs used to determine the fair value of each major category of Plan assets. It is important to note that the investment amounts in the asset categories shown in the table above are different from the asset category allocation shown in the Investment Strategy section of the note. Asset classes in the table above are grouped by the characteristics of the investments held. The asset class break-down in the Investment Strategy section is based on management’s view of the economic exposures after considering the impact of derivatives and certain trading strategies.
Debtsecurities include time deposits, U.S. treasuries and agencies, debt obligations of foreign governments and debt obligations in corporations of domestic and foreign issuers. Fixed income also includes investments in asset backed securities such as collateralized mortgage obligations and mortgage backed securities. These securities are valued by independent pricing vendors at quoted market prices for the same or similar
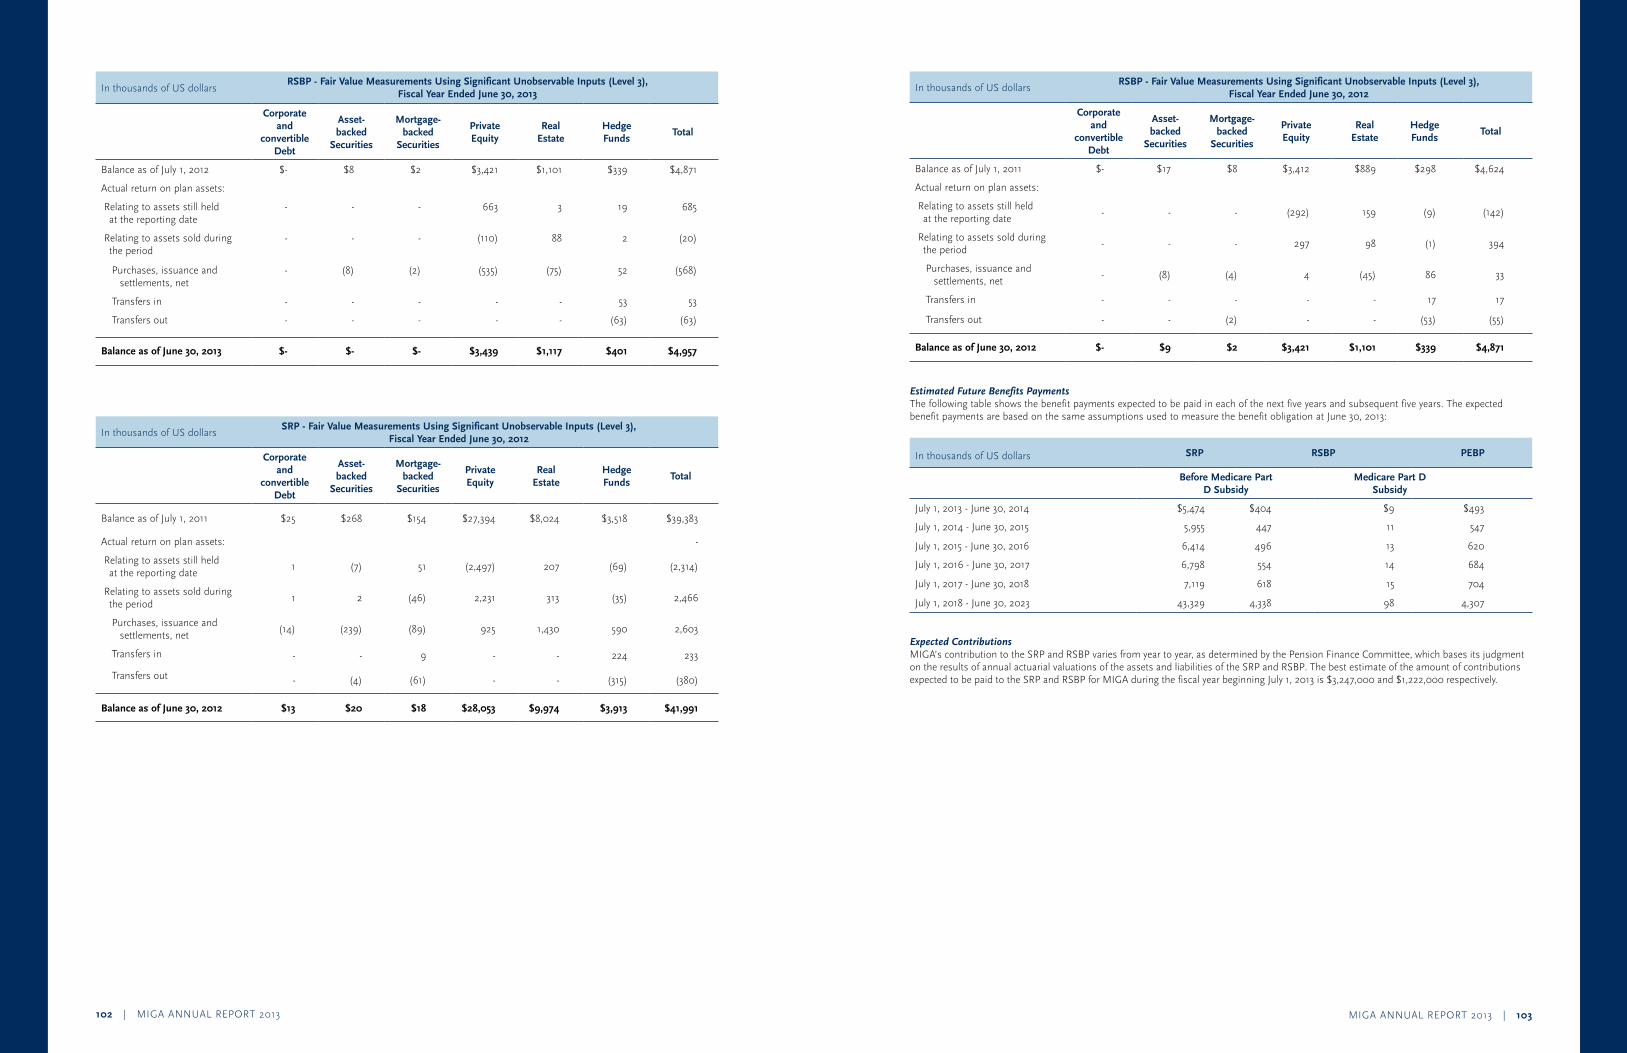
MIGA ANNUAL REPORT 2013 | 103102 | MIGA ANNUAL REPORT 2013
In thousands of US dollarsRSBP - Fair Value Measurements Using Significant Unobservable Inputs (Level 3),
Fiscal Year Ended June 30, 2012
Corporate and
convertible Debt
Asset-backed
Securities
Mortgage-backed
Securities
Private Equity
Real Estate
Hedge Funds
Total
Balance as of July 1, 2011 $- $17 $8 $3,412 $889 $298 $4,624
Actual return on plan assets:
Relating to assets still heldat the reporting date
- - - (292) 159 (9) (142)
Relating to assets sold duringthe period
- - - 297 98 (1) 394
Purchases, issuance and settlements, net
- (8) (4) 4 (45) 86 33
Transfers in - - - - - 17 17
Transfers out - - (2) - - (53) (55)
Balance as of June 30, 2012 $- $9 $2 $3,421 $1,101 $339 $4,871
Estimated Future Benefits PaymentsThe following table shows the benefit payments expected to be paid in each of the next five years and subsequent five years. The expected benefit payments are based on the same assumptions used to measure the benefit obligation at June 30, 2013:
In thousands of US dollars SRP RSBP PEBP
Before Medicare Part D Subsidy
Medicare Part D Subsidy
July 1, 2013 - June 30, 2014 $5,474 $404 $9 $493
July 1, 2014 - June 30, 2015 5,955 447 11 547
July 1, 2015 - June 30, 2016 6,414 496 13 620
July 1, 2016 - June 30, 2017 6,798 554 14 684
July 1, 2017 - June 30, 2018 7,119 618 15 704
July 1, 2018 - June 30, 2023 43,329 4,338 98 4,307
Expected Contributions MIGA’s contribution to the SRP and RSBP varies from year to year, as determined by the Pension Finance Committee, which bases its judgment on the results of annual actuarial valuations of the assets and liabilities of the SRP and RSBP. The best estimate of the amount of contributions expected to be paid to the SRP and RSBP for MIGA during the fiscal year beginning July 1, 2013 is $3,247,000 and $1,222,000 respectively.
In thousands of US dollarsRSBP - Fair Value Measurements Using Significant Unobservable Inputs (Level 3),
Fiscal Year Ended June 30, 2013
Corporate and
convertible Debt
Asset- backed
Securities
Mortgage-backed
Securities
Private Equity
Real Estate
Hedge Funds
Total
Balance as of July 1, 2012 $- $8 $2 $3,421 $1,101 $339 $4,871
Actual return on plan assets:
Relating to assets still heldat the reporting date
- - - 663 3 19 685
Relating to assets sold duringthe period
- - - (110) 88 2 (20)
Purchases, issuance and settlements, net
- (8) (2) (535) (75) 52 (568)
Transfers in - - - - - 53 53
Transfers out - - - - - (63) (63)
Balance as of June 30, 2013 $- $- $- $3,439 $1,117 $401 $4,957
In thousands of US dollarsSRP - Fair Value Measurements Using Significant Unobservable Inputs (Level 3),
Fiscal Year Ended June 30, 2012
Corporate and
convertible Debt
Asset- backed
Securities
Mortgage-backed
Securities
Private Equity
Real Estate
Hedge Funds
Total
Balance as of July 1, 2011 $25 $268 $154 $27,394 $8,024 $3,518 $39,383
Actual return on plan assets: -
Relating to assets still held at the reporting date
1 (7) 51 (2,497) 207 (69) (2,314)
Relating to assets sold duringthe period
1 2 (46) 2,231 313 (35) 2,466
Purchases, issuance and settlements, net
(14) (239) (89) 925 1,430 590 2,603
Transfers in - - 9 - - 224 233
Transfers out - (4) (61) - - (315) (380)
Balance as of June 30, 2012 $13 $20 $18 $28,053 $9,974 $3,913 $41,991
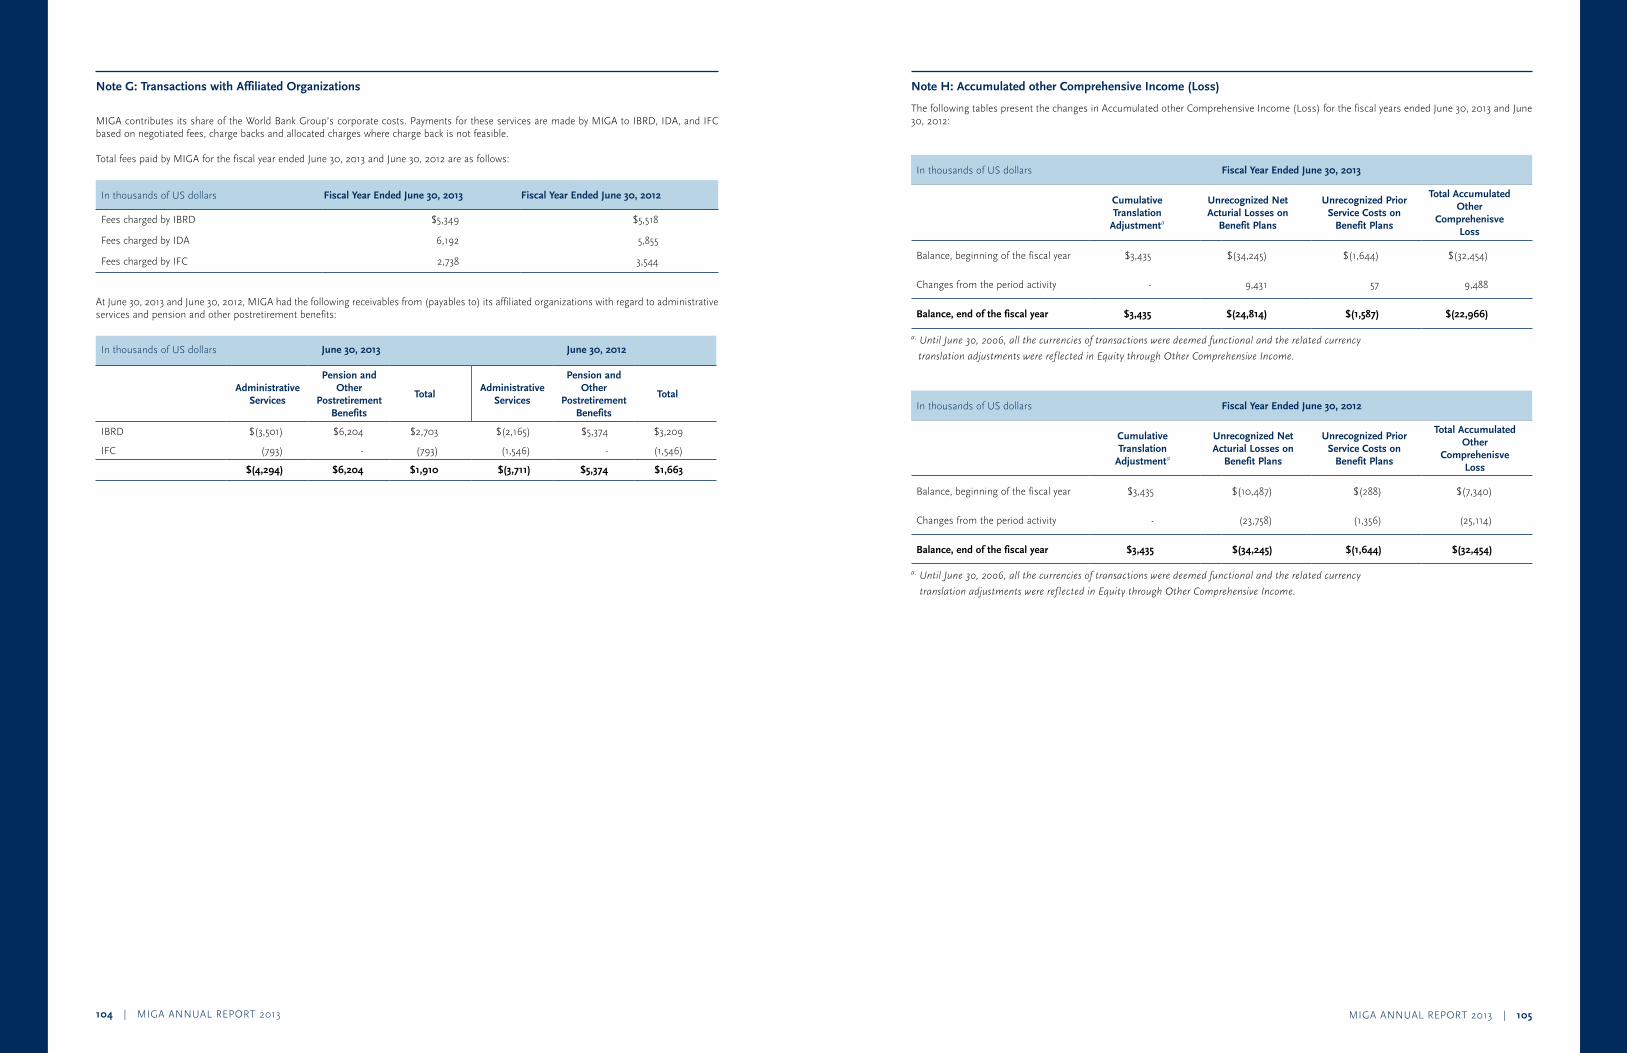
MIGA ANNUAL REPORT 2013 | 105104 | MIGA ANNUAL REPORT 2013
Note H: Accumulated other Comprehensive Income (Loss)
The following tables present the changes in Accumulated other Comprehensive Income (Loss) for the fiscal years ended June 30, 2013 and June 30, 2012:
In thousands of US dollars Fiscal Year Ended June 30, 2013
Cumulative Translation
Adjustmenta
Unrecognized Net Acturial Losses on
Benefit Plans
Unrecognized Prior Service Costs on
Benefit Plans
Total Accumulated Other
Comprehenisve Loss
Balance, beginning of the fiscal year $3,435 $(34,245) $(1,644) $(32,454)
Changes from the period activity - 9,431 57 9,488
Balance, end of the fiscal year $3,435 $(24,814) $(1,587) $(22,966)
a.UntilJune30,2006,allthecurrenciesoftransactionsweredeemedfunctionalandtherelatedcurrency
translationadjustmentswerereflectedinEquitythroughOtherComprehensiveIncome.
In thousands of US dollars Fiscal Year Ended June 30, 2012
Cumulative Translation
Adjustmenta
Unrecognized Net Acturial Losses on
Benefit Plans
Unrecognized Prior Service Costs on
Benefit Plans
Total Accumulated Other
Comprehenisve Loss
Balance, beginning of the fiscal year $3,435 $(10,487) $(288) $(7,340)
Changes from the period activity - (23,758) (1,356) (25,114)
Balance, end of the fiscal year $3,435 $(34,245) $(1,644) $(32,454)
a.UntilJune30,2006,allthecurrenciesoftransactionsweredeemedfunctionalandtherelatedcurrency
translationadjustmentswerereflectedinEquitythroughOtherComprehensiveIncome.
Note G: Transactions with Affiliated Organizations
MIGA contributes its share of the World Bank Group’s corporate costs. Payments for these services are made by MIGA to IBRD, IDA, and IFC based on negotiated fees, charge backs and allocated charges where charge back is not feasible.
Total fees paid by MIGA for the fiscal year ended June 30, 2013 and June 30, 2012 are as follows:
In thousands of US dollars Fiscal Year Ended June 30, 2013 Fiscal Year Ended June 30, 2012
Fees charged by IBRD $5,349 $5,518
Fees charged by IDA 6,192 5,855
Fees charged by IFC 2,738 3,544
At June 30, 2013 and June 30, 2012, MIGA had the following receivables from (payables to) its affiliated organizations with regard to administrative services and pension and other postretirement benefits:
In thousands of US dollars June 30, 2013 June 30, 2012
Administrative Services
Pension and Other
Postretirement Benefits
TotalAdministrative
Services
Pension and Other
Postretirement Benefits
Total
IBRD $(3,501) $6,204 $2,703 $(2,165) $5,374 $3,209
IFC (793) - (793) (1,546) - (1,546)
$(4,294) $6,204 $1,910 $(3,711) $5,374 $1,663
MIGA ANNUAL REPORT 2013 | 107106 | MIGA ANNUAL REPORT 2013
Note I: Fair Value Measurement
Fair value is defined as the price that would be received to sell a financial asset or paid to transfer a financial liability in an orderly transaction be-tween market participants at the measurement date. MIGA uses observable market data, when available, and minimizes the use of unobservable inputs when determining fair value. The fair values of MIGA’s cash and non-negotiable, non interest-bearing demand obligations, receivables for investment securities sold, payables for investment securities purchased, accounts payable and accrued expenses approximate their carrying values. The fair values of government obligations are based on quoted market prices and the fair values of asset-backed securities are based on pricing models for which market observable inputs are used. The degree to which management judgment is involved in determining the fair value of a financial instrument is dependent upon the availability of quoted market prices or observable market parameters. For financial instru-ments that trade actively and have quoted market prices or observable market parameters, there is minimal subjectivity involved in measuring fair value. Substantially all of MIGA’s financial instruments use either of the foregoing methodologies to determine fair values that are recorded on its financial statements.
Note J: Risk Management
The responsibility for approving MIGA’s risk management policies lies with the Board of Directors. The Audit Committee of the Board deals with risk management issues. While the Executive Vice President assumes the responsibility for overall risk management with the support of the senior management team, the responsibility for the design and operational implementation of the risk management framework lies with the Finance and Risk Management Group with coordination from the Legal Affairs and Claims Group, the Operations Group and the Economics and Sustainability Group.
Risk CategoriesMIGA is exposed to a variety of risks and uses risk management programs such as an Economic Capital Framework, and reinsurance arrangements to manage its risk. Below is a description of risk management systems of the important risks for MIGA.
r Insurance Risk Assessment of non–commercial and political risk forms an integral part of MIGA’s underwriting process, and includes the analysis of both country-related and project-related risks. Insurance risk arises from MIGA’s core business of issuing investment guarantees. MIGA’s earnings depend upon the extent to which claims experience is consistent with assumptions used in setting prices for products and establishing technical provisions and liabilities for claims. If actual claims experience of the Agency is less favorable than underlying assumptions, then income would be reduced. MIGA monitors claim activities and provisions for pending claims. In addition, claims reserves for the guarantee portfolio are calculated, using MIGA’s Economic Capital model.
r Economic Capital and Portfolio Risk ModelingFor portfolio risk management purposes, MIGA currently utilizes an Economic Capital (EC) Model, based on best practices framework used in risk modeling. The Economic Capital concept is a widely recognized risk management tool in the banking and insurance industries, defining the minimum amount of capital an organization needs to hold in order to sustain larger than expected losses with a high degree of confidence, over a defined time horizon and given the risk exposure and defined risk tolerance. MIGA defines its economic capital as the 99.99th percentile of the aggregate loss distribution over a one year horizon, minus the mean of the loss distribution, which is in line with industry practice.
The model helps evaluate concentration risk in the guarantee portfolio and facilitates active, risk-based exposure management by allocating the Economic Capital to particular regions, countries, sectors, covers, or individual contracts, based on their respective risk contribution. In order to prevent excessive risk concentration, MIGA uses the Economic Capital model to set exposure limits per country and per project, and to support decision making in terms of pricing and exposure retention for new projects. MIGA’s reinsurance program, including treaty and facultative rein-surance, is linked to the portfolio risk modeling and helps manage the risk profile of the portfolio.
The Economic Capital model is also used in the assessment of MIGA’s capital adequacy, and provides the analytical basis for risk-based pricing of its products as well as quantification of the need for prudent technical provisions for claims. In addition, the model-based capital adequacy assessment determines the size and duration targets for MIGA’s liquidity holdings. The economic capital, pricing models and underlying pa-rameters are reviewed periodically. EC-based risk measures are combined with nominal exposures and income information in a comprehensive portfolio exposure and risk report prepared for MIGA management on a monthly basis.
r Credit Risk Counter-party credit risk in MIGA’s portfolio is the risk that reinsurers would fail to pay their share of a claim. MIGA requires that private sector reinsurers, with which it conducts business, be rated by at least two of the four major rating agencies (Standard & Poor’s, A.M. Best, Moody’s and Fitch), and that the ratings be above a minimum threshold. Also, MIGA has established limits at both the project and portfolio levels, which restrict the amount of reinsurance.
At present MIGA’s investment portfolio does not have significant credit risk exposure. MIGA currently invests in fixed income securities with high credit quality. The Investment authorization stipulates that government or agency sponsored debt securities be AA-rated or above, time deposits be A-rated or above, and corporate debt securities be AAA-rated.
r Interest Rate Risk Interest rate changes affect the market values of MIGA’s invested assets. A need to liquidate assets to pay for claims in an unfavorable interest rate environment may generate trading losses and reduce investment income. Changes in interest rates will also affect prepayment speeds of mortgage and asset backed security holdings, which may affect the duration of the asset portfolio. A 100 basis point parallel shift in the yield curve would impact the net income for the fiscal year ended June 30, 2013, by approximately $13.5 million ($19.9 million – June 30, 2012). This interest rate sensitivity is illustrative only and is based on simplified scenarios. The impact of a parallel shift in interest rates is determined using market value weighted portfolio duration applied to invested asset balance at year end.
r Foreign Exchange Rate Risk The majority of MIGA’s assets and contingent liabilities are denominated in USD, but some guarantee contracts are issued in other currencies such as EUR. To the extent that a claim is made in a non-USD currency and requires payment in excess of MIGA’s holdings of that currency, MIGA may face a foreign exchange related loss in converting to the needed currency to pay for a claim. A 10% change in the USD/Euro year end exchange rate would impact net income for the fiscal year ended June 30, 2013, by approximately $6.8 million ($9.0 million – fiscal year end June 30, 2012) and net guarantee exposure by approximately $222.0 million ($229.7 million – fiscal year end June 30, 2012). The impact on the net income is mitigated by an offsetting effect due to exchange rate movement on investment portfolio and other assets. This foreign exchange rate sensitivity is illustrative only and is based on simplified scenarios.
r Liquidity Risk Adequate liquidity resources need to be maintained to sustain the Agency over prolonged periods of cash payouts due to claims. MIGA assesses and monitors the availability of its liquid assets on a periodic basis and analyzes the impact on its finances (capital and liquidity) under stress scenarios where claims situations propagate through contagion across countries and regions. During the fiscal year ended June 30, 2013, there was one claim (fiscal year ended June 30, 2012 - None) filed with the Agency.
r Operational Risk Operational Risk is intrinsic to financial institutions and is an important component of the agency-wide risk management framework. The most important types of operational risk involve breakdowns in internal controls, processes, systems and corporate governance.
MIGA mitigates operational risks by maintaining a sound internal control system. Since 2000, MIGA has adopted the 1992 Committee of Spon-soring Organizations of the Treadway Commission (COSO)’s integrated internal control framework, in line with IBRD/IDA and IFC, to regularly evaluate the effectiveness of internal control system. In addition, MIGA has introduced an integrated risk management process to strengthen monitoring of the operational risks and controls in financial reporting, and the effectiveness of key controls in the financial reporting process are assessed through the internal quality assurance review process.
MIGA’s internal control is regularly evaluated through independent review by the Internal Audit Department (IAD) of the World Bank Group.
With regard to information technology, all MIGA information systems and applications are hosted on the IBRD technology infrastructure that is configured and adherent to the information security policy and procedures of the World Bank Group. In addition, increased collaboration with the World Bank Group has allowed MIGA to gain access to a larger pool of specialized skill sets to support its information systems. MIGA’s client relationship management system (MIGA CRM) is fully integrated with the Agency’s core financial system (Guarantee Database). Its content is reviewed and verified against an external Anti-Money Laundering (AML) and Combating the Financing of Terrorism (CFT) database service. MIGA redesigned its core information and financial system for managing and reporting data on activities supporting the guarantee process and imple-mented a new Guarantee Database on a SAP-based platform in March 2010.
For business continuity, MIGA’s corporate web services have now been added to MIGA’s information systems already hosted at the World Bank Group’s Business Continuity Center. In addition, MIGA departments have further documented their business processes required to support the Agency’s effort to re-establish basic operations following a crisis. For data security, more robust reporting functions and security monitoring have been implemented to further enhance MIGA’s information security.
r Legal Risk Legal Risk arise primarily from changes in the legal parameters of MIGA’s member countries as a result of legislation or court decisions that may affect MIGA’s activities. There are also legal risks associated with MIGA being involved in legal disputes and arbitration proceedings, especially in the context of claim resolution or settlement.
MIGA manages these risks by monitoring current and prospective future developments by way of ongoing discussions with member countries’ representatives on the Board of Directors and Council of Governors. MIGA also shares information and analyses with other members of the World Bank Group, the IMF and the United Nations. In addition, MIGA actively participates as a member of the Berne Union in discussions and analyses of the changes in the operating investment environment in its member countries.
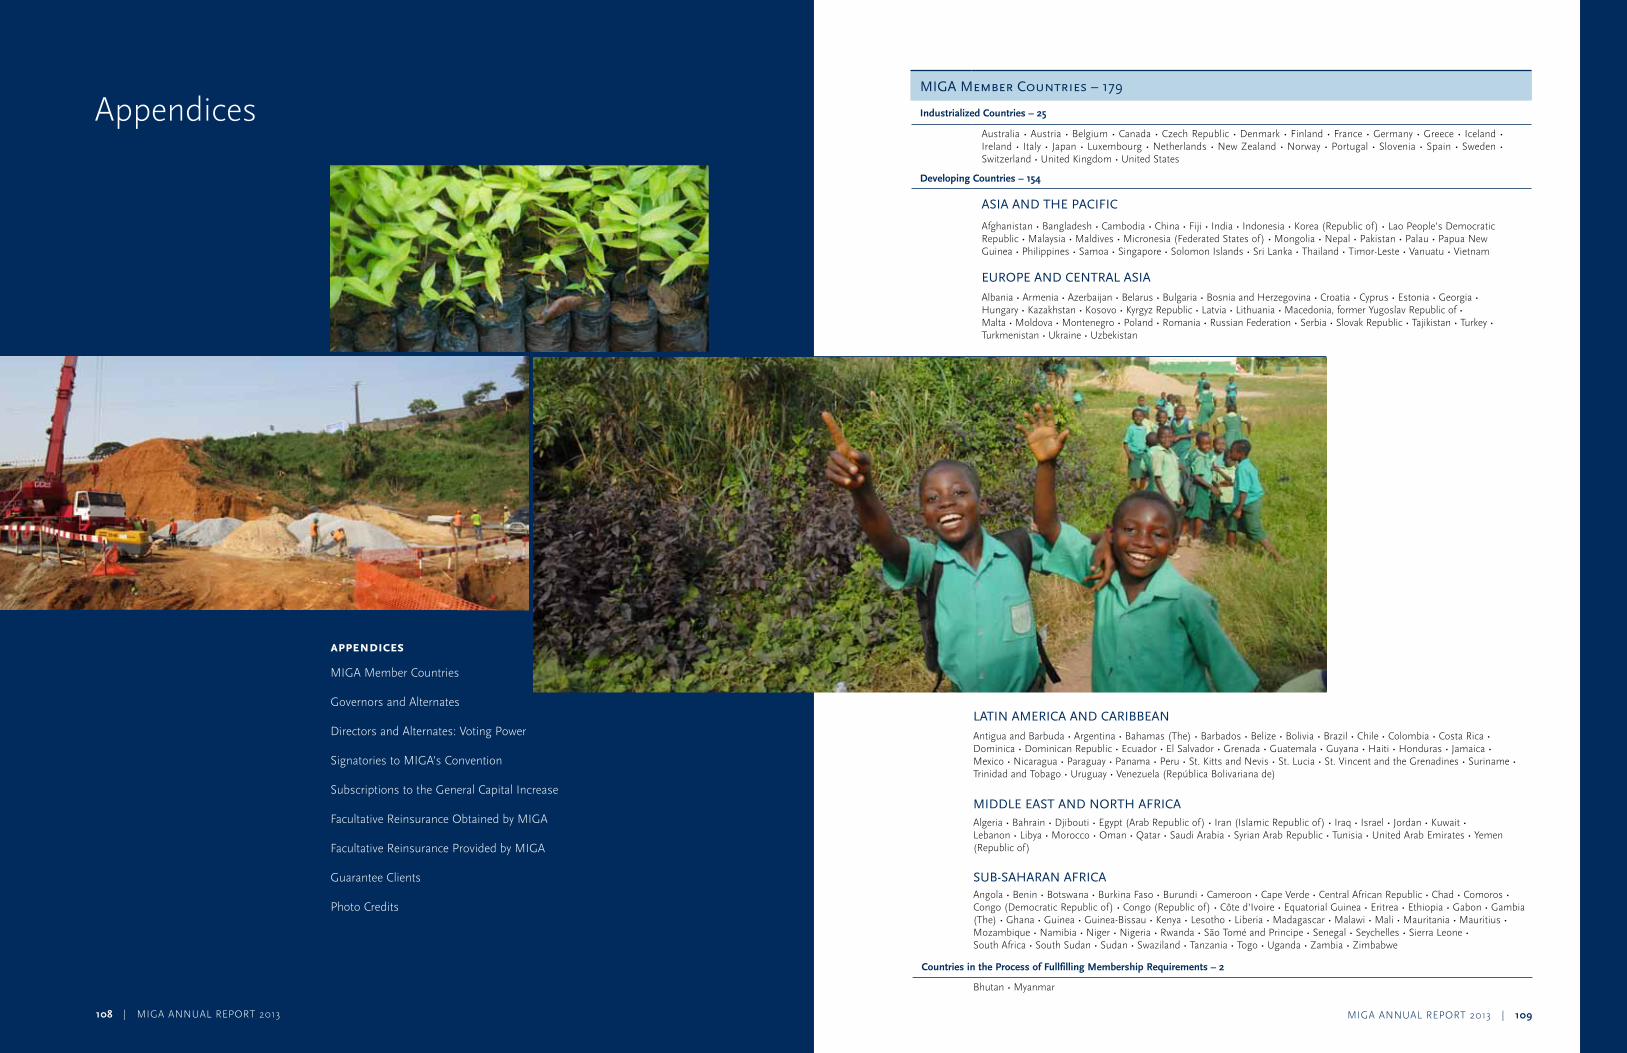
MIGA ANNUAL REPORT 2013 | 109
108 | MIGA ANNUAL REPORT 2013
Appendices
appendices
MIGA Member Countries
Governors and Alternates
Directors and Alternates: Voting Power
Signatories to MIGA’s Convention
Subscriptions to the General Capital Increase
Facultative Reinsurance Obtained by MIGA
Facultative Reinsurance Provided by MIGA
Guarantee Clients
Photo Credits
mIgA member Countries – 179
Industrialized Countries – 25
Australia • Austria • Belgium • Canada • Czech Republic • Denmark • Finland • France • Germany • Greece • Iceland • Ireland • Italy • Japan • Luxembourg • Netherlands • New Zealand • Norway • Portugal • Slovenia • Spain • Sweden • Switzerland • United Kingdom • United States
Developing Countries – 154
AsIA AnD tHe pACIFIC
Afghanistan • Bangladesh • Cambodia • China • Fiji • India • Indonesia • Korea (Republic of) • Lao People’s Democratic Republic • Malaysia • Maldives • Micronesia (Federated States of) • Mongolia • Nepal • Pakistan • Palau • Papua New Guinea • Philippines • Samoa • Singapore • Solomon Islands • Sri Lanka • Thailand • Timor-Leste • Vanuatu • Vietnam
europe AnD CentrAL AsIA
Albania • Armenia • Azerbaijan • Belarus • Bulgaria • Bosnia and Herzegovina • Croatia • Cyprus • Estonia • Georgia • Hungary • Kazakhstan • Kosovo • Kyrgyz Republic • Latvia • Lithuania • Macedonia, former Yugoslav Republic of • Malta • Moldova • Montenegro • Poland • Romania • Russian Federation • Serbia • Slovak Republic • Tajikistan • Turkey • Turkmenistan • Ukraine • Uzbekistan
LAtIn AmerICA AnD CArIBBeAn
Antigua and Barbuda • Argentina • Bahamas (The) • Barbados • Belize • Bolivia • Brazil • Chile • Colombia • Costa Rica • Dominica • Dominican Republic • Ecuador • El Salvador • Grenada • Guatemala • Guyana • Haiti • Honduras • Jamaica • Mexico • Nicaragua • Paraguay • Panama • Peru • St. Kitts and Nevis • St. Lucia • St. Vincent and the Grenadines • Suriname • Trinidad and Tobago • Uruguay • Venezuela (República Bolivariana de)
mIDDLe eAst AnD nortH AFrICAAlgeria • Bahrain • Djibouti • Egypt (Arab Republic of) • Iran (Islamic Republic of) • Iraq • Israel • Jordan • Kuwait • Lebanon • Libya • Morocco • Oman • Qatar • Saudi Arabia • Syrian Arab Republic • Tunisia • United Arab Emirates • Yemen (Republic of)
suB-sAHArAn AFrICAAngola • Benin • Botswana • Burkina Faso • Burundi • Cameroon • Cape Verde • Central African Republic • Chad • Comoros • Congo (Democratic Republic of) • Congo (Republic of) • Côte d’Ivoire • Equatorial Guinea • Eritrea • Ethiopia • Gabon • Gambia (The) • Ghana • Guinea • Guinea-Bissau • Kenya • Lesotho • Liberia • Madagascar • Malawi • Mali • Mauritania • Mauritius • Mozambique • Namibia • Niger • Nigeria • Rwanda • São Tomé and Principe • Senegal • Seychelles • Sierra Leone • South Africa • South Sudan • Sudan • Swaziland • Tanzania • Togo • Uganda • Zambia • Zimbabwe
Countries in the Process of Fullfilling Membership Requirements – 2
Bhutan • Myanmar
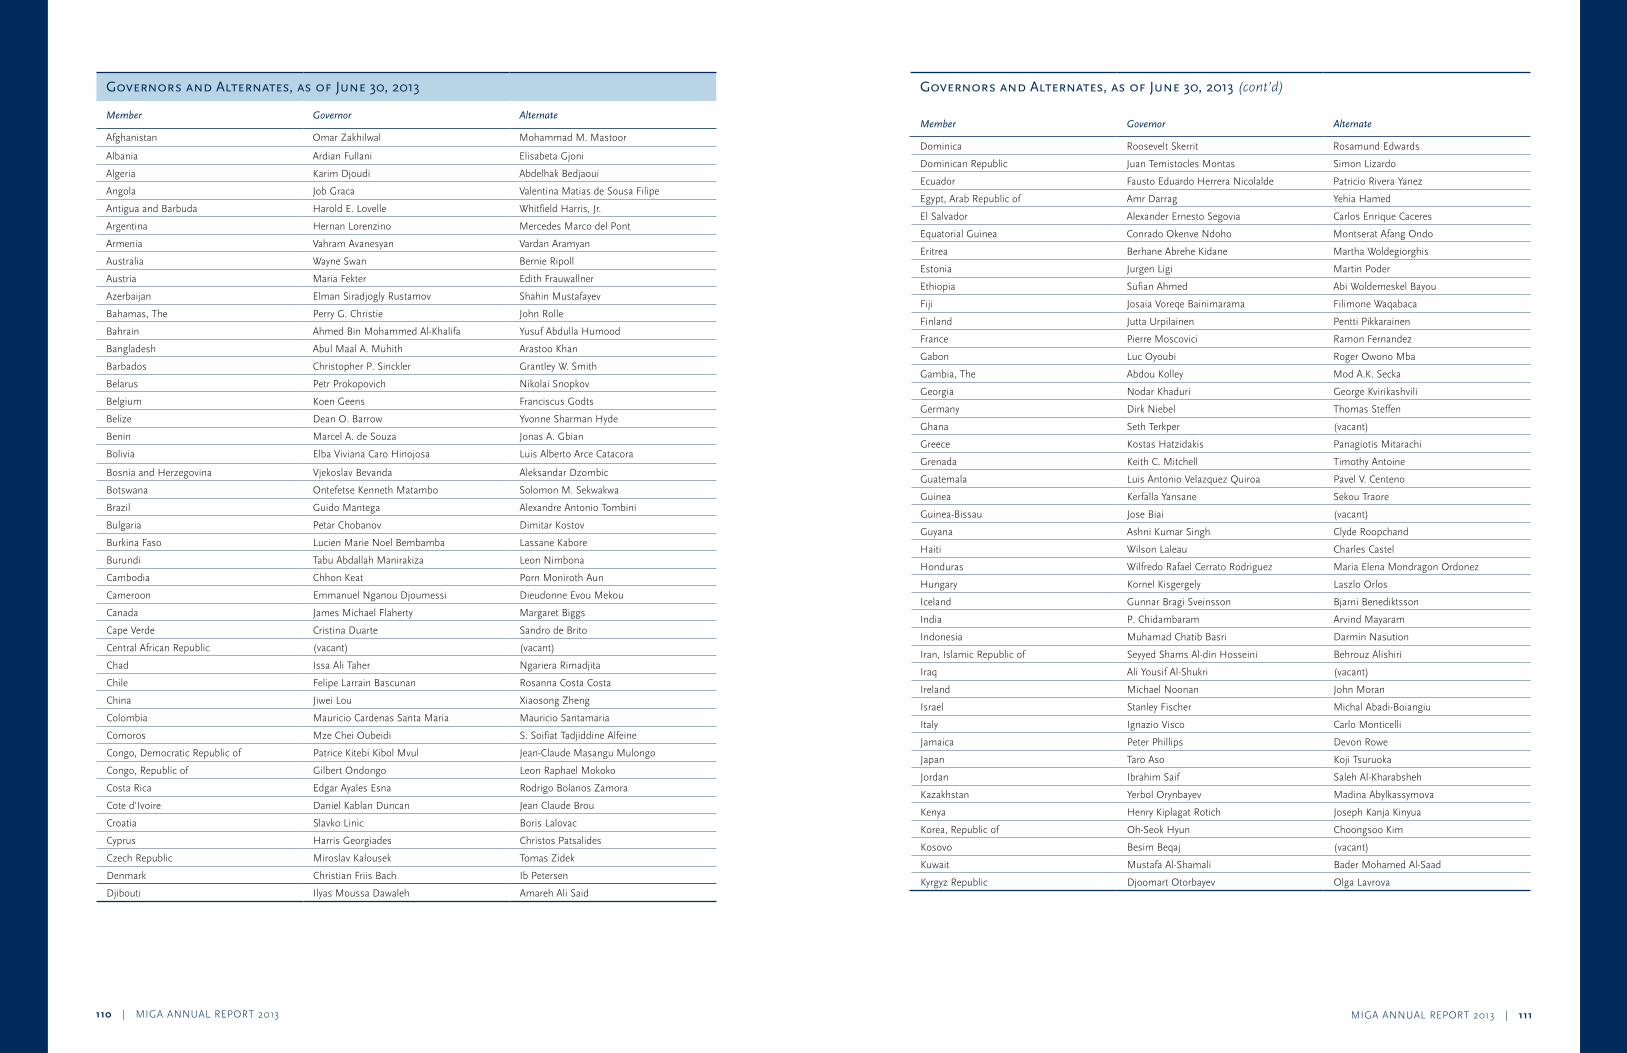
MIGA ANNUAL REPORT 2013 | 111110 | MIGA ANNUAL REPORT 2013
governors and Alternates, as of June 30, 2013
Member Governor Alternate
Afghanistan Omar Zakhilwal Mohammad M. Mastoor
Albania Ardian Fullani Elisabeta Gjoni
Algeria Karim Djoudi Abdelhak Bedjaoui
Angola Job Graca Valentina Matias de Sousa Filipe
Antigua and Barbuda Harold E. Lovelle Whitfield Harris, Jr.
Argentina Hernan Lorenzino Mercedes Marco del Pont
Armenia Vahram Avanesyan Vardan Aramyan
Australia Wayne Swan Bernie Ripoll
Austria Maria Fekter Edith Frauwallner
Azerbaijan Elman Siradjogly Rustamov Shahin Mustafayev
Bahamas, The Perry G. Christie John Rolle
Bahrain Ahmed Bin Mohammed Al-Khalifa Yusuf Abdulla Humood
Bangladesh Abul Maal A. Muhith Arastoo Khan
Barbados Christopher P. Sinckler Grantley W. Smith
Belarus Petr Prokopovich Nikolai Snopkov
Belgium Koen Geens Franciscus Godts
Belize Dean O. Barrow Yvonne Sharman Hyde
Benin Marcel A. de Souza Jonas A. Gbian
Bolivia Elba Viviana Caro Hinojosa Luis Alberto Arce Catacora
Bosnia and Herzegovina Vjekoslav Bevanda Aleksandar Dzombic
Botswana Ontefetse Kenneth Matambo Solomon M. Sekwakwa
Brazil Guido Mantega Alexandre Antonio Tombini
Bulgaria Petar Chobanov Dimitar Kostov
Burkina Faso Lucien Marie Noel Bembamba Lassane Kabore
Burundi Tabu Abdallah Manirakiza Leon Nimbona
Cambodia Chhon Keat Porn Moniroth Aun
Cameroon Emmanuel Nganou Djoumessi Dieudonne Evou Mekou
Canada James Michael Flaherty Margaret Biggs
Cape Verde Cristina Duarte Sandro de Brito
Central African Republic (vacant) (vacant)
Chad Issa Ali Taher Ngariera Rimadjita
Chile Felipe Larrain Bascunan Rosanna Costa Costa
China Jiwei Lou Xiaosong Zheng
Colombia Mauricio Cardenas Santa Maria Mauricio Santamaria
Comoros Mze Chei Oubeidi S. Soifiat Tadjiddine Alfeine
Congo, Democratic Republic of Patrice Kitebi Kibol Mvul Jean-Claude Masangu Mulongo
Congo, Republic of Gilbert Ondongo Leon Raphael Mokoko
Costa Rica Edgar Ayales Esna Rodrigo Bolanos Zamora
Cote d'Ivoire Daniel Kablan Duncan Jean Claude Brou
Croatia Slavko Linic Boris Lalovac
Cyprus Harris Georgiades Christos Patsalides
Czech Republic Miroslav Kalousek Tomas Zidek
Denmark Christian Friis Bach Ib Petersen
Djibouti Ilyas Moussa Dawaleh Amareh Ali Said
governors and Alternates, as of June 30, 2013 (cont’d)
Member Governor Alternate
Dominica Roosevelt Skerrit Rosamund Edwards
Dominican Republic Juan Temistocles Montas Simon Lizardo
Ecuador Fausto Eduardo Herrera Nicolalde Patricio Rivera Yanez
Egypt, Arab Republic of Amr Darrag Yehia Hamed
El Salvador Alexander Ernesto Segovia Carlos Enrique Caceres
Equatorial Guinea Conrado Okenve Ndoho Montserat Afang Ondo
Eritrea Berhane Abrehe Kidane Martha Woldegiorghis
Estonia Jurgen Ligi Martin Poder
Ethiopia Sufian Ahmed Abi Woldemeskel Bayou
Fiji Josaia Voreqe Bainimarama Filimone Waqabaca
Finland Jutta Urpilainen Pentti Pikkarainen
France Pierre Moscovici Ramon Fernandez
Gabon Luc Oyoubi Roger Owono Mba
Gambia, The Abdou Kolley Mod A.K. Secka
Georgia Nodar Khaduri George Kvirikashvili
Germany Dirk Niebel Thomas Steffen
Ghana Seth Terkper (vacant)
Greece Kostas Hatzidakis Panagiotis Mitarachi
Grenada Keith C. Mitchell Timothy Antoine
Guatemala Luis Antonio Velazquez Quiroa Pavel V. Centeno
Guinea Kerfalla Yansane Sekou Traore
Guinea-Bissau Jose Biai (vacant)
Guyana Ashni Kumar Singh Clyde Roopchand
Haiti Wilson Laleau Charles Castel
Honduras Wilfredo Rafael Cerrato Rodriguez Maria Elena Mondragon Ordonez
Hungary Kornel Kisgergely Laszlo Orlos
Iceland Gunnar Bragi Sveinsson Bjarni Benediktsson
India P. Chidambaram Arvind Mayaram
Indonesia Muhamad Chatib Basri Darmin Nasution
Iran, Islamic Republic of Seyyed Shams Al-din Hosseini Behrouz Alishiri
Iraq Ali Yousif Al-Shukri (vacant)
Ireland Michael Noonan John Moran
Israel Stanley Fischer Michal Abadi-Boiangiu
Italy Ignazio Visco Carlo Monticelli
Jamaica Peter Phillips Devon Rowe
Japan Taro Aso Koji Tsuruoka
Jordan Ibrahim Saif Saleh Al-Kharabsheh
Kazakhstan Yerbol Orynbayev Madina Abylkassymova
Kenya Henry Kiplagat Rotich Joseph Kanja Kinyua
Korea, Republic of Oh-Seok Hyun Choongsoo Kim
Kosovo Besim Beqaj (vacant)
Kuwait Mustafa Al-Shamali Bader Mohamed Al-Saad
Kyrgyz Republic Djoomart Otorbayev Olga Lavrova
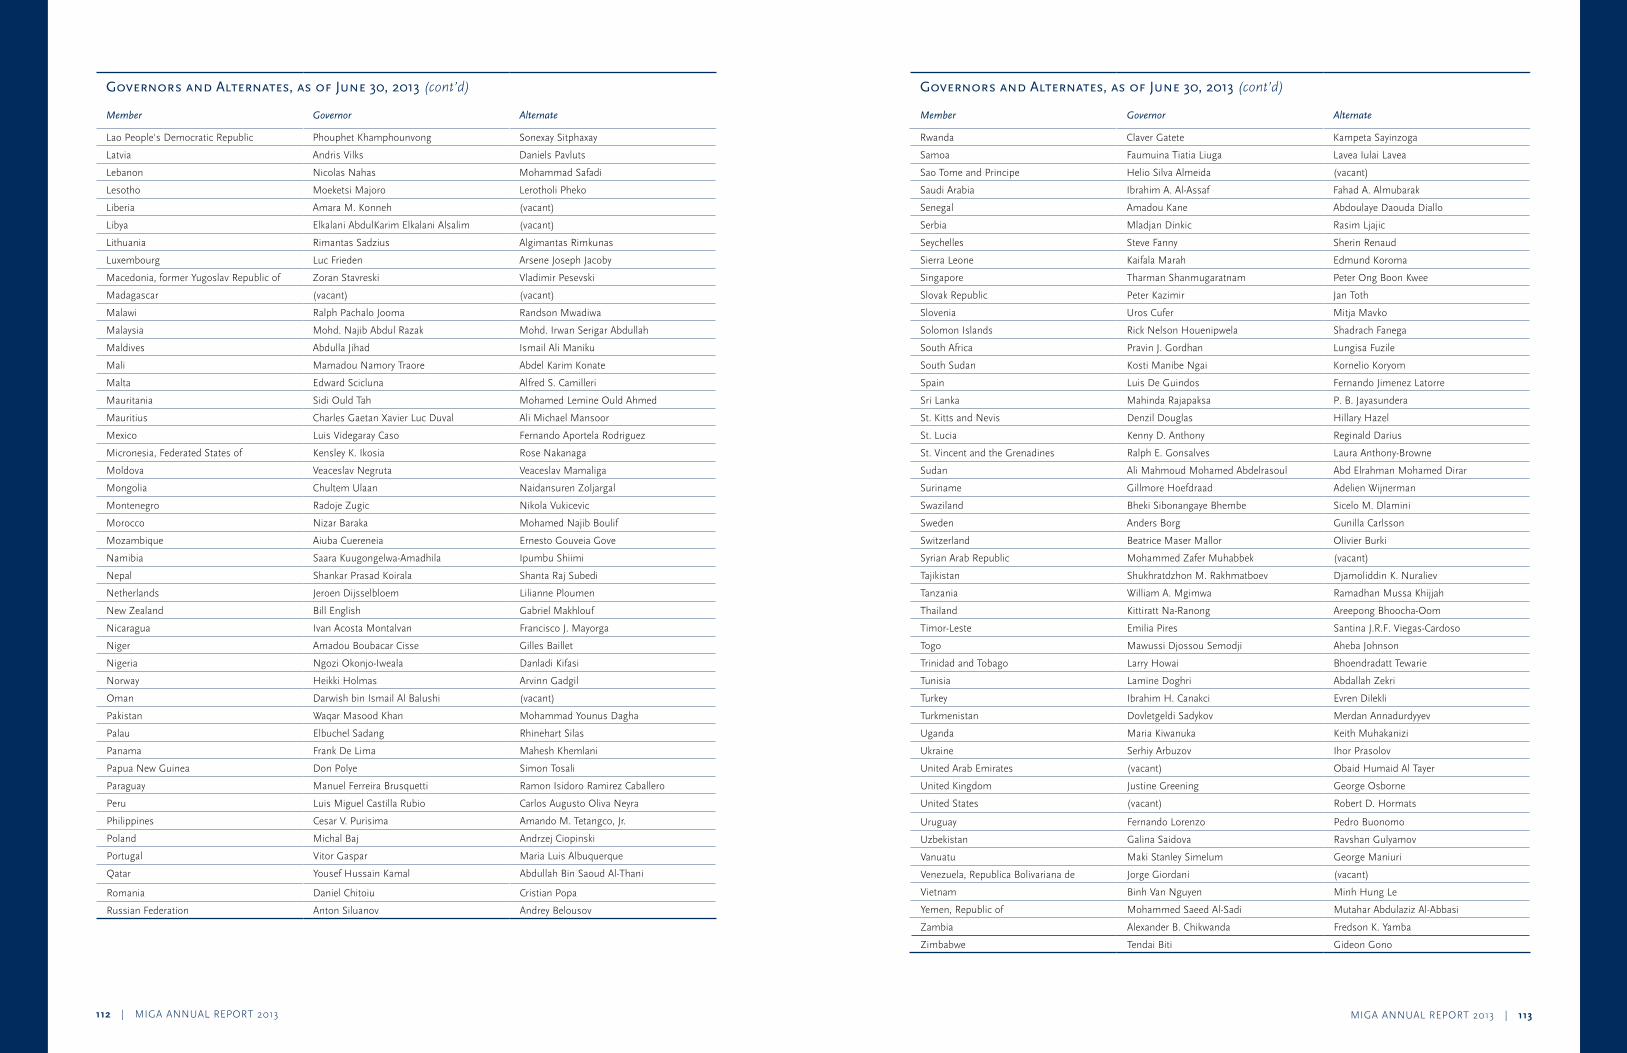
MIGA ANNUAL REPORT 2013 | 113112 | MIGA ANNUAL REPORT 2013
governors and Alternates, as of June 30, 2013 (cont’d)
Member Governor Alternate
Lao People's Democratic Republic Phouphet Khamphounvong Sonexay Sitphaxay
Latvia Andris Vilks Daniels Pavluts
Lebanon Nicolas Nahas Mohammad Safadi
Lesotho Moeketsi Majoro Lerotholi Pheko
Liberia Amara M. Konneh (vacant)
Libya Elkalani AbdulKarim Elkalani Alsalim (vacant)
Lithuania Rimantas Sadzius Algimantas Rimkunas
Luxembourg Luc Frieden Arsene Joseph Jacoby
Macedonia, former Yugoslav Republic of Zoran Stavreski Vladimir Pesevski
Madagascar (vacant) (vacant)
Malawi Ralph Pachalo Jooma Randson Mwadiwa
Malaysia Mohd. Najib Abdul Razak Mohd. Irwan Serigar Abdullah
Maldives Abdulla Jihad Ismail Ali Maniku
Mali Mamadou Namory Traore Abdel Karim Konate
Malta Edward Scicluna Alfred S. Camilleri
Mauritania Sidi Ould Tah Mohamed Lemine Ould Ahmed
Mauritius Charles Gaetan Xavier Luc Duval Ali Michael Mansoor
Mexico Luis Videgaray Caso Fernando Aportela Rodriguez
Micronesia, Federated States of Kensley K. Ikosia Rose Nakanaga
Moldova Veaceslav Negruta Veaceslav Mamaliga
Mongolia Chultem Ulaan Naidansuren Zoljargal
Montenegro Radoje Zugic Nikola Vukicevic
Morocco Nizar Baraka Mohamed Najib Boulif
Mozambique Aiuba Cuereneia Ernesto Gouveia Gove
Namibia Saara Kuugongelwa-Amadhila Ipumbu Shiimi
Nepal Shankar Prasad Koirala Shanta Raj Subedi
Netherlands Jeroen Dijsselbloem Lilianne Ploumen
New Zealand Bill English Gabriel Makhlouf
Nicaragua Ivan Acosta Montalvan Francisco J. Mayorga
Niger Amadou Boubacar Cisse Gilles Baillet
Nigeria Ngozi Okonjo-Iweala Danladi Kifasi
Norway Heikki Holmas Arvinn Gadgil
Oman Darwish bin Ismail Al Balushi (vacant)
Pakistan Waqar Masood Khan Mohammad Younus Dagha
Palau Elbuchel Sadang Rhinehart Silas
Panama Frank De Lima Mahesh Khemlani
Papua New Guinea Don Polye Simon Tosali
Paraguay Manuel Ferreira Brusquetti Ramon Isidoro Ramirez Caballero
Peru Luis Miguel Castilla Rubio Carlos Augusto Oliva Neyra
Philippines Cesar V. Purisima Amando M. Tetangco, Jr.
Poland Michal Baj Andrzej Ciopinski
Portugal Vitor Gaspar Maria Luis Albuquerque
Qatar Yousef Hussain Kamal Abdullah Bin Saoud Al-Thani
Romania Daniel Chitoiu Cristian Popa
Russian Federation Anton Siluanov Andrey Belousov
governors and Alternates, as of June 30, 2013 (cont’d)
Member Governor Alternate
Rwanda Claver Gatete Kampeta Sayinzoga
Samoa Faumuina Tiatia Liuga Lavea Iulai Lavea
Sao Tome and Principe Helio Silva Almeida (vacant)
Saudi Arabia Ibrahim A. Al-Assaf Fahad A. Almubarak
Senegal Amadou Kane Abdoulaye Daouda Diallo
Serbia Mladjan Dinkic Rasim Ljajic
Seychelles Steve Fanny Sherin Renaud
Sierra Leone Kaifala Marah Edmund Koroma
Singapore Tharman Shanmugaratnam Peter Ong Boon Kwee
Slovak Republic Peter Kazimir Jan Toth
Slovenia Uros Cufer Mitja Mavko
Solomon Islands Rick Nelson Houenipwela Shadrach Fanega
South Africa Pravin J. Gordhan Lungisa Fuzile
South Sudan Kosti Manibe Ngai Kornelio Koryom
Spain Luis De Guindos Fernando Jimenez Latorre
Sri Lanka Mahinda Rajapaksa P. B. Jayasundera
St. Kitts and Nevis Denzil Douglas Hillary Hazel
St. Lucia Kenny D. Anthony Reginald Darius
St. Vincent and the Grenadines Ralph E. Gonsalves Laura Anthony-Browne
Sudan Ali Mahmoud Mohamed Abdelrasoul Abd Elrahman Mohamed Dirar
Suriname Gillmore Hoefdraad Adelien Wijnerman
Swaziland Bheki Sibonangaye Bhembe Sicelo M. Dlamini
Sweden Anders Borg Gunilla Carlsson
Switzerland Beatrice Maser Mallor Olivier Burki
Syrian Arab Republic Mohammed Zafer Muhabbek (vacant)
Tajikistan Shukhratdzhon M. Rakhmatboev Djamoliddin K. Nuraliev
Tanzania William A. Mgimwa Ramadhan Mussa Khijjah
Thailand Kittiratt Na-Ranong Areepong Bhoocha-Oom
Timor-Leste Emilia Pires Santina J.R.F. Viegas-Cardoso
Togo Mawussi Djossou Semodji Aheba Johnson
Trinidad and Tobago Larry Howai Bhoendradatt Tewarie
Tunisia Lamine Doghri Abdallah Zekri
Turkey Ibrahim H. Canakci Evren Dilekli
Turkmenistan Dovletgeldi Sadykov Merdan Annadurdyyev
Uganda Maria Kiwanuka Keith Muhakanizi
Ukraine Serhiy Arbuzov Ihor Prasolov
United Arab Emirates (vacant) Obaid Humaid Al Tayer
United Kingdom Justine Greening George Osborne
United States (vacant) Robert D. Hormats
Uruguay Fernando Lorenzo Pedro Buonomo
Uzbekistan Galina Saidova Ravshan Gulyamov
Vanuatu Maki Stanley Simelum George Maniuri
Venezuela, Republica Bolivariana de Jorge Giordani (vacant)
Vietnam Binh Van Nguyen Minh Hung Le
Yemen, Republic of Mohammed Saeed Al-Sadi Mutahar Abdulaziz Al-Abbasi
Zambia Alexander B. Chikwanda Fredson K. Yamba
Zimbabwe Tendai Biti Gideon Gono
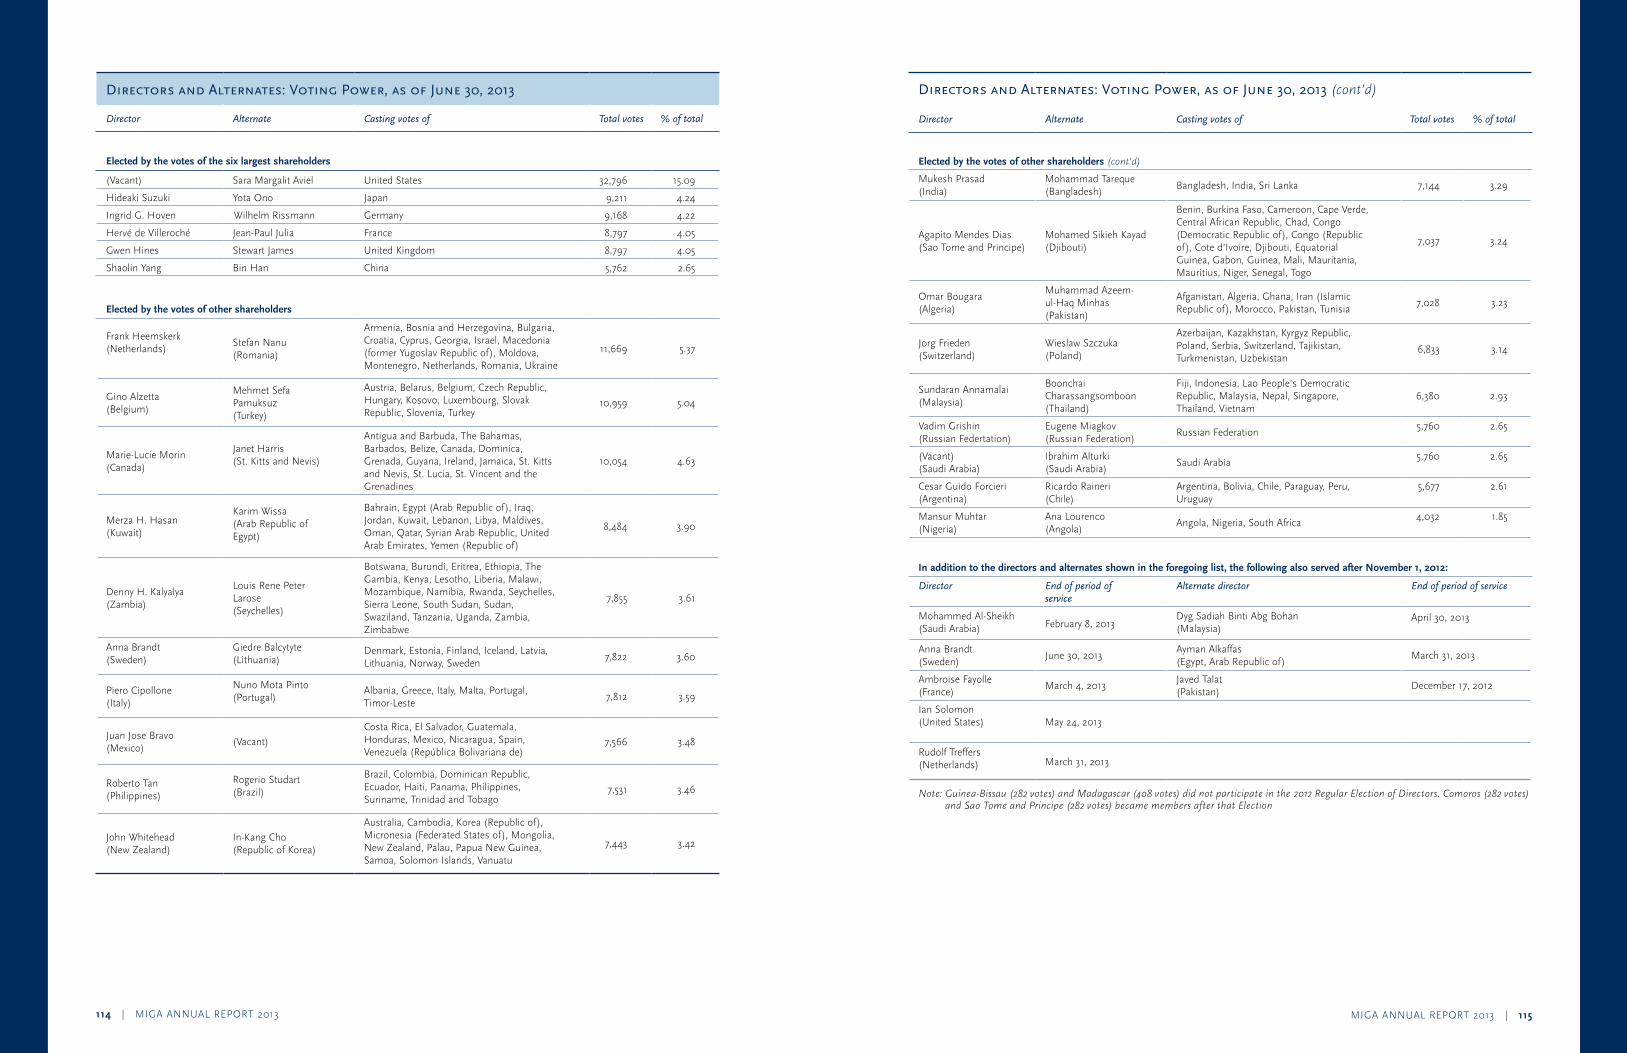
MIGA ANNUAL REPORT 2013 | 115114 | MIGA ANNUAL REPORT 2013
Directors and Alternates: voting power, as of June 30, 2013
Director Alternate Casting votes of Total votes % of total
Elected by the votes of the six largest shareholders
(Vacant) Sara Margalit Aviel United States 32,796 15.09
Hideaki Suzuki Yota Ono Japan 9,211 4.24
Ingrid G. Hoven Wilhelm Rissmann Germany 9,168 4.22
Hervé de Villeroché Jean-Paul Julia France 8,797 4.05
Gwen Hines Stewart James United Kingdom 8,797 4.05
Shaolin Yang Bin Han China 5,762 2.65
Elected by the votes of other shareholders
Frank Heemskerk(Netherlands)
Stefan Nanu(Romania)
Armenia, Bosnia and Herzegovina, Bulgaria, Croatia, Cyprus, Georgia, Israel, Macedonia (former Yugoslav Republic of), Moldova, Montenegro, Netherlands, Romania, Ukraine
11,669 5.37
Gino Alzetta (Belgium)
Mehmet Sefa Pamuksuz(Turkey)
Austria, Belarus, Belgium, Czech Republic, Hungary, Kosovo, Luxembourg, Slovak Republic, Slovenia, Turkey
10,959 5.04
Marie-Lucie Morin (Canada)
Janet Harris(St. Kitts and Nevis)
Antigua and Barbuda, The Bahamas, Barbados, Belize, Canada, Dominica, Grenada, Guyana, Ireland, Jamaica, St. Kitts and Nevis, St. Lucia, St. Vincent and the Grenadines
10,054 4.63
Merza H. Hasan(Kuwait)
Karim Wissa(Arab Republic of Egypt)
Bahrain, Egypt (Arab Republic of), Iraq, Jordan, Kuwait, Lebanon, Libya, Maldives, Oman, Qatar, Syrian Arab Republic, United Arab Emirates, Yemen (Republic of)
8,484 3.90
Denny H. Kalyalya(Zambia)
Louis Rene Peter Larose(Seychelles)
Botswana, Burundi, Eritrea, Ethiopia, The Gambia, Kenya, Lesotho, Liberia, Malawi, Mozambique, Namibia, Rwanda, Seychelles, Sierra Leone, South Sudan, Sudan, Swaziland, Tanzania, Uganda, Zambia, Zimbabwe
7,855 3.61
Anna Brandt(Sweden)
Giedre Balcytyte(Lithuania)
Denmark, Estonia, Finland, Iceland, Latvia, Lithuania, Norway, Sweden
7,822 3.60
Piero Cipollone(Italy)
Nuno Mota Pinto(Portugal)
Albania, Greece, Italy, Malta, Portugal, Timor-Leste
7,812 3.59
Juan Jose Bravo(Mexico)
(Vacant)
Costa Rica, El Salvador, Guatemala, Honduras, Mexico, Nicaragua, Spain, Venezuela (República Bolivariana de)
7,566 3.48
Roberto Tan(Philippines)
Rogerio Studart (Brazil)
Brazil, Colombia, Dominican Republic, Ecuador, Haiti, Panama, Philippines, Suriname, Trinidad and Tobago
7,531 3.46
John Whitehead (New Zealand)
In-Kang Cho (Republic of Korea)
Australia, Cambodia, Korea (Republic of), Micronesia (Federated States of), Mongolia, New Zealand, Palau, Papua New Guinea, Samoa, Solomon Islands, Vanuatu
7,443 3.42
Directors and Alternates: voting power, as of June 30, 2013(cont’d)
Director Alternate Casting votes of Total votes % of total
Elected by the votes of other shareholders (cont’d)
Mukesh Prasad (India)
Mohammad Tareque(Bangladesh)
Bangladesh, India, Sri Lanka 7,144 3.29
Agapito Mendes Dias(Sao Tome and Principe)
Mohamed Sikieh Kayad(Djibouti)
Benin, Burkina Faso, Cameroon, Cape Verde, Central African Republic, Chad, Congo (Democratic Republic of), Congo (Republic of), Cote d’Ivoire, Djibouti, Equatorial Guinea, Gabon, Guinea, Mali, Mauritania, Mauritius, Niger, Senegal, Togo
7,037 3.24
Omar Bougara(Algeria)
Muhammad Azeem-ul-Haq Minhas(Pakistan)
Afganistan, Algeria, Ghana, Iran (Islamic Republic of), Morocco, Pakistan, Tunisia
7,028 3.23
Jorg Frieden(Switzerland)
Wieslaw Szczuka(Poland)
Azerbaijan, Kazakhstan, Kyrgyz Republic, Poland, Serbia, Switzerland, Tajikistan, Turkmenistan, Uzbekistan
6,833 3.14
Sundaran Annamalai(Malaysia)
Boonchai Charassangsomboon(Thailand)
Fiji, Indonesia, Lao People’s Democratic Republic, Malaysia, Nepal, Singapore, Thailand, Vietnam
6,380 2.93
Vadim Grishin(Russian Federtation)
Eugene Miagkov (Russian Federation)
Russian Federation5,760 2.65
(Vacant)(Saudi Arabia)
Ibrahim Alturki (Saudi Arabia)
Saudi Arabia5,760 2.65
Cesar Guido Forcieri(Argentina)
Ricardo Raineri (Chile)
Argentina, Bolivia, Chile, Paraguay, Peru, Uruguay
5,677 2.61
Mansur Muhtar(Nigeria)
Ana Lourenco(Angola)
Angola, Nigeria, South Africa4,032 1.85
In addition to the directors and alternates shown in the foregoing list, the following also served after November 1, 2012:
Director End of period of service
Alternate director End of period of service
Mohammed Al-Sheikh(Saudi Arabia) February 8, 2013
Dyg Sadiah Binti Abg Bohan(Malaysia)
April 30, 2013
Anna Brandt(Sweden)
June 30, 2013 Ayman Alkaffas(Egypt, Arab Republic of)
March 31, 2013
Ambroise Fayolle(France)
March 4, 2013Javed Talat(Pakistan)
December 17, 2012
Ian Solomon(United States) May 24, 2013
Rudolf Treffers(Netherlands) March 31, 2013
Note:Guinea-Bissau(282votes)andMadagascar(408votes)didnotparticipateinthe2012RegularElectionofDirectors.Comoros(282votes)andSaoTomeandPrincipe(282votes)becamemembersafterthatElection
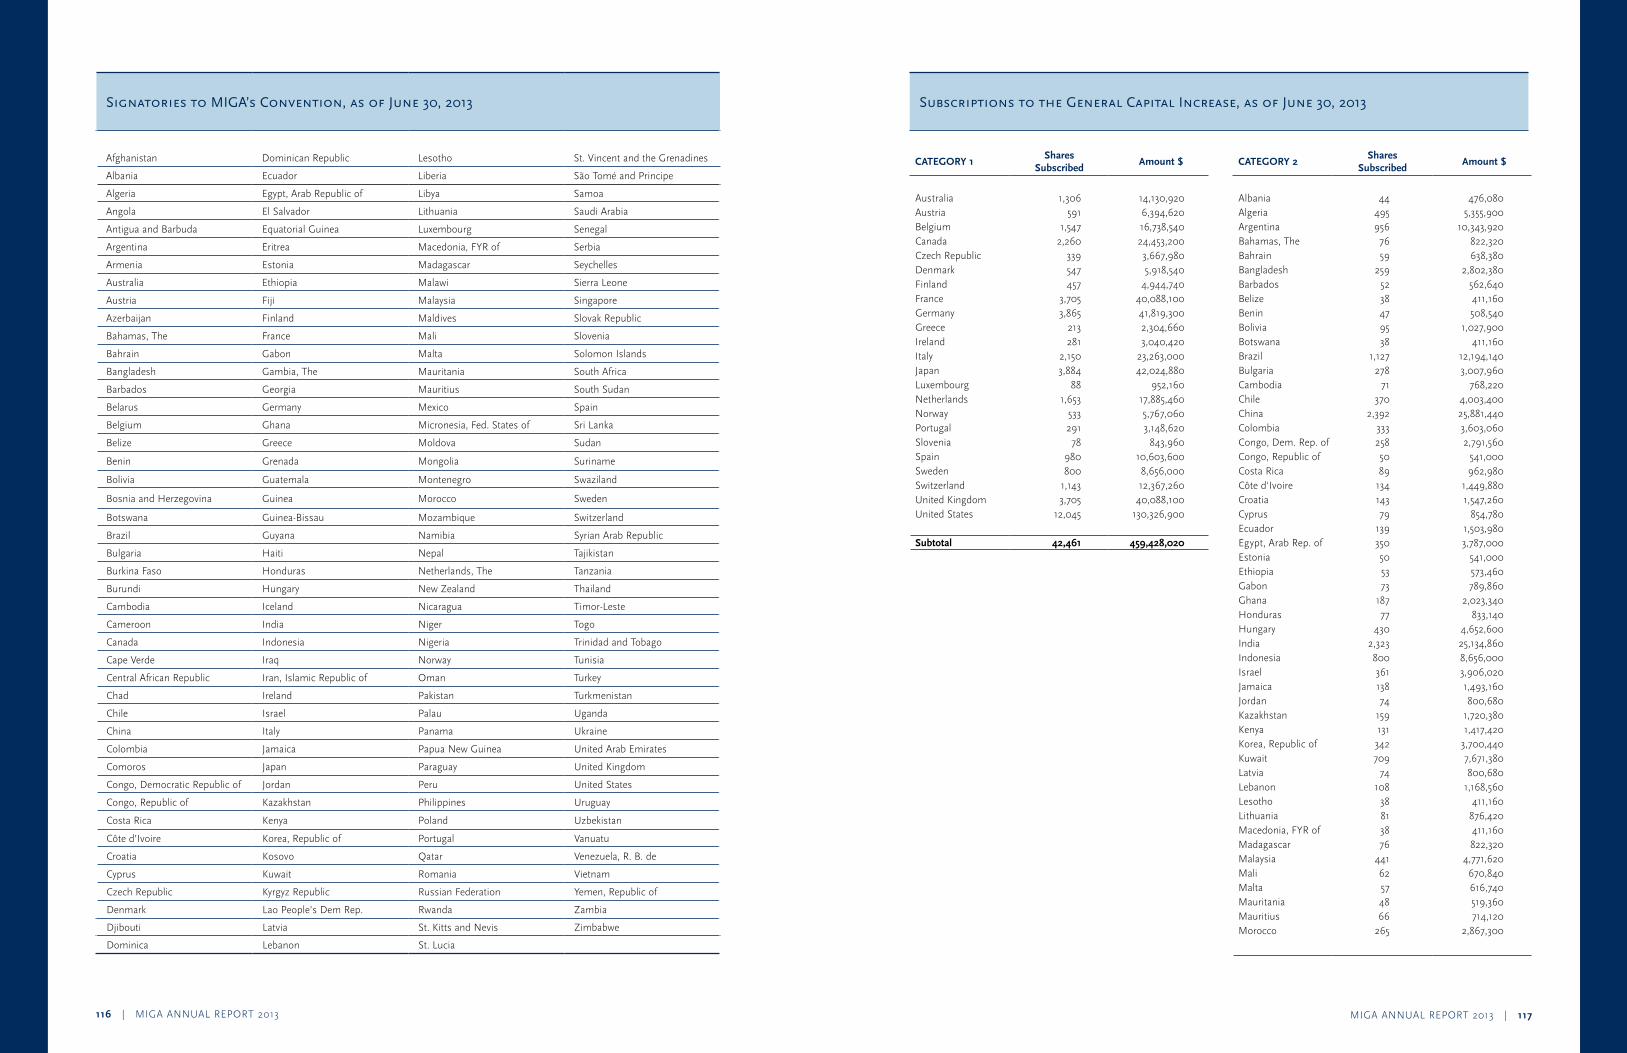
MIGA ANNUAL REPORT 2013 | 117116 | MIGA ANNUAL REPORT 2013
signatories to mIgA’s Convention, as of June 30, 2013
Afghanistan Dominican Republic Lesotho St. Vincent and the Grenadines
Albania Ecuador Liberia São Tomé and Principe
Algeria Egypt, Arab Republic of Libya Samoa
Angola El Salvador Lithuania Saudi Arabia
Antigua and Barbuda Equatorial Guinea Luxembourg Senegal
Argentina Eritrea Macedonia, FYR of Serbia
Armenia Estonia Madagascar Seychelles
Australia Ethiopia Malawi Sierra Leone
Austria Fiji Malaysia Singapore
Azerbaijan Finland Maldives Slovak Republic
Bahamas, The France Mali Slovenia
Bahrain Gabon Malta Solomon Islands
Bangladesh Gambia, The Mauritania South Africa
Barbados Georgia Mauritius South Sudan
Belarus Germany Mexico Spain
Belgium Ghana Micronesia, Fed. States of Sri Lanka
Belize Greece Moldova Sudan
Benin Grenada Mongolia Suriname
Bolivia Guatemala Montenegro Swaziland
Bosnia and Herzegovina Guinea Morocco Sweden
Botswana Guinea-Bissau Mozambique Switzerland
Brazil Guyana Namibia Syrian Arab Republic
Bulgaria Haiti Nepal Tajikistan
Burkina Faso Honduras Netherlands, The Tanzania
Burundi Hungary New Zealand Thailand
Cambodia Iceland Nicaragua Timor-Leste
Cameroon India Niger Togo
Canada Indonesia Nigeria Trinidad and Tobago
Cape Verde Iraq Norway Tunisia
Central African Republic Iran, Islamic Republic of Oman Turkey
Chad Ireland Pakistan Turkmenistan
Chile Israel Palau Uganda
China Italy Panama Ukraine
Colombia Jamaica Papua New Guinea United Arab Emirates
Comoros Japan Paraguay United Kingdom
Congo, Democratic Republic of Jordan Peru United States
Congo, Republic of Kazakhstan Philippines Uruguay
Costa Rica Kenya Poland Uzbekistan
Côte d’Ivoire Korea, Republic of Portugal Vanuatu
Croatia Kosovo Qatar Venezuela, R. B. de
Cyprus Kuwait Romania Vietnam
Czech Republic Kyrgyz Republic Russian Federation Yemen, Republic of
Denmark Lao People’s Dem Rep. Rwanda Zambia
Djibouti Latvia St. Kitts and Nevis Zimbabwe
Dominica Lebanon St. Lucia
subscriptions to the general Capital Increase, as of June 30, 2013
CATEGORY 1Shares
SubscribedAmount $
Australia 1,306 14,130,920 Austria 591 6,394,620 Belgium 1,547 16,738,540 Canada 2,260 24,453,200 Czech Republic 339 3,667,980 Denmark 547 5,918,540 Finland 457 4,944,740 France 3,705 40,088,100 Germany 3,865 41,819,300 Greece 213 2,304,660 Ireland 281 3,040,420 Italy 2,150 23,263,000 Japan 3,884 42,024,880 Luxembourg 88 952,160 Netherlands 1,653 17,885,460 Norway 533 5,767,060 Portugal 291 3,148,620 Slovenia 78 843,960 Spain 980 10,603,600 Sweden 800 8,656,000 Switzerland 1,143 12,367,260 United Kingdom 3,705 40,088,100 United States 12,045 130,326,900
Subtotal 42,461 459,428,020
CATEGORY 2Shares
SubscribedAmount $
Albania 44 476,080 Algeria 495 5,355,900 Argentina 956 10,343,920 Bahamas, The 76 822,320 Bahrain 59 638,380 Bangladesh 259 2,802,380 Barbados 52 562,640 Belize 38 411,160 Benin 47 508,540 Bolivia 95 1,027,900 Botswana 38 411,160 Brazil 1,127 12,194,140 Bulgaria 278 3,007,960 Cambodia 71 768,220 Chile 370 4,003,400 China 2,392 25,881,440 Colombia 333 3,603,060 Congo, Dem. Rep. of 258 2,791,560 Congo, Republic of 50 541,000 Costa Rica 89 962,980 Côte d'Ivoire 134 1,449,880 Croatia 143 1,547,260 Cyprus 79 854,780 Ecuador 139 1,503,980 Egypt, Arab Rep. of 350 3,787,000 Estonia 50 541,000 Ethiopia 53 573,460 Gabon 73 789,860 Ghana 187 2,023,340 Honduras 77 833,140 Hungary 430 4,652,600 India 2,323 25,134,860 Indonesia 800 8,656,000 Israel 361 3,906,020 Jamaica 138 1,493,160 Jordan 74 800,680 Kazakhstan 159 1,720,380 Kenya 131 1,417,420 Korea, Republic of 342 3,700,440 Kuwait 709 7,671,380 Latvia 74 800,680 Lebanon 108 1,168,560 Lesotho 38 411,160 Lithuania 81 876,420 Macedonia, FYR of 38 411,160 Madagascar 76 822,320 Malaysia 441 4,771,620 Mali 62 670,840 Malta 57 616,740 Mauritania 48 519,360 Mauritius 66 714,120 Morocco 265 2,867,300
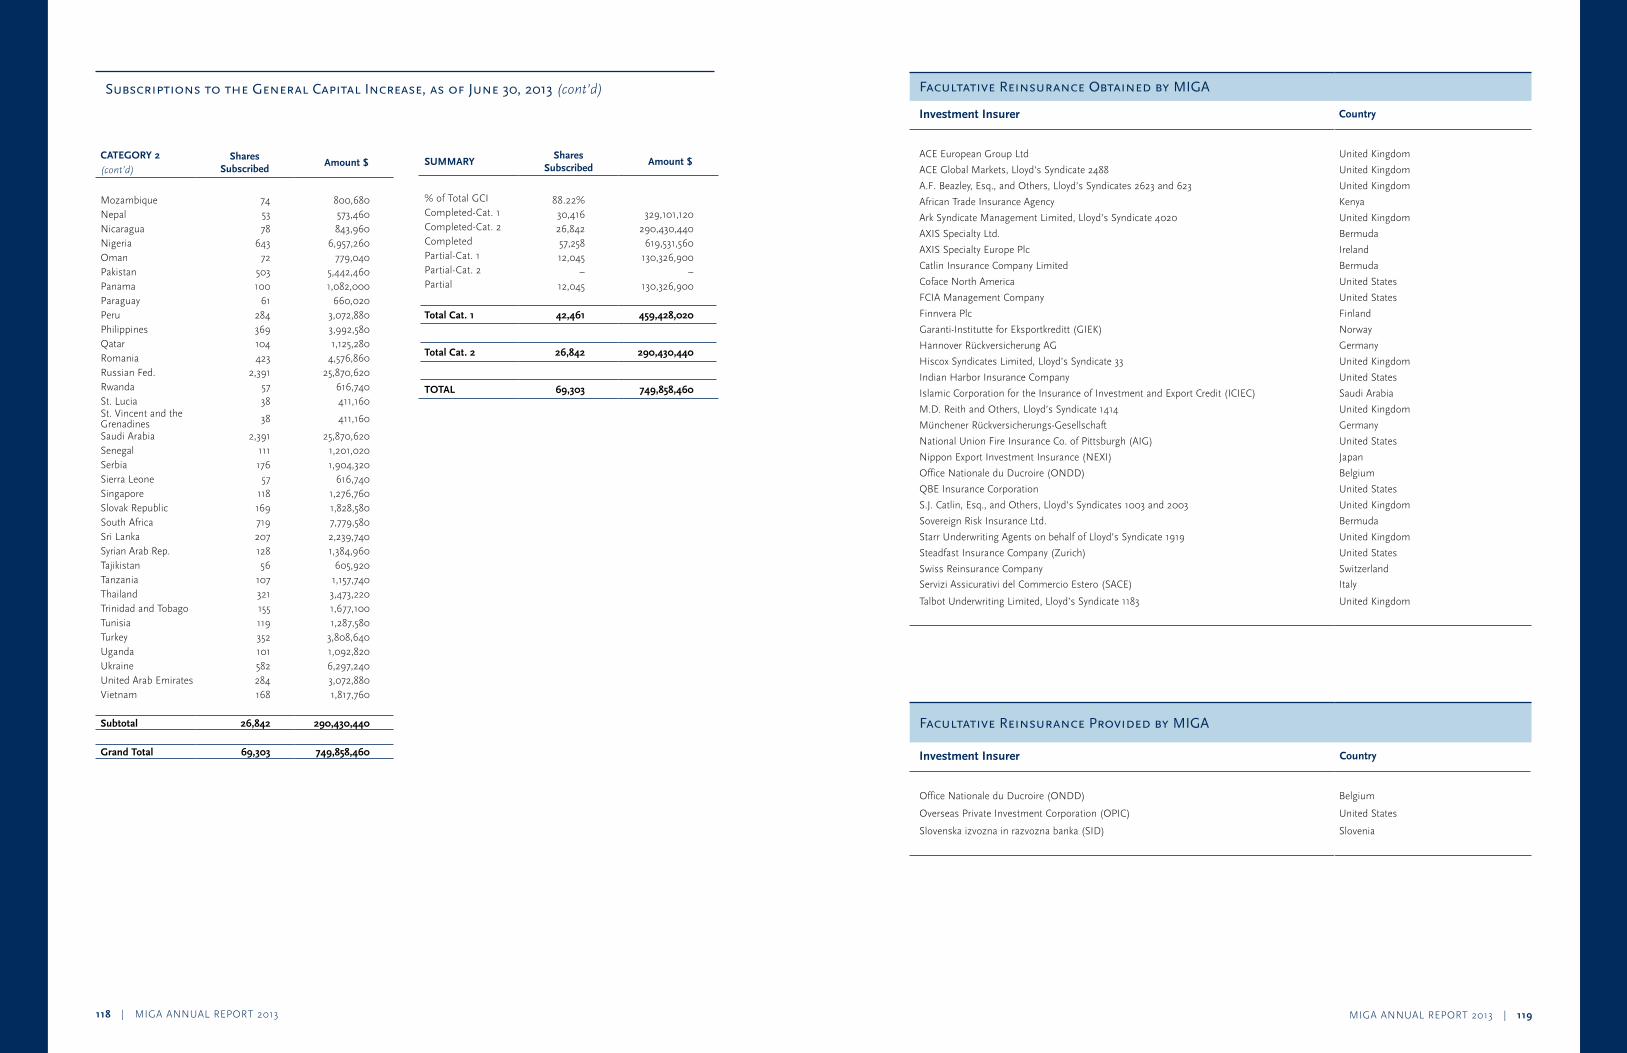
MIGA ANNUAL REPORT 2013 | 119118 | MIGA ANNUAL REPORT 2013
CATEGORY 2 (cont’d)
Shares Subscribed
Amount $
Mozambique 74 800,680 Nepal 53 573,460 Nicaragua 78 843,960 Nigeria 643 6,957,260 Oman 72 779,040 Pakistan 503 5,442,460 Panama 100 1,082,000 Paraguay 61 660,020 Peru 284 3,072,880 Philippines 369 3,992,580 Qatar 104 1,125,280 Romania 423 4,576,860 Russian Fed. 2,391 25,870,620 Rwanda 57 616,740 St. Lucia 38 411,160 St. Vincent and the Grenadines 38 411,160
Saudi Arabia 2,391 25,870,620 Senegal 111 1,201,020 Serbia 176 1,904,320 Sierra Leone 57 616,740 Singapore 118 1,276,760 Slovak Republic 169 1,828,580 South Africa 719 7,779,580 Sri Lanka 207 2,239,740 Syrian Arab Rep. 128 1,384,960 Tajikistan 56 605,920 Tanzania 107 1,157,740 Thailand 321 3,473,220 Trinidad and Tobago 155 1,677,100 Tunisia 119 1,287,580 Turkey 352 3,808,640 Uganda 101 1,092,820 Ukraine 582 6,297,240 United Arab Emirates 284 3,072,880 Vietnam 168 1,817,760
Subtotal 26,842 290,430,440
Grand Total 69,303 749,858,460
SUMMARYShares
SubscribedAmount $
% of Total GCI 88.22% Completed-Cat. 1 30,416 329,101,120 Completed-Cat. 2 26,842 290,430,440 Completed 57,258 619,531,560 Partial-Cat. 1 12,045 130,326,900 Partial-Cat. 2 – – Partial 12,045 130,326,900
Total Cat. 1 42,461 459,428,020
Total Cat. 2 26,842 290,430,440
TOTAL 69,303 749,858,460
subscriptions to the general Capital Increase, as of June 30, 2013 (cont’d) Facultative reinsurance obtained by mIgA
Investment Insurer Country
ACE European Group Ltd United Kingdom
ACE Global Markets, Lloyd’s Syndicate 2488 United Kingdom
A.F. Beazley, Esq., and Others, Lloyd’s Syndicates 2623 and 623 United Kingdom
African Trade Insurance Agency Kenya
Ark Syndicate Management Limited, Lloyd’s Syndicate 4020 United Kingdom
AXIS Specialty Ltd. Bermuda
AXIS Specialty Europe Plc Ireland
Catlin Insurance Company Limited Bermuda
Coface North America United States
FCIA Management Company United States
Finnvera Plc Finland
Garanti-Institutte for Eksportkreditt (GIEK) Norway
Hannover Rückversicherung AG Germany
Hiscox Syndicates Limited, Lloyd’s Syndicate 33 United Kingdom
Indian Harbor Insurance Company United States
Islamic Corporation for the Insurance of Investment and Export Credit (ICIEC) Saudi Arabia
M.D. Reith and Others, Lloyd’s Syndicate 1414 United Kingdom
Münchener Rückversicherungs-Gesellschaft Germany
National Union Fire Insurance Co. of Pittsburgh (AIG) United States
Nippon Export Investment Insurance (NEXI) Japan
Office Nationale du Ducroire (ONDD) Belgium
QBE Insurance Corporation United States
S.J. Catlin, Esq., and Others, Lloyd’s Syndicates 1003 and 2003 United Kingdom
Sovereign Risk Insurance Ltd. Bermuda
Starr Underwriting Agents on behalf of Lloyd’s Syndicate 1919 United Kingdom
Steadfast Insurance Company (Zurich) United States
Swiss Reinsurance Company Switzerland
Servizi Assicurativi del Commercio Estero (SACE) Italy
Talbot Underwriting Limited, Lloyd’s Syndicate 1183 United Kingdom
Facultative reinsurance provided by mIgA
Investment Insurer Country
Office Nationale du Ducroire (ONDD) Belgium
Overseas Private Investment Corporation (OPIC) United States
Slovenska izvozna in razvozna banka (SID) Slovenia
MIGA ANNUAL REPORT 2013 | 121120 | MIGA ANNUAL REPORT 2013
Active guarantee Clients as of June 30, 2013
Abengoa
Absa Capital
ADC Financial Services & Corporate Development
AES Bulgaria Holdings BV
Africa Finance Corporation
Africa Renewables Limited
Africa Juice BV
Albemarle Corporation
Mr. Giovanni Aletti
Aqualyng Holding AS
Autopistas del Nordeste (Cayman) Limited
Azalaï Hotels S.A.
S.S.A. Bakhresa, M.S. Bakhresa and A.S.S. Bakhresa
Banco Universal S.A.
Barloworld Equipment UK Limited
Bartrac Equipment GBL
Bergenshalvoens Kommunale kraftselskap AS
Banque Nationale de Paris
Antoine & Gabriel Boulos
Bouygues Travaux Publics
Bureau Veritas Inspection, Valuation, Assessment & Control
Caja Madrid
Calyon Corporate & Investment Bank
Can Pack S. A.
Cementhai Chemicals Co., Ltd.
CfC Stanbic Bank Limited
Chayton Atlas Investments
Chayton Africa
Campestres Holdings Limited
Citbibank N.A.
CCB Management Services G,bH
ContourGlobal Africa Holdings S.a.r.l.
Cotecna Inspection S.A.
Darco Environmental Pte.Ltd
Daye Water Investment (Ghana), B.V
Deutsche Bank Luxembourg S.A.
Dubai Islamic Bank
Dole Food Company, Inc
DP World FZCO
East West Gold Corporation
EcoPlanet Bamboo Group LLC
EDF International
Energy Engineering Investment Ltd
Erste Group Bank AG
Eskom
Eurobank Ergasias
EVN AG
Finrep Ges M.B.H
FMO
Fons Mediterrània Capital F.C.R. De Régimen Simplificado
Fraport AG
Geogas Trading S.A.
GE.POR.TUR. s.a.s.
Globeleq Holdings (Azito) Ltd.
Globeleq Mesoamérica Energy (Wind) Limited (“GME”)
Golden State Waste Management (Beijing) Corp
Grodco Panama
Groupe Europe Handling S.A.S.
Habib Bank AG Zurich
Hitachi Construction Machinery Africa Pty. Ltd
Hitachi Construction Machinery Southern
HSBC Bank Plc International
Icam SPA
Industrial Development Corp. of South Africa
Infilco Degremeont, Inc.
ING Bank, a Branch of ING-DiBa AG
Organization de Ingenieria Internacional S.A.
InterMims Investment Limited
Investcom Global Ltd.
Itochu Corporation
Jean-Francois Guillon
JPMorgan Chase Bank, N.A.
Karo Dis Ticaret ve Sanayi Ltd. Sti.
Kenmare Resources PLC
Kjaer Group AS
Klaus Nikolaus Kohler
Korea Water Resources Corporation
Linx Telecommunications B.V
Liongate Venture Fund I SPC
Mark M. Mullen
The Mauritius Commercial Bank Ltd.
MediCapital Bank
Millco Limited
MKV Holdings, LLC
The Morganti Group Inc.
Mobile Telephone Networks International Ltd.
MXS SA
PTT Chemical Public Company Ltd
Odinsa Holding Inc.
Orange Participations SA
OPIC
Orascom Telecom
Orca Credit Holdings LLC
Ormat Holding Corp.
Pan-African Infrastructure Development Fund
POL-AM-Pack S.A.
Portigon AG
ProCredit Holding AG
Raghbir Sineh Chatthe
Ralph Odell Burleson (Individual)
Rockland Steel Trading Ltd.
Raiffeisen a.s., Prague/Czech Republic
Sasol Gas Holdings (Pty) Ltd.
State Bank Of India
SCDM Energie
Bank of Nova Scotia
Sena Development Limited
SGI Ethiopia Cement Limited
SGS Societe Generale de Surveillance SA
SID - Slovenska Izvozna in Razvojna
Sierra Investment Fund Ltd.
Silverlands Ireland Holdings (Z2) Limited
Societe Malienne de Promotion Hoteliere S.A.
SGS SA
Sojitz Corporation
Sonatel
Standard Bank Plc
Standard Chartered Bank
Stora Enso South Asia Holdings AB
Strand Minerals (Indonesia) Pte. Ltd
Suez Environment S.A.
Tapon France S.A.S
Teleinvest Limited
Tamboho International Ltd
Touton S.A.
Traitex International SA
Troy AB (or other subsidiary of Celebi Group)
Tulbagh Holdings LLC
Office National de Telcomms."TUNISIE TELECOM"
Umeme Holdings limited
UniCredit Bank AG
Unifruit Limited
UPM-Kymmene Corporation
FG Volga Farming Ltd
West African Gas Pipeline Company Ltd.
Whirlpool Europe Coordination Center S.A.
Kreditanstalt fur Wiederaufbau
World Power Holdings Luxemborg S. a. r. l.
WTE Wassertechnik GmbH
YooMee Africa AG
photo Credits
Cover Rebecca Post, MIGA; Izumi Kobayashi, MIGA; Gero Verheyen, MIGA; Suez Environnement, SA, Infilco Degremont, Inc., and Morganti Group, Inc.; Cara Santos Pianesi, MIGA
page 5 World Bank Group Photo Lab
page 7 World Bank Group Photo Lab
page 9 World Bank Group Photo Lab
page 10 World Bank Group Photo Lab
page 11 World Bank Group Photo Lab
page 12 Rebecca Post, MIGA; Jillian Rachel Crowther, MIGA; Suez Environnement, SA, Infilco Degremont, Inc., and Morganti Group, Inc.
page 15 Rebecca Post, MIGA
page 17 Cara Santos Pianesi, MIGA
page 19Suez Environnement, SA, Infilco Degremont, Inc., and Morganti Group, Inc.; Chayton Africa; SASOL; Raiffeisen Bank International AG
page 20 Rebecca Post, MIGA; Gero Verheyen, MIGA; Globeleq Mesoamérica Energy (Wind) Limited
page 24 Gero Verheyen, MIGA
page 27 Jillian Rachel Crowther, MIGA; Graham Crouch, World Bank
page 34 Suzanne Pelland, MIGA; Financial Times
page 36 Simone D. McCourtie, World Bank; Graham Crouch, World Bank; Curt Carnemark, World Bank
page 39 World Bank Group; Almin Zrno, World Bank; Simone D. McCourtie, World Bank
page 43 Cara Santos Pianesi, MIGA; Globeleq Mesoamérica Energy (Wind) Limited
page 45 Gero Verheyen, MIGA; Suez Environnement, SA, Infilco Degremont, Inc., and Morganti Group, Inc.; Izumi Kobayashi, MIGA
page 48 Jillian Rachel Crowther, MIGA; Rebecca Post, MIGA
page 58Globeleq Mesoamérica Energy (Wind) Limited; Suez Environnement, SA, Infilco Degremont, Inc., and Morganti Group, Inc.; Globeleq Holdings (Azito) Limited
page 108 Africa Renewables Ltd.; Rebecca Post, MIGA; Cara Santos Pianesi, MIGA
ISBN 978-1-4648-0059-7
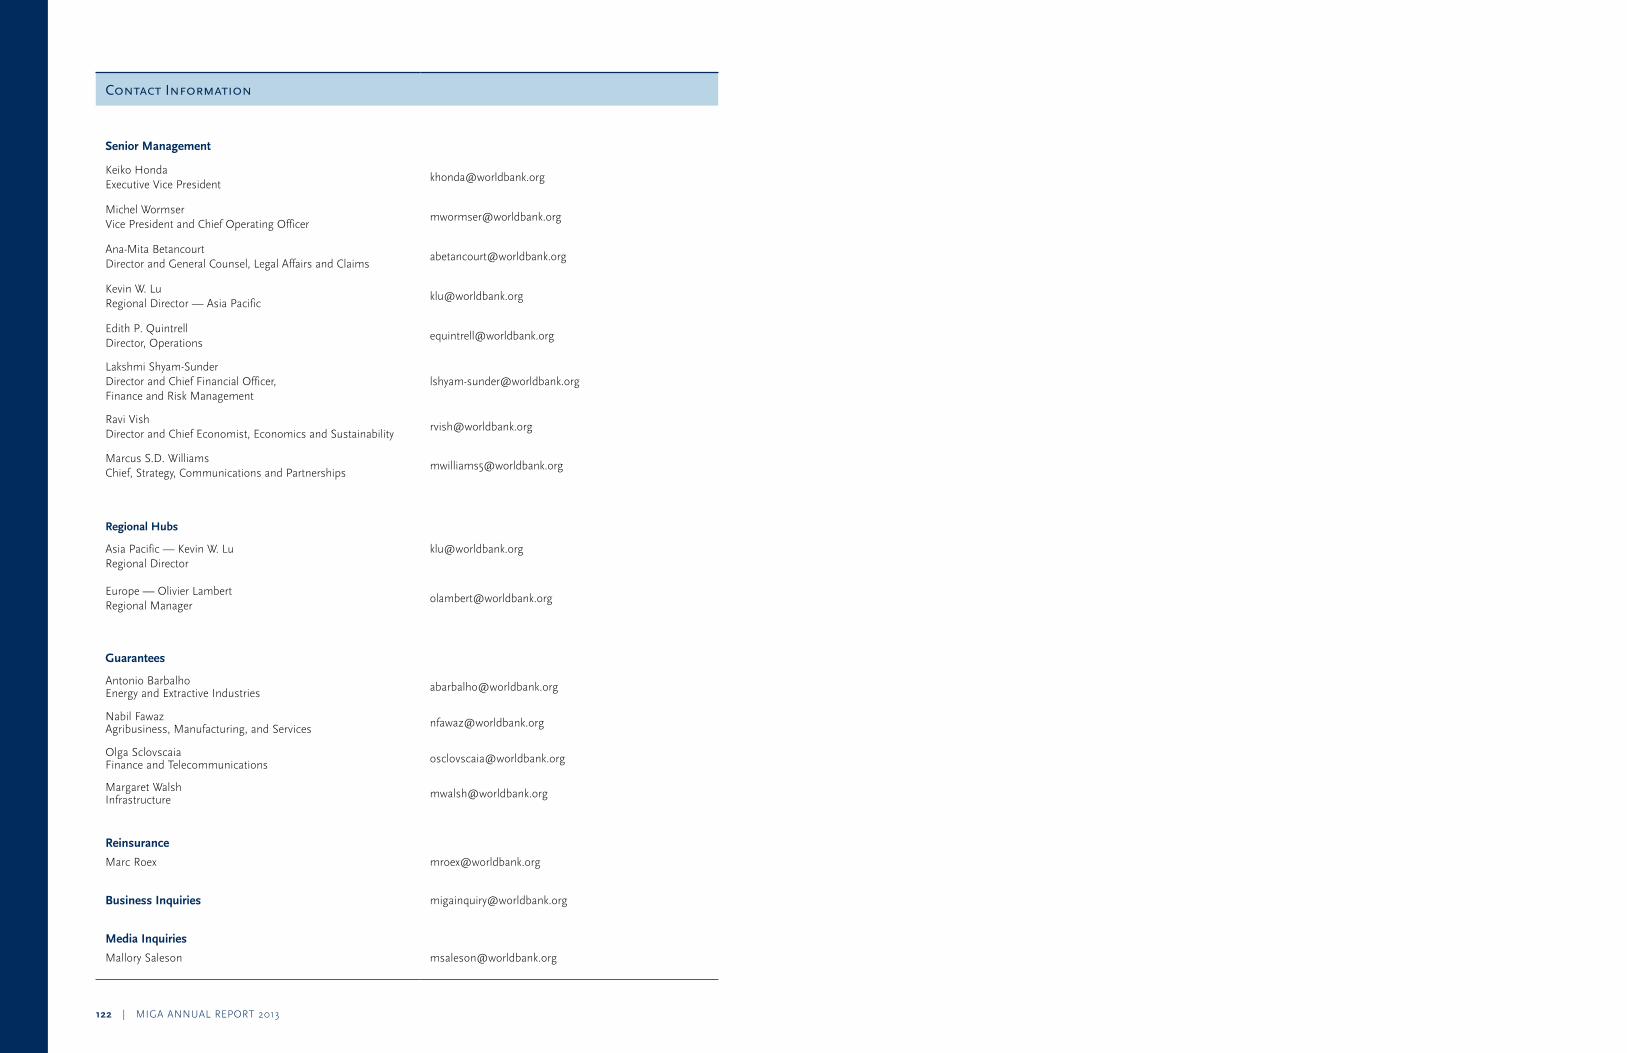
122 | MIGA ANNUAL REPORT 2013
Contact Information
Senior Management
Keiko Honda Executive Vice President
Michel Wormser Vice President and Chief Operating Officer
Ana-Mita Betancourt Director and General Counsel, Legal Affairs and Claims
Kevin W. Lu Regional Director — Asia Pacific
Edith P. Quintrell Director, Operations
Lakshmi Shyam-Sunder Director and Chief Financial Officer, Finance and Risk Management
Ravi Vish Director and Chief Economist, Economics and Sustainability
Marcus S.D. Williams Chief, Strategy, Communications and Partnerships
Regional Hubs
Asia Pacific — Kevin W. Lu Regional Director
Europe — Olivier Lambert Regional Manager
Guarantees
Antonio Barbalho Energy and Extractive Industries [email protected]
Nabil Fawaz Agribusiness, Manufacturing, and Services [email protected]
Olga Sclovscaia Finance and Telecommunications [email protected]
Margaret Walsh Infrastructure [email protected]
Reinsurance
Marc Roex [email protected]
Business Inquiries [email protected]
Media Inquiries
Mallory Saleson [email protected]

Multilateral Investment Guarantee Agency World Bank Group1818 H Street, NW
Washington, DC 20433 USA
t. 202.458.2538f. 202.522.0316
ISBN 978-1-4648-0059-7
W W W. m I g A . o r g