annual report 2011 - port authority of new york & new … governance of the port...
TRANSCRIPT
Annual Report 2011Comprehensive Annual Financial Report for the Year Ended December 31, 2011
Mission StatementTo identify and meet the critical transportation infrastructure needs of the bistate region’s businesses, residents, and visitors: providing the highest quality, most efficient transportation and port commerce facilities, and services that move people and goods within the region, providing access to the rest of the nation and to the world, while strengthening the economic competitiveness of the New York-New Jersey metropolitan region.

1
Table of ContentsIntroductory Section
2 Portfolio of Facilities
3 Letter of Transmittal to the Governors
5 The Port District
6 Board of Commissioners
7 Governance of the Port Authority/Commitment to Transparency
8 Officers and Directors
9 Letter from the Executive Director
11 The Year in Review
25 Letter of Transmittal to the Board of Commissioners
Financial Section
31 Independent Auditors’ Report
33 Management’s Discussion and Analysis
Basic Financial Statements
43 Consolidated Statements of Net Assets
44 Consolidated Statements of Revenues, Expenses and Changes in Net Assets
45 Consolidated Statements of Cash Flows
47 Notes to Consolidated Financial Statements
78 Required Supplementary Information
Financial Statements Pursuant to Port Authority Bond Resolutions
79 Schedule A - Revenues and Reserves
80 Schedule B - Assets and Liabilities
81 Schedule C - Analysis of Reserve Funds
Statistical Section
85 Statistical Section Narrative
86 Schedule D-1 - Selected Statistical Financial Trends Data
88 Schedule D-2 - Selected Statistical Debt Capacity Data
90 Schedule D-3 - Selected Statistical Operating Data
91 Schedule E - Information on Port Authority Operations
92 Schedule F - Information on Port Authority Capital Program Components
93 Schedule G - Port Authority Facility Traffic
94 Selected Statistical Demographic and Economic Data
Corporate Information
95 Top 20 Salaried Staff
The Port Authority of New York and New JerseyComprehensive Annual Financial Report for the Year Ended December 31, 2011Prepared by the Marketing and Comptroller’s departments of The Port Authority of New York and New Jersey225 Park Avenue South, New York, NY 10003-1604 www.panynj.gov
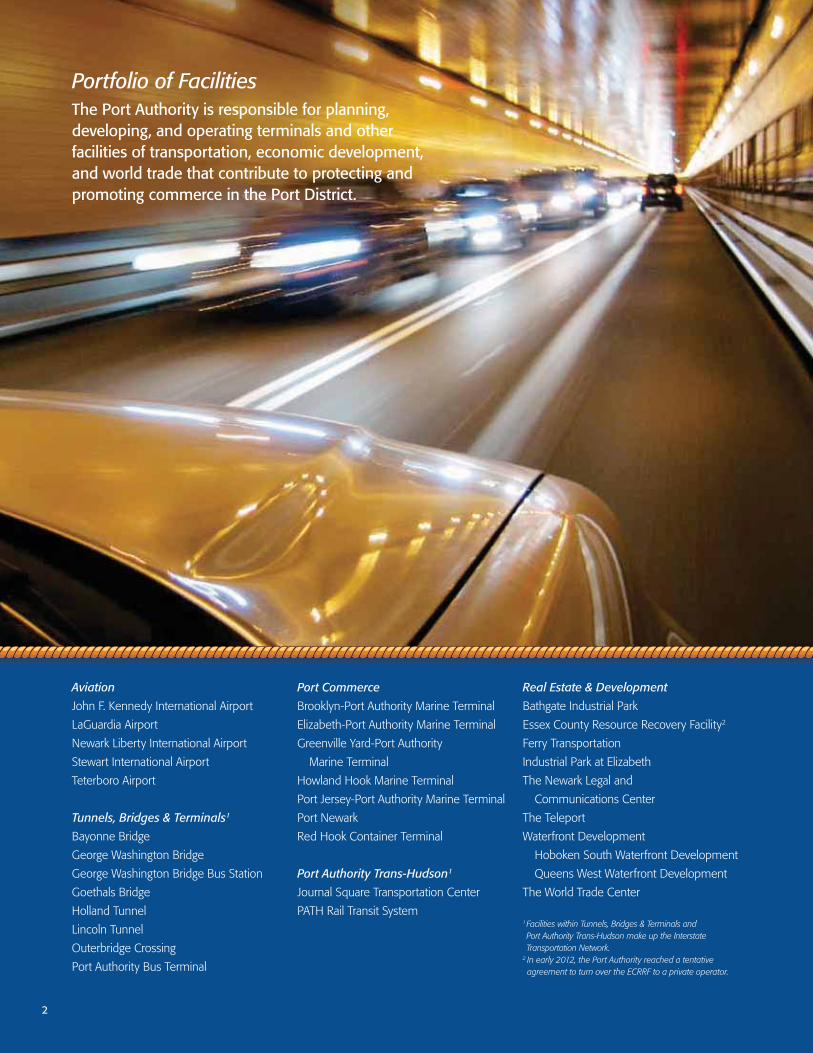
Aviation
John F. Kennedy International Airport
LaGuardia Airport
Newark Liberty International Airport
Stewart International Airport
Teterboro Airport
Tunnels, Bridges & Terminals1
Bayonne Bridge
George Washington Bridge
George Washington Bridge Bus Station
Goethals Bridge
Holland Tunnel
Lincoln Tunnel
Outerbridge Crossing
Port Authority Bus Terminal
Port Commerce
Brooklyn-Port Authority Marine Terminal
Elizabeth-Port Authority Marine Terminal
Greenville Yard-Port Authority
Marine Terminal
Howland Hook Marine Terminal
Port Jersey-Port Authority Marine Terminal
Port Newark
Red Hook Container Terminal
Port Authority Trans-Hudson1
Journal Square Transportation Center
PATH Rail Transit System
Real Estate & Development
Bathgate Industrial Park
Essex County Resource Recovery Facility2
Ferry Transportation
Industrial Park at Elizabeth
The Newark Legal and
Communications Center
The Teleport
Waterfront Development
Hoboken South Waterfront Development
Queens West Waterfront Development
The World Trade Center
1 Facilities within Tunnels, Bridges & Terminals and Port Authority Trans-Hudson make up the Interstate Transportation Network.
2 In early 2012, the Port Authority reached a tentative agreement to turn over the ECRRF to a private operator.
2
Portfolio of FacilitiesThe Port Authority is responsible for planning, developing, and operating terminals and other facilities of transportation, economic development, and world trade that contribute to protecting and promoting commerce in the Port District.

3
Letter of Transmittal to the Governors
The HonorableAndrew M. CuomoGovernor, State of New York
The HonorableChris ChristieGovernor, State of New Jersey
Dear Governors:
In conformance with the Port Compact of 1921, I am
pleased to present to you and to the Legislatures of New
York and New Jersey the 2011 Comprehensive Annual
Financial Report of The Port Authority of New York and
New Jersey.
2011 was a year of significant achievement for the Port
Authority. Foremost among its accomplishments was the
honor we shared together on September 11 when we
welcomed you, along with President Barack Obama and
former President George W. Bush, as we opened the
National September 11 Memorial Plaza at the World Trade
Center on the 10th Anniversary of the 9/11 attacks. In
addition, we continued meeting our commitments on the
other elements of the World Trade Center site as work
advanced on every aspect of the Transportation Hub at
the same time One World Trade Center continued to rise,
claiming a dominant place in the city’s skyline.
The Port Authority also advanced the raising of the Bayonne
Bridge and the replacement of the Goethals Bridge, two
projects of national and regional significance that will allow
the Port of New York and New Jersey to remain the
preeminent destination for cargo on the East Coast, creating
high-quality jobs and stimulating economic growth for
years to come.
We are pleased to report that the Port Authority completed
the replacement of our entire fleet of PATH railcars, part of
a comprehensive PATH modernization program that is
improving the commutes of hundreds of thousands of
travelers between the two states. This program’s successful
conclusion arrived just in time: The Port Authority
experienced record ridership on PATH in 2011, with 76.6
million trips–the highest total since it took over operation
of the rail system in 1962.
The Port Authority also broke records for international
passengers at Newark Liberty and JFK airports, and for
cargo volume at the Port of New York and New Jersey. We
attribute this success to the billions of dollars of investment
we made in these seaports and airports as a result of your
commitment to reinforce the Port Authority’s status as the
primary engine for economic growth in the region.
Despite these records set last year, agency-wide annual net
revenues have not kept pace with the agency’s projected
level of capital spending on critical infrastructure projects
required to meet regional transportation and security needs.
As a result, the Board of Commissioners made the difficult
decision last summer to increase tolls and fares on our
Interstate Transportation Network. In response to these
increases, at your direction, the Board commenced a
comprehensive review of the Port Authority, including its
finances, operations and capital planning process. Earlier this
year, a Special Committee of the Board presented you
with the Phase I Interim Report prepared by an international
consulting firm, which found that the Port Authority
was at a crossroads, challenged, and in need of renewed
focus on its strategic financial and capital plans and
operating effectiveness.
The Board has since delivered a series of reform initiatives
responsive to recommendations in the Phase I Interim Report.
We have enacted sweeping reforms to compensation and
benefits programs that will save the agency more than $41
million through 2013, and millions more in the years ahead.
4
We have also improved our Freedom of Information process,
and further increased transparency by posting more than
22,000 pages of public documents to our website—
believed to be one of the largest voluntary postings of
online documents by a government agency in the history
of government entities in our bistate region.
These initiatives expand upon the internal reforms instituted
by the Board in 2011 to change the way the Port Authority
does business through streamlining operations, increasing
efficiencies, and improving governance and transparency.
To this end, we have maintained a flat operating budget;
kept salaries frozen; hired the first new independent auditor
in 31 years; conducted a thorough review of our security
organization and operations; and began posting online all
salaries and additional compensation for employees.
These actions are significant, but they are just the
beginning. As we look forward to executing aggressively
our capital plan and improving our operations in 2012 and
beyond, the Board and our new management team will
continue to follow your leadership and return this agency
to its traditional role of being the pillar of economic growth
and transportation infrastructure leader of New York and
New Jersey.
Respectfully,
David Samson
Chairman
May 31, 2012

5
PassaicSuss
ex
0
0
10
10
Mi
Km Monmouth
Middlesex
Morris
Essex
Hudson
Bergen
Union
Somerset
Rockland
Westchester
Brooklyn
Queens
Bronx
StatenIsland
Man
hatta
nN J
N Y
C T
Nassau
Port District
Poughkeepsie
Beacon
Peekskill
Newburgh
New York LongIslandSound
LowerNew York
BayAtlanticOcean
Atlantic Ocean
The Port DistrictThe Port Authority was established by the Compact of April 30, 1921, between the states of New York and New Jersey as one of the first interstate agencies created under a clause of the United States Constitution permitting compacts between states with the consent of Congress. The Compact also created the Port District, which comprises an area of about 1,500 square miles in both states, centering around New York Harbor. The Port District includes the cities of New York and Yonkers in New York State, and the cities of Newark, Jersey City, Bayonne, Hoboken, and Elizabeth in the State of New Jersey, and more than 200 other municipalities, including all or part of 17 counties, in the two states. This Port Compact established a bistate authority to provide transportation, terminal, and other facilities of commerce within the Port District. For such purposes, the states have from time to time authorized specific transportation and terminal facilities, and facilities of commerce and economic development. Stewart International Airport is located in Orange County, N.Y., and is operated by the Port Authority under a long-term lease.

ChairmanDavid SamsonMemberWolff & Samson, PC
Jeffrey H. LynfordCo-Managing MemberWellsford Strategic Partners LLC
Vice ChairmanScott H. RechlerChief Executive Officer and Chairman, RXR
Jeffrey A. MoerdlerMember Mintz, Levin, Cohn, Ferris, Glovsky and Popeo, P.C.
William “Pat” SchuberProfessorFairleigh Dickinson University
Raymond M. PocinoVice President/Eastern Regional Mgr., Laborers Int’l Union of N.A.
Henry R. SilvermanSenior Advisor and Vice ChairmanGuggenheim Investments
Virginia S. BauerChief Executive OfficerGTBM, Inc.
Anthony J. SartorChairman & ChiefExecutive Officer, Paulus, Sokolowski & Sartor LLC
David S. SteinerChairmanSteiner EquitiesGroup, LLC
H. Sidney Holmes IIIPartnerWinston & Strawn, LLPBoard of
CommissionersDavid Samson, Chairman1
Scott H. Rechler, Vice Chairman2
Virginia S. BauerAnthony R. Coscia3
Stanley E. Grayson4
H. Sidney Holmes IIIJeffrey H. Lynford5
Jeffrey A. MoerdlerRaymond M. PocinoAnthony J. SartorWilliam “Pat” Schuber6
Henry R. SilvermanDavid S. Steiner
1 David Samson became Chairman on February 3, 2011.
2 Scott H. Rechler joined the Board on June 20, 2011, and became Vice Chairman on September 22, 2011.
3 Anthony R. Coscia retired from the Board on June 30, 2011.
4 Stanley E. Grayson retired from the Board on September 19, 2011.
5 Jeffrey H. Lynford joined the Board on June 20, 2011.
6 William “Pat” Schuber joined the Board on July 1, 2011.
Anthony R. CosciaPartnerWindels Marx Lane& Mittendorf, LLP
Stanley E. GraysonVice Chairman & Chief Operating OfficerM.R. Beal & Company
6

7
Governance of the Port Authority
The governor of each state appoints six members of the agency’s Board of Commissioners,
for overlapping six-year terms; each appointment is subject to the approval of the respective
state senate. Commissioners serve as public officials without remuneration. The governors
retain the right to veto the actions of the commissioners from their respective state. An
executive director, appointed by the Board of Commissioners, is responsible for managing
the operation of the Port Authority in a manner consistent with the agency’s policies, as
established by the Board. The Port Authority undertakes projects and activities in accordance
with the Port Compact of 1921, and amendatory and supplemental bistate legislation.
Commitment to Transparency
The Port Authority is committed to the highest standards of accountability and transparency.
The agency has opened public access to its Board of Commissioners meetings by posting
an advance listing of items on the agenda, opening up more meetings to the public,
disclosing reasons for discussing or acting upon matters in executive session, webcasting
all public meetings, and providing for public comment at the public Board meetings. The
Board of Commissioners has approved an overhauled Freedom of Information Code (FOI)
to increase transparency by making it easier for individuals to obtain a wider range of Port
Authority information and records. In early 2012, the agency posted thousands of pages
of documents to its public Web site. The site also includes Port Authority/PATH payroll
information—providing data from 2008 forward. This is believed to be one of the largest,
voluntary online postings of government documents in the history of public entities in the
New York and New Jersey region.
Patrick J. FoyeExecutive Director
Bill BaroniDeputy Executive Director

Chief Administrative Officer Louis J. LaCapraHuman Resources Department Mary Lee Hannell, DirectorLabor Relations Department Louis J. LaCapra, DirectorOperations Services Department Thomas C. Lubas, DirectorProcurement Department Lillian D. Valenti, Director
Chief, Capital Planning David B. TweedyOffice of Business Diversity & Civil Rights Lash L. Green, DirectorOffice of Environmental & Energy Programs Christopher R. Zeppie, DirectorOffice of Strategic Initiatives Cruz C. Russell, DirectorPlanning & Regional Development Department Andrew S. Lynn, DirectorWTC Construction Department Steven P. Plate, DirectorWTC Redevelopment Department Philippe B. Visser, Director
Chief Engineer Peter J. Zipf
Chief Financial Officer Michael G. FabianoComptroller’s Department Daniel G. McCarron, ComptrollerFinancial Analysis Department Gerald B. Stoughton, DirectorManagement & Budget Department Michael G. Massiah, DirectorTechnology Services Department Kirby King, DirectorTreasury Department Anne Marie C. Mulligan, Treasurer
Chief Operating Officer Ernesto L. Butcher1
Aviation Department Susan M. Baer, DirectorCapital Security Projects John J. Drobny, DirectorPort Commerce Department Richard M. Larrabee, DirectorPublic Safety Department Michael A. Fedorko, Director/
Superintendent of PoliceRail Transit Department Michael P. DePallo, DirectorTunnels, Bridges & Terminals Department Cedrick T. Fulton, Director
Chief of Public & Government AffairsGovernment & Community Affairs Tina Lado/Brian Simon, DirectorsMarketing Department Andrew T. Hawthorne, DirectorOffice of Media Relations Lisa MacSpadden, Director
Chief, Real Estate & Development Michael B. Francois
General Counsel Darrell B. Buchbinder
Inspector General Robert E. Van EttenAudit Department Robert A. Sudman, DirectorOffice of Investigations Michael Nestor, Director
Secretary Karen E. Eastman
1Ernesto L. Butcher retired from the Port Authority on April 13, 2012.
As of April 16, 2012
Officers and Directors
Executive Director / Patrick J. FoyeDeputy Executive Director / Bill Baroni
8
9
Chairman Samson, Vice Chairman Rechler, and Members of
the Board of Commissioners:
As One World Trade Center soars ever skyward over Lower
Manhattan, the Port Authority is taking pivotal steps to return
the agency’s focus to its core mission of building and operating
transportation infrastructure. At a time when the nation’s
economic recovery remains fragile and unemployment lingers
at stubbornly high levels, the Port Authority’s contribution to
the region’s economic growth is all the more vital.
To ensure we are successful in executing our core mission,
together we must continue to focus on pursuing significant
reform in the way we do business. Our agency faces the
significant challenge of delivering on a capital investment
program in excess of $25 billion during the next decade. To do
this successfully, the Port Authority must be faster and more
nimble. We need to act decisively and find ways to speed
delivery of our projects, while reducing associated soft costs.
Building and maintaining our transportation network is critical to
the short- and long- term growth of the New York-New Jersey
region. By delivering the hundreds of projects in our long-term
capital plan, we will create and support thousands of high-
quality jobs. Coupled with a healthy, robust transportation
network, we all will benefit from a foundation for sustained
economic growth and competitiveness. No less than the
region’s global competitive position is at stake.
Since joining the Port Authority in November 2011, I have
come to appreciate that the employees of this agency are
committed to delivering on the public’s needs. Opening the
Memorial Plaza in time for the 10-year anniversary of
September 11 demonstrated the caliber of our workforce to
the world. We must now rise to the occasion as we address
our myriad transportation needs with that same speed, focus,
and intensity.
High among our priority needs for investment are our airports.
The region’s airports are an economic force, supporting nearly
half a million jobs and more than $60 billion in annual
economic activity. It is critical that we act decisively to keep
our facilities modern and competitive. We are doing just that
by pursuing a replacement of LaGuardia Airport’s aging Central
Terminal Building (CTB). Built at the dawn of the jet age to
accommodate DC-9s, the terminal cannot adequately handle
modern jets and current passenger loads. With annual
passenger volume at CTB expected to exceed 17 million by
2032, it is imperative that we replace this obsolete terminal.
To accelerate the project and lower costs, we are exploring
public-private partnership proposals. We are also preparing a
similar public-private partnership process to replace the
outdated Terminal A at Newark Liberty International Airport, and
we have partnered with Delta Air Lines on an ongoing $1.2
billion expansion of Terminal 4 at JFK International Airport that
will replace Terminal 3.
We are also embarking upon several major bridge projects to
modernize our critical bistate crossings. We will be replacing
the Goethals Bridge, a crucial passenger and freight crossing
built in 1928, which Staten Islanders and many others rely on.
The bridge is now functionally obsolete and expensive to
maintain. Here too, we are pursuing a public-private partnership
to rebuild the Goethals faster and for less money, while
transferring risk to the private sector. Collaborating with the
private sector, where sensible, will be an important part of
reforming how the Port Authority delivers projects.
We also are moving to “Raise the Roadway” on the Bayonne
Bridge to allow modern container ships to access our port
facilities after the Panama Canal widening is completed
in 2014. Our ports are the largest on the East Coast and
responsible for a quarter-million jobs in the region. Modernizing
the Bayonne Bridge, which marked its 80th birthday in 2011,
is critical to the region, and every day counts on this $1 billion
project if we are to ensure it remains a gateway to commerce,
rather than a roadblock for the next century.
Letter from the Executive Director
10
At the George Washington Bridge, we are in the midst of
planning and engineering for a series of rehabilitation projects
needed to keep the 80-year-old span in top condition. The
work will include access ramp and overpass rehabilitation, lower
level roadway upgrades, and the replacement of more than
500 suspender ropes. These projects will total more than
$1.5 billion and will create more than 3,600 jobs.
Further, we have begun a process of divesting noncore assets,
so we can focus the agency’s resources on our transportation
mission. Early in 2012, we reached a tentative agreement to
turn over the Essex County Resource Recovery Facility, a
waste-to-energy plant in Newark, to a private operator. We are
also looking into divesting other noncore real estate assets,
such as the Legal Center in Newark, the Teleport in Staten
Island, and our industrial parks in both states.
One specific area of reform I focused on when I arrived was
reforming a broken permitting and regulatory process. The Port
Authority is dedicated to minimizing environmental impacts
from our projects, but we also need to decrease the time it
takes to permit new projects, especially ones that merely
involve the replacement—or raising the roadway—of existing
facilities. While the permitting process involves many
stakeholders, I am committed to having the Port Authority
work with national and local authorities so that we can be at
the vanguard of this important effort.
As an organization, the Port Authority should be proud of all
that it accomplished in 2011 in setting a foundation for future
growth in the region. However, as we look ahead, we should be
sure to renew our connection with our customers. We directly
touch the lives of as many as a million people a day—at our
airports, on tunnels, bridges, terminals, and the PATH system
and through the international shippers who move cargo via our
ports and airports. These customers expect and deserve a
more responsive level of service.
I believe the Port Authority can do more, and do it better, faster,
and smarter, to meet the major challenges that we will face
in the months and years ahead. Our governors have made
their expectations clear. Business as usual at the Port Authority
will not allow us to reach our objectives. You, the members of
the Board, have made your goals clear. I am confident that the
steps taken together in 2011 will allow us to build a stronger,
better Port Authority.
Respectfully,
Patrick J. Foye
Executive Director
May 31, 2012

“ It was a year marked by difficult decisions, but also many successes. The Port Authority experienced rising passenger counts and cargo volumes; achieved key milestones at the World Trade Center; delivered on vital capital investments; and initiated reforms in compensation and transparency.”
Scott H. Rechler Vice Chairman The Port Authority of NY & NJ
The Year in Review
12
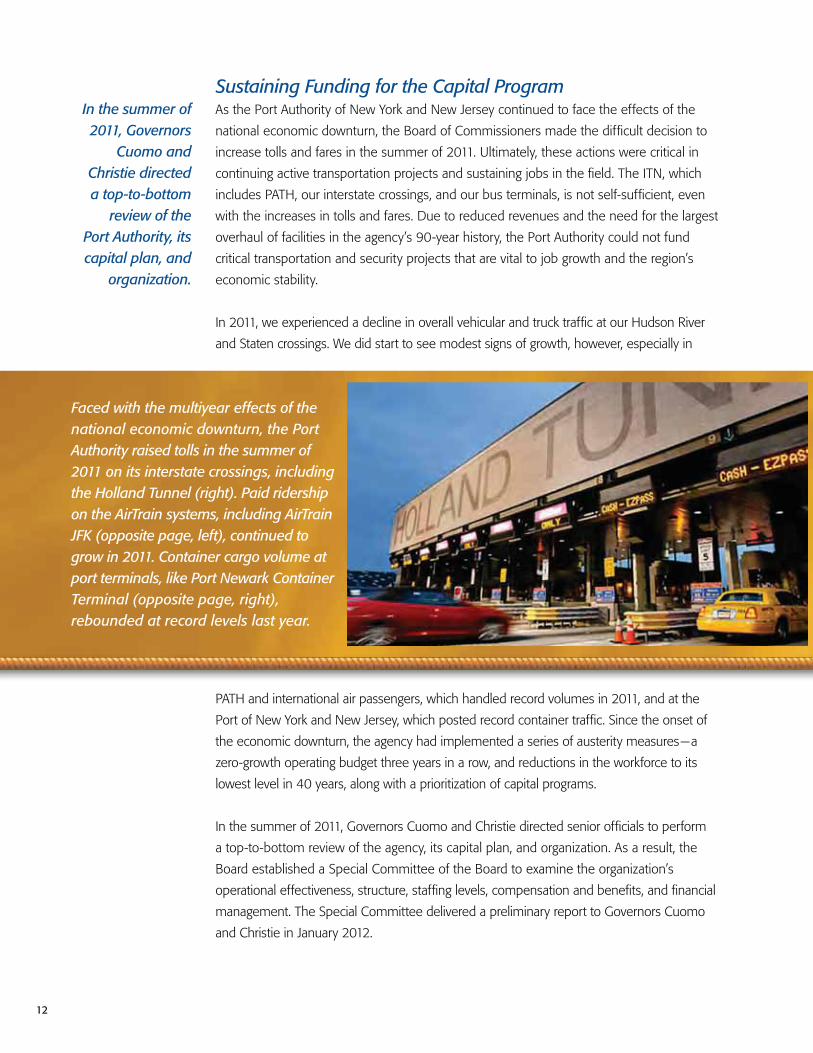
Faced with the multiyear effects of the national economic downturn, the Port Authority raised tolls in the summer of 2011 on its interstate crossings, including the Holland Tunnel (right). Paid ridership on the AirTrain systems, including AirTrain JFK (opposite page, left), continued to grow in 2011. Container cargo volume at port terminals, like Port Newark Container Terminal (opposite page, right), rebounded at record levels last year.
Sustaining Funding for the Capital ProgramAs the Port Authority of New York and New Jersey continued to face the effects of the
national economic downturn, the Board of Commissioners made the difficult decision to
increase tolls and fares in the summer of 2011. Ultimately, these actions were critical in
continuing active transportation projects and sustaining jobs in the field. The ITN, which
includes PATH, our interstate crossings, and our bus terminals, is not self-sufficient, even
with the increases in tolls and fares. Due to reduced revenues and the need for the largest
overhaul of facilities in the agency’s 90-year history, the Port Authority could not fund
critical transportation and security projects that are vital to job growth and the region’s
economic stability.
In 2011, we experienced a decline in overall vehicular and truck traffic at our Hudson River
and Staten crossings. We did start to see modest signs of growth, however, especially in
PATH and international air passengers, which handled record volumes in 2011, and at the
Port of New York and New Jersey, which posted record container traffic. Since the onset of
the economic downturn, the agency had implemented a series of austerity measures—a
zero-growth operating budget three years in a row, and reductions in the workforce to its
lowest level in 40 years, along with a prioritization of capital programs.
In the summer of 2011, Governors Cuomo and Christie directed senior officials to perform
a top-to-bottom review of the agency, its capital plan, and organization. As a result, the
Board established a Special Committee of the Board to examine the organization’s
operational effectiveness, structure, staffing levels, compensation and benefits, and financial
management. The Special Committee delivered a preliminary report to Governors Cuomo
and Christie in January 2012.
In the summer of 2011, Governors
Cuomo and Christie directed a top-to-bottom
review of the Port Authority, its capital plan, and
organization.

13
interstate bridges and two tunnels handled 119 million vehicles in 2011, down from 121
million in 2010, which in turn was off significantly from the 2007 high of 127 million.
However, passenger and cargo activity started to recover from its recession levels. In 2011,
PATH ridership increased by 3.6 percent, reaching 76.6 million passenger trips during
the year. This is the highest passenger volume recorded by the PATH system since the
Port Authority took over operations of the former Hudson & Manhattan Railroad in 1962.
The previous high of 74.9 million annual trips was set in 2008. PATH carries an average of
256,000 weekday travelers.
All five of the region’s airports saw gains in overall passenger growth during 2011. While the
combined regional total of 105.5 million air passengers is up from 103 million in 2010, it is
still short of the 109 million peak established in 2007. Air cargo volumes stayed consistent
compared to 2010, with 2.2 million in cargo tons.
Consistent with the findings of the report, the Board of Commissioners enacted reforms to
employee compensation and benefits programs as well as the Port Authority’s Freedom of
Information policy. These reforms built on the positive changes that began last year on
transparency and governance. Initial reforms in 2011 included posting total compensation of
employees online; hiring the first new independent auditor in 31 years; strengthening our
internal enterprise risk management system; and establishing an Insurance Working Group
to examine insurance practices. There is more to come in 2012 as we continue the
organizational review and find ways to be even more efficient, transparent, and smarter
stewards of our transportation infrastructure.
Passenger, Cargo Volumes ReboundThe Port Authority’s interstate vehicular crossings experienced a decline of nearly 2 percent
in 2011 against 2010 levels. As measured in eastbound crossings, the Port Authority’s four
The PATH rail transit system and the Port of NY-NJ posted record passenger and cargo volumes in 2011, a clear sign of recovery from the economic downturn.

14
A record number of international air passengers used the Port Authority airport system last
year, and the AirTrain rail systems that connect JFK International and Newark Liberty
International airports with regional commuter railroads continued to post annual passenger
growth. International traffic at JFK grew by more than 800,000 passengers in 2011 to reach
23.9 million annual passengers, a new all-time high. At Newark Liberty, international
passengers topped 11.5 million, also a record.
AirTrain JFK recorded 5.5 million paid passengers in 2011, marking the seventh consecutive
year of ridership increases on the rail system that connects the airport with the Long Island
Rail Road’s Jamaica Station and the New York City Subway, as well as providing on-airport
connections between terminals and services. AirTrain Newark crossed the 2 million paid
passenger threshold for the first time in its 10-year history. The Newark service connects
the airport with NJ Transit and Amtrak Northeast Corridor Line service.
At the Port of New York and New Jersey, which experienced sharp downturns in 2008 and
2009, container volume also recovered to record levels in 2011. General cargo volume, as
measured in 20-foot equivalent container units or TEUs, grew by 4 percent to reach a new
high of 5.5 million TEUs. This surpassed the 5.2 million-TEU record reached in 2007.
Another key indicator of port activity, container movement by rail to and from the port, also
recovered strongly in 2011. ExpressRail, the port’s on-dock rail system that moves
discretionary cargo between the port and inland markets, handled 12 percent more activity
in 2011, reaching 422,144 container moves. The Port Authority has invested strongly in
developing a competitive on-dock rail system for our port, and these increases are an
indication that we are achieving a return on that investment.
The New York-New Jersey
Region faces an unprecedented
need for infrastructure
investment, and the agency is
working to replace some of its
signature facilities.
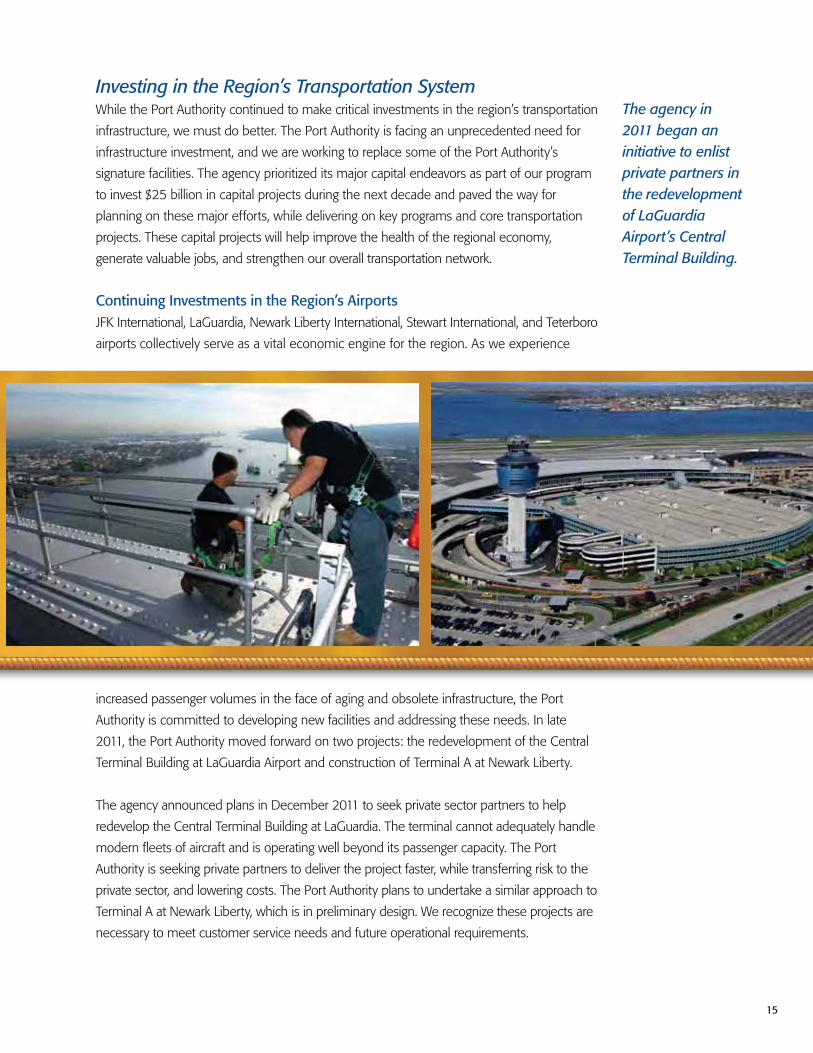
International air passenger volumes at JFK and Newark Liberty International (right) airports reached record highs in 2011. A key element of the Port Authority’s capital program is state-of-good-repair work on the agency’s facilities, including the Bayonne Bridge (opposite page, left). The agency began planning for a replacement of the LaGuardia Central Terminal Building (opposite page, right).
15
Investing in the Region’s Transportation SystemWhile the Port Authority continued to make critical investments in the region’s transportation
infrastructure, we must do better. The Port Authority is facing an unprecedented need for
infrastructure investment, and we are working to replace some of the Port Authority’s
signature facilities. The agency prioritized its major capital endeavors as part of our program
to invest $25 billion in capital projects during the next decade and paved the way for
planning on these major efforts, while delivering on key programs and core transportation
projects. These capital projects will help improve the health of the regional economy,
generate valuable jobs, and strengthen our overall transportation network.
Continuing Investments in the Region’s AirportsJFK International, LaGuardia, Newark Liberty International, Stewart International, and Teterboro
airports collectively serve as a vital economic engine for the region. As we experience
increased passenger volumes in the face of aging and obsolete infrastructure, the Port
Authority is committed to developing new facilities and addressing these needs. In late
2011, the Port Authority moved forward on two projects: the redevelopment of the Central
Terminal Building at LaGuardia Airport and construction of Terminal A at Newark Liberty.
The agency announced plans in December 2011 to seek private sector partners to help
redevelop the Central Terminal Building at LaGuardia. The terminal cannot adequately handle
modern fleets of aircraft and is operating well beyond its passenger capacity. The Port
Authority is seeking private partners to deliver the project faster, while transferring risk to the
private sector, and lowering costs. The Port Authority plans to undertake a similar approach to
Terminal A at Newark Liberty, which is in preliminary design. We recognize these projects are
necessary to meet customer service needs and future operational requirements.
The agency in 2011 began an initiative to enlist private partners in the redevelopment of LaGuardia Airport’s Central Terminal Building.
16
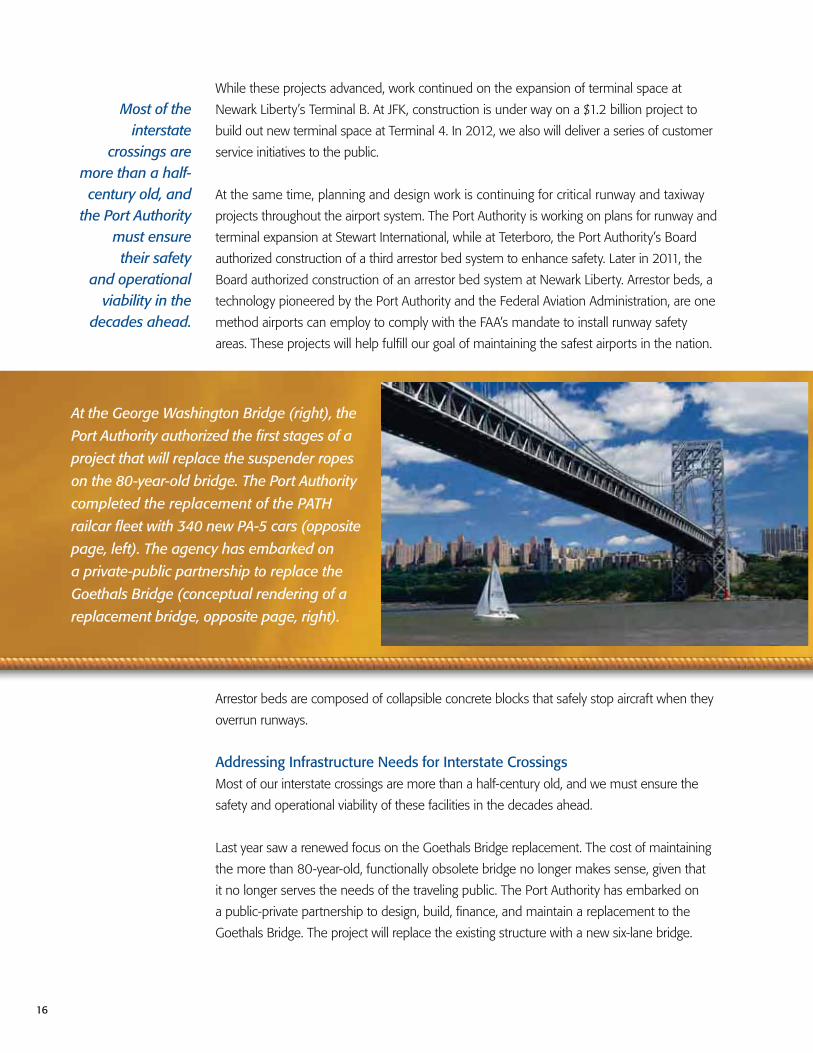
At the George Washington Bridge (right), the
Port Authority authorized the first stages of a
project that will replace the suspender ropes
on the 80-year-old bridge. The Port Authority
completed the replacement of the PATH
railcar fleet with 340 new PA-5 cars (opposite
page, left). The agency has embarked on
a private-public partnership to replace the
Goethals Bridge (conceptual rendering of a
replacement bridge, opposite page, right).
While these projects advanced, work continued on the expansion of terminal space at
Newark Liberty’s Terminal B. At JFK, construction is under way on a $1.2 billion project to
build out new terminal space at Terminal 4. In 2012, we also will deliver a series of customer
service initiatives to the public.
At the same time, planning and design work is continuing for critical runway and taxiway
projects throughout the airport system. The Port Authority is working on plans for runway and
terminal expansion at Stewart International, while at Teterboro, the Port Authority’s Board
authorized construction of a third arrestor bed system to enhance safety. Later in 2011, the
Board authorized construction of an arrestor bed system at Newark Liberty. Arrestor beds, a
technology pioneered by the Port Authority and the Federal Aviation Administration, are one
method airports can employ to comply with the FAA’s mandate to install runway safety
areas. These projects will help fulfill our goal of maintaining the safest airports in the nation.
Arrestor beds are composed of collapsible concrete blocks that safely stop aircraft when they
overrun runways.
Addressing Infrastructure Needs for Interstate CrossingsMost of our interstate crossings are more than a half-century old, and we must ensure the
safety and operational viability of these facilities in the decades ahead.
Last year saw a renewed focus on the Goethals Bridge replacement. The cost of maintaining
the more than 80-year-old, functionally obsolete bridge no longer makes sense, given that
it no longer serves the needs of the traveling public. The Port Authority has embarked on
a public-private partnership to design, build, finance, and maintain a replacement to the
Goethals Bridge. The project will replace the existing structure with a new six-lane bridge.
Most of the interstate
crossings are more than a half-century old, and
the Port Authority must ensure their safety
and operational viability in the
decades ahead.

17
The Port Authority continued planning and design for significant projects crucial to our
network of interstate crossings. The Lincoln Tunnel Helix, an iconic roadway structure leading
to the Lincoln Tunnel, is more than 70 years old and nearing the end of its useful life.
It is critical we move ahead with a plan to repair the structure. In November, the Board
authorized a project to rehabilitate the Lincoln Tunnel Helix, the I-495 approach roadway
to the tunnel. “The Helix Fix” is scheduled to begin in the summer of 2012 and continue
through 2014.
Last year, the George Washington Bridge turned 80 years old, and its 592 suspender ropes
are reaching the end of their useful lives. In December, the Board authorized a $20 million
effort to begin the planning phase for the replacement of the bridge’s steel suspender ropes.
The construction of this project is anticipated to cost between $1 billion and $1.2 billion and
is projected to generate nearly 4,000 jobs.
Full Speed Ahead with PATH ModernizationIn November, the Port Authority placed the last of its 340 new railcars into service, marking
the completion of a multiyear $744 million project that replaced one of the nation’s oldest
rail fleets with new, state-of-the-art equipment. The new fleet is part of a larger effort at
modernizing the entire PATH system, which provides critical rail transit connections between
Manhattan and North Jersey urban centers and commuter rail hubs. PATH is also in the
midst of a $400 million signal system upgrade. This project also will help PATH enhance
system capacity and reduce delays through greater efficiency.
As more passengers use the PATH system, the Port Authority is actively working to anticipate
demand and plan accordingly. To meet future capacity demands, PATH is preparing to
lengthen platforms to accommodate 10-car trains in order to provide extra capacity on the
heavily used World Trade Center-Newark line, to and from Lower Manhattan.
With all 340 new PATH cars now in service, the railroad’s fleet has been transformed from one of the oldest in the nation to one of the most modern and up-to-date rail transit systems.

18
Maintaining the Competitive Edge at the Region’s PortsWith the steady rise in cargo volume, the Port Authority continues to invest in several critical
port projects, many of which will improve or guarantee effective ocean- and land-side access
to the marine terminals.
Engineering and design work continued on a project that will raise the roadway of the
Bayonne Bridge. The Port Authority has committed $1 billion to the project and this work
is crucial to maintaining the Port of New York and New Jersey’s position as the largest
East Coast port. This project will raise the bridge’s roadbed from 151 to 215 feet to
accommodate a new generation of larger post-Panamax oceangoing vessels starting in
2014. Planning work is under way, and the agency is working with the U.S. Coast Guard to
accelerate the regulatory permitting process so that the project can be completed quickly
and with no disruption to traffic on the crossing or the navigational channel below.
Work also continued on the full build-out of the ExpressRail system—the Port Authority’s
network of on-dock rail terminals that help move cargo efficiently to and from inland markets.
This included work on the Corbin Street rail yard and an overpass at Corbin Street that will
connect the ExpressRail Newark terminal with the Port Newark Container Terminal.
In December, the Board authorized a $39 million investment to design and reconstruct a
section of Corbin Street, one of the main highway access roadways to Port Newark/Elizabeth.
This followed action to widen McLester Street in the Elizabeth-Port Authority Marine Terminal,
and to widen and realign Port Street and Brewster Road.
Additionally, work continued on the 50-foot harbor deepening project. Harbor deepening
will provide deeper channels leading to and from Port Newark, the Elizabeth-Port Authority
The Port Authority has committed $1 billion to a
project that will raise the roadway
of the Bayonne Bridge to provide
navigational clearance for the
world’s largest shipping vessels.
This overpass at Port Newark (right), connecting ExpressRail Newark with the PNCT terminal, is a key element of the Port of New York and New Jersey’s full build-out of the ExpressRail system. This rendering (opposite page, left) shows how the Bayonne Bridge will appear with its roadway raised to 215 feet to accommodate larger containerships calling on the Port of New York and New Jersey. The World Trade Center (opposite page, right) Memorial Plaza opened for the first time on September 11, 2011.

19
Marine Terminal, and Port Jersey by the end of 2012, and to and from the New York
Container Terminal at Howland Hook in Staten Island by 2014. The project is on schedule
to be complete in time for the Panama Canal expansion. Harbor deepening improves
navigational safety and will accommodate the next generation of vessels, and ensure our
standing as the third largest port in the nation.
Honoring Our Commitments at the World Trade CenterOn September 11, 2011, the Memorial Plaza at the National September 11th Memorial
was opened for the first time during a moving ceremony at the World Trade Center site.
This was a result of the Port Authority’s commitment to complete the plaza by the 10th
anniversary of the 2001 terrorist attacks. The Memorial features waterfalls in the footprints
of the original Twin Towers surrounded by inscriptions of the names of all those who were
lost on September 11, 2001, and in the 1993 bombing.
Throughout the year, One World Trade Center rose in the downtown skyline, reaching ever
closer to its 104-story final height. By early 2012, the building had claimed a dominant spot in
the city’s skyline, reaching a height of 90 floors. The building is expected to top off in late
spring/summer of 2012.
In May 2011, the Port Authority signed a lease with Condé Nast—one of the world’s leading
publishing and media companies—to occupy one-third of One World Trade Center. It was an
important milestone in the development of the new World Trade Center, and it paves the way for
the further revitalization of Lower Manhattan. The publishing company’s lease calls for an initial
25-year term for more than 1 million square feet of office space, covering more than 20 floors.
In addition to the Memorial and One World Trade Center accomplishments, the Port Authority
is also managing the construction of the WTC Transportation Hub, which is slated to open
Work at the WorldTrade Center site achieved significant milestones in 2011 with the opening of the Memorial Plaza and with One World Trade Center reaching high into the city’s skyline.

20
in 2014. This facility will serve PATH’s World Trade Center trains as well as a connector to
other key public transportation services. In early 2012, the Transportation Hub’s mezzanine
level was nearly complete, and workers were bringing the Transit Hall to grade level on the
eastern half of the site.
The Port Authority worked throughout the year with its World Trade Center partners on
other key aspects that came to fruition early in 2012. Among these was the announcement
by the Port Authority of a joint venture with the Westfield Group for the development,
lease, and operation of up to 450,000 square feet of shopping and dining space at the
World Trade Center site. The agreement represents the largest private sector investment
of new equity to date at the World Trade Center. Westfield will invest $612.5 million for a
50 percent share in the venture. The initial retail space will total 365,000 square feet across
multiple levels of the site, including space in the Transportation Hub and at street level.
Renewed Focus on Our Customers Service is at the core of the Port Authority’s approach to its mission. The Port Authority
directly affects the lives of people from the region every day. While we have completed
certain initiatives, we will work to ensure a more responsive level of service in the coming
year. The Port Authority also has an important role to play in the stewardship of the
region’s environment, its economic well-being, and its communities.
NY-NJ Staten Island Bridges Plan
Among the key service initiatives undertaken in 2011 was an adjustment in the New York-
New Jersey Staten Island Bridges Plan. The Port Authority plan now provides savings of up to
50 percent for E-ZPass users and up to 60 percent off the cash toll for motorists who make
up to 10 trips in a 30-day period when using the Bayonne and Goethals bridges and the
Outerbridge Crossing. The previous plan required 20 trips in a 35-day period. For regular
commuters, this can translate into more than $1,000 per year in savings.
While operating transportation
facilities that touch the lives of more
than 1 million people a day, the
Port Authority puts service at the core
of its approach to its mission.
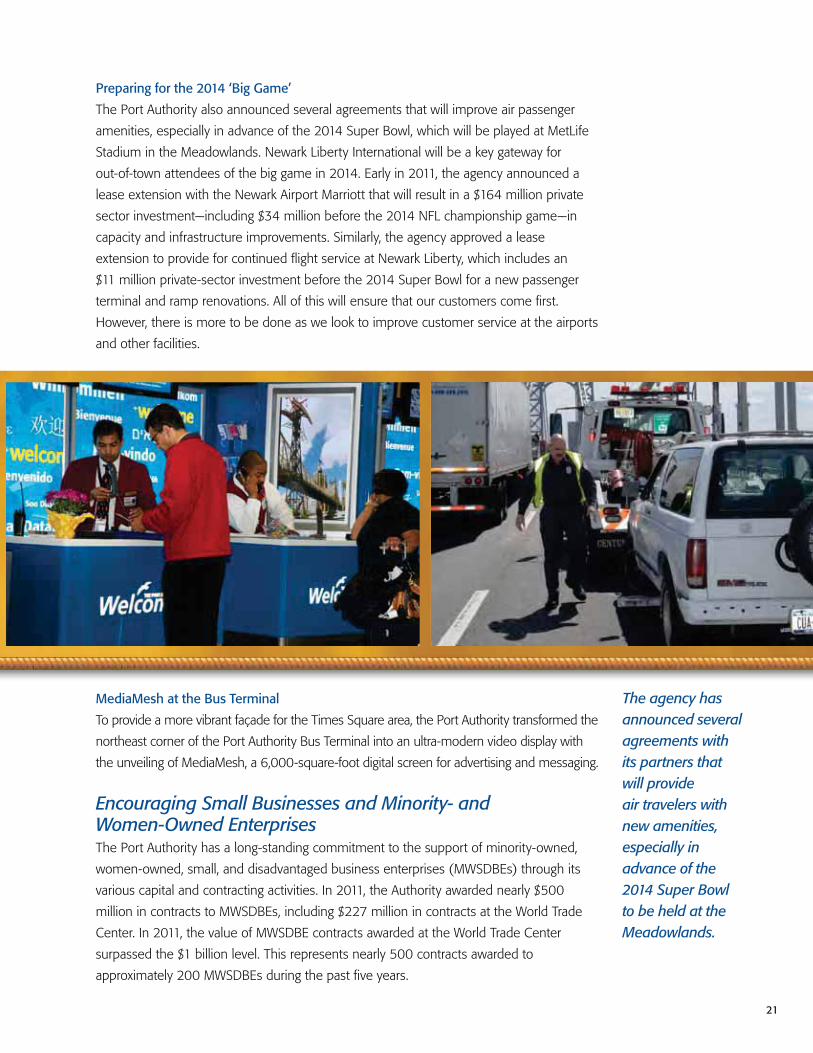
The Port Authority Police (right) provide essential law enforcement and security services at Port Authority facilities. Customer Care agents offer assistance with a variety of traveling concerns at airport Welcome Centers (opposite page, left). Tunnel and Bridge agents (opposite page, right) help motorists on the agency’s interstate crossings.
21
MediaMesh at the Bus Terminal
To provide a more vibrant façade for the Times Square area, the Port Authority transformed the
northeast corner of the Port Authority Bus Terminal into an ultra-modern video display with
the unveiling of MediaMesh, a 6,000-square-foot digital screen for advertising and messaging.
Encouraging Small Businesses and Minority- and Women-Owned EnterprisesThe Port Authority has a long-standing commitment to the support of minority-owned,
women-owned, small, and disadvantaged business enterprises (MWSDBEs) through its
various capital and contracting activities. In 2011, the Authority awarded nearly $500
million in contracts to MWSDBEs, including $227 million in contracts at the World Trade
Center. In 2011, the value of MWSDBE contracts awarded at the World Trade Center
surpassed the $1 billion level. This represents nearly 500 contracts awarded to
approximately 200 MWSDBEs during the past five years.
The agency has announced several agreements with its partners that will provide air travelers with new amenities, especially in advance of the 2014 Super Bowl to be held at the Meadowlands.
Preparing for the 2014 ‘Big Game’
The Port Authority also announced several agreements that will improve air passenger
amenities, especially in advance of the 2014 Super Bowl, which will be played at MetLife
Stadium in the Meadowlands. Newark Liberty International will be a key gateway for
out-of-town attendees of the big game in 2014. Early in 2011, the agency announced a
lease extension with the Newark Airport Marriott that will result in a $164 million private
sector investment—including $34 million before the 2014 NFL championship game—in
capacity and infrastructure improvements. Similarly, the agency approved a lease
extension to provide for continued flight service at Newark Liberty, which includes an
$11 million private-sector investment before the 2014 Super Bowl for a new passenger
terminal and ramp renovations. All of this will ensure that our customers come first.
However, there is more to be done as we look to improve customer service at the airports
and other facilities.

22
Early in 2012, New York Governor Andrew Cuomo’s office announced a streamlined M/WBE
certification process between the Port Authority and the New York State Department of
Economic Development, Division of Minority and Women’s Business Development.
This effort was championed to make it easier for minority and women-owned businesses
to obtain M/WBE certification, and gain access to special vendor programs and regional
contracting opportunities.
Energy ConservationAs part of our commitment to the environment, the Port Authority undertook several energy
conservation projects at JFK through a New York Power Authority program in 2011. This
included completing work on several buildings and garages at JFK that will result in average
building energy savings of approximately 30 percent.
Port Authority participation in demand response programs, where facilities shed load during
times of peak demand, increased substantially in 2011. Capacity enrollments increased 50
percent, and associated incentive payments increased approximately 33 percent. In 2011,
Port Authority purchases of Renewable Energy Certificates increased approximately 70
percent, covering more Port Authority demand with power from “green” sources.
Ecosystem Preservation and Waterfront AccessAs part of the Port Authority’s commitment to preserve habitat and waterfront access
within the Port District, it has set aside $30 million each for the states of New York and
New Jersey. Properties acquired under the Hudson-Raritan Estuary Resources Program
(HRERP) are preserved through conservation easements or deed restrictions. In 2011,
Depot Place on the Harlem River Promenade in the Bronx was acquired, and the creation
of a fully accessible public waterfront at River Barge Park in the New Jersey Meadowlands
neared completion.
Stewardship of the regional environment
is a key commitment of
the Port Authority.
The exterior of the Port Authority Bus Terminal
(right) was transformed with the installation of
MediaMesh. The River Barge Park (opposite page,
left) in Carlstadt, N.J., which opened in 2011, is
among the properties that the Port Authority
and local communities have preserved under
the Hudson-Raritan Estuary Resources Program.
Under the Truck Replacement Program, the
Port Authority is working with the port community
to improve air quality in the region (opposite
page, right).

23
The Port Authority continued its commitment to the preservation of habitat and waterfront
access in early 2012 by approving a contribution of up to $4 million to help acquire a nearly
43-acre conservation easement on Staten Island. This easement is part of the 113.6-acre
William H. Pouch Scout Camp. Along with $1 million from the City of New York, the Port
Authority’s investment will preserve one of the borough’s last remaining large swaths of
open space from potential future development. The action will enable greater public access
and ensure continued use by the region’s Boy Scouts for generations to come.
Several other clean air strategy actions in 2011 contributed to improved air quality at the
Port of New York and New Jersey marine terminals and surrounding communities. The Truck
Replacement Program disbursed $1.9 million in incentive grants to replace more than 138
old trucks with newer, cleaner, more fuel-efficient vehicles, while the Truck Phaseout Plan
prohibited all model years 1993 or older trucks from serving the Port. The Low Sulfur Fuel
Program provided nearly $200,000 in incentives to ships that made 188 vessel calls during
which they burned cleaner, low sulfur fuel and reduced speed, and the Cargo Handling Fleet
Modernization program provided $560,000 in incentives to marine terminal operators that
replaced old equipment with newer units meeting the latest emission standards.
In 2011, the Port Authority marked the 90th anniversary of its creation. It was a challenging,
and sometimes difficult year for the agency and its customers. Yet, the agency is proud of all
its achievements in 2011. The Board and the new management of the organization have set
the agency on a new course to better provide the region with the transportation and trade
infrastructure and services that will be needed in the years ahead.
With the direction of the Governors, the Board, and its new leadership, the Port Authority has set a new course for the agency—one that will enable it to meet the demands of the future.

24
25
To The Board of Commissioners ofThe Port Authority of New York and New Jersey
The Consolidated Financial Statements (the “Financial Statements”) of The Port Authority of New York and New Jersey (including its related entities, collectively referred to herein as the “Port Authority”) as of and for the years ended December 31, 2011, and December 31, 2010, are enclosed. Responsibility for both the accuracy of the data and the completeness and fairness of the presentation in the Financial Statements rests with management of the Port Authority. The Management’s Discussion and Analysis (“MD&A”) and Required Supplementary Information sections of the Financial Statements provide a narrative introduction, overview, and analysis of the Port Authority’s financial performance and are required by the Governmental Accounting Standards Board (“GASB”). Schedules A, B, and C have been prepared in accordance with Port Authority bond resolutions and are not intended to be a presentation in conformity with accounting principles generally accepted in the United States of America (“GAAP”). Schedules D, E, F, and G include other statistical information presented for purposes of additional analysis and are not a required part of the Financial Statements.
Port Authority management is also responsible for establishing and maintaining adequate internal controls over financial reporting for the Port Authority. Internal control over financial reporting is a process designed to provide reasonable assurance regarding the reliability of financial reporting and the preparation of financial statements in accordance with GAAP. The Port Authority has established a comprehensive framework of internal controls that includes maintaining records that accurately and fairly reflect the transactions of the Port Authority; provide reasonable assurance that transactions are recorded as necessary for financial statement preparation; and provide reasonable assurance that unauthorized use, acquisition or disposition of company assets that could have a material impact on the Port Authority’s financial condition would be prevented or detected on a timely basis. Because of its inherent limitations, internal control over financial reporting is not intended to provide absolute assurance that a misstatement of the financial statements would be prevented or detected.
As officers of the Port Authority, the Port Authority’s executive director and I certified in connection with the release of the Financial Statements on February 24, 2012, that (a) to the best of our knowledge and belief, the financial and other information, including the summary of significant accounting policies described in the Financial Statements, was accurate in all material respects and was reported in a manner designed to present fairly the Port Authority’s net assets, changes in net assets, and cash flows, in conformity with GAAP; and (b) on the basis that the cost of internal controls should not outweigh their benefits, the Port Authority has established a comprehensive framework of internal controls to protect its assets from loss, theft, or misuse, and to provide reasonable (rather than absolute) assurance regarding the reliability of financial reporting and the preparation of the Financial Statements in conformity with GAAP.
A firm of independent auditors is retained annually to conduct an audit of the Financial Statements in accordance with auditing standards generally accepted in the United States of America. The goal of the independent audit is to provide reasonable assurance that these Financial Statements are free of material misstatement. The audit includes an examination, on a test basis, of the evidence supporting the amounts and disclosures in the Financial Statements, an assessment of the accounting principles used and significant estimates made by management, as well as the overall presentation of the Financial Statements. In planning and performing their audit, the independent auditors considered the Port Authority’s comprehensive framework of internal controls in order to determine auditing procedures for purposes of expressing an opinion on the Financial Statements. The independent auditors’ report is presented as the first component in the financial section following this letter.
This letter of transmittal is designed to complement the MD&A and should be read in conjunction with the independent auditors’ report and the audited Financial Statements.

26
Profile of the Port AuthorityThe Port Authority is a municipal corporate instrumentality and political subdivision of the states of New York and New Jersey, established in 1921 to provide transportation, terminal, and other facilities of commerce within the Port District, an area of about 1,500 square miles in both states centering about New York Harbor. The Port Authority raises the funds necessary for the improvement, construction, or acquisition of its facilities generally upon the basis of its own credit. The Port Authority has no power to pledge the credit of either state or any municipality, or to levy taxes or assessments.
The Port Authority maintains an infrastructure of financial systems to record the financial results of operations and provide an audit trail to be used in a review of accountability.
The financial planning process integrates an annual budget process with multiyear forecasting projections. Through the capital plan and budget process, staff identifies strategic, financial, and operational issues that affect resource allocations; sets forth an expenditure plan for the year that balances priorities across all agency lines of operation; and provides alternate financial scenarios of proposed operating and financial arrangements and their impact on the agency’s financial position. Each new budget is separately considered and approved by the Port Authority’s Board of Commissioners (“Board of Commissioners”), although such approval does not in itself authorize specific expenditures, which are authorized from time to time by, or as contemplated by, other specific actions of the Board of Commissioners.
The approved budget becomes a mechanism that facilitates the systematic review of program expenditures to ensure that they are made consistent with statutory, contractual, and other commitments of the agency, the policies and financial decisions of the Board of Commissioners, and the requirements of the By-Laws of the Port Authority. Forecasting models are used to assess the agency’s projected long-range financial condition; determine the financial feasibility of future capital investment; and perform financial tests to measure fiscal risk and to ensure the organization’s integrity in the credit markets. This comprehensive approach to planning, budgeting, and forecasting enables the agency to identify, track, and take corrective action with respect to the funding requirements needed to deliver the projects and services that the Port Authority provides.
Regional Economic Condition and Outlook Regionally, Port District economic growth has slowed and is now expanding at a pace below that of the U.S. economy. 2011 was an inflection point as faster than national economic growth reversed itself regionally over the summer months and has fallen slightly below the expansionary pace of the U.S. economy. However, regional growth for 2012 is still estimated to be approximately 2.0 percent.
There remains a discrepancy between economic growth in the New York and New Jersey parts of the region. Growth in the New York counties has been largely fueled by a recovery of the financial sector, significant growth in leisure and tourism and spending on education and health care. Construction in New York counties spending remains depressed. The New Jersey counties have seen growth in the same areas but not as fast as their New York counterparts.
In terms of employment, the region is still struggling to regain its pre-recession levels. The New York counties have made progress and are close to a full recovery. Significant employment gains in education, health, and leisure and tourism have been able to offset declines in manufacturing and construction. In the New Jersey counties, 2011 ended with an improvement of employment conditions. Even though government employment continued to shrink, there was modest growth across the board. At the current pace of expansion, New Jersey counties are expected to regain their pre-recession levels by the end of 2016. In contrast, New York employment figures are expected to be higher than their pre-recession levels by the end of 2012.
Reflecting the economic recovery, in 2011 activity levels at Port Authority facilities saw improvements except for bridges and tunnels. The region’s airports saw an increase in passengers of 1.8 percent. This result is significant considering the severe weather conditions early in 2011, the shutdown of the FAA over the budget debate, and the upward trend in ticket prices. Port Authority Hudson River vehicular crossings totaled 119.2 million vehicles, a decrease of 1.7 percent from 2010. Auto travel fell 1.9 percent to 108 million automobiles. These declines were the result of severe weather and snow conditions, higher gasoline prices, lagging employment growth in the region, and the September 2011 toll increase at Port Authority
27
Hudson River vehicular crossings. PATH passenger volumes increased 3.6 percent to an all-time high of 76.6 million passengers in 2011 from 2010. The level of containerized cargo increased in 2011 by 3.9 percent to a total volume of 3.2 million containers.
The Port Authority has taken a variety of measures over the past years to mitigate the impacts of the economic downturn and will continue to do so in 2012. Going forward, the Port Authority will continue to monitor the economic environment and develop sound budgets that are fiscally sustainable and responsive to the economic needs of the region.
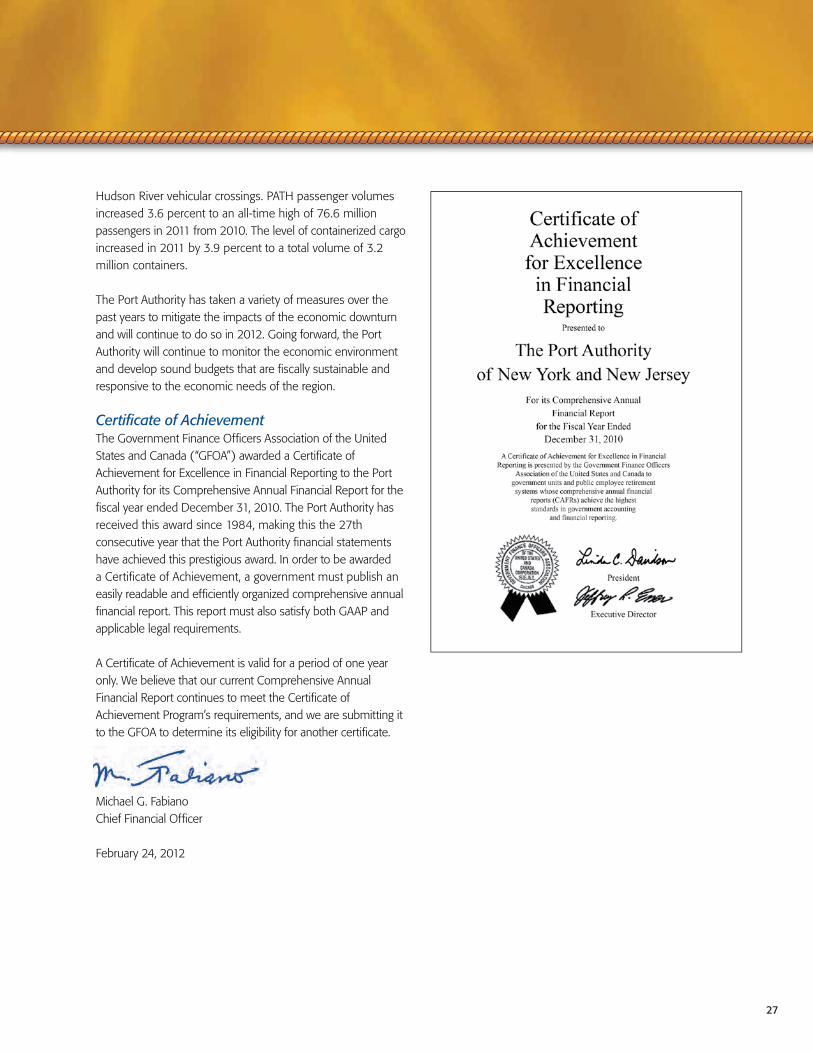
Certificate of AchievementThe Government Finance Officers Association of the United States and Canada (“GFOA”) awarded a Certificate of Achievement for Excellence in Financial Reporting to the Port Authority for its Comprehensive Annual Financial Report for the fiscal year ended December 31, 2010. The Port Authority has received this award since 1984, making this the 27th consecutive year that the Port Authority financial statements have achieved this prestigious award. In order to be awarded a Certificate of Achievement, a government must publish an easily readable and efficiently organized comprehensive annual financial report. This report must also satisfy both GAAP and applicable legal requirements.
A Certificate of Achievement is valid for a period of one year only. We believe that our current Comprehensive Annual Financial Report continues to meet the Certificate of Achievement Program’s requirements, and we are submitting it to the GFOA to determine its eligibility for another certificate.
Michael G. FabianoChief Financial Officer
February 24, 2012

29
Financial SectionThe Port Authority of New York and New Jersey
Annual Financial Report for the Year Ended December 31, 2011
Prepared by the Comptroller’s Department

30

31
Independent Auditors’ Report
Member ofDeloitte Touche Tohmatsu

32

33
IntroductionThe following discussion and analysis of the financial performance and activity of The Port Authority of New York and New Jersey and the related entities described herein (see Note A.1(d) – Nature of the Organization and Summary of Significant Accounting Policies) is intended to provide an introduction to and understanding of the consolidated financial statements of the Port Authority for the year ended December 31, 2011, with selected comparative information for the years ended December 31, 2010 and December 31, 2009. This section has been prepared by management of the Port Authority and should be read in conjunction with the financial statements and the notes thereto, which follow this section.
Overview of 2011 Financial Results Net assets of the Port Authority increased $701 million in 2011, compared to an increase of $347 million in 2010.
Gross operating revenues totaled $3.8 billion in 2011, representing a $166 million increase from 2010. This increase was primarily due to a $78 million increase in toll and fare revenues, reflecting the partial year impact of revised toll and fare schedules which became effective on September 18, 2011 at the Port Authority’s six vehicular crossings and the Port Authority Trans-Hudson Corporation (PATH) system; a $41 million increase in facility rental revenues associated with Special Project Bonds, Series 8, JFK International Air Terminal LLC (JFKIAT Project) issued in December 2010 for a terminal expansion project at John F. Kennedy International Airport (JFK); and a $23 million increase in aviation fees primarily derived from cost recovery agreements with airlines operating at LaGuardia Airport (LGA), JFK and Newark Liberty International Airport (EWR).
Operating and maintenance expenses totaled $2.6 billion in 2011, a $34 million decrease when compared to 2010. The decrease was primarily due to a $186 million decrease in non-recurring capital expenditure write-offs to operating expense accounts in 2011 compared to 2010 write-offs, which included the write-off of alternative design work prepared in conjunction with the redevelopment of the World Trade Center (WTC) site and the terminated Access to the Region’s Core Project (ARC Project). Partially offsetting this decrease was a $96 million increase in contract service costs in 2011 from 2010, primarily due to a $24 million increase for the use of outside legal services and a $15 million increase in costs for the demolition of Terminal 6 and Hangar 12 at JFK; a $41 million increase in interest expenses associated with the JFKIAT Project; and a $15 million increase in employee compensation costs primarily due to higher police overtime resulting from the continued heightened security levels at Port Authority facilities.
Depreciation and amortization expense increased by $65 million in 2011 compared to 2010 primarily reflecting the full year impact of transferring $1.8 billion of construction in progress to completed construction in 2010 and the transfer of an additional $2.1 billion of construction in progress to completed construction in 2011.
Net recoverables relating to the events of September 11, 2001 decreased by $53 million in 2011 reflecting the 2010 final settlement with insurers participating in the Port Authority’s property damage and business interruption insurance claims related to the events of September 11, 2001.
Financial income decreased by $51 million in 2011 compared to 2010 primarily due to a $41 million year-to-year decrease in market valuation adjustments associated with three unhedged interest rate exchange contracts (swaps). Interest expense increased by $58 million in 2011 primarily reflecting higher outstanding principal amounts in connection with consolidated bonds and other asset financings.
Contributions, Passenger Facility Charges (PFCs) and grants increased by $382 million in 2011 compared to 2010 primarily due to contributed capital amounts of $275 million from the net lessees of WTC Towers 2, 3 and 4 (Silverstein net lessees) relating to the construction of these buildings and $100 million from the Durst Corporation (Durst) for a minority equity interest in Tower 1 Joint Venture LLC.
Other Activities
PATH, including $172 million for the purchase of new PATH rail cars and $44 million for the PATH signal replacement project; $214 million spent on Port Commerce facilities, including $109 million on channel improvement projects; $212 million spent on Aviation facilities, including $28 million on Terminal B mid and upper level modifications at EWR; $160 million spent on Tunnel, Bridge & Terminal facilities, including $20 million on George Washington Bridge (GWB) upper level structural rehabilitation; and $154 million spent on projects designed to maintain the safety and security across the agency’s facilities.
rebuilding of the WTC site; infrastructure improvements to the main routes and approaches to the Lincoln Tunnel; continued planning efforts for the replacement of the Goethals Bridge; rehabilitation of the Bayonne Bridge and Terminals A and B at EWR; runway and taxiway reconstruction at airports; and the advancement of a new PATH signal system.
toll for automobiles paying with cash was increased from $8.00 to $12.00, with further increases of $1.00 scheduled in December 2012, 2014 and 2015; the cash toll for truck classes 2-6 was increased from $8.00 to $13.00 per axle, with further increases of $2.00 per axle scheduled in December each year from 2012 through 2015; the cash toll for buses carrying 10 or more people was increased from $6.00 to $20.00, with further increases of $1.00 scheduled in December each year from 2012 through 2015. Discounts are available for vehicles using the E-ZPass electronic toll collection system and certain designated user programs. The PATH base fare for a single trip increased from $1.75 to $2.00 per trip, with further increases of 25 cents scheduled on October 1st each year from 2012 through 2014. The cost of the multi-trip tickets and SmartLink passes will increase on October 1st each year from 2012 through 2014 in a consistent manner with the base fare increase.
Management’s Discussion and AnalysisYear ended December 31, 2011
Management’s Discussion and Analysis(continued)
34
As a condition of the toll and fare increases, a Special Committee of the Board of Commissioners (Special Committee) was formed on September 30, 2011, as directed by the Governors of the States of New York and New Jersey, to immediately commence a comprehensive audit of the Port Authority focusing on both a financial audit of the Port Authority’s ten-year capital plan to reduce its size and cost and a review of the Port Authority’s management and operations to find ways to lower costs and increase efficiencies. On January 31, 2012, the Special Committee issued a Phase I Interim Report to the Governors.
On September 27, 2011, the Automobile Club of New York, Inc. d/b/a AAA New York and North Jersey Inc., instituted an action against the Port Authority in the United States District Court for the Southern District of New York seeking (i) a declaration that the 2011 tolls schedule is illegal and void under the Federal-Aid Highway Act of 1987 and the Commerce Clause of the United States Constitution; and (ii) to preliminarily enjoin the Port Authority from continuing to collect tolls under the 2011 tolls schedule pending a determination in this action and directing the Port Authority to reinstate the tolls in effect prior to September 18, 2011. The Port Authority disputes the plaintiffs’ allegations and vigorously defends the Port Authority’s position that the 2011 tolls schedule is consistent with the just and reasonable requirement of the Federal-Aid Highway Act of 1987, does not violate the Commerce Clause, and conforms with established case law.
On February 6, 2012, United States District Court for the Southern District of New York denied the plaintiffs’ application for a preliminary injunction.
have started to recover from their recession lows. A combination of the modest gains in activity levels, increased rental revenues in connection with airport terminal expansion and the toll and fare increases have put the agency in a more financially sound position to support its ten-year capital plan for building new facilities and maintaining the existing network of facilities in a state of good repair. The Port Authority’s Preliminary 2012 Budget anticipates a $31 million, or 1.2%, increase in operating expenses over the 2011 budget. This increase is to accommodate one-time items for an interim port operating agreement in connection with the surrender of certain port tenant leaseholds, and acceleration of a final payment under a memorandum of agreement between the Port Authority and the Brooklyn Bridge Park Development Corporation as well as for additional policing needs at the WTC site. The agency’s core expenses, excluding these incremental costs, are relatively flat while providing approximately $36 million in increased air and marine terminal rent payments under certain lease agreements with the City of New York and the City of Newark.
Overview of the Financial StatementsManagement’s discussion and analysis is intended to serve as an introduction to the Port Authority’s financial statements, including the notes to the consolidated financial statements, required supplementary information, financial schedules pursuant to Port Authority bond resolutions, and statistical and other supplemental information. The financial statements comprise the following: the Consolidated Statements of Net Assets, the Consolidated Statements of Revenues, Expenses and Changes in Net Assets, the Consolidated Statements of Cash Flows, and the Notes to the Consolidated Financial Statements.

35
Management’s Discussion and Analysis(continued)
Consolidated Statements of Net AssetsThe Consolidated Statements of Net Assets present the financial position of the Port Authority at the end of the fiscal year and include all of its assets and liabilities. Net Assets represent the difference between total assets and total liabilities. A summarized comparison of the Port Authority’s assets, liabilities, and net assets follows:
2011 2010 2009
(In thousands)
ASSETSCurrent assets $ 4,044,368 $ 3,348,508 $ 3,542,307
Noncurrent assets
Facilities, net 23,134,288 20,557,400 18,398,356
Other noncurrent assets 6,739,065 5,649,662 5,266,810
Total assets 33,917,721 29,555,570 27,207,473
LIABILITIESCurrent liabilities 2,635,668 2,456,529 2,292,249
Noncurrent liabilities
Bonds and other asset financing obligations 15,751,041 13,554,884 12,406,153
Other noncurrent liabilities 3,805,121 2,519,534 1,831,289
Total liabilities 22,191,830 18,530,947 16,529,691
NET ASSETS Invested in capital assets, net of related debt 10,020,306 9,200,077 8,415,993
Restricted 294,460 222,871 211,725
Unrestricted 1,411,125 1,601,675 2,050,064
Total net assets $11,725,891 $11,024,623 $10,677,782
Port Authority assets, which totaled $33.9 billion at December 31, 2011, increased by $4.4 billion from December 31, 2010 primarily due to a $2.6 billion increase in “Facilities, net,” including both completed construction and construction in progress, and a $1.2 billion increase in “Amounts receivable – Tower 4 Liberty Bonds” in 2011 due to the issuance of “New York Liberty Development Corporation, Liberty Revenue Bonds, Series 2011 (4 World Trade Center Project)” (Tower 4 Liberty Bonds) in November 2011 by the New York Liberty Development Corporation for the continued construction of WTC Tower 4. In addition, cash and investments increased by $605 million primarily due to an increase in available bond proceeds received in connection with the issuance of capital obligations, and an increase in Port Authority reserve funds. Partially offsetting these increases was a $132 million decrease in “Other amounts receivable, net” due to the satisfaction of the receivable recognized in 2001 in connection with the recovery for and development of certain capital assets primarily comprised of WTC Towers 2, 3 and 4.
Port Authority liabilities totaled $22.2 billion at December 31, 2011, an increase of $3.7 billion from December 31, 2010. This increase was primarily due to a $2.2 billion increase in “Bonds and other asset financing obligations” resulting from the issuance of consolidated bonds in connection with the Port Authority’s capital plan and a $1.2 billion increase in “Amounts payable – Tower 4 Liberty Bonds” in 2011 due to the issuance of Tower 4 Liberty Bonds in November 2011 by the New York Liberty Development Corporation for the continued construction of WTC Tower 4 (see Note D and Note K).
Net assets totaled $11.7 billion at December 31, 2011, an increase of $701 million from December 31, 2010. “Invested in capital assets, net of related debt,” totaling $10 billion at December 31, 2011, represents the largest of the three components of Port Authority Net Assets and comprises investment in capital assets (such as land, buildings, improvements and equipment), less the related outstanding indebtedness used to acquire those capital assets. Net Assets reported as restricted due to constraints imposed by agreements or legislation totaled $294 million, comprised of $160 million for Port Authority Insurance Captive Entity, LLC (PAICE); $100 million for a minority equity interest in Tower 1 Joint Venture LLC; $20 million in PFCs restricted for use on projects or expenditures eligible for the application of PFCs; and $14 million in insurance proceeds which are restricted to business interruption obligations and redevelopment expenditures of WTC Retail LLC. The balance of net assets at December 31, 2011 totaling $1.4 billion are unrestricted and may be used to meet ongoing Port Authority obligations.

Management’s Discussion and Analysis(continued)
36
Consolidated Statements of Revenues, Expenses and Changes in Net AssetsThe change in net assets is an indicator of whether the overall fiscal condition of an organization has improved or worsened during the year. Following is a summary of the Consolidated Statements of Revenues, Expenses and Changes in Net Assets:
2011 2010 2009
(In thousands)
Gross operating revenues $(3,800,480 $(3,634,023 $(3,552,243
Operating expenses (2,564,969) (2,598,557) (2,438,670)
Depreciation and amortization (930,264) (865,515) (786,948)
Net recoverables related to the events of September 11, 2001 – 53,051 202,978
Income from operations 305,247 223,002 529,603
Net non-operating expenses (609,172) (499,338) (329,326)
Contributions, PFCs and grants 1,005,193 623,177 646,141
Increase in net assets $(0,701,268 $(3,346,841 $(3,846,418
Additional information on facility operating results can be found in Schedule E located in the Statistical and Other Supplemental Information section of this report.
Revenues A summary of gross operating revenues follows:
2011 2010 2009
(In thousands)Gross operating revenues: Rentals $1,150,569 $1,144,709 $1,115,652
Tolls and fares 1,148,061 1,069,785 1,068,105
Aviation fees 895,356 872,774 839,327
Parking and other 339,131 321,257 316,005
Utilities 154,810 154,041 140,817
Rentals – Special Project Bonds Projects 112,553 71,457 72,337
Total $3,800,480 $3,634,023 $3,552,243
2011 vs. 2010Gross operating revenues totaled $3.8 billion for the year ended December 31, 2011, a $166 million increase from 2010. The increase in operating revenues was primarily due to:
the partial year impact of revised tolls which became effective on September 18, 2011; partially offsetting this increase was a 1.7% overall decline in vehicular activity at the Port Authority’s six vehicular crossings in 2011 when compared to 2010.
September 18, 2011; this increase was furthered by an increase in overall ridership levels of 3.6% in 2011 when compared to 2010.
Project obligations in connection with the expansion of Terminal 4 at JFK.
operating at LGA, JFK and EWR.
establishment of the Cargo Facility Charge, a cargo activity based port infrastructure and security fee, in March 2011; and a $6 million increase for the sale of development rights at Queens West Waterfront Development Facility.

37
Management’s Discussion and Analysis(continued)
major tenants at Aviation and Port Commerce facilities. Partially offsetting these increases was a $33 million decrease under the net leases for WTC Towers 2 and 3, resulting from the full year impact of the 2010 net lease amendments in connection with the implementation of the 2010 World Trade Center Eastside Development Plan.
2010 vs. 2009Gross operating revenues totaled $3.6 billion for the year ended December 31, 2010, an $82 million increase from 2009. The increase in operating revenues was primarily due to:
LGA, JFK and EWR.
and Port Commerce facilities. The increased rentals were partially offset by lower rental revenues under the net leases for WTC Towers 2 and 3 as a result of amendments in connection with the implementation of the 2010 World Trade Center Eastside Development Plan; and a decrease in revenues associated with the Ramada Hotel at JFK which closed in December 2009.
and water.
and Elizabeth – Port Authority Marine Terminal; and an increase in vehicular parking activity at LGA, JFK and EWR, partially offset by a decrease in gate and tipping fees at the Essex County Resource Recovery Facility due to lower rates.
0.2% overall decline in vehicular activity at Port Authority tunnel and bridge crossings in 2010.
ExpensesA summary of operating expenses follows:
2011 2010 2009
(In thousands)
Operating expenses: Employee compensation, including benefits $1,037,681 $1,022,195 $2,974,154
Contract services 726,883 630,438 683,418
Rents and amounts in-lieu-of taxes 280,237 272,002 276,830
Materials, equipment and other 219,183 418,639 263,682
Utilities 188,432 183,826 168,249
Interest on Special Project Bonds 112,553 71,457 72,337
Total $2,564,969 $2,598,557 $2,438,670
2011 vs. 2010Operating expenses totaled $2.6 billion in 2011, a $34 million decrease from 2010. The year-to-year decrease was primarily due to the following:
non-recurring capital expenditure write-offs to operating expense accounts. 2010 write-offs included alternative design work performed in conjunction with the redevelopment of the WTC site, the terminated ARC Project, and $28 million associated with the 2010 purchase of a portion of the former Marine Ocean Terminal at Bayonne Peninsula (MOTBY). Partially offsetting these decreases were a $10 million increase in the write-off of bad debt at Port Authority facilities, and a $7 million increase in the actuarially determined incurred but not reported (IBNR) loss provision for PAICE.
million increase in costs for the demolition of Terminal 6 and Hangar 12 at JFK, and a $12 million increase in costs for interim terminal operating agreements at the New York Marine Terminal at Red Hook and New Jersey Marine Terminal at Port Newark.
JFKIAT Project obligations in connection with the expansion of Terminal 4 at JFK.

Management’s Discussion and Analysis(continued)
38
including a $21 million increase in policing costs resulting from the continued heightened security levels at Port Authority facilities; partially offsetting these increases was a $10 million decrease in overall benefit expenses, primarily due to lower other postemployment benefits (OPEB).
2010 vs. 2009Operating expenses totaled $2.6 billion in 2010, a $160 million increase from 2009. The year-to-year increase was primarily due to the following:
million in capital expenditures to operating expense accounts, primarily for design work related to alternative analyses performed in conjunction with the redevelopment of the WTC site and the termination of the ARC Project; a $31 million increase in acquisition costs associated with the purchase of a portion of the former MOTBY. These one-time charges were partially offset by a $70 million decrease in expenses reflecting the termination in 2009 of the Port Authority’s payment of liquidated damages to the Silverstein net lessees for WTC Towers 2 and 3 in connection with the timing of the Port Authority’s turnover of the site for such towers to the net lessees thereof; and a $17 million decrease in the loss provision for IBNR claims associated with PAICE.
associated with a 2010 New York State Retirement System retirement incentive program and OPEB.
outside legal costs associated with the redevelopment of the WTC site, and lower architectural and design consulting costs associated with the Port Authority’s operating major works program.
Depreciation and AmortizationA summary of depreciation and amortization expenses follows:
2011 2010 2009
(In thousands)
Depreciation and amortization: Depreciation of facilities $852,727 $789,011 $712,331
Amortization of costs for regional programs 077,537 76,504 74,617
Total $930,264 $865,515 $786,948
2011 vs. 2010Depreciation and amortization expense totaled $930 million in 2011, an increase of $65 million compared to 2010. The increase primarily reflects the full year impact of transferring $1.8 billion of construction in progress to completed construction in 2010 and the transfer of an additional $2.1 billion in capital expenditures to completed construction in 2011. 2011 transfers of $2.1 billion were comprised of $983 million for the construction of WTC site infrastructure; $386 million of Aviation related investment including $200 million for runway and taxiway improvements; $203 million for capital projects designed to maintain security at Port Authority facilities; and $193 million for 130 new PATH rail cars.
2010 vs. 2009Depreciation and amortization expense totaled $866 million in 2010, an increase of $79 million compared to 2009. The increase primarily reflects the full year impact of transferring $1.3 billion of construction in progress to completed construction in 2009 and the transfer of an additional $1.8 billion in capital expenditures to completed construction in 2010. The 2010 transfer of $1.8 billion included in excess of $590 million in aviation related investment, comprising $265 million for runways and taxiways, including $188 million for the Bay Runway at JFK, $175 million in terminal improvements, and $150 million in infrastructure and other improvements. In addition, transfers to completed construction included $277 million for new PATH rail cars, $109 million for the acquisition of MOTBY, $101 million for land acquisitions and easements attributable to the terminated ARC Project and $178 million for capital projects designed to maintain the safety and security of the agency’s facilities.

39
Management’s Discussion and Analysis(continued)
Non-operating Revenues and Expenses
2011 2010 2009
(In thousands)
Non-operating revenues and (expenses): Interest income $(154,398 $(961,168 $(067,820
Net (decrease) increase in fair value of investments (101,296) (56,733) 78,741
Interest expense in connection with
bonds and other asset financing (559,110) (501,607) (501,892)
Net gain on disposition of assets – – 27,125
Pass-through grant program payments (11,507) (2,166) (1,120)
4 WTC associated payments 8,343 – –
Net non-operating expenses $(609,172) $(499,338) $(329,326)
2011 vs. 2010Financial income, including interest income and changes to the fair value of investments decreased by $51 million in 2011 compared with 2010, primarily due to a $45 million decrease in the fair value of investments, including a $41 million year-to-year decrease in market valuation adjustments associated with three unhedged swaps, and a $7 million decrease in earnings on investment securities due to a lower interest rate environment. Financial expense in connection with bonds and other financing obligations of $559 million increased by $58 million in 2011 from 2010, primarily reflecting higher average principal balances of outstanding debt obligations in 2011 compared to 2010, including $8 million of accrued interest expense associated with Tower 4 Liberty Bonds issued in November 2011 for the continued construction of WTC Tower 4. Partially offsetting these amounts was an $8 million increase in “4 WTC associated payments” reflecting the reimbursement from the WTC Tower 4 net lessee for accrued interest expense associated with Tower 4 Liberty Bonds.
2010 vs. 2009Financial income, including interest income and changes to the fair value of investments, decreased by $142 million in 2010 compared with 2009 due to lower market valuation adjustments for three unhedged swaps and lower earnings on investment securities due to a lower interest rate environment. Overall interest expense remained relatively flat year-to-year.
Contributions, Passenger Facility Charges and Grants
2011 2010 2009
(In thousands)
Contributions in aid of construction $1.767,010 $358,268 $382,978
Passenger Facility Charges 214,456 210,387 201,737
1 WTC LLC/WTC Retail LLC insurance proceeds – 42,814 50,813
Grants 23,727 11,708 10,613
Total $1,005,193 $623,177 $646,141
2011 vs. 2010PFCs, grants, 1 World Trade Center LLC (1 WTC LLC)/WTC Retail LLC restricted insurance proceeds and other contributions in aid of construction totaled $1 billion in 2011, representing a $382 million increase from 2010. The total year-to-year increase was primarily due to contributed capital amounts of $275 million from Silverstein net lessees for the construction of WTC Towers 2, 3 and 4, and a $100 million capital contribution by Durst for a minority equity interest in Tower 1 Joint Venture LLC. These increases were partially offset by a decrease of $43 million in insurance proceeds received in connection with the November 2006 global settlement of 1 WTC LLC and WTC Retail LLC allocated amounts of September 11, 2001 property damage and business interruption claims.
2010 vs. 2009PFCs, grants, 1 WTC LLC/WTC Retail LLC restricted insurance proceeds and other contributions totaled $623 million in 2010, representing a $23 million decrease from 2009. The year-to-year decrease is primarily due to lower amounts received in connection with capital projects eligible for federal funding from the Federal Transit Administration (FTA) and insurance proceeds received in connection with the November 2006 global settlement of the WTC net lessees September 11, 2001 property damage and business interruption claims. The decrease was partially offset by an increase in PFC collections reflecting higher passenger activity at LGA and JFK.

Management’s Discussion and Analysis(continued)
40
Capital Construction Activities
Port Authority expenditures for capital construction projects, including contributed capital amounts, totaled $3.4 billion in 2011, $3.0 billion in 2010 and
$2.7 billion in 2009. The following chart depicts net capital expenditures for the last three years summarized by line of business:
Funding sources for the $3.4 billion of Port Authority capital investment in 2011 were as follows: $2.1 billion was funded with proceeds received from
the issuance of capital debt obligations, $199 million was funded with PFCs, $123 million was funded with FTA contributions in aid of construction for
the WTC Transportation Hub, $37 million was funded with other contributions in aid of construction, $12 million was funded with 1 WTC LLC insurance
proceeds, $272 million was funded with Port Authority Consolidated Bond Reserve Fund, $100 million was funded with Tower 1 Joint Venture LLC
capital contributions, $489 million was funded from WTC Towers 2, 3 and 4 net lessee capital contributions, and the balance of approximately $97
million was funded through other sources.
Additional capital investment information on Port Authority facilities can be found in Note B – Facilities, Net to the consolidated financial statements
and in Schedule F – Information on Port Authority Capital Program Components located in the Statistical and Other Supplemental Information section
of this report.
Net Capital Expenditures(In millions)
0
3,000
2,500
2,000
1,500
1,000
500
–500
TUNNELS,BRIDGES &TERMINALS
PATH AVIATION PORTCOMMERCE
DEVELOPMENT WTC SITE REGIONALPROGRAMS
& OTHER
ARCPROJECT
2009
2010
2011
084
169 150 175
339 315 327
519
244
658
303229
174
–21 49 31 11
2,470
1,529
1,317
3 30 26

41
Management’s Discussion and Analysis(continued)
2012 Planned Capital Expenditures
The Preliminary 2012 Budget includes capital spending of approximately $3.7 billion, as depicted in the following chart:
Major elements of 2012 planned capital expenditures include:
Vehicular Security Center and Tour Bus Parking Facility, and WTC retail redevelopment
Port Jersey – Port Authority Marine Terminal
Allocation of 2012 Planned Capital Expenditures
8% PORT COMMERCE
12% AVIATION
TUNNELS, BRIDGES & TERMINALS 16%
REGIONAL PROGRAMS & OTHER 3%
9% PATHDEVELOPMENT 1%
WTC SITE 51%
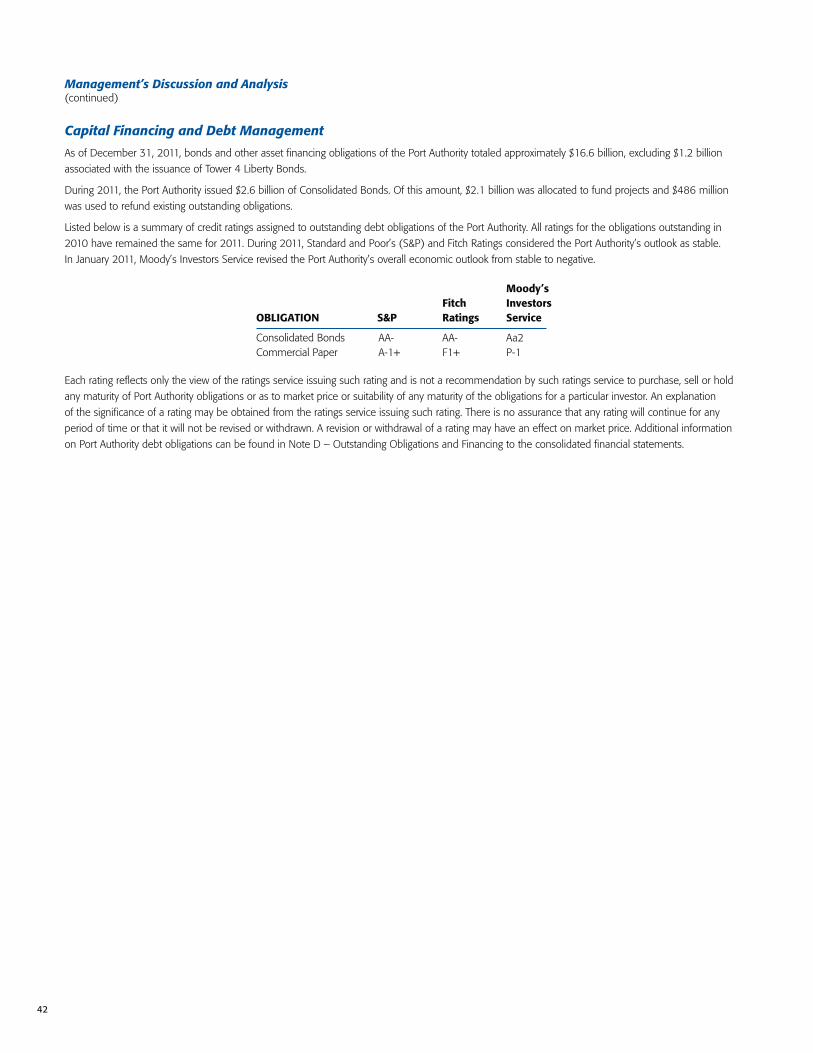
Management’s Discussion and Analysis(continued)
42
Capital Financing and Debt Management
As of December 31, 2011, bonds and other asset financing obligations of the Port Authority totaled approximately $16.6 billion, excluding $1.2 billion
associated with the issuance of Tower 4 Liberty Bonds.
During 2011, the Port Authority issued $2.6 billion of Consolidated Bonds. Of this amount, $2.1 billion was allocated to fund projects and $486 million
was used to refund existing outstanding obligations.
Listed below is a summary of credit ratings assigned to outstanding debt obligations of the Port Authority. All ratings for the obligations outstanding in
2010 have remained the same for 2011. During 2011, Standard and Poor’s (S&P) and Fitch Ratings considered the Port Authority’s outlook as stable.
In January 2011, Moody’s Investors Service revised the Port Authority’s overall economic outlook from stable to negative.
Moody’s Fitch Investors OBLIGATION S&P Ratings Service
Consolidated Bonds AA- AA- Aa2 Commercial Paper A-1+ F1+ P-1
Each rating reflects only the view of the ratings service issuing such rating and is not a recommendation by such ratings service to purchase, sell or hold
any maturity of Port Authority obligations or as to market price or suitability of any maturity of the obligations for a particular investor. An explanation
of the significance of a rating may be obtained from the ratings service issuing such rating. There is no assurance that any rating will continue for any
period of time or that it will not be revised or withdrawn. A revision or withdrawal of a rating may have an effect on market price. Additional information
on Port Authority debt obligations can be found in Note D – Outstanding Obligations and Financing to the consolidated financial statements.
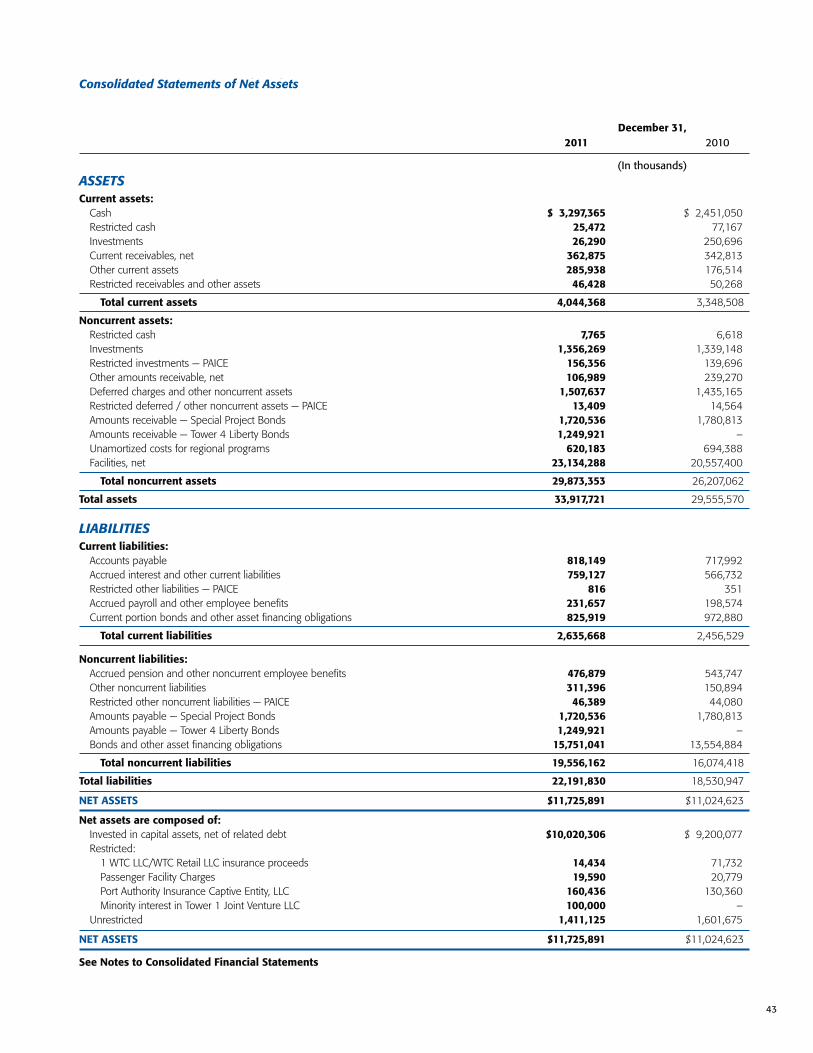
43
Management’s Discussion and Analysis(continued)
December 31, 2011 2010
(In thousands)
ASSETS Current assets: Cash $03,297,365 $02,451,050 Restricted cash 25,472 77,167 Investments 26,290 250,696 Current receivables, net 362,875 342,813 Other current assets 285,938 176,514 Restricted receivables and other assets 46,428 50,268
Total current assets 4,044,368 3,348,508
Noncurrent assets: Restricted cash 7,765 6,618 Investments 1,356,269 1,339,148 Restricted investments — PAICE 156,356 139,696 Other amounts receivable, net 106,989 239,270 Deferred charges and other noncurrent assets 1,507,637 1,435,165 Restricted deferred / other noncurrent assets — PAICE 13,409 14,564 Amounts receivable — Special Project Bonds 1,720,536 1,780,813 Amounts receivable — Tower 4 Liberty Bonds 1,249,921 – Unamortized costs for regional programs 620,183 694,388 Facilities, net 23,134,288 20,557,400
Total noncurrent assets 29,873,353 26,207,062
Total assets 33,917,721 29,555,570
LIABILITIES Current liabilities: Accounts payable 818,149 717,992 Accrued interest and other current liabilities 759,127 566,732 Restricted other liabilities — PAICE 816 351 Accrued payroll and other employee benefits 231,657 198,574 Current portion bonds and other asset financing obligations 825,919 972,880
Total current liabilities 2,635,668 2,456,529
Noncurrent liabilities: Accrued pension and other noncurrent employee benefits 476,879 543,747 Other noncurrent liabilities 311,396 150,894 Restricted other noncurrent liabilities — PAICE 46,389 44,080 Amounts payable — Special Project Bonds 1,720,536 1,780,813 Amounts payable — Tower 4 Liberty Bonds 1,249,921 – Bonds and other asset financing obligations 15,751,041 13,554,884
Total noncurrent liabilities 19,556,162 16,074,418
Total liabilities 22,191,830 18,530,947
NET ASSETS $11,725,891 $11,024,623
Net assets are composed of: Invested in capital assets, net of related debt $10,020,306 $09,200,077 Restricted: 1 WTC LLC/WTC Retail LLC insurance proceeds 14,434 71,732 Passenger Facility Charges 19,590 20,779 Port Authority Insurance Captive Entity, LLC 160,436 130,360 Minority interest in Tower 1 Joint Venture LLC 100,000 – Unrestricted 1,411,125 1,601,675
NET ASSETS $11,725,891 $11,024,623
See Notes to Consolidated Financial Statements
Consolidated Statements of Net Assets
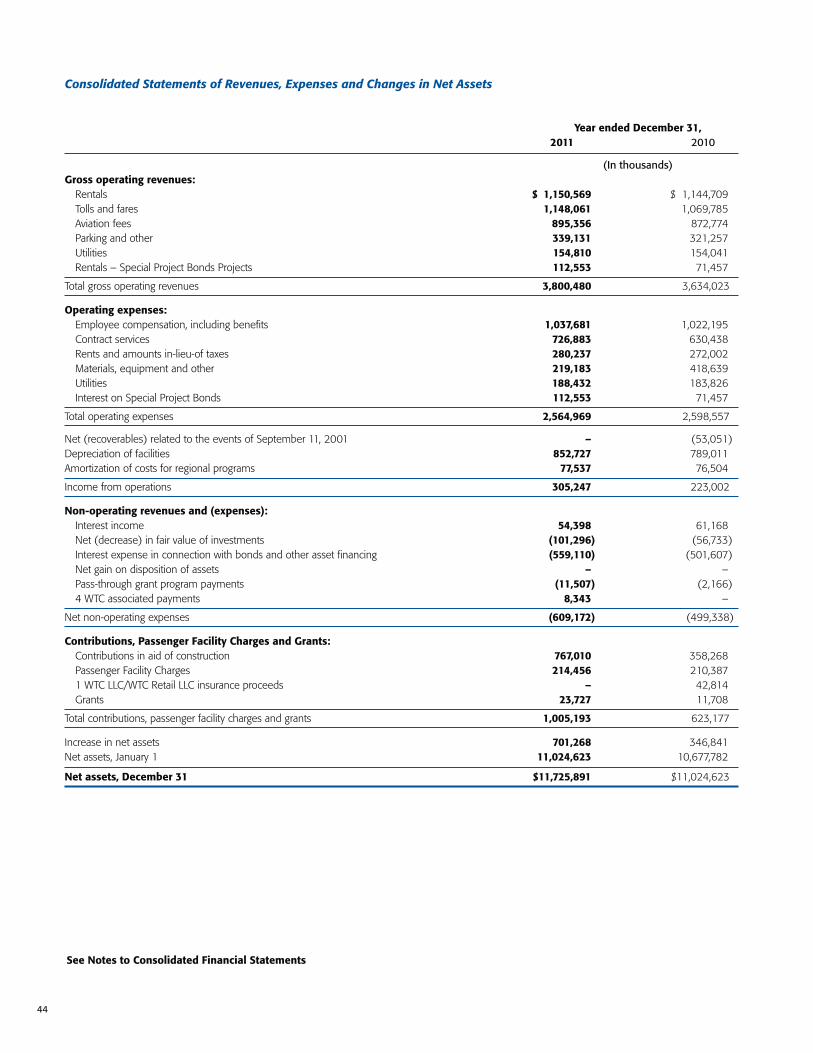
44
See Notes to Consolidated Financial Statements
Year ended December 31, 2011 2010
(In thousands)Gross operating revenues: Rentals $01,150,569 $01,144,709 Tolls and fares 1,148,061 1,069,785 Aviation fees 895,356 872,774 Parking and other 339,131 321,257 Utilities 154,810 154,041 Rentals – Special Project Bonds Projects 112,553 71,457
Total gross operating revenues 3,800,480 3,634,023
Operating expenses: Employee compensation, including benefits 1,037,681 1,022,195 Contract services 726,883 630,438 Rents and amounts in-lieu-of taxes 280,237 272,002 Materials, equipment and other 219,183 418,639 Utilities 188,432 183,826 Interest on Special Project Bonds 112,553 71,457
Total operating expenses 2,564,969 2,598,557
Net (recoverables) related to the events of September 11, 2001 – (53,051)Depreciation of facilities 852,727 789,011 Amortization of costs for regional programs 77,537 76,504
Income from operations 305,247 223,002
Non-operating revenues and (expenses): Interest income 54,398 61,168 Net (decrease) in fair value of investments (101,296) (56,733) Interest expense in connection with bonds and other asset financing (559,110) (501,607) Net gain on disposition of assets – – Pass-through grant program payments (11,507) (2,166) 4 WTC associated payments 8,343 –
Net non-operating expenses (609,172) (499,338)
Contributions, Passenger Facility Charges and Grants: Contributions in aid of construction 767,010 358,268 Passenger Facility Charges 214,456 210,387 1 WTC LLC/WTC Retail LLC insurance proceeds – 42,814 Grants 23,727 11,708
Total contributions, passenger facility charges and grants 1,005,193 623,177
Increase in net assets 701,268 346,841 Net assets, January 1 11,024,623 10,677,782
Net assets, December 31 $11,725,891 $11,024,623
Consolidated Statements of Revenues, Expenses and Changes in Net Assets

45
Management’s Discussion and Analysis(continued)
See Notes to Consolidated Financial Statements
Year ended December 31, 2011 2010
(In thousands)1. Cash flows from operating activities: Cash received from operations $(3,788,114 $(3,677,899 Cash received related to the events of September 11, 2001 – 55,675 Cash paid to suppliers (1,067,026) (984,824) Cash paid to or on behalf of employees (1,097,311) (1,009,290) Cash paid to municipalities (271,706) (273,781) Cash payments related to the events of September 11, 2001 – (3,607)
Net cash provided by operating activities 1,352,071 1,462,072
Cash flows from noncapital financing activities: Proceeds from insurance related to the 1 WTC LLC/WTC Retail LLC – 42,814 Principal paid on noncapital financing obligations (30,485) (11,840) Payments for Fund buy-out obligation (43,211) (43,211) Interest paid on noncapital financing obligations (217) (360) Grants 20,742 11,251
Net cash used for noncapital financing activities (53,171) (1,346)
Cash flows from capital and related financing activities: Proceeds from sales of capital obligations 2,337,635 1,219,309 Contribution for Tower 1 Joint Venture LLC minority equity interest 100,000 – Principal paid on capital obligations (216,748) (208,157) Proceeds from capital obligations issued for refunding purposes 1,132,865 2,985,015 Principal paid through capital obligations refundings (1,132,865) (2,985,015) Interest paid on capital obligations (697,184) (628,705) Investment in facilities and construction of capital assets (2,858,190) (2,712,821) Payments for MOTBY obligation (35,000) (40,000) Financial income allocated to capital projects 2,212 3,117 Investment in regional programs (3,332) (29,626) Proceeds from Passenger Facility Charges 215,645 206,751 Contributions in aid of construction 420,671 356,592
Net cash used for capital and related financing activities (734,291) (1,833,540)
Cash flows from investing activities: Purchase of investment securities (748,818) (1,570,286) Proceeds from maturity and sale of investment securities 930,332 2,423,539 Interest received on investment securities 40,420 48,803 Other interest income 9,224 9,038
Net cash provided by investing activities 231,158 911,094
Net increase in cash 795,767 538,280 Cash at beginning of year 2,534,835 1,996,555
Cash at end of year $(3,330,602 $(2,534,835
Consolidated Statements of Cash Flows
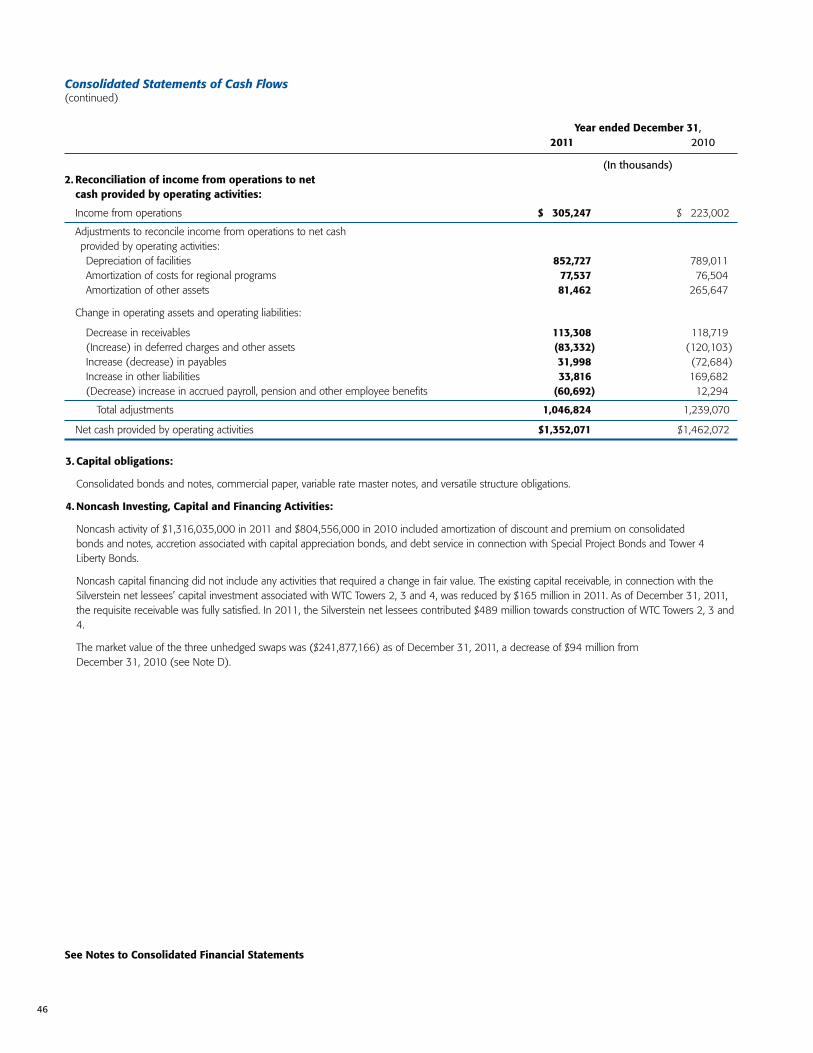
46
3. Capital obligations:
Consolidated bonds and notes, commercial paper, variable rate master notes, and versatile structure obligations.
4. Noncash Investing, Capital and Financing Activities:
Noncash activity of $1,316,035,000 in 2011 and $804,556,000 in 2010 included amortization of discount and premium on consolidated bonds and notes, accretion associated with capital appreciation bonds, and debt service in connection with Special Project Bonds and Tower 4 Liberty Bonds.
Noncash capital financing did not include any activities that required a change in fair value. The existing capital receivable, in connection with the Silverstein net lessees’ capital investment associated with WTC Towers 2, 3 and 4, was reduced by $165 million in 2011. As of December 31, 2011, the requisite receivable was fully satisfied. In 2011, the Silverstein net lessees contributed $489 million towards construction of WTC Towers 2, 3 and 4.
The market value of the three unhedged swaps was ($241,877,166) as of December 31, 2011, a decrease of $94 million from December 31, 2010 (see Note D).
Year ended December 31, 2011 2010
(In thousands)2. Reconciliation of income from operations to net
cash provided by operating activities:
Income from operations $1,305,247 $1,223,002
Adjustments to reconcile income from operations to net cash provided by operating activities: Depreciation of facilities 852,727 789,011 Amortization of costs for regional programs 77,537 76,504 Amortization of other assets 81,462 265,647
Change in operating assets and operating liabilities:
Decrease in receivables 113,308 118,719 (Increase) in deferred charges and other assets (83,332) (120,103) Increase (decrease) in payables 31,998 (72,684) Increase in other liabilities 33,816 169,682 (Decrease) increase in accrued payroll, pension and other employee benefits (60,692) 12,294
Total adjustments 1,046,824 1,239,070
Net cash provided by operating activities $1,352,071 $1,462,072
See Notes to Consolidated Financial Statements
Consolidated Statements of Cash Flows(continued)

47
Management’s Discussion and Analysis(continued)
Note A – Nature of the Organization and Summary of Significant Accounting Policies
1. Reporting Entity
a. The Port Authority of New York and New Jersey was created in 1921 by Compact between the States of New York and New Jersey with the consent of the United States Congress. The Compact envisions the Port Authority as being financially self-sustaining. As such, the agency must raise the funds necessary for the improvement, construction or acquisition of its facilities and their operation generally upon the basis of its own credit. Cash derived from Port Authority operations and other cash received may be disbursed only for specific purposes in accordance with provisions of various statutes and agreements with holders of its obligations and others. The costs of providing facilities and services to the general public on a continuing basis are recovered primarily from operating revenue sources, including rentals, tolls, fares, aviation and port fees, and other charges.
b. The Governor of each State, with the consent of the respective State Senate, appoints six of the twelve members of the governing Board of Commissioners. The Commissioners serve without remuneration for six-year overlapping terms. Meetings of the Commissioners of the Port Authority are open to the public in accordance with policies adopted by the Commissioners. The actions taken by the Commissioners at Port Authority meetings are subject to gubernatorial review and may be vetoed by the Governor of their respective State.
c. The Audit Committee, which consists of four members of the Board of Commissioners other than the Chairman and Vice Chairman of the Port Authority, provides oversight of the quality and integrity of the Port Authority’s framework of internal controls, compliance systems and the accounting, auditing and financial reporting processes. The Audit Committee retains independent auditors and reviews their performance and independence. The independent auditors are required to provide written disclosure of, and discuss with the Committee, any significant relationships or issues that would have a bearing on their independence. The Audit Committee meets directly, on a regular basis, with the independent auditors, a law firm retained to address certain Audit Committee matters, and management of the Port Authority. For the year ending December 31, 2011, Deloitte & Touche LLP are serving as independent auditors. On December 8, 2011, the Audit Committee selected KPMG LLP as independent auditors to perform the audit for the year ending December 31, 2012.
d. The consolidated financial statements and schedules include the accounts of The Port Authority of New York and New Jersey and the related entities: Port Authority Trans-Hudson Corporation (PATH), the Newark Legal and Communications Center Urban Renewal Corporation, Port Authority Insurance Captive Entity, LLC (PAICE), WTC Retail LLC, Tower 5 LLC (formerly “1 WTC LLC”), Tower 1 Member LLC, Tower 1 Joint Venture LLC, Tower 1 Holdings LLC, WTC Tower 1 LLC, and New York New Jersey Rail LLC (all collectively referred to as the Port Authority).
2. Basis of Accounting
a. The Port Authority’s activities are accounted for using the flow of economic resources measurement focus and the accrual basis of accounting. All assets, liabilities, net assets, revenues and expenses are accounted for in an enterprise fund with revenues recorded when earned and expenses recorded at the time liabilities are incurred.
b. In 2011, the Port Authority adopted Government Accounting Standards Board (GASB) Statement No. 62, Codification of Accounting and Financial Reporting Guidance Contained in Pre-November 30, 1989 FASB and AICPA Pronouncements, which requires the Port Authority to follow the pronouncements of the GASB in its accounting and financial reporting. GASB Statement No. 62 supersedes previous guidance contained in GASB Statement No. 20, Accounting and Financial Reporting for Proprietary Funds and Other Governmental Activities That Use Proprietary Funds Accounting. The objective of GASB Statement No. 62 was not to change existing accounting guidance, rather it was to incorporate into GASB authoritative literature certain applicable accounting and financial reporting guidance issued on or before November 30, 1989 by the Financial Accounting Standards Board (FASB) or American Institute of Certified Public Accountants (AICPA), which does not conflict with or contradict GASB pronouncements.
3. Significant Accounting Policies
a. Facilities are carried at cost. The costs for facilities include net interest expense incurred from the date of issuance of the debt to finance construction until the capital project is completed and ready for its intended use. Generally, projects in excess of $100,000 for additions, asset replacements and/or asset improvements that benefit future accounting periods or are expected to prolong the service lives of assets beyond their originally assigned lives are capitalized (see Note B). Facilities do not include regional programs undertaken at the request of the Governor of the State of New Jersey or the Governor of the State of New York (see Note H).
b. Depreciation of facilities is computed using the straight-line method during the estimated useful lives of the related assets (see Note B). The useful lives of assets are developed by the various related disciplines in the Port Authority’s Engineering Department utilizing past experience, standard industrial expectations, and external sources such as consultants, manufacturers and contractors. Useful lives are reviewed periodically for each specific type of asset class. Asset lives used in the calculation of depreciation are generally as follows:
Buildings, bridges, tunnels and other structures 25 to 100 years Machinery and equipment 5 to 35 years Runways, roadways and other paving 7 to 20 years Utility infrastructure 20 to 40 years
Notes to Consolidated Financial Statements

48
Notes to Consolidated Financial Statements(continued)
Assets located at facilities leased by the Port Authority from others are depreciated over the lesser of, the remaining term of the facility lease or the asset life stated above.
Costs of regional programs are deferred and amortized on a straight-line basis over the period benefited up to a maximum of 15 years (see Note H). In addition, certain operating costs, which provide benefits for periods exceeding one year, are deferred as a component of deferred charges and amortized over the period benefited.
c. Cash consists of cash on hand and short term cash equivalents. Cash equivalents are made up of negotiable order of withdrawal (NOW) accounts, United States Treasury bills, collateralized time deposits, and money market accounts.
d. Restricted cash is primarily comprised of insurance proceeds of WTC Retail LLC, which are restricted to business interruption and redevelopment expenditures of the entity, PFCs and operating cash restricted for use by PAICE.
e. Statutory reserves held by PAICE are restricted for purposes of insuring certain risk exposures.
f. Inventories are valued using an average cost method which prices items on the basis of the average cost of all similar goods remaining in stock. Inventory is reported as a component of “Deferred charges and other noncurrent assets” on the Consolidated Statements of Net Assets.
g. Operating revenues are derived principally from rentals, tolls, fares, aviation and port fees, and other charges for the use of, and privileges at Port Authority facilities, and amounts reimbursed for operating activities. Operating expenses include those costs incurred for the operation, maintenance and security of Port Authority facilities. All other revenues, including financial income, PFCs, contributions in aid of construction, grants, insurance proceeds and gains resulting from the disposition of assets, if any, are reported as non-operating revenues, and all other expenses, such as interest expense, losses resulting from the disposition of assets, and pass-through grant program payment costs are reported as non-operating expenses.
h. Amounts attributable to the collection and investment of PFCs are restricted and can only be used for Federal Aviation Administration (FAA) approved airport-related projects. Revenue derived from the collection of PFCs, net of the air carriers’ handling charges, is recognized and accrued as non-operating revenue when the passenger activity occurs and the fees are due from the air carriers. PFC revenue applied to eligible capital projects is reflected as a component of “Facilities, net.”
i. All Port Authority investment values that are affected by interest rate changes have been reported at their fair value, using published market prices. The Port Authority uses a variety of financial instruments to assist in the management of its financing and investment objectives, and may also employ hedging strategies to minimize interest rate risk and enters into various derivative instruments, including options on United States Treasury securities, repurchase and reverse repurchase (yield maintenance) agreements, United States Treasury and municipal bond futures contracts (see Note C) and swaps (see Note D).
j. When issuing new debt for refunding purposes, the difference between the acquisition price of the new debt and the net carrying amount of the refunded debt is deferred and amortized using the straight-line method as a component of interest expense over the remaining life of the old debt or the life of the new debt, whichever is shorter.
k. The preparation of the consolidated financial statements in conformity with accounting principles generally accepted in the United States of America requires management, where necessary, to make estimates and assumptions that affect the amounts reported in the consolidated financial statements and accompanying notes. Such estimates and assumptions are subject to various uncertainties, the occurrence of which may cause differences between those estimates and assumptions and actual results.
l. In June 2011, GASB issued Statement No. 63, Financial Reporting of Deferred Outflows of Resources, Deferred Inflows of Resources, and Net Position. GASB Statement No. 63 is effective for financial statements for periods beginning after December 15, 2011. The Port Authority has not completed the process of evaluating the impact that will result from adopting GASB Statement No. 63, and therefore, is unable to disclose the impact that adopting this statement will have on its financial position and results of operations.
4. Reconciliation of the Consolidated Financial Statements Prepared in Accordance with Accounting Principles Generally Accepted in the United States of America to Schedules Prepared Pursuant to Port Authority Bond Resolutions
Schedules A, B and C, which follow the Required Supplementary Information section of this report, have been prepared in accordance with Port Authority bond resolutions which differ in some respects from accounting principles that are generally accepted in the United States of America, as follows:
a. The revenues and expenses of facilities are accounted for in the operating fund. The financial resources expended for the construction or acquisition of major facilities or improvements are accounted for in the capital fund. Transactions involving the application of net revenues are accounted for in the reserve funds.
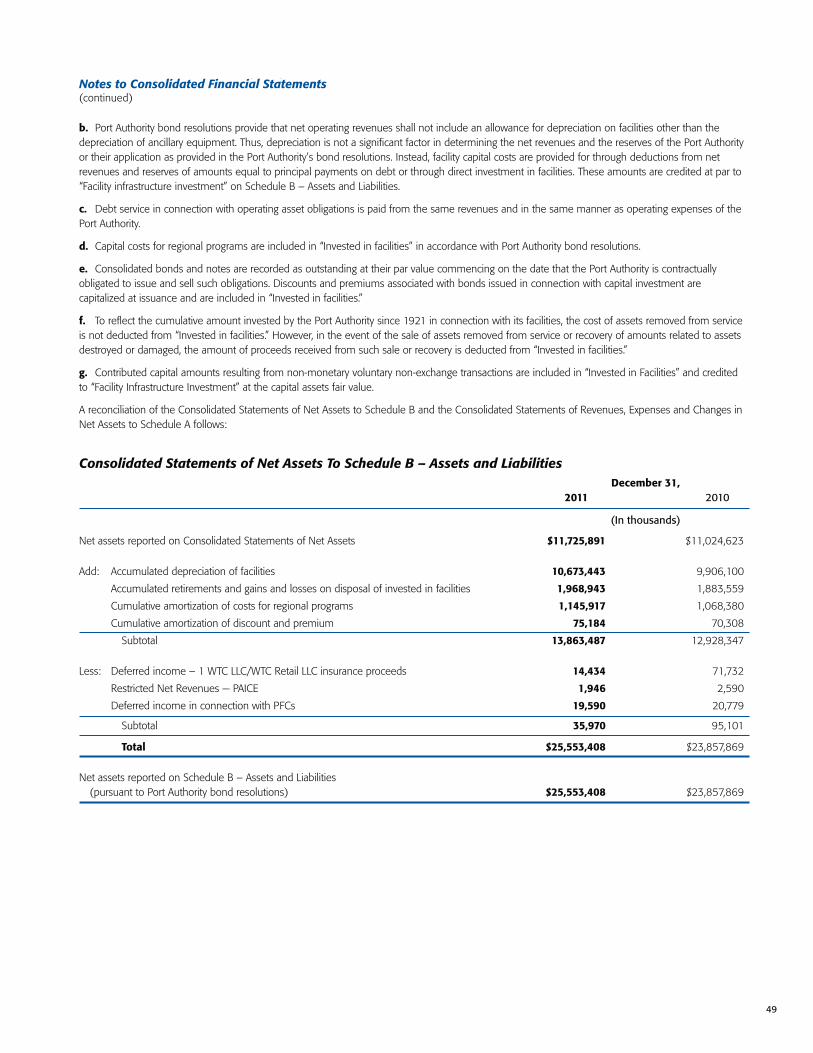
49
Management’s Discussion and Analysis(continued)
b. Port Authority bond resolutions provide that net operating revenues shall not include an allowance for depreciation on facilities other than the depreciation of ancillary equipment. Thus, depreciation is not a significant factor in determining the net revenues and the reserves of the Port Authority or their application as provided in the Port Authority’s bond resolutions. Instead, facility capital costs are provided for through deductions from net revenues and reserves of amounts equal to principal payments on debt or through direct investment in facilities. These amounts are credited at par to “Facility infrastructure investment” on Schedule B – Assets and Liabilities.
c. Debt service in connection with operating asset obligations is paid from the same revenues and in the same manner as operating expenses of the Port Authority.
d. Capital costs for regional programs are included in “Invested in facilities” in accordance with Port Authority bond resolutions.
e. Consolidated bonds and notes are recorded as outstanding at their par value commencing on the date that the Port Authority is contractually obligated to issue and sell such obligations. Discounts and premiums associated with bonds issued in connection with capital investment are capitalized at issuance and are included in “Invested in facilities.”
f. To reflect the cumulative amount invested by the Port Authority since 1921 in connection with its facilities, the cost of assets removed from service is not deducted from “Invested in facilities.” However, in the event of the sale of assets removed from service or recovery of amounts related to assets destroyed or damaged, the amount of proceeds received from such sale or recovery is deducted from “Invested in facilities.”
g. Contributed capital amounts resulting from non-monetary voluntary non-exchange transactions are included in “Invested in Facilities” and credited to “Facility Infrastructure Investment” at the capital assets fair value.
A reconciliation of the Consolidated Statements of Net Assets to Schedule B and the Consolidated Statements of Revenues, Expenses and Changes in Net Assets to Schedule A follows:
Consolidated Statements of Net Assets To Schedule B – Assets and Liabilities December 31, 2011 2010
(In thousands)
Net assets reported on Consolidated Statements of Net Assets $11,725,891 $11,024,623
Add: Accumulated depreciation of facilities 10,673,443 9,906,100
Accumulated retirements and gains and losses on disposal of invested in facilities 1,968,943 1,883,559
Cumulative amortization of costs for regional programs 1,145,917 1,068,380
Cumulative amortization of discount and premium 75,184 70,308
Subtotal 13,863,487 12,928,347
Less: Deferred income – 1 WTC LLC/WTC Retail LLC insurance proceeds 14,434 71,732
Restricted Net Revenues — PAICE 1,946 2,590
Deferred income in connection with PFCs 19,590 20,779
Subtotal 35,970 00,095,101
Total $25,553,408 $23,857,869
Net assets reported on Schedule B – Assets and Liabilities (pursuant to Port Authority bond resolutions) $25,553,408 $23,857,869
Notes to Consolidated Financial Statements(continued)

50
Consolidated Statements of Revenues, Expenses and Changes in Net Assets to Schedule A – Revenues and Reserves
Year ended December 31, 2011 2010
(In thousands)Increase in net assets reported on Consolidated Statements of Revenues, Expenses and Changes in Net Assets $0,701,268 $1,,346,841
Add: Depreciation of facilities 852,727 789,011 Application of 1 WTC LLC/WTC Retail LLC insurance proceeds 57,340 61,468 Application of PFCs 215,645 207,122 Amortization of costs for regional programs 77,537 76,504 Amortization of discount and premium 4,876 5,647 Restricted Net Revenues – PAICE 644 – Decrease in appropriations for self-insurance 1,949 –
Subtotal 1,210,718 1,139,752
Less: Debt maturities and retirements 140,390 178,095 Debt retirement acceleration 6,100 – Repayment of asset financing obligations 20,258 30,062 Non-monetary capital contributions 279,714 – Direct investment in facilities 742,001 1,375,008 PFCs 214,456 210,387 1 WTC LLC/WTC Retail LLC insurance proceeds – 42,814 1 WTC LLC/WTC Retail LLC interest income 43 136 Restricted Net Revenues – PAICE – 102 PFC Interest Income/Fair Value Adjustment – 2 Increase in appropriations for self-insurance – 3,971
Subtotal 1,402,962 1,840,577
Total $0,509,024 $ (353,984)
Increase/(decrease) in reserves reported on Schedule A – Revenues and Reserves (pursuant to Port Authority bond resolutions) $0,509,024 $ (353,984)
Notes to Consolidated Financial Statements(continued)
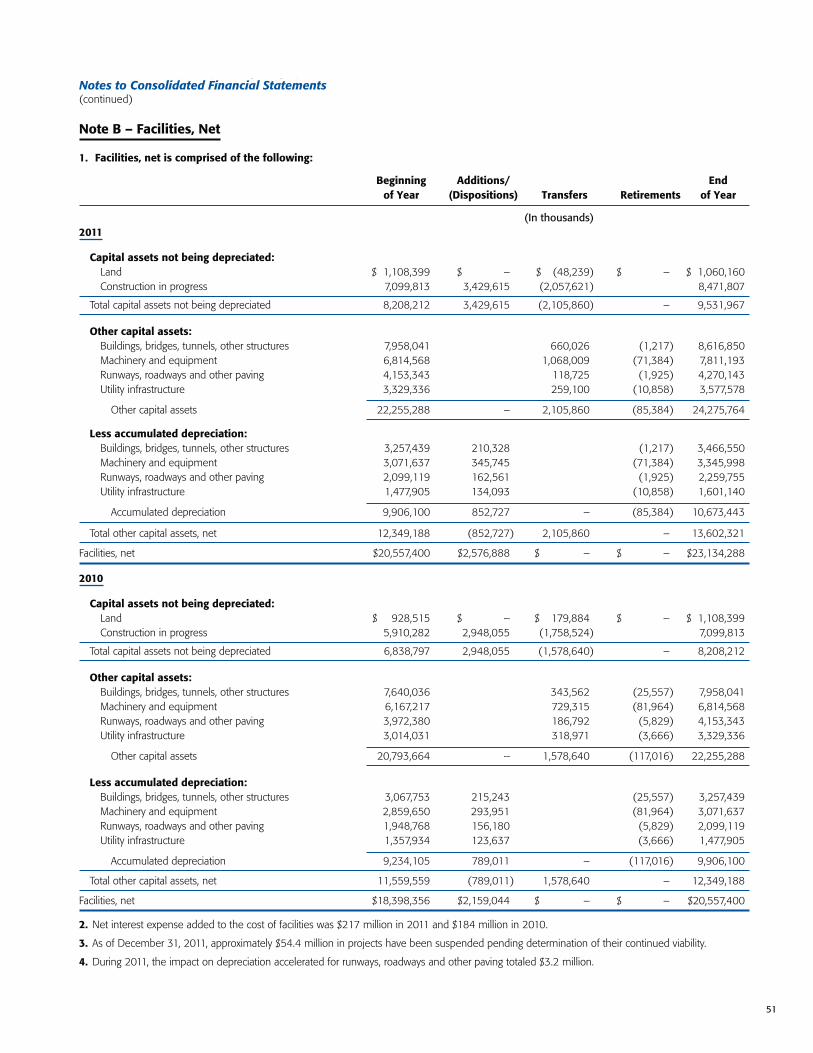
51
Management’s Discussion and Analysis(continued)
Note B – Facilities, Net
1. Facilities, net is comprised of the following:
Beginning Additions/ End of Year (Dispositions) Transfers Retirements of Year
(In thousands)2011
Capital assets not being depreciated: Land $01,108,399 $ – $0,,(48,239) $ – $01,060,160 Construction in progress 7,099,813 3,429,615 (2,057,621) 8,471,807
Total capital assets not being depreciated 8,208,212 3,429,615 (2,105,860) – 9,531,967
Other capital assets: Buildings, bridges, tunnels, other structures 7,958,041 660,026 (1,217) 8,616,850 Machinery and equipment 6,814,568 1,068,009 (71,384) 7,811,193 Runways, roadways and other paving 4,153,343 118,725 (1,925) 4,270,143 Utility infrastructure 3,329,336 259,100 (10,858) 3,577,578
Other capital assets 22,255,288 – 2,105,860 (85,384) 24,275,764
Less accumulated depreciation: Buildings, bridges, tunnels, other structures 3,257,439 210,328 (1,217) 3,466,550 Machinery and equipment 3,071,637 345,745 (71,384) 3,345,998 Runways, roadways and other paving 2,099,119 162,561 (1,925) 2,259,755 Utility infrastructure 1,477,905 134,093 (10,858) 1,601,140
Accumulated depreciation 9,906,100 852,727 – (85,384) 10,673,443
Total other capital assets, net 12,349,188 (852,727) 2,105,860 – 13,602,321
Facilities, net $20,557,400 $2,576,888 $ – $ – $23,134,288
2010
Capital assets not being depreciated: Land $ 928,515 $ – $0,,179,884 $ – $01,108,399 Construction in progress 5,910,282 2,948,055 (1,758,524) 7,099,813
Total capital assets not being depreciated 6,838,797 2,948,055 (1,578,640) – 8,208,212
Other capital assets: Buildings, bridges, tunnels, other structures 7,640,036 343,562 (25,557) 7,958,041 Machinery and equipment 6,167,217 729,315 (81,964) 6,814,568 Runways, roadways and other paving 3,972,380 186,792 (5,829) 4,153,343 Utility infrastructure 3,014,031 318,971 (3,666) 3,329,336
Other capital assets 20,793,664 – 1,578,640 (117,016) 22,255,288
Less accumulated depreciation: Buildings, bridges, tunnels, other structures 3,067,753 215,243 (25,557) 3,257,439 Machinery and equipment 2,859,650 293,951 (81,964) 3,071,637 Runways, roadways and other paving 1,948,768 156,180 (5,829) 2,099,119 Utility infrastructure 1,357,934 123,637 (3,666) 1,477,905
Accumulated depreciation 9,234,105 789,011 – (117,016) 9,906,100
Total other capital assets, net 11,559,559 (789,011) 1,578,640 – 12,349,188
Facilities, net $18,398,356 $2,159,044 $ – $ – $20,557,400
2. Net interest expense added to the cost of facilities was $217 million in 2011 and $184 million in 2010.
3. As of December 31, 2011, approximately $54.4 million in projects have been suspended pending determination of their continued viability.
4. During 2011, the impact on depreciation accelerated for runways, roadways and other paving totaled $3.2 million.
Notes to Consolidated Financial Statements(continued)
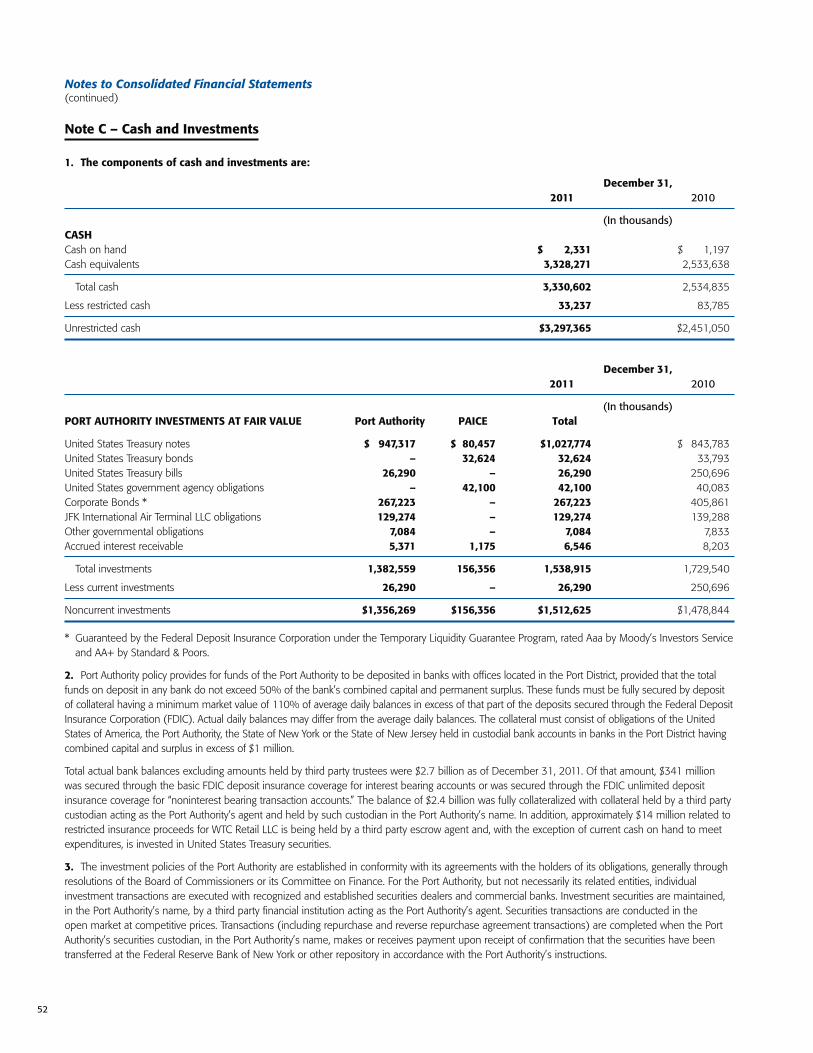
52
Notes to Consolidated Financial Statements(continued)
Note C – Cash and Investments
1. The components of cash and investments are:
December 31, 2011 2010
(In thousands) CASHCash on hand $1,472,331 $ 1,197 Cash equivalents 3,328,271 2,533,638
Total cash 3,330,602 2,534,835
Less restricted cash 33,237 83,785
Unrestricted cash $3,297,365 $2,451,050
December 31, 2011 2010
(In thousands)PORT AUTHORITY INVESTMENTS AT FAIR VALUE Port Authority PAICE Total
United States Treasury notes $0,947,317 $080,457 $1,027,774 $0,843,783 United States Treasury bonds – 32,624 32,624 33,793 United States Treasury bills 26,290 – 26,290 250,696 United States government agency obligations – 42,100 42,100 40,083 Corporate Bonds * 267,223 – 267,223 405,861 JFK International Air Terminal LLC obligations 129,274 – 129,274 139,288 Other governmental obligations 7,084 – 7,084 7,833 Accrued interest receivable 5,371 1,175 6,546 8,203
Total investments 1,382,559 156,356 1,538,915 1,729,540
Less current investments 26,290 – 26,290 250,696
Noncurrent investments $1,356,269 $156,356 $1,512,625 $1,478,844
* Guaranteed by the Federal Deposit Insurance Corporation under the Temporary Liquidity Guarantee Program, rated Aaa by Moody’s Investors Service and AA+ by Standard & Poors.
2. Port Authority policy provides for funds of the Port Authority to be deposited in banks with offices located in the Port District, provided that the total funds on deposit in any bank do not exceed 50% of the bank’s combined capital and permanent surplus. These funds must be fully secured by deposit of collateral having a minimum market value of 110% of average daily balances in excess of that part of the deposits secured through the Federal Deposit Insurance Corporation (FDIC). Actual daily balances may differ from the average daily balances. The collateral must consist of obligations of the United States of America, the Port Authority, the State of New York or the State of New Jersey held in custodial bank accounts in banks in the Port District having combined capital and surplus in excess of $1 million.
Total actual bank balances excluding amounts held by third party trustees were $2.7 billion as of December 31, 2011. Of that amount, $341 million was secured through the basic FDIC deposit insurance coverage for interest bearing accounts or was secured through the FDIC unlimited deposit insurance coverage for “noninterest bearing transaction accounts.” The balance of $2.4 billion was fully collateralized with collateral held by a third party custodian acting as the Port Authority’s agent and held by such custodian in the Port Authority’s name. In addition, approximately $14 million related to restricted insurance proceeds for WTC Retail LLC is being held by a third party escrow agent and, with the exception of current cash on hand to meet expenditures, is invested in United States Treasury securities.
3. The investment policies of the Port Authority are established in conformity with its agreements with the holders of its obligations, generally through resolutions of the Board of Commissioners or its Committee on Finance. For the Port Authority, but not necessarily its related entities, individual investment transactions are executed with recognized and established securities dealers and commercial banks. Investment securities are maintained, in the Port Authority’s name, by a third party financial institution acting as the Port Authority’s agent. Securities transactions are conducted in the open market at competitive prices. Transactions (including repurchase and reverse repurchase agreement transactions) are completed when the Port Authority’s securities custodian, in the Port Authority’s name, makes or receives payment upon receipt of confirmation that the securities have been transferred at the Federal Reserve Bank of New York or other repository in accordance with the Port Authority’s instructions.

53
Management’s Discussion and Analysis(continued)Notes to Consolidated Financial Statements(continued)
Proceeds of “Bonds and other asset financing obligations” may be invested, on an interim basis, in conformance with applicable Federal laws and regulations, in obligations of (or fully guaranteed by) the United States of America (including such securities held pursuant to repurchase agreements) and collateralized time deposit accounts. Consolidated Bond Reserve Fund and General Reserve Fund amounts may be invested in obligations of (or fully guaranteed by) the United States of America. Additionally, amounts in the Consolidated Bond Reserve Fund and the General Reserve Fund (subject to certain limitations) may be invested in obligations of the State of New York or the State of New Jersey, collateralized time accounts, and Port Authority bonds actually issued and secured by a pledge of the General Reserve Fund. Operating funds may be invested in various items including (a) direct obligations of the United States of America, obligations of United States government agencies, and sponsored enterprises that have the highest short-term ratings by two nationally recognized firms; (b) investment grade negotiable certificates of deposit and negotiable Bankers’ Acceptances with banks having AA or better long-term debt rating, premier status and with issues actively traded in secondary markets; (c) commercial paper having only the highest short-term ratings separately issued by two nationally recognized rating agencies; (d) United States Treasury and municipal bond futures contracts; (e) certain interest rate exchange contracts with banks and investment firms; (f) certain interest rate options contracts that are limited to $50 million of underlying securities with a maturity of no greater than five years with primary dealers in United States Treasury securities; and (g) certain unrated obligations of JFKIAT LLC (presently comprising approximately 9.4% of total Port Authority investments at December 31, 2011) for certain costs attributable to the completion of Terminal 4 (JFKIAT). The Board has from time to time authorized other investments of operating funds.
It is the general policy of the Port Authority to limit exposure to declines in fair market values by limiting the weighted average maturity of the investment portfolio to less than two years. Extending the weighted average maturity beyond two years requires explicit written approval of the Chief Financial Officer. Committee on Finance authorization is required to extend the weighted average maturity beyond five years.
The following is the fair value and weighted average maturity of investments held by the Port Authority, excluding PAICE, at December 31, 2011:
Fair Value Weighted Average PA Investment Type (In thousands) Maturity (In days)
United States Treasury notes $ 947,317 677United States Treasury bills 26,290 71Corporate Bonds 267,223 169JFK International Air Terminal LLC obligations 129,274 4,980Other governmental obligations 7,084 959
Total fair value of investments* $1,377,188
Investments weighted average maturity 972
* Excludes accrued interest receivable amounts of $5.4 million.
The Port Authority has, from time to time, entered into reverse repurchase (yield maintenance) agreements under which the Port Authority contracted to sell a specified United States Treasury security to a counterparty and simultaneously agreed to purchase it back from that party at a predetermined price and future date. All reverse repurchase agreements sold are matched to repurchase agreements bought, thereby minimizing market risk. The credit risk is managed by a daily evaluation of the market value of the underlying securities and periodic cash adjustments, as necessary, in accordance with the terms of the repurchase agreements. There were no investments in reverse repurchase agreements at December 31, 2011.
4. The investment policies of PAICE have been established and approved by the PAICE Board of Directors, which is comprised of Port Authority executive staff. Consistent with the Port Authority Board of Commissioners’ authorization with respect to the establishment of PAICE as a wholly owned entity of the Port Authority, PAICE provides the Port Authority Board of Commissioners’ Committee on Finance with periodic updates on PAICE’s investment activities.
Under PAICE’s investment policies, eligible investments include money market demand accounts of commercial banks, not to exceed bank deposit insurance limits, and/or taxable or tax-exempt money market mutual funds that offer daily purchase and redemption while maintaining a constant share price and whose fund assets are primarily United States Treasury notes and bonds and whose assets are more than $1 billion. Other investments include: United States Treasury securities and United States government agency obligations, AAA rated tax-exempt general obligation issues of states, and U.S. dollar denominated corporate debt rated AA or above.

54
The following is the fair value and weighted average maturity of investments held by PAICE at December 31, 2011:
Fair Value Weighted Average PAICE Investment Type (In thousands) Maturity (In days)
United States Treasury notes $080,457 632United States Treasury bonds 32,624 182United States government agency obligations 42,100 330
Total fair value of investments* $155,181
Investments weighted average maturity 456
* Excludes accrued interest receivable amounts of $1.2 million.
Note D – Outstanding Obligations and Financing
Obligations noted with (*) throughout Note D-1 and D-2 are subject to the alternative minimum tax imposed under the Internal Revenue Code of 1986, as amended, with respect to individuals and corporations. Obligations noted with (**) are subject to federal taxation.
D-1. Outstanding bonds and other asset financing obligations
December 31, 2011 Current Noncurrent Total
(In thousands)
A. Consolidated Bonds and Notes $205,410 $15,364,335 $15,569,745B. Commercial Paper Notes 396,155 – 396,155 C. Variable Rate Master Notes 77,900 – 77,900 D. Versatile Structure Obligations – – –E. Port Authority Equipment Notes 68,160 – 68,160 F. Fund Buy-Out Obligation 51,213 308,646 359,859G. MOTBY Obligation 27,081 78,060 105,141H. Tower 4 Liberty Bonds – 1,249,921 1,249,921
$825,919 $17,000,962 $17,826,881
December 31, 2010 Current Noncurrent Total
(In thousands)
A. Consolidated Bonds and Notes $190,390 $13,119,246 $13,309,636B. Commercial Paper Notes 354,280 – 354,280 C. Variable Rate Master Notes 77,900 – 77,900 D. Versatile Structure Obligations 175,200 – 175,200E. Port Authority Equipment Notes 98,645 – 98,645 F. Fund Buy-Out Obligation 43,211 330,496 373,707G. MOTBY Obligation 33,254 105,142 138,396
$972,880 $13,554,884 $14,527,764
Notes to Consolidated Financial Statements(continued)

55
Management’s Discussion and Analysis(continued)
A. Consolidated Bonds and Notes Dec. 31, Issued/ Refunded/ Dec. 31, 2010 Accreted Retired 2011
(In thousands)Consolidated bonds and notesSixty-ninth series Due 2011 $ 3,881 $ 119 $ 4,000 $000,00 – Seventy-fourth series (a) Due 2012-2014 15,507 497 4,155 11,849 Eighty-fifth series 5.2%-5.375% due 2012-2028 90,000 – 3,000 87,000 Eighty-sixth series 5.2% due 2012 8,005 – 4,150 3,855 Ninety-third series 6.125% due 2094 100,000 – – 100,000 One hundred third series 5.25% due 2012-2014 26,135 – 6,240 19,895 One hundred thirteenth series 4.75% due 2012-2013 15,750 – 5,250 10,500 One hundred sixteenth series 4.25%-5.25% due 2012-2033 402,645 – 10,495 392,150 One hundred seventeenth series* 4.75%-5.125% due 2012-2018 50,110 – 50,110 – One hundred twenty-second series* 5%-5.5% due 2012-2036 165,030 – 165,030 – One hundred twenty-fourth series* 4.75%-5% due 2012-2036 214,145 – 11,685 202,460 One hundred twenty-fifth series 5% due 2018-2032 300,000 – – 300,000 One hundred twenty-sixth series* 5%-5.5% due 2012-2037 211,480 – 13,065 198,415 One hundred twenty-seventh series* 5%-5.5% due 2012-2037 230,470 – 10,165 220,305 One hundred twenty-eighth series 4.75%-5% due 2012-2032 236,210 – 3,935 232,275 One hundred twenty-ninth series 3.5%-4% due 2012-2015 35,790 – 6,075 29,715 One hundred thirtieth series 3.5%-3.75% due 2012-2015 38,230 – 7,145 31,085 One hundred thirty-first series* 4.625%-5% due 2012-2033 441,100 – 9,205 431,895 One hundred thirty-second series 5% due 2024-2038 300,000 – – 300,000 One hundred thirty-third series 3.25%-4.4% due 2012-2021 167,680 – 15,500 152,180 One hundred thirty-fourth series 4%-5% due 2012-2039 244,500 – 2,970 241,530 One hundred thirty-fifth series 4.5%-5% due 2024-2039 400,000 – – 400,000 One hundred thirty-sixth series* 5%-5.5% due 2012-2034 342,290 – 2,570 339,720 One hundred thirty-seventh series* 4%-5.5% due 2012-2034 230,585 – 3,935 226,650 One hundred thirty-eighth series* 4.25%-5% due 2012-2034 334,750 – 7,310 327,440 One hundred thirty-ninth series* 4%-5% due 2012-2025 161,105 – 8,570 152,535 One hundred fortieth series 4.125%-5% due 2016-2035 400,000 – – 400,000 One hundred forty-first series* 4.5%-5% due 2016-2035 350,000 – – 350,000 One hundred forty-second series 4%-5% due 2015-2036 350,000 – – 350,000 One hundred forty-third series* 5% due 2016-2036 500,000 – – 500,000 One hundred forty-fourth series 4.25%-5% due 2026-2035 300,000 – – 300,000 One hundred forty-fifth series** 5.75% due 2027-2032 250,000 – – 250,000 One hundred forty-sixth series* 4.25%-5% due 2016-2036 500,000 – – 500,000 One hundred forty-seventh series* 4.75%-5% due 2017-2037 450,000 – – 450,000 One hundred forty-eighth series 5% due 2015-2037 500,000 – – 500,000 One hundred forty-ninth series 4%-5% due 2017-2037 400,000 – – 400,000 One hundred fiftieth series** 4.125%-6.4% due 2013-2027 350,000 – – 350,000 One hundred fifty-first series* 5.25%-6% due 2019-2035 350,000 – – 350,000 One hundred fifty-second series* 4.75%-5.75% due 2018-2038 400,000 – – 400,000 One hundred fifty-third series 4%-5% due 2018-2038 500,000 – – 500,000 One hundred fifty-fourth series 3%-5% due 2012-2029 96,190 – 3,855 92,335 One hundred fifty-fifth series 1.75%-3.5% due 2012-2019 73,700 – 12,000 61,700 One hundred fifty-sixth series 4%-5% due 2025-2039 100,000 – – 100,000 One hundred fifty-seventh series** 5.309% due 2019 150,000 – – 150,000 One hundred fifty-eighth series** 5.859% due 2024 250,000 – – 250,000 One hundred fifty-ninth series** 6.04% due 2029 350,000 – – 350,000 One hundred sixtieth series 4%-5% due 2030-2039 300,000 – – 300,000 One hundred sixty-first series 4.25%-5% due 2030-2039 300,000 – – 300,000 One hundred sixty-second series 1.25%-3.3% due 2012-2020 105,090 – 18,020 87,070 One hundred sixty-third series 2.5%-5% due 2017-2040 400,000 – – 400,000 One hundred sixty-fourth series** 5.647% due 2040 425,000 – – 425,000 One hundred sixty-fifth series** 5.647% due 2040 425,000 – – 425,000 One hundred sixty-sixth series 5%-5.25% due 2030-2041 – 300,000 – 300,000 One hundred sixty-seventh series* 3%-5.50% due 2012-2028 – 225,000 – 225,000 One hundred sixty-eighth series** 4.926% due 2051 – 1,000,000 – 1,000,000 One hundred sixty-ninth series* 3%-5% due 2012-2041 – 400,000 – 400,000 One hundred seventieth series (b) 5%-5.25% due 2041 & 2043 – 672,480 – 672,480
Consolidated bonds and notes pursuant to Port Authority bond resolutions 13,340,378 $2,598,096 $388,435 15,550,039
Less unamortized discount and (premium) (c) 30,742 (19,706)Consolidated bonds and notes (d) $13,309,636 $15,569,745
NOTE: See page 56 for explanations of footnotes (a-d) concerning Consolidated Bonds and Notes.
Notes to Consolidated Financial Statements(continued)
Note D – Outstanding Obligations and Financing (continued)

56
A. Consolidated Bonds and Notes (continued from previous page)
(a) Includes $2,908,000 serial bonds issued on a capital appreciation basis; the only payments with respect to these bonds will be made at their respective maturities, ranging from years 2012 to 2014, in the total maturity amount of $12,465,000.
(b) The entire series was acquired by the New York Liberty Development Corporation in connection with its issuance of the New York Liberty Development Corporation Liberty Revenue Bonds, Series 1WTC-2011 (Secured by Port Authority Consolidated Bonds).
(c) Amount includes the unamortized difference between acquisition price and carrying amount on refunded debt.
(d) Debt service requirements to maturity for Consolidated Bonds outstanding on December 31, 2011 are as follows:
Year ending Debt December 31: Principal Interest Service
(In thousands)2012 $13,205,410 $13,773,856 $0,0979,2662013 227,090 765,524 992,6142014 248,530 755,834 1,004,3642015 262,945 744,102 1,007,0472016 290,355 731,688 1,022,0432017-2021 1,976,940 3,400,922 5,377,8622022-2026 2,560,490 2,845,875 5,406,3652027-2031 3,384,600 2,116,799 5,501,3992032-2036 3,192,595 1,235,073 4,427,6682037-2041 1,729,220 592,068 2,321,2882042-2046 372,480 305,455 677,9352047-2051 1,000,000 166,090 1,166,090 2052-2094*** 100,000 234,996 334,996
$15,550,655 $14,668,282 $30,218,937
*** Debt service for the years 2052-2094 reflects principal and interest payments associated with Consolidated Bonds Ninety-third Series.
Total principal of $15,550,655,000 shown above differs from the total consolidated bonds pursuant to Port Authority bond resolutions of $15,550,039,000 because of differences in the par value at maturity of the capital appreciation bonds Seventy-fourth Series of $616,000.
As of December 31, 2011, the Board of Commissioners had authorized the issuance of Consolidated Bonds, One Hundred Sixty-second Series through One Hundred Seventy-sixth Series, in the aggregate principal amount of up to $500 million of each series, and Consolidated Notes, Series ZZ, AAA, BBB, CCC and DDD, of up to $300 million in aggregate principal amount of each series. To the extent any of Consolidated Bonds, One Hundred Sixty-eighth Series through Consolidated Bonds, One Hundred Seventy-sixth Series are issued and sold solely for purposes of capital expenditures in connection with One World Trade Center, the retail components of the WTC site and other WTC site-wide infrastructure, such series may be issued and sold without limit as to principal amounts and term to maturity, provided that the total aggregate principal amount of all of such series (regardless of the purpose for issuance) shall not be in excess of $4.5 billion.
During 2011, the Port Authority used the proceeds of consolidated bonds to refund $198 million of consolidated bonds, $169.1 million of versatile structure obligations and $118.4 million of commercial paper notes. The economic gain resulting from the debt refunding (the difference between the present value of the cash flows required to service the old debt and the present value of the cash flows required to service the new debt) totaled approximately $25.8 million in present value savings to the Port Authority.
Consolidated bonds outstanding as of February 24, 2012 (pursuant to Port Authority bond resolutions) totaled $15,950,039,000.
Notes to Consolidated Financial Statements(continued)
Note D – Outstanding Obligations and Financing (continued)

57
Management’s Discussion and Analysis(continued)
B. Commercial Paper Notes
Commercial paper obligations are issued to provide interim financing for authorized projects at Port Authority facilities and may be outstanding until December 31, 2015. The maximum aggregate principal amount that may be outstanding at any one time is $300 million for Series A and $200 million for Series B. Commercial paper obligations are issued without third party provider support for payment at their maturity dates.
Dec. 31, Refunded/ Dec. 31, 2010 Issued Repaid 2011
(In thousands)Series A* $208,815 $563,740 $564,820 $207,735 Series B 145,465 412,960 370,005 188,420
$354,280 $976,700 $934,825 $396,155
Interest rates for all commercial paper notes ranged from 0.11% to 0.36% in 2011.
As of February 24, 2012, commercial paper notes outstanding totaled $390,135,000.
C. Variable Rate Master Notes
Variable rate master notes may be issued in aggregate principal amounts outstanding at any one time not to exceed $400 million.
Dec. 31, Refunded/ Dec. 31, 2010 Issued Repaid 2011
(In thousands)Agreements 1989 -1995* $44,900 $ – $ – $44,900Agreements 1989 -1998 33,000 – – 33,000
$77,900 $ – $ – $77,900
Interest rates are determined weekly, based upon a spread added to a specific industry index (the Securities Industry and Financial Markets Association rate) as stated in each master note agreement, and ranged from 0.12% to 0.42% in 2011.
Debt service requirements on outstanding variable rate master notes, valued for presentation purposes at the rate in effect on December 31, 2011, would be as follows:
Year ending Debt December 31: Principal Interest Service
(In thousands)2012 $ – $ 131 $ 1312013 – 130 1302014 – 130 1302015 – 130 1302016 – 131 1312017-2021 25,000 628 25,6282022-2025 52,900 140 53,040
$77,900 $1,420 $79,320
Variable rate master notes are subject to prepayment at the option of the Port Authority or upon demand of the holders.
D. Versatile Structure Obligations
Dec. 31, Refunded/ Dec. 31, 2010 Issued Repaid 2011
(In thousands)
Series 1R* $ 92,800 $ – $ 92,800 $ –
Series 4* 82,400 – 82,400 –
$175,200 $ – $175,200 $ –
Notes to Consolidated Financial Statements(continued)
Note D – Outstanding Obligations and Financing (continued)

58
Variable interest rates, set daily by the remarketing agent for Versatile Structure Obligations Series 1R and 4, ranged from 0.14% to 0.50% in 2011. Versatile Structure Obligations Series 1R and 4 were refunded in their entirety on April 29, 2011 through a combination of Consolidated Bond proceeds and net revenues deposited into the Consolidated Bond Reserve Fund.
The Port Authority had entered into a separate standby certificate purchase agreement for Versatile Structure Obligations with certain banks, which terminated on April 29, 2011. Bank commitment fees during 2011 in connection with these agreements were approximately $136,000.
E. Port Authority Equipment Notes
Equipment notes may be issued in aggregate principal amounts outstanding at any one time not to exceed $250 million.
Dec. 31, Refunded/ Dec. 31, 2010 Issued Repaid 2011
(In thousands)Notes 2004, 2006, 2008* $04,380 $ – $01,745 $02,635
Notes 2004, 2006, 2008 94,265 – 28,740 65,525
$98,645 $ – $30,485 $68,160
Variable interest rates, set weekly by a remarketing agent for each series, ranged from 0.13% to 0.48% in 2011.
Annual debt service requirements on outstanding Port Authority equipment notes, valued for presentation purposes at the rate in effect on December 31, 2011, would be as follows: Debt Year ending December 31: Principal Interest Service
(In thousands)
2012 $18,595 $107 $18,7022013 2,640 80 2,7202014 15,425 56 15,4812015 31,500 10 31,510
$68,160 $253 $68,413
The Port Authority has entered into agreements with the purchasers of the notes stating that on seven days notice on any business day during the term of the agreements, the Port Authority may prepay in whole, or, from time to time, in part, without penalty or premium, the outstanding principal amount of the notes. Also, the purchasers can tender the notes back to the remarketing agent on seven days notice, in whole and not in part. In the event that the remarketing agent cannot resell the notes, notice shall be given by the remarketing agent to the Port Authority requesting the Port Authority to pay the purchase price of the notes.
F. Fund Buy-Out Obligation
Dec. 31, Refunded/ Dec. 31, 2010 Accretion (a) Repaid 2011
(In thousands)
Obligation outstanding $373,707 $29,363 $43,211 $359,859
(a) Represents the annual implicit interest cost (8.25%) contained in the present value of amounts due to the States of New York and New Jersey upon the termination, in 1990, of the Fund for Regional Development.
Payment requirements of the fund buy-out obligation outstanding, including the implicit interest cost, on December 31, 2011 are as follows:
Year ending December 31: Payments
(In thousands)2012 $051,2132013 51,2122014 51,2142015 51,2122016 51,2122017-2021 266,452
$522,515
As of February 24, 2012, the fund buy-out obligation outstanding totaled $364,336,543.
Notes to Consolidated Financial Statements(continued)
Note D – Outstanding Obligations and Financing (continued)

59
Management’s Discussion and Analysis(continued)
G. MOTBY Obligation
On August 3, 2010, the Port Authority acquired approximately 131 acres of the former MOTBY from the Bayonne Local Redevelopment Authority (BLRA) for $235 million. The acquired property is comprised of three parcels on the southern side of the peninsula and has been incorporated into the Port Jersey – Port Authority Marine Terminal for future marine terminal purposes. The $235 million total purchase price is payable to the BLRA in twenty-four annual installment payments (2010-2033). Accordingly, the total purchase price of $235 million was discounted to a present value of $178.4 million at an implicit interest rate of 5.25% and recognized as an asset financing obligation in 2010.
Dec. 31, Refunded/ Dec. 31, 2010 Accretion (a) Repaid 2011
(In thousands)
Obligation outstanding $138,396 $1,745 $35,000 $105,141
(a) Represents the annual implicit interest cost (5.25%) contained in the present value of amounts due the BLRA.
Payment requirements for the MOTBY obligation outstanding, including the implicit interest cost, on December 31, 2011 are as follows:
Year ending December 31: Payments
(In thousands)2012 $030,0002013 30,0002014 5,0002015 5,0002016 5,000 2017-2021 25,0002022-2026 25,0002027-2031 25,0002032-2033 10,000
$160,000
H. Tower 4 Liberty Bonds
In connection with the issuance of the Tower 4 Liberty Bonds by the New York Liberty Development Corporation on November 15, 2011, the Port Authority entered into a Tower 4 Bond Payment Agreement with Tower 4 Trustee to make, as a co-borrower/obligor with respect to the New York Liberty Development Corporation, Liberty Revenue Bonds, Series 2011 (4 World Trade Center Project), debt service payments of principal and interest under the bonds as a special obligation of the Port Authority to the trustee during the term of the agreement, from May 11, 2012 through November 15, 2051.
Dec. 31, Repaid/ Dec. 31, 2010 Issued Amortized 2011
(In thousands)
Series 2011 $ – $1,225,520 $ – $1,225,520
Add: unamortized premium – 24,479 78 24,401
Total Tower 4 Liberty Bonds $ – $1,249,999 $ 78 $1,249,921
Notes to Consolidated Financial Statements(continued)
Note D – Outstanding Obligations and Financing (continued)
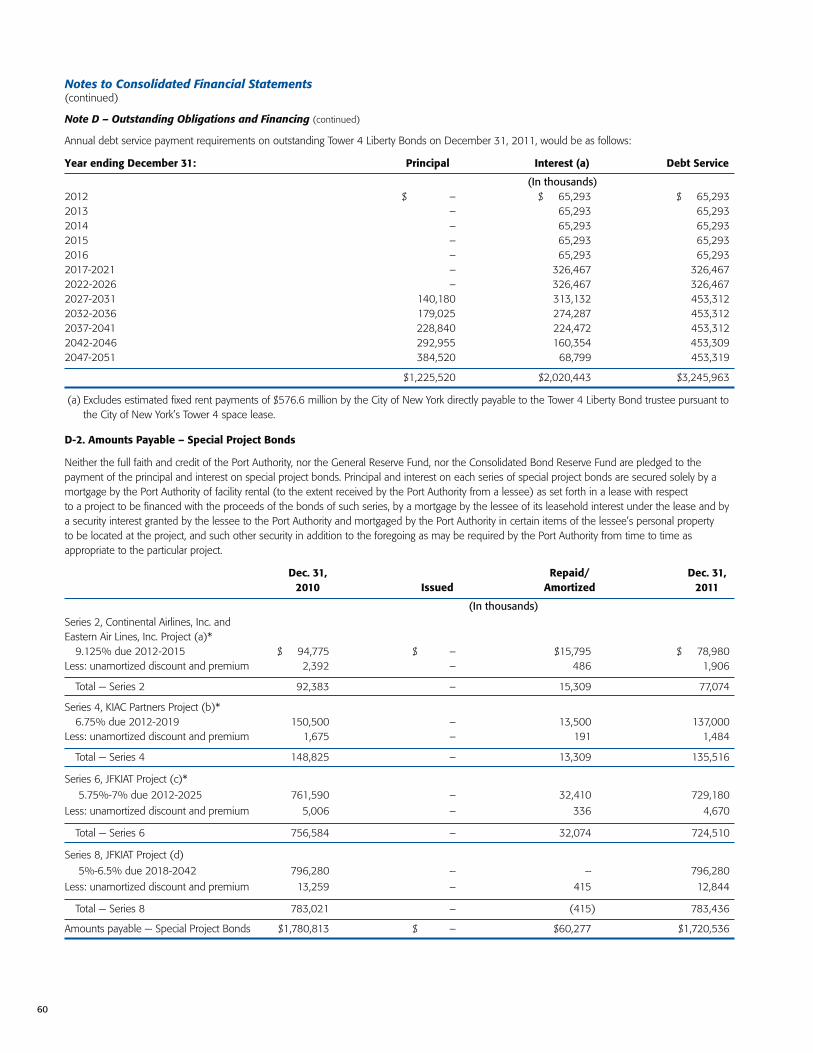
60
Annual debt service payment requirements on outstanding Tower 4 Liberty Bonds on December 31, 2011, would be as follows:
Year ending December 31: Principal Interest (a) Debt Service
(In thousands)2012 $ – $0,065,293 $0,065,2932013 – 65,293 65,2932014 – 65,293 65,2932015 – 65,293 65,2932016 – 65,293 65,2932017-2021 – 326,467 326,4672022-2026 – 326,467 326,4672027-2031 140,180 313,132 453,3122032-2036 179,025 274,287 453,3122037-2041 228,840 224,472 453,3122042-2046 292,955 160,354 453,3092047-2051 384,520 68,799 453,319
$1,225,520 $2,020,443 $3,245,963
(a) Excludes estimated fixed rent payments of $576.6 million by the City of New York directly payable to the Tower 4 Liberty Bond trustee pursuant to the City of New York’s Tower 4 space lease.
D-2. Amounts Payable – Special Project Bonds
Neither the full faith and credit of the Port Authority, nor the General Reserve Fund, nor the Consolidated Bond Reserve Fund are pledged to the payment of the principal and interest on special project bonds. Principal and interest on each series of special project bonds are secured solely by a mortgage by the Port Authority of facility rental (to the extent received by the Port Authority from a lessee) as set forth in a lease with respect to a project to be financed with the proceeds of the bonds of such series, by a mortgage by the lessee of its leasehold interest under the lease and by a security interest granted by the lessee to the Port Authority and mortgaged by the Port Authority in certain items of the lessee’s personal property to be located at the project, and such other security in addition to the foregoing as may be required by the Port Authority from time to time as appropriate to the particular project.
Dec. 31, Repaid/ Dec. 31, 2010 Issued Amortized 2011
(In thousands)Series 2, Continental Airlines, Inc. and Eastern Air Lines, Inc. Project (a)* 9.125% due 2012-2015 $0,094,775 $ – $15,795 $0,078,980Less: unamortized discount and premium 2,392 – 486 1,906
Total — Series 2 92,383 – 15,309 77,074
Series 4, KIAC Partners Project (b)* 6.75% due 2012-2019 150,500 – 13,500 137,000Less: unamortized discount and premium 1,675 – 191 1,484
Total — Series 4 148,825 – 13,309 135,516
Series 6, JFKIAT Project (c)*
5.75%-7% due 2012-2025 761,590 – 32,410 729,180
Less: unamortized discount and premium 5,006 – 336 4,670
Total — Series 6 756,584 – 32,074 724,510
Series 8, JFKIAT Project (d)
5%-6.5% due 2018-2042 796,280 – – 796,280
Less: unamortized discount and premium 13,259 – 415 12,844
Total — Series 8 783,021 – (415) 783,436
Amounts payable — Special Project Bonds $1,780,813 $ – $60,277 $1,720,536
Notes to Consolidated Financial Statements(continued)
Note D – Outstanding Obligations and Financing (continued)

61
Management’s Discussion and Analysis(continued)
(a) Special project bonds, Series 2, Continental Airlines, Inc. and Eastern Air Lines, Inc. Project, were issued in connection with a project that included the construction of a passenger terminal at LGA leased to and to be occupied by Continental and Eastern. The leasehold interest of Eastern was assigned to Continental. Continental’s leasehold interest in such passenger terminal, including the previously acquired leasehold interest of Eastern, was subsequently assigned to USAir, Inc. (with Continental to remain liable under both underlying leases).
(b) Special project bonds, Series 4, KIAC Partners Project, were issued to refund Special project bonds, Series 3, KIAC Partners Project, and in connection with a project at JFK, that included the construction of a cogeneration facility, the renovation and expansion of the central heating and refrigeration plant, and the renovation and expansion of the thermal distribution system.
(c) Special project bonds, Series 6, JFKIAT Project, were issued in connection with a project that included the development and construction of a new passenger terminal at JFK.
(d) Special project bonds, Series 8, JFKIAT Project, were issued in December 2010 in connection with a project that included the expansion of Terminal 4 at JFK.
D-3. Interest Rate Exchange Contracts (Swaps)
The Port Authority records interest rate exchange contract payments pursuant to the settlement method of accounting whereby cash paid or received under the terms of the swap is charged or credited to the related interest expense account for the purpose of managing interest rate exposure. Each swap transaction involves the exchange of fixed and variable rate interest payment obligations with respect to an agreed upon nominal principal amount called a “notional amount.”
Objective
The Port Authority’s financial management program provides for the Port Authority to enter into interest rate swaps for the purpose of managing and controlling interest rate risk in connection with Port Authority obligations designated at the time of entering into interest rate swap transactions. The notional amounts of the swaps are designed to match the principal amount of the associated debt. The Port Authority’s swap agreements contain scheduled reductions to outstanding notional amounts to approximately follow scheduled reductions of the associated debt.
As of December 31, 2011, the Port Authority had three pay-fixed, receive variable rate interest rate swaps. Two of these swaps were entered into in anticipation of the issuance of future variable interest rate versatile structure obligations in July and August 2008, respectively; however, due to unfavorable market conditions, these obligations were not issued, and the swaps remain unhedged. The third remaining swap became unhedged when the corresponding variable rate obligation was refunded in 2008 (Versatile Structure Obligations, Series 8). To mitigate the impacts of unfavorable market conditions, in the second quarter of 2009, the Port Authority amended the three unhedged swap agreements to defer periodic interest rate exchange contract payments until the last quarter of 2010. Periodic interest rate exchange contract payments resumed on these three unhedged swaps in October and November 2010, respectively. Periodic interest rate payments associated with the three unhedged swaps totaled $27.5 million in 2011.
The terms, including the fair values and credit ratings of the outstanding swaps as of December 31, 2011, are as follows: Ratings Original Current Fixed Variable Swap of the Associated Notional Execution Effective Rate Rate Termination Counterparty Debt Amount Date Date Paid Received Fair Value Date (a)
70% of three- BBB+/ Unhedged $224,000,000 6/15/2006 10/1/2010(b) 4.510% month LIBOR(c) $ (78,469,798) 10/1/2035 Baa1/A+
70% of three- Unhedged 187,100,000 6/15/2006 10/1/2010(b) 4.450% month LIBOR(c) (67,829,026) 7/1/2036 AA-/Aa3/A+
70% of one- Unhedged 236,100,000 6/15/2006 11/1/2010(d) 4.408% month LIBOR(c) (95,578,342) 8/1/2038 AA-/Aa1/AA Total $647,200,000 $(241,877,166)
(a) Ratings supplied by Standard & Poor’s/Moody’s Investors Service/Fitch Ratings, respectively
(b) Swap agreement amended April 2, 2009
(c) London Interbank Offered Rate Index
(d) Swap agreement amended May 22, 2009
Notes to Consolidated Financial Statements(continued)
Note D – Outstanding Obligations and Financing (continued)
62
Notes to Consolidated Financial Statements(continued)
Note D – Outstanding Obligations and Financing (continued)
Fair Value
Interest rates have generally declined since the execution date of the swaps. As a result, all three swaps had a negative fair value totaling $242 million as of December 31, 2011. In accordance with GASB Statement No. 53, Accounting and Financial Reporting for Derivatives, changes in the fair value of investment derivative instruments (unhedged) have been recognized as a change to investment income on the Consolidated Statements of Revenues, Expenses and Changes in Net Assets. The fair value of the three outstanding investment derivatives (unhedged) decreased $94 million from December 31, 2010 to December 31, 2011.
Credit Risk
As of December 31, 2011, the Port Authority was not exposed to credit risk on any of its outstanding swaps because the swaps had negative fair values. Should interest rates change and the fair values of the swaps become positive, the Port Authority would be exposed to credit risk in the amount of the swaps’ fair value. However, the Port Authority has limited protection from credit risk of the counterparties since the outstanding swap agreements require collateral to be posted for the swaps under certain conditions. If the outstanding ratings of the Port Authority or the counterparty (or its credit support provider) fall to a certain level, then the party whose rating is affected is required to post collateral with a third party custodian to secure termination payments above threshold amounts. Collateralization of the fair value of the swaps, above certain threshold amounts, is required should the Port Authority’s highest credit rating fall below Baa1, as issued by Moody’s Investors Service, or BBB+, as issued by Standard & Poor’s and Fitch Ratings. Collateralization of the fair value of the swaps, above certain threshold amounts, is required should the counterparty’s, or its credit support provider’s, highest credit rating fall below A1, as issued by Moody’s Investors Service, or A+, as issued by Standard & Poor’s and Fitch Ratings. Collateral on all swaps shall consist of direct obligations of, or obligations the principal and interest of which are guaranteed by, the United States of America (including cash). All of the swap agreements provide that an early termination date may be designated if an event of default occurs. The three swap transactions currently outstanding are held by three different counterparties.
Basis Risk
The Port Authority would be exposed to basis risk if the variable rate received under the swap varied from the variable payments for the associated floating rate debt obligations. Since the swaps are not associated with any debt obligations, the Port Authority is currently not exposed to basis risk.
Termination Risk
The Port Authority or the counterparty may terminate any of the swaps if the other party fails to perform under the terms of the agreement. Additionally, the Port Authority has the option to terminate, cancel or cash settle any of the three swaps, in whole or in part, at its discretion. As part of the 2009 amendments to the unhedged swap agreements previously described, two of the swap counterparties were granted the option to early terminate, cancel or cash settle their respective swaps, in whole or in part, beginning in 2012, at their discretion. However, if at the time of termination the swap has a negative fair value, the Port Authority would be liable to the counterparty for a termination payment.
Rollover Risk
The Port Authority would be exposed to rollover risk if the swaps mature or are terminated prior to the maturity of the associated debt. Currently, there are no swaps exposed to rollover risk since they are not associated with any debt obligations.
Note E – General and Consolidated Bond Reserve Funds
The General Reserve Fund is pledged in support of Consolidated Bonds and Notes. Statutes which require the Port Authority to create and maintain the General Reserve Fund established the principle of pooling revenues from all facilities and require that the Port Authority apply surplus revenues from all of its existing facilities to maintain the General Reserve Fund in an amount at least equal to 10% of the par value of outstanding bonds legal for investment. At December 31, 2011, the General Reserve Fund balance was $1,783,369,487 and met the prescribed statutory amount (see Schedule C – Analysis of Reserve Funds).
The balance remaining of all net revenues of the Port Authority’s existing facilities after deducting payments for debt service upon all Consolidated Bonds and Notes and the amount necessary to maintain the General Reserve Fund at its statutorily required amount is to be paid into the Consolidated Bond Reserve Fund, which is pledged as additional security for all outstanding Consolidated Bonds and Notes. Consolidated Bonds and Notes have a first lien upon the net revenues (as defined in the Consolidated Bond Resolution) of all existing facilities of the Port Authority and any additional facility financed by Consolidated Bonds.
Other asset obligations (commercial paper obligations, variable rate master notes, versatile structure obligations, swaps executed after 2005, MOTBY obligation and Tower 4 Liberty Bonds), and the interest thereon, are not secured by or payable from the General Reserve Fund. Principal of, and interest on, other asset obligations are payable solely from the proceeds of obligations issued for such purposes or from net revenues paid into the Consolidated Bond Reserve Fund and, in the event such proceeds or net revenues are insufficient therefor, from other moneys of the Port Authority legally available for such payments. Operating asset obligations (equipment notes and the fund buy-out obligation) are payable in the same manner and from the same

63
Management’s Discussion and Analysis(continued)Notes to Consolidated Financial Statements(continued)
sources as operating expenses. Special project bonds are not secured by or payable from the General Reserve Fund or the Consolidated Bond Reserve Fund.
The Port Authority has a long-standing policy of maintaining total reserve funds in an amount equal to at least the next two years’ bonded debt service on outstanding debt secured by a pledge of the General Reserve Fund. The moneys in the reserve funds may be accumulated or applied only to purposes set forth in legislation and the agreements with the holders of the Port Authority’s obligations pertaining thereto. At December 31, 2011, the Port Authority met the requirements of the Consolidated Bond Resolution to maintain total reserve funds in cash and certain specified securities.
Note F – Funding Provided by Others
During 2011 and 2010, the Port Authority received federal and state grants and contributions from other entities for various programs as summarized below:
1. Operating programs
a. K-9 Program – The FAA and the Transportation Security Administration (TSA) provided funding for operating costs associated with the training and care of explosive detection dogs. Amounts received in connection with this program were approximately $1,336,000 in 2011 and $1,007,000 in 2010.
b. Airport Screening Program – The TSA provided approximately $459,000 in both 2011 and 2010 to fund operating costs incurred by Port Authority police personnel involved with airport screening programs at JFK and EWR.
c. U.S. Department of State (USDOS) – The Port Authority received $1,310,000 in 2011 and $1,031,000 in 2010 from the USDOS to fund operating security costs incurred by Port Authority police personnel for the United Nations General Assembly.
Amounts in connection with operating activities are recorded as operating revenues on the Consolidated Statements of Revenues, Expenses and Changes in Net Assets and on Schedule A – Revenues and Reserves.
2. Grants and Contributions in Aid of Construction
a. Subsequent to September 11, 2001, the Port Authority entered into various agreements with federal and state agencies for programs associated with security related projects through which the Port Authority would be reimbursed for eligible expenses. Amounts provided in connection with security projects totaled $39 million in 2011 and $38 million in 2010.
b. The Port Authority receives contributions in aid of construction with respect to its facilities from federal, state and other entities. Amounts from the FTA for the WTC Transportation Hub, including the restoration of the permanent WTC PATH Terminal, in 2011 and 2010 were approximately $315 million and $218 million, respectively. Amounts from the FAA under the Airport Improvement Program in 2011 and 2010 were approximately $40 million and $89 million, respectively. Other contributions in aid of construction, including $275 million in contributed capital from the Silverstein net lessees for the construction of WTC Towers 2, 3 and 4 and $100 million in contributed capital from Durst for the construction, management and operation of WTC Tower 1, totaled $386 million in 2011 and $23 million in 2010.
Note G – Lease Commitments
1. Operating lease revenues
Gross operating revenues attributable to fixed rentals associated with operating leases amounted to approximately $1 billion in both 2011 and 2010.
2. Property held for lease
The Port Authority has entered into operating leases with tenants for the use of space at various Port Authority facilities including buildings, terminals, offices and consumer service areas at air terminals, marine terminals, bus terminals, rail facilities, industrial parks, the Teleport, the WTC and the Newark Legal and Communications Center. Investments in such facilities, as of December 31, 2011, include property associated with minimum rentals derived from the leases. It is not reasonably practicable to segregate the value of assets associated with producing minimum rental revenue from the value of assets associated with an entire facility.

64
Future minimum rentals are predicated upon the ability of the lessees to meet their commitments. Future minimum rentals scheduled to be received on operating leases in effect on December 31, 2011 are:
Year ending December 31:
(In thousands)2012 $ 863,6352013 831,8342014 816,3252015 790,5872016 645,628Later years 41,209,060
Total future minimum rentals (a-c) $45,157,069
(a) Includes future rentals of approximately $36 billion attributable to the WTC net leases.
(b) Future minimum rentals decreased in 2011 by approximately $29 billion primarily in connection with the net lease for One World Trade Center, resulting from the Port Authority and Durst entering into various agreements related to the establishment of a joint venture with respect to the construction, financing, leasing, management and operation of One World Trade Center.
(c) Not included in the future minimum rentals is approximately $2.2 billion attributable to lease agreements at One World Trade Center entered into with Vantone Industrial Co., Ltd for 191,000 square feet of office space and Advance Magazine Publishers Inc d/b/a Conde Nast for approximately 1 million square feet of office and related space. Rentals from these leases are contingent upon specific events commencing upon completion of the building.
3. Property leased from others
Rental expenses under leases, including payments to the cities of New York and Newark for various air terminals, marine terminals and other facilities and the cost of replacement office space due to the destruction of the WTC, aggregated $278 million in 2011 and $270 million in 2010.
Future minimum rentals scheduled to be paid on operating leases in effect on December 31, 2011 are detailed below. Additional rentals may be payable based on earnings of specified facilities under some of these leases.
Year ending December 31:
(In thousands)2012 $ 232,4932013 230,7672014 230,0652015 225,8192016 187,2802017-2021 898,5992022-2026 880,1312027-2031 870,0002032-2036 870,0002037-2065* 3,387,000
Total future minimum rent payments $8,012,154
* Future minimum rent payments for the years 2037-2065 reflect payments associated with the City of New York and the City of Newark lease commitments.
Note H – Regional Programs
1. At the request of the Governors of the States of New York and New Jersey, the Port Authority participates in certain programs that are deemed essential to the continued economic viability of the two states and the region. These programs, which are generally non-revenue producing to the Port Authority, are addressed by the Port Authority in its budget and business planning process in the context of the Port Authority’s overall financial capacity. To the extent not otherwise a part of existing Port Authority facilities, these projects are effectuated through additional Port Authority facilities established solely for these purposes. The Port Authority does not expect to derive any revenues from regional development facilities described below.
Regional Development Facility – This facility is a centralized program of certain economic development and infrastructure renewal projects. It was expected that $250 million of capital funds would be made available in connection with the Governors’ Program of June 1983. As of December 31, 2011, approximately $247 million has been expended under this program.
Notes to Consolidated Financial Statements(continued)

65
Management’s Discussion and Analysis(continued)
Regional Economic Development Program – This facility is to be comprised of up to $400 million for certain transportation, economic development and infrastructure renewal projects. Net expenditures on projects authorized under this program totaled approximately $395 million as of December 31, 2011.
Oak Point Rail Freight Link – The Port Authority has participated with the New York State Department of Transportation in the development of the Oak Point Rail Freight Link. As of December 31, 2011, the Port Authority has provided approximately $102 million for this rail project, of which approximately $63 million was made available through the Regional Development Facility and the Regional Economic Development Program.
New Jersey Marine Development Program – This program was undertaken to fund certain fishery, marine or port development projects in the State of New Jersey at a total cost not to exceed $27 million. All funds under this program have been fully allocated and expended.
New York Transportation, Economic Development and Infrastructure Renewal Program – This facility was established to provide up to $250 million for certain transportation, economic development and infrastructure renewal projects in the State of New York. As of December 31, 2011, $245 million has been spent on projects associated with this program.
Regional Transportation Program – This facility was established in conjunction with a program to provide up to $500 million for regional transportation initiatives. As of December 31, 2011, all funds under this program have been fully expended.
Hudson-Raritan Estuary Resources Program – This facility was established to acquire certain real property in the Port District area of the Hudson-Raritan Estuary for environmental enhancement/ancillary economic development purposes, in support of the Port Authority’s capital program. The cost of real property acquired under this program is not to exceed $60 million. As of December 31, 2011, approximately $46 million has been expended under this program.
Regional Rail Freight Program – This facility provides for the Port Authority to participate, in consultation with other governmental entities in the States of New York and New Jersey, in the development of certain regional rail freight projects to provide for increased rail freight capacity. The Port Authority is authorized to provide up to $50 million. As of December 31, 2011, all funds under this program have been fully expended.
Meadowlands Passenger Rail Facility – This facility, which links New Jersey Transit’s (NJT) Pascack Valley Rail Line to the Meadowlands Sports Complex, encourages greater use of PATH service since NJT runs shuttle bus service at peak times to Hoboken. The improved level of passenger rail service provided by the facility also serves to ease traffic congestion on the Port Authority’s interstate tunnel and bridge crossings. The Port Authority is authorized to provide up to $150 million towards the project’s capital costs. As of December 31, 2011, all funds under this program have been fully expended.
As of December 31, 2011, a total of approximately $2.1 billion has been expended for regional programs. Costs for these programs that are not otherwise recognized as part of an existing Port Authority facility, are deferred and amortized over the period benefited, up to a maximum of 15 years. The unamortized costs of the regional programs are as follows:
Dec. 31, Project Dec. 31, 2010 Expenditures Amortization 2011
(In thousands)Regional Development Facility $040,816 $0,00–. $06,423 $034,393 Regional Economic Development Program 122,238 – 19,884 102,354Oak Point Rail Freight Link 9,779 – 1,630 8,149 New Jersey Marine Development Program 5,028 – 834 4,194 New York Transportation, Economic Development and Infrastructure Renewal Program 158,063 – 15,891 142,172 Regional Transportation Program 176,721 – 16,667 160,054 Hudson-Raritan Estuary Resources Program 35,520 3,332 2,875 35,977Regional Rail Freight Program 28,828 – 3,333 25,495Meadowlands Passenger Rail Facility 117,395 – 10,000 107,395
Total unamortized costs of regional programs $694,388 $3,332 $77,537 $620,183
2. Bi-State Initiatives – From time to time, the Port Authority makes payments to assist various bi-state regional operating initiatives. During 2011, the Port Authority expended approximately $16 million on regional initiatives, bringing the total amount spent to date to approximately $140 million.
3. Buy-out of Fund for Regional Development – In 1983, the Fund for Regional Development (Fund) was established to sublease space in the WTC that was previously held by the State of New York as tenant. An agreement among the Port Authority and the States of New York and New Jersey with respect to the Fund provided that net revenues from the subleasing were to be accumulated subject to disbursements to be made upon the concurrence of the Governors of New York and New Jersey. The assets, liabilities, revenues and expenses of the Fund were not consolidated with those of the Port Authority. In 1990, the Port Authority and the States of New York and New Jersey agreed to terminate the Fund. The present value (calculated at the time of the termination agreement) of the cost to the Port Authority of its purchase of the Fund’s interest in the WTC subleased
Notes to Consolidated Financial Statements(continued)
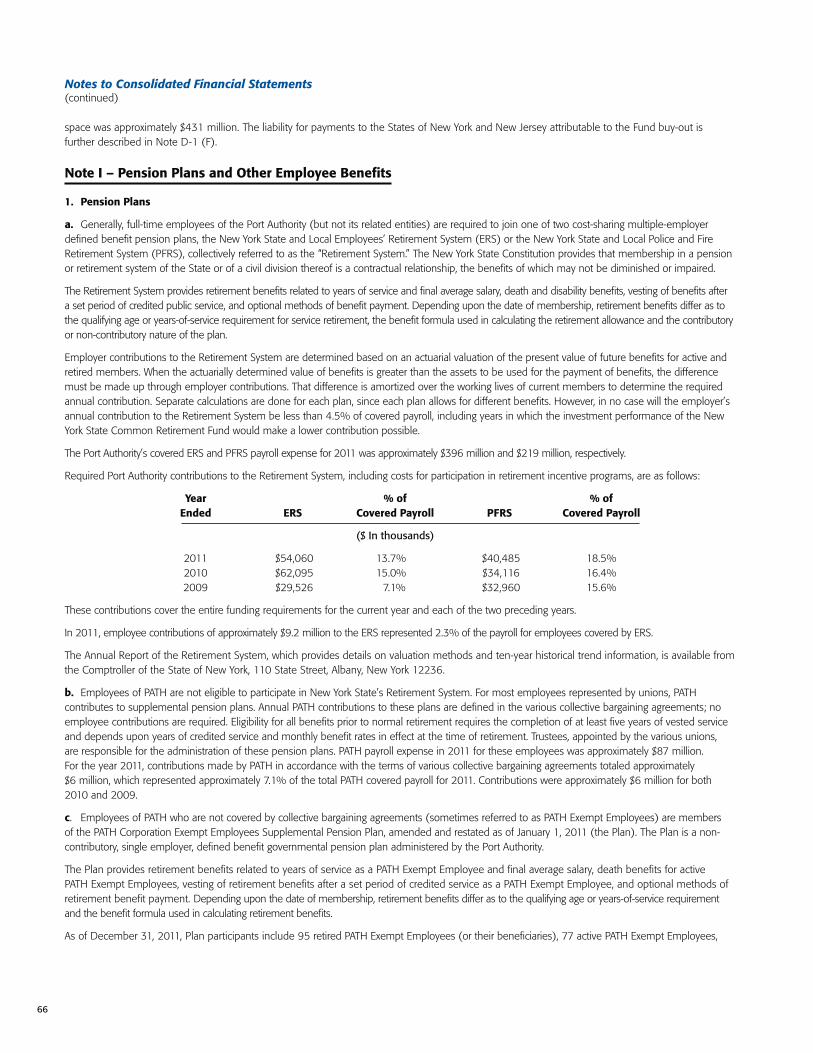
66
Notes to Consolidated Financial Statements(continued)
space was approximately $431 million. The liability for payments to the States of New York and New Jersey attributable to the Fund buy-out is further described in Note D-1 (F).
Note I – Pension Plans and Other Employee Benefits
1. Pension Plans
a. Generally, full-time employees of the Port Authority (but not its related entities) are required to join one of two cost-sharing multiple-employer defined benefit pension plans, the New York State and Local Employees’ Retirement System (ERS) or the New York State and Local Police and Fire Retirement System (PFRS), collectively referred to as the “Retirement System.” The New York State Constitution provides that membership in a pension or retirement system of the State or of a civil division thereof is a contractual relationship, the benefits of which may not be diminished or impaired.
The Retirement System provides retirement benefits related to years of service and final average salary, death and disability benefits, vesting of benefits after a set period of credited public service, and optional methods of benefit payment. Depending upon the date of membership, retirement benefits differ as to the qualifying age or years-of-service requirement for service retirement, the benefit formula used in calculating the retirement allowance and the contributory or non-contributory nature of the plan.
Employer contributions to the Retirement System are determined based on an actuarial valuation of the present value of future benefits for active and retired members. When the actuarially determined value of benefits is greater than the assets to be used for the payment of benefits, the difference must be made up through employer contributions. That difference is amortized over the working lives of current members to determine the required annual contribution. Separate calculations are done for each plan, since each plan allows for different benefits. However, in no case will the employer’s annual contribution to the Retirement System be less than 4.5% of covered payroll, including years in which the investment performance of the New York State Common Retirement Fund would make a lower contribution possible.
The Port Authority’s covered ERS and PFRS payroll expense for 2011 was approximately $396 million and $219 million, respectively.
Required Port Authority contributions to the Retirement System, including costs for participation in retirement incentive programs, are as follows:
Year % of % of Ended ERS Covered Payroll PFRS Covered Payroll
($ In thousands)
2011 $54,060 13.7% $40,485 18.5% 2010 $62,095 15.0% $34,116 16.4% 2009 $29,526 7.1% $32,960 15.6%
These contributions cover the entire funding requirements for the current year and each of the two preceding years.
In 2011, employee contributions of approximately $9.2 million to the ERS represented 2.3% of the payroll for employees covered by ERS.
The Annual Report of the Retirement System, which provides details on valuation methods and ten-year historical trend information, is available from the Comptroller of the State of New York, 110 State Street, Albany, New York 12236.
b. Employees of PATH are not eligible to participate in New York State’s Retirement System. For most employees represented by unions, PATH contributes to supplemental pension plans. Annual PATH contributions to these plans are defined in the various collective bargaining agreements; no employee contributions are required. Eligibility for all benefits prior to normal retirement requires the completion of at least five years of vested service and depends upon years of credited service and monthly benefit rates in effect at the time of retirement. Trustees, appointed by the various unions, are responsible for the administration of these pension plans. PATH payroll expense in 2011 for these employees was approximately $87 million. For the year 2011, contributions made by PATH in accordance with the terms of various collective bargaining agreements totaled approximately $6 million, which represented approximately 7.1% of the total PATH covered payroll for 2011. Contributions were approximately $6 million for both 2010 and 2009.
c. Employees of PATH who are not covered by collective bargaining agreements (sometimes referred to as PATH Exempt Employees) are members of the PATH Corporation Exempt Employees Supplemental Pension Plan, amended and restated as of January 1, 2011 (the Plan). The Plan is a non-contributory, single employer, defined benefit governmental pension plan administered by the Port Authority.
The Plan provides retirement benefits related to years of service as a PATH Exempt Employee and final average salary, death benefits for active PATH Exempt Employees, vesting of retirement benefits after a set period of credited service as a PATH Exempt Employee, and optional methods of retirement benefit payment. Depending upon the date of membership, retirement benefits differ as to the qualifying age or years-of-service requirement and the benefit formula used in calculating retirement benefits.
As of December 31, 2011, Plan participants include 95 retired PATH Exempt Employees (or their beneficiaries), 77 active PATH Exempt Employees,

67
Management’s Discussion and Analysis(continued)Notes to Consolidated Financial Statements(continued)
and 31 terminated but vested employees who are not currently receiving benefits.
On January 31, 2011, PATH requested a determination letter from the Internal Revenue Service to recognize the amended and restated Plan as a qualified plan under section 401(a) of the Internal Revenue Code.
Actuarial Methods and Assumptions
The actuarially determined valuation of the unfunded Net Pension Obligation (NPO) of the Plan was reviewed in 2011 for purposes of recognizing an actuarially determined Annual Required Contribution operating expense provision and the change in the NPO liability for the Plan in the Port Authority consolidated financial statements.
The actuarial valuation was performed in accordance with GASB Statement No. 25, Financial Reporting for Defined Benefit Pension Plans and Note Disclosures for Defined Contribution Plans, GASB Statement No. 27, Accounting for Pensions by State and Local Governmental Employers and GASB Statement No. 50, Pension Disclosures (an amendment of GASB Statements No. 25 and No. 27). The Plan does not issue separate stand-alone financial statements.
Projections of benefits for financial reporting purposes are based on the terms of the Plan as described by PATH to participants, and include the types of benefits provided at the time of each valuation.
In the December 31, 2011 actuarial valuation, the projected unit credit cost method was employed for all participants. Actuarial assumptions used to project pension benefits included a 5.25% investment rate of return, representing the estimated long term yield on investments expected to be used for the payment of pension benefits and a salary scale adjustment of 3% per annum (including 2.5% inflation factor).
The Annual Required Contribution represents the actuarially determined level of funding that, if paid on an ongoing basis, is projected to cover annual benefit costs and the 30- year open amortization amounts, which represents the difference between the actuarial accrued liability and amounts previously recognized. The following reflects the components of the 2011 Annual Required Contribution, benefits paid and changes to the NPO.
Annual Required Contributions and NPO for 2011
(In thousands)Normal Cost $01,236Amortization Cost 1,341Interest on NPO 1,357
Annual Required Contribution 3,934
Benefits Paid in 2011 (2,877)
Increase in NPO in 2011 1,057
NPO Beginning of Year 25,847
NPO End of Year $26,904
The year-to-year change in the NPO consists of the difference between the 2011 annual required contribution and 2011 pension benefits paid to Plan participants. As of December 31, 2011, the actuarial accrued liability for pension benefits totaled $53.9 million. The difference between the actuarial accrued liability of $53.9 million and the $25.8 million previously recognized is being amortized as a level dollar amount over an open amortization period of 30 years.
Annual Required Contributions and NPO for 2009–2011
Ratio of Benefit Payments to NPO Annual Annual NPO Beginning Required Benefit Required Year-End Year Balance Contribution Payments Contribution Balance
($ In thousands)
2011 $25,847 $3,934 $2,877 73.14% $26,904 2010 $25,236 $3,976 $3,365 84.64% $25,847 2009 $24,255 $3,951 $2,970 75.17% $25,236

68
Funding StatusPATH (the employer) does not currently fund the Plan; therefore, there are no Plan assets. Retirement benefit payments are on a pay-as-you-go basis from available Port Authority operating funds.
The Schedule of Funding Progress for the plan covering 2011 is:
Unfunded Actuarial Unfunded Accrued Actuarial Actuarial Actuarial Actuarial Liability Valuation Value of Accrued Accrued Funded Covered as a % of Date Assets Liability Liability Ratio Payroll Payroll
($ In thousands)
12/31/11 $0 $53,977 $53,977 0% $ 9,185 587.65%
The schedule of funding progress for the previous five years is presented as required supplementary information immediately following the notes to the financial statements, and presents multi-year trend information about whether the actuarial value of plan assets is increasing or decreasing over time relative to the actuarial accrued liability for benefits.
2. Other Employee Benefits
Benefit PlansThe Port Authority and PATH provide, pursuant to Board action or as contemplated thereby, certain group health care, prescription, dental, vision and term life insurance benefits for active and retired employees of the Port Authority and PATH (and for eligible dependents and survivors of active and retired employees). Collectively, these covered individuals are referred to as “participants.” Contributions toward the costs of some of these benefits are required of certain participants. These contributions generally range from 10% to 50% of the Port Authority or PATH’s cost of the benefit and depend on a number of factors, including status of the participants, type of benefit, hire date, years of service, and retirement date. Benefits are provided through insurance companies whose premiums are based on the benefits paid during the year, or through plans under which benefits are paid by service providers on behalf of the Port Authority or PATH. The actuarially determined valuation of postemployment benefits is reviewed annually for the purpose of estimating the present value of future benefits for participants.
Actuarial Methods and AssumptionsProjections of benefits for financial reporting purposes are based on the benefit plans as described by the Port Authority and PATH to participants, and include the types of benefits provided at the time of each valuation and the historical pattern of sharing of benefit costs to that point. The actuarial methods and assumptions used include techniques that are designed to reduce the effects of short-term volatility in actuarial accrued liabilities, consistent with the long-term perspective of the calculations.
Actuarial valuations of an ongoing plan involve estimates and assumptions about the probability of occurrence of events far into the future, including future employment, mortality, and healthcare cost trends. Actuarially determined amounts are subject to continual revision as actual results are compared with past expectations and new estimates are made about the future.
In the January 1, 2011 actuarial valuation, the projected unit credit cost method was used for all participants. The actuarial assumptions used to project future costs included a 6% investment rate of return, representing the estimated yield on investments expected to be used for the payment of benefits; a medical healthcare cost trend rate of 8% in 2011, declining to an ultimate rate of 5% in 2014; a pharmacy benefit cost trend rate of 5% in 2011; and a dental benefit cost trend rate of 4.5% per year. In addition, the unfunded, unrecognized actuarial accrued liability is amortized as a level dollar amount over a period of 30 years.
Other Postemployment Benefit Costs and ObligationsThe annual non-pension postemployment benefit cost is actuarially determined in accordance with the parameters of GASB Statement No. 45, Accounting and Financial Reporting by Employers for Postemployment Benefits Other Than Pensions, which also forms the basis for calculating the annual required contribution for the Port Authority and PATH. The annual required contribution represents the actuarially determined level of funding that, if paid on an ongoing basis, is projected to cover annual benefit costs and the 30-year open amortization of the difference between the actuarial accrued liability and amounts previously recognized. The Port Authority has been recognizing OPEB costs since 1985. The following reflects the components of the 2011 annual OPEB costs, amounts paid, and changes to the net accrued OPEB obligation based on the January 1, 2011 actuarial valuation:
Notes to Consolidated Financial Statements(continued)

69
Management’s Discussion and Analysis(continued)
(In millions)Normal actuarial cost $035.8 Amortization cost 83.9 Interest on excess contribution (6.6)
Annual Required Contribution 113.1
OPEB payments (103.7)
Increase in net OPEB obligation 9.4
Net accrued OPEB obligation as of 12/31/10 539.9
OPEB obligation as of 12/31/11 549.3
Trust contributions (100.0)
Net accrued OPEB obligation as of 12/31/11 $449.3
As of January 1, 2011, the actuarially accrued liability for OPEB totaled approximately $2 billion. The difference between the actuarial accrued liability of $2 billion and the sum of the $539.9 million liability previously recognized and the $274 million in trust assets is being amortized using an open amortization approach over a 30-year period.
The Medicare Prescription Drug, Improvement, and Modernization Act of 2003 established a new prescription drug benefit commonly known as Medicare Part D. The Port Authority’s application to the Centers for Medicare and Medicaid Services (CMS) within the Department of Health and Human Services to sponsor a Part D Plan for retirees was approved effective January 1, 2006. Effective January 1, 2009, the Port Authority contracted with Express Scripts, Inc. for an Employee Group Waiver Plan (CMS approved series 800 plan) covering its retirees. Under the contract, Express Scripts, Inc. assumed responsibility for the administrative and compliance obligations imposed by CMS. In 2011, CMS payments to Express Scripts, Inc., on behalf of the Port Authority, totaled approximately $3.5 million. These amounts were considered in calculating the actuarial valuation of the OPEB liability.
The Port Authority and PATH’s combined annual OPEB cost, the percentage of annual OPEB cost contributed to the plans, and the net accrued OPEB obligation for 2011 and the two preceding years, were as follows:
Annual OPEB Payments as a % Net Required of Annual Required Accrued OPEB Year Contribution Contribution Obligation
($ In thousands)
2011 $113,078 180% $449,299 2010 $130,942 127% $539,979 2009 $114,270 127% $575,314
Funding Status On December 14, 2006, the Port Authority established a restricted fund to provide funding for post employment benefits. Effective December 2010, the Port Authority’s quarterly contribution to The Port Authority of New York and New Jersey Retiree Health Benefits Trust (Trust), with Wells Fargo Bank, N.A-Institutional Trust Services serving as the Trustee, increased from $15 million to $25 million. In 2011 and 2010, contributions to the Trust totaled $100 million and $70 million, respectively.
OPEB Trust net assets, the actuarial accrued liability, the unfunded actuarial accrued liability for benefits, the annual payroll amounts for active employees covered by the plans and the ratio of the unfunded actuarial liability to covered payroll for the three most recent valuation dates were as follows:
Covered Ratio of the Unfunded Payroll Unfunded OPEB Actuarial for Active Actuarial Actuarial Trust Actuarial Accrued Employees Liability Valuation Net Accrued Benefit Covered by to Covered Date Assets Liability Liability the Plans Payroll
($ In millions)
1/1/2011 $274 $1,978 $1,704 $712 239% 1/1/2010 $180 $2,120 $1,940 $722 269% 1/1/2009 $100 $1,898 $1,798 $719 250%
Following are the Condensed Statements of Trust Net Assets and Changes in Trust Net Assets held in trust for OPEB for 2011 and 2010. The activities are accounted for using the accrual basis of accounting and all investments are recorded at their fair value.
Notes to Consolidated Financial Statements(continued)

70
Statements of Trust Net Assets
December 31, 2011 2010
(In thousands)
ASSETS
Cash $ 6,425 $ 58 Investments, at fair value: Bond/Equity Funds 370,126 274,038
Total Investments 370,126 274,038
Total assets 376,551 274,096
LIABILITIES
Total liabilities – –
NET ASSETS HELD IN TRUST FOR OPEB $376,551 $274,096
Statements of Changes in Trust Net Assets
Year ended December 31, 2011 2010
(In thousands)
Additions
Contributions $100,000 $ 70,000
Total contributions 100,000 70,000
Investment Income: Net change in fair value of investments (6,450) 18,743 Interest income 9,060 5,858
Total Net Investment gain (loss) 2,610 24,601
Deductions
Administrative expenses and fees (155) (270)
Total deductions (155) (270)
Net Increase 102,455 94,331Trust net assets, January 1 274,096 179,765
NET ASSETS HELD IN TRUST FOR OPEB $376,551 $274,096
The audited financial statements for the years ended December 31, 2011 and December 31, 2010 of the Trust, which provides additional information concerning trust assets, are available from the Comptroller’s Department of The Port Authority of New York and New Jersey, 1 PATH Plaza, Jersey City, New Jersey 07306.
Notes to Consolidated Financial Statements(continued)

71
Management’s Discussion and Analysis(continued)
Note J – Commitments and Certain Charges to Operations
1. On December 8, 2011, the Board of Commissioners of the Port Authority adopted the preliminary budget for 2012. Approval of a budget by the Board of Commissioners does not in itself authorize any specific expenditures, which are authorized from time to time by or as contemplated by other actions of the Board of Commissioners consistent with statutory, contractual and other commitments of the Port Authority, including agreements with the holders of its obligations.
2. At December 31, 2011, the Port Authority had entered into various construction contracts totaling approximately $5.1 billion, which are expected to be completed within the next three years.
3. The Port Authority carries insurance or requires insurance to be carried (if available) on or in connection with its facilities to protect against direct physical loss or damage and resulting loss of revenue and against liability in such amounts as it deems appropriate, considering self-insured retentions, purchase of insurance through its captive insurance entity, PAICE, exceptions, or exclusions of portions of facilities, and the scope of insurable hazards. In view of the current state of the insurance industry, availability of coverage may be constrained and premium costs may increase for available coverage in connection with the Port Authority’s periodic renewal of its insurance programs.
a. Property damage and loss of revenue insurance program:
The Port Authority’s property damage and loss of revenue insurance program (which was renewed effective June 1, 2011 and expires on June 1, 2012) provides for coverage as follows:
General Coverage(Excluding Terrorism) Terrorism Coverage
$25 million in the aggregate self-insuranceafter which purchased coverage applies
$5 million per occurrence deductible
$1.425 billion of purchased coverage
$25 million in the aggregate self-insuranceafter which purchased coverage applies
$5 million per occurrence deductible
$1.21 billion TRIPRA*coverage (PAICE)
$213.75 million purchasedcoverage
* On December 26, 2007, the Federal government enacted the Terrorism Risk Insurance Program Reauthorization Act of 2007 (TRIPRA), which replaced the Federal reinsurance provisions of the Terrorism Risk Insurance Act of 2002 (TRIA) and added reinsurance for acts of domestic terrorism in addition to acts of foreign terrorism through December 31, 2014. Under TRIPRA, the Federal government reinsures 85% of certified terrorism losses, subject to a $100 million deductible and a 20% insurance carrier/captive deductible, in an amount not to exceed an annual cap on all such losses payable under TRIPRA of $100 billion. No federal payments are made under this program until the aggregate industry insured losses from acts of terrorism exceed $100 million.
Notes to Consolidated Financial Statements(continued)
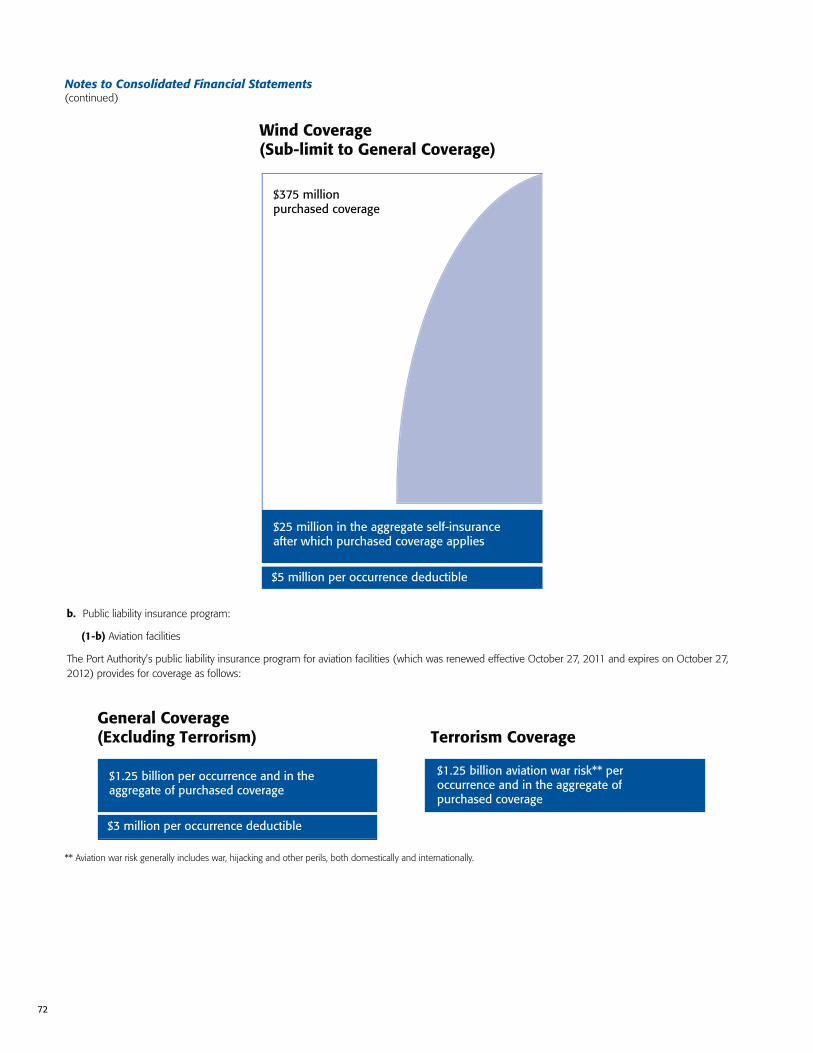
72
Wind Coverage(Sub-limit to General Coverage)
General Coverage(Excluding Terrorism) Terrorism Coverage
** Aviation war risk generally includes war, hijacking and other perils, both domestically and internationally.
b. Public liability insurance program:
(1-b) Aviation facilities
The Port Authority’s public liability insurance program for aviation facilities (which was renewed effective October 27, 2011 and expires on October 27, 2012) provides for coverage as follows:
$25 million in the aggregate self-insuranceafter which purchased coverage applies
$5 million per occurrence deductible
$375 million purchased coverage
$1.25 billion per occurrence and in theaggregate of purchased coverage
$3 million per occurrence deductible
$1.25 billion aviation war risk** per occurrence and in the aggregate of purchased coverage
Notes to Consolidated Financial Statements(continued)
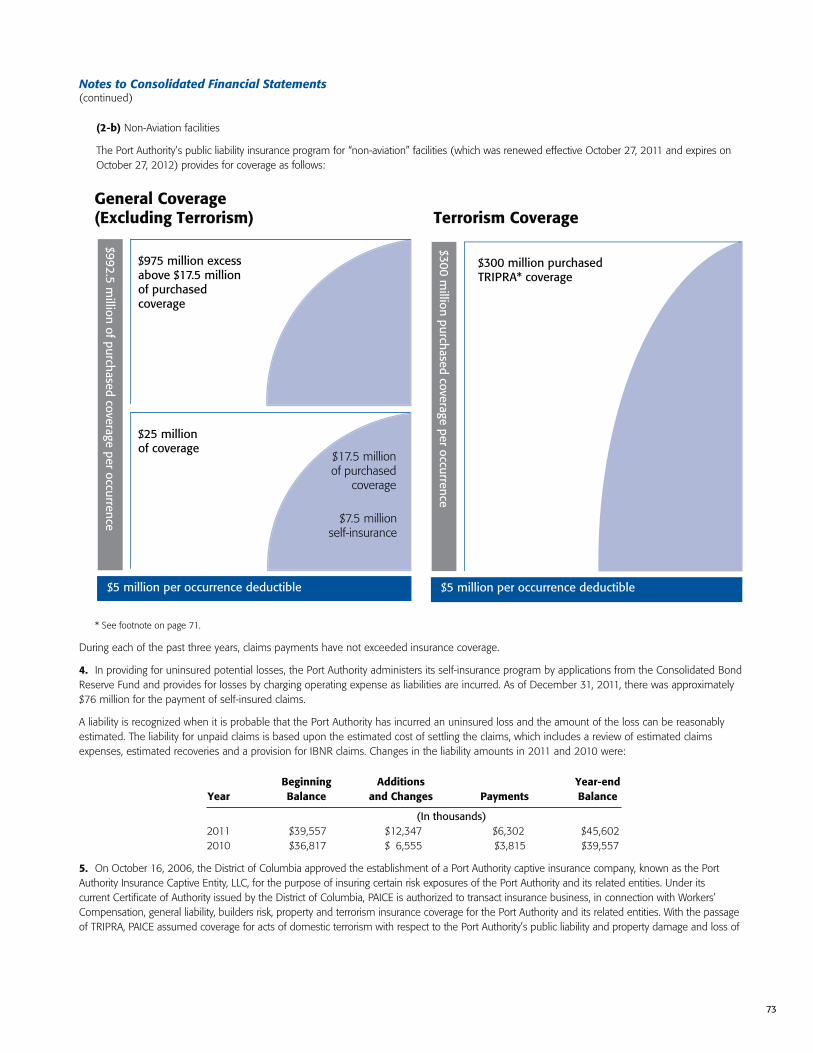
73
Management’s Discussion and Analysis(continued)
(2-b) Non-Aviation facilities
The Port Authority’s public liability insurance program for “non-aviation” facilities (which was renewed effective October 27, 2011 and expires on October 27, 2012) provides for coverage as follows:
* See footnote on page 71.
During each of the past three years, claims payments have not exceeded insurance coverage.
4. In providing for uninsured potential losses, the Port Authority administers its self-insurance program by applications from the Consolidated Bond Reserve Fund and provides for losses by charging operating expense as liabilities are incurred. As of December 31, 2011, there was approximately $76 million for the payment of self-insured claims.
A liability is recognized when it is probable that the Port Authority has incurred an uninsured loss and the amount of the loss can be reasonably estimated. The liability for unpaid claims is based upon the estimated cost of settling the claims, which includes a review of estimated claims expenses, estimated recoveries and a provision for IBNR claims. Changes in the liability amounts in 2011 and 2010 were:
Beginning Additions Year-end Year Balance and Changes Payments Balance
(In thousands) 2011 $39,557 $12,347 $6,302 $45,602 2010 $36,817 $16,555 $3,815 $39,557
5. On October 16, 2006, the District of Columbia approved the establishment of a Port Authority captive insurance company, known as the Port Authority Insurance Captive Entity, LLC, for the purpose of insuring certain risk exposures of the Port Authority and its related entities. Under its current Certificate of Authority issued by the District of Columbia, PAICE is authorized to transact insurance business, in connection with Workers’ Compensation, general liability, builders risk, property and terrorism insurance coverage for the Port Authority and its related entities. With the passage of TRIPRA, PAICE assumed coverage for acts of domestic terrorism with respect to the Port Authority’s public liability and property damage and loss of
General Coverage(Excluding Terrorism) Terrorism Coverage
$25 millionof coverage
$5 million per occurrence deductible
$992.5 million of purchased coverage per occurrence
$975 million excessabove $17.5 millionof purchased coverage
$17.5 millionof purchased
coverage
$7.5 millionself-insurance
$25m in the aggregate self-insuranceafter which purchased coverage applies
$5 million per occurrence deductible
$300 million purchasedTRIPRA* coverage
$300 million purchased coverage per occurrence
Notes to Consolidated Financial Statements(continued)

74
revenue insurance programs in addition to the previously provided coverage for acts of foreign terrorism. In addition, as of December 31, 2011, PAICE has continued to provide the first $1,000,000 in coverage under the Workers’ Compensation portion, the first $500,000 in coverage under the general liability aspect of the Port Authority’s Contractor’s Insurance Program, and $1 billion of Builders Risk and Terrorism coverage for the WTC Transportation Hub Owner Controlled Insurance Program, which is 100% reinsured through the commercial insurance marketplace and TRIPRA.
Any changes in the lines of insurance being provided by PAICE or its capitalization are subject to prior approval by the Port Authority Board of Commissioners’ Committee on Finance. PAICE also provides periodic reports with respect to its general operations to the Port Authority’s Board of Commissioners.
The financial results for PAICE for the year ended December 31, 2011 are set forth below. Amounts associated with PAICE recorded on the Port Authority’s consolidated financial statements have been adjusted to reflect intercompany transfers between the Port Authority and PAICE (see Schedule E).
(In thousands)Financial Position Total Assets $233,421Total Liabilities 112,038
Net Assets $121,383
Operating ResultsRevenues $ 27,465Expenses 9,544
Net Income $ 17,921
Changes in Net AssetsBalance at January 1, 2011 $103,462Net Income 17,921
Balance at December 31, 2011 $121,383
6. The 2011 balance of “Other amounts receivable, net” on the Consolidated Statements of Net Assets consists of approximately $72 million representing advance payments to DCM Erectors Inc., Tutor Perini, and Tishman Construction for work performed in connection with the WTC Transportation Hub; approximately $25 million in net long-term receivables from Port Authority tenants; approximately $8 million in interest expense reimbursement due from Tower 4 net lessee related to Tower 4 Liberty Bonds; and approximately $2 million representing the balance due from the private full service vendor operating the plant at the Essex County Resource Recovery Facility under the conditional sale agreement through which the vendor financed a portion of the construction costs of the plant.
7. The 2011 balance of “Other noncurrent liabilities” consists of the following:
Dec. 31, Dec. 31, 2010 Additions Deductions 2011
(In thousands)Workers’ Compensation liability $ 42,684 $ 26,848 $24,144 $ 45,388Claims liability 39,557 12,347 6,302 45,602Pollution remediation 36,520 5,034 9,722 31,832PATH exempt employees supplemental pension plan* 25,847 – 25,847 –Asset forfeiture 11,192 3,478 4,022 10,648Contractors Insurance Program-WTC – 122,701 – 122,701Surety and security deposits 6,974 1,446 299 8,121Other 7,009 55,768 117 62,660
Gross other liabilities $169,783 $227,622 $70,453 326,952
Less current portion:
Workers’ Compensation liability 15,556
Total other noncurrent liabilities $311,396
* Reclassified to “Accrued pension and other noncurrent employee benefits” in 2011.
Notes to Consolidated Financial Statements(continued)

75
Management’s Discussion and Analysis(continued)
8. During 2011, approximately $35 million in capital expenditures primarily associated with the construction of a podium covered with prismatic glass at the base of One World Trade Center building and the development of advanced metering projects at LGA and JFK, that were previously included as a component of “Facilities, net” were determined to represent costs for projects that will not proceed forward to completion, or for preliminary engineering and design work related to alternative analyses no longer considered viable for ongoing projects. As a result, these charges were written off to operating expense accounts in 2011.
9. During 2011, the Port Authority provided voluntary termination benefits, including severance payments based primarily on years of service to 15 employees. Port Authority costs totaled approximately $1 million in 2011 for these severance programs. As of December 31, 2011, all severance amounts were recognized.
10. In accordance with GASB Statement No. 49, Accounting and Financial Reporting for Pollution Remediation Obligations, an operating expense provision and corresponding liability measured at its current value using the expected cash flow method have been recognized for certain pollution remediation obligations that previously may not have been required to be recognized, have been recognized earlier than in the past or are no longer able to be capitalized as a component of a capital project. The Port Authority recognized an additional $5 million in pollution remediation obligations, thus increasing the cumulative amounts recognized to date from $52 million in 2010 to $57 million in 2011, net of $2.1 million in expected recoveries. A corresponding liability, measured at its current value utilizing the prescribed expected cash flow method, has been recognized on the Consolidated Statements of Net Assets.
As of December 31, 2011, the outstanding pollution remediation liability totaled $31.8 million, primarily consisting of future remediation activities associated with asbestos removal, lead abatement, ground water contamination, soil contamination, and arsenic contamination at Port Authority facilities.
Note K – Information with Respect to the Redevelopment of the World Trade Center Site
The terms of the original July 2001 net leases established both an obligation and concomitant right for the net lessees, at their sole cost and expense, to restore their net leased premises following a casualty whether or not the damage is covered by insurance proceeds in accordance, to the extent feasible, prudent and commercially reasonable, with the plans and specifications as they existed before the casualty or as otherwise agreed to with the Port Authority. The net lessees obtained property damage and business interruption insurance in a combined single limit of approximately $3.5 billion per occurrence. The net lessees recovered approximately $4.57 billion against available policy limits of approximately $4.68 billion. Approximately $2.3 billion of these funds has been used for the net lessees’ business interruption expenses, including the payment of rent to the Port Authority, the prepayment of the mortgage loan entered into on July 24, 2001 by the Silverstein net lessees with GMAC Commercial Mortgage Corporation in the amount of approximately $562 million, and the purchase by the Port Authority on December 23, 2003 of the retail net lessee from Westfield for $140 million as well as certain of their WTC redevelopment expenses.
Conceptual Framework for the Redevelopment of the Office, Retail and Other Components of the World Trade Center
The redevelopment of the WTC will provide approximately 10 million square feet of above-grade office space with associated storage, mechanical, loading, below-grade parking, and other non-office space, and consist of One World Trade Center, Tower 2, Tower 3, Tower 4, Tower 5, approximately 450,000 square feet of retail space, a WTC Transportation Hub, a memorial and interpretive museum (Memorial/Museum) and cultural facilities and certain related infrastructure.
Future minimum rentals (see Note G) include rentals of approximately $36 billion attributable to WTC net leases. The inclusion of this amount in future rentals is predicated upon the assumption that the net lessees of various components of the WTC Towers 2, 3 and 4, and WTC Retail will continue to meet their contractual commitments pertaining to their net leased properties, including those with respect to the payment of rent and the restoration of their net leased properties. The net lessees’ ability to meet these contractual commitments may be affected by the nature of the downtown Manhattan real estate market, and coordination among various public and private sector entities involved in the redevelopment of downtown Manhattan.
One World Trade Center
In November 2006, as part of the continuing redevelopment of the WTC, the Port Authority acquired from Silverstein Properties 100% of the membership interests in 1 WTC LLC, the then-net lessee of One World Trade Center and Tower 5, which will comprise, in the aggregate, approximately 4.2 million square feet of office space. On June 13, 2011, the Port Authority and Durst entered into various agreements in connection with the establishment of a joint venture with respect to the construction, financing, leasing, management and operation of the One World Trade Center building. Durst contributed $100 million for a minority equity interest in Tower 1 Joint Venture LLC. One World Trade Center will contain 3.0 million square feet of space, comprised of commercial office space and an indoor observation deck. It is presently expected that One World Trade Center will be substantially completed by late 2013, at a cost of approximately $3.1 billion.
Notes to Consolidated Financial Statements(continued)
76
World Trade Center Tower 2, Tower 3 and Tower 4
A December 2010 World Trade Center Amended and Restated Master Development Agreement (MDA), among the Port Authority, PATH, 1 WTC LLC, WTC Retail LLC, and the Silverstein net lessees, sets forth the respective rights and obligations of the parties thereto with respect to construction on the WTC site, including the allocation of construction responsibilities and costs between the parties to the MDA.
The Silverstein net lessees are required to construct Tower 4, the Tower 3 podium and certain sub grade and foundation work required for Tower 2, to be located on the eastern portion of the WTC site, along the Church Street corridor, comprising, in the aggregate, approximately 6.2 million square feet of office space, as well as contribute an aggregate of $140,000,000 toward specified common infrastructure costs. The MDA also provides for the implementation of a construction coordination and cooperation plan among the respective parties’ construction teams in order to provide for cooperation and coordination to achieve reasonable certainty of timely project completion.
World Trade Center Tower 4
For the continued development and construction of Tower 4, with approximately 600,000 of its 2 million square feet of office space preleased to the Port Authority, and approximately 580,000 square feet preleased to the City of New York, the Port Authority, as a co-borrower/obligor with respect to the Liberty Bonds issued on November 15, 2011 under a Tower 4 Tenant Repayment Agreement, has provided tenant support payments for the benefit of the Silverstein net lessee of Tower 4. The Port Authority’s obligations with respect to the payment of debt service on the Tower 4 Liberty Bonds are evidenced by a separate Tower 4 Bond Payment Agreement between the Port Authority and the bond trustee. Tenant Support payments would be reimbursed to the Port Authority from Tower 4 cash flow and to the extent Tower 4 cash flow is not sufficient, would accrue interest until repaid with an overall term of the investment not in excess of 40 years. As security for the repayment to the Port Authority under the Tower 4 Tenant Support Agreement, the Silverstein net lessee of Tower 4, the Port Authority and a third party banking institution have entered into an account control agreement pursuant to which the revenues derived from the operation of Tower 4 (excluding the rents payable under the space lease with the City of New York which have been assigned by the Silverstein net lessee of Tower 4 directly to the bond trustee for the Tower 4 Liberty Bonds) will be deposited into a segregated lockbox account, in which the Port Authority has a security interest, and will be administered and disbursed by such banking institution in accordance with the Tower 4 Tenant Repayment Agreement. To provide additional security for the repayment to the Port Authority, the Silverstein net lessee of Tower 4 will assign to the Port Authority various contracts with architects, engineers and other persons in connection with the development and construction of Tower 4, together with all licenses, permits, approvals, easements and other rights of the Silverstein net lessee of Tower 4; will grant a first priority leasehold mortgage on the net lease for Tower 4 to the Port Authority; and will assign all Tower 4 space leases and rents (other than the space lease with the City of New York) to the Port Authority.
World Trade Center Tower 3
The Silverstein net lessee of Tower 3 would construct the Tower 3 podium, with the construction of the office tower to follow. To assist the Silverstein net lessee of Tower 3 in the construction of the Tower 3 office tower following satisfaction of certain private-marketing triggers the Port Authority has entered into a Tower 3 Tenant Support Agreement providing for the investment of Port Authority operating funds of $210 million for the construction of the tower and a backstop of $390 million for certain construction and leasing overruns, senior debt service shortfalls and operating expense deficits. These private-market triggers include the Silverstein Tower 3 net lessee raising $300 million of private equity, preleasing 400,000 square feet of the office tower, and obtaining private financing for the remaining cost of the office tower. The State of New York and the City of New York have agreed to reimburse the Port Authority for $200 million each of the $600 million to be provided under the Tower 3 Tenant Support Agreement for a total reimbursement of $400 million. Under the Tower 3 Tenant Support Agreement, the Silverstein net lessee of Tower 3 is responsible for the repayment of the $390 million backstop on a subordinated basis, without interest, from Tower 3 revenues. All repayments of the Tower 3 backstop received by the Port Authority would in turn be distributed among the Port Authority, the State of New York and the City of New York in accordance with their respective shares of the $390 million backstop payments.
The World Trade Center Transportation Hub
Immediately following the terrorist attacks of September 11, 2001, the Governors of the States of New York and New Jersey and the Board of Commissioners of the Port Authority made rapid restoration of PATH service a priority on the Port Authority’s agenda. PATH service recommenced at the Exchange Place station (which was rendered unusable as a result of the events of September 11, 2001) on June 29, 2003, and PATH service to the WTC site recommenced on November 23, 2003 at the temporary PATH station at the WTC site.
On July 28, 2005, the Board of Commissioners of the Port Authority authorized the WTC Transportation Hub project. Construction of the WTC Transportation Hub commenced on September 6, 2005 and is presently scheduled for completion between the fourth quarter of 2013 and the second quarter of 2014, at a cost of approximately $3.44 billion.
Notes to Consolidated Financial Statements(continued)

77
Management’s Discussion and Analysis(continued)
World Trade Center Infrastructure Projects
In addition to the WTC Transportation Hub, the Port Authority continues to advance planning and design for various infrastructure projects toward full build out of the WTC site. A vehicular security center for cars, tour buses, and delivery vehicles to access sub grade loading facilities is presently expected to be substantially completed in time to support the commercial development throughout the WTC site at a cost of approximately $670 million. Other infrastructure work to be implemented includes streets and utilities, a central chiller plant, and electrical infrastructure that will support the operations of the WTC site.
WTC Retail
In December 2003, as part of the redevelopment of the WTC, the Port Authority acquired 100% of the membership interest in the net lessee of the retail components of the WTC from Westfield for $140 million, and is the sole managing member of this bankruptcy remote single purpose entity, which was renamed “WTC Retail LLC.” In such capacity, the Port Authority has been involved in the planning for the restoration of the retail components of the WTC. On February 9, 2012, the Board of Commissioners of the Port Authority authorized a transaction between the Port Authority and Westfield in which the Port Authority and Westfield would form a 50/50 joint venture to develop, lease and operate the WTC retail project.
The Memorial
On July 6, 2006, the Board of Commissioners authorized the Port Authority to enter into an agreement with the Lower Manhattan Development Corporation (LMDC), the National September 11 Memorial and Memorial Museum at the WTC (Memorial Foundation), the City of New York and the State of New York for the construction by the Port Authority of the WTC memorial and cultural project. The agreement establishes the general areas of responsibility of the parties for the design, development, construction, financing and operation of the project, which will include the Memorial/Museum, the Visitor Orientation and Education Center (VOEC), and the related common and exclusive infrastructure (Infrastructure).
In connection with the funding of the costs of the construction of the project, the Memorial Foundation and the LMDC are responsible for providing $280 million and $250 million, respectively, for the Memorial/Museum; the State of New York is responsible for providing $80 million for the VOEC and the Port Authority is responsible for providing up to $150 million for the Infrastructure. The Port Authority does not have any responsibility for the operation and maintenance of the Memorial, the Memorial/Museum or the VOEC. The Memorial Plaza was substantially completed and opened for public access on September 11, 2011.
Accounting
In connection with the events of September 11, 2001, the Port Authority reclassified and recognized as an operating expense the $1.1 billion net book value of various assets consisting primarily of buildings, infrastructure and certain ancillary equipment that together comprised the components of the WTC complex destroyed as a result of the September 11, 2001 terrorist attacks. A receivable in an amount equal to such net book value was recorded in 2001. In connection with the recovery for and redevelopment of certain assets comprising the WTC, the receivable has been fully satisfied on the Port Authority’s financial statements as of December 31, 2011.
Notes to Consolidated Financial Statements(continued)

78
Required Supplementary Information
Schedule of Funding Progress
PATH Exempt Employees Supplemental Pension Plan
Unfunded Unfunded Actuarial Actuarial Actuarial Actuarial Accrued Actuarial Value of Accrued Accrued Funded Covered Liability as a Valuation Assets Liability Liability Ratio Payroll % of Payroll Date (a) (b) (c) = (b–a) (a)/(b) (d) (c)/(d)
($ In thousands)
12/31/11 $0 $53,977 $53,977 0% $09,185 587.65% 12/31/10 $0 $53,382 $53,382 0% $10,456 510.56% 12/31/09 $0 $55,270 $55,270 0% $09,043 611.20% 12/31/08 $0 $54,126 $54,126 0% $08,315 650.96% 12/31/07 $0 $53,176 $53,176 0% $08,709 610.55% 12/31/06 $0 $51,712 $51,712 0% $07,506 688.99%

79
Management’s Discussion and Analysis(continued)
Year ended December 31, 2011 2010
Operating Reserve Combined Combined Fund Funds Total Total
(In thousands)
Gross operating revenues: Rentals $(1,150,569 $ – $1,150,569 $(1,144,709 Tolls and fares 1,148,061 – 1,148,061 1,069,785 Aviation fees 895,356 – 895,356 872,774 Parking and other 339,131 – 339,131 321,257 Utilities 154,810 – 154,810 154,041 Rentals – Special Project Bonds Projects 112,553 – 112,553 71,457
Total gross operating revenues 3,800,480 – 3,800,480 3,634,023
Operating expenses: Employee compensation, including benefits 1,037,681 – 1,037,681 1,022,195 Contract services 726,883 – 726,883 630,438 Rents and amounts in-lieu-of taxes 280,237 – 280,237 272,002 Materials, equipment and other 219,183 – 219,183 418,639 Utilities 188,432 – 188,432 183,826 Interest on Special Project Bonds 112,553 – 112,553 71,457
Total operating expenses 2,564,969 – 2,564,969 2,598,557
Amounts in connection with operating asset obligations 29,580 – 29,580 46,561Net (recoverables) related to the events of September 11, 2001 – – – (53,051)
Net operating revenues 1,205,931 – 1,205,931 1,041,956
Financial income: Interest income 17,732 30,294 48,026 55,835 Net (decrease) in fair value of investments (1,206) (100,090) (101,296) (56,735)Contributions in aid of construction 487,296 – 487,296 358,268Application of Passenger Facility Charges 215,645 – 215,645 207,122Application of 1WTC LLC/WTC Retail LLC Insurance Proceeds 57,340 – 57,340 61,468Application of 4 WTC associated payments 8,343 – 8,343 –Restricted Net Revenues – PAICE 644 – 644 (102)Grants 23,727 – 23,727 11,708Pass-through grant program payments (11,507) – (11,507) (2,166)
Net revenues available for debt service and reserves 2,003,945 (69,796) 1,934,149 1,677,354
Debt service: Interest on bonds and other asset financing obligations 480,623 37,702 518,325 444,202 Debt maturities and retirements 140,390 – 140,390 178,095 Debt retirement acceleration – 6,100 6,100 – Repayment of asset financing obligations – 20,258 20,258 30,062
Total debt service 621,013 64,060 685,073 652,359
Transfers to reserves $(1,382,932) 1,382,932 – –
Revenues after debt service and transfers to reserves 1,249,076 1,249,076 1,024,995 Direct investment in facilities (742,001) (742,001) (1,375,008)Change in appropriations for self-insurance 1,949 1,949 (3,971)
Increase in reserves 509,024 509,024 (353,984) Reserve balances, January 1 2,196,012 2,196,012 2,549,996
Reserve balances, December 31 $2,705,036 $2,705,036 ($(2,196,012
Schedule A – Revenues and Reserves(Pursuant to Port Authority bond resolutions)

80
See Notes to Consolidated Financial Statements
Schedule B – Assets and Liabilities(Pursuant to Port Authority bond resolutions)
December 31, 2011 2010
Operating Capital Reserve Combined Combined Fund Fund Funds Total Total
(In thousands)ASSETS Current assets: Cash $ 616,508 $01,227,251 $1,453,606 $03,297,365 $02,451,050 Restricted cash: 1 WTC LLC/WTC Retail LLC insurance proceeds 14,434 – – 14,434 71,732 Passenger Facility Charges – – – – – Port Authority Insurance Captive Entity, LLC 11,038 – – 11,038 5,435 Investments 1,290 – 25,000 26,290 250,696 Current receivables, net 320,039 42,708 128 362,875 342,813 Other current assets 62,737 223,201 – 285,938 176,514 Restricted receivables and other assets 49,316 (2,888) – 46,428 50,268
Total current assets 1,075,362 1,490,272 1,478,734 4,044,368 3,348,508
Noncurrent assets: Restricted cash 7,765 – – 7,765 6,618 Investments 129,967 – 1,226,302 1,356,269 1,339,148 Restricted Investments – PAICE 156,356 – – 156,356 139,696 Other amounts receivable, net 33,172 73,817 – 106,989 239,270 Deferred charges and other noncurrent assets 1,381,691 132,380 – 1,514,071 1,464,338 Restricted deferred / other noncurrent assets – PAICE 13,409 – – 13,409 14,564 Amounts receivable – Special Project Bonds Projects – 1,741,440 – 1,741,440 1,780,813 Amounts receivable – Tower 4 Liberty Bonds – 1,225,520 – 1,225,520 – Invested in facilities – 37,591,818 – 37,591,818 34,204,035
Total noncurrent assets 1,722,360 40,764,975 1,226,302 43,713,637 39,188,482
Total assets 2,797,722 42,255,247 2,705,036 47,758,005 42,536,990
LIABILITIES Current liabilities: Accounts payable 200,339 617,810 – 818,149 717,992 Accrued interest and other current liabilities 692,849 66,278 – 759,127 566,732 Restricted other liabilities – PAICE 816 – – 816 351 Accrued payroll and other employee benefits 231,657 – – 231,657 198,574 Deferred income: 1 WTC LLC/WTC Retail LLC insurance proceeds 14,434 – – 14,434 71,732 Passenger Facility Charges 19,590 – – 19,590 20,779 Restricted Net Revenues – PAICE 1,946 – – 1,946 2,590 Current portion bonds and other asset financing obligations 129,960 695,959 – 825,919 972,880
Total current liabilities 1,291,591 1,380,047 – 2,671,638 2,551,630
Noncurrent liabilities: Accrued pension and other noncurrent employee benefits 476,879 – – 476,879 543,747 Other noncurrent liabilities 142,639 168,757 – 311,396 150,894 Restricted other noncurrent liabilities – PAICE 46,389 – – 46,389 44,080 Amounts payable – Special Project Bonds – 1,741,440 – 1,741,440 1,803,145 Amounts payable – Tower 4 Liberty Bonds – 1,225,520 – 1,225,520 – Bonds and other asset financing obligations 764,163 14,967,172 – 15,731,335 13,585,625
Total noncurrent liabilities 1,430,070 18,102,889 – 19,532,959 16,127,491
Total liabilities 2,721,661 19,482,936 – 22,204,597 18,679,121
NET ASSETS $ 76,061 $22,772,311 $2,705,036 $25,553,408 $23,857,869
Net assets are composed of: Facility infrastructure investment $0, 00,00,– $22,772,311 $ ,000,00,– $22,772,311 $21,583,848Reserves – – 2,705,036 2,705,036 2,196,012Appropriated reserves for self-insurance 76,061 – – 76,061 78,009
Net assets $0,076,061 $22,772,311 $2,705,036 $25,553,408 $23,857,869
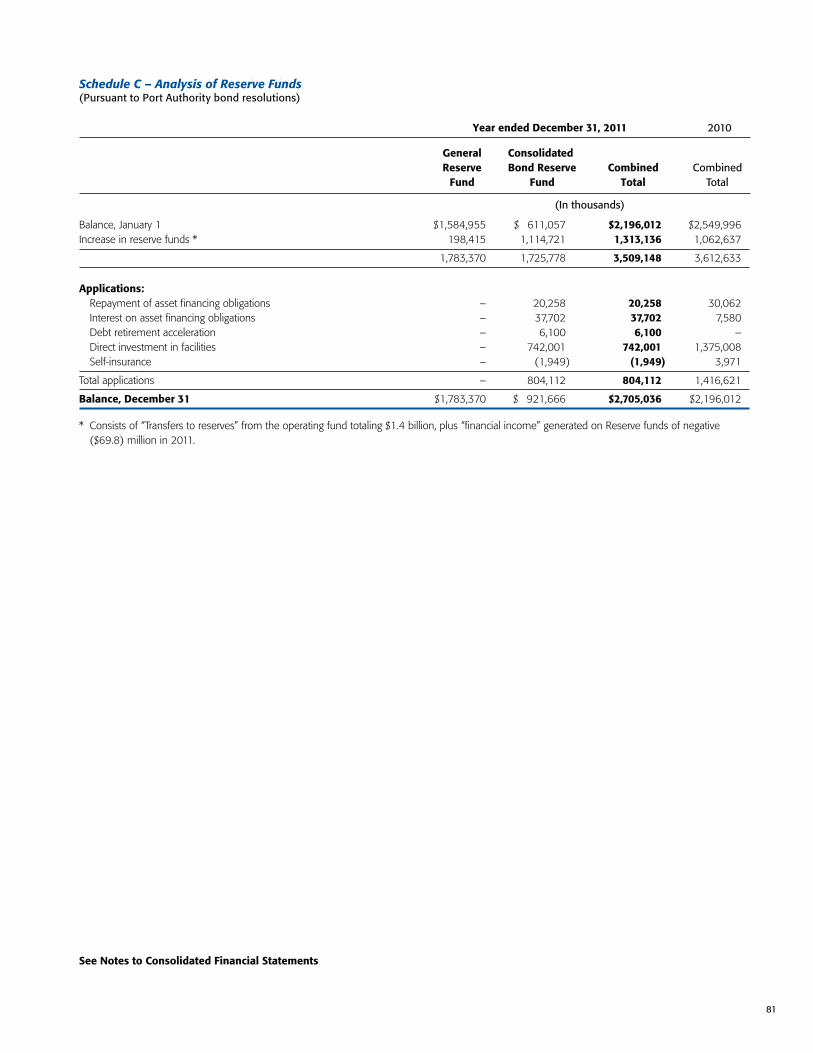
81
Management’s Discussion and Analysis(continued)
See Notes to Consolidated Financial Statements
Schedule C – Analysis of Reserve Funds(Pursuant to Port Authority bond resolutions)
Balance, January 1 $1,584,955 $0,611,057 $2,196,012 $2,549,996Increase in reserve funds * 198,415 1,114,721 1,313,136 1,062,637
1,783,370 1,725,778 3,509,148 3,612,633
Applications: Repayment of asset financing obligations – 20,258 20,258 30,062 Interest on asset financing obligations – 37,702 37,702 7,580 Debt retirement acceleration – 6,100 6,100 – Direct investment in facilities – 742,001 742,001 1,375,008 Self-insurance – (1,949) (1,949) 3,971
Total applications – 804,112 804,112 1,416,621
Balance, December 31 $1,783,370 $0,921,666 $2,705,036 $2,196,012
* Consists of “Transfers to reserves” from the operating fund totaling $1.4 billion, plus “financial income” generated on Reserve funds of negative ($69.8) million in 2011.
Year ended December 31, 2011 2010
General Consolidated Reserve Bond Reserve Combined Combined Fund Fund Total Total
(In thousands)


838383
Statistical & Other Supplemental InformationFor the Year Ended December 31, 2011


The Statistical Section presents additional information as context for further understanding the information in the financial statements, note disclosures and schedules. The information contained in this section is unaudited.
Financial Trends – Schedule D-1
Trend information is provided to help the reader understand how the Port Authority’s financial performance and fiscal health has changed over time.
Debt Capacity – Schedule D-2
The Port Authority has several forms of outstanding obligations.
Information on Port Authority revenues, outstanding obligations, debt service, and reserves is included here for statistical purposes (more detailed information about the various kinds of debt instruments used by the Port Authority can be found in Note D, and the reserve funds are described in Note E). Debt limitations, including in some cases limits on total authorized amounts or requirements for the issuance of additional bonds, may be found in the various resolutions establishing and authorizing such obligations.
Operating Information – Schedule D-3
Operating and service data is provided to help the reader understand how information in the Port Authority’s financial report relates to the services it provides and activities it performs.
Statistical Section
85
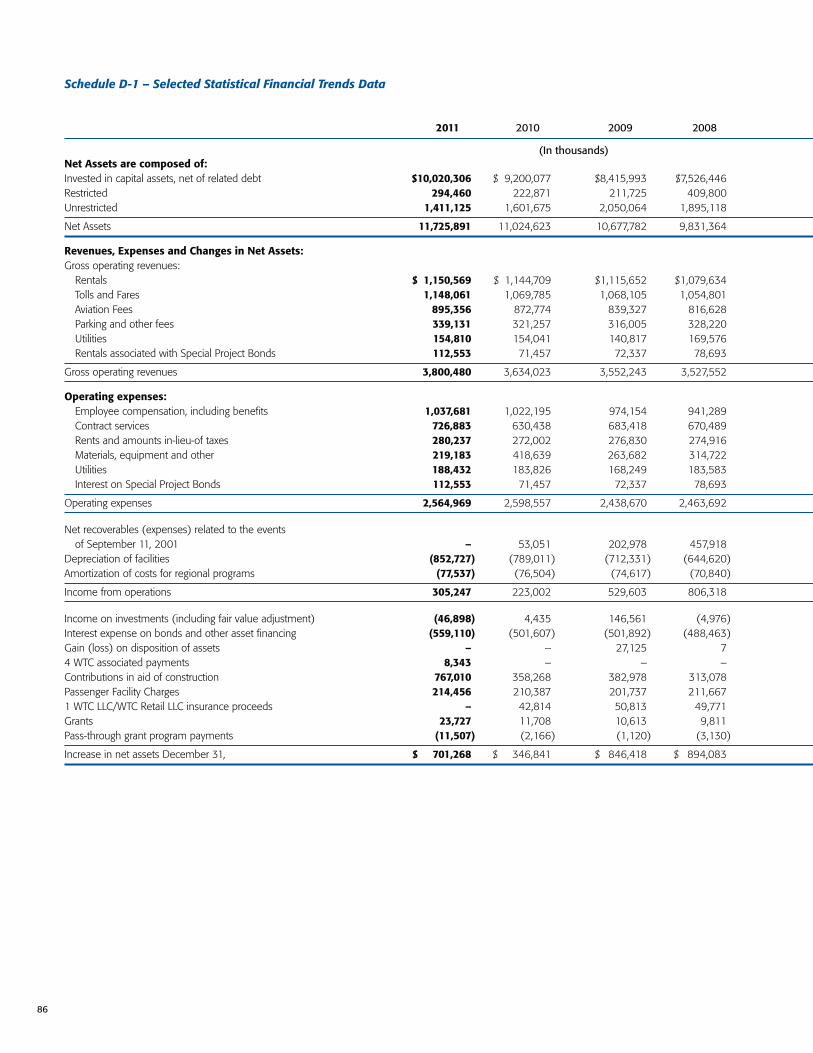
86
Schedule D-1 – Selected Statistical Financial Trends Data
2011 2010 2009 2008
(In thousands) Net Assets are composed of: Invested in capital assets, net of related debt $10,020,306 $09,200,077 $8,415,993 $7,526,446 Restricted 294,460 222,871 211,725 409,800 Unrestricted 1,411,125 1,601,675 2,050,064 1,895,118
Net Assets 11,725,891 11,024,623 10,677,782 9,831,364
Revenues, Expenses and Changes in Net Assets:Gross operating revenues: Rentals $01,150,569 $01,144,709 $1,115,652 $1,079,634 Tolls and Fares 1,148,061 1,069,785 1,068,105 1,054,801 Aviation Fees 895,356 872,774 839,327 816,628 Parking and other fees 339,131 321,257 316,005 328,220 Utilities 154,810 154,041 140,817 169,576 Rentals associated with Special Project Bonds 112,553 71,457 72,337 78,693
Gross operating revenues 3,800,480 3,634,023 3,552,243 3,527,552
Operating expenses: Employee compensation, including benefits 1,037,681 1,022,195 974,154 941,289 Contract services 726,883 630,438 683,418 670,489 Rents and amounts in-lieu-of taxes 280,237 272,002 276,830 274,916 Materials, equipment and other 219,183 418,639 263,682 314,722 Utilities 188,432 183,826 168,249 183,583 Interest on Special Project Bonds 112,553 71,457 72,337 78,693
Operating expenses 2,564,969 2,598,557 2,438,670 2,463,692
Net recoverables (expenses) related to the events of September 11, 2001 – 53,051 202,978 457,918 Depreciation of facilities (852,727) (789,011) (712,331) (644,620) Amortization of costs for regional programs (77,537) (76,504) (74,617) (70,840)
Income from operations 305,247 223,002 529,603 806,318
Income on investments (including fair value adjustment) (46,898) 4,435 146,561 (4,976) Interest expense on bonds and other asset financing (559,110) (501,607) (501,892) (488,463) Gain (loss) on disposition of assets – – 27,125 7 4 WTC associated payments 8,343 – – – Contributions in aid of construction 767,010 358,268 382,978 313,078 Passenger Facility Charges 214,456 210,387 201,737 211,667 1 WTC LLC/WTC Retail LLC insurance proceeds – 42,814 50,813 49,771 Grants 23,727 11,708 10,613 9,811 Pass-through grant program payments (11,507) (2,166) (1,120) (3,130)
Increase in net assets December 31, $0,0701,268 $0,0346,841 $0,846,418 $0,894,083

87
2007 2006 2005 2004 2003 2002
$6,609,691 $5,872,518 $5,725,929 $5,563,683 $5,397,959 $4,492,027 719,306 208,771 17,916 14,651 15,153 16,505
1,608,284 1,553,114 1,371,928 1,375,533 1,389,219 1,410,763
$8,937,281 $7,634,403 $7,115,773 $6,953,867 $6,802,331 $5,919,295
$0,986,663 $0,952,431 $0,928,395 $0,877,306 $0,858,414 $0,832,527 800,244 798,682 787,381 788,333 758,326 774,337 781,355 716,700 748,811 714,766 705,302 672,175 387,966 335,019 296,663 269,413 234,261 197,912 149,537 146,822 147,795 121,436 112,555 97,184 85,861 88,884 91,648 93,570 95,193 96,448
3,191,626 3,038,538 3,000,693 2,864,824 2,764,051 2,670,583
922,671 840,640 870,784 806,890 769,711 777,146 587,730 590,197 564,332 545,404 543,927 622,781 271,073 254,178 243,411 252,658 237,014 140,614 212,147 187,996 168,139 141,367 150,961 135,321 167,912 150,729 149,604 141,476 122,445 113,880 85,861 88,884 91,648 93,570 95,193 96,448
2,247,394 2,112,624 2,087,918 1,981,365 1,919,251 1,886,190
(4,563) (2,069) (3,358) (4,985) 664,211 474,663 (632,553) (674,940) (643,732) (575,539) (488,986) (406,484)
(59,316) (49,319) (42,996) (38,677) (32,112) (28,762)
247,800 199,586 222,689 264,258 987,913 823,810
229,812 137,968 105,579 59,047 66,148 97,812 (493,689) (454,134) (422,334) (391,870) (344,755) (336,725)
17,011 (3,741) (55) – 787 – – – – – – –
313,504 250,904 107,262 81,173 57,568 36,258 221,380 192,509 134,429 125,532 109,111 110,471 760,467 184,901 – – – –
11,310 17,469 14,336 13,396 34,501 19,892 (4,717) (6,832) – – (28,237) (11,556)
$1,302,878 $0,518,630 $0,161,906 $0,151,536 $0,883,036 $0,739,962

88
Schedule D-2 – Selected Statistical Debt Capacity Data
2011 2010 2009 2008
(In thousands) Gross Operating Revenues $03,800,480 $03,634,023 $03,552,243 $03,527,552 Operating expenses (2,564,969) (2,598,557) (2,438,670) (2,463,692) Net recoverables (expenses) related to the events of September 11, 2001 (a) – 53,051 202,978 457,918 Amounts in connection with operating asset obligations (29,580) (46,561) (55,058) (41,301)
Net operating revenues 1,205,931 1,041,956 1,261,493 1,480,477 Financial income (53,270) (900) 141,136 (19,537) Grants and contributions in aid-of-construction, net 499,516 367,810 392,471 319,759 Application of Passenger Facility Charges 215,645 207,122 205,164 215,407 Application of 4 WTC Association payments 8,343 – – – Application of 1WTC LLC/WTC LLC Retail Insurance Proceeds 57,340 61,468 266,676 411,278 Restricted Net Revenues – PAICE 644 (102) 3,177 (4,311)
Net Revenues available for debt service and reserves (b) 1,934,149 1,677,354 2,270,117 2,403,073
DEBT SERVICE – OPERATIONS Interest on bonds and other asset financing obligations (c) (480,623) (436,622) (427,384) (409,175) Debt Service Ratio * (b/c) 4.02 3.84 5.31 5.87 Debt maturities and retirements (d) (140,390) (178,095) (147,370) (152,275) Debt Service Ratio * [b/(c+d)] 3.11 2.73 3.95 4.28
APPLICATION OF RESERVES Direct investment in facilities (742,001) (1,375,008) (1,522,096) (1,514,369) Debt retirement acceleration (6,100) – – – Change in appropriations for self-insurance 1,949 (3,971) 6,463 2,123 Interest on bonds and other asset financing obligations (37,702) (7,580) (8,938) (28,797) Repayment of asset financing obligations (20,258) (30,062) (13,525) (80,775)
Net increase (decrease) in reserves 509,024 (353,984) 157,267 219,805
RESERVE BALANCES January 1 2,196,012 2,549,996 2,392,729 2,172,924
December 31 $02,705,036 $02,196,012 $02,549,996 $02,392,729
Reserve funds balances represented by: General Reserve 1,783,370 1,584,955 1,412,221 1,270,215 Consolidated Bond Reserve 921,666 611,057 1,137,775 1,122,514
Total $02,705,036 $02,196,012 $02,549,996 $02,392,729
OBLIGATIONS AT DECEMBER 31 Consolidated Bonds and Notes $15,550,039 $13,340,378 $12,284,449 $10,794,831 Fund Buy-out obligation 359,859 373,707 386,480 398,262 MOTBY obligation 105,141 138,396 – – Amounts payable – Special Project Bonds 1,741,440 1,803,145 1,064,380 1,118,105 Variable rate master notes 77,900 77,900 90,990 90,990 Commercial paper notes 396,155 354,280 321,010 186,040 Versatile structure obligations – 175,200 250,900 399,700 Port Authority equipment notes 68,160 98,645 110,485 112,485 Tower 4 Liberty Bonds 1,225,520 – – –
Total obligations $19,524,214 $16,361,651 $14,508,694 $13,100,413
DEBT RETIRED THROUGH INCOME: Annual 166,748 208,157 160,895 233,050 Cumulative $07,493,306 $07,326,558 $07,118,401 $06,957,506
* Debt service ratios excluding net (expenses) recoverables related to the events of September 11, 2001 are as follows:
Debt Service Ratio [(b-a)/c] 4.02 3.72 4.84 4.75 Debt Service Ratio [(b-a)/(c+d)] 3.11 2.64 3.60 3.46
Note: This selected financial data is prepared primarily from information contained in Schedules A, B and C and is presented for general informationonly and is not intended to reflect the specific applications of the revenues and reserves of the Port Authority, which are governed by statutes and its bond resolutions.
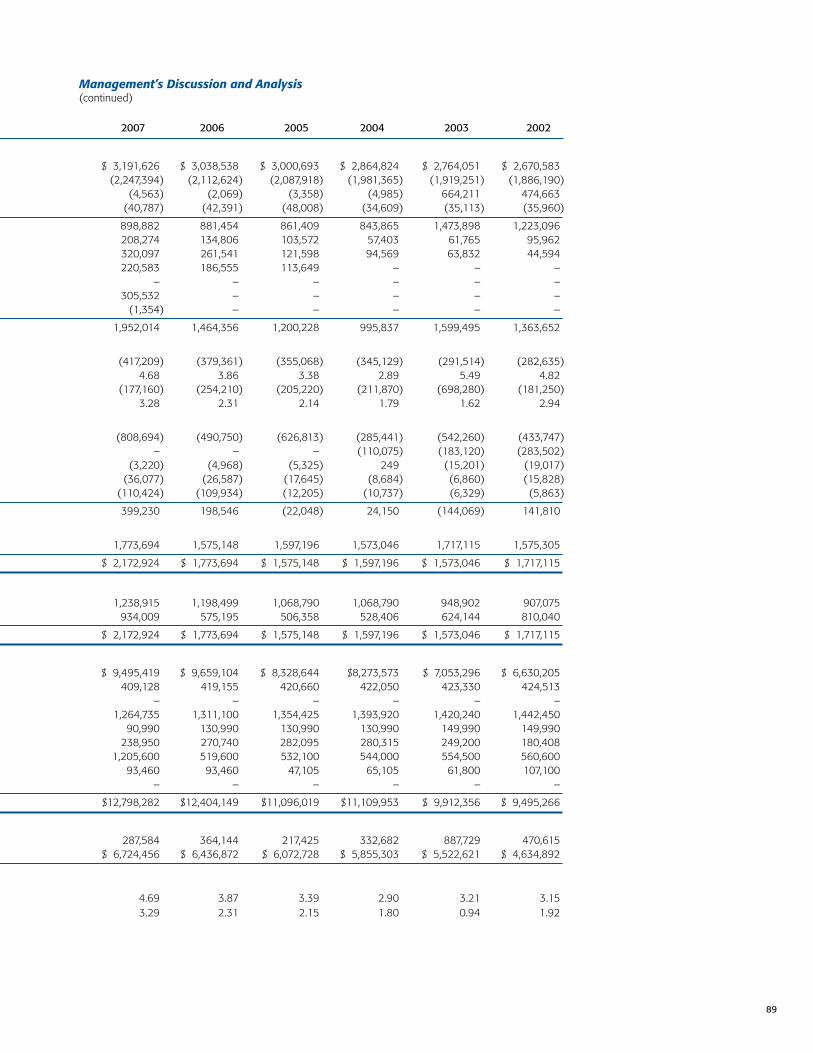
89
Management’s Discussion and Analysis(continued)
2007 2006 2005 2004 2003 2002
$03,191,626 $03,038,538 $03,000,693 $02,864,824 $02,764,051 $02,670,583
(2,247,394) (2,112,624) (2,087,918) (1,981,365) (1,919,251) (1,886,190) (4,563) (2,069) (3,358) (4,985) 664,211 474,663
(40,787) (42,391) (48,008) (34,609) (35,113) (35,960)
898,882 881,454 861,409 843,865 1,473,898 1,223,096 208,274 134,806 103,572 57,403 61,765 95,962 320,097 261,541 121,598 94,569 63,832 44,594 220,583 186,555 113,649 – – –
– – – – – – 305,532 – – – – –
(1,354) – – – – –
1,952,014 1,464,356 1,200,228 995,837 1,599,495 1,363,652
(417,209) (379,361) (355,068) (345,129) (291,514) (282,635) 4.68 3.86 3.38 2.89 5.49 4.82
(177,160) (254,210) (205,220) (211,870) (698,280) (181,250) 3.28 2.31 2.14 1.79 1.62 2.94
(808,694) (490,750) (626,813) (285,441) (542,260) (433,747) – – – (110,075) (183,120) (283,502)
(3,220) (4,968) (5,325) 249 (15,201) (19,017) (36,077) (26,587) (17,645) (8,684) (6,860) (15,828)
(110,424) (109,934) (12,205) (10,737) (6,329) (5,863)
399,230 198,546 (22,048) 24,150 (144,069) 141,810
1,773,694 1,575,148 1,597,196 1,573,046 1,717,115 1,575,305
$02,172,924 $01,773,694 $01,575,148 $01,597,196 $01,573,046 $01,717,115
1,238,915 1,198,499 1,068,790 1,068,790 948,902 907,075 934,009 575,195 506,358 528,406 624,144 810,040
$02,172,924 $01,773,694 $01,575,148 $01,597,196 $01,573,046 $01,717,115
$09,495,419 $09,659,104 $08,328,644 0$8,273,573 $07,053,296 $06,630,205 409,128 419,155 420,660 422,050 423,330 424,513
– – – – – – 1,264,735 1,311,100 1,354,425 1,393,920 1,420,240 1,442,450
90,990 130,990 130,990 130,990 149,990 149,990 238,950 270,740 282,095 280,315 249,200 180,408
1,205,600 519,600 532,100 544,000 554,500 560,600 93,460 93,460 47,105 65,105 61,800 107,100
– – – – – –
$12,798,282 $12,404,149 $11,096,019 $11,109,953 $09,912,356 $09,495,266
287,584 364,144 217,425 332,682 887,729 470,615 $06,724,456 $06,436,872 $06,072,728 $05,855,303 $05,522,621 $04,634,892
4.69 3.87 3.39 2.90 3.21 3.15 3.29 2.31 2.15 1.80 0.94 1.92
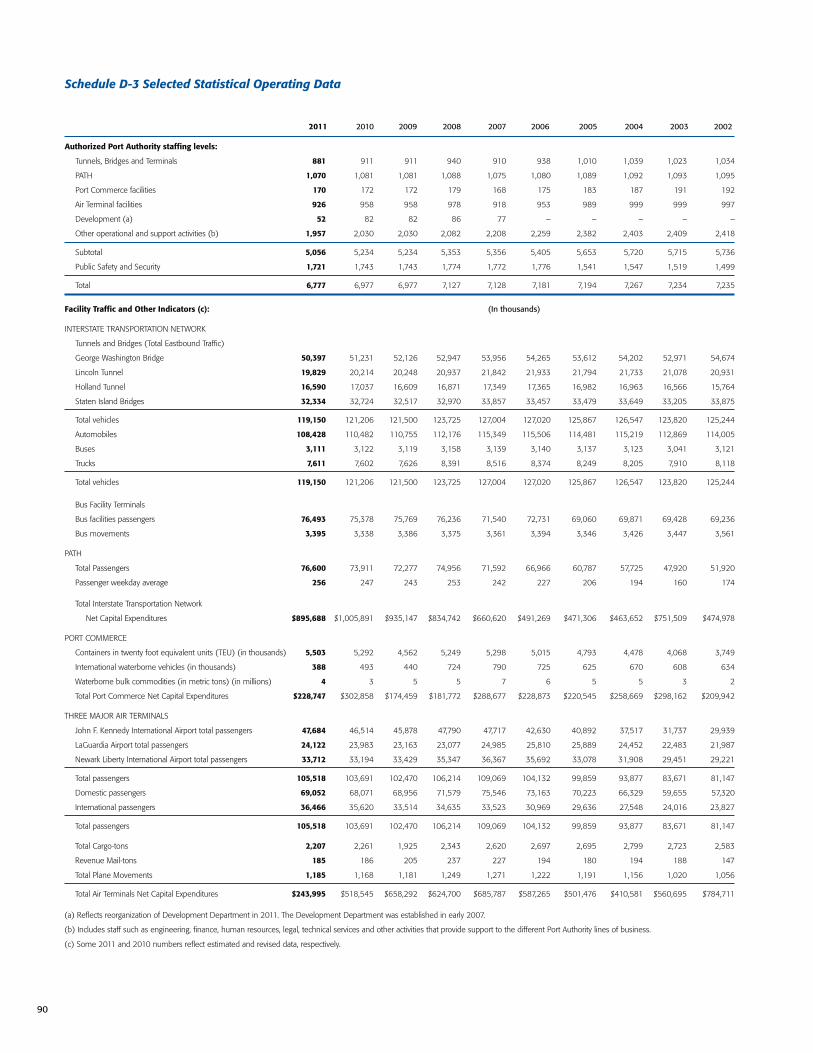
90
2011 2010 2009 2008 2007 2006 2005 2004 2003 2002
Schedule D-3 Selected Statistical Operating Data
Authorized Port Authority staffing levels:
Tunnels, Bridges and Terminals 881 911 911 940 910 938 1,010 1,039 1,023 1,034
PATH 1,070 1,081 1,081 1,088 1,075 1,080 1,089 1,092 1,093 1,095
Port Commerce facilities 170 172 172 179 168 175 183 187 191 192
Air Terminal facilities 926 958 958 978 918 953 989 999 999 997
Development (a) 52 82 82 86 77 – – – – –
Other operational and support activities (b) 1,957 2,030 2,030 2,082 2,208 2,259 2,382 2,403 2,409 2,418
Subtotal 5,056 5,234 5,234 5,353 5,356 5,405 5,653 5,720 5,715 5,736
Public Safety and Security 1,721 1,743 1,743 1,774 1,772 1,776 1,541 1,547 1,519 1,499
Total 6,777 6,977 6,977 7,127 7,128 7,181 7,194 7,267 7,234 7,235
Facility Traffic and Other Indicators (c): (In thousands)
INTERSTATE TRANSPORTATION NETWORK
Tunnels and Bridges (Total Eastbound Traffic)
George Washington Bridge 50,397 51,231 52,126 52,947 53,956 54,265 53,612 54,202 52,971 54,674
Lincoln Tunnel 19,829 20,214 20,248 20,937 21,842 21,933 21,794 21,733 21,078 20,931
Holland Tunnel 16,590 17,037 16,609 16,871 17,349 17,365 16,982 16,963 16,566 15,764
Staten Island Bridges 32,334 32,724 32,517 32,970 33,857 33,457 33,479 33,649 33,205 33,875
Total vehicles 119,150 121,206 121,500 123,725 127,004 127,020 125,867 126,547 123,820 125,244
Automobiles 108,428 110,482 110,755 112,176 115,349 115,506 114,481 115,219 112,869 114,005
Buses 3,111 3,122 3,119 3,158 3,139 3,140 3,137 3,123 3,041 3,121
Trucks 7,611 7,602 7,626 8,391 8,516 8,374 8,249 8,205 7,910 8,118
Total vehicles 119,150 121,206 121,500 123,725 127,004 127,020 125,867 126,547 123,820 125,244
Bus Facility Terminals
Bus facilities passengers 76,493 75,378 75,769 76,236 71,540 72,731 69,060 69,871 69,428 69,236
Bus movements 3,395 3,338 3,386 3,375 3,361 3,394 3,346 3,426 3,447 3,561
PATH
Total Passengers 76,600 73,911 72,277 74,956 71,592 66,966 60,787 57,725 47,920 51,920
Passenger weekday average 256 247 243 253 242 227 206 194 160 174
Total Interstate Transportation Network
Net Capital Expenditures $895,688 $1,005,891 $935,147 $834,742 $660,620 $491,269 $471,306 $463,652 $751,509 $474,978
PORT COMMERCE
Containers in twenty foot equivalent units (TEU) (in thousands) 5,503 5,292 4,562 5,249 5,298 5,015 4,793 4,478 4,068 3,749
International waterborne vehicles (in thousands) 388 493 440 724 790 725 625 670 608 634
Waterborne bulk commodities (in metric tons) (in millions) 4 3 5 5 7 6 5 5 3 2
Total Port Commerce Net Capital Expenditures $228,747 $302,858 $174,459 $181,772 $288,677 $228,873 $220,545 $258,669 $298,162 $209,942
THREE MAJOR AIR TERMINALS
John F. Kennedy International Airport total passengers 47,684 46,514 45,878 47,790 47,717 42,630 40,892 37,517 31,737 29,939
LaGuardia Airport total passengers 24,122 23,983 23,163 23,077 24,985 25,810 25,889 24,452 22,483 21,987
Newark Liberty International Airport total passengers 33,712 33,194 33,429 35,347 36,367 35,692 33,078 31,908 29,451 29,221
Total passengers 105,518 103,691 102,470 106,214 109,069 104,132 99,859 93,877 83,671 81,147
Domestic passengers 69,052 68,071 68,956 71,579 75,546 73,163 70,223 66,329 59,655 57,320
International passengers 36,466 35,620 33,514 34,635 33,523 30,969 29,636 27,548 24,016 23,827
Total passengers 105,518 103,691 102,470 106,214 109,069 104,132 99,859 93,877 83,671 81,147
Total Cargo-tons 2,207 2,261 1,925 2,343 2,620 2,697 2,695 2,799 2,723 2,583
Revenue Mail-tons 185 186 205 237 227 194 180 194 188 147
Total Plane Movements 1,185 1,168 1,181 1,249 1,271 1,222 1,191 1,156 1,020 1,056
Total Air Terminals Net Capital Expenditures $243,995 $518,545 $658,292 $624,700 $685,787 $587,265 $501,476 $410,581 $560,695 $784,711
(a) Reflects reorganization of Development Department in 2011. The Development Department was established in early 2007.
(b) Includes staff such as engineering, finance, human resources, legal, technical services and other activities that provide support to the different Port Authority lines of business.
(c) Some 2011 and 2010 numbers reflect estimated and revised data, respectively.
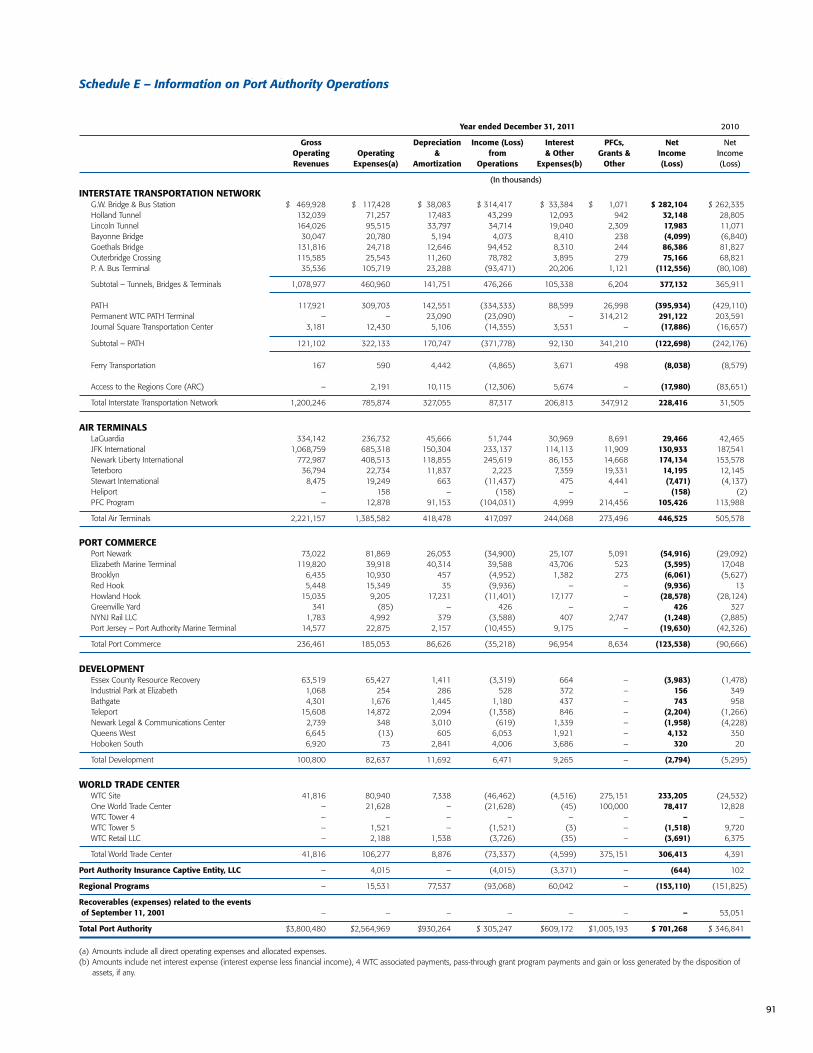
91
Management’s Discussion and Analysis(continued)Schedule E – Information on Port Authority Operations
Year ended December 31, 2011 2010
Gross Depreciation Income (Loss) Interest PFCs, Net Net Operating Operating & from & Other Grants & Income Income Revenues Expenses(a) Amortization Operations Expenses(b) Other (Loss) (Loss)
(In thousands)
INTERSTATE TRANSPORTATION NETWORK G.W. Bridge & Bus Station $0,469,928 $0,117,428 $038,083 $(314,417 $033,384 $0.001,071 $(282,104 $(262,335 Holland Tunnel 132,039 71,257 17,483 43,299 12,093 942 32,148 28,805 Lincoln Tunnel 164,026 95,515 33,797 34,714 19,040 2,309 17,983 11,071 Bayonne Bridge 30,047 20,780 5,194 4,073 8,410 238 (4,099) (6,840) Goethals Bridge 131,816 24,718 12,646 94,452 8,310 244 86,386 81,827 Outerbridge Crossing 115,585 25,543 11,260 78,782 3,895 279 75,166 68,821 P. A. Bus Terminal 35,536 105,719 23,288 (93,471) 20,206 1,121 (112,556) (80,108)
Subtotal – Tunnels, Bridges & Terminals 1,078,977 460,960 141,751 476,266 105,338 6,204 377,132 365,911
PATH 117,921 309,703 142,551 (334,333) 88,599 26,998 (395,934) (429,110) Permanent WTC PATH Terminal – – 23,090 (23,090) – 314,212 291,122 203,591 Journal Square Transportation Center 3,181 12,430 5,106 (14,355) 3,531 – (17,886) (16,657)
Subtotal – PATH 121,102 322,133 170,747 (371,778) 92,130 341,210 (122,698) (242,176)
Ferry Transportation 167 590 4,442 (4,865) 3,671 498 (8,038) (8,579)
Access to the Regions Core (ARC) – 2,191 10,115 (12,306) 5,674 – (17,980) (83,651)
Total Interstate Transportation Network 1,200,246 785,874 327,055 87,317 206,813 347,912 228,416 31,505
AIR TERMINALS LaGuardia 334,142 236,732 45,666 51,744 30,969 8,691 29,466 42,465 JFK International 1,068,759 685,318 150,304 233,137 114,113 11,909 130,933 187,541 Newark Liberty International 772,987 408,513 118,855 245,619 86,153 14,668 174,134 153,578 Teterboro 36,794 22,734 11,837 2,223 7,359 19,331 14,195 12,145 Stewart International 8,475 19,249 663 (11,437) 475 4,441 (7,471) (4,137) Heliport – 158 – (158) – – (158) (2) PFC Program – 12,878 91,153 (104,031) 4,999 214,456 105,426 113,988
Total Air Terminals 2,221,157 1,385,582 418,478 417,097 244,068 273,496 446,525 505,578
PORT COMMERCE Port Newark 73,022 81,869 26,053 (34,900) 25,107 5,091 (54,916) (29,092) Elizabeth Marine Terminal 119,820 39,918 40,314 39,588 43,706 523 (3,595) 17,048 Brooklyn 6,435 10,930 457 (4,952) 1,382 273 (6,061) (5,627) Red Hook 5,448 15,349 35 (9,936) – – (9,936) 13 Howland Hook 15,035 9,205 17,231 (11,401) 17,177 – (28,578) (28,124) Greenville Yard 341 (85) – 426 – – 426 327 NYNJ Rail LLC 1,783 4,992 379 (3,588) 407 2,747 (1,248) (2,885) Port Jersey – Port Authority Marine Terminal 14,577 22,875 2,157 (10,455) 9,175 – (19,630) (42,326)
Total Port Commerce 236,461 185,053 86,626 (35,218) 96,954 8,634 (123,538) (90,666)
DEVELOPMENT Essex County Resource Recovery 63,519 65,427 1,411 (3,319) 664 – (3,983) (1,478) Industrial Park at Elizabeth 1,068 254 286 528 372 – 156 349 Bathgate 4,301 1,676 1,445 1,180 437 – 743 958 Teleport 15,608 14,872 2,094 (1,358) 846 – (2,204) (1,266) Newark Legal & Communications Center 2,739 348 3,010 (619) 1,339 – (1,958) (4,228) Queens West 6,645 (13) 605 6,053 1,921 – 4,132 350 Hoboken South 6,920 73 2,841 4,006 3,686 – 320 20
Total Development 100,800 82,637 11,692 6,471 9,265 – (2,794) (5,295)
WORLD TRADE CENTER WTC Site 41,816 80,940 7,338 (46,462) (4,516) 275,151 233,205 (24,532) One World Trade Center – 21,628 – (21,628) (45) 100,000 78,417 12,828 WTC Tower 4 – – – – – – – – WTC Tower 5 – 1,521 – (1,521) (3) – (1,518) 9,720 WTC Retail LLC – 2,188 1,538 (3,726) (35) – (3,691) 6,375
Total World Trade Center 41,816 106,277 8,876 (73,337) (4,599) 375,151 306,413 4,391
Port Authority Insurance Captive Entity, LLC – 4,015 – (4,015) (3,371) – (644) 102
Regional Programs – 15,531 77,537 (93,068) 60,042 – (153,110) (151,825)
Recoverables (expenses) related to the events of September 11, 2001 – – – – – – – 53,051
Total Port Authority $3,800,480 $2,564,969 $930,264 $(305,247 $609,172 $1,005,193 $(701,268 $(346,841
(a) Amounts include all direct operating expenses and allocated expenses.(b) Amounts include net interest expense (interest expense less financial income), 4 WTC associated payments, pass-through grant program payments and gain or loss generated by the disposition of
assets, if any.

92
Schedule F – Information on Port Authority Capital Program Components
Net Facilities, net Capital Facilities, net Dec. 31, 2010 Expenditures Depreciation Dec. 31, 2011
(In thousands)
INTERSTATE TRANSPORTATION NETWORK G.W. Bridge & Bus Station $ 806,313 $ 46,981 $ 38,084 $ 815,210 Holland Tunnel 366,602 19,229 17,483 368,348 Lincoln Tunnel 459,068 34,778 33,797 460,049 Bayonne Bridge 184,733 12,467 5,194 192,006 Goethals Bridge 253,408 18,081 12,646 258,843 Outerbridge Crossing 86,931 2,272 11,260 77,943 P. A. Bus Terminal 472,062 34,951 23,288 483,725
Subtotal – Tunnels, Bridges & Terminals 2,629,117 168,759 141,752 2,656,124
PATH 1,775,477 332,189 133,918 1,973,748 Temporary WTC PATH Station 312,882 – 8,634 304,248 WTC Transportation Hub 1,747,811 382,272 23,090 2,106,993 Journal Square Transportation Center 90,744 6,336 5,106 91,974
Subtotal – PATH 3,926,914 720,797 170,748 4,476,963
Ferry Transportation 123,945 6,132 4,442 125,635 Access to the Region’s Core (ARC) 128,848 – 10,115 118,733
Total Interstate Transportation Network 6,808,824 895,688 327,057 7,377,455
AIR TERMINALS LaGuardia 851,348 (5,517) 45,665 800,166 JFK International 2,594,767 (36,314) 150,304 2,408,149 Newark Liberty International 1,918,001 54,489 118,855 1,853,635 Teterboro 214,952 23,702 11,837 226,817 Stewart International 51,322 8,668 663 59,327 Heliport – – – – PFC Program 1,928,486 198,967 91,153 2,036,300
Total Air Terminals 7,558,876 243,995 418,477 7,384,394
PORT COMMERCE Port Newark 622,200 77,932 26,053 674,079 Elizabeth Marine Terminal 1,059,903 71,305 40,314 1,090,894 Brooklyn 34,764 4,619 457 38,926 Red Hook 216 (23) 35 158 Howland Hook 465,792 65,210 17,231 513,771 Greenville Yard / NYNJ Rail LLC 10,641 2,872 379 13,134 Port Jersey – Port Authority Marine Terminal 169,361 6,832 2,157 174,036
Total Port Commerce 2,362,877 228,747 86,626 2,504,998
DEVELOPMENT Essex County Resource Recovery 12,701 – 1,410 11,291 Industrial Park at Elizabeth 7,514 – 286 7,228 Bathgate 9,596 – 1,445 8,151 Teleport 19,070 57 2,094 17,033 Newark Legal & Communications Center 29,422 – 3,010 26,412 Queens West 89,063 (1) 605 88,457 Hoboken South 82,775 – 2,841 79,934 PreDevelopment Site Acquisition 26,612 (26,612) – –
Total Development 276,753 (26,556) 11,691 238,506
WORLD TRADE CENTER WTC Site 1,154,379 578,379 6,533 1,726,225 One World Trade Center 1,291,429 629,950 – 1,921,379 WTC Towers 2, 3 & 4 494,215 565,575 – 1,059,790 WTC Memorial 215,742 71,150 805 286,087 WTC Retail LLC 394,305 242,687 1,538 635,454
Total World Trade Center 3,550,070 2,087,741 8,876 5,628,935
FACILITIES, NET $20,557,400 $3,429,615 $852,727 $23,134,288
REGIONAL PROGRAMS $ 694,388 $ 3,332 $ 77,537 $ 620,183

93
Management’s Discussion and Analysis(continued)Schedule G – Port Authority Facility Traffic*
TUNNELS AND BRIDGES(Eastbound Traffic) 2011 2010
All CrossingsAutomobiles 108,428,000 110,482,000 Buses 3,111,000 3,122,000 Trucks 7,611,000 7,602,000 Total vehicles 119,150,000 121,206,000
George Washington BridgeAutomobiles 46,116,000 46,954,000 Buses 487,000 514,000 Trucks 3,794,000 3,763,000 Total vehicles 50,397,000 51,231,000
Lincoln TunnelAutomobiles 16,644,000 17,034,000 Buses 2,156,000 2,139,000 Trucks 1,029,000 1,041,000 Total vehicles 19,829,000 20,214,000
Holland TunnelAutomobiles 15,968,000 16,460,000 Buses 268,000 265,000 Trucks 354,000 312,000 Total vehicles 16,590,000 17,037,000
Staten Island BridgesAutomobiles 29,700,000 30,034,000 Buses 200,000 204,000 Trucks 2,434,000 2,486,000 Total vehicles 32,334,000 32,724,000
PATH 2011 2010
Total passengers 76,600,000 73,911,000 Passenger weekday average 256,186 246,890
MARINE TERMINALS 2011 2010
All TerminalsContainers 3,197,016 3,076,395 General cargo (a) (Metric tons) 33,954,000 32,170,041 Containers in twenty foot equivalent units 5,503,485 5,292,020 International waterborne vehicles 387,656 493,245 Waterborne bulk commodities (in metric tons) 3,885,614 3,192,132
New Jersey Marine TerminalsContainers 2,652,744 2,500,503
New York Marine TerminalsContainers 544,272 575,892
AIR TERMINALS 2011 2010
Totals at the Major AirportsPlane movements 1,185,419 1,167,849 Passengers 105,518,365 103,691,426 Cargo-tons 2,206,611 2,261,352 Revenue mail-tons 185,228 185,681
John F. Kennedy International Airport Plane movements 409,383 396,912 Passengers 47,683,529 46,514,154 Domestic 23,763,046 23,404,277 International 23,920,483 23,109,877 Cargo-tons 1,387,330 1,392,866
LaGuardia AirportPlane movements 365,896 361,616 Passengers 24,122,478 23,983,082 Domestic 23,086,756 22,950,115 International 1,035,722 1,032,967 Cargo-tons 7,292 7,516
Newark Liberty International AirportPlane movements 410,140 409,321 Passengers 33,712,358 33,194,190 Domestic 22,202,662 21,716,886 International 11,509,696 11,477,304 Cargo-tons 811,989 860,970
TERMINALS 2011 2010
All Bus FacilitiesPassengers 76,493,000 75,377,900 Bus movements 3,395,000 3,338,300
Port Authority Bus TerminalPassengers 64,550,000 63,585,000 Bus movements 2,263,500 2,220,000
George Washington Bridge Bus StationPassengers 4,605,000 4,510,000 Bus movements 307,000 300,000
PATH Journal Square Transportation Center Bus StationPassengers 7,338,000 7,282,900 Bus movements 824,500 818,300
* Some 2011 and 2010 numbers reflect estimated and revised data, respectively.
(a) International oceanborne general cargo as recorded in the
New York — New Jersey Customs District.

94
Selected Statistical Demographic and Economic Data
The New York-New Jersey Metropolitan Region, one of the largest and most diversified in the nation, consists of the five New York boroughs of Manhattan, Brooklyn, Queens, Staten Island and The Bronx; the four suburban counties of Nassau, Rockland, Suffolk and Westchester; and the nine northern New Jersey counties of Bergen, Essex, Hudson, Middlesex, Morris, Monmouth, Passaic, Somerset and Union. The following demographic information is provided for this eighteen county region that comprises approximately 4,500 square miles.
Total Per-capita Unemployment Population Personal Income Personal Income Employment Rate
($ In millions)
2011 (1) 17,995 1,049,161,352 $58.30 8,047.6 8.0% 2010 17,908 990,278,074 $55.30 8,020.4 8.9% 2009 17,792 951,053,352 $53.46 8,033.1 8.8% 2008 17,667 986,584,077 $55.84 8,312.4 5.2% 2007 17,572 967,452,261 $55.06 8,285.2 4.4% 2006 17,543 900,205,499 $51.31 8,160.2 4.6% 2005 17,581 824,375,637 $46.89 8,067.6 4.9% 2004 17,617 776,698,639 $44.09 8,012.0 5.8% 2003 17,628 728,854,291 $41.35 7,981.4 6.7% 2002 17,597 716,005,153 $40.69 8,012.1 6.5% 2001 17,538 714,995,567 $40.77 8,148.4 5.0%
Leading employment by major industries (% of total) (2)
2011 2002
Education & Health Services 18.6% 15.8% Government 15.0% 15.1% Retail Trade 15.5% 15.1% Financial Activities 9.9% 9.8% Professional & Business Services 9.0% 9.5% Leisure & Hospitality 8.2% 6.8% Manufacturing 4.3% 6.7% Wholesale Trade 4.8% 5.3% Other Services 4.2% 4.1% TWU* 3.7% 3.9% Construction 3.4% 3.9% Information 3.2% 3.9%
Source – Moody’s Analytics (1) Data for 2011 is preliminary and subject to revision.(2) Industry definitions can be found at the US Department of Labor Statistics website at www.bls.gov/bls/naics.htm.
* Transportation, Warehousing and Utilities

33
Patrick FoyeExecutive DirectorBase salary: $289,6672011 total compensation: $27,853J.D., Fordham Law School; B.A., Fordham CollegeMore than 30 years of private sector, legal and publicsector management experience.
Bill BaroniDeputy Executive DirectorBase salary: $289,6672011 total compensation: $291,100J.D., University of VirginiaB.A., George Washington UniversityMore than 13 years of legal and legislative experience.
Darrell B. BuchbinderGeneral CounselBase salary: $276,9262011 total compensation: $316,220J.D. and B.A., New York UniversityMore than 35 years of experience in both private and public practice of law.
Louis J. LaCapraChief Administrative OfficerBase salary: $251,7582011 total compensation: $350,405M.S., New Jersey Institute of TechnologyMBA, New York University; B.S., Rutgers UniversityMore than 40 years of public experience in labor relations and human resources.
David B. TweedyChief, Capital PlanningBase salary: $251,7582011 total compensation: $261,443MBA, Columbia University; B.A., Yale UniversityMore than 30 years of experience in the public and private sectors.
Michael G. FabianoChief Financial OfficerBase salary: $240,0322011 total compensation: $279,361B.S., St. Peter’s CollegeMore than 30 years of experience in financial services.
Steven P. PlateDirector, WTC ConstructionBase salary: $238,0042011 total compensation: $258,825B.S., Manhattan CollegeMore than 30 years of experience in programmanagement in the private and public sectors.
Michael B. FrancoisChief, Real Estate & DevelopmentBase salary: $236,3402011 total compensation: $245,430M.A., St. Louis University; B.A., St. Louis UniversityMore than 30 years of public experience in real estate and economic development.
Susan M. BaerDirector, AviationBase salary: $230,0222011 total compensation: $257,802MBA, New York University; B.A., Barnard CollegeMore than 30 years of public experience in transportation operations.
Peter J. ZipfChief EngineerBase salary: $219,0502011 total compensation: $239,895M.S., Polytechnic Institute of NYB.S., Manhattan CollegeMore than 30 years of engineering experience in the public and private sector.
Richard M. LarrabeeDirector, Port CommerceBase salary: $216,3202011 total compensation: $216,320M.S., University of Rhode IslandB.S., U.S. Coast Guard AcademyMore than 35 years of public experience in maritime operations.
Alan L. ReissDeputy Director, WTC ConstructionBase salary: $215,2802011 total compensation: $241,114B.S., Northeastern UniversityMore than 30 years of engineering, project management, and executive management experience.
Michael A. FedorkoDirector, Public Safety/Superintendent of PoliceBase salary: $215,0982011 total compensation: $215,098B.S., Trenton State CollegeMore than 40 years of public safety and publicmanagement experience.
Anne Marie C. MulliganTreasurerBase salary: $215,0202011 total compensation: $246,281B.S., St. Peter’s CollegeMore than 30 years of public experience in financial services.
Michael G. MassiahDirector, Management & BudgetBase salary: $215,0202011 total compensation: $220,147MPA, SUNY Albany; B.A., LeMoyne CollegeMore than 29 years of public experience in human resources and financial services.
Michael P. DePalloDirector, Rail TransitBase salary: $215,0202011 total compensation: $236,522M.S., University of PennsylvaniaB.A., Mansfield UniversityMore than 30 years of public experiencein transportation.
Andrew S. LynnDirector, Planning & Regional DevelopmentBase salary: $215,0202011 total compensation: $215,020J.D. and B.A., Harvard UniversityMore than 25 years of public and privateexperience in planning and development.
Mark D. HofferDirector, New Port InitiativesBase salary: $210,6522011 total compensation: $210,652J.D., Yale University; B.A., Queens CollegeMore than 30 years of public and privatelegal and management experience.
Philippe B. VisserDirector, World Trade Center RedevelopmentBase salary: $210,0022011 total compensation: $205,364MBA., Columbia Business SchoolM.S., London School of EconomicsB.A., University of PennsylvaniaOver 15 years of experience in real estate development and finance in the private and public sectors.
Richard D. GladstoneSenior Advisor to the Director of Planningand Regional DevelopmentBase salary: $210,0022011 total compensation: $210,002MBA., The Wharton School, University of PennsylvaniaM.Arch., School of Architecture, Princeton UniversityB.A., in Architecture, Princeton UniversityMore than 25 years of experience in real estatedevelopment, design and construction management.
Top 20 Salaried Staff*
95
* As of December 31, 2011; active staff as of April 16, 2012

34
The entirety of this year’s Annual Report has been printed on recycled materials and certified by the Forest Stewardship Council. The Port Authority of New York and New Jersey is committed to preserving the environment and reducing its environmental impact. The Port Authority’s green initiatives include promotion of clean air, alternative fuel vehicles, mass transit and energy conservation efforts.
Managing Editor: David McGrathPublic Affairs Staff: Maureen McManus Financial Editors: Heekyung Cho, Erin MonaghanFinancial Section: Michael Ambrosio, Philip Caffrey, Jaime KournidakisProduction Supervision: Flory DanishStaff Photography: Wallace Chan, John Denise, Mike Dombrowski, Alan HicksConcept and Design: Candace Bexell-Oukacine
On page 2: “linkin tunnel 2 Photo,” © 2006 Pawel Loj (limaoscarjuliet), used under a Creative Commons Attribution-ShareAlike license: http://creativecommons.org/licenses/by/2.0/deed.en
On page 28: photo by Paul Warchol
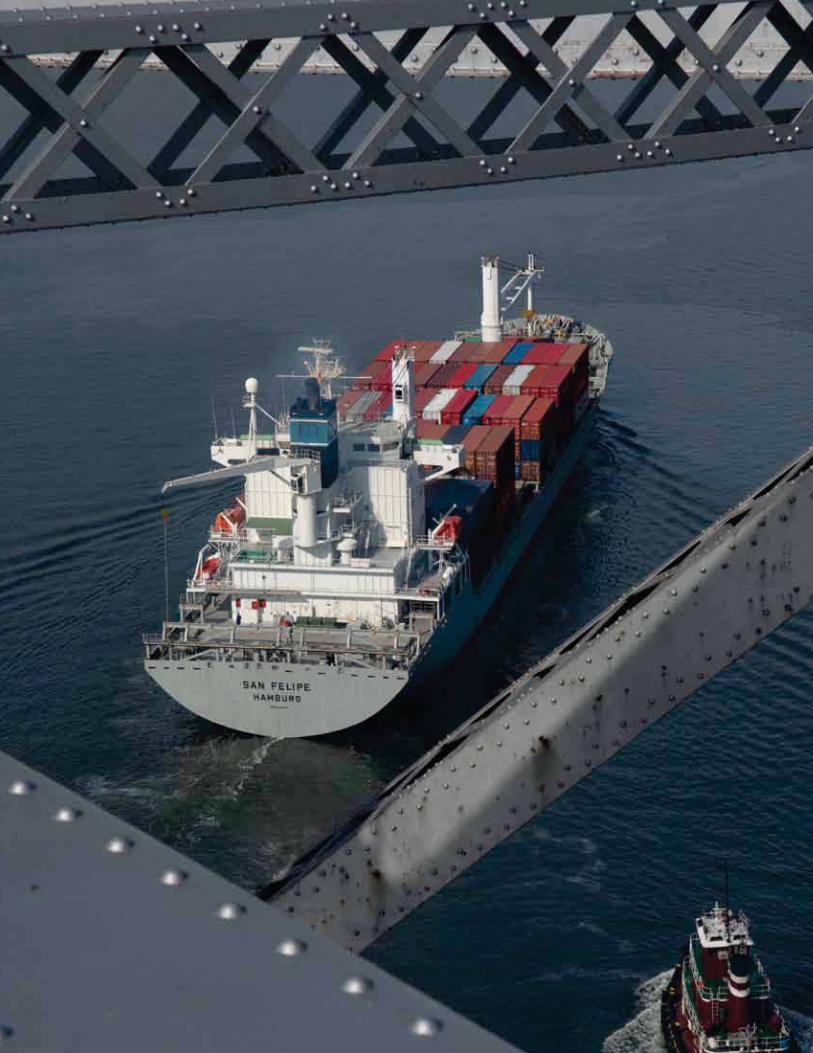

225 Park Avenue South, New York, NY 10003www.panynj.gov