annual report 2008-09
DESCRIPTION
Annual Report 2008-09TRANSCRIPT

To go on-line, go to: www.sccassessor.org
Lawrence E. Stone, Assessor$ 316,515,914,258
2008-2009Annual Report
Office of the County AssessorLawrence E. Stone, Assessor

Alfredo Semene Andy Wu Anita Badger Annabelle Alquiza Annie Wai-Foong Leung Anthony Rao Antonio Sanchez Arika Owens AshokGupta Barry Eng Benjamin Victorino Bertha Legorreta Besilda Mascardo Beverly Brown Bien Abordo Bordon Chin BrendaCantrell Brian Lombard Brian O'Neill Bruce Glenday Carlos Cansino Jr. Carmen Cortes Carol Callahan Carol RivasCelerina Celeste Charles Mirrasoul Charles Steed Charmaine Cabuag Cheryl McCloskey Ching-Fu Lan Chi-Perng LeeChristine Swensen Christopher Hughes Chuong Tran Clint Nottingham Clyde Wong Conrad Chen Craig Cooper CraigDavies Cristina Thomas Cristina Torio Curt Kendall Cynthia Bartolino Dae-Sun Kang Daniel Collins Darleen Yamaki DavidBethel David Ginsborg David King David Liu David Shank David Wierzba Dayle Murphy Deborah Chavez Deborah DiniDebra Ross Delia Rivas Denise Barry Diane Paskert Edward Palacio Eleanor Parker Elizabeth Samaro Eric Matsuda EricZamudio Fe Escalante Federico Baltazar Florlinda Gonzales Ford Sandberg Francisco Diaz Frank Giordano Fraser Louie Geemin FongGemma Foster Generoso Almerido George Beckner George Miller Gilbert Lee Gloria Brown Grace Quilty Grace Tolentino GregoryMonteverde Guillermo Young Gumersindo Zavala Heather Hong Tran Helen Silva Hemlata Khiani Hollis Holladay Huong Thi Dinh HyungSong Imelda Pea Indira Ebenezer Ing-Ning Lin JackieVentimiglia Jacquelyn Cantu Jae Ryoung Choe James AbeJames DiTomaso James Fredrickson Jamie HillJanene Pratt Jared Gregory Jeanette Tonini Jeffrey BarlowJeffrey Kwan Jenny Huynh Jocelyn Champlin Joey Kimpo
John Maag John Recchio JohnSleeman Jon B r e d e s o nJosefina Olivarez Joseph GarciaJoseph Machado Joy Tsai JuanSchiappacasse Judy EpsteinJulius Ho J y o t i rma y eePendse Karen M c P h e r s o n
Kathleen LeGrande Kenneth Green Kevin Tanner KhanhTran Kimberly Starrett Kimhong Tang Kristen LegluLarrySteven Suehiro Laura Colunga Laura ScottLawrence Stone Laynette Blackfield Lesley Pak LeslieKennedy Lilia Yalong Linda Aguilar Linda Brown LisaCortez Lisa Wong Lisette Rodriguez Lorna GabonLydia Paquiz Madan Ganti Mai Bang Manuel MandapatManuela Gonzalez Manuela Rosalez Maria Manesis MariaSarabia Maria Theresa Trinidad Marian Shank Marian StewartMarianne Suriaga Marie Fuentes Martin ReindersMary Dam Nguyen Mary Fasching Mary Solseng MattMoore Matthew Leslie Maureen Cowan Medel Angel MeiChou Melissa Kong Melody Luong Michael BautistaMichelle Zaffa Mohit Sabherwal Monique Hackett MurrayHartmann Naren Shah Natalie Tran Neeraj Bhardwaj NgocTan Huynh Nicole Tran Nora Galvez Oscar Amaya PamelaHopkins Pamela Umeda Patrici Murrieta-Santillanez PatriciaBarber Patrick Tisdale Pauline Coleman Peter van der PasPhu Van Phan Ramon De La Cruz Raphael ThomasRaymond Bramlette Rebecca Ross Renee Rodriguez Rey
Eugenio Rhonda A r m s t r o n gRichard Cloyd Richard FisherRichard Leong R i c h a r dM e n d o z a Richard XavierRichelle Feldan- Cayol RitaMedina Robert K i nde r l eh re rRobert Madrid II R o b e r t
McKibbin Robert Norman Robert Wellner Roger YamatRoland Child Romeo Rodriguez Rosalyn McLain Rosita DonesRudy Baya Salvador Gutierrez Jr Sandra Emerson Sang Au Sean Cooper Selu Sataraka Shalini Agrawal Shannon Rice Stephanie PerezStephen Buckley Sue-ee Lai Susan Murphy Susan Vasconcelos Susan Vigilante Susie Wang Suzanne Lambrecht Sylvia Pedraza TaraThomas Teresa Gonzalez Theresa Cisneros Theresa Montenegro Thida Lim-Santos Tiffany Ming Tommy Shing Tony Duong Tracy MartinezTri Huynh Trinh Hoai Luu-Nguyen Trong-Quyen Nguyen Tuan Au Tuan Le Vanessa Barkin Victoria Byrd Virginia Hale Xuan Huong Thi PhamYiichern Shiah Yvette Briddell Li Zhao
Table of ContentsMessage from the Assessor . . . . . . . . . . . . . . . . . . . . . . . . . . . . . . . . .1
Factors Causing Change to the Assessment Roll . . . . . . . . . . . . . . . .3
Largest Taxpayers/How Tax Bills are Calculated & Allocated . . . . . . .5
Assessment Roll . . . . . . . . . . . . . . . . . . . . . . . . . . . . . . . . . . . . . . . .6
Supplemental Assessments . . . . . . . . . . . . . . . . . . . . . . . . . . . . . . . . .8
Assessment Information by City . . . . . . . . . . . . . . . . . . . . . . . . . . . .9
Summary of Bay Area Counties Roll Comparison . . . . . . . . . . . . . .12
Exemptions . . . . . . . . . . . . . . . . . . . . . . . . . . . . . . . . . . . . . . . . . . .13
Proposition 8 . . . . . . . . . . . . . . . . . . . . . . . . . . . . . . . . . . . . . . . . . .14
Proposition 13 . . . . . . . . . . . . . . . . . . . . . . . . . . . . . . . . . . . . . . . .16
Department Overview . . . . . . . . . . . . . . . . . . . . . . . . . . . . . . . . . . .18
Assessment Information by Property Type . . . . . . . . . . . . . . . . . . . .20
Change in Ownership/New Construction by City/Property Type . .22
Major New Construction/Changes in Ownership . . . . . . . . . . . . . .23
Assessed Value by City/School District/Property Type . . . . . . . . . . .24
Assessment Appeals . . . . . . . . . . . . . . . . . . . . . . . . . . . . . . . . . . . . .28
Performance Counts . . . . . . . . . . . . . . . . . . . . . . . . . . . . . . . . . . . .30
Frequently Asked Questions/Directions to Office . . . . . . . . . . . . . . 32
Explanation of Terms . . . . . . . . . . . . . . . . . . . . . . . . . . . . . . . . . . . .33
Above are all the permanent employees that contributed to the closing of the 2008-2009 Assessment Roll. The pictured employeesare, clockwise, Dayle Murphy, Laura Colunga, Melissa Kong, Sue-ee Lai and Fraser Louie

www.sccassessor.org 1
Current Year Roll Growth*(Exclusive of Public Utility Valuations. Values in Billions.)
2008-2009 Valuation Changes
Assessment Roll Value Change: 2008-2009 2007-2008 Dollar Change % ChangeLocal Roll before exemptions $316.51 $295.78 20.74 7.01%Less: Nonreimbursable exemptions (13.20) (12.27)NET LOCAL ROLL VALUE $303.31 $283.51 19.80 6.98%Note: Minor discrepancies may occur due to rounding calculations. Percentages based on non-rounded values.
Message from the AssessorLawrence E. Stone
anta Clara County’s 2008-09 assessment roll contains clear evi-dence that Silicon Valley is not immune to the national recessionand the economic “meltdown” in the residential real estate market.The difference, however, is the degree of impact. Overall, SantaClara County has fared far better than most counties. Similarlywithin the County, assessed values in cities with new, entry-levelhousing and few technology companies did not grow as fast as citieswith expensive housing and/or a solid commercial/industrial base.
The Assessor’s Annual Report provides one view of the real estateeconomy of the nation’s 13th most populous county. It containsnarrative, detailed tables and summary charts of the 2008-09assessment roll for Santa Clara County as of the lien (valuation)date, January 1, 2008. The report, in its 10th year, has become apopular document for finance officials, corporate and communityleaders.
The annual assessment roll, delivered to the County FinanceAgencyDirector on July 1, 2008, is a valuable resource for budget-ing and financial planning by local governmental agencies.Information in this report reflects all locally assessed property, bothsecured and unsecured. The statistical data also distinguishesbetween business personal property and real property. It summa-rizes current property assessments including exemptions that arereimbursed by the State. Declines in value (Proposition 8) arereported by city and unincorporated area, and are then comparedto prior years. Detailed value information is also provided by prop-erty type, city and school district.
General information regarding trends of assessment appeals as wellas office performance data is also included. Assessments of publicutilities are the responsibility of the California State Board ofEqualization, and therefore, are not included in the report.
Role of the County Assessor’s OfficeThe Assessor’s Office is responsible for annually determining theassessed value of all real property and business personal propertyand equipment within Santa Clara County. Each year, theAssessor’s professional staff renders accurate assessments of allsecured and unsecured property. The assessment roll, whichincludes 562,624 assessable roll units of real and business property,is the basis upon which property taxes are levied. Property taxes, inturn, provide an essential source of revenue to support basic public
services provided by schools andlocal governments. These publicinstitutions form the foundation ofour region’s quality of life.
Assessment GrowthThe assessed value of property in Santa Clara County increased by$19.8 billion, nearly $2 billion less than either of the last two years.The total assessed value, net of non-reimbursable institutionalexemptions (e.g., qualifying church and welfare organizations), was$303.31 billion, an increase of 6.98 percent over the previous year.This is substantially below the apex of the “dot-comboom” in2001when the annual assessment roll growth exceeded 15 percent.
Just as major parts of the residential market have cooled during thelast three years, the commercial and industrial market has experi-enced a modest resurgence. Just a few years ago a robust residentialreal estate market bolstered the County’s assessment roll growth.
The current commercial and industrial “mini-boom” is led by con-struction of selected retail “power centers” and the development ofClass A office buildings from either the ground up, or major reno-vations to older properties. Companies like Adobe, Facebook,Oracle, Google, e-Bay and Apple are expanding, while other com-panies like Sun, Yahoo and HP are consolidating their facilities.Despite the national recession, Silicon Valley’s economy appearshealthy as many high-profile, high-tech companies are expandinglocally. The assessment roll also underscores the Valley’s successfultransition from high–tech manufacturing, to an internet, softwareand biotechnology based economy.
Following the national housing foreclosure crisis, the residential sec-tor, particularly construction and sales of entry-level housing, hasdeclined substantially. The number of transactions recordeddeclined 15 percent over the prior year. In addition, the number ofresidential properties inwhichmarket value declined below the fac-tored base year value, more than doubled to 41,000. This trend isespecially pronounced in the condominium sector and the lowerend of the residentialmarketplace.More than 20percent of all con-dominiums are assessed below their purchase price. The only vari-ation from this trend is high-end, residential properties, which havegenerally retained their value.
S

2 www.sccassessor.org
The other major contributor to assessment roll growth is the unse-cured assessment roll, comprised primarily of business personalproperty, machinery and equipment. This sector—so vital toSilicon Valley--recorded growth of 9.96 percent, to $21.5 billion.The rate of growth was nearly twice the growth of recent years.
Overall however, this is the third year of gradual decline in assess-ment roll growth from 9.6 percent in 2006; 8.3 percent last yearand 6.98 percent this year. While the County is vulnerable to thedownturn in the national economy, the decline in the growth ratewasmore gradual than experienced bymost counties inCalifornia,and has been buoyed by Silicon Valley’s strong technology sector.While this may be the third year of declining roll growth in SantaClara County, it is a far cry from the crisis facing other countieswhere both the residential and commercial sectors are in financialturmoil.
In neighboring StanislausCounty, the assessment roll actuallywentnegative, dropping6.87percent.The assessment roll in SanBenito,San Joaquin and SolanoCounties were also negative.This perilousdecline is especially remarkablewhen you consider that Proposition13 provides for an automatic 2 percent increase in the assessedvalue for all real property that did not change ownership or com-plete new construction during the prior calendar year. To put thisin perspective, in the past 75 years, the Santa Clara County assess-ment roll was negative only four times: immediately followingProposition 13 in 1978, and in 1932, 1933, and 1936, during thegreat depression. Numerous other counties also experienced steepdeclines this year. Fresno and Contra Costa Counties reported rollgrowth less than 1 percent; Sacramento and Riverside Countiesbetween 1 percent and 2 percent; all following several years of dou-ble-digit increases.What a roller coaster.These declines will furtherreduce property tax revenue and exacerbate the state budget crisis.
Within SantaClaraCounty there are dramatic differences in prop-erty values defined by property type and/or geographic area. Incommunities with substantial development of entry-level homes,especially condominiums and townhouses, such as east San Jose orMilpitas, there is clear evidence that the mortgage crisis has madeits way to Santa Clara County. In those cities, the rate of growth inassessed value was between 4 percent and 5 percent. In four of theseven elementary schools districts that comprise the East SideUnionHigh SchoolDistrict, total assessed value increased less than3 percent.
By contrast the San Jose Redevelopment Agency area, primarilycomposed of commercial and office properties, experienced 8 per-cent growth; nearly double that of the City of San Jose.
Reflecting the improving commercial and industrial sectors, assess-ment roll growth in redevelopment agency areas (RDA) increasedin seven of the ninemunicipal jurisdictions (Campbell, Cupertino,Los Gatos, Milpitas, San Jose, Santa Clara and Sunnyvale), anddeclined in two jurisdictions (Mountain View and Morgan Hill).Due to recent purchase/sale transactions and development ofmajor commercial centers, RDA’s inCupertino and Sunnyvale sawextraordinary assessed value increases of 46 percent and 57 percentrespectively.
Communities composed primarily of mid to high-end residentialproperties, also fared relatively well. In Sunnyvale, Los Altos andLos Altos Hills assessed value increases exceeded 8 percent. TheFremont Union High School District saw assessed values increase
9.41 percent. Cities that performed the best were Palo Alto with11 percent growth, followed closely byCupertino and SantaClara,both over 10 percent. These cities did well precisely because of thenature of the housingmarket and the strong presence of technolo-gy companies.
Assessment roll growth is also important to “basic aid” school dis-tricts. A basic aid school district is a district in which the propertytax revenue generated locally exceeds the state’s formula for schoolfunding. Consequently, basic aid school districts have more fundsat their disposal because of direct access to local property tax rev-enue. However, the revenue these school districts receive can fluc-tuate according to changes in the assessed value of property locatedwithin the tax rate area of each school district.
The 12 basic aid school districts in Santa Clara County for 2007-08 are: Campbell Union High School District (5.62%); FremontUnion High School District (9.41%); Lakeside Joint ElementarySchool District (5.76%); Loma Prieta Joint Union Elementary(5.46%); Los Gatos Elementary School District (7.28%); LosGatos-SaratogaHigh School District (6.88%);Montebello SchoolDistrict (3.15%); Mountain View-Los Altos High School District(7.50%); Palo Alto Unified School District (11.08%); Santa ClaraUnified School District (9.38%); Saratoga Elementary SchoolDistrict (6.51%); and Sunnyvale Elementary School District(9.85%). Twelve of California’s 87 basic aid school districts arelocated in Santa Clara County.
Factors in Assessment GrowthAssessment roll growth is a result of several major components.Real property is assessed at fairmarket valuewhena change inown-ership or new construction occurs. The newly established value isreferred to as the “base year value.”The change in assessed value ofindividual properties reflects the difference between the priorassessed value and the newmarket value resulting from the changein ownership or new construction. Reappraisal as a result of newconstruction includes only themarket value addedby thenewcon-struction. Proposition 13 limits the increase in assessed value to nomore than 2 percent annually or the California CPI, whichever islower, unless there is a change of ownership or new construction.The indexed value of theproperty is referred to as the “factoredbaseyear value.” Consequently, assessed values are significantly less thanthe total fair market value of property in Santa Clara County.
Each year, the Assessor is required to enroll the lower of themarketvalue as of January 1, or the factored base year value of the proper-ty.Therefore, when economic conditions cause a decline inmarketvalues, the Assessor is required by law (Proposition 8) to reduce theassessment to reflect the lower market value. If the market value ofa property, as of the lien (valuation) date, January 1, 2008, was lessthan the factored base year value, the impacted property owner isentitled to a temporary adjustment of the property assessment.When market conditions improve, the value may increase up tothe factored base year value that would have been enrolled had notemporary reduction been applied or, tomarket value as of January1, whichever is lower. The rate of this restoration can exceed the 2percent limit required by Proposition 13, but only until the mar-ket value is equal to the factored base year value.
In 2008, the Assessor’s Office proactively reduced the assessed val-ues of 41,866 properties, representing a total reduction of $5.05billion from the assessment roll.While the overall number of prop-erties in a decline status increased 136 percent, the total amount of

www.sccassessor.org 3
the value reduction increased by only 2 percent over the prior year.To put this in perspective, in 2005-06 at the bottom of the com-mercial and industrial downturn, there were 4,442 properties inProposition8decline status reflecting a total reductionof $9.48bil-lion. One of four properties in that year was non-residential. Theaverage reduction, without regard to property type was $2.1 mil-lion. This year 41,866 properties received an assessed value reduc-tion totaling $5.05 billion, for an average value reduction of justover $150,000 per parcel. This surprising decrease in the averagereduction and increase in the number of parcels is caused by thefact that over 95 percent of the reductions are residential properties,compared to less than 10 percent in the prior year.
Finally, unsecured business personal property, including comput-ers, machinery, equipment and fixtures, increased 9.96 percent.The assessed value of business personal property is calculated fromproperty statements filed annually by nearly 51,000 businesses inSantaClaraCounty. Of thenearly $2billion increase inunsecuredbusiness personal property, nearly half was the result of newAssessment accounting discovery procedures designed to increasecompliance and reduce the number of businesses that routinely failto file their annual business property statements mandated by law,thereby evading payment of taxes on business personal property.The other half of the increase is attributed to acquisitions of newequipment and fixtures.
Like the Internal Revenue Service and other taxing authorities,when a business fails to return a property statement, the Assessorhas the authority and responsibility to both determine the assessedvalue of a company’s assets and equipment using the best informa-tion available, and levy a 10 percent penalty. On the 2008-09assessment roll, 14,000 businesses out of a total of 50,791, failed toreturn a property statement to the Assessor’s Office by the May 7deadline. Businesses are required to disclose the cost of the assetsthey own such asmachinery, equipment and fixtures which is usedto determine the assessed value. Absent this information theAssessor must estimate the value and levy a 10 percent penalty.
Challenges and AccomplishmentsThe assessment roll closed on July 1 was the most difficult in my14 years as County Assessor. During the prior year, my staff wasreduced by 32 positions, and other positions were left unfilled inanticipation of an additional reduction of seven positions this fiscalyear. In total, my office has 2 percent fewer employees today thanin 1995 when I took office, yet the assessment roll has increased163 percent. In contrast, otherCounty departments have grown at
or faster than theCounty’s growth inpopulationof 16percent dur-ing the past 14 years. In addition, the Assessor’s 30-year-old legacyinformation systemhas begun to show signs of collapse as theman-ufacturer has cancelled its support, and the senior information sys-tem staff members most familiar with the legacy system haveretired.
Despite the demanding times, I am more optimistic than everabout our long-term ability to provide the highest level of qualityservice and productivity. In particular, the completion of the newcomputer system is no longer just a concept as components havebeen completed and are operational, and others are actively inprogress. Accountability, productivity and performance will con-tinue to be the hallmark of the Assessor’sOffice. The following area few of our major accomplishments over the past year:• Completed the annual assessment roll by the deadlinemandat-ed by state law.
• Returned $38,998 of the Assessor’s budget to the county gen-eral fund, including large, unbudgeted retiree payouts.
• Reduced the department’s 2008-09 budget by $598,560.• Completed 95.5 percent of real property assessments. Thismarks the third year of declining performance from the 99.1percent completion rate in 2005.
• Completed 99.98 percent of business personal propertyassessments.
• Completed 100 percent of eligible exemptions.• Continued to enhance the on-line property “look-up” featureon the Assessor’s web site (sccassessor.org), allowing propertyowners to access property assessment data any time of the dayor night from a convenient location. The site remains amongthe County’s top five most-visited web sites. Other enhance-ments included additional content inVietnamese and expand-ed channels for seniors and disabled taxpayers.
• Audited 99.6 percent of the 1,072 businesses required by theCalifornia Revenue andTaxation Code.
• Processed 100 percent of recorded deeds.• Processed77,673 title documents, a decrease of 15percent overthe prior year; 32 percent over the past two years.
• Completed 99.6 percent of Proposition 8 appraisals identifiedfor review.
• Processed all title documents recorded in 2007 a full 40 daysprior to the close of the assessment roll; a first in the Assessor’shistory.
• Field inspections by the exemption staff continued to result inthe discovery of properties, receiving but not eligible for an
Dollar % ofChange Change
Exemptions $-0.92 53.1%Proposition 8 net change+ -0.82 46.9Subtotal, declines in values -$1.74 100.0%
Dollar % ofChange Change
Change in ownership** $12.10 56.2%CPI inflation factor (2%) 4.58 21.2New construction** 2.31 10.7Business Personal Property 2.02 9.4Corrections / Board / Other 0.53 2.4Subtotal, increases in value $21.54 100.0%
Factors Causing Change to the 2008-2009 Assessment Roll(in billions)
Grand Total of Changes to Assessment Roll $19.80** Net of 2% annual increase+ Reflects those properties that did not establish a new base year value.Note: A limited portion of new construction is reflected in the change in ownership figures.

4 www.sccassessor.org
exemption from property taxes. Total additional assessed valuediscovered was $180 million.
• Continued to offer cross training opportunities throughout theorganization to increase staff’s ability to assist other units dur-ing periods of heavy workload.
• Expanded effort to identify homeowners eligible to receive anexemption, but did not previously apply for this benefit. Morethan 3,000 additional homeowners now receive the $7,000annual exemption benefit.
• Provided 1,833 hours of training on new or upgraded softwareapplications.
• Reduced the assessed values of 41,866 properties as mandatedby law (Proposition 8).
• Assisted 169,316 taxpayers who telephoned withquestions.
• Published the request for proposal (RFP) to replace the majorcomponents of computer information system.When complet-ed, all of the existing functionality currently operatingonmain-frame, mini-computer, and server platforms will be replacedwith a simple, more flexible and modern environment basedon relational database architecture, with a modern user inter-face. Implementation is expected to commence in 2009.
• Successfully defended assessed values at theAssessmentAppealsBoard, retaining 95 percent of the value at risk, a four percentincrease over the 2006-07.
• Increased by 23 percent to over 10,000, the number of smallbusinesses that electronically file their business property state-ments on-line.This is nearly double the number of companieswho e-filed just two years ago. Continued to provide special-ized electronic services so thatmajor corporate taxpayers can filebusiness property statements electronically.
• Processed nearly 100 percent of all property statements filed viaU.S.Mail using paperless processing, resulting in a reduction ofboth filing and retrieval time.
• Businesses that filed property statements by April 1 wereprovided a summary of their extended values within twoweeksof submission, a full 10 weeks sooner than last year. This datais used by businesses to project their property tax liability.
• Continued the Assessor’s on-going commitment to a first classwork environment by upgrading desktop computers, software,laptops, servers, and printers.
• During peak production, both the Business Division andInformation System Division implemented the first phase ofnew process management software that will become the back-bone of the new comprehensive computer systemunder devel-opment.
• Implemented anewMobilehome appraisal system that reducesthe number of on-sight inspections.
• Facilitated State Board of Equalization (SBE) training classesfor a total of 4,708 training hours.
• Developed an electronic customer service and call tracking sys-tem to allow better management of incoming customers issuesin the Real Property Division.
• Worked cooperatively with the SBE auditors in their compre-hensive compliance audit and survey of the Assessor’s Office.Results, which will be published this fall, will exceed all previ-ous standards, once again confirming SantaClaraCounty’s sta-tus as one of the best managed assessor’s offices in California.
• Substantially enhanced procedures for managing assessmentsof business that fail to timely file property statements.Implementation of new procedures is expected to result inimproved compliance in future years.
• Developed a new on-line form to allow taxpayers to apply for
Proposition 8 tax relief, eliminating the need to mail or fax aform and enabling staff to electronically manage requests forreductions in a more timely manner.
• Implemented new procedures to substantially increase discov-ery of unrecorded changes in ownership by legal entities. Theprogram resulted in identifying corporate changes in owner-ship including mergers and acquisitions that had escapedreassessment.
• Implemented a comprehensive, departmentwide style guide toimprove the overall quality and consistency of correspondencefrom the Assessor’s Office.
• Implemented new electronic reporting tools to enable man-agers to gainmore timely, user driven reports of assessment rolldata.
Trends and Future GoalsThe Assessor’s Office continues to focus on developing and imple-menting creative and innovative solutions to improve efficiencyand productivity while reducing costs. Some of the major chal-lenges/opportunities ahead include:• Complete a $28.1million replacement of the 25-year-old lega-cy computer system with a modern, “state of the art” systemthat will efficientlymeet both immediate and long-termneeds.
• Budget entirely by service levels.• Achieve measurable, annual increases in office productivity.• Identify and implement additional on-line assessment services.• Manage an increase in workload with decreasing staff.Continue to focus on the quality ofwork rather than the quan-tity. Rushing the valuation process not only jeopardizes theaccuracy of assessments, it ultimately results in a greater expen-diture of time and resources in corrections.
For the first time in 14 years, the Assessor’s Office has a backlog ofunprocessed assessments.This situation is due to a severe reductionin staff required to meet the County’s budget deficit. The impacton taxpayers resulting from our inability to timely assess propertywill not be fully known until the end of the current fiscal year. Inaddition, property revenue to schools and local governments couldalso be jeopardized.
As County Assessor, I remain committed to the full implementa-tion of a performance budgetingmanagement system that tiesmis-sion and goals directly to the budget; identifies, acknowledges andrewards superior employees’ performance; and focuses attentionand resources on continuous improvement initiatives based onquality, service, innovation and accountability.
The Assessor’s Office employs a group of people that I believe areamong the most talented and dedicated anywhere in government.It is our primary objective to treat all property owners and taxpay-ers with the highest degree of courtesy and professionalism. Fornearly14 years, it has been my honor to serve the taxpayers, prop-erty owners and public agencies in Santa Clara County. It is myprivilege to continue rendering fair and accurate valuations andproviding the highest level of public service.
Lawrence E. StoneAssessor

www.sccassessor.org 5
TTaaxxppaayyeerr TTaaxxeess PPaaiidd**1 Pacific Gas & Electric Co. $21,371,4842 Blackhawk Development $16,097,6033 Cisco Technology Inc. $15,394,214 4 Sobrato Development $15,193,1855 Intel Corporation $12,828,717
TTaaxxppaayyeerr TTaaxxeess PPaaiidd** 6 AT&T $11,883,573 7 Berg & Berg Developers $11,365,8308 Silicon Valley Developers $9,374,417 9 Applied Materials Company $8,827,66310 Westfield Corporation Inc. $8,362,792
* Ten largest taxpayers on the 2007-2008 secured tax roll, includes local and state assesseesSource: Santa Clara County Tax Collector, August 2008
Largest Taxpayers 2007-2008*
After the County Assessor determines theassessed value of all assessable property in SantaClara County, the County Finance Agency cal-culates and issues tax bills for each property.Under Proposition 13, the maximum propertytax rate is 1 percent of the property’s net taxablevalue. In addition, the bill will include anamount necessary to make the annual paymenton general obligation bonds or other bondedindebtedness imposed by public agencies andapproved by the voters.
The property tax revenue collected by theCounty Tax Collector supports schools includinglocal elementary, high school and communitycollege districts and local government agencies
including cities, redevelopment agencies, theCounty, and special districts. The basic one-per-cent tax rate is divided among the public taxingagencies in Santa Clara County.
The accurate, consistent and fair valuation ofproperty by the Assessor’s Office every year cre-ates the foundation that supports the delivery of essential public services provided by local gov-ernments. The County Assessor’s Office does notcalculate taxes, collect taxes or allocate tax rev-enues. For information regarding the collectionand allocation of property taxes, please contactthe Tax Collector at (408) 808-7900 or the Controller at (408) 299-5200.
How Tax Bills Are Calculated
Santa Clara County Property Tax Revenue Allocation 2007-2008*
The County Assessor’s Office does notcalculate taxes, collect taxes or allocate tax revenues.
K-12 Public
Schools 45%
County 18%
Cities 14%
Redevelopment
Agencies 10%
Community
Colleges 7%
Special
Districts 6%
*Data provided by the Santa Clara County Controller’s Office

6 www.sccassessor.org
2008/2009 2007/2008 Difference Change Land $139,348,057,034 $129,652,799,589 $9,695,257,445 7.48% Improvements (Real Property) $146,593,536,189 $137,578,635,966 $9,014,900,223 6.55 Improvements (BusinessDiv) $1,244,681,984 $1,293,620,185 ($48,938,201) -3.78 SSuubbttoottaall $$228877,,118866,,227755,,220077 $$226688,,552255,,005555,,774400 $$1188,,666611,,221199,,446677 66..9955%%
Personal Property $4,662,647,598 $4,695,140,833 ($32,493,235) -0.69% Mobilehomes $612,757,510 $606,980,358 $5,777,152 0.95SSuubbttoottaall $$55,,227755,,440055,,110088 $$55,,330022,,112211,,119911 (($$2266,,771166,,008833)) --00..5500%%
TTOOTTAALL GGrroossss SSeeccuurreedd $$229922,,446611,,668800,,331155 $$227733,,882277,,117766,,993311 $$1188,,663344,,550033,,338844 66..8811%% Less: Other Exemptions (sec) ($10,689,440,963) ($9,904,231,272) ($785,209,691) 7.93
NNEETT SSEECCUURREEDD $$228811,,777722,,223399,,335522 $$226633,,992222,,994455,,665599 $$1177,,884499,,229933,,669933 66..7766%%
TTOOTTAALL GGrroossss UUnnsseeccuurreedd $$2244,,005544,,223333,,994433 $$2211,,995511,,773355,,228822 $$22,,110022,,449988,,666611 99..5588%% Less: Other Exemptions ($2,512,242,367) ($2,361,761,466) ($150,480,901) 6.37
(unsec)NNEETT UUNNSSEECCUURREEDD $$2211,,554411,,999911,,557766 $$1199,,558899,,997733,,881166 $$11,,995522,,001177,,776600 99..9966%%TTOOTTAALL LLooccaall RRoollll $$330033,,331144,,223300,,992288 $$228833,,551122,,991199,,447755 $$1199,,880011,,331111,,445533 66..9988%%
Homeowners' Exemption $2,005,180,794 $1,992,840,265 $12,340,529 0.62%
Assessment Roll Summary2008-2009 Assessment Roll Compared to 2007-2008 (Exclusive of Public Utility Valuations)
The assessment roll is divided into the securedroll (property subject to a lien) and the unse-cured roll (property on which property taxes arenot a lien against the real estate where the prop-erty is situated, including improvements locatedon leased land).
Exemption values include homeowner exemp-tions (reimbursed by the state) and other exemp-tions for non-profit organizations, includingchurches, charitable institutions, colleges, hospi-tals and private and parochial schools (not reim-bursed by the state).
Improvements (the value of buildings or struc-tures situated on land) reflect values assessed byboth the Real Property and Business Divisions.
Since Proposition 13’s passage in 1978, SantaClara County’s annual roll growth has rangedfrom more than 17 percent to less than 1 per-cent. The local economy has a significant impacton property transfer transactions and buildingpermit activity. This year, changes in propertyownership accounted for 56 percent of the totalincrease in assessed value over last year’s assess-ment roll. Under Proposition 13, once a basevalue is established as a result of a change in own-ership or new construction, the assessed value ofa property can increase by no more than 2 per-cent annually based on an inflation factor, tied tothe California Consumer Price Index (CPI).Since the implementation of Proposition 13 in1978, the CPI has been less than 2 percent fivetimes: in 1983, 1995, 1996, 1999 and 2004.
The Assessment Roll

www.sccassessor.org 7
Ten-Year Assessment Roll Summary$300,000,000,000$280,000,000,000$260,000,000,000$240,000,000,000$220,000,000,000$200,000,000,000$180,000,000,000$160,000,000,000$140,000,000,000
Percentage Change Including Inflation Factor
Ten-Year Assessment Roll SummarySanta Clara County History Summary
16.00%14.00%12.00%10.00%8.00%6.00%4.00%2.00%0.00%
PercentRollChange
InflationFactor
1999 2000 2001 2002 2003 2004 2005 2006 2007 2008
1999 2000 2001 2002 2003 2004 2005 2006 2007 2008
(Exclusive of public utility valuation, and nonreimbursable exemptions)
Year Net Local Roll Change in Value Percent Change Inflation Factor*2008-09 $ 303,314,230,928 $19,801,311,453 6.98% 2.00%2007-08 $283,512,919,475 $21,597,627,615 8.25% 2.00%2006-07 $261,915,291,860 $21,773,313,717 9.07% 2.00%2005-06 $240,141,978,143 $17,765,933,316 7.99% 2.00%2004-05 $222,376,044,827 $4,856,902,557 2.23% 1.87%2003-04 $217,519,142,270 $6,670,743,127 3.16% 2.00%2002-03 $210,848,399,143 $11,022,579,515 5.52% 2.00%2001-02 $199,825,819,628 $26,908,458,506 15.56% 2.00%2000-01 $172,917,361,122 $15,347,394,561 9.74% 2.00%1999-2000 $157,569,966,561 $13,049,052,236 9.03% 1.85%* Proposition 13 limits the inflation factor for property values to 2% per year or the California Consumer Price Index, whichever is lower.

8 www.sccassessor.org
Supplemental assessments are admittedly complicat-ed and confusing! Created by Senate Bill 813 in1983, supplemental assessment closed what was per-ceived as a loophole and inequity in Proposition 13.It also created substantial new revenue for the stateand local government.
Supplemental assessments aredesigned to identify changes inassessed value, either increases ordecreases, that occur during thefiscal year. They are in addition(supplemental) to the traditionalannual assessment and propertytax bill.
Prior to the creation of supple-mental assessments, changes inassessed value due to a change in ownership or com-pletion of new construction would not result in high-er taxes until the tax year (July 1 to June 30),following the lien date when the new values wereplaced on the assessment roll. In some instances,taxes on the new assessments would not be collectedfor up to 21 months. This resulted inserious differences in tax treatmentfor transactions that may have onlybeen separated by one day. For exam-ple, two houses closed escrow onethe day before the annual lien dateand the other the day after; the valueincrease for each change in owner-ship was $500,000. The buyer whopurchased the day before the liendate would pay taxes on the entirepurchase price with the first install-ment of taxes no later thanDecember 10 that year. The buyerwho purchased the day after the liendate would not see the increase in taxes until the taxbill due in December of the following year. If bothproperties are owned for the same period of time, the buyer who bought a single day before the liendate would pay about $5,000 more in taxes than theother property owner due to differences in the initialtransaction.
With the implementation of supplemental assess-ments the increase in value is taxed from the first ofthe month following the date of completion of newconstruction or the change in ownership. That date isreferred to as the event date.
An event date between January 1 and May 31 resultsin two supplemental tax bills. The first supplementalbill is for the remainder of the fiscal year from the
first of the month following the event date. The sec-ond supplemental bill is for the subsequent fiscalyear, beginning July 1 after the event date. If theevent date is between June 1 and December 31, therewill be only one Supplemental Assessment in effect
for the remainder of that fiscalyear.
The amount of the supplementalassessment is the increase ordecrease in value as of the eventdate compared to the value thatwas previously assessed.Supplemental taxes are proratedbased on the number of monthsremaining in the fiscal year, endingJune 30. If the new assessment islower than the prior assessed value
a refund, rather than additional taxes, results.
Owners who have acquired property or completednew construction should be prepared for the following financial responsibilities:
Supplemental Event datesbetween June 1 & December 311. The portion of the annual taxbill for that fiscal year basedupon the assessed value prior tothe event.
2. The supplemental tax bill forthe difference in value betweenthe new and prior assessed val-ues; taxes are prorated forremainder of the fiscal year.
3. The annual tax bill for theupcoming fiscal year, reflectingnew assessed value.
Supplemental Event dates between January 1 and May 311. The portion of the annual tax bill for that fiscal
year based upon the assessed value prior to theevent.
2. The first supplemental tax bill for the differencein value between the new and prior assessed val-ues; taxes are prorated for remainder of the fiscalyear.
3. The annual tax bill for the full fiscal year (July 1 – June 30) following the date of the eventbased upon the assessed value prior to the event.
4. The second supplemental tax bill for the differ-ence in value between the new value and theassessed value shown on the tax bill referencedimmediately above.
Supplemental Assessments
“Every week hundreds ofconfused, frustrated or angryhome buyers here and acrossCalifornia call their countyassessor’s office with the samequestion: What’s a supplemental tax bill?”
Sacramento Bee, June 4, 2001
In 2007, the Assessor’s Office processed 33,221
supplemental assessmentsdue to new construction
and changes in ownershipwith a total net increase
in assessed value of$12.8 billion prorated into
supplemental tax bills by the Tax Collector.

www.sccassessor.org 9
Assessment Information by City
Total* Total* Percent Value PerRoll 2008 Roll 2007 Growth** Capita+
Campbell $6.43 $5.98 7.52% 160.19Cupertino 13.17 11.93 10.41% 237.12Gilroy 6.77 6.35 6.52% 132.23Los Altos 9.06 8.39 8.00% 320.39Los Altos Hills 4.76 4.38 8.45% 538.12Los Gatos 8.17 7.59 7.58% 269.52Milpitas 12.03 11.11 8.26% 173.24Monte Sereno 1.45 1.36 6.41% 405.20Morgan Hill 6.76 6.49 4.07% 172.29Mountain View 15.28 14.22 7.45% 206.63Palo Alto 21.13 18.97 11.40% 333.51San Jose 124.83 118.70 5.17% 126.16Santa Clara 24.48 22.24 10.05% 211.91Saratoga 9.93 9.33 6.48% 314.46Sunnyvale 24.73 22.67 9.08% 179.77Unincorporated 14.34 13.79 4.02% 144.71TOTAL $303.31 $283.51 6.98% 165.11
(Values in billions, per capita in thousands)
Assessment Roll Growth by City
* Net of nonreimbursable exemptions** Percentages based on non-rounded values+ California Department of Finance, County population est., May 2008
Roll growth varieddepending upon the type
of housing and commer-
cial properties. In commu-
nities with large numbers
of entry-level homes,
especially condominiums,
growth slowed compared
to communities with
composed primarily of
mid to high-end residen-
tial properties and/or
expanding high tech
industries. Palo Alto saw
the largest percentage
increase in assessed value
at 11.40 percent.
2008-2009 Percent Growth by City20%
15%
10%
5%
0%
Milpitas
San Jose
Mountain View
Palo Alto
Cupertino
Santa Clara
Sunnyvale
Los Altos Hills
Los Altos
Los Gatos
Campbell
Gilroy
Saratoga
Monte Sereno
Morgan Hill
Unincorporated

10 www.sccassessor.org
2008-2009 Net Assessment Roll by City(value in billions)
Secured Secured Unsecured Unsecured Total PercentCITY RDA* CITY RDA* Roll** of Roll+
Campbell $5.48 $0.66 $0.20 $0.10 $6.43 2.12%Cupertino 12.47 0.17 0.51 0.02 13.17 4.34%Gilroy 6.49 - 0.28 - 6.77 2.23%Los Altos 8.96 - 0.10 - 9.06 2.99%Los Altos Hills 4.75 - 0.00 - 4.76 1.57%Los Gatos 6.85 1.10 0.16 0.06 8.17 2.69%Milpitas 6.35 4.25 0.67 0.75 12.03 3.96%Monte Sereno 1.45 - 0.00 - 1.45 0.48%Morgan Hill 4.49 1.99 0.02 0.26 6.76 2.23%Mountain View 11.88 1.85 0.83 0.73 15.28 5.04%Palo Alto 19.38 - 1.75 - 21.13 6.97%San Jose 100.92 15.26 4.41 4.25 124.83 41.16%Santa Clara 18.80 1.87 2.80 1.01 24.48 8.07%Saratoga 9.89 - 0.04 - 9.93 3.28%Sunnyvale 21.69 0.71 2.25 0.07 24.73 8.15%Unincorporated 14.09 0.00 0.26 - 14.34 4.73%TOTAL $253.93 $27.84 $14.29 $7.25 $303.31 100.00%
Secured Roll: Property for which taxes become a lien on real property to secure payment of taxes. Unsecured Roll: Property for which taxes are not a lien on Real Property to secure payment of taxes.*RDA: Redevelopment Agency **Net of Nonreimbursable Exemptions +Percentages based on non-rounded values- Indicates a value of 0 or less than $10 million
2008-2009 Net Assessment Roll by City
$25
$20
$15
$10
$5
$0
(value in billions)
Real Property(RP) Business Personal Property
San Jose
Sunnyvale
Santa Clara
Unincorporated
Morgan Hill
Gilroy
Mountain View
Campbell
Los Gatos
Los Altos
Monte Sereno
Los Altos Hills
Cupertino
Palo Alto
Saratoga
Milpitas
$114 Billion (RP)

www.sccassessor.org 11
2008-2009 Real Property Distribution by City(value in billions)
Land Improvement Total Exemptions* Net ParcelValue Value Value Total Count
Campbell $3.16 $3.04 $6.20 $0.08 $6.12 11,440 Cupertino 6.58 5.90 12.49 0.09 12.39 16,293 Gilroy 2.76 3.81 6.57 0.17 6.41 12,717 Los Altos 5.61 3.42 9.03 0.08 8.95 10,836 Los Altos Hills 2.81 1.97 4.78 0.03 4.75 3,111 Los Gatos 4.30 3.80 8.10 0.18 7.92 10,468 Milpitas 4.64 5.98 10.62 0.20 10.42 16,928 Monte Sereno 0.85 0.61 1.45 0.00 1.45 1,252 Morgan Hill 2.71 3.87 6.59 0.16 6.43 11,035 Mountain View 6.77 7.06 13.83 0.28 13.55 18,348 Palo Alto 10.42 10.47 20.89 1.72 19.16 19,919 San Jose 54.93 62.41 117.33 3.25 114.08 229,078 Santa Clara 9.23 11.54 20.77 1.17 19.60 28,203 Saratoga 5.97 4.08 10.04 0.15 9.89 11,040 Sunnyvale 10.82 10.38 21.20 0.18 21.02 30,745 Unincorporated 7.78 8.28 16.06 2.19 13.87 30,464 TOTAL $139.35 $146.59 $285.94 $9.94 $276.00 461,877
Note: Does not include mobilehomes; does not include possessory interest assessments, which are billed as unsecuredassessments. Totals based on non-rounded values.- Indicates a value of 0 or less than $10 million *Nonreimbursable Exemptions
2008-2009 Business Personal Property Distribution by City(value in billions)
Gross Gross Net Percent Value Secured* Unsecured** Exemptions+ Total of Value Growth
Campbell $0.02 $0.31 $0.01 $0.31 1.15% 12.22%Cupertino 0.25 0.54 0.01 0.78 2.86% 16.10%Gilroy 0.09 0.29 0.02 0.36 1.32% 14.04%Los Altos 0.02 0.11 0.01 0.11 0.41% 13.03%Los Altos Hills 0.00 0.01 0.01 0.00 0.01% -70.25%Los Gatos 0.05 0.23 0.03 0.25 0.90% 12.12%Milpitas 0.19 1.44 0.02 1.61 5.90% 7.41%Monte Sereno 0.00 0.00 0.00 0.00 0.00% -78.63%Morgan Hill 0.05 0.28 0.01 0.33 1.20% 5.56%Mountain View 0.22 1.61 0.10 1.73 6.34% -3.62%Palo Alto 0.36 2.86 1.25 1.97 7.21% 9.83%San Jose 2.24 8.94 0.43 10.75 39.36% 5.05%Santa Clara 1.38 3.91 0.42 4.87 17.85% 13.85%Saratoga 0.01 0.04 0.01 0.04 0.16% 19.08%Sunnyvale 1.42 2.36 0.06 3.71 13.58% 2.23%Unincorporated 0.23 1.12 0.87 0.48 1.74% 15.66%Grand Total $6.52 $24.05 $3.26 $27.31 100.00% 6.71%* Secured Roll: Property for which taxes become a lien on real property to secure payment of taxes. ** Unsecured Roll: Property for which taxes are not a lien on Real Property to secure payment of taxes.+Nonreimbursable ExemptionsNet of nonreimbursable exemptions; includes mobilehomes and possessory interest assessments

12 www.sccassessor.org
Bay Area Counties 2008-2009 Secured, Unsecured and Total Assessment Roll
County Unsecured roll Secured roll Total gross roll Percent increaseover prior year
Alameda $12,015,146,152 $195,197,515,172 $207,212,661,324 4.87%Contra Costa $5,164,766,412 $155,509,726,416 $160,674,492,828 0.53%Marin $1,452,739,800 $55,497,969,974 $56,950,709,774 5.75%Monterey $2,234,085,805 $51,095,955,117 $53,330,040,922 2.60%Napa $1,203,081,443 $26,469,301,609 $27,672,383,052 6.02%San Benito $252,683,063 $6,466,349,648 $6,719,032,711 -1.05%San Francisco $9,622,316,941 $135,947,330,250 $145,569,647,191 9.14%San Mateo $10,388,871,202 $135,878,026,823 $146,266,898,025 8.07%Santa Clara $24,054,233,943 $292,461,680,315 $316,515,914,258 7.01%
Santa Cruz $861,576,085 $33,580,381,167 $34,441,957,252 3.30%Solano $1,948,949,721 $45,626,911,462 $47,575,861,183 -0.24%Sonoma $2,607,708,466 $68,182,503,151 $70,790,211,617 2.87%
Most Populous 15 California Counties (ranked by population)2008-2009 Gross Secured, Unsecured and Total Assessment Roll
County Unsecured roll Secured roll Total gross roll Percent increase over 2007-2008
1 Los Angeles $72,729,178,644 $1,036,284,271,861 $1,109,013,450,505 6.90%2 San Diego $15,277,453,469 $394,108,136,157 $409,385,589,626 4.59%3 Orange $21,026,521,882 $423,700,777,981 $444,727,299,863 4.15%4 Riverside $8,400,933,944 $234,579,455,547 $242,980,389,491 1.45%5 San Bernardino $10,576,812,960 $175,588,453,535 $186,165,266,495 5.31%6 Santa Clara $24,054,233,943 $292,461,680,315 $316,515,914,258 7.01%7 Alameda $12,015,146,152 $195,197,515,172 $207,212,661,324 4.87%8 Sacramento $5,892,766,165 $134,737,596,104 $140,630,362,269 2.12%9 Contra Costa $5,164,766,412 $155,509,726,416 $160,674,492,828 0.53%10 Fresno $2,562,933,461 $60,075,002,273 $62,637,935,734 0.93%11 Ventura $4,460,560,694 $104,574,164,516 $109,034,725,210 3.38%12 San Francisco $9,622,316,941 $135,947,330,250 $145,569,647,191 9.14%13 Kern $3,244,102,477 $79,334,828,918 $82,578,931,395 5.94%14 San Mateo $10,388,871,202 $135,878,026,823 $146,266,898,025 8.07%15 San Joaquin $3,724,225,964 $60,735,966,145 $64,460,192,109 -0.99%
Although Santa Clara County is the sixth most populous, and has the fourth highestassessment roll, it consistently ranks second in California in the assessed value ofunsecured business personal property.

www.sccassessor.org 13
ExemptionsHomeowners’ Exemption is the exemption with which most homeowners are familiar. Over the lastyear the number of properties receiving this exemption increased by one-half of one percent.
In addition to the homeown-ers’ exemption, there aremany other exemptions avail-able to taxpayers. Theyinclude charitable non-profitorganizations, religious insti-tutions and private non-profitcolleges. During the last year,the value of exempt properties (non homeowner exempt)increased 7.6 percent. Despitethe slowdown in the marketrate housing sector, affordablehousing continued to grow to10.6 percent, greater than theoverall growth in housing.
Due to internal changes in systems, libraries were reclassi-fied and moved from the miscellaneous category there-by increasing the assessed values of the category muse-ums/libraries by 202 percent.
(value in billions)
Qualifying Exemptions
Percent PercentExemption Roll Total Value Exempt
Units Value Increase Value+Non-Profit Colleges 315 $5.96 7.52% 39.17%Qualifying Low Income Housing 302 2.63 10.65% 17.30%Charitable Non-Profit Org. 1,170 2.07 1.16% 13.59%Homeowners' Exemption* 286,086 2.01 0.70% 13.20%Hospitals 29 1.05 11.65% 6.88%Religious Org. 699 0.72 -0.34% 4.73%Private Schools 133 0.39 7.63% 2.57%Cemeteries 33 0.14 2.59% 0.91%Museums / Libraries 16 0.13 202.30% 0.83%Disabled Veterans 653 0.06 8.26% 0.42%Misc. 28 0.06 28.68% 0.37%Historical Aircraft 36 - 39.46% 0.02%TOTAL 289,500 $15.21 6.65% 100.00%
Exemptions not reimbursed by the state 3,414 13.20 7.62%These categories include only those non profit organizations that haveapplied and qualified in accordance with the Revenue and Taxation Code.
* The state reimburses the County for the Homeowners’ Exemption.+ Percentages based on non-rounded values- Indicates a value of 0 or less than $10 million
Kaiser Foundation Hospitals Inc. qualified for a$951 million exemption...and Stanford received an exemption of $4.57 billion in assessed value...the second largest exemption inCalifornia...

14 www.sccassessor.org
(value in billions)
2008-2009 Properties with Temporary Declines by City
Number of Values Percent City Properties Declined* Decline**
Campbell 1,057 $0.05 7.13%Cupertino 1,415 0.10 6.71%Gilroy 1,430 0.23 21.90%Los Altos 186 0.05 13.22%Los Altos Hills 93 0.13 27.43%Los Gatos 536 0.07 10.24%Milpitas 2,310 0.47 18.90%Monte Sereno 33 0.02 17.50%Morgan Hill 1,089 0.17 16.39%Mt. View 215 0.16 24.67%Palo Alto 229 0.11 18.92%San Jose 25,467 2.56 13.09%Santa Clara 2,973 0.22 9.12%Saratoga 605 0.16 13.02%Sunnyvale 2,876 0.39 11.55%Unincorporated 1,352 0.16 12.44%TOTAL 41,866 $5.05 13.45%*Represents decline in assessed value had the market value exceeded the Proposition 13 protected factored base year value
**Percentages based on non-rounded values
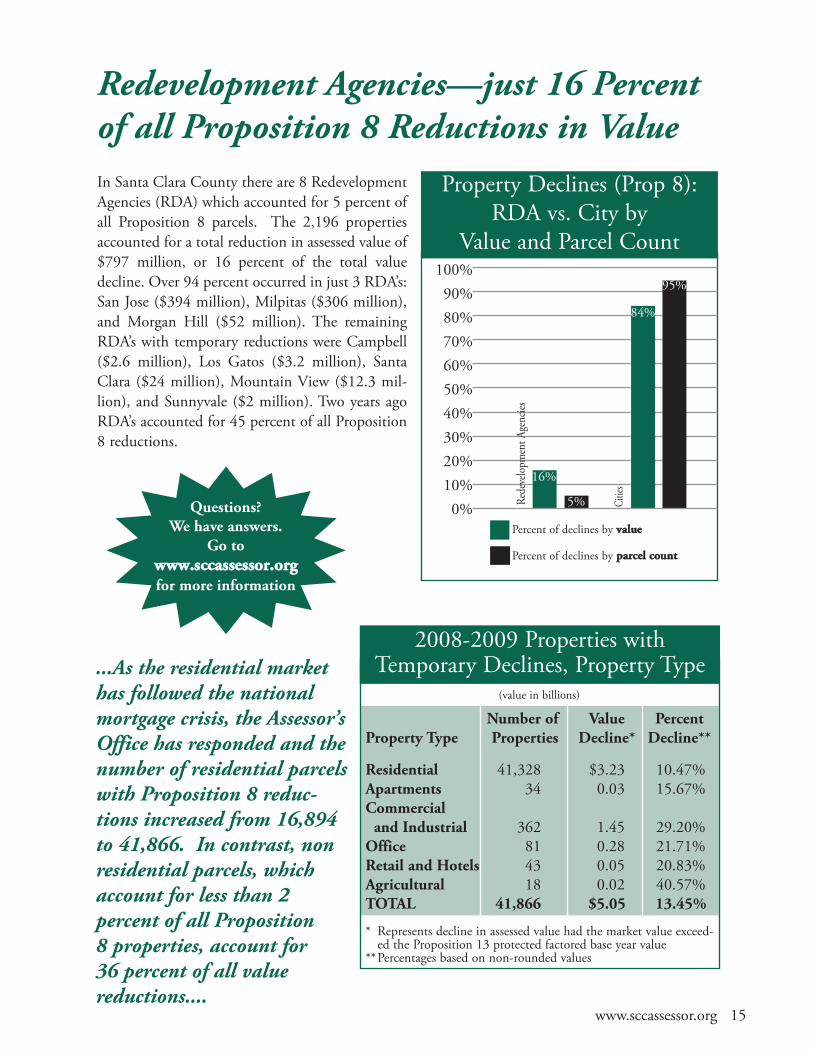
Proposition 8The assessed values of 41,866 propertieswere reduced by the Assessor’s Office as of the lien date, January 1, 2008, toreflect changes in market conditions fora total reduction of $5.05 billion. Thisrepresents a 13 percent decline fromwhat would have been the assessed valueof these properties had the market valuenot declined below the Proposition 13protected level.
The temporary reductions in assessedvalue are mandated by Proposition 8,passed by California voters inNovember 1978. Proposition 8 pro-vides that property owners are entitledto the lower of the fair market value oftheir property as of January 1, 2008, orthe assessed value as determined at thetime of purchase or construction, andincreased by no more than 2 percentannually.
The overwhelming majority of reduc-tions are for properties that were pur-chased or newly constructed at the “topof the market.” Properties where themarket value exceeds the assessed valueas of January 1, 2008, are not eligiblefor an adjustment.
2002-2008 Number of properties temporarily reduced to reflect changes in market value
Parcels
Billions
45,000
40,000
35,000
30,000
25,000
20,000
15,000
10,000
5,000
0
$12.00
$10.00
$8.00
$6.00
$4.00
$2.00
$02002-03 2003-04 2004-05 2005-06 2006-07 2007-08
Parcels Reduced AV
17,758
6,5034,442
24,743
33,36529,014
2008-09
41,866
(value in billions)
2008-2009 Properties with Temporary Declines, Property Type
Number of Value PercentProperty Type Properties Decline* Decline**
Residential 41,328 $3.23 10.47%Apartments 34 0.03 15.67%Commercial
and Industrial 362 1.45 29.20%Office 81 0.28 21.71%Retail and Hotels 43 0.05 20.83%Agricultural 18 0.02 40.57%TOTAL 41,866 $5.05 13.45%
* Represents decline in assessed value had the market value exceed-ed the Proposition 13 protected factored base year value
**Percentages based on non-rounded values
100%90%80%70%60%50%40%30%20%10%0% Re
development Agencies
Cities
5%
Percent of declines by vvaalluuee
Percent of declines by ppaarrcceell ccoouunntt
Property Declines (Prop 8): RDA vs. City by
Value and Parcel Count
Redevelopment Agencies—just 16 Percentof all Proposition 8 Reductions in ValueIn Santa Clara County there are 8 RedevelopmentAgencies (RDA) which accounted for 5 percent ofall Proposition 8 parcels. The 2,196 propertiesaccounted for a total reduction in assessed value of$797 million, or 16 percent of the total valuedecline. Over 94 percent occurred in just 3 RDA’s:San Jose ($394 million), Milpitas ($306 million),and Morgan Hill ($52 million). The remainingRDA’s with temporary reductions were Campbell($2.6 million), Los Gatos ($3.2 million), SantaClara ($24 million), Mountain View ($12.3 mil-lion), and Sunnyvale ($2 million). Two years agoRDA’s accounted for 45 percent of all Proposition8 reductions.
...As the residential markethas followed the nationalmortgage crisis, the Assessor’sOffice has responded and thenumber of residential parcelswith Proposition 8 reduc-tions increased from 16,894 to 41,866. In contrast, non residential parcels, whichaccount for less than 2 percent of all Proposition 8 properties, account for 36 percent of all value reductions....
Questions?We have answers.
Go to wwwwww..ssccccaasssseessssoorr..oorrggfor more information
16%
84%
95%
www.sccassessor.org 15

16 www.sccassessor.org
Average Assessed Value vs.
Average “Sale” Value
Proposition 13Passed by the voters in June 1978, Proposition 13amended the California Constitution limiting theassessment and taxation of property in California.It restricts both the tax rate and the rate ofincrease allowed in assessing real property as fol-lows:• The property tax cannot exceed 1 percent of aproperty’s taxable value, plus service fees,improvement bonds and special assessments,many which require voter approval.
• A property’s original base value is its 1975-76market value. A new base year value is estab-lished by reappraisal whenever there is achange in ownership or new construction.Except for change in ownership or new con-struction, the increase in the assessed value ofreal property is limited to no more than 2 per-cent per year.
• Business Personal Property, boats, airplanesand certain restricted properties are subject toannual reappraisal and assessment.
• In the case of real property, the adjusted (fac-tored) base year value is the upper limit ofvalue for property tax purposes.
Historically, the market value of real property hasincreased at a significantly greater rate than theassessed value, which is limited to no more than 2percent per year, unless there is a change in own-ership or new construction.
The result has been a widening disparity betweenthe market value and assessed value of property inSanta Clara County. Long-time property ownersbenefit from lower assessments while new, andfrequently younger property owners, are adverselyimpacted by assessments that can be as much asten times greater than that of a comparable prop-erty held by a long-time owner.
Since the passage of Proposition 13, the averageassessed value compared to average sale prices ofsingle family residences in Santa Clara Countyhas ranged from 40 percent in 1978, to 57 per-cent in 1995, and was 46 percent in 2008
Historical trend of assessed values in Santa Clara CountyThe chart compares the contri-bution by homeowners versus allother real property, such as com-mercial and industrial properties,to the County’s total net assessedvalue. Since passage ofProposition 13 in 1978, the con-tribution of secured assessedvalue of commercial and indus-trial properties relative to thetotal has declined 17 percent, atrend consistent with data fromother California counties.
Historic Trend of Assessed Values in Santa Clara County
Percent of Total Assessed Value 70.00%
65.00%
60.00%
55.00%
50.00%
45.00%
40.00%
35.00%
30.00% 1977-1978 1985-1986 1990-1991 1995-1996 2000-2001 2005-2006 2008-2009
Residential (Single Family and Condominiums) All Other Property
Average Assessed ValueAnnual Average “Sale” Value (Source RE InfoLink)
1978 1985 1990 1995 1999 2004 2007
$1,100,000
$1,000,000
$900,000
$800,000
$700,000
$600,000
$500,000
$400,000
$300,000
$200,000
$100,000
0Value

www.sccassessor.org 17
Do I benefit from Proposition 13? It is a fre-quent question. The answer is, every propertyowner benefits from Proposition 13. However,property owners that have owned their propertylonger benefit more than recent buyers. Forexample, 16 percent of today’s property ownershave not had their property reassessed to marketvalue since 1975. The total of those 1975 baseyear values equals 5.4 percent of the totalassessed value of all the land and improvementsin Santa Clara County. By contrast, propertyowners who acquired a property during the lasttwo years account for 11 percent of all proper-ties, yet their combined assessed values accountfor 20 percent of the total assessment roll.
The charts and table below provide a snap shot as of January 1, 2008, of properties assessedas of 1975 (all property owned prior to March 1,1975) and for each subsequent year of acquisi-tion for the current roll. It also shows the 2008assessed value, based upon market value as ofMarch 1, 1975, or as of the date of acquisition,plus the inflation rate not to exceed 2 percentper year. For example, of the 461,877 propertiesin the County, 24,875 were reassessed at marketvalue in 2008 and account for $29 billion inassessed value out of a total County assessmentroll of $285.9 billion.
Non Residential Properties
20087%
1996-200744% 1985-1995
16%
1975 19%
1976-198514%
200813%
19759% 1976-1985
7%
1986-199513%
1996-200758%
Residential Properties
2008 5%
1996-200749% 1985-1995: 19%
1975 16%1976-1985: 11%
20089%
19753%
1976-19855%
1986-199515%1996-2007
68%
Assessed Values
Number of Parcels
The above pie charts show the percentage of either residential or non residential parcels compared to assessed values based upon when they were acquired and valued.
Base Year Parcels Assessed Value Base Year Parcels Assessed Value Lien Date (Land & Imp.) Lien Date (Land & Imp.)
1975 73,663 $15,435,961,463 1992 7,704 $3,835,713,071 1976 5,305 $828,566,402 1993 8,798 $4,558,590,411 1977 6,983 $1,176,886,829 1994 9,083 $5,017,471,023 1978 6,691 $1,523,502,360 1995 9,922 $5,512,650,511 1979 5,805 $1,317,200,215 1996 9,857 $6,303,764,632 1980 6,174 $1,498,515,048 1997 10,994 $6,740,648,078 1981 4,074 $1,375,140,469 1998 14,109 $8,747,795,273 1982 3,339 $1,259,504,349 1999 15,466 $12,275,570,078 1983 3,160 $1,278,026,160 2000 17,416 $13,053,805,955 1984 5,583 $2,089,976,977 2001 15,275 $14,346,273,769 1985 6,557 $3,066,994,824 2002 12,083 $11,590,658,396 1986 7,325 $2,639,835,402 2003 17,626 $14,347,087,606 1987 8,898 $3,613,506,684 2004 22,198 $17,340,349,378 1988 8,729 $3,404,995,970 2005 29,598 $23,328,003,678 1989 10,255 $4,521,306,139 2006 32,375 $28,765,797,096 1990 7,666 $4,027,884,771 2007 28,126 $28,560,615,076 1991 6,165 $3,318,399,321 2008 24,875 $29,240,595,809
TOTAL 461,877 $285,941,593,223
Who benefits?

40%Asian
46%Male
54%Female
Staff Composition
43%Caucasian
2% AfricanAmerican
15%Hispanic
Organizational Overview of the County Assessor’s OfficeAssessor
Assistant Assessor
Assessment Standards, Services, and Exemptions
Division DescriptionResponsible for locating and identifying ownership and reappraisability of all taxable real proper-ty as well as approving and enrolling all legal property tax exemptions. In addition, professionalstaff members monitor assessment appeal information; process legal appeals; maintain and updateassessment maps; manage the public service center, docment imaging center and oversee qualitycontrol.
Staff CompositionA majority of the sixty-two staff members of the Assessment, Standards, Services and ExemptionDivision possess expert knowledge in exemption law, cartography and/or the legal complexities ofproperty transfers. In addition, two staff members are certified by the State Board of Equalization(SBE), one as an appraiser and another as an advanced appraiser.
Major Accomplishments 2008/2009 2007/2008Ownership Title Documents Processed 77,673 91,818Change in Ownership Reviewed (reassessable events) 27,475 33,090Parcel Number Changes (split & combinations) 6,109 5,607
Real Property
Division DescriptionResponsible for valuing and enrolling all taxable real property (land and improvements). TheDivision provides assessment-related information to the public, and cooperates with other agencies regarding assessment and property tax-related matters.
Staff CompositionSeventy of the eighty-seven staff positions are professional appraisers certified by the State Boardof Equalization (SBE) Fifty-three of those appraisers hold advanced certificates issued by the SBE.
Major Accomplishments 2008/2009 2007/2008Real Property Parcels (secured; taxable) 461,877 456,981Permits Processed 28,246 27,623Proposition 8 Parcels (temporary reductions) 41,866 17,758Parcels with New Construction 7,723 9,028Change in Ownership Assessed (reassessable events) 26,242 32,394
18 www.sccassessor.org

www.sccassessor.org 19
Office Mission The mission of the Santa Clara County Assessor’s Office is to producean annual assessment roll including all assessable property in accordance with legal mandatesin a timely, accurate, and efficient manner; and provide current assessment-related informa-tion to the public and to governmental agencies in a timely and responsive way.
Business Division (Business Personal Property)
Division DescriptionResponsible for locating, valuing and enrolling all taxable business personal property includingproperty (owned and leased) such as computers, supplies, machinery, equipment and fixtures as well as mobilehomes, airplanes and boats. Last year, the Division completed 1,068 businessaudits. The Division is responsible for administration of assessment appeals involving businesspersonal property. Businesses with personal property valued in excess of $400,000 are auditedonce every four years, which accounts for over 90 percent of all personal property in the County.
Staff CompositionForty-three of the sixty-five staff members are certified as auditor-appraisers including thirty-eightstaff members who have advanced certification awarded by the SBE. The staff is comprised ofaccountants and experts skilled in assessing and auditing high-tech businesses.
Major Accomplishments 2008/2009 2007/2008Business Assessments on Secured Roll* 2,771 2,764Mobilehome Parcels Assessed* 9,983 9,724 Business Personal Property (BPP) Appraisals Enrolled* 71,979 75,533Total Business Personal Property Assessment Activities 104,227 105,949
* Note: Subset of Total Activities
Administration DivisionDivision DescriptionResponsible for providing administrative and fiscal support services to the Assessor’s Office; including budget,personnel, payroll, purchasing, facilities management andinternal/external communications.
Staff Composition A staff of ten, includes the Assessor, Assistant Assessor andthe Deputy to the Assessor. Three are certified appraisersand one is an advanced appraiser certified by the SBE.
Assessor’s 2008/2009* 2007/2008*Budget $26,165,831 $25,189,101Employees in the Assessor’s Office 237 243
Staff Funded by state 10 49Performance Grant (PTAP) * assessment year
Information Systems Division
Division DescriptionResponsible for supplying systems support to all otherdivisions in the pursuit ofpreparing and delivering the secured, unsecured andsupplemental assessment rolls.
Staff Composition The thirteen member staff hasa broad knowledge ofadvanced computer systems.
Organizational Overview of the County Assessor’s OfficeAssessor
Assistant Assessor

20 www.sccassessor.org
100%90%80%70%60%50%40%30%20%10%0%
Single Family/Condo Residential
Percent of Real Property by Value Percent of Real Property by Parcel
2008-2009 Real Property Types by Value and Parcel Count
68.1%
Multi-Family Residential
Non-Residential
7.5%4.4%
24.4%
7.6%
2008-2009 Real Property Distribution of Value by Property Type
Property Type Value* Value Value % Parcel Parcel(in Billions) Growth Percentage Count Percentage+
Single Family Detatched $159.86 5.14% 57.92% 329,123 71.26%Condominiums 28.04 7.32% 10.16% 77,322 16.74%Office 16.33 18.51% 5.92% 5,001 1.08%Apartments 5+ Units 14.27 7.26% 5.17% 4,750 1.03%Other Industrial Non-Manufacturing 9.97 8.99% 3.61% 3,735 0.81%
R&D Industrial 9.86 10.70% 3.57% 695 0.15%Specialty Retail and Hotels 9.32 9.60% 3.38% 5,852 1.27%Single Family 2-4 units 6.40 4.93% 2.32% 15,228 3.30%Other Urban 5.76 11.27% 2.09% 9,403 2.04%Major Shopping Centers 5.35 12.92% 1.94% 855 0.19%Electronic & Machinery Mfg. 4.47 8.83% 1.62% 382 0.08%Other Industrial Manufacturing 3.26 7.47% 1.18% 2,070 0.45%
Agricultural 1.84 2.98% 0.67% 6,027 1.30%Public & Quasi-Public 1.23 10.34% 0.45% 1,231 0.27%Residential Misc. 0.06 -15.80% 0.02% 203 0.04%TOTAL $276.00 7.01% 100.00% 461,877 100.00%+ Percentages based on non-rounded values* Net of Nonreimbursable Exemptions; Does not include Mobilehomes; Does not include Possessory Interest assess-ments which are billed as unsecured assessments.
Although nearly nine out of ten parcels of real propertyin Santa Clara County aresingle family residences, thoseparcels represent two-thirdsof the total assessed value ofall real property. Non-residen-tial real property, includingcommercial, industrial, retailand agricultural properties,account for 32 percent of theassessed values while consti-tuting only 12 percent of allparcels.
88.0%

www.sccassessor.org 21
2008-2009 Business Personal Property Distribution of Value by Type
(value in billions)
Net Percent of Value EntityProperty Type Secured* Unsecured** Exemptions Total Value+ Growth+ CountProfessional Services $0.77 $7.66 $0.76 $7.67 28.08% 12.79% 16,511Electronic Manufacturers 1.65 3.36 0.00 5.02 18.37% 3.73% 1,071Computer Manufacturers 0.83 2.54 0.00 3.37 12.33% 7.55% 15Other Manufacturing 0.60 2.55 0.00 3.16 11.56% 9.85% 3,532Retail 0.09 2.06 0.01 2.14 7.84% 17.47% 6,809Semiconductor Manufacturing 1.17 0.63 0.00 1.80 6.60% -13.11% 36Other 0.70 3.02 2.48 1.24 4.53% -7.84% 1,753Aircraft 0.00 1.16 0.00 1.15 4.22% 14.02% 872Leased Equipment 0.00 0.85 0.00 0.85 3.12% 5.02% 535Mobilehomes 0.61 0.00 0.00 0.61 2.24% 0.81% 9,795Financial Institutions 0.01 0.16 0.00 0.16 0.59% 4.66% 104Apartments 0.08 0.01 0.01 0.08 0.29% 8.66% 971Boats 0.00 0.06 0.00 0.06 0.22% 5.01% 3,738TOTAL $6.52 $24.05 $3.26 $27.31 100.00% 6.71% 45,742* Secured Roll: Property for which taxes become a lien on real property to secure payment of taxes. ** Unsecured Roll: Property for which taxes are not a lien on Real Property to secure payment of taxes.*** Net of nonreimbursable exemptions, includes possessory interest assessments valued by Real Property Division. + Percentages based on non-rounded values.0 or - Indicates a value of 0 or less than $10 million. As a result, totals of displayed numbers may be off by up to $10 million.
Business Personal PropertyAssessed values of business personal property are determined from the business property statementsfiled with the Assessor annually by 51,000 businesses in Silicon Valley. This year’s growth of 6.71percent, in the secured and unsecured business personal property, is similiar to last year’s growth of5.04 percent, which followed three years of negative growth. In Santa Clara County, the gross assessedvalue of unsecured business property represents 7 percent of the entire assessment roll. Statewide,unsecured values account for approximately 5 percent of the total assessment roll. While Santa ClaraCounty ranks sixth in population, and has historically ranked fourth in total assessed value, it is sec-ond only to Los Angeles in the assessed value of unsecured property.
Below are the top 25 companies in Santa Clara County as of the lien date, January 1, 2008, rankedby the net assessed taxable value of their “business property,” which includes personal property, com-puters, machinery, equipment and fixtures. Ranging in size from over $125 million to just over $2billion dollars, the “business property” of the top 25 companies is assessed annually. [Note: The rank-ing does not include the assessed value of real property.]
1 Cisco Systems (1)2 Intel (2)3 Lockheed Martin (3)4 Hitachi Global Storage (6)5 Hewlett Packard (8)6 Applied Materials (5)7 Apple Computer (12)8 Yahoo (9)9 Spansion (10)
10 Google (4)11 Microsoft (NR)12 Juniper Network (17)13 Marvell Semi Conductor (NR)14 Nor Flash Electronic (NR)15 Kla Tencor (18)16 Southwest Airlines (20)17 Air Products & Chemicals (NR)18 Maxim Integrated Products (14)
19 eBay (7)20 Sun Microsystems (11)21 Hanson Permanente (25)22 Alza (16)23 VMware (NR)24 NVIDIA (NR)25 Space Systems Loral (NR)
2008-2009 Top 25 Companies* (parenthesis indicate last year’s ranking)
* Ranked by gross assessed value of their busi-ness personal property. Excludes Exempt entities.
22 www.sccassessor.org
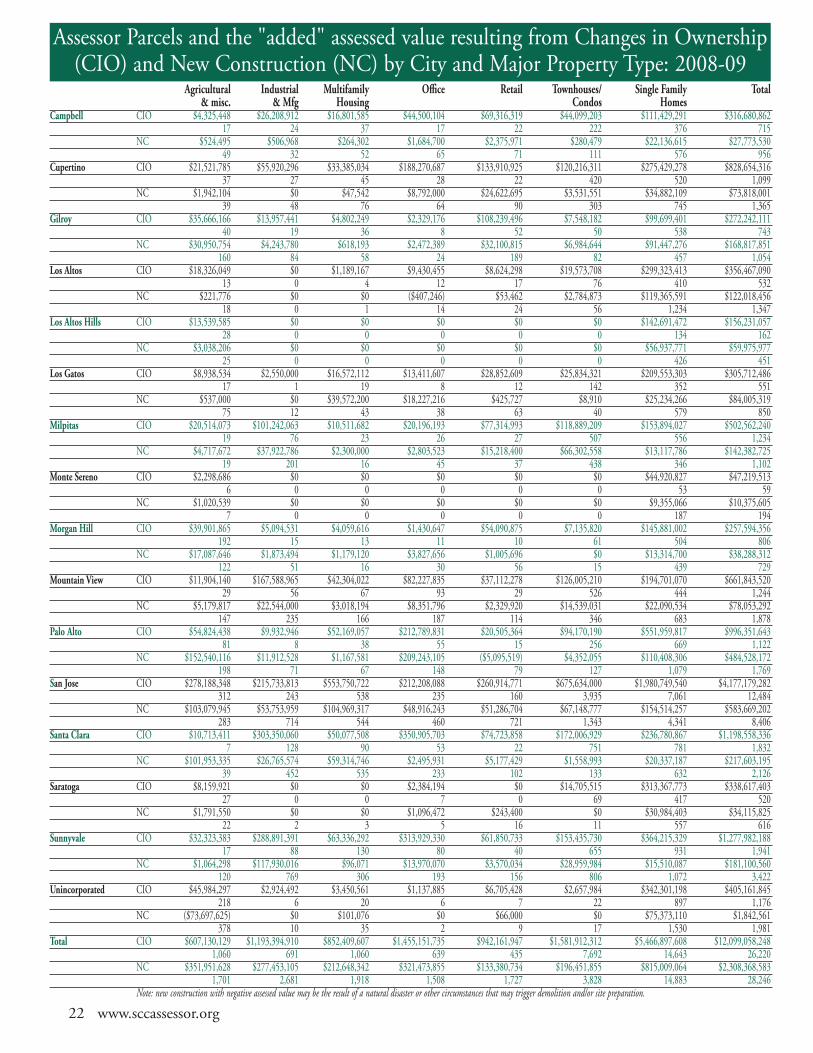
Assessor Parcels and the "added" assessed value resulting from Changes in Ownership(CIO) and New Construction (NC) by City and Major Property Type: 2008-09
Agricultural Industrial Multifamily Office Retail Townhouses/ Single Family Total& misc. & Mfg Housing Condos Homes
Campbell CIO $4,325,448 $26,208,912 $16,801,585 $44,500,104 $69,316,319 $44,099,203 $111,429,291 $316,680,86217 24 37 17 22 222 376 715
NC $524,495 $506,968 $264,302 $1,684,700 $2,375,971 $280,479 $22,136,615 $27,773,53049 32 52 65 71 111 576 956
Cupertino CIO $21,521,785 $55,920,296 $33,385,034 $188,270,687 $133,910,925 $120,216,311 $275,429,278 $828,654,31637 27 45 28 22 420 520 1,099
NC $1,942,104 $0 $47,542 $8,792,000 $24,622,695 $3,531,551 $34,882,109 $73,818,00139 48 76 64 90 303 745 1,365
Gilroy CIO $35,666,166 $13,957,441 $4,802,249 $2,329,176 $108,239,496 $7,548,182 $99,699,401 $272,242,11140 19 36 8 52 50 538 743
NC $30,950,754 $4,243,780 $618,193 $2,472,389 $32,100,815 $6,984,644 $91,447,276 $168,817,851160 84 58 24 189 82 457 1,054
Los Altos CIO $18,326,049 $0 $1,189,167 $9,430,455 $8,624,298 $19,573,708 $299,323,413 $356,467,09013 0 4 12 17 76 410 532
NC $221,776 $0 $0 ($407,246) $53,462 $2,784,873 $119,365,591 $122,018,45618 0 1 14 24 56 1,234 1,347
Los Altos Hills CIO $13,539,585 $0 $0 $0 $0 $0 $142,691,472 $156,231,05728 0 0 0 0 0 134 162
NC $3,038,206 $0 $0 $0 $0 $0 $56,937,771 $59,975,97725 0 0 0 0 0 426 451
Los Gatos CIO $8,938,534 $2,550,000 $16,572,112 $13,411,607 $28,852,609 $25,834,321 $209,553,303 $305,712,48617 1 19 8 12 142 352 551
NC $537,000 $0 $39,572,200 $18,227,216 $425,727 $8,910 $25,234,266 $84,005,31975 12 43 38 63 40 579 850
Milpitas CIO $20,514,073 $101,242,063 $10,511,682 $20,196,193 $77,314,993 $118,889,209 $153,894,027 $502,562,24019 76 23 26 27 507 556 1,234
NC $4,717,672 $37,922,786 $2,300,000 $2,803,523 $15,218,400 $66,302,558 $13,117,786 $142,382,72519 201 16 45 37 438 346 1,102
Monte Sereno CIO $2,298,686 $0 $0 $0 $0 $0 $44,920,827 $47,219,5136 0 0 0 0 0 53 59
NC $1,020,539 $0 $0 $0 $0 $0 $9,355,066 $10,375,6057 0 0 0 0 0 187 194
Morgan Hill CIO $39,901,865 $5,094,531 $4,059,616 $1,430,647 $54,090,875 $7,135,820 $145,881,002 $257,594,356192 15 13 11 10 61 504 806
NC $17,087,646 $1,873,494 $1,179,120 $3,827,656 $1,005,696 $0 $13,314,700 $38,288,312122 51 16 30 56 15 439 729
Mountain View CIO $11,904,140 $167,588,965 $42,304,022 $82,227,835 $37,112,278 $126,005,210 $194,701,070 $661,843,52029 56 67 93 29 526 444 1,244
NC $5,179,817 $22,544,000 $3,018,194 $8,351,796 $2,329,920 $14,539,031 $22,090,534 $78,053,292147 235 166 187 114 346 683 1,878
Palo Alto CIO $54,824,438 $9,932,946 $52,169,057 $212,789,831 $20,505,364 $94,170,190 $551,959,817 $996,351,64381 8 38 55 15 256 669 1,122
NC $152,540,116 $11,912,528 $1,167,581 $209,243,105 ($5,095,519) $4,352,055 $110,408,306 $484,528,172198 71 67 148 79 127 1,079 1,769
San Jose CIO $278,188,348 $215,733,813 $553,750,722 $212,208,088 $260,914,771 $675,634,000 $1,980,749,540 $4,177,179,282312 243 538 235 160 3,935 7,061 12,484
NC $103,079,945 $53,753,959 $104,969,317 $48,916,243 $51,286,704 $67,148,777 $154,514,257 $583,669,202283 714 544 460 721 1,343 4,341 8,406
Santa Clara CIO $10,713,411 $303,350,060 $50,077,508 $350,905,703 $74,723,858 $172,006,929 $236,780,867 $1,198,558,3367 128 90 53 22 751 781 1,832
NC $101,953,335 $26,765,574 $59,314,746 $2,495,931 $5,177,429 $1,558,993 $20,337,187 $217,603,19539 452 535 233 102 133 632 2,126
Saratoga CIO $8,159,921 $0 $0 $2,384,194 $0 $14,705,515 $313,367,773 $338,617,40327 0 0 7 0 69 417 520
NC $1,791,550 $0 $0 $1,096,472 $243,400 $0 $30,984,403 $34,115,82522 2 3 5 16 11 557 616
Sunnyvale CIO $32,323,383 $288,891,391 $63,336,292 $313,929,330 $61,850,733 $153,435,730 $364,215,329 $1,277,982,18817 88 130 80 40 655 931 1,941
NC $1,064,298 $117,930,016 $96,071 $13,970,070 $3,570,034 $28,959,984 $15,510,087 $181,100,560120 769 306 193 156 806 1,072 3,422
Unincorporated CIO $45,984,297 $2,924,492 $3,450,561 $1,137,885 $6,705,428 $2,657,984 $342,301,198 $405,161,845218 6 20 6 7 22 897 1,176
NC ($73,697,625) $0 $101,076 $0 $66,000 $0 $75,373,110 $1,842,561378 10 35 2 9 17 1,530 1,981
Total CIO $607,130,129 $1,193,394,910 $852,409,607 $1,455,151,735 $942,161,947 $1,581,912,312 $5,466,897,608 $12,099,058,2481,060 691 1,060 639 435 7,692 14,643 26,220
NC $351,951,628 $277,453,105 $212,648,342 $321,473,855 $133,380,734 $196,451,855 $815,009,064 $2,308,368,5831,701 2,681 1,918 1,508 1,727 3,828 14,883 28,246
Note: new construction with negative assessed value may be the result of a natural disaster or other circumstances that may trigger demolition and/or site preparation.

www.sccassessor.org 23
(assessed value in millions)
Major Changes in Ownership* 2008-2009
Company (Assessee) Property Type City Net Value+Cupertino City Center Building Office Cupertino $208.00Blackhawk Parent LLC Office Sunnyvale $180.74Blackhawk Parent LLC Office Sunnyvale $139.08Bea Systems Inc Office San Jose $135.86Blackhawk Parent LLC Office Sunnyvale $124.03SPF Mathilda LLC Office Sunnyvale $121.90NOP 650 Page Mill LLC Office Palo Alto $117.30Campus @ North 1St LP Land Sale San Jose $110.16Arden Realty Limited Partnership Office Palo Alto $109.70Santa Clara Towers II LP Office Santa Clara $109.61* Includes partial or completed construction.+ Assessed value of new construction only (net change in assessed value).
(assessed value in millions)
Major New Construction* 2008-2009
Company (Assessee) Property Type City Net Value+VMware, Inc Office Palo Alto $110.93Fourth Avenue LLC Apartment Santa Clara $67.50The Irvine Company LLC Apartment San Jose $63.26Lockheed Martin Industrial Sunnyvale $45.77Sobrato Land Holdings Apartment Los Gatos $39.31eBay Inc Office San Jose $26.83Roem Development Corp Apartment San Jose $25.70Health Care Reit Inc Res. Care Facility Gilroy $23.60Costco Wholesale Corp Retail San Jose $16.80A & P Children Inv. LLC Office Palo Alto $15.28* Income generating properties only. + Includes only properties with 100% change in ownership.
...the largest
home in Santa
Clara County
is 19,951
square feet &
the net assessed
value is $9.6
million.
However, the
home with the
highest net
assessed value
is $16.9 mil-
lion & 10,338
square feet...
Appraising and Assessing: Is There a Difference?
Yes. An appraisal is the process of estimatingvalue. Most taxpayers assume the market placeexclusively determines a property’s assessment.However, the market value may be only onecomponent in the process of determining theproperty’s assessed value. While at least one ofthe three approaches to value, (1) market, (2)income, and (3) cost, is always considered in theappraisal of a property, the Assessor is required
to incorporate additional factors when deter-mining when and how to assess property understate law. Frequently, court decisions, laws, andrules promulgated by the state Legislature andState Board of Equalization amend the assess-ment process, and redefine what, when and/orhow the Assessor must determine the assessedvalue of a property.

24 www.sccassessor.org
2008-2009 Net Secured Assessed Value (AV) and Number of Parcels (APN)
by City, Redevelopment Agency (RDA) and Major Property Type (Value in Millions)
Sing
le F
amily
M
obile
hom
eM
ulti
fam
ilyIn
dust
rial
&R
etai
lO
ffic
eA
gric
ultu
ral/
Tota
l Net
Oth
erH
omeo
wne
rH
ousi
ngH
ousi
ngM
anuf
actu
ring
Mis
c.Se
cure
d*Ex
empt
ions
Exem
ptio
nC
ampb
ellCity
Val
$3,740.27
$4.79
$628.66
$254.51
$446.03
$344.08
$58.12
$5,476.46
$73.80
$46.24
APN
9,414
61731
130
182
146
169
10,833
746,507
RDA
Val
$116.05
$0.08
$75.20
$197.78
$77.66
$177.96
$10.78
$655.53
$8.44
$1.03
APN
272
119
195
7568
39669
23147
Total
Val
$3,856.32
$4.87
$703.86
$452.30
$523.69
$522.05
$68.90
$6,131.99
$82.24
$47.27
APN
9,686
62750
325
257
214
208
11,502
976,654
Cup
erti
noCity
Val
$8,794.62
$791.68
$828.98
$515.58
$1,341.76
$194.92
$12,467.53
$99.95
$78.60
APN
14,969
582
75150
210
292
16,278
6511,226
RDA
Val
$146.44
$23.65
$170.10
$0.00
$0.00
APN
132
150
0Total
Val
$8,794.62
$791.68
$828.98
$662.02
$1,365.41
$194.92
$12,637.62
$99.95
$78.60
APN
14,969
582
75163
212
292
16,293
6511,226
Gilr
oyTotal
Val
$4,447.87
$8.96
$324.13
$357.90
$770.31
$89.49
$489.90
$6,488.55
$169.77
$46.39
APN
10,466
133
578
210
325
991,039
12,850
996,630
Los
Alt
osTotal
Val
$8,198.63
$116.77
$7.23
$241.09
$314.82
$80.87
$8,959.41
$84.01
$55.82
APN
10,086
9234
196
291
137
10,836
617,977
Los
Alt
os H
ills
Total
Val
$4,574.13
$0.05
$1.85
$175.96
$4,751.98
$27.38
$15.63
APN
2,877
117
217
3,112
122,234
Los
Gat
osCity
Val
$5,562.32
$2.55
$396.16
$109.43
$186.89
$348.72
$247.04
$6,853.11
$180.15
$41.82
APN
8,090
45365
5680
209
339
9,184
515,977
RDA
Val
$711.51
$83.61
$7.78
$197.27
$84.63
$12.09
$1,096.88
$11.24
$4.22
APN
958
104
8149
6842
1,329
15604
Total
Val
$6,273.83
$2.55
$479.78
$117.20
$384.16
$433.34
$259.13
$7,949.99
$191.39
$46.05
APN
9,048
45469
64229
277
381
10,513
666,581
Milp
itas
City
Val
$4,242.43
$21.41
$320.82
$1,151.29
$317.99
$127.29
$168.30
$6,349.52
$126.71
$56.31
APN
11,688
343
340
244
63107
151
12,936
668,049
RDA
Val
$1,626.26
$100.17
$1,515.68
$747.60
$113.05
$146.94
$4,249.70
$83.03
$15.65
APN
3,754
10204
131
64172
4,335
192,237
Total
Val
$5,868.69
$21.41
$420.98
$2,666.96
$1,065.59
$240.34
$315.24
$10,599.22
$209.75
$71.97
APN
15,442
343
350
448
194
171
323
17,271
8510,286
Mon
te S
eren
o Total
Val
$1,414.88
$0.85
$33.81
$1,449.54
$3.45
$6.48
APN
1,206
244
1,252
2926
Mor
gan
Hill City
Val
$3,694.37
$12.52
$33.90
$334.33
$100.52
$47.76
$263.88
$4,487.28
$28.98
$36.50
APN
6,803
143
2255
3213
414
7,482
285,069
RDA
Val
$999.97
$12.32
$207.98
$269.12
$283.27
$71.45
$147.83
$1,991.95
$131.91
$12.32
APN
2,525
258
285
170
168
82466
3,954
391,758
Total
Val
$4,694.35
$24.84
$241.88
$603.45
$383.79
$119.21
$411.71
$6,479.22
$160.89
$48.82
APN
9,328
401
307
225
200
95880
11,436
676,827

www.sccassessor.org 25
Mou
ntai
n V
iew
City
Val
$6,800.23
$26.86
$1,855.12
$1,468.93
$763.16
$807.07
$155.30
$11,876.67
$291.30
$76.57
APN
15,066
434
1,518
362
387
343
270
18,380
8110,935
RDA
Val
$92.75
$10.97
$27.02
$1,114.90
$85.71
$486.49
$29.59
$1,847.42
$30.21
$1.36
APN
159
177
2066
8164
12579
8194
Total
Val
$6,892.98
$37.83
$1,882.14
$2,583.83
$848.88
$1,293.55
$184.88
$13,724.10
$321.51
$77.92
APN
15,225
611
1,538
428
468
407
282
18,959
8911,129
Palo
Alt
oTotal
Val
$12,152.83
$0.07
$1,009.08
$1,964.29
$1,069.06
$2,286.66
$898.16
$19,380.15
$1,871.29
$89.63
APN
17,427
7871
216
451
468
486
19,926
231
12,806
San
Jose
City
Val
$79,126.27
$294.16
$8,174.73
$3,983.78
$4,989.70
$2,252.85
$2,095.26
$100,916.74
$3,053.31
$974.53
APN
203,846
5,260
9,937
1,774
2,599
1,550
3,734
228,700
1,243
138,936
RDA
Val
$1,214.43
$38.42
$1,421.31
$6,947.19
$1,197.71
$3,611.93
$824.17
$15,255.18
$348.26
$14.74
APN
3,199
759
105
1,029
378
404
523
6,397
532,107
Total
Val
$80,340.70
$332.58
$9,596.04
$10,930.97
$6,187.41
$5,864.77
$2,919.43
$116,171.92
$3,401.57
$989.28
APN
207,045
6,019
10,042
2,803
2,977
1,954
4,257
235,097
1,296
141,043
Sant
a C
laraCity
Val
$8,668.96
$0.13
$2,332.85
$5,046.73
$1,065.01
$1,345.00
$339.11
$18,797.79
$1,473.98
$117.65
APN
24,190
11,984
961
462
231
243
28,072
187
16,807
RDA
Val
$18.76
$212.97
$226.65
$1,376.97
$30.31
$1,865.67
$18.05
$0.00
APN
120
2276
13132
50
Total
Val
$8,668.96
$0.13
$2,351.61
$5,259.70
$1,291.65
$2,721.97
$369.42
$20,663.45
$1,492.02
$117.65
APN
24,190
11,985
981
484
307
256
28,204
192
16,807
Sara
toga
Total
Val
$9,506.97
$0.05
$11.28
$22.68
$104.09
$110.59
$137.80
$9,893.47
$158.45
$56.98
APN
10,485
123
4671
85330
11,041
488,144
Sunn
yval
eCity
Val
$10,836.26
$176.51
$2,642.07
$5,506.65
$986.71
$1,290.51
$256.03
$21,694.74
$199.08
$146.67
APN
26,654
2,319
2,067
667
359
303
268
32,637
151
20,954
RDA
Val
$97.48
$40.82
$211.63
$357.47
$1.98
$709.37
$13.52
$0.91
APN
250
3491
493
427
5130
Total
Val
$10,933.74
$176.51
$2,682.90
$5,506.65
$1,198.34
$1,647.97
$258.01
$22,404.11
$212.60
$147.58
APN
26,904
2,319
2,101
667
450
352
271
33,064
156
21,084
Uni
ncor
pora
ted
City
Val
$11,281.39
$1.13
$188.91
$163.86
$108.84
$44.61
$2,298.78
$14,087.51
$2,203.18
$109.10
APN
22,061
40493
341
242
697,256
30,502
221
15,588
RDA
Val
$0.00
$0.00
$0.00
$0.00
APN
22
00
Total
Val
$11,281.39
$1.13
$188.91
$163.86
$108.84
$44.61
$2,298.79
$14,087.51
$2,203.18
$109.10
APN
22,061
40493
341
242
697,258
30,504
221
15,588
Sant
a C
lara
Cou
nty
Gra
nd T
otal
City
Val
$183,042.43
$549.19
$18,826.16
$21,203.27
$11,664.97
$10,751.21
$7,893.22
$253,930.44
$10,044.78
$1,954.93
APN
395,328
8,788
19,603
5,190
5,599
4,124
15,389
454,021
2,620
278,765
RDA
Val
$4,858.45
$61.80
$1,974.88
$10,265.42
$3,173.96
$6,303.59
$1,203.70
$27,841.80
$644.66
$50.24
APN
11,117
1,195
578
1,692
1,108
877
1,272
17,839
167
7,177
TOTAL
Val
$187,900.88
$610.99
$20,801.04
$31,468.69
$14,838.92
$17,054.80
$9,096.92
$281,772.24
$10,689.44
$2,005.17
APN
406,445
9,983
20,181
6,882
6,707
5,001
16,661
471,860
2,787
285,942
*Includes other exemptions, excludes homeowner exemption.

26 www.sccassessor.org
2008-2009 Net Secured Assessed Value (AV) and Number of Parcels (APN)
by High School and Elementary Districts (ESD) and by Major Property Type (Value in Millions)
Sing
le F
amily
M
obile
hom
eM
ulti
fam
ily
Indu
stri
al &
R
etai
lO
ffic
eA
gric
ultu
ral &
To
tal S
ecur
ed
Oth
erH
ome
Ow
ner
Hou
sing
Hou
sing
Man
ufac
turi
ngM
isce
llane
ous
Net
AV
**Ex
empt
ion
Exem
ptio
nC
ampb
ell U
nion
Hig
h Sc
hool
Dis
tric
t*Burbank ESD
Val
$170.99
$0.09
$83.60
$0.59
$27.06
$17.54
$3.84
$303.71
$7.82
$2.15
APN
590
1183
176
2725
903
2308
Cambrian ESD
Val
$3,138.89
$0.39
$422.16
$186.66
$276.21
$149.71
$188.42
$4,362.43
$64.31
$41.14
APN
8,272
6472
130
179
101
989,258
445,780
Campbell ESD
Val
$8,567.74
$6.74
$2,113.30
$356.29
$1,496.35
$1,102.74
$266.30
$13,909.46
$396.22
$98.37
APN
20,450
891,987
245
526
491
379
24,167
156
14,050
Moreland ESD*
Val
$4,177.27
$0.03
$830.33
$14.18
$405.35
$206.73
$43.05
$5,676.93
$107.55
$54.93
APN
10,632
11,089
10112
100
8212,026
637,848
Union ESD
Val
$5,564.33
$0.03
$252.01
$257.83
$129.36
$112.40
$76.89
$6,392.85
$63.79
$69.50
APN
13,569
1380
1547
64156
14,232
629,933
Total
Val
$21,619.22
$7.28
$3,701.39
$815.54
$2,334.33
$1,589.13
$578.49
$30,645.39
$639.69
$266.10
APN
53,513
984,111
401
940
783
740
60,586
327
37,919
East
Sid
e U
nion
Hig
h Sc
hool
Dis
tric
tAlum Rock ESD
Val
$5,808.31
$3.39
$526.29
$113.64
$373.53
$175.73
$201.58
$7,202.49
$399.03
$79.54
APN
19,045
116
857
65246
190
542
21,061
149
11,051
Berryessa ESD
Val
$7,579.21
$0.25
$214.40
$355.24
$187.23
$30.72
$129.33
$8,496.39
$112.99
$100.47
APN
21,398
492
147
6414
369
22,088
7614,361
Evergreen ESD
Val
$12,793.20
$30.51
$161.66
$108.33
$569.80
$54.40
$289.94
$14,007.84
$156.27
$122.11
APN
25,149
539
7223
195
55373
26,406
102
17,451
Franklin McK ESD
Val
$4,940.08
$105.57
$596.93
$841.88
$470.53
$76.18
$141.76
$7,172.93
$549.13
$65.37
APN
14,226
2,014
717
620
217
81415
18,290
128
9,343
Mt Plsnt ESD
Val
$1,801.37
$0.04
$9.67
$6.26
$33.41
$2.77
$43.49
$1,897.03
$30.41
$21.56
APN
4,978
128
1211
9146
5,185
303,082
Oak Grove ESD
Val
$8,695.16
$78.26
$922.08
$1,488.57
$281.23
$157.45
$231.06
$11,853.80
$333.23
$119.39
APN
25,007
1,202
407
176
90106
189
27,177
9917,061
Orchard ESD
Val
$943.81
$42.94
$782.77
$3,052.24
$260.79
$1,620.39
$319.60
$7,022.53
$79.28
$12.42
APN
2,043
836
28763
60215
144
4,089
401,776
Total
Val
$42,561.14
$260.96
$3,213.81
$5,966.16
$2,176.52
$2,117.65
$1,356.76
$57,653.01
$1,660.35
$520.85
APN
111,846
4,712
2,201
1,806
883
670
2,178
124,296
624
74,125
Frem
ont U
nion
Hig
h Sc
hool
Dis
tric
t*Cupertino ESD
Val
$19,213.77
$0.02
$1,643.46
$842.20
$1,118.30
$1,466.14
$454.71
$24,738.60
$203.35
$192.23
APN
35,763
11,564
110
333
329
482
38,582
139
27,461
Montebello ESD
Val
$85.33
$0.00
$0.27
$2.02
$0.02
$0.00
$50.83
$138.47
$0.00
$0.55
APN
111
-2
31
-103
220
078
Sunnyvale ESD*
Val
$5,829.11
$42.11
$1,860.27
$5,155.97
$905.30
$1,422.36
$173.74
$15,388.85
$151.63
$76.70
APN
15,162
584
1,328
615
352
303
196
18,540
9910,958
Total
Val
$25,128.21
$42.13
$3,504.00
$6,000.19
$2,023.62
$2,888.50
$679.28
$40,265.92
$354.97
$269.48
APN
51,036
585
2,894
728
686
632
781
57,342
238
38,497

www.sccassessor.org 27
*Basic Aid School Districts
Gilr
oy U
nifie
d Sc
hool
Dis
tric
tTotal
Val
$5,325.62
$9.20
$327.15
$381.82
$771.58
$89.86
$1,080.44
$7,985.68
$171.19
$55.69
APN
11,949
143
602
234
330
100
2,823
16,181
106
7,957
Los
Gat
os-S
arat
oga
Join
t Uni
on H
igh
Scho
ol D
istr
ict*
Lakeside ESD*
Val
$87.42
$0.00
$0.40
$0.79
$0.00
$0.00
$17.09
$105.70
$1.25
$0.90
APN
170
-1
14-
-121
306
2129
Loma Prieta ESD*
Val
$162.87
$0.00
$2.40
$5.26
$0.00
$0.00
$19.53
$190.06
$0.85
$1.62
APN
325
-3
33-
-236
597
2232
Los Gatos ESD*
Val
$6,556.57
$2.56
$270.94
$93.08
$339.85
$303.04
$268.80
$7,834.86
$187.30
$43.29
APN
8,509
47259
143
223
183
1,007
10,371
566,187
Saratoga ESD*
Val
$7,335.65
$0.05
$8.19
$11.14
$63.45
$33.50
$199.42
$7,651.41
$151.06
$36.52
APN
6,761
118
3757
28470
7,372
295,220
Total
Val
$14,142.51
$2.61
$281.94
$110.27
$403.31
$336.55
$504.84
$15,782.03
$340.47
$82.34
APN
15,765
48281
227
280
211
1,834
18,646
8911,768
Milp
itas
Uni
fied
Scho
ol D
istr
ict
Total
Val
$5,906.76
$21.38
$368.67
$2,570.03
$1,063.20
$238.47
$382.78
$10,551.29
$196.67
$72.58
APN
15,503
343
349
432
191
170
629
17,617
8410,374
Mor
gan
Hill
Uni
fied
Scho
ol D
istr
ict
Total
Val
$7,313.35
$25.30
$254.58
$785.73
$417.46
$125.56
$1,353.07
$10,275.06
$173.99
$76.39
APN
14,924
420
339
287
242
101
3,228
19,541
9410,764
Mt V
iew
-Los
Alt
os U
nion
Hig
h Sc
hool
Dis
tric
t*Los Altos ESD
Val
$12,079.40
$0.05
$260.77
$10.91
$367.00
$486.38
$269.33
$13,473.83
$117.49
$72.72
APN
13,477
1143
60248
323
358
14,610
8110,392
Mountain View ESD
Val
$5,672.18
$37.83
$1,688.74
$2,556.29
$709.43
$1,304.69
$197.00
$12,166.17
$333.54
$65.07
APN
12,739
611
1,436
467
415
383
259
16,310
849,292
Total
Val
$17,751.57
$37.88
$1,949.52
$2,567.20
$1,076.43
$1,791.07
$466.34
$25,640.00
$451.03
$137.79
APN
26,216
612
1,579
527
663
706
617
30,920
165
19,684
Palo
Alt
o U
nifie
d Sc
hool
Dis
tric
t*Total
Val
$14,294.23
$0.07
$1,009.15
$1,893.82
$1,061.82
$2,269.98
$1,077.65
$21,606.73
$3,978.99
$99.84
APN
19,236
7890
171
445
461
634
21,844
343
14,265
Patt
erso
n Jo
int H
igh
Scho
ol D
istr
ict
Total
Val
$0.42
$0.07
$0.00
$0.00
$0.00
$0.00
$13.96
$14.45
$0.00
$0.15
APN
11
--
--
428
430
121
Nor
th (
San
Ben
ito)
Cou
nty
Join
t Uni
on S
choo
l Dis
tric
tTotal
Val
$0.00
$0.07
$0.00
$0.00
$0.26
$0.00
$28.12
$28.45
$0.00
$0.04
APN
-1
--
2-
215
218
06
San
Jose
Uni
fied
Hig
h Sc
hool
Dis
tric
tTotal
Val
$23,581.63
$26.97
$3,129.94
$1,119.07
$2,136.51
$2,383.54
$891.75
$33,269.40
$1,134.07
$278.18
APN
58,721
444
4,805
821
1,553
856
2,100
69,300
476
39,740
Sant
a C
lara
Uni
fied
Hig
h Sc
hool
Dis
tric
t*Total
Val
$10,276.21
$177.08
$3,060.90
$9,258.85
$1,373.89
$3,224.49
$683.43
$28,054.84
$1,588.03
$145.74
APN
27,735
2,569
2,130
1,248
492
311
454
34,939
240
20,822
Sant
a C
lara
Cou
nty
Hig
h Sc
hool
Dis
tric
ts G
rand
Total
Val
$187,900.88
$610.99
$20,801.04
$31,468.69
$14,838.92
$17,054.80
$9,096.92
$281,772.24
$10,689.44
$2,005.17
APN
406,445
9,983
20,181
6,882
6,707
5,001
16,661
471,860
2,787
285,942
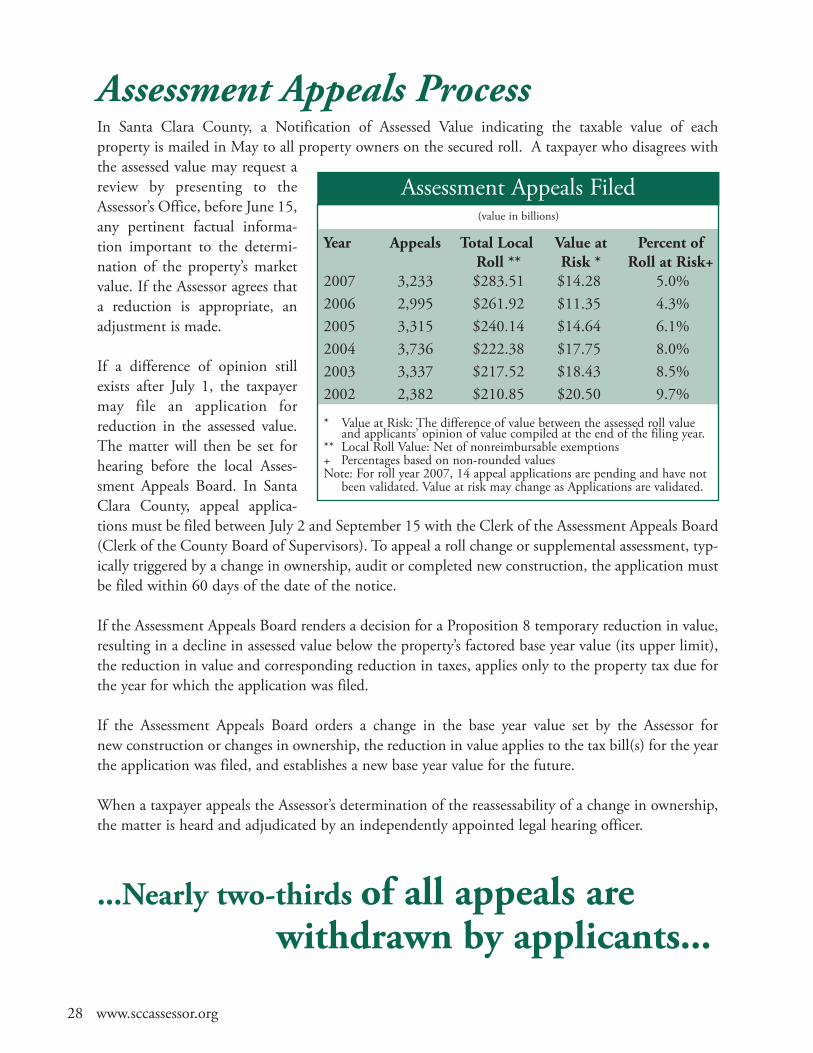
28 www.sccassessor.org
Assessment Appeals ProcessIn Santa Clara County, a Notification of Assessed Value indicating the taxable value of each property is mailed in May to all property owners on the secured roll. A taxpayer who disagrees withthe assessed value may request areview by presenting to theAssessor’s Office, before June 15,any pertinent factual informa-tion important to the determi-nation of the property’s marketvalue. If the Assessor agrees thata reduction is appropriate, anadjustment is made.
If a difference of opinion stillexists after July 1, the taxpayermay file an application for reduction in the assessed value.The matter will then be set forhearing before the local Asses-sment Appeals Board. In SantaClara County, appeal applica-tions must be filed between July 2 and September 15 with the Clerk of the Assessment Appeals Board(Clerk of the County Board of Supervisors). To appeal a roll change or supplemental assessment, typ-ically triggered by a change in ownership, audit or completed new construction, the application mustbe filed within 60 days of the date of the notice.
If the Assessment Appeals Board renders a decision for a Proposition 8 temporary reduction in value,resulting in a decline in assessed value below the property’s factored base year value (its upper limit),the reduction in value and corresponding reduction in taxes, applies only to the property tax due forthe year for which the application was filed.
If the Assessment Appeals Board orders a change in the base year value set by the Assessor for new construction or changes in ownership, the reduction in value applies to the tax bill(s) for the yearthe application was filed, and establishes a new base year value for the future.
When a taxpayer appeals the Assessor’s determination of the reassessability of a change in ownership,the matter is heard and adjudicated by an independently appointed legal hearing officer.
...Nearly two-thirds of all appeals are withdrawn by applicants...
(value in billions)
Assessment Appeals Filed
Year Appeals Total Local Value at Percent ofRoll ** Risk * Roll at Risk+
2007 3,233 $283.51 $14.28 5.0%2006 2,995 $261.92 $11.35 4.3%2005 3,315 $240.14 $14.64 6.1%2004 3,736 $222.38 $17.75 8.0%2003 3,337 $217.52 $18.43 8.5%2002 2,382 $210.85 $20.50 9.7%
* Value at Risk: The difference of value between the assessed roll valueand applicants’ opinion of value compiled at the end of the filing year.
** Local Roll Value: Net of nonreimbursable exemptions+ Percentages based on non-rounded valuesNote: For roll year 2007, 14 appeal applications are pending and have notbeen validated. Value at risk may change as Applications are validated.

Homeowners File More AssessmentAppeals; Business Property OwnersContest Fewer AssessmentsWith the residential market reeling from the mortgage meltdown, the number of appeals filed by homeowners (1,186) has increased 90 percent over the prior year. However, appeals filed by busi-ness property owners (2,047) declined14 percent reflecting improvements inthe technology industry.
While the total number of appeals hasincreased 8 percent, the more complexassessment appeals filed by business,commercial and industrial propertyowners and major corporations stillaccount for 63 percent of assessmentappeals. The complexity of valuationissues and the amount of taxes in dispute(or at risk) is much greater in assessmentappeals filed by commercial/industrialproperty owners, or by companies withexpensive business machinery, equip-ment, computers and fixtures.
Between July 1, 2007 and June 30,2008, there were 2,953 appeals resolved. The Board provided an adjustment—an increase or decreasein assessed value—to 664 applicants and heard 72 appeals. Additionally, 95 percent of the Assessor’soriginally enrolled assessed values, disputed by appellants, were retained.
www.sccassessor.org 29
Appeals Comparison4,0003,5003,0002,5002,0001,500100050002002 2003 2004 2005 2006 2007
Total Appeals (sum of below)Appeals by owners ofresidential properties
Appeals by all othertaxpayers
2,382
3,337
3,7363,315
2,995
Q. Can I transfer my current assessed value to mynew home to avoid paying higher property taxes?
A. Yes, under Proposition 60, if you are age 55or older and qualify. When a senior citizen sellsan existing residence and purchases or constructs a replacement residence valued thesame or less than the residence sold, theAssessor can transfer the assessment (factoredbase year value) of the original residence, to thereplacement residence anywhere in Santa ClaraCounty. Additionally, Santa Clara and six other counties currently participate in Prop90, and will accept base year transfers from any other county throughout California.Propositions 60/90 require timely filing, are subject to approval by the Assessor, and can be granted only once. To receive moreinformation or an application, go towww.sccassessor.org.
Q. I plan to transfer my home to my child; canhe/she retain my same assessment?
A. Yes, upon qualification. The voters ofCalifornia modified the Constitution(Propositions 58 and 193) to allow parents andin some cases grandparents who want to keeptheir home “in the family” to transfer theirassessed value to their children or even grand-children in certain circumstances. Tax relief isprovided when real property transfers occurbetween parents and their children (Proposition58) or from grandparents to grandchildren(Proposition 193) if the parents are no longerliving. Interested taxpayers should contact the Assessor to receive more information and an application. All claims must be filed timely and are subject to final approval by theAssessor. Visit the Assessor’s website for moreinformation.
Frequently Asked Questions
3,233

30 www.sccassessor.org
Performance CountsLed by County Assessor Larry Stone, the Assessor’s Office has embarked on an ambitious per-formance based budgeting and management initiative. Based on the simple idea that what getsmeasured gets done, the new system establishes a clear mission statement, measurable perform-ance indicators designed to quantify improvement over time, all tied directly to the budget.
Last year, 479 customers responded to ourrequest to complete an anonymous customer sat-isfaction questionnaire. While tailored to theunique services provided by the differentDivisions, each single-page survey asks customersto rate the services received in the following cate-gories: Courtesy, Professionalism, Helpfulness,Promptness, Clarity of Information, and OverallService. Above is the data summed for each
Division for last year, and the prior two years.
Overall, the Assessor’s Office received a customerservice grade of 89.3 percent, virtually the samerating as the last year. To calculate the office’soverall customer service grade, each Division’sannualized data is aggregated, and weighted basedon relative size.
What Our Customers are SayingEach year, scores of customers respond to customer surveys with comments about the
office and the staff. Below is a small sample.
“The staff was excellent over the phone. Thank you.”
“Staff was very, very helpful, courteous and more offices should be like this one.They care, are polite and great.”
“We were very happy with the help we got, but unhappy with the results of ourclaim.”
“A lot more helpful than I anticipated . Wait time very short.”
“The appraiser quickly grasped the problem and resolved the issue.”
“Made everything easier than I thought.”
Customer Feedback: Division Results100%
90%
80%
70%
60%
50%
2005 2006 2007
Admin Standards/Services
InformationSystems
RealProperty
Business Exemption Overall

www.sccassessor.org 31
2006-2007 Performance Measures
More of What Our Customers are Saying
The following are the Assessor’s comprehensive performance measures. By reporting high-level quan-titative and qualitative data that tracks levels of customer satisfaction, timeliness of product delivery,accuracy of assessments and overall financial efficiency, these measures allow the Assessor to identifyand record service levels from year to year, which are designed to achieve specific continuous improve-ment objectives. The data is compiled from the results of similar, more detailed measures in eachDivision of the Assessor’s Office. The performance measures in each Division were developed in col-laboration with both line staff and managers.
1. 97.3% of assessments were completed byJuly 1, 2006.
Why is this important? The assessment roll isthe basis by which property taxes are levied. Thecompleteness of the assessment roll assures publicagencies dependent upon property tax revenuethat the roll accurately reflects current marketactivity.
2. 154 is the average number of days to deliver supplemental assessments to the Tax Collector.
Why is this important? Supplemental assess-ments occur upon a “change in ownership” or “newconstruction” of real property. This performancemeasure insures timely notification to those prop-erty owners who acquire or complete new con-struction of their property.
3. 99.8% of assigned mandatory audits werecompleted by June 30, 2006.
Why is this important? State statute requires theAssessor to audit, every four years, all businesseswith assets valued at $400,000 or more located inSanta Clara County. This performance measuredetermines the timeliness of conducting thesemandatory audits.
4. 438 is the average number of days to closean assessment appeal.
Why is this important? By statute, assessmentappeals must be resolved within two years of fil-ing, unless a waiver is executed by the taxpayer.This performance measure insures a timely equal-ization of assessments for property owners.
5. Department’s customer satisfaction rating from surveys is 90.0%
Why is this important? This outcome measurerates the satisfaction level of both our internaland external customers who rely on the Assessorfor timely service and accurate information.
6. The Cost Efficiency Index is 56Why is this important? The Cost EfficiencyIndex determines the cost efficiency of producinga product and/or work item compared to prior base year cost. As the measure does notaccount for inflation, a new, more accurate meas-ure is being developed.
7. Total expenditures were 97% of the budget in FY 2007.
Why is this important? The budget/cost ratiocompares the department’s actual bottom lineexpenditures at the end of the fiscal year to thebudget to insure that costs do not exceed antici-pated resources.
“During this period of profound grief due to the loss of my husband, your staffmade it very easy to work through this process.”
“Actually, I was quite impressed with your professionalism and hospitality. Thevisit was very helpful and all staff were pleasant. Thank you. Keep up the goodwork.”

32 www.sccassessor.org
Frequently Asked QuestionsQ. My house was destroyed by a fire. Is property tax
relief available until it’s rebuilt?
A. Yes, assuming you qualify. Owners of realproperty who incur significant damages (at leastten-thousand dollars or more) as the result of anatural disaster, such as a fire, flood or earth-quake, can file for temporary property tax relief(reassessment) with the Assessor’s Office.Applicants must file a written application within60 days of the disaster. Items such as home fur-nishings, personal effects and business inventoriesare not assessable.
Q. What can I do if I think my assessment is toohigh (i.e., higher than market value)?
A. Request an informal review by submitting aone-page “assessment review” form which is avail-able on-line for printing or downloading atwww.sccassessor.org. Any supporting data(appraisals, comparables, multiple listings, etc.)
will be helpful in expediting a reduction if anadjustment is warranted. To file a formal appealwith the Assessment Appeals Board, contact the Clerk of the Board at www.sccgov.org or (408) 299-5001.
Q. How many properties are still protected by Proposition 13, passed by the voters in 1978?
A. All properties in Santa Clara County, andthroughout California, receive the full benefit of Proposition 13. Whether a property was pur-chased last year or in 1975, every property ownerreceives the same protections and benefits. Thebase year value is established at the time of pur-chase or new construction, and increases in theassessed value are limited to an inflation factor ofno more than 2 percent annually.
For more information on Proposition 13, go topages 16 and 17.
To Hwy 101 (South)
To Hwy 101 (North)
Younger St.
Sheriff’s Bldg.
County EmployeeParking
(public parking permittedafter 5:00 p. m.)
Hedding St.
N. 1st St.
San Pedro St.San Pedro St..
To Hwy 280 Mission St.
West Wing East Wing CivicCenterLightRailStation
ASSESSOR’S OFFICE5TH FLOOR, EAST WING
Guadalupe Parkw
ay Highway 87
Nati’lGuard
Armory
U.S.Army
Reserve
Civic CenterParkingGarage
171 W. Hedding St.
Justice Facility
Santa Clara CountyGovt. Center
70 W. Hedding St.
SanJose
Airport
[880
Directions to the Assessor’s Office

www.sccassessor.org 33
Explanation of Terms*Ad Valorem Property Tax
Assessed Value
Assessee
Assessment Appeal
Assessment Appeals Board
Assessment Roll
Assessment Roll Year
Base Year (Value)
Basic Aid
Business Personal Property
Change in Ownership
CPI
Escaped Assessments
Exclusions from Reappraisal
Exemption
Taxes imposed on the basis of the property’s value.
The taxable value of a property against which the tax rate is applied.
The person to whom the property is being assessed.
The assessee may file an appeal for reduction of the assessed value on the current localroll during the regular filing period for that year, between July 2 and September 15 withthe Clerk of the Board. For supplemental or escape assessments, appeals must be filedwithin 60 days of the mailing of the date of the notice.
A three-member panel appointed by the Board of Supervisors, operating under state law,to review and adjust assessments upon request of a taxpayer or his or her agent. (See“assessment appeal”)
The official list of all property within the county assessed by the Assessor.
The year following the annual lien date and the regular assessment of property beginningon July 1.
The 1975-76 regular roll value serves as the original base value. Thereafter, changes tothe assessment on real property value, or a portion thereof, caused by new constructionor changes in ownership create the base year value used in establishing the full cash valueof such real property.
“Basic aid” school districts rely principally on locally derived property tax revenues tofund school operations, rather than on Statewide reallocation formulas based on averagedaily attendance and other factors. School districts become “basic aid” when the project-ed level of revenues provided by local property taxes exceeds the state formula.
Business personal property is assessable, and includes computers, supplies, office furni-ture and equipment, tooling, machinery and equipment. Most business inventory isexempt. (See personal property)
When a transfer of ownership in Real Property occurs, the Assessor determines if a reap-praisal is required under state law. If required, the reappraised value becomes the newbase value of the property transferred, and a supplemental assessment is enrolled.
Consumer Price Index as determined annually by the California Bureau of Labor Statistics.
When property that should have been assessed in a prior year is belatedly discoveredand assessed, it is referred to as an “escape assessment” because it is an assessment thatlevied outside the normal assessment period for the lien date(s) in question.
Some changes in ownership may be excluded from reappraisal if a timely claim is filedwith the Assessor’s Office that meets the qualifications. Examples include the transfer ofreal property between parents and children or senior citizens over age 55 who replacetheir principal residence.
Allowance of a deduction from the taxable assessed value of the property as prescribed bylaw.
*Explanation of terms are provided to simplify assessment terminology, but do not replace legal definitions.

34 www.sccassessor.org
Exemptions: Homeowners
Exemptions: Other
Factored Base Year Value
Fiscal Year
Fixture
Full Cash Value (FCV)
Improvements
Lien
Lien Date
Mobilehomes
New Base Year (Value)
New Construction
Parcel
Personal Property
Possessory Interest (PI)
People who own and occupy a dwelling on the lien date as their principal place of resi-dence are eligible to receive an exemption of up to $7,000 of the dwelling’s taxable value.The tax dollars reduced by the homeowner’s exemption (HOX) are reimbursed to theCounty by the State of California.
Charitable, hospital, religious or scientific organizations, colleges, cemeteries, museums,and disabled Veterans (for 100%, service-connected disabled Veterans) are eligible forexemption.
A property’s base value is adjusted each year by the change in the California ConsumerPrice Index (CPI), not to exceed 2 percent. The factored base value is the upper limit oftaxable value each year.
The period beginning July 1 and ending June 30.
An improvement to real property whose purpose directly applies to or augments theprocess or function of a trade, industry or profession.
The amount of cash or its equivalent value which property would bring if exposed forsale in the open market and as further defined in Revenue and Taxation Code 110.1.
Buildings or structures generally attached to the land. Improvements may also includecertain business fixtures.
The amount owed and created by the assessment of the property, or the amount leviedagainst property by a taxing agency or revenue district.
The time when taxes for any fiscal year become a lien on property; and the time as ofwhich property is valued for tax purposes. The lien date for California property is 12:01a.m. on January 1 (effective January 1, 1997) preceding the fiscal year for which the taxesare collected. The lien date for years prior to 1997 was March 1.
On July 1, 1980, the Department of Motor Vehicles transferred all mobilehome licens-ing and registration to the California Department of Housing and CommunityDevelopment (HCD). The law requires that mobilehomes be classified as personal prop-erty and enrolled on the secured roll.
The full cash value of property on the date it changes ownership or when new construc-tion is completed.
The construction of new buildings, additions to existing buildings, or alterations whichconvert the property to another use or extends the economic life of the improvement, isreassessed, establishing a new base year value for only that portion of the property.
Real property assessment unit. Land that is segregated into units by boundary lines forassessment purposes.
Any property except real estate, including airplanes, boats, and business property such ascomputers, supplies, furniture, machinery and equipment. Most business inventory,household furnishings, personal effects, and pets are exempt from taxation.
The possession or the right to possession of real estate whose fee title is held by a taxexempt public agency. Examples of a PI include the exclusive right to use public prop-erty at an airport such as a car rental company’s service counter or a concession stand atthe county fair. In both cases, the vendors are subject to property taxes. Regardless ofthe type of document evidencing the right to possession, a taxable PI exists whenever aprivate party has the exclusive right to a beneficial use of tax exempt publicly ownedreal property.

www.sccassessor.org 35
Proposition 13
Proposition 8
Real Property
Roll
Roll Unit
Roll Year
SBE
Secured Roll
Special Assessments
State Board of Equalization
Supplemental Assessment
Supplemental Roll
Tax Rates
Tax Roll
TRA
Transfer
Unsecured Roll
Passed by California voters in June, 1978, Proposition 13 is a Constitutional amendmentthat limits the taxation of property and creates a procedure for establishing the currenttaxable value of locally assessed real property, referencing a base year full cash value.
Passed by California voters in November 1978, Proposition 8 requires the temporaryreduction in the assessed value when there is a decline in market value below the proper-ty’s factored base year value.
Land and improvements to the land, which permits the possession of, claim to, ownershipof, or right to possess.
A listing of all assessed property within the county. It identifies property, the owner, andthe assessed value of the property.
A parcel of property or a business personal property account that is assessed for annualvaluation.
See “Assessment Roll Year.”
See “State Board of Equalization.”
Property on which the property taxes are a lien against the real estate.
Direct charges or flat fees against property which are included in the total tax bill but arenot based upon the Assessor’s valuation of the property. Examples are a sewer charge or aschool parcel tax.
The Board consists of four members elected by California voters by district, and the StateController whose duties in the field of taxation are imposed by the State Constitution andthe Legislature. The Board regulates county assessment practices and administers a varietyof state and local business tax programs.
When property is assessed due to a change in ownership or completed new construction,a supplemental assessment is issued. This is separate and in addition to the annual regu-lar assessment roll. It is based on the net difference between the previous assessed valuesand the new value for the remainder of the assessment year(s).
The roll, prepared or amended, contains properties in which a change in ownership orcompleted new construction occurred.
The maximum ad valorem (on the value) basic property tax rate is 1 percent of the nettaxable value of the property. The total tax rate may be higher for various propertiesbecause of voter-approved general obligation bonds that are secured by property taxes forthe annual payment of principle and interest.
The official list of property subject to property tax, together with the amount of assessedvalue and the amount of taxes due, as applied and extended by the Auditor/Controller.
The tax rate area (TRA) is a specific geographic area all of which is within the jurisdictionof the same combination of local agencies for the current fiscal year. For the 2008-09 FYthere are 807 TRAs in Santa Clara County, each one identified by a unique number.
Change in the ownership of, or change in the manner which, property is held. Dependingon the specific situation, a transfer may trigger a reassessment of the property.
Property on which the property taxes are not a lien against the real estate (real property)where they are situated, including personal property or improvements located on leasedland.

36 www.sccassessor.org
January 1 Lien Date for next assessment roll year. This is the time when taxes for the next fiscal year become a lien on the property.
February 15 Deadline to file all exemption claims.
April 1 Due date for filing statements for business personal property, aircraft and boats.Business property owners must file a property statement each year detailing thecost of all supplies, machinery, equipment, leasehold improvements, fixtures andland owned at each location within Santa Clara County.
April 10 Last day to pay second installment of secured property taxes without penalty. This tax payment is based on property values determined for the January lien date 15 months earlier.
Mid-May Annual mailing of assessment notices to all Santa Clara County property ownerson the secured roll stating the taxable value of the property. Owners who disagreewith the Assessor’s valuation are encouraged to contact us prior to June 15 torequest a review. Please provide any pertinent factual information concerning the market value of the property with the request. If the Assessor agrees that areduction is appropriate, a new assessed value will be enrolled.
May 7 Last day to file a business personal property statement without incurring a 10 percent penalty.
July 1 Close of assessment roll and the start of the new assessment roll year. The assessment roll is the official list of all assessable property within the County.
July 2 First day to file assessment appeal application with the Clerk of the Board ofSupervisors.
August 31 Last day to pay unsecured property taxes without penalty.
September 15 Last day to file an assessment appeal application for reduced assessment on the regular roll with the Clerk of the Board of Supervisors.
December 10 Last day to pay first installment of secured property taxes without penalty.
January 1 Lien date for next assessment roll year.
Property Assessment Calendar

Responsibility of the Assessor’s OfficeThe Assessor has the responsibility to locate all taxableproperty in the County, identify ownership, establish avalue for all property subject to local property taxation, listthe value of all property on the assessment roll, and applyall legal exemptions. The Santa Clara County Assessor doesnot compute property tax bills, collect property taxes,establish property tax laws, establish rules by which proper-ty is assessed, or set property tax rates.
Santa Clara County contains more than 460,000 separatereal property parcels. There were over 6,000 changes in par-cel numbers, and there were over 77,000 changes in prop-erty ownership as reflected by deeds and maps filed in theCounty Recorder’s Office. The Assessor’s professional staffmaintains a comprehensive set of 214 Assessor’s parcel mapbooks. The office appraised more than 7,700 parcels withnew construction activities, and processed more than105,000 business personal property assessments.
The assessments allow the County of Santa Clara and 204 local government taxing authorities to set tax rates (as limited by Proposition 13 and other laws), collect and allocate property tax revenue which supports essential public services provided by the County, localschools, cities, and special districts.
For information regarding general County financialinformation including taxes by tax rate areas and methods of property tax revenue allocation contact:Santa Clara County Finance Agency (408) 299-5200
For information about Santa Clara County Assessments:Public Information and Ownership (408) 299-5500Real Property (land and improvements) (408) 299-5300Personal Property, including Business, Mobilehomes, Boats and Airplanes (408) 299-5400Property Tax Exemptions (408) 299-6460Change in Ownership Issues (408) 299-5540Mapping (408) 299-5550Administration (408) 299-5570Administration Fax (408) 297-9526Assessor Web Site www.sccassessor.orgCounty Web Site www.sccgov.org
For information about a tax bill, payments, delinquency,or the phone number of the appropriate agency to con-tact about a special assessment, contact:Santa Clara County Tax Collector (408) 808-7900
For information about filing assessment appeals, call:Santa Clara County Assessment Appeals Board Clerk(Clerk of the Board of Supervisors) (408) 299-5001
For information about Recording documents, call:Santa Clara County Clerk/Recorder (408) 299-2481
California State Board of EqualizationThe State Board of Equalization is responsible for assuring that county property tax assessment practicesare equal and uniform throughout the state. For moreinformation, contact the State Board at:
450 N StreetPO Box 942879Sacramento, CA 94279-0001
For general tax information call (800) 400-7115 orwww.boe.ca.gov
AcknowledgmentsEditor: David K. Ginsborg, Deputy to the AssessorAssistance provided by Michael Bernier and the staff of theSanta Clara County Assessor’s OfficeLayout Production: KurigraphicsPrinted by GSA Printing ServicesPhotographs provided by Bordon Chin, Legacy Partners, San Jose RDA, Airport and Convention & Visitors Bureau
¿No habla ingles? La Oficina del Tasador tiene empleados que hablan español. Llámenos al (408) 299-5500
Disclaimer: This document presents a distribution of the 2008-2009 Santa Clara County property tax local assessment roll by City/RedevelopmentAgency and major property types. It does not include state-assessed property (unitary roll). It is not the source document for deriving the property tax revenues to be received by any public entity. For example, the Controller’s AB8 calculations do not include aircraft assessed valuation, which isincorporated into this report. Numbers reported in tables and charts reflect up to 0.01 units. Items less than 0.01 units have been reported as a dash.Minor discrepancies may occur due to rounding calculations and/or clarification in definition of terms.Published August, 2008.
www.sccassessor.org 37

Office of the C
ounty Assessor
Lawrence E. Stone, Assessor
County of Santa C
lara Governm
ent Center
70 West H
edding Street, 5th Floor, East Wing
San Jose, California 95110-1771
Website: w
ww.sccassessor.org
Santa Clara C
ountyBoard of SupervisorsDon G
age, District I
Blanca Alvarado, District II
Pete McHugh, D
istrict IIIKen Yeager, D
istrict IVLiz K
niss, District V
County Executive
Pete Kutras
Mission Statem
entThe m
ission of the Santa Clara C
ounty Assessor’s O
ffice is to produce an annual assessm
ent roll including all assessable property in accordance w
ith legal mandates
in a timely, accurate, and efficient m
anner; and provide current assessm
ent-related inform
ation to the public and to governm
ental agencies in a timely
and responsive way.
Please notify us if your address has changedPrinted on recycled paper w
ith soy based inks2199
PRSRT STD
U.S. PostagePA
IDPerm
it # 1406San Jose, C
A