annexure 1: a literature review on the performance of ......1 annexure 1: a literature review on the...
TRANSCRIPT
1
Annexure 1: A literature review on the performance of local government over the past two decades
Verna Nel & Stuart Denoon-Stevens
Pegasys Strategy and Development (Pty) Ltd
For South African Cities Network
July 2015 – Revised August 2015
2
Abbreviations
ANC African National Congress
COGTA Department of Cooperative Government and Traditional Affairs
DAFF Department of Agriculture, Forestry and Fishing
DCD Ministry of Constitutional Development and Provincial Affairs
DCoG Department of Cooperative Governance
DEA Department of Environmental Affairs
DFA Development Facilitation Act, 67 of 1995
DPLG Department of Provincial and Local Government
EPWP Expanded Public Works Programme
GDP/GVA Gross Domestic Product/ Gross Value Add
HDA Housing Development Agency
IDP Integrated Development Plan
LED Local economic development
LGTA Local Government Transitional Act
MDB Municipal Demarcation Board
Metros Category A or Metropolitan Municipalities
MFMA Local Government: Municipal Finance Management Act, no 56 of 2003
MSA Local Government: Municipal Systems Act, 32 of 2000
SACN South African Cities Network
StatsSA Statistics South Africa
UNDP United Nations Development Programme
WHO World Health Organisation
WOF Working on Fire
NOTE
This literature review has deliberately not included publications primarily sponsored or authored
by the SACN (with a few exceptions). These include the ‘State of the Cities’ reports, the
publications on secondary cities and the recent housing and transportation publications.
However, as the SACN has produced many critical reviews on key areas affecting local
government, this omission may result in gaps in the literature.
3
Executive summary and linkage to SACN SWOT analysis: This initial section both summarizes this report, and links the findings of this report to the
performance areas and foci of the SACN over the previous five year period, as detailed in the
SWOT analysis. The intent of this is to show the alignment of the SACN’s work with the needs of
local government, as outlined by this literature review, and the areas that potentially need more
investigation by the SACN.
The value of this report is it establishes the wider context of local government within which the
SACN works and responds. It thus permits us to identify which needs of local government the
SACN has adequately addressed, as well as identifying which needs the SACN has not addressed
and which could be future areas of research focus for the SACN in the future. This report thus lays
the foundation for the SWOT report.
The first theme that this report investigates is that of well governed cities. In this regard, this
report has highlighted the following issues:
There is a discrepancy between the developmental intention and the functions in the
constitutional schedules of local government, meaning that metropolitan areas require
additional powers (e.g. housing and transport) to fulfil their developmental mandate (De
Visser, 2009; Koeble & LiPuma, 2010).
Lack of confidence in local government and community protests: there is an increasing
number of protests around inadequate service delivery and corruption in local
government (Powell et al., 2015).
Municipal management: poor service delivery, corruption, nepotism, political
appointments and political failure to deal adequately with corruption (Alexander & Kane-
Berman, 2014).
The sources of ‘own revenue’ are inadequate to deal with the scale of the demand for
services, given that small municipalities are dependent on transfers, while metros have
reached the limits of tariff increases (Fiscal & Finance Commission, 2013b).
In terms of administrative capacity, it is clear that there are high levels of vacancies and a
shortage of technical skills in the smaller municipalities (Municipal Demarcation Board,
2012).
With regard to community participation, while the systems and processes are in place the
level of true participatory planning is appears to be low as municipalities merely ‘go
through the motions’ to comply with legislation, and take limited account of inputs
received (Mautjana & Maombe, 2014).
The sheer size of South African municipalities, with some being territorially larger than US
or European states, make service delivery and community involvement difficult
(Alexander & Kane-Berman, 2014).
Intergovernmental relationships are working to some extent, particularly at district level,
but some national and provincial departments do not take the effort to align their plans
with the local IDP. Furthermore, the monitoring of local government needs improvement
(The Presidency, 2014a).
There is a greater need for differentiation between different ‘types’ of local government,
in particular between metropolitan areas and smaller municipalities (Ovens, 2013).
4
The SACN is addressing these issues through both research and facilitation. It acts as a facilitator
assisting with intergovernmental coordination through the various dialogues it arranges. As the
latter (between 2009/2010-2013/2014) were attended by both national government (20% of all
attendees), member cities (23% of all) and non-member cities (13% of all) there is opportunity for
exchange of information and the building of personal networks. In addition, municipal finance
has been a major focus of the SACN, with the publication of the State of the South African Cities
Finance reports. The issue of capacity building was addressed by the SACN through the publishing
of, “Capacity Building through Knowledge Management a Toolkit for South African
Municipalities.”
In addition, recognition needs to be given to the work of the SACN with regards to the capacity
building of member cities, with in particular the Manguang and Buffalo City Metro Readiness
projects and the Managing Low Cost Housing Training Programme playing a vital role in upskilling
officials in member cities. Consequently, the SACN has, to varying degrees, responded to all of the
aforementioned issues.
In terms of productive cities, this report has highlighted the following:
The main city regions of contribute over 80% of the GVA to the country and are home to
63% of the population. Thus the metropolitan areas are critical for national economic
development (COGTA 2014).
Despite the constitutional mandate for economic development, LED is not taken seriously
or is limited to community development projects in most municipalities (Rogerson 2010).
While the basic services infrastructure is being expanded, there is insufficient attention
given to maintenance of existing infrastructure which will have severe financial and social
consequences (Fiscal and Finance commission, 2013b).
Despite performing considerably better than rural areas, unemployment rates in the cities
are still very high by world standards (Turok & Borel-Saladin 2013, Harrison, 2014).
Through the Infrastructure Dialogues, and also the State of the City Finances reports, the SACN
has played a prominent role in highlighting infrastructure financing challenges. Furthermore, the
Expanded Public Works Program (EPWP) reference group and the related publications has to some
extent looked at the challenge of job creation.
It must, however, be noted that in the last five years the SACN has not extensively focused on
issues of Local Economic Development, or in particular, on the subsidiary question of how cities
can encourage economic growth. Other than the focus on EPWP projects, there has been limited
research output focusing on job creation.
In terms of sustainable cities, this report has highlighted the following:
There has been significant growth in the renewable energy sector, with at least 4,233 MW
being procured in South Africa by 2015 by various renewable energy technologies
(Joemat-Pettersson 2015).
South Africa faces numerous threats due to climate change, including reductions in
stream-flow, extinction of certain plant species, increasing vulnerability to wildfires and
extreme weather events, as well as increased encroachment by alien plant species (DEA
2013a, Ziergovel et al 2014.)
16% of all deaths in South Africa can be attributed to environmental factors, with the
majority of these deaths linked to poor water, sanitation and hygiene (WHO 2009,
StatsSA, 2005 &2014a).
5
There are high levels of outdoor air pollution in South Africa, leading to an estimated 4637
deaths in 2000, and 42 219 years lost annually (Norman et al. 2007 & Scorgie et al 2012).
Invasive alien plant species are reducing freshwater runoff in South Africa by as much as
7% of total annual runoff (DEA et al. 2011).
Land degradation is a serious issue in South Africa, affecting in particular the agricultural
productivity of former homeland areas (Meadows and Hoffmann 2002).
The impact of natural disasters in South Africa are poorly understood, but are likely having
a severe impact on the South African economy (WOF 2013, Zuma et al 2012, Pretorius and
Smal 1994).
There has been a severe decline in fish stocks in South African oceans, with half of the
commercially exploited fish stocks in South Africa being heavily overfished (DAFF 2015).
The SACN has dealt with some of these issues indirectly and directly through its considerable work
on climate change, with 9 dialogues focusing on this issue, and directly through its work on energy
and the green economy, with 9 dialogues and one publication focusing on this. There is however
scope for a much wider focus on environmental issues, such as the severe health impact of poor
water, sanitation and hygiene, high levels of outdoor air pollution, the impact of natural disasters
on South African cities, the issue of land degradation, and the severe decline of fish stokes in South
Africa.
It must also be stressed that there is significant overlap between the sustainable cities theme and
the productive cities theme. For instance, renewable energy directly affects the national economy,
given the critical importance of increasing the production of electricity in South Africa. The SACN’s
emphasis on renewable energy is also an issue that is covered by the sustainable cities theme.
Similar comments can be made for dialogues and publications focusing on waste management,
green jobs and the green economy, and green infrastructure.
In terms of inclusive cities, this report has highlighted the following:
There is an indication of declining levels of extreme poverty in South African, matched
with an increase in access to basic services. This indicates an improving quality of life for
the poor. The evidence for this is South Africa’s increasing Human Development Index,
which has risen from 0.569 in 1980, to 0.658 in 2013. However, as much as 53.8% of South
Africans still live on as little as R26 a day (R779 a month), or less, indicating that we still
have a long way to go in addressing this issue (StatsSA 2015a 2015b; & UNDP 2014).
South Africa has made minimal progress in combating income inequality, with its Gini
coefficient rising from 0.59 in 1994 to 0.65 in 2011, indicating an increasingly polarized
society (StatsSA 2014a & Harmse 2013).
In terms of spatial inequality, the situation has not changed much over 20 years. On a
national scale, the differentiation is not between rural and urban, but rather between
homeland and non-homeland South Africa, with the former having high unemployment,
and the latter having much lower unemployment rates. In the metropolitan areas, the
vast majority of the city areas (80% of suburbs) are unaffordable to the majority of
households (Weir-Smith & Ahmed 2013, Kingdon & Knight 1999, Steedly 2014).
The housing situation in South Africa is getting worse, not better: between 2001 and 2011
the number of households living in informal settlements grew by 126,502. The added
difficulty is that the majority of public housing provided has been on the fringes of the
cities, further entrenching the patterns of urban inequality (Turok & Borel-Saradin 2014,
Joseph and Karuri-Sebina 2014).
6
Furthermore, the provision of facilities and amenities, such as police stations and schools,
has not kept pace with housing delivery, leading to a number of settlements been
deprived of key basic amenities needed for the effective functioning of the settlement.
The poorly performing transport system is highly unequal. For instance, only 14.9% of
private motor vehicle drivers exceeded the international threshold of a work trip taking
no longer than 60 minutes (one-way), but 26% of passengers who travelled by taxi (26.5%
of all work trips) exceeded this international threshold. In total, 22.3% of South Africans
spend more than 60 minutes (one-way) travelling to and from work (StatsSA 2014b).
In terms of Spatial Planning and Land Use Management, spatial planners increasing
attempt, through the SDF process, to encourage the inclusion of the poor. However, the
implementation of these policies through land use management and targeted public
investment has been relatively weak, with a few notable exceptions (Du Plessis &
Boonzaaier 2015, Harrison and Todes 2015).
This is another focus area in which the SACN has performed admirably. The main focus of this
topic area has been spatial planning and land use management, specifically preparing member
cities to deal with the promulgation and implementation of the Spatial Planning and Land Use
Management Act. There was also emphasis placed on training municipal officials on best practice
in the housing sector, and training as well as producing guidelines on township renewal.
In terms of quantity, there has been a lesser focus on public transport and human settlement
upgrading publications and dialogues. However this theme area produced two notable books on
these topics. It should also be noted that the work on housing affordability in member cities is
ground-breaking, given that it was the first spatial assessment of cities housing affordability in the
local context.
7
Table of Contents Abbreviations ........................................................................................................................... 2
Executive summary and linkage to SACN SWOT analysis: ............................................................... 3
Setting the scene.............................................................................................................................. 9
1. Introduction ......................................................................................................................... 9
2. Context ............................................................................................................................... 10
External forces acting on South African cities ........................................................................ 10
The economy .......................................................................................................................... 10
Demographic changes ............................................................................................................ 11
Cities in South Africa............................................................................................................... 11
Transformation of local government ..................................................................................... 13
Local government from 1994 ........................................................................................................ 16
Introduction ............................................................................................................................ 16
3. Good government .............................................................................................................. 16
Introduction ............................................................................................................................ 16
The path from 2001 to the present ........................................................................................ 16
What are the current issues? ................................................................................................. 17
Local government mandates .................................................................................................. 18
Municipal management ......................................................................................................... 19
Municipal Finances: Revenue and Management ................................................................... 20
A failed experiment? .............................................................................................................. 23
4. Productive cities ................................................................................................................. 24
Introduction ............................................................................................................................ 24
Relative performance of South African Cities ........................................................................ 24
Local economic development................................................................................................. 29
The informal economy ........................................................................................................... 30
Infrastructure ......................................................................................................................... 31
5. Inclusive cities .................................................................................................................... 34
Introduction ............................................................................................................................ 34
Human Development ............................................................................................................. 34
Income Inequality ................................................................................................................... 35
Spatial Inclusion and inequality .............................................................................................. 36
Financial Inclusion .................................................................................................................. 37
Shelter and inclusion .............................................................................................................. 37
Urban transport ...................................................................................................................... 38
Inclusive Cities and Urban Safety ........................................................................................... 39
8
The healthy city ...................................................................................................................... 40
6. Sustainable Cities ............................................................................................................... 40
Introduction ............................................................................................................................ 40
Renewable energy .................................................................................................................. 40
Environmental Health ............................................................................................................. 41
Air pollution ............................................................................................................................ 41
Water ...................................................................................................................................... 42
Alien invasive plants ............................................................................................................... 43
Land degradation .................................................................................................................... 43
Fish stocks ............................................................................................................................... 44
What does this mean for local government? ............................................................................... 45
Introduction ............................................................................................................................ 45
7. The key issues .................................................................................................................... 45
The failure of basic service delivery to influence socio-economic development in South
Africa....................................................................................................................................... 45
The current electricity and impending water crisis ................................................................ 46
Recognising, mitigating and preparing for natural disasters ................................................. 46
Urban economic development ............................................................................................... 46
(Not so good) governance ...................................................................................................... 47
List of tables
Table 1: Problems in local government .......................................................................................... 17
Table 2: Population and economic activity per type of settlements, 2011 ................................... 25
Table 3: Change in employment per sector for SA settlements .................................................... 27
List of figures
Figure 1 - The classification of municipalities ................................................................................. 12
Figure 2 - HDI in South Africa (source: UNDP 2012) ....................................................................... 35
Figure 3 - South Africa GINI index: 1993-2011 (Source: StatsSA 2014a) ........................................ 35
Figure 4 - 2007 Unemployment trends by standard deviation ..................................................... 36
Figure 5 - Financial Inclusion (Source: FInmark Trust 2014) .......................................................... 37
Figure 6 - Serviced sites and houses completed: 2002-2011 (Source: DMPE 2013) ...................... 38
Figure 7 - SO2 and PM10 levels in South Africa in 2012 (Source: DEA 2013b). ............................. 42
9
Setting the scene
1. Introduction
The transition to democracy in South Africa was accompanied by wide ranging change, particularly
with respect to new policy and legislation and the institutions to implement policies aimed
towards reducing poverty and ensuring greater equity with inclusive development. Of all the
South African governance institutions, local government has perhaps been the most deeply
affected and subjected to the greatest transformation. Boundaries, structures, municipal systems
and mandates have all seen numerous substantial changes since the interim constitution of 1993.
Such changes have occurred in several phases, beginning with a pre-interim phase, then the
interim phase culminating in December 2000 with the transition to the current dispensation.
While the policy, legislation and structures that gave birth to the new municipal dispensation are
in place, the reformed local government institutions are still evolving, with some performing
reasonably well, while others are struggling. Size, location and capacity all influence the ability of
local governments to fulfil their new developmental mandates. Many smaller, rural municipalities
are in crisis, while the large metropolitan municipalities fare better, despite high urbanisation
rates and demand for basic services, shelter and livelihoods.
The South African Cities Network (SACN) was established in 2002, as a learning network,
knowledge generator and disseminator around good governance and sound management of
South African cities. Although its primary focus has been on its member cities – the large
metropolitan municipalities – it has not limited its activities to these cities alone. As part of the
process of looking to the future, the SACN has commissioned a review of its past performance as
well as that of the local government sector in which it functions.
This document thus provides an analysis of the South African local government context, the
performance of local government from establishment (2000 – 2005) to transition (2006 – 2011)
and subsequent developments drawn from a review of both academic and ‘grey’ literature such
as official reports and policy by national and local government. The literature review will be
framed within the SACN’s four thematic programme areas: well governed cities, productive cities,
sustainable cities and inclusive cities. The literature review is coupled to a review of the
performance of the SACN also within the context of the four programme areas.
The report is structured in three parts that include seven sections. The first is this, the
introduction, while the second section provides a background and overview of the context of local
government and is followed by past ten years or so. The second part of the document contains
sections three to six that comprise the review of local government in terms of the SACN themes.
Part three and section seven, the conclusion, includes a summary of the key challenges facing local
government over the past fifteen years or so.
10
2. Context
The purpose of this section is to describe the transformation of local government from 1993 to its
2000, and well as indicating the context in which local government operates.
External forces acting on South African cities
Globalisation and reintegration of SA economy created opportunities for local businesses, but at
the same time exposed the local economy to greater competition (Turok & Borel-Saladin 2013).
As part of a global network of trade, tourism and communication, South Africa is exposed to the
ripples throughout the system, such as the economic crises of 2008/2009 that devastated western
economies (Ovens, 2013). While buffered to some extent by the 2010 Soccer World Cup and
demand for commodities from growing economies in Asia, there were still detrimental effects.
These included lower demand for exports due to decreased markers as well as a reduction in
tourism (UN Habitat, 2014). Although trade relationships with India and China have had
advantages, there have also been drawbacks, such as the undermining of the South African textile
industry through cheaper imports from China (UN Habitat, 2014).
However, a low global recovery is forecast for the next few years, with better prospects in the USA
than Europe and emerging markets. Although the outlook for sub-Saharan Africa is healthy, there
are still concerns regarding the volatility of commodity exports, weak demand from major
importers such as Europe and security concerns (National Treasury 2015).
While not immediately affected by terrorism driven by the rise of radical Islam (and associated
terrorist groups such as El-Shabaab), this issues does have the potential to become more serious
(Solomon, 2012). The effects of any perceived instability can curtail the country’s lucrative tourism
industry as well as reducing investor confidence in the country. A health threat such as Ebola can
seriously damage economy in the short and longer term (Bax et al, 2014).
Climate change is another global threat that is already affecting Africa, and in particular Southern
Africa. Sea level rise and flooding associated with storm surges are issues that coastal cities must
deal with, while many South African cities are faced with drought and dwindling water supplies.
While some areas may have increased precipitation, this may be in the form of more intense
storms leading to localised flooding. Furthermore, increased temperatures, and more erratic
rainfall will affect food security (UN Habitat, 2014).
The economy
South Africa’s recovery from the global recession has been slow and more in line with Europe than
the more dynamic BRICS countries. This is compounded by high unemployment and electricity
supply limitations (OECD, 2013). Other concerns for the economy are declining commodity prices,
linked to shrinkages in the mining sector, reduced investor confidence and the challenges
associated with the current energy crisis (National Treasury, 2015).
According to the 2015 budget speech, the current electricity crisis is damaging the economy, but
should this issue be addressed then the economic outlook will be better. South Africa’s economic
growth is projected at 2% for 2015 (0,5% lower than 2014) but to slowly rise to 3% in 2017. The
current exchange rate will assist in the competiveness of exports and the lower oil prices should
boost the South African economy (Nene, 2015).
11
Furthermore, manufacturing – traditionally a driver for economic growth (UN Habitat 2014) – has
not grown and is expected to be detrimentally affected by the energy crisis (National Treasury
2015). Other reasons for South Africa’s sluggish economic growth include an undiversified export
profile, insufficient savings and investment levels and the poor quality of the basic educational
system that provides inadequate skills and by default excludes many from well-paid employment
(Bhorat, Cassim & Hirsch, 2014; Musvoto, 2014).
Overall, unemployment remains high at 24,3% (or 34,6% if discouraged job seekers are included),
while youth unemployment (15-24 years) is 48.8%. However, there are wide differences in the
rate of employment between municipalities from 14% to 50% (Alexander & Kane-Berman 2014).
Most new jobs were created in the public sector, with the private sector contributing only about
40% to new employment. Key sectors such as mining and manufacturing have seen job losses, but
in 2014 this was partially offset by gains in agriculture. However, there has been a general
decrease in labour intensity, which restricts the uptake of new job seekers in the labour market
(National Treasury, 2015). There appears to have been a stagnation of real wages over the past
few years, but due to social grants there has also been a decline in poverty (The Presidency,
2014a). In South Africa, as in other African states, there is limited capacity to raise taxes due to a
limited tax base, slow economic growth and endemic poverty (Pieterse & Parnell, 2014).
Demographic changes
South Africa is currently experiencing urbanisation and a demographic transition that is fuelled by
both in-migration from rural South African and neighbouring countries as well as natural growth
(Fox 2014). Although urbanisation is predicted to take place in secondary cities and towns in most
countries of the Global South (UN Habitat 2014), currently the most rapid growth appears to be
occurring in the large metropolitan regions (Turok & Borel- Saladin, 2014).
Much of the urban population growth is in the ‘townships’ and informal settlements and it is
particularly the latter that have grown the fastest, “being the first recipients of rural (and foreign)
migrants in search of work” (Mahajan, 2014: 8). In addition to the expansion of informal
settlements, many households are renting in backyard shacks (The Presidency, 2014c).
In addition to the absolute increase in numbers of people in cities, household sizes have also
decreased. Nationally this decrease is from 4,5 in 1996 to 3,6 in 2011. The most urbanised
province, Gauteng, has the smallest average household sizes (3,1) a typical reduction of household
sizes as a consequence of urbanisation (StatsSA, 2012). The reduction of household sizes implies
a concomitant growth in the number of households and subsequently an increase in the number
of households (Van Zyl et al, 2008). The increase in both absolute numbers of people, and the
reduced size of urban households has had profound implications for cities, such as an escalating
demand for housing within metropolitan areas.
Cities in South Africa
South Africa has one of the biggest economies in Africa and accounts for a substantial proportion
of the continent’s product including mineral commodities (Chikulo, 2013). While the large city
regions may not vie with world cities, they can certainly compete with their African counterparts
(Pillay, 2004; Van Huyssteen et al, 2009). The four biggest metropolitan regions (Gauteng, Cape
Town, eThekwini and Nelson Mandela Bay) account for over sixty percent of the population and
the majority of population growth in the country (Turok & Borel-Saladin, 2014). The Gauteng, Cape
Town and eThekwini regions constitute an inner core of urban areas that are responsible for
12
approximately 72% of South Africa’s gross domestic product (GDP) (Van Huyssteen et al., 2009),
with the remaining metropolitan cities and large cities together accounting for some 14% of the
gross value add, while the remaining urban areas make a limited contribution to both population
growth and production. This is clear evidence of the primacy of the metropolitan regions of the
country (De Visser, 2009; Harrison, 2014).
The high levels of growth recorded by the main urban centres are driven by both in-migration and
natural increase (Pieterse & Parnell, 2014; Fox, 2014). This population growth of predominantly
the urban poor has a number of consequences, such as pressure on already strained water
resources, the provision of basic services provision, dealing with pollution, waste production and
environmental degradation (Van Huyssteen et al., 2009; Turok & Borel-Saladin, 2014).
In-migration is not only domestic, but attracts international migrants as well, an accordance that
has led to violent xenophobia (Vale, 2002; Murray, 2003; Hayem 2013), which has international
reverberations. So too did the Marikana Massacre, that can be partially attributed to deep levels
of poverty and the stark inequalities prevailing in South Africa cities. Not only has South Africa
remained one of the most unequal countries in the world (Chikulo, 2013), but the human
development index has also decreased since 1995 (Kotze & Taylor).
However, despite the urbanisation of poverty, the largest cities still offer potential:
unemployment, though high, is lower than in the rest of South Africa and is possibly keeping pace
with urbanisation as is the provision of urban infrastructure (van Huyssteen et al., 2009).
According to Turok & Borel-Saladin, “there have been substantial improvements in the availability
of basic services in the metros over the last decade. Despite their enlarged populations, the big
cities have enhanced their position in terms of service delivery. Progress has been most apparent
in relation to piped water, flush toilets and refuse removal” (2014: 682). Furthermore, despite
their size, South African ‘uni-cities’ have a major advantage over their European and American
equivalents in that they have a single government and are not fractured into multiple (competing)
jurisdictions (Wheeler, 2009).
Smaller urban centres also appear to have performed reasonably well in providing basic services,
particularly with respect to water provision. While there has been an overall improvement in the
provision of sanitation and refuse removal the gains are not as great as in the water sector. The
smaller rural municipalities (B4) are faring the least well in service delivery (The Presidency, 2014).
As with many African cities, there are strong urban-rural linkages, particularly through circular
migration (Pieterse & Parnell, 2014). In addition, there are also sprawling informal settlements
(although at a lesser scale than other African countries) (UN Habitat 2014). According to StatsSA
(2012), over 13% of all households were living in informal dwellings in 2011, a reduction from the
previous census. However, the majority of these are in the metropolitan cities (Van Huyssteen et
al, 2009). According to the Housing Development Agency (2013), this proportion appears to have
stabilised; nonetheless, the metros still have large backlogs of informal areas without access to
basic services, formal dwelling structures or secure tenure.
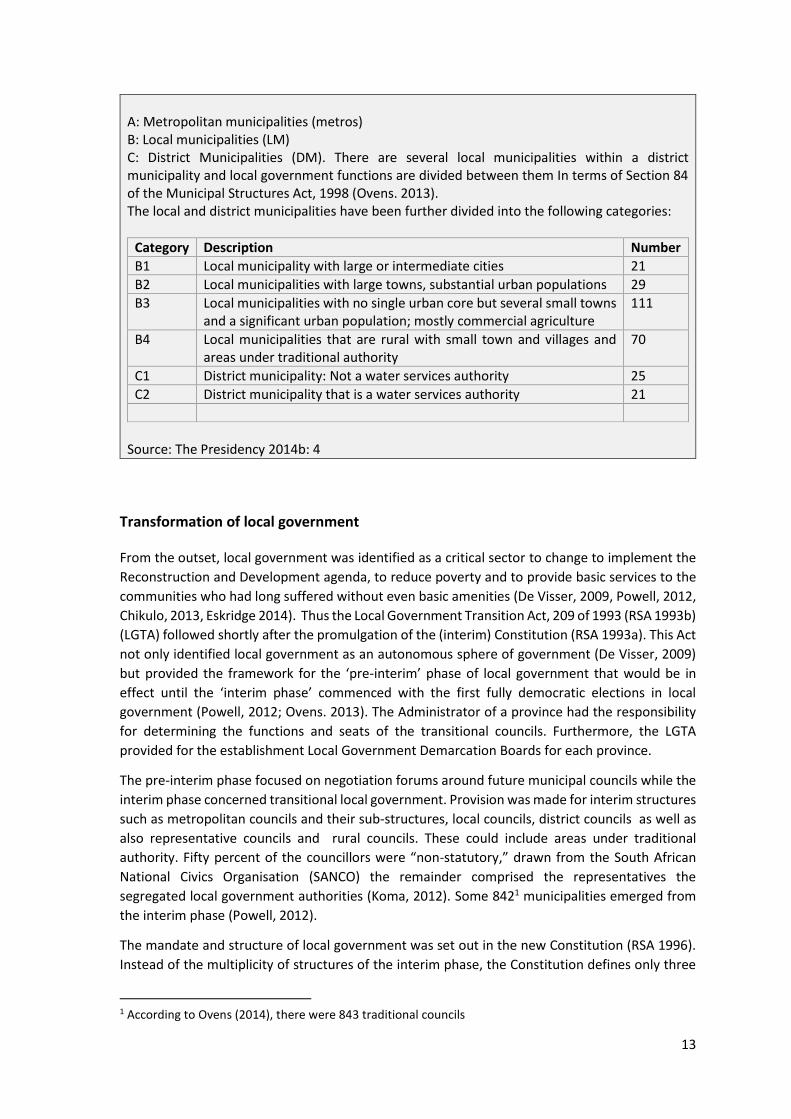
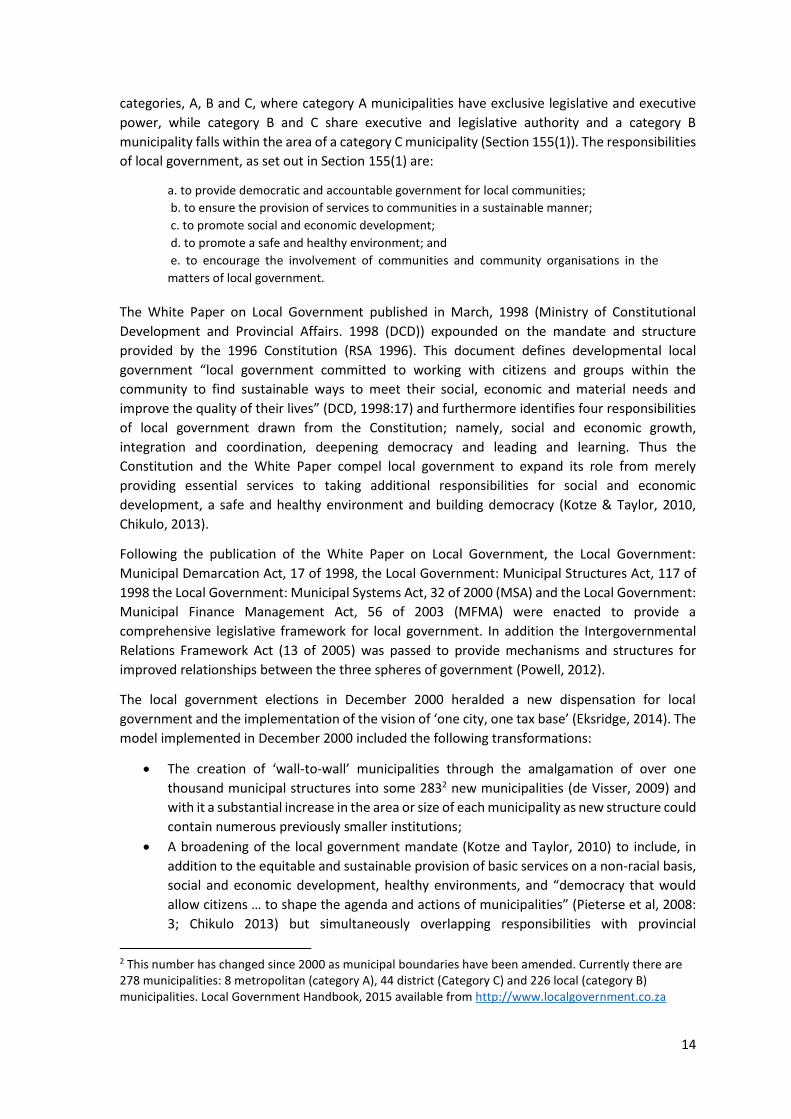
The Constitution (RSA 1996) defined three categories of municipality: A. B and C. These have since been further defined as:
Figure 1 - The classification of municipalities
13
A: Metropolitan municipalities (metros) B: Local municipalities (LM) C: District Municipalities (DM). There are several local municipalities within a district municipality and local government functions are divided between them In terms of Section 84 of the Municipal Structures Act, 1998 (Ovens. 2013). The local and district municipalities have been further divided into the following categories:
Category Description Number
B1 Local municipality with large or intermediate cities 21
B2 Local municipalities with large towns, substantial urban populations 29
B3 Local municipalities with no single urban core but several small towns and a significant urban population; mostly commercial agriculture
111
B4 Local municipalities that are rural with small town and villages and areas under traditional authority
70
C1 District municipality: Not a water services authority 25
C2 District municipality that is a water services authority 21
Source: The Presidency 2014b: 4
Transformation of local government
From the outset, local government was identified as a critical sector to change to implement the
Reconstruction and Development agenda, to reduce poverty and to provide basic services to the
communities who had long suffered without even basic amenities (De Visser, 2009, Powell, 2012,
Chikulo, 2013, Eskridge 2014). Thus the Local Government Transition Act, 209 of 1993 (RSA 1993b)
(LGTA) followed shortly after the promulgation of the (interim) Constitution (RSA 1993a). This Act
not only identified local government as an autonomous sphere of government (De Visser, 2009)
but provided the framework for the ‘pre-interim’ phase of local government that would be in
effect until the ‘interim phase’ commenced with the first fully democratic elections in local
government (Powell, 2012; Ovens. 2013). The Administrator of a province had the responsibility
for determining the functions and seats of the transitional councils. Furthermore, the LGTA
provided for the establishment Local Government Demarcation Boards for each province.
The pre-interim phase focused on negotiation forums around future municipal councils while the
interim phase concerned transitional local government. Provision was made for interim structures
such as metropolitan councils and their sub-structures, local councils, district councils as well as
also representative councils and rural councils. These could include areas under traditional
authority. Fifty percent of the councillors were “non-statutory,” drawn from the South African
National Civics Organisation (SANCO) the remainder comprised the representatives the
segregated local government authorities (Koma, 2012). Some 8421 municipalities emerged from
the interim phase (Powell, 2012).
The mandate and structure of local government was set out in the new Constitution (RSA 1996).
Instead of the multiplicity of structures of the interim phase, the Constitution defines only three
1 According to Ovens (2014), there were 843 traditional councils
14
categories, A, B and C, where category A municipalities have exclusive legislative and executive
power, while category B and C share executive and legislative authority and a category B
municipality falls within the area of a category C municipality (Section 155(1)). The responsibilities
of local government, as set out in Section 155(1) are:
a. to provide democratic and accountable government for local communities;
b. to ensure the provision of services to communities in a sustainable manner;
c. to promote social and economic development;
d. to promote a safe and healthy environment; and
e. to encourage the involvement of communities and community organisations in the
matters of local government.
The White Paper on Local Government published in March, 1998 (Ministry of Constitutional
Development and Provincial Affairs. 1998 (DCD)) expounded on the mandate and structure
provided by the 1996 Constitution (RSA 1996). This document defines developmental local
government “local government committed to working with citizens and groups within the
community to find sustainable ways to meet their social, economic and material needs and
improve the quality of their lives” (DCD, 1998:17) and furthermore identifies four responsibilities
of local government drawn from the Constitution; namely, social and economic growth,
integration and coordination, deepening democracy and leading and learning. Thus the
Constitution and the White Paper compel local government to expand its role from merely
providing essential services to taking additional responsibilities for social and economic
development, a safe and healthy environment and building democracy (Kotze & Taylor, 2010,
Chikulo, 2013).
Following the publication of the White Paper on Local Government, the Local Government:
Municipal Demarcation Act, 17 of 1998, the Local Government: Municipal Structures Act, 117 of
1998 the Local Government: Municipal Systems Act, 32 of 2000 (MSA) and the Local Government:
Municipal Finance Management Act, 56 of 2003 (MFMA) were enacted to provide a
comprehensive legislative framework for local government. In addition the Intergovernmental
Relations Framework Act (13 of 2005) was passed to provide mechanisms and structures for
improved relationships between the three spheres of government (Powell, 2012).
The local government elections in December 2000 heralded a new dispensation for local
government and the implementation of the vision of ‘one city, one tax base’ (Eksridge, 2014). The
model implemented in December 2000 included the following transformations:
The creation of ‘wall-to-wall’ municipalities through the amalgamation of over one
thousand municipal structures into some 2832 new municipalities (de Visser, 2009) and
with it a substantial increase in the area or size of each municipality as new structure could
contain numerous previously smaller institutions;
A broadening of the local government mandate (Kotze and Taylor, 2010) to include, in
addition to the equitable and sustainable provision of basic services on a non-racial basis,
social and economic development, healthy environments, and “democracy that would
allow citizens … to shape the agenda and actions of municipalities” (Pieterse et al, 2008:
3; Chikulo 2013) but simultaneously overlapping responsibilities with provincial
2 This number has changed since 2000 as municipal boundaries have been amended. Currently there are 278 municipalities: 8 metropolitan (category A), 44 district (Category C) and 226 local (category B) municipalities. Local Government Handbook, 2015 available from http://www.localgovernment.co.za
15
government for certain functions such as health, public transport, and emergency
services3;
New governance structures based on an executive mayor and mayoral committee
appointed by the ruling party with a Municipal Manager responsible for the
administration along with departmental heads appointed on limited term contracts
reporting to the municipal manager; and
New administration and financial management systems required by the MSA and later the
MFMA.
The key instruments for local government to deliver on the new mandate are integrated
development planning, community participation and performance management, which can be
traced back to concepts related to ‘New Public Management’ and ‘networked management’ (CDC,
1998, Harrison, 2006; Schmidt, 2008). The integrated development plan (IDP) ties all three
together, as it is the mechanism for integrated planning, the basis for performance management
and the medium for community engagement on development (Harrison, 2008).
The concept of integrated development planning was not entirely new as it had been introduced
in 1996 with the Local Government Transition Act, Second Amendment Act, No. 97 of 1996
(Harrison, 2006) and followed shortly after the introduction of Land Development Objectives
(LDOs) in the Development Facilitation Act, 67 of 1995. However, the MSA expanded on the
content and process of the IDP as well as its primacy in municipal planning, budgeting, expenditure
and even organisational structure. Furthermore, the integrated development plan was intended
to integrate the plans of national and provincial governments and state owned enterprises acting
within the municipal area (De Visser, 2009).
As local government has been viewed as a key institution in development and democracy, it has
been the object of radical transformation in an effort to enable it to deliver on the developmental
mandate of government. However, it does not operate in a vacuum: there are various forces
influencing and impinging on local government. Many of these are local such as expectations from
residents and other spheres of government and other global, including forces over which local
government’s economies have limited control.
3 These will be discussed more fully in section 3 on Good Government
16
Local government from 1994
Introduction
The first part has sketched a brief background to transformation of local government and the
context in which local government functions. This part will focus on the issues facing local
government and its performance over the past fifteen years. It contains four sections
corresponding to the SACN themes. Section 3 evaluates ‘Good government’ which will consider
general governance aspects including mandates and capacity, financial management, integrated
development planning and service delivery, intergovernmental relationships and community
protests. The section on Productive Cities examines urban/municipal economies, including urban
and rural linkages and infrastructure investment. Section 5, Inclusive Cities, reflects on the major
themes of spatial planning and land use management, human settlements and housing, and urban
mobility and transport. The final section, Sustainable Cities, evaluates local government responses
around climate change, water and wastewater management and urban sustainability in general.
3. Good government
Introduction
Much has been written about local government over the past fifteen years, including a number of
papers on ‘service delivery’ protests by disgruntled communities. Rather than enumerating this
literature, the approach taken here has been to identify the key issues facing local government.
From the overview of the literature it is a clear that there is consensus on the progress of local
government and the nature of the problems that beset this sphere of government. Thus the
section is structured around the progress, successes and problems of local government.
The path from 2001 to the present
The process of transforming local authorities from racially based municipalities to ‘wall-to-wall’,
non-racial democratic local governments that began with the Local Government Transition Act
(RSA 1993) reached a major milestone when the new system was implemented in December 2000.
However, the transformation is still ongoing, with both successes and serious problems.
It was anticipated that the major transformation in local government would take a few years to
settle down and the new systems become fully functional. However, by 2004 there were signs
that the new system was not performing optimally and particularly rural municipalities were ‘in
distress’. Project Consolidate was devised to address these concerns (DPLG 2004, Powell, 2012).
However, this project did not resolve the problems of local government as the State of Local
Government report (CoGTA, 2009) attests. The ‘Turnaround strategy’ (2009) developed to address
these problems was been followed by a ‘Back to Basics’ (2014) strategy has been implemented to
improve governance (Powell, 2012; Auditor General, 2015).
Despite the litany of problems surrounding local government evidenced in citizen dissatisfaction
and community protests (Powell et al., 2015) the new system of local government is not a failure
(Alexander & Kane-Berman 2014). The new system of local government took time to settle down
but most municipalities are now functioning (RSA 2014a; Chikulo, 2013).
17
The legal framework is now in place that on the one hand provides local government authority
and considerable powers and on the other a regulatory context to conduct its affairs. The policy
of free basic services has been implemented to alleviate poverty and with it equitable share
funding (RSA 2014b; Ovens, 2013; Kroukamp, 2014).
Policies and programmes have been put in place to support local government, to build capacity
such as the Siyenza Manje programme and deal with corruption (RSA 2014b). Regulations have
been passed to ensure competent senior management (Powell, 2012). Integrated development
planning has been established and with it the structures for community participation such as ward
committees (De Visser, 2009). There has been a steady improvement in audit outcomes (Auditor
General, 2015) and extensive gains in service delivery (RSA, 2014b; Chikulo, 2013, Turok & Borel-
Saladin 2014; Alexander & Kane-Berman, 2014).
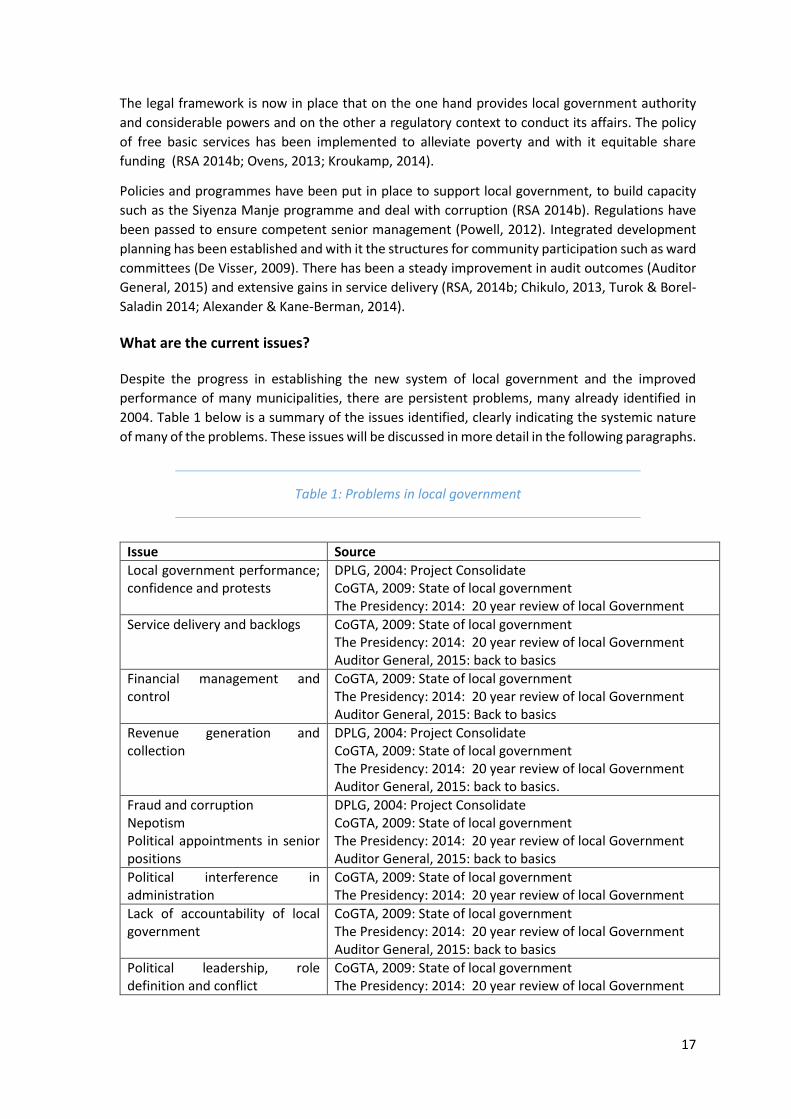
What are the current issues?
Despite the progress in establishing the new system of local government and the improved
performance of many municipalities, there are persistent problems, many already identified in
2004. Table 1 below is a summary of the issues identified, clearly indicating the systemic nature
of many of the problems. These issues will be discussed in more detail in the following paragraphs.
Table 1: Problems in local government
Issue Source
Local government performance; confidence and protests
DPLG, 2004: Project Consolidate CoGTA, 2009: State of local government The Presidency: 2014: 20 year review of local Government
Service delivery and backlogs CoGTA, 2009: State of local government The Presidency: 2014: 20 year review of local Government Auditor General, 2015: back to basics
Financial management and control
CoGTA, 2009: State of local government The Presidency: 2014: 20 year review of local Government Auditor General, 2015: Back to basics
Revenue generation and collection
DPLG, 2004: Project Consolidate CoGTA, 2009: State of local government The Presidency: 2014: 20 year review of local Government Auditor General, 2015: back to basics.
Fraud and corruption Nepotism Political appointments in senior positions
DPLG, 2004: Project Consolidate CoGTA, 2009: State of local government The Presidency: 2014: 20 year review of local Government Auditor General, 2015: back to basics
Political interference in administration
CoGTA, 2009: State of local government The Presidency: 2014: 20 year review of local Government
Lack of accountability of local government
CoGTA, 2009: State of local government The Presidency: 2014: 20 year review of local Government Auditor General, 2015: back to basics
Political leadership, role definition and conflict
CoGTA, 2009: State of local government The Presidency: 2014: 20 year review of local Government
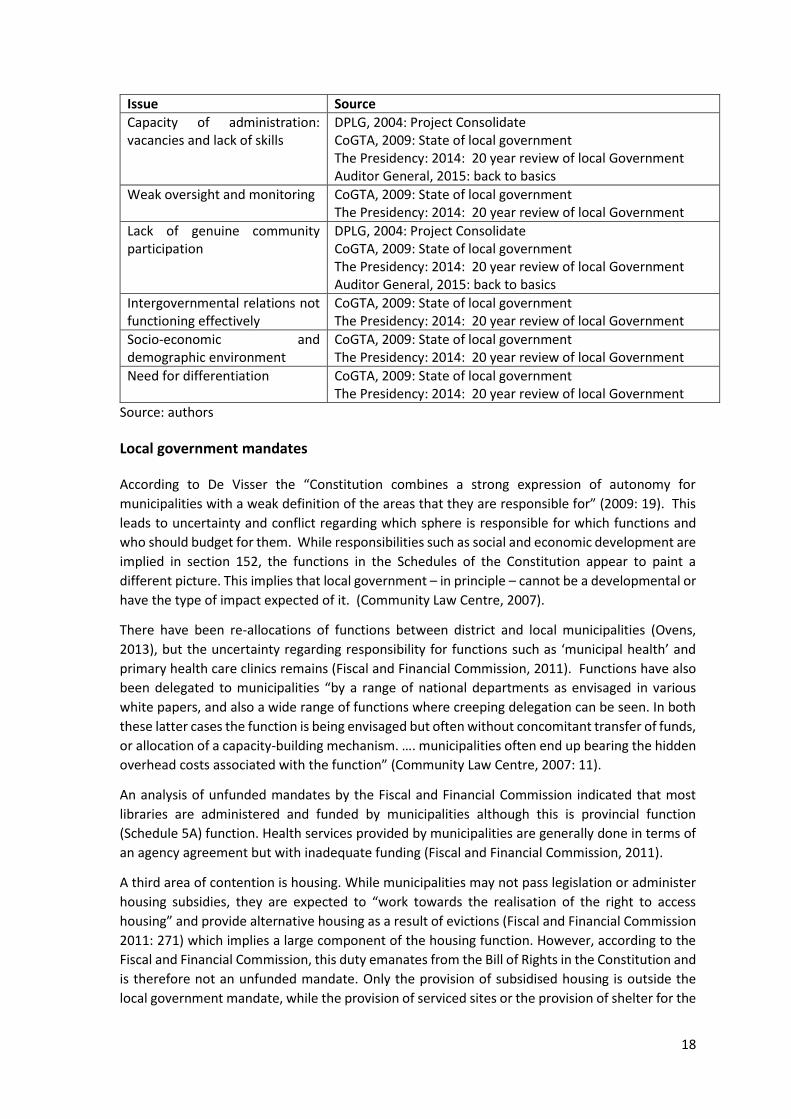
18
Issue Source
Capacity of administration: vacancies and lack of skills
DPLG, 2004: Project Consolidate CoGTA, 2009: State of local government The Presidency: 2014: 20 year review of local Government Auditor General, 2015: back to basics
Weak oversight and monitoring CoGTA, 2009: State of local government The Presidency: 2014: 20 year review of local Government
Lack of genuine community participation
DPLG, 2004: Project Consolidate CoGTA, 2009: State of local government The Presidency: 2014: 20 year review of local Government Auditor General, 2015: back to basics
Intergovernmental relations not functioning effectively
CoGTA, 2009: State of local government The Presidency: 2014: 20 year review of local Government
Socio-economic and demographic environment
CoGTA, 2009: State of local government The Presidency: 2014: 20 year review of local Government
Need for differentiation CoGTA, 2009: State of local government The Presidency: 2014: 20 year review of local Government
Source: authors
Local government mandates
According to De Visser the “Constitution combines a strong expression of autonomy for
municipalities with a weak definition of the areas that they are responsible for” (2009: 19). This
leads to uncertainty and conflict regarding which sphere is responsible for which functions and
who should budget for them. While responsibilities such as social and economic development are
implied in section 152, the functions in the Schedules of the Constitution appear to paint a
different picture. This implies that local government – in principle – cannot be a developmental or
have the type of impact expected of it. (Community Law Centre, 2007).
There have been re-allocations of functions between district and local municipalities (Ovens,
2013), but the uncertainty regarding responsibility for functions such as ‘municipal health’ and
primary health care clinics remains (Fiscal and Financial Commission, 2011). Functions have also
been delegated to municipalities “by a range of national departments as envisaged in various
white papers, and also a wide range of functions where creeping delegation can be seen. In both
these latter cases the function is being envisaged but often without concomitant transfer of funds,
or allocation of a capacity-building mechanism. …. municipalities often end up bearing the hidden
overhead costs associated with the function” (Community Law Centre, 2007: 11).
An analysis of unfunded mandates by the Fiscal and Financial Commission indicated that most
libraries are administered and funded by municipalities although this is provincial function
(Schedule 5A) function. Health services provided by municipalities are generally done in terms of
an agency agreement but with inadequate funding (Fiscal and Financial Commission, 2011).
A third area of contention is housing. While municipalities may not pass legislation or administer
housing subsidies, they are expected to “work towards the realisation of the right to access
housing” and provide alternative housing as a result of evictions (Fiscal and Financial Commission
2011: 271) which implies a large component of the housing function. However, according to the
Fiscal and Financial Commission, this duty emanates from the Bill of Rights in the Constitution and
is therefore not an unfunded mandate. Only the provision of subsidised housing is outside the
local government mandate, while the provision of serviced sites or the provision of shelter for the
19
homeless is a municipal responsibility. For this reasons, as well as the influence of housing (and
the broader concept of human settlement development) has on the structure of the city, the
provision of basic services and other social and physical infrastructure, the links to transport and
the municipal budget, the metros a pressing national and provincial government for the
delegation of this function. Discussions on the ‘accreditation’ of metros for housing functions have
been ongoing and need to be finalised (CoGTA, 2014; RSA, 2014c). A similar assignment of
transport to metros is required for effective and integrated transport systems (De Visser, 2009).
From the analysis by the Fiscal and Financial Commission metros perform provincial functions
without receiving the full funding to do so. In some cases the Provincial departments do not sign
the service level agreements or do not adhere to the funding conditions of the agreements while
in other cases functions are “devolved to municipalities without consultation and additional
funding” (2011:273). The implications of these ‘unfunded mandates’ extend beyond the
agreements to equitable share arrangements and local government’s ability to finance and deliver
services.
Lack of confidence in local government and community protests
Although service delivery protests have occurred since 2004, there has been an increase in the
number of protests since 2009, and these protests are becoming more violent (Kotze & Taylor,
2010; Powell et al., 2015; Fiscal and Financial Commission 2015). It appears that communities find
protests a more effective way of voicing their discontent than formal participatory structures
(Powell, 2012).
By far the most common grievances are related to municipal services and administration. Among
the main complaints are the following:
Inadequate service delivery or poor quality of basic services such as water and sanitation
(Chikulo, 2013) or lack of access to a service such as electricity due to ‘load shedding’ and
the price increases Kotze & Taylor, 2010; Alexander & Kane-Berman, 2014)
Maintenance of services (Akinboade et al., 2012)
Municipal mismanagement and corruption (Alexander & Kane-Berman, 2014);
Non-municipal functions such as education and policing (Powell et al., 2015)
Socio-economic issues such as lack of employment (Akinboade et al., 2012)
These protests do not appear to be closely linked to elections, as approximately as many protests
took place in the months after 2014 election there in the month before (Kotze & Taylor, 2010).
Despite the service record of the metropolitan city regions, they recorded the most protests, with
the most recorded in Gauteng, while Cape Town was the city with the most protests between
2012 and 2014 (Powell et al., 2015). Furthermore, there appears to be a low correlation “between
the size of the poor population and the prevalence of protests in general” (Powell et al., 2015: 13).
Municipal management
As mentioned above, many protests relate to municipal management including political
leadership, accountability and corruption. National government has also noted concerns as
indicated in Table 1 above (CoGTA, 2009; The Presidency: 2014a; Auditor General, 2015).
However, this is not a problem unique to local government and if these “problems within local
government are to be fixed, they must also be fixed at the provincial and national levels”
(Alexander & Kane-Berman, 2014:17).
20
Problems pertaining to leadership include political appointments of senior managers who may not
have the skills or experience for the post (De Visser, 2009; Ovens, 2013) Alexander & Kane-
Berman, (2014) point to the policy appointing of public servants in terms of political party
affiliation in order to gain control over all state institutions applies in all levels of government. The
dominance of one political party in an area creates conditions ripe for nepotism and corruption
(Koelbe & LiPuma, 2010).
Other leadership issues concern political interference with the administration including poor role
definition (Koelble & LiPuma 2010; CoGTA, 2009; De Visser, 2009). The regulations relating to
qualifications for senior management will address this, should they be implemented (Koelble &
LiPuma 2010; Alexander & Kane-Berman, 2014).
A lack of accountability of local government, including politicians, to their constituencies is noted
by several authors (Koelble & LiPuma 2010; Khale & Worku, 2013) as well as by national
government (DPLG, 2004; CoGTA, 2009; Auditor General, 2015). Accountability is compromised
when there is low fiscal autonomy but a heavy reliance of intergovernmental grants (Manyaka,
2014). Only when local government and the political leadership is held accountable to their
constituencies and not the party, can service delivery improve (Alexander & Kane-Berman, 2014).
While national policy documents bewail the high levels of corruption in local government, it
appears that in some cases the ruling party prizes political allegiance over a clean administration,
for example in Tlokwe, in fact, the ANC did not simply fail to stamp out corruption within its ranks
– it mobilised its top leadership to stamp upon those who tried to stamp it [out] there” Alexander
& Kane-Berman, 2014: 26). A similar case is reported in the Harry Gwala district where a whistle
blower was sanctioned (Keegan, 2015d).4
Municipal Finances: Revenue and Management
Municipalities have the power to generate revenue from property taxes (rates) and use charges
on the distribution of services (services charges) and also receive transfers and grants from
national government. As the municipal fiscal base is dependent on the local economic base,
municipalities with growing economies are able to collect more own revenue that those with a
weak economy. Thus metros are able to generate a large proportion of their own revenue, while
many smaller municipalities are dependent on transfers (Ovens, 2013; Koelbe & LiPuma, 2010;
Powell, 2012).
From the literature it is apparent that revenue collection is a challenge in local government. At the
end of March 2015 the total consumer debt owed to municipalities was R104 billion with
households owing two thirds of this amount (Keegan, 2015e). The recent report released by the
Auditor General (2015) points to declining fiscal health of municipalities and debt collection is part
of the problem. The underlying reasons for poor revenue collection include a long-standing culture
of non-payment, a high percentage of indigents who cannot afford to pay, losses due to lack of
maintenance, illegal connections and an unwillingness to enforce disconnections (Kroukamp,.
2014; Manyaka, 2014; Alexander & Kane-Berman, 2014).
4 The monthly The SA Local Government Briefing compiled by Clive Keegan and published by the SA Local Government Information Centre contains short section entitled Corruption Watch that reports on allegations and reports of corruption in local government.
21
Large cities have shown an improvement in their financial position (Savage, 2013) but may not be
able to extend their revenue sources (Fiscal & Financial Commission, 2013c). As the service tariffs
are increasing above the inflation rate, municipalities are reaching ceiling on what they can charge.
Furthermore, these are disproportionally affecting low income households who need to spend
between 11% and 19%, whereas higher income households only spent 2-3 percent more for the
same package of services (Savage, 2013).
The average collection rate is in the region of 80 percent and households are responsible for more
than 63 percent of municipal debt that was R87 billion by June 2013 (Alexander & Kane-Berman,
2014). According to the Fiscal & Financial Commission, smaller municipalities only manage to
collect about half of what is owed (2013a). The problem is particularly acute where large parts of
the municipality are under traditional leadership and no rates are payable and where no revenue
can be generated from electrical services charges as ESKOM provides the service directly (Fiscal &
Financial Commission, 2013a; Manyaka, 2014). For this reason there are growing numbers of
municipalities in financial difficulty (Monkam, 2014; Fiscal & Financial Commission, 2013c).
Fiscal autonomy – or the reduced reliance on transfers and grants - has had a positive effect on
service delivery (Krugell, et al., 2010; Manyaka, 2014). Revenue collection is not only critical for
cash flow, service delivery and maintenance but the payment of creditors. Earlier this year it was
noted that “total municipal arrear debt greater than 30 days was R4.67 billion. Of this amount,
the top 20 defaulting municipalities owed ESKOM about R3.68 billion for the bulk supply of
electricity” (Keegan, 2015d).
In addition to inadequate revenue collection, local government has been accused of poor financial
management (Khale & Worku, 2013). However, there has been an improvement since 2008, but
this is unevenly spread. “Metros and district municipalities should be leading by example in the
local government sphere, but only two metros (25%) and 12 district municipalities (27%) obtained
clean audit opinions” (Auditor General, 2015: 7). Reasons for poor financial management are the
lack of skills of senior financial managers (Monkam, 2014), and poor enforcement of regulations
(Koelbe & LiPuma, 2010; Alexander & Kane-Berman, 2014).
These problems are reflected in under-expenditure of grants (Fiscal and Financial Commission
2014; Keegan, 2015b). Other problems related to grants are the conditionality that requires
municipalities to provide infrastructure that does not necessarily add economic infrastructure to
support the economic and by implication the rates base. Furthermore, notwithstanding the
legislated priority of the integrated development plan, national departments grant administrators
dictate grant investment towards their department’s priorities, rather than those of the
municipality Fiscal and Financial Commission 2014).
Administrative capacity
The amalgamation of many small, under-resourced authorities into the new wall-to-wall
municipalities left all but the biggest municipalities with shortages of critical skills. This has been
a consistent comment relating to financial management, service delivery and maintenance of
infrastructure (Municipal Demarcation Board, 2012; Khale & Worku, 2013; Ovens, 2013; Koelbe &
LiPuma, 2010; Powell, 2012). Of particular concern are the vacancies in senior positions
municipalities and municipal entities and the high turnover of Chief Financial Officers (Auditor
General, 2015).
22
Two authors have also noted the constraints that the sheer size of many municipalities and the
distances to be travelled has on service provision and community participation (De Visser, 2009;
Alexander & Kane-Berman, 2014).
Community Participation
Another consistent concern regarding local government relates to the quality of community
participation and involvement in decision-making. Poor communication with residents, including
lack of feedback on promises, has been cited as a reason for community protests (Kroukamp,
2014; Koelbe & LiPuma, 2010).
National legislation and policy call for local government to be democratic and developmental;
working with communities and participating as voters, consumers and development partners
(Kotze & Taylor, 2010). To this end, formal community participation structures and processes
have been developed (Tau, 2013, Cash & Swatuk, 2011). In most cases the structures and
processes are in place, but they do not realise real participation (Mautjana, & Maombe, 2014).
However, in other cases there was little or no participation, and the processes did not follow the
rules (Auditor General, 2015). According to de Visser (2009) the institutionalisation of the
community participation process has reduced any incentive for innovation in involving
communities. There is also low public awareness of these participatory processes and structures
(Powell, 2012).
Intergovernmental relationships
The South African governance framework with its three spheres of government is complex and
has given rise to numerous difficulties regarding coordination and cooperation (Harrison, 2008,
CoGTA, 2009). The integrated development plan (IDP) was intended to be the mechanism for
integrating and coordinating government service delivery within the municipal space. According
to De Visser (209:22):
The IDP is expected to integrate the planning of all municipal departments under the
umbrella of a united strategy for the municipal area. Importantly, the IDP must go beyond
planning rhetoric and be the basis for the municipality’s annual budgets and its spatial
planning. Furthermore, the municipality’s senior managers must be held accountable
regularly, through a system of performance management, for the realisation of the IDP. As
if this configuration is not sufficiently ambitious, the IDP is expected to integrate not only
the municipality’s plans but also the plans of all national and provincial departments and
parastatals (such as electricity-generating and telecommunication utilities) in that municipal
area.
Clearly, this is a tall order and requires commitment, budget and capacity to achieve these
intentions. Many local municipalities rely on consultants to prepare the IDP but the quality of the
documents was less than ideal (Subban & Theron, 2012; De Visser, 2009, Harrison, 2008, Reddy,
2010). It has not achieved the intergovernmental integration that was desired (DPLG, 2008;
Subban & Theron, 2012) nor has it had much “success either in promoting social integration or in
altering the power dynamics reflected in spatial arrangements” (Cash & Swatuk, 2011:22).
The evaluation by the DPLG (2008) indicates that there is improving alignment between the plans
of the three spheres of government and that the system instituted by the Intergovernmental
Relations Framework Act (RSA, 2005) is beginning to function, with the most effective forms being
District Forums due to the decision-making powers of the executive mayors. This potential is
confirmed by Goss et al., (2008) () on the basis of a pilot project in thirteen district municipalities.
23
Nevertheless, the Presidency (2014a) expresses concern about the state of inter-governmental
relationships and the need for improved alignment.
The involvement of Traditional Leaders in local government remains problematic, as they believe
that they are ignored or sidelined (Ovens, 2013; Bikam, & Chakwizira, 2014). This is a critical issue
in municipalities whose area contains large areas under traditional authority.
Provincial governments have a duty to monitor and support municipalities, a responsibility that
has been neglected according to the national government reviews of local government (DPLG,
2004; CoGTA, 209, RSA, 2014b). However, Kroukamp (2014) notes that when it comes to grants,
provinces have little influence or input on the payment or expenditure of the grants, as these are
paid directly to municipalities. Nonetheless, both national and provincial government are accused
of not giving enough attention to the problems in local government (Koeble & LiPuma, 2010).
One of the areas where misconstrued mandates, conflicting agendas and self-interest is played
out is spatial planning and development, where
“Government departments pursued their own interests and policies without concern for
some broader agenda or their impact on migration and urbanisation patterns ... [so] that
all sorts of programmes (housing, healthcare, industrial development initiatives, social
welfare policies, migration to name a few) have all taken place in the context of the relevant
departments with little coordination and oversight from the political and administrative
centre…. Local municipalities, the lowest and newest of the new governing institutions,
ended up with the responsibility of implementing a myriad of ‘developmental policies’
without a coherent framework or coordination from the national and provincial levels of
government and, increasingly, at the expense of their democratic role and purpose” Koeble
& LiPuma, 2010:578-579).
A failed experiment?
The transformation of the local government system has been a continuous process over the past
twenty years and has deeply affected the nature of municipal governance. The positive, even
exciting message of the White Paper on Local Government in 1998, has become one of
‘consolidate’, ‘turnaround’ and ‘back-to-basics’ in the following years. Most of the concerns noted
in the status quo of the 1998 White Paper on Local Government (DCD, 1998) still apply: racial
segregation, financial constraints, protests and an incomplete transition (Koeble & LiPuma, 2010,
Powell, 2012).
Local government is failing the poor located on the periphery of the city regions who are excluded
from the city by the fragmented spatial landscape, the distances to economic opportunities and
social facilities, and the scale of the demand for services. Equally are the residents of the smaller
municipalities. The citizens of the small towns, and in particular the rural municipalities, have also
been failed by local government in that they do not have the financial or administrative capacity
to deliver on the developmental mandate. There is a clear distinction between the ability of the
large metros such as Johannesburg, Cape Town, Tshwane, and eThekwini (and possibly
Ekurhuleni) to raise revenue to govern and provide the basic needs of their growing populations,
and the remainder of South African cities. Even the second tier of metros such as Ekurhuleni,
Nelson Mandela Bay, Buffalo City and Mangaung are not in the same league in terms of economic
base or governance capacity (Chitga-Mabugu & Monkam, 2013). While some of the intermediate
cities such as Rustenburg and Emalahleni are currently growing due to mining activities, many
other mining towns are facing decline and severe economic and environmental problems.
24
The nature of the problem is different for different cities; thus the plans and solutions should be
different (Kruger, 2012).
Perhaps a new approach to local government is required. Or perhaps it is merely a matter of
improved oversight due to distrust in the ability of local government (De Visser, 2009) or that
where “the mechanisms of government oversight, accountability and the enforcement of rules
are at best rudimentary and, at worst, non-existent across the spectrum of municipal government.
While the legal structure is certainly in place, the implementation of the rules and regulations to
ensure financial oversight, accountability, and responsiveness to the citizens is rudimentary”
(Koeble & LiPuma, 2010: 586)?
If local government is to be the delivery arm of government, then a re-appraisal of the mandates
and funding is required. At present local government receives the smallest share from central
government coffers based on the assumption that cities can raise revenue from property taxes
and services charges (Fiscal & Finance Commission 2013b). However, this is proving to be a largely
unfounded assumption for all but the largest cities – and they are the municipalities with the
greatest growth rates and hence the escalating demand for services (van Huyssteen et al 2009).
4. Productive cities
Introduction
This overview will focus on the economy of cities in South Africa. While detailed economic data is
available at national and provincial level, unfortunately the same quality of data relating to
employment, industrial structure, investment, and skills at municipal level – even for the large
metros – is not readily available which constrains the level of analysis possible. Consequently, this
section provides a broad overview rather than detailed discussions on local economies.
The section will firstly consider the relative productivity, employment and incomes of different
types of cities based largely on the work of Harrison (2014) and Turok & Borel-Saladin (2013). This
will include a comment on the economies of the largely rural B3 and B4 municipalities including
the role of small towns. Some reflections on the informal economy in urban areas will introduce
a short discussion of Local Economic Development to complete the first part of this section. The
final part of this section will evaluate infrastructure investment and maintenance along with some
of the key successes and concerns.
Relative performance of South African Cities
National economic development and growth has long been linked to the productivity of cities
(Glaeser, 2011), however, this is not necessarily true of the majority of South African cities (Turok
& Borel-Saladin 2013). This is certainly true of the largest metropolitan municipalities (metros)
that are growing faster than the rest of the country, generate over 70% of South Africa’s GDP and
exports (Van Huyssteen et al, 2009, Turok & Borel-Saladin 2013). The Gauteng metros
(Johannesburg, Tshwane and Ekurhuleni) Cape Town, eThekwini and Nelson Mandela Bay (Port
Elizabeth) provide services to a region far wider than their municipal boundaries. These metros
have the highest levels of skilled labour, research and development that along with agglomeration
economies contribute to regional competitiveness. While there are still pockets of deep
deprivation with some 24% of the population living in poverty, employment rates - including youth
employment - and incomes are generally higher than in rural areas (Van Huyssteen et al, 2009).
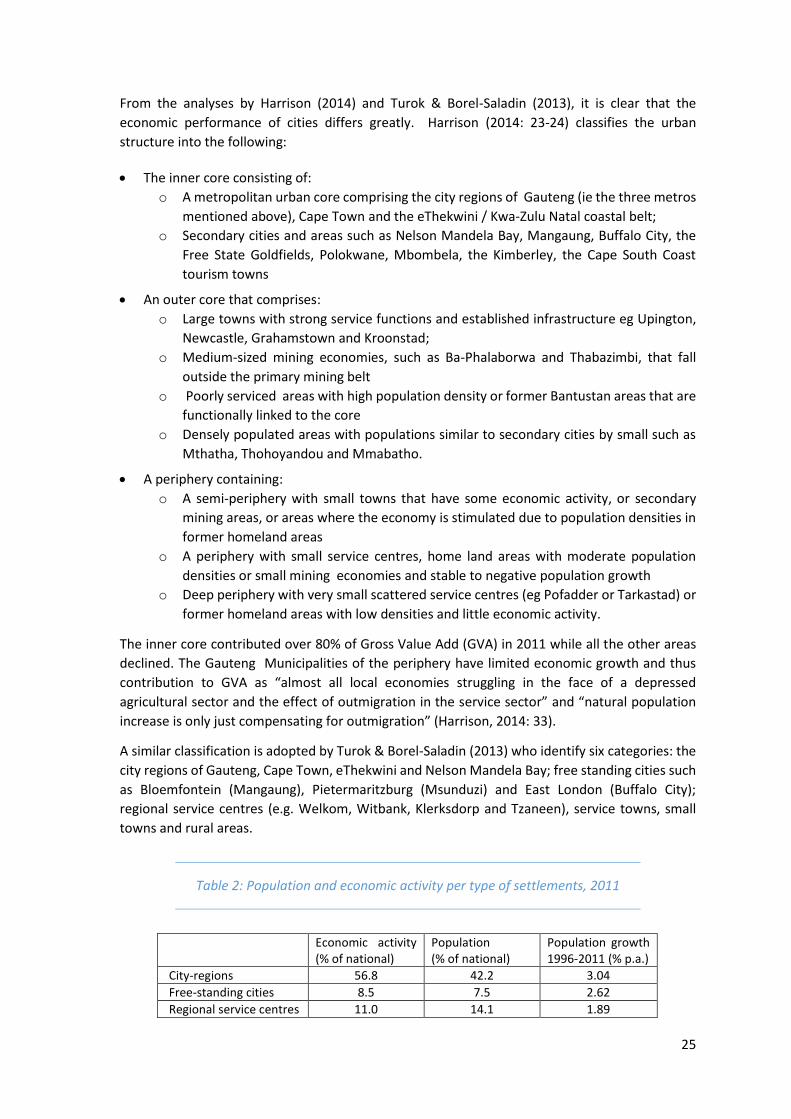
25
From the analyses by Harrison (2014) and Turok & Borel-Saladin (2013), it is clear that the
economic performance of cities differs greatly. Harrison (2014: 23-24) classifies the urban
structure into the following:
The inner core consisting of:
o A metropolitan urban core comprising the city regions of Gauteng (ie the three metros
mentioned above), Cape Town and the eThekwini / Kwa-Zulu Natal coastal belt;
o Secondary cities and areas such as Nelson Mandela Bay, Mangaung, Buffalo City, the
Free State Goldfields, Polokwane, Mbombela, the Kimberley, the Cape South Coast
tourism towns
An outer core that comprises:
o Large towns with strong service functions and established infrastructure eg Upington,
Newcastle, Grahamstown and Kroonstad;
o Medium-sized mining economies, such as Ba-Phalaborwa and Thabazimbi, that fall
outside the primary mining belt
o Poorly serviced areas with high population density or former Bantustan areas that are
functionally linked to the core
o Densely populated areas with populations similar to secondary cities by small such as
Mthatha, Thohoyandou and Mmabatho.
A periphery containing:
o A semi-periphery with small towns that have some economic activity, or secondary
mining areas, or areas where the economy is stimulated due to population densities in
former homeland areas
o A periphery with small service centres, home land areas with moderate population
densities or small mining economies and stable to negative population growth
o Deep periphery with very small scattered service centres (eg Pofadder or Tarkastad) or
former homeland areas with low densities and little economic activity.
The inner core contributed over 80% of Gross Value Add (GVA) in 2011 while all the other areas
declined. The Gauteng Municipalities of the periphery have limited economic growth and thus
contribution to GVA as “almost all local economies struggling in the face of a depressed
agricultural sector and the effect of outmigration in the service sector” and “natural population
increase is only just compensating for outmigration” (Harrison, 2014: 33).
A similar classification is adopted by Turok & Borel-Saladin (2013) who identify six categories: the
city regions of Gauteng, Cape Town, eThekwini and Nelson Mandela Bay; free standing cities such
as Bloemfontein (Mangaung), Pietermaritzburg (Msunduzi) and East London (Buffalo City);
regional service centres (e.g. Welkom, Witbank, Klerksdorp and Tzaneen), service towns, small
towns and rural areas.
Table 2: Population and economic activity per type of settlements, 2011
Economic activity (% of national)
Population (% of national)
Population growth 1996-2011 (% p.a.)
City-regions 56.8 42.2 3.04
Free-standing cities 8.5 7.5 2.62
Regional service centres 11.0 14.1 1.89
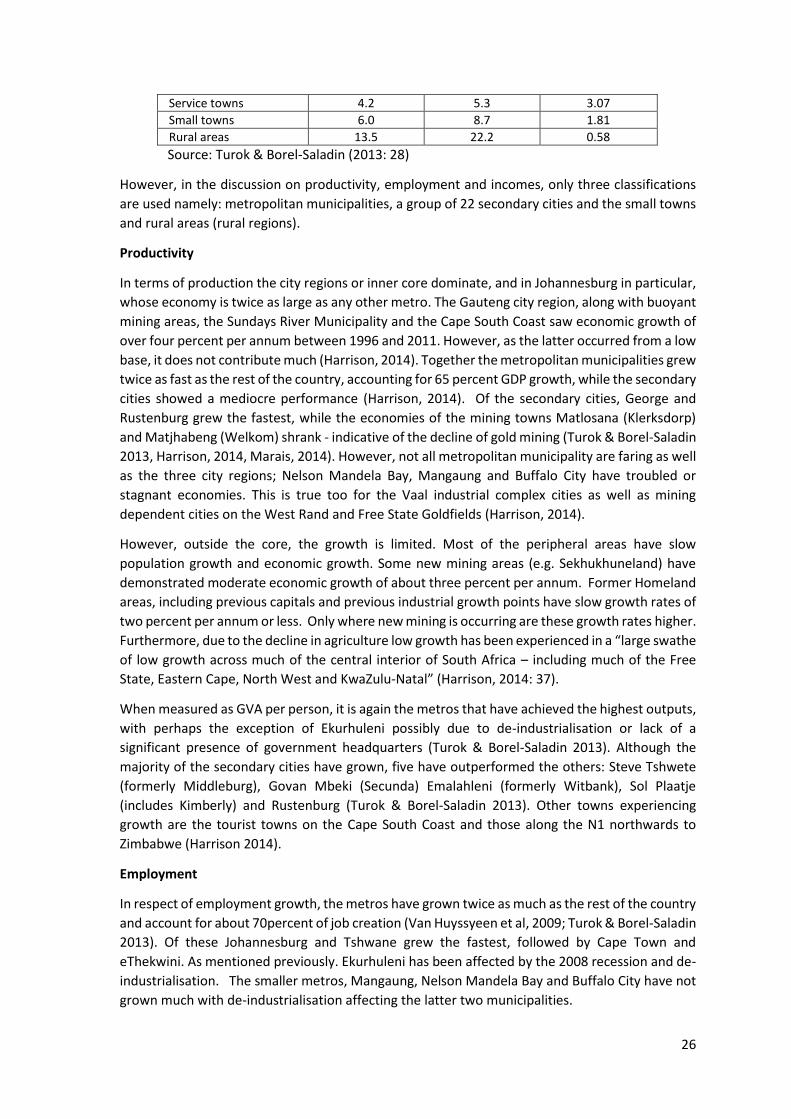
26
Service towns 4.2 5.3 3.07
Small towns 6.0 8.7 1.81
Rural areas 13.5 22.2 0.58
Source: Turok & Borel-Saladin (2013: 28)
However, in the discussion on productivity, employment and incomes, only three classifications
are used namely: metropolitan municipalities, a group of 22 secondary cities and the small towns
and rural areas (rural regions).
Productivity
In terms of production the city regions or inner core dominate, and in Johannesburg in particular,
whose economy is twice as large as any other metro. The Gauteng city region, along with buoyant
mining areas, the Sundays River Municipality and the Cape South Coast saw economic growth of
over four percent per annum between 1996 and 2011. However, as the latter occurred from a low
base, it does not contribute much (Harrison, 2014). Together the metropolitan municipalities grew
twice as fast as the rest of the country, accounting for 65 percent GDP growth, while the secondary
cities showed a mediocre performance (Harrison, 2014). Of the secondary cities, George and
Rustenburg grew the fastest, while the economies of the mining towns Matlosana (Klerksdorp)
and Matjhabeng (Welkom) shrank - indicative of the decline of gold mining (Turok & Borel-Saladin
2013, Harrison, 2014, Marais, 2014). However, not all metropolitan municipality are faring as well
as the three city regions; Nelson Mandela Bay, Mangaung and Buffalo City have troubled or
stagnant economies. This is true too for the Vaal industrial complex cities as well as mining
dependent cities on the West Rand and Free State Goldfields (Harrison, 2014).
However, outside the core, the growth is limited. Most of the peripheral areas have slow
population growth and economic growth. Some new mining areas (e.g. Sekhukhuneland) have
demonstrated moderate economic growth of about three percent per annum. Former Homeland
areas, including previous capitals and previous industrial growth points have slow growth rates of
two percent per annum or less. Only where new mining is occurring are these growth rates higher.
Furthermore, due to the decline in agriculture low growth has been experienced in a “large swathe
of low growth across much of the central interior of South Africa – including much of the Free
State, Eastern Cape, North West and KwaZulu-Natal” (Harrison, 2014: 37).
When measured as GVA per person, it is again the metros that have achieved the highest outputs,
with perhaps the exception of Ekurhuleni possibly due to de-industrialisation or lack of a
significant presence of government headquarters (Turok & Borel-Saladin 2013). Although the
majority of the secondary cities have grown, five have outperformed the others: Steve Tshwete
(formerly Middleburg), Govan Mbeki (Secunda) Emalahleni (formerly Witbank), Sol Plaatje
(includes Kimberly) and Rustenburg (Turok & Borel-Saladin 2013). Other towns experiencing
growth are the tourist towns on the Cape South Coast and those along the N1 northwards to
Zimbabwe (Harrison 2014).
Employment
In respect of employment growth, the metros have grown twice as much as the rest of the country
and account for about 70percent of job creation (Van Huyssyeen et al, 2009; Turok & Borel-Saladin
2013). Of these Johannesburg and Tshwane grew the fastest, followed by Cape Town and
eThekwini. As mentioned previously. Ekurhuleni has been affected by the 2008 recession and de-
industrialisation. The smaller metros, Mangaung, Nelson Mandela Bay and Buffalo City have not
grown much with de-industrialisation affecting the latter two municipalities.
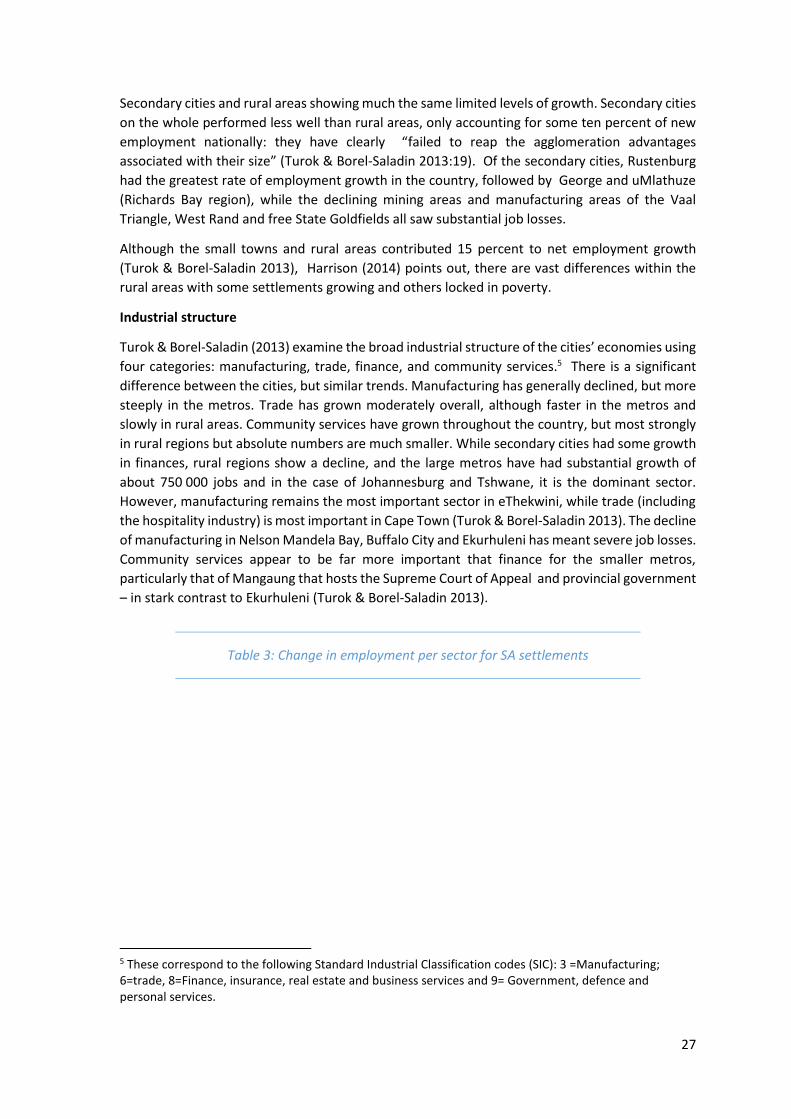
27
Secondary cities and rural areas showing much the same limited levels of growth. Secondary cities
on the whole performed less well than rural areas, only accounting for some ten percent of new
employment nationally: they have clearly “failed to reap the agglomeration advantages
associated with their size” (Turok & Borel-Saladin 2013:19). Of the secondary cities, Rustenburg
had the greatest rate of employment growth in the country, followed by George and uMlathuze
(Richards Bay region), while the declining mining areas and manufacturing areas of the Vaal
Triangle, West Rand and free State Goldfields all saw substantial job losses.
Although the small towns and rural areas contributed 15 percent to net employment growth
(Turok & Borel-Saladin 2013), Harrison (2014) points out, there are vast differences within the
rural areas with some settlements growing and others locked in poverty.
Industrial structure
Turok & Borel-Saladin (2013) examine the broad industrial structure of the cities’ economies using
four categories: manufacturing, trade, finance, and community services.5 There is a significant
difference between the cities, but similar trends. Manufacturing has generally declined, but more
steeply in the metros. Trade has grown moderately overall, although faster in the metros and
slowly in rural areas. Community services have grown throughout the country, but most strongly
in rural regions but absolute numbers are much smaller. While secondary cities had some growth
in finances, rural regions show a decline, and the large metros have had substantial growth of
about 750 000 jobs and in the case of Johannesburg and Tshwane, it is the dominant sector.
However, manufacturing remains the most important sector in eThekwini, while trade (including
the hospitality industry) is most important in Cape Town (Turok & Borel-Saladin 2013). The decline
of manufacturing in Nelson Mandela Bay, Buffalo City and Ekurhuleni has meant severe job losses.
Community services appear to be far more important that finance for the smaller metros,
particularly that of Mangaung that hosts the Supreme Court of Appeal and provincial government
– in stark contrast to Ekurhuleni (Turok & Borel-Saladin 2013).
Table 3: Change in employment per sector for SA settlements
5 These correspond to the following Standard Industrial Classification codes (SIC): 3 =Manufacturing; 6=trade, 8=Finance, insurance, real estate and business services and 9= Government, defence and personal services.
28
Source: Turok & Borel-Saladin (2013: 23)
Employment rate6
Employment rates in metros are far higher (between 40 and 45 percent) than those in rural areas
where employment rates can be as low as twenty percent (Turok & Borel-Saladin 2013, Harrison,
2014). The metros have a slight advantage in unemployment rate but those of secondary cities
and rural regions are much the same at roughly 26 percent.
Of the metros, Johannesburg, followed by Tshwane and Cape Town, has the most positive
employment rates, while those of the three smallest metros lag behind at around 30 percent. This
is indicative of poorly performing economies and serious poverty. Similarly the secondary cities
demonstrate a range of employment rates with Rustenburg exceeding fifty percent and Emfuleni
uMhlathuze below twenty percent. According to Harrison (2014) the peripheral areas have
unemployment rates ranging from the national average of about 24 percent to over forty or even
fifty percent in former Homelands.
From the above discussion, it is clear that with the exception of a few cities such as the major city
regions and some secondary cities such as Rustenburg, local economies are not performing
particularly well and are therefore unable to provide employment to the growing pool of job
seekers. Deindustrialisation of the economy, and the downscaling of mining have led to job losses
and depressed economies in many cities with concomitant social consequences. However, despite
the bleak outlook of many urban areas, the large metros still offer more opportunities than rural
areas where the economic prospects are worse.
The rural landscape
Rural areas in South Africa range from sparsely populated areas in the Northern Cape, commercial
agricultural areas and former homelands. Therefore any discussion on rural economies must
either be very broad, or very specific. This section takes the former approach, building on the
information presented in the section above.
6 “The rate of employment measures the proportion of the working age population (aged 15-64) with a paid formal job. The unemployment rate is the proportion of the economically active population aged 15-64 who are able, willing and actively looking for work” (Turok & Borel-Saladin 2013: 25)
29
Just over a century ago South Africa was mostly rural, with a few port cities and some small towns
scattered through the interior that were established as administrative centres for either the
church or the state, or both (Floyd, 1960). The discovery of diamonds, then gold, and subsequent
industrialisation, along with the enforcement of segregationist policies dramatically altered the
landscape with urbanisation on the one hand and the creation of reserves or ‘Homelands’ or
‘Bantustans’ (Turok, 2012; Musvoto 2014).
Urbanisation is continuing while many rural areas – with the exception of rapidly expanding
mining areas – experience slow or negative population and economic growth. This is particularly
acute in the peripheral areas where there is a limited economic base (Harrison 2014). For many
such areas social grants and remittances are the main sources of income (COGTA, 2009; Manyaka.
2014). With limited opportunities, such areas find it difficult to attract and retain professionals and
other skilled people (Alexander & Kane-Berman, 2014).
Not only are the former homeland areas under pressure, but commercial farming regions have
also seen shrinking economies. “Rural employment fell by close to 1.5 million in the past decade
because of losses in the commercial farm sector and the collapse of homeland agriculture, which
sharply reduced self-employment opportunities there. As a result, only one out of every four
persons of working age in rural areas is currently employed, generating a growing reservoir of
surplus labour that looks toward urban areas for job opportunities” (Mahajan, 2014: 8). In
considering the prospects for rural areas, Wessels (2012) notes that many residents trapped in
rural areas have already emotionally urbanised, and concludes that skills development that will
enable people to find work in a non-rural context is the most important intervention required for
areas with limited economic potential.
Small or rural towns are viewed as important service points in the rural landscape. There is a
growing literature on their role and prospects. Toerien and Seaman (2010, 2012a, 20102b, 20102c,
2014) have described the regional enterprise system of small towns and Toerien (2015) has
recently examined the economic profile of Free State towns where agriculture (10.3%), followed
by services (10,1%) are the dominant economic activities while the decline in mining has led to a
reduction of some 147 000 jobs. Other work on small towns in South Africa include Donaldson
and Marais (2012) with chapters that inter alia examine the economy of small towns, including
case studies of Beaufort West, Calvinia, Clarens, Knysna, Prince Albert, and Richmond. One of the
key themes of these chapters is the importance of small towns in their locale as service providers.
Other authors include Xuza (2005) and Etienne Nel (eg McKibbin, Binns, T. & Nel (2012); Nel,
Taylor, Hill, & Atkinson, D. (2011) Nel & Binns (2003). Many of these case studies are in the
commercial farming areas, and few appear to be in areas under traditional authority or in the
north of the country.
Local economic development
The Constitution requires local government to promote social and economic development. Thus
local economic development (LED) and with it small, medium and micro enterprise (SMME)
development has been an important policy consideration by national government for local
government and are intended to be part of the integrated development plan (IDP). Two distinct
approaches, market-led and top down and pro-poor or bottom-up, have been adopted in
preparing LED strategies (Rogerson 2011, Muvoto, 2014). Market led strategies seek to enhance
the local economy’s competitiveness, and often include large property led development (eg The
Gauteng Blue IQ projects, international conference centres (ICC) and facilities for hosting mega
30
events (Mosvoto, 2014), or concerned attracting investment to a city, such as Industrial
Development Zones (IDZ) (Xuza, 2007). The larger cities tend to focus on market led strategies
and developing institutional frameworks (Rogerson, 2010). Pro-poor or bottom-up strategies
emphasise local self-reliance and poverty reduction. Such strategies tend to be favoured by
smaller municipalities (Musvoto, 2014; Rogerson, 2010, Xuza, 2007).
In his review of the effectiveness of LED Rogerson (2011: 164) indicates that the “achievements
of LED in South Africa have been, at best, modest, particularly outside of the major cities”. Nel et
al echo this view (2009). Among the reasons for poor performance noted by Nel et al. (2009),
Reddy & Wallis, (2012), Rogerson (2010, 2011) and Xuza (2007) are:
Improved economic data at local level for a better understanding of the local economy.
The lack of success of projects, particularly community development or social welfare
projects undermines the standing of LED;
A poor institutional framework with limited involvement of provinces and private sector
partnerships;
The lack of knowledge centres or platforms to develop and disseminate good practices;
LED is not considered as important as basic service delivery and therefore does not receive
the focus that it should;
Poor capacity that is linked to the low status of LED
Insecure funding linked to grants (from government and donors)
Differential scales: large cities and small municipalities (Heideman, 2011).
However, there are some successes, including the support of the informal economy by local
governments through LED (Rogerson, 2011, 2013).
The informal economy
No discussion on the economy of South African cities can be complete without comment on the
informal (or second) economy (Toerein, 2015). There is an extensive literature on the informal
economy (see for example Gërxhani, 2004, Simone, n.d, Simone & Abouhani) and the importance
thereof in Africa, but the scope of this research does not permit a detailed discussion; thus the
following paragraphs will provide a synopsis of key issues.
There are a number of definitions of the informal economy, but the most common feature is a
lack of regulation (Gërxhani, 2004; Van der Heijden, 2012). However, the range of activities is
wide, including informal (street) traders or hawkers, mini-bus taxis, and informal producers.
There is a complex interaction between the formal and the informal economies (Davies, &
Thurlow, 2010). Van Heijden (2012) points out that the informal economy is important to the
formal as the former sources its products and spends earnings in the latter.
According to Davies, & Thurlow (2010), South Africa’s informal economy is smaller than similar
middle income countries but has still created the most employment in the previous decade: in
2004 roughly thirty percent7 of employment – depending on the definition – could have been in
the informal economy. However, a more recent survey indicated that the contribution to
employment was roughly 16 percent in 2014 (Visser, 2014) and some over ten percent of all
7 According to StatsSA 2012, the total number of employed people was 13 180 077 and of those about 12% were in the informal sector ie 1 613 078.
31
incomes, of which sixty percent is from labour in private households. (Wills, 2009). The relative
share of the informal sector by province indicates some correlation with the unemployment rate,
supporting the idea that for many people the informal sector is the alternative to unemployment.
Estimates of the contribution of the informal sector to the economy range from about five percent
(in 2013 according to Stats SA) (Visser 2014) to over thirty percent (Van der Heijden, 2012), which
is more than the contribution of agriculture or construction (Stats SA, 2014b). Informal trade in
Bloemfontein alone was worth R431 million in 2010 (Ntema & Marais, 2010). This significant
contribution to the economy has important policy implications for local economic development,
spatial planning and urban design (Van der Heijden, 2012; Siqwana-Ndulo, 2013).
The informal economy is not the preferred form of employment in South Africa, but is viewed as
an alternative to unemployment (Visser, 2014). This is supported by correlation between the
unemployment rate and relative share of the informal economy (Van der Heijden, 2012).
Conversely, entry into the informal economy is not much easier than the formal due to access due
to barriers to entry such as limited credit, crime and “reservation wage inflated by social transfers”
(Davies, & Thurlow, 2010: 438). These barriers are confirmed by Mahajan (2014), who states that
in ‘townships’ the competition by national chains have “crowded out local production and street
trading through price competition” (2014:10).
From a study on township and informal settlement enterprises, an opportunity has been identified
to “enable South Africa’s growth engine to fire on two cylinders” of the formal economy and a
modernising informal sector (Mahajan, 2014: 20), through economy-wide competiveness,
improved urban management and targeted interventions in ‘townships’. The latter will require
improved infrastructure, a more-enterprise friendly regulatory environment, reducing crime, and
better access to finance and financial services as well as improved skills through better quality
education. Furthermore, according to Smit & Musango (2015), there is potential for more
sustainable growth through ‘greening’ of the informal economy.
However, despite the acknowledgement of the importance of the informal economy in poverty
alleviation - without the contribution of the informal economy the employment rate would
double– “almost complete absence of reference to the informal economy in official IDP and LED
strategy documents. The informal economy is most often considered by municipal planners as a
spatial problem (i.e. where to locate informal trading zones) rather than as an integral part of the
local economy, and a key factor preventing even higher levels of unemployment”(Van Heijden,
2012: 9).
Infrastructure
The Development Bank of Southern Africa’s Infrastructure Barometer emphasises the importance
of sound infrastructure for social and economic growth as “Infrastructure planning and provision
underpin spatial planning, access to services and economic opportunities, and productivity”
(Nicolaou-Manias, 2012: 6). This short section will provide an overview on the state of
infrastructure provision in South Africa around the provision of basic services and issues of
investment and maintenance. The discussion about more sustainable or ‘green’ infrastructure is
in a separate section linked to the sustainable city.
Service delivery and infrastructure
32
Few will dispute that South African cities have made major gains in the provision of basic services
in the past 20 years (StatsSA, 2012, Turok & Borel-Saladin, 2014). Alexander & Kane-Berman
(2014: 24) state that:
Between 1996 and 2011 the total number of households in South Africa increased by 60%,
or 5.4 million and the population by 28%, or 11.4 million. In the same period, the number
of households using electricity for lighting increased by 135%, or by 7.1 million. The number
of households with access to piped water increased by 82% or 5.9 million. The number of
households with access to flush or chemical lavatories has increased by 99% or 4.4 million,
and the number of households who have their refuse removed by their local authority by
90%, or 4.3 million.
The metros have been consistently performing better than the local municipalities in all areas of
service provision despite the much greater populations that they service, with particularly the
rural (B4) municipalities lagging behind in relation to all four major services, while the B2 and B3
municipalities provide between sixty per cent and seventy percent of their households with
sanitation and municipal waste services and over 90% of households with water. Overall, the
greatest progress is with respect to water provision and the least is sanitation (RSA, 2014a).
Generally the rural municipalities are struggling to provide basic services and they face the
following problems:
The sheer size of the municipal area: many municipalities are larger than states in the
USA or European countries which creates difficulties in servicing all areas (Alexander &
Kane-Berman, 2014; De Visser, 2009);
The economic viability of providing waterborne sanitation and electricity in low density or
mountainous areas (Nicolaou-Manias, 2012);
Lack of capacity, particularly with respect to the shortage of technical skills such as
planning and engineering (MDB, 2012; Nicolaou-Manias, 2012; Ovens, 2013);
The low level of economic activity, which translates into, limited revenue and a strong
reliance on intergovernmental transfers (Manyaka. 2014; Nicolaou-Manias, 2012).
These issues are also reflected in the Blue Drop and Green Drop ratings of drinking water and
waste water treatment respectively, where the urban provinces generally performed better than
the rural ones. However, some local municipalities outperformed the metros according to the
2012 Blue Drop report (Department of Water Affairs, 2012) and the latest Green Drop report
(Department of Water Affairs, 2015) but rural municipalities generally do not perform well (see
Department of Water Affairs, 2015). However, nearly forty percent of municipalities’ ratings fall
within the High – to Critical Risk category (Department of Water Affairs, 2014a)
While the of Department of Water Affairs is monitoring the performance of municipalities that
are water authorities, there is concerns regarding the quality of water treatment, where in many
cases the water quality is poor, the supply of potable water is unreliable. The extent of water loss
– a national average of 35 percent – in a water scarce country is of deep concern (Nicolaou-
Manias, 2012). eThekwini is spending millions annually to deal with water losses due to leakages
and overflows at storage points (Keegan. 2015b).
Similar concerns arise regarding sanitation systems. In 2009 only seven percent of waste water
treatment plants were at an acceptable standard and again it was generally the metros that
achieved the highest scores. There has subsequently been improvement in the average
performance by municipalities with scores rising from 37 percent in 2009 to 46.4 percent in 2013
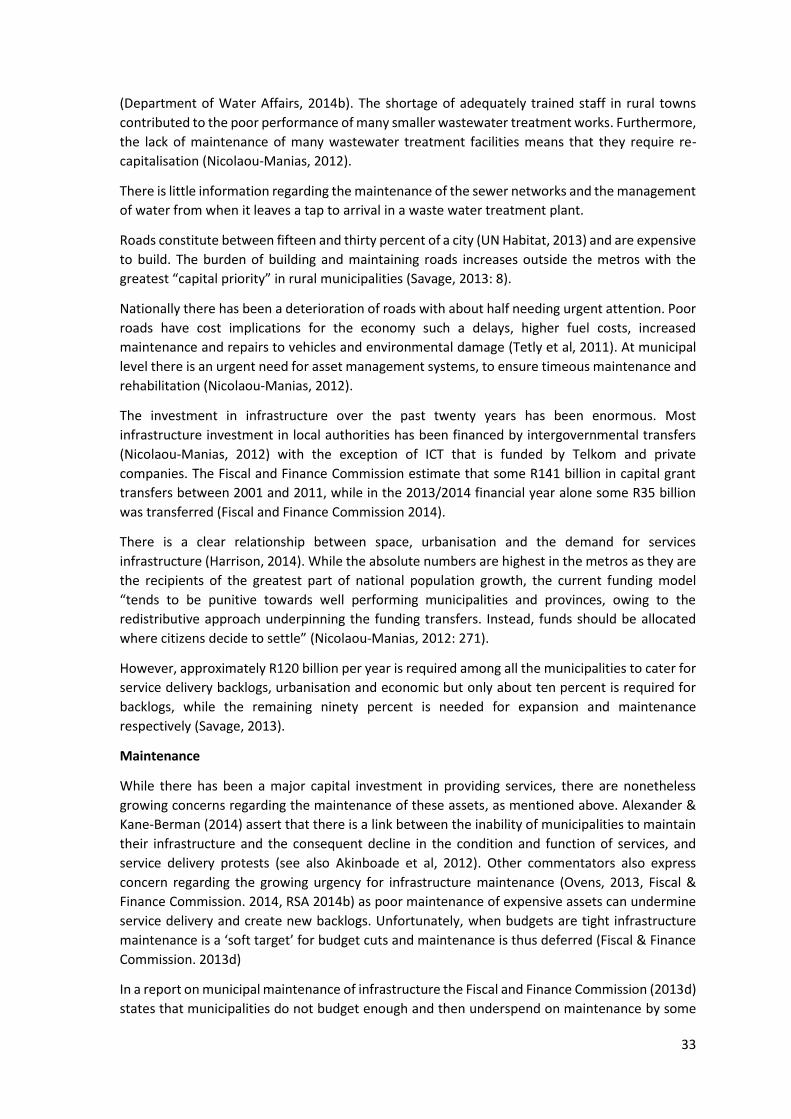
33
(Department of Water Affairs, 2014b). The shortage of adequately trained staff in rural towns
contributed to the poor performance of many smaller wastewater treatment works. Furthermore,
the lack of maintenance of many wastewater treatment facilities means that they require re-
capitalisation (Nicolaou-Manias, 2012).
There is little information regarding the maintenance of the sewer networks and the management
of water from when it leaves a tap to arrival in a waste water treatment plant.
Roads constitute between fifteen and thirty percent of a city (UN Habitat, 2013) and are expensive
to build. The burden of building and maintaining roads increases outside the metros with the
greatest “capital priority” in rural municipalities (Savage, 2013: 8).
Nationally there has been a deterioration of roads with about half needing urgent attention. Poor
roads have cost implications for the economy such a delays, higher fuel costs, increased
maintenance and repairs to vehicles and environmental damage (Tetly et al, 2011). At municipal
level there is an urgent need for asset management systems, to ensure timeous maintenance and
rehabilitation (Nicolaou-Manias, 2012).
The investment in infrastructure over the past twenty years has been enormous. Most
infrastructure investment in local authorities has been financed by intergovernmental transfers
(Nicolaou-Manias, 2012) with the exception of ICT that is funded by Telkom and private
companies. The Fiscal and Finance Commission estimate that some R141 billion in capital grant
transfers between 2001 and 2011, while in the 2013/2014 financial year alone some R35 billion
was transferred (Fiscal and Finance Commission 2014).
There is a clear relationship between space, urbanisation and the demand for services
infrastructure (Harrison, 2014). While the absolute numbers are highest in the metros as they are
the recipients of the greatest part of national population growth, the current funding model
“tends to be punitive towards well performing municipalities and provinces, owing to the
redistributive approach underpinning the funding transfers. Instead, funds should be allocated
where citizens decide to settle” (Nicolaou-Manias, 2012: 271).
However, approximately R120 billion per year is required among all the municipalities to cater for
service delivery backlogs, urbanisation and economic but only about ten percent is required for
backlogs, while the remaining ninety percent is needed for expansion and maintenance
respectively (Savage, 2013).
Maintenance
While there has been a major capital investment in providing services, there are nonetheless
growing concerns regarding the maintenance of these assets, as mentioned above. Alexander &
Kane-Berman (2014) assert that there is a link between the inability of municipalities to maintain
their infrastructure and the consequent decline in the condition and function of services, and
service delivery protests (see also Akinboade et al, 2012). Other commentators also express
concern regarding the growing urgency for infrastructure maintenance (Ovens, 2013, Fiscal &
Finance Commission. 2014, RSA 2014b) as poor maintenance of expensive assets can undermine
service delivery and create new backlogs. Unfortunately, when budgets are tight infrastructure
maintenance is a ‘soft target’ for budget cuts and maintenance is thus deferred (Fiscal & Finance
Commission. 2013d)
In a report on municipal maintenance of infrastructure the Fiscal and Finance Commission (2013d)
states that municipalities do not budget enough and then underspend on maintenance by some
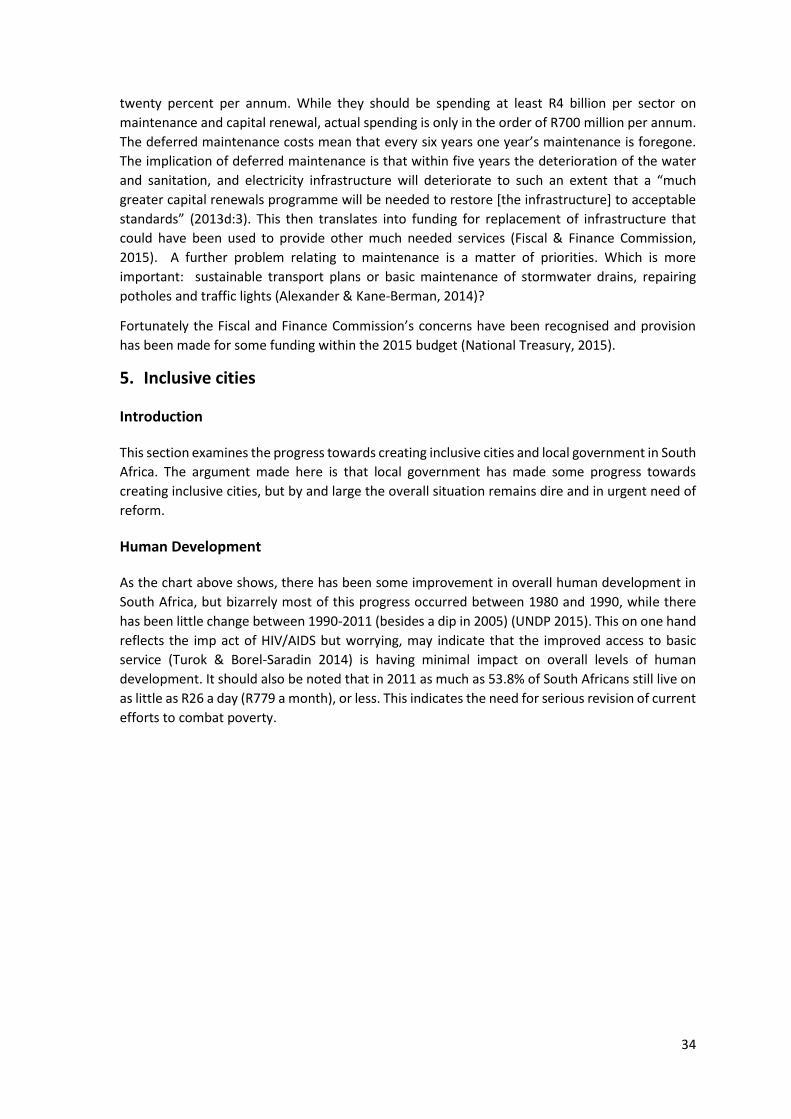
34
twenty percent per annum. While they should be spending at least R4 billion per sector on
maintenance and capital renewal, actual spending is only in the order of R700 million per annum.
The deferred maintenance costs mean that every six years one year’s maintenance is foregone.
The implication of deferred maintenance is that within five years the deterioration of the water
and sanitation, and electricity infrastructure will deteriorate to such an extent that a “much
greater capital renewals programme will be needed to restore [the infrastructure] to acceptable
standards” (2013d:3). This then translates into funding for replacement of infrastructure that
could have been used to provide other much needed services (Fiscal & Finance Commission,
2015). A further problem relating to maintenance is a matter of priorities. Which is more
important: sustainable transport plans or basic maintenance of stormwater drains, repairing
potholes and traffic lights (Alexander & Kane-Berman, 2014)?
Fortunately the Fiscal and Finance Commission’s concerns have been recognised and provision
has been made for some funding within the 2015 budget (National Treasury, 2015).
5. Inclusive cities
Introduction
This section examines the progress towards creating inclusive cities and local government in South
Africa. The argument made here is that local government has made some progress towards
creating inclusive cities, but by and large the overall situation remains dire and in urgent need of
reform.
Human Development
As the chart above shows, there has been some improvement in overall human development in
South Africa, but bizarrely most of this progress occurred between 1980 and 1990, while there
has been little change between 1990-2011 (besides a dip in 2005) (UNDP 2015). This on one hand
reflects the imp act of HIV/AIDS but worrying, may indicate that the improved access to basic
service (Turok & Borel-Saradin 2014) is having minimal impact on overall levels of human
development. It should also be noted that in 2011 as much as 53.8% of South Africans still live on
as little as R26 a day (R779 a month), or less. This indicates the need for serious revision of current
efforts to combat poverty.
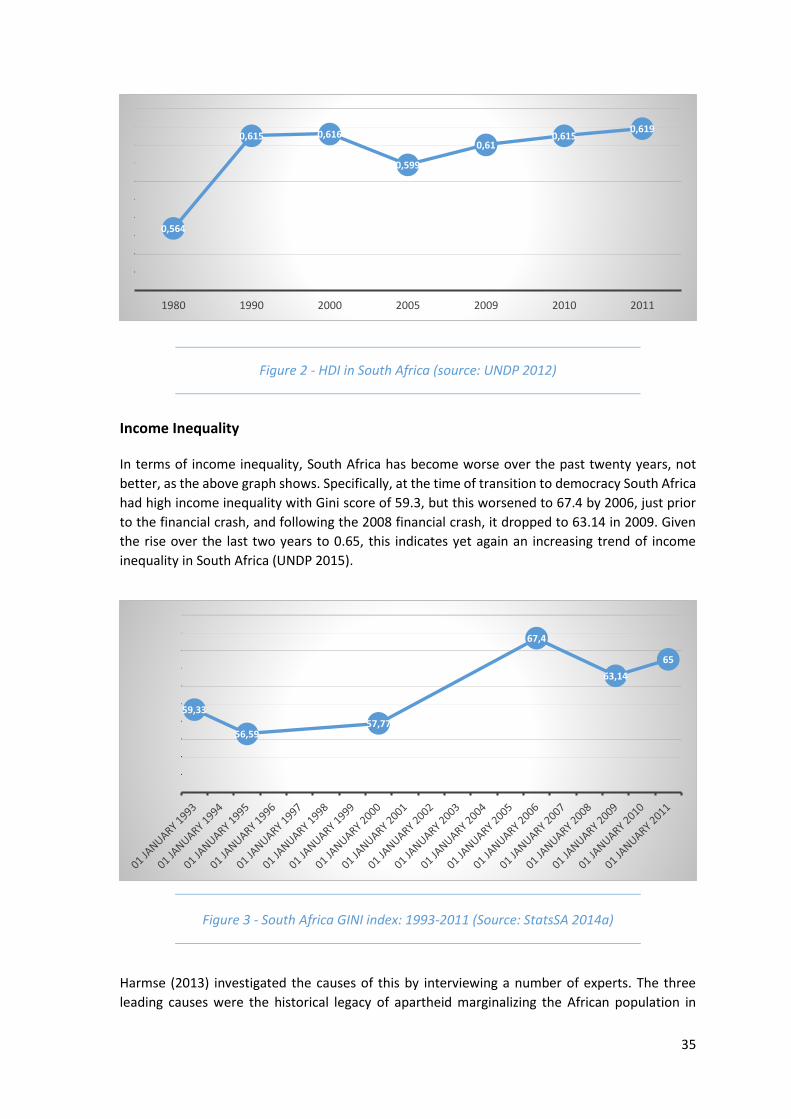
35
Figure 2 - HDI in South Africa (source: UNDP 2012)
Income Inequality
In terms of income inequality, South Africa has become worse over the past twenty years, not
better, as the above graph shows. Specifically, at the time of transition to democracy South Africa
had high income inequality with Gini score of 59.3, but this worsened to 67.4 by 2006, just prior
to the financial crash, and following the 2008 financial crash, it dropped to 63.14 in 2009. Given
the rise over the last two years to 0.65, this indicates yet again an increasing trend of income
inequality in South Africa (UNDP 2015).
Figure 3 - South Africa GINI index: 1993-2011 (Source: StatsSA 2014a)
Harmse (2013) investigated the causes of this by interviewing a number of experts. The three
leading causes were the historical legacy of apartheid marginalizing the African population in
0,564
0,615 0,616
0,599
0,610,615
0,619
1980 1990 2000 2005 2009 2010 2011
59,33
56,5957,77
67,4
63,14
65
36
South Africa, the poor education system in South Africa, and the severity of the un- and under-
employment situation in South Africa. The recommendations for this argue that the notions in the
National Development Plan are accurate, but what is lacking is the effective implementation of
them, in part due to capacity and competence issues within government. There was also a call for
reform of legislative barriers that impede the smooth functioning of business, reform of the
educational sector and a focus on economic inclusion. This later aspect emphasised a need for
government not to focus on trickle-down economics, but to make it as easy as possible for
business to create jobs at the lower end of the spectrum.
Spatial Inclusion and inequality
There are two scales with which this can be
looked at, national and at settlement scale. At
national scale there is a distinct difference
between the former homelands areas and the
dense urban areas, as shown by the maps from
Weir-Smith & Ahmed (2013). They found that
between 1991 and 2007 the Moran Score for
unemployment clustering increased from 0.61
to 0.71. This indicates an increasing clustering
of unemployment in South Africa, as opposed
to a random dispersed pattern.
This finding is the corollary to Harrison and
Todes’s study (2015) which has found higher
growth in absolute number of jobs in primarily
Gauteng, which represented 43% of new jobs in
South Africa between 1996-2011. They also
found that the GVA increased albeit marginally
in the inner core urban settlements between
1996 and 2011, shifting from 79.4% of GVA in
1996 to 81.4% in 2011, while every scale other
settlement decreased in GVA during this period.
This indicates that employment is increasingly
clustering, primarily within the larger
metropolitan areas and secondary cities.
These economic trends mirror population movements. The Western Cape and Gauteng increasing
their proportion of total population, and every other province decreasing their proportionate
share (Harrison 2014). These trends are relatively positive, as it points to an aligning of population
location with economic location, two phenomena which were artificially separated by apartheid.
The future role of the homelands and rural areas remains a question.
Within settlements the story is bleaker. Steedley (2014) has reviewed the location of affordable
houses in the South African metros. She found that in the majority of metros, these houses were
located on the periphery public and had limited access to cultural amenities and centres of
employment. Thus while on a national scale there is a growing alignment between population and
jobs, within the settlements themselves the poor and working class are largely marginalized.
Figure 4 - 2007 Unemployment
trends by standard deviation – blue
depicts areas with abnormally higher
than average unemployment, cream
is average unemployment, and
brown lower than average
unemployment (source: Weir-Smith
& Ahmed 2013.)
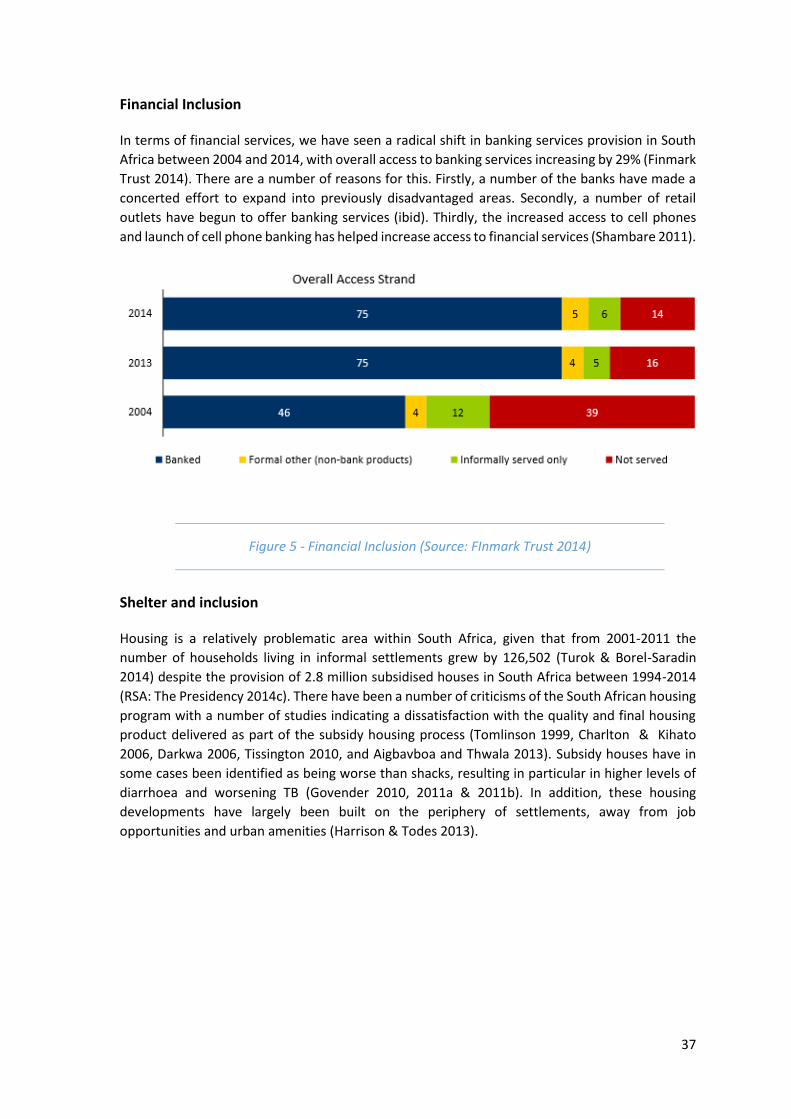
37
Financial Inclusion
In terms of financial services, we have seen a radical shift in banking services provision in South
Africa between 2004 and 2014, with overall access to banking services increasing by 29% (Finmark
Trust 2014). There are a number of reasons for this. Firstly, a number of the banks have made a
concerted effort to expand into previously disadvantaged areas. Secondly, a number of retail
outlets have begun to offer banking services (ibid). Thirdly, the increased access to cell phones
and launch of cell phone banking has helped increase access to financial services (Shambare 2011).
Shelter and inclusion
Housing is a relatively problematic area within South Africa, given that from 2001-2011 the
number of households living in informal settlements grew by 126,502 (Turok & Borel-Saradin
2014) despite the provision of 2.8 million subsidised houses in South Africa between 1994-2014
(RSA: The Presidency 2014c). There have been a number of criticisms of the South African housing
program with a number of studies indicating a dissatisfaction with the quality and final housing
product delivered as part of the subsidy housing process (Tomlinson 1999, Charlton & Kihato
2006, Darkwa 2006, Tissington 2010, and Aigbavboa and Thwala 2013). Subsidy houses have in
some cases been identified as being worse than shacks, resulting in particular in higher levels of
diarrhoea and worsening TB (Govender 2010, 2011a & 2011b). In addition, these housing
developments have largely been built on the periphery of settlements, away from job
opportunities and urban amenities (Harrison & Todes 2013).
Figure 5 - Financial Inclusion (Source: FInmark Trust 2014)
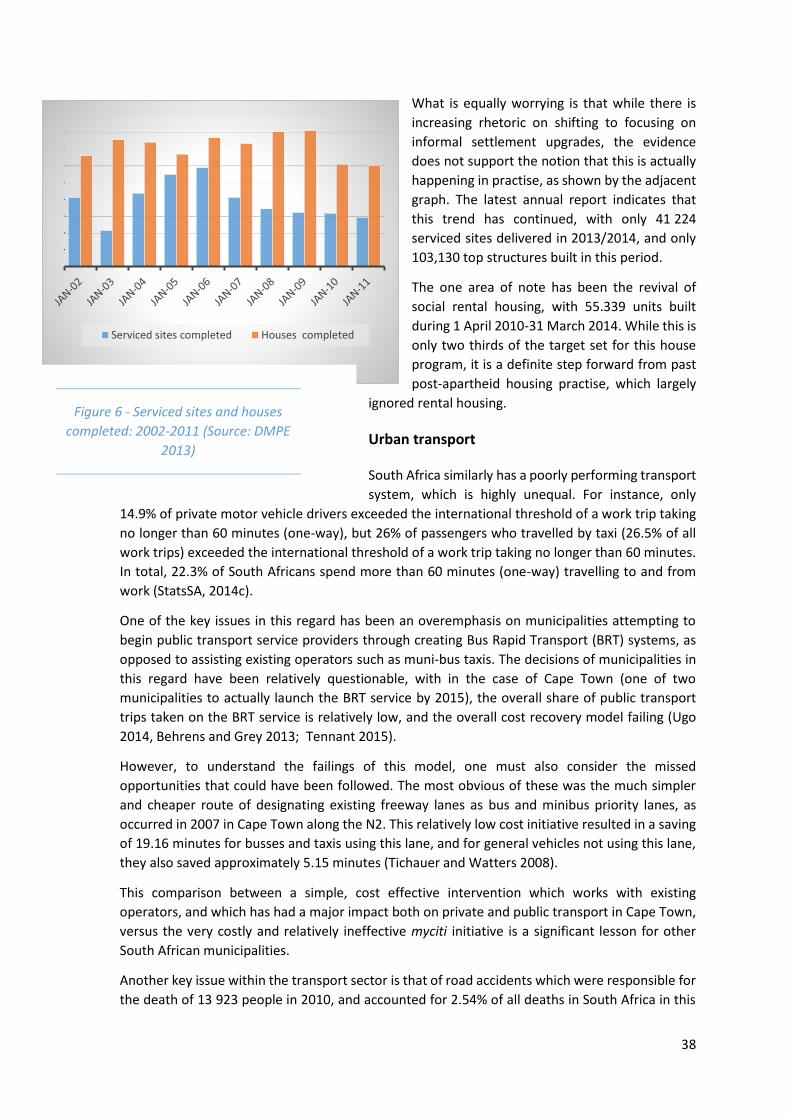
38
What is equally worrying is that while there is
increasing rhetoric on shifting to focusing on
informal settlement upgrades, the evidence
does not support the notion that this is actually
happening in practise, as shown by the adjacent
graph. The latest annual report indicates that
this trend has continued, with only 41 224
serviced sites delivered in 2013/2014, and only
103,130 top structures built in this period.
The one area of note has been the revival of
social rental housing, with 55.339 units built
during 1 April 2010-31 March 2014. While this is
only two thirds of the target set for this house
program, it is a definite step forward from past
post-apartheid housing practise, which largely
ignored rental housing.
Urban transport
South Africa similarly has a poorly performing transport
system, which is highly unequal. For instance, only
14.9% of private motor vehicle drivers exceeded the international threshold of a work trip taking
no longer than 60 minutes (one-way), but 26% of passengers who travelled by taxi (26.5% of all
work trips) exceeded the international threshold of a work trip taking no longer than 60 minutes.
In total, 22.3% of South Africans spend more than 60 minutes (one-way) travelling to and from
work (StatsSA, 2014c).
One of the key issues in this regard has been an overemphasis on municipalities attempting to
begin public transport service providers through creating Bus Rapid Transport (BRT) systems, as
opposed to assisting existing operators such as muni-bus taxis. The decisions of municipalities in
this regard have been relatively questionable, with in the case of Cape Town (one of two
municipalities to actually launch the BRT service by 2015), the overall share of public transport
trips taken on the BRT service is relatively low, and the overall cost recovery model failing (Ugo
2014, Behrens and Grey 2013; Tennant 2015).
However, to understand the failings of this model, one must also consider the missed
opportunities that could have been followed. The most obvious of these was the much simpler
and cheaper route of designating existing freeway lanes as bus and minibus priority lanes, as
occurred in 2007 in Cape Town along the N2. This relatively low cost initiative resulted in a saving
of 19.16 minutes for busses and taxis using this lane, and for general vehicles not using this lane,
they also saved approximately 5.15 minutes (Tichauer and Watters 2008).
This comparison between a simple, cost effective intervention which works with existing
operators, and which has had a major impact both on private and public transport in Cape Town,
versus the very costly and relatively ineffective myciti initiative is a significant lesson for other
South African municipalities.
Another key issue within the transport sector is that of road accidents which were responsible for
the death of 13 923 people in 2010, and accounted for 2.54% of all deaths in South Africa in this
Serviced sites completed Houses completed
Figure 6 - Serviced sites and houses
completed: 2002-2011 (Source: DMPE
2013)
39
period (Denoon-Stevens 2014). This is a serious area of concern which at present is not been given
the attention it deserves, in particular with regard to the design of road layouts (Jobanputra 2013)
Inclusive Cities and Urban Safety
High crime rates and the perception of South Africa as a dangerous place have affected social life
and the structure of cities (CoGTA, 2014). According to Petrella (2007), after Brazil, South Africa is
the country where people most fear walking home at night. In particular, the metropolitan central
business areas were in 2007 some of the most dangerous areas in South Africa with regard to
violent crime (Lancaster, 2007). However, it is generally impoverished areas that have the highest
violent crime rates, while wealthy residential areas have a high incidence of robberies, burglaries
and carjacking (Brodie: online.)
In response to crime the large metros have adopted crime prevention and management
programmes (Gotsch et al., 2013, Van Huyssteen & Oranje, 2003) with variable degrees of success.
While some of the secondary cities such as George mention safety in their IDPs, the commitment
in terms of strategy and budget is low (Gotch et al, 2013). Work undertaken by the CSIR on
participatory approaches to crime prevention demonstrates that such methods hold potential
(Liebermann & Coulson, 2004; Landman & Lieberman, 2005).
While the state’s approach to dealing with crime is more effective and visible policing, crime
prevention and community involvement (Gotch et al, 2013), many citizens have opted for gated
communities. These range from ‘urban villages’ or security complexes constructed as an entity to
‘enclosed neighbourhoods’ what entail the closure of public streets and places (Landman &
Schönteich, 2002). When large areas are ‘gated’ including the contiguous enclosure of smaller
areas, there are disruptions to the urban system; traffic patterns are changed with longer trip
times, pedestrians and cyclists are disadvantaged, emergency services are unable to reach people
in need quickly and certain services such garbage removal are compromised (Landman, 2004). In
addition, they contribute to social exclusion and a new form of separate development (Durington,
2006). Effective policy to manage not only the cause (crime) but also the response (Landman,
2004).
Another response to ‘crime and grime’ are city or business improvement districts in an effort to
retain the value and attractiveness of the area to shoppers, residents and investors. Such districts
are geographically defined areas where the property owners8 have agreed to contribute a special
levy. This levy is used for ‘top-up’ services, i.e. over and above provided by the local authority and
generally includes additional security, information through security guards, street cleaning and
waste/litter removal and removal of illegal signs and posters and physical improvements such as
street lighting. Some City Improvement Districts provided additional services such as the support
of homeless communities. The management of the city improvement districts is undertaken by
not-for-profit companies especially established for this purpose and are intended to work in
partnership with the municipality. In 2008 there were thirteen city improvement districts in
Johannesburg, Cape Town, Tshwane and Durban (Heimann & Oranje, 2008).
The introduction of city improvements districts has been criticised as a neo-liberal plan to regain
control over inner cities and compensate for the lack of municipal services, (Didier et al. 2012,
Didier et al., 2013) and a means of ‘’ the city business district from unsavoury persons (Miraftab,
8 According to the Gauteng City Improvement District Act, 12 of 1997, 51% of property owners, representing 51% of the property value must consent to the CID.
40
2007). The private policing of public spaces is another concern, particularly where there are
multiple agencies responsible for security (Berg, 2004). Paasche (2012) confirms the creation of
spaces such as city improvement districts are created by differing values. Here public spaces are
controlled by private ‘governments’ (i.e. the management companies) that exert authority by
excluding some (e.g. street children and sex workers) and control others such as parking
attendants. Thus, while some argue that [“w]ithout these policing schemes, large parts of the
middle and upper classes would not make use of public space at all. In these terms, the old
[apartheid] segregation order is not only evident in the gated community and the shiny mall, but
also in public spaces with a private government; meanwhile, the vagrant population and
undesirables cumulate on the borders” (Paasche, 2012: 55).
The healthy city
Over the past three decades there has been a growing amount of literature on healthy cities.
Besides the links between clean water and effective sanitation, there is a recognition of the role
of local government in the health of residents (Werna et al, 1998; Kenzer, 1999; Dannenberg et
al. 2011; Coburn, 2013). This includes problems associated with urban sprawl and reliance on
motorised transport, and private cars in particular as well as the effects of inequality on urban
health (Smit & Watson, 2011; Coburn, 2013, RTPI, 2014). However, there is very little South African
literature that reviews programmes for healthy cities, let alone local government programmes for
improved urban health.
6. Sustainable Cities
Introduction
The aim of this section is to overview the key factors currently affecting the sustainability of local
government, specifically looking at physical and environmental attributes.
Renewable energy
This is one area in which South Africa is making steady progress with a number of notable
achievements in implementing renewable energy generation options. The intention is to have 45%
of energy coming from renewable energy sources by 2030 (Papapetrou 2014). Already, (2015) as
much as 4,233 MW (which is roughly equivalent to 2.35 times the output of Koeberg) has been
procured in South Africa through various renewable energy technologies (Joemat-Pettersson
2015).
Currently, South Africa has the capacity to produce 784 MW of Solar Power, ranking it 10th in the
world for solar power generation (Solar Wiki 2015), and 570 MW of wind power (the wind power
2015), placing South Africa 34th in the world for overall wind power generation (Wikipedia 2015).
Climate Change
While the exact impacts of climate change are still to be seen, it is estimated that South Africa will
face the following trends:
Warming of the interior regions by as much as 5°-8° C.
Wetter conditions in the east of South Africa.
41
An increase in extreme rainfall events and extreme droughts.
With regard to specific adaptation strategies, there is evidence of a number of municipalities
adopting climate change adaptation policies. However that there is less evidence that these plans
are being implemented (Ziervogel et al 2014). For coastal municipalities this is in particular an
issue of concern, given the current impact of sea level rise and increased severity of flooding
events.
Environmental Health
In terms of environmental health, South Africa faces a quandary: despite increasing provision of
basic services, in particular water and sanitation, there has been no reduction in diarrhoea related
deaths, which is one of the main proxies for poor sanitation (Pegram et al 1998). For instance, in
2013 as many as 15 670 deaths were attributed to diarrhoea, which comprised 3.4% of total
deaths in South Africa. In 1997, there were only 6,236 deaths due to diarrhoea, which amounts to
2.5% of all deaths in 1997 (derived from StatsSA 2005 & 2014a). Based on this, it appears that
environmental health issues have grown worse since 1997, despite a supposed improvement in
basic service provision.
The reasons for this are not altogether clear; however, some possible causes are indicated in the
literature. Firstly, the use of river water for drinking, cleaning or recreational purposes. In
particular the issue here is that many wastewater treatment plants are inadequately treating
sewer water, and the outflow from these plants still contains pathogens that can lead to diarrhoea
(Momba et al. 2006 & Okoh and OIgbinosa 2010). Any individual using this water is thus
susceptible to disease. Secondly, the growth in informal settlements (Turok & Borel-Saradin 2014)
in South Africa may indicate an increased exposure to unsanitary conditions, despite the presence
of taps and toilets. Thirdly, Govender et al (2010, 2011) have clearly shown that the sanitation
practices of state subsidy housing recipients, and the structural failures and poor design of
sanitation infrastructure of the RDP housing settlements sampled were likely a major contributor
to the prevalence of diarrhoea in these settlements.
Air pollution
The state of air quality in South Africa is still a major area of concern, but in some respects there
has been some relatively major progress. For instance, as the adjacent graph shows, SO2, levels
have been decreasing since 1996 and are currently, on average, well below the international
threshold for good air quality.
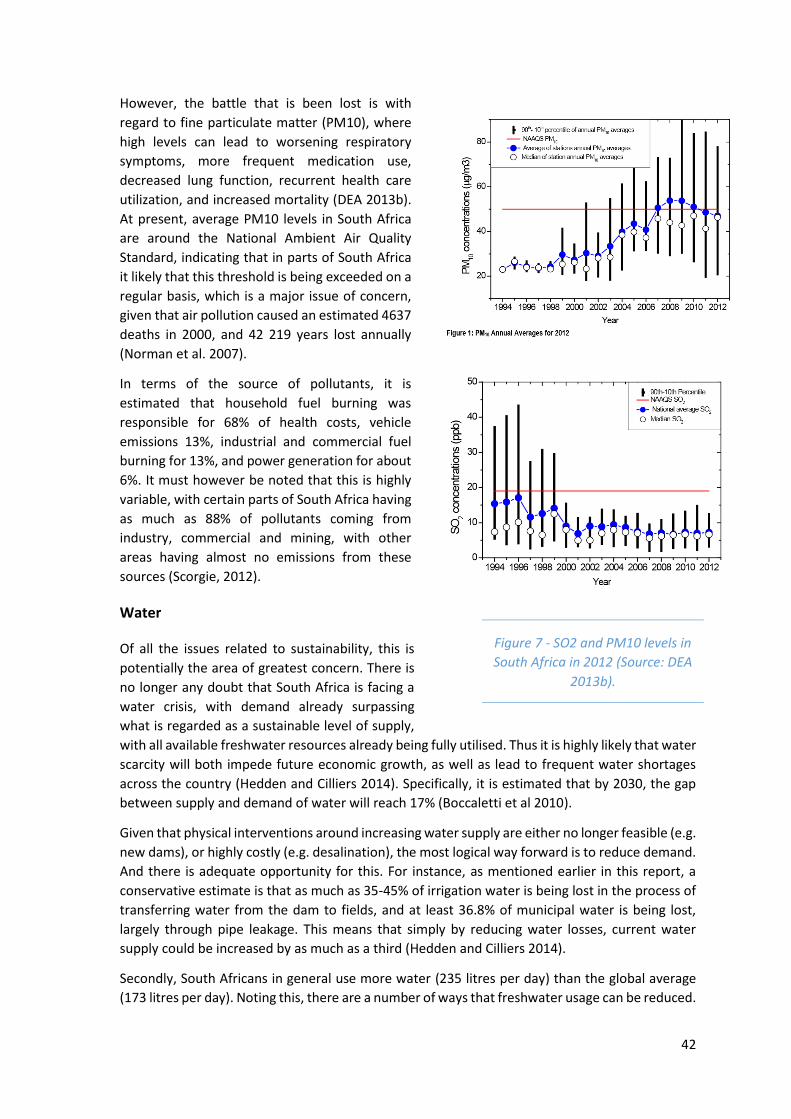
42
However, the battle that is been lost is with
regard to fine particulate matter (PM10), where
high levels can lead to worsening respiratory
symptoms, more frequent medication use,
decreased lung function, recurrent health care
utilization, and increased mortality (DEA 2013b).
At present, average PM10 levels in South Africa
are around the National Ambient Air Quality
Standard, indicating that in parts of South Africa
it likely that this threshold is being exceeded on a
regular basis, which is a major issue of concern,
given that air pollution caused an estimated 4637
deaths in 2000, and 42 219 years lost annually
(Norman et al. 2007).
In terms of the source of pollutants, it is
estimated that household fuel burning was
responsible for 68% of health costs, vehicle
emissions 13%, industrial and commercial fuel
burning for 13%, and power generation for about
6%. It must however be noted that this is highly
variable, with certain parts of South Africa having
as much as 88% of pollutants coming from
industry, commercial and mining, with other
areas having almost no emissions from these
sources (Scorgie, 2012).
Water
Of all the issues related to sustainability, this is
potentially the area of greatest concern. There is
no longer any doubt that South Africa is facing a
water crisis, with demand already surpassing
what is regarded as a sustainable level of supply,
with all available freshwater resources already being fully utilised. Thus it is highly likely that water
scarcity will both impede future economic growth, as well as lead to frequent water shortages
across the country (Hedden and Cilliers 2014). Specifically, it is estimated that by 2030, the gap
between supply and demand of water will reach 17% (Boccaletti et al 2010).
Given that physical interventions around increasing water supply are either no longer feasible (e.g.
new dams), or highly costly (e.g. desalination), the most logical way forward is to reduce demand.
And there is adequate opportunity for this. For instance, as mentioned earlier in this report, a
conservative estimate is that as much as 35-45% of irrigation water is being lost in the process of
transferring water from the dam to fields, and at least 36.8% of municipal water is being lost,
largely through pipe leakage. This means that simply by reducing water losses, current water
supply could be increased by as much as a third (Hedden and Cilliers 2014).
Secondly, South Africans in general use more water (235 litres per day) than the global average
(173 litres per day). Noting this, there are a number of ways that freshwater usage can be reduced.
Figure 7 - SO2 and PM10 levels in
South Africa in 2012 (Source: DEA
2013b).
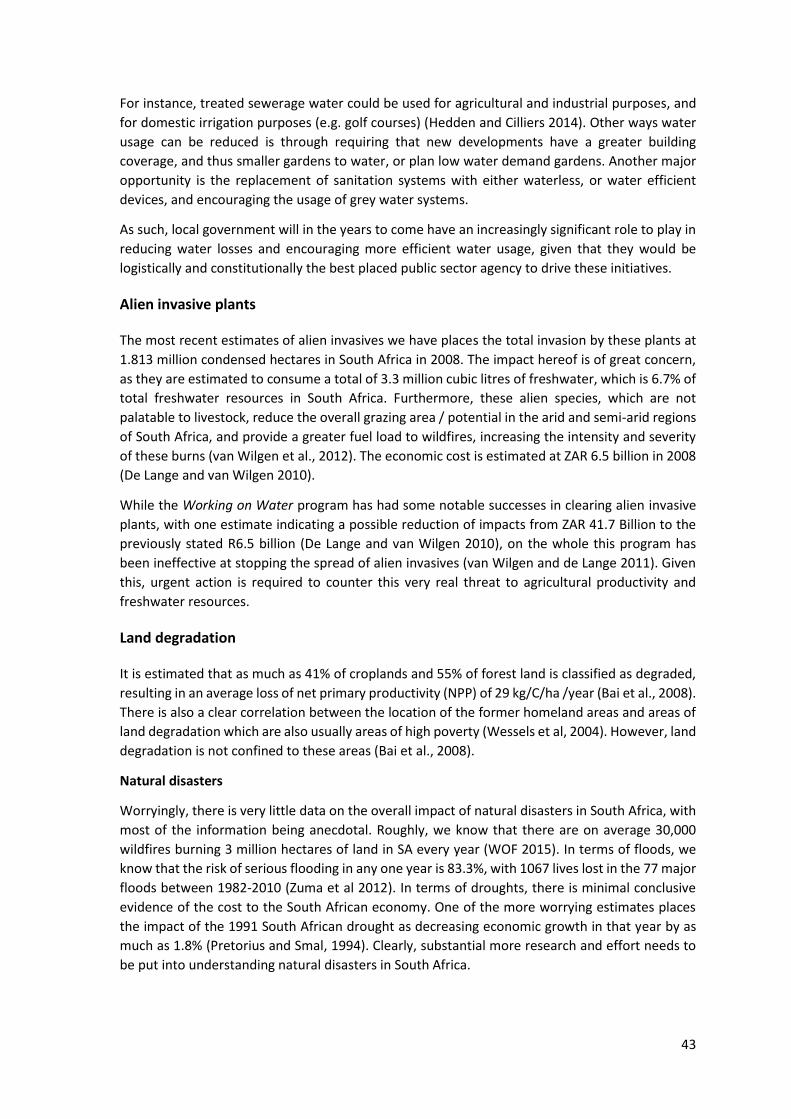
43
For instance, treated sewerage water could be used for agricultural and industrial purposes, and
for domestic irrigation purposes (e.g. golf courses) (Hedden and Cilliers 2014). Other ways water
usage can be reduced is through requiring that new developments have a greater building
coverage, and thus smaller gardens to water, or plan low water demand gardens. Another major
opportunity is the replacement of sanitation systems with either waterless, or water efficient
devices, and encouraging the usage of grey water systems.
As such, local government will in the years to come have an increasingly significant role to play in
reducing water losses and encouraging more efficient water usage, given that they would be
logistically and constitutionally the best placed public sector agency to drive these initiatives.
Alien invasive plants
The most recent estimates of alien invasives we have places the total invasion by these plants at
1.813 million condensed hectares in South Africa in 2008. The impact hereof is of great concern,
as they are estimated to consume a total of 3.3 million cubic litres of freshwater, which is 6.7% of
total freshwater resources in South Africa. Furthermore, these alien species, which are not
palatable to livestock, reduce the overall grazing area / potential in the arid and semi-arid regions
of South Africa, and provide a greater fuel load to wildfires, increasing the intensity and severity
of these burns (van Wilgen et al., 2012). The economic cost is estimated at ZAR 6.5 billion in 2008
(De Lange and van Wilgen 2010).
While the Working on Water program has had some notable successes in clearing alien invasive
plants, with one estimate indicating a possible reduction of impacts from ZAR 41.7 Billion to the
previously stated R6.5 billion (De Lange and van Wilgen 2010), on the whole this program has
been ineffective at stopping the spread of alien invasives (van Wilgen and de Lange 2011). Given
this, urgent action is required to counter this very real threat to agricultural productivity and
freshwater resources.
Land degradation
It is estimated that as much as 41% of croplands and 55% of forest land is classified as degraded,
resulting in an average loss of net primary productivity (NPP) of 29 kg/C/ha /year (Bai et al., 2008).
There is also a clear correlation between the location of the former homeland areas and areas of
land degradation which are also usually areas of high poverty (Wessels et al, 2004). However, land
degradation is not confined to these areas (Bai et al., 2008).
Natural disasters
Worryingly, there is very little data on the overall impact of natural disasters in South Africa, with
most of the information being anecdotal. Roughly, we know that there are on average 30,000
wildfires burning 3 million hectares of land in SA every year (WOF 2015). In terms of floods, we
know that the risk of serious flooding in any one year is 83.3%, with 1067 lives lost in the 77 major
floods between 1982-2010 (Zuma et al 2012). In terms of droughts, there is minimal conclusive
evidence of the cost to the South African economy. One of the more worrying estimates places
the impact of the 1991 South African drought as decreasing economic growth in that year by as
much as 1.8% (Pretorius and Smal, 1994). Clearly, substantial more research and effort needs to
be put into understanding natural disasters in South Africa.
44
Currently, there are moves afoot to amend the National Disaster Management Act, with these
amendments increasing the impetus for local municipalities to build capacity, draft disaster
management plans and be involved in disaster management. It should also be noted that currently
the National Veldfire Amendment Bill is currently being processed by the Minister of Agriculture,
Forestry and Fisheries. If the bill is passed in its current form, it will compel municipalities and
public entities to join Fire Protection Agencies where their land is at risk of wildfires, and also
compel Municipalities and Traditional Leaders to establish Fire Protection Associations if deemed
necessary by the minister. It will also enable municipal peace officers and traditional leaders to
enforce the act.
Given this, it will become increasingly important for municipalities to take account of natural
disasters in the years to come.
Not all disasters are large scale: many are small, ‘everyday disasters’ that disproportionately affect
the poor. These small events such as traffic accidents or flooding with loss of assets or illness
where rainwater mixes with sewerage and pollutes wells (Pelling & Wisner, 2009; Hamdi, 2004).
These small events may not be noted or enumerated, but their cumulative effect on households
and livelihoods can be overwhelming (Pelling, 2003).
Fish stocks
In terms of commercial line fishing, 68% of species caught are considered to have ‘collapsed,’ and
11% are considered fully overexploited. Offshore resources are faring better, with only 14.8%
species counted as being overexploited, and no species have collapsed, but noting that 29.6% of
fish species status remains uncertain. Given that 127,000 people in 2008 were directly or
indirectly working in the fisheries sector, and the fact that fisheries make up 0.5% of South Africa’s
GDP, this is a critical sector to monitor and assist so as to prevent the overexploitation and
degradation of this valuable resource.
45
What does this mean for local government?
“It's easier to break something than create it.”― Marie Rutkoski: The Cabinet of Wonders
Introduction
The importance of South Africa’s large cities to the wellbeing of the nation cannot be under-
estimated. The metros alone are home to over 40% of the population but their contribution to the
economy is significantly higher. Most growth in employment has also occurred in the larger cities
and on aggregate, incomes are higher (Turok & Borel-Saladin, 2013). Local government is also
viewed as being closest to the people and is thus regarded as the most appropriate sphere of
government for implementation of the development agenda as reflected in the Constitution.
Given the extent of the local government transformation and the constraints under which it has
to function, the results that many municipalities have accomplished are impressive. Building a new
system, with new responsibilities, new geographic areas, new legislation, policies and systems
cannot happen overnight. Rebuilding a defective system, located in dysfunctional spaces, is far
more difficult than creating a new one de novo. It has demanded local government to move from
one trajectory or attractor to another; a move that requires considerable energy to achieve. There
is therefore reason to celebrate the successes of local government – particularly of the large cities
that play such a pivotal role in the country.
As critical as local government is for the development of South Africa as an inclusive, equitable,
sustainable and productive nation, so are the challenges it is facing. These problems do not belong
to local government alone but are the responsibility of the entire nation. Solving them will require
a long-term commitment to appropriate strategies, built with a long range vision of the future that
moves away from a myopic fixation on ‘quick and visible, low hanging fruit’.
The discussion that follows will firstly draw together the key issues drawn from the preceding
literature review and then links these to the SACN outputs.
7. The key issues
Although this review has identified a number of problems facing local government, this section
will be devoted to the five key issues that will influence the future and thus drive the SACN
knowledge generation and dissemination initiatives. These are, the failure of basic service delivery
to influence socio-economic development in South Africa, the current electricity and impending
water crisis, recognising, mitigating and preparing for natural disasters, urban economic
development, and governance.
The failure of basic service delivery to influence socio-economic development in South
Africa
There is a conundrum in South Africa that at present that despite increased access to basic
services, and increased access to goods, the main development indicators (HDI and Gini
coefficient) and the proxies for improved sanitation (percentage of deaths attributable to
diarrhoea) have either remained unchanged, or have deteriorated in the last decade. The cause
behind this disjuncture is not yet clear, but needs to be investigated. If we are not seeing any
46
measurable improvement in people’s lives after providing basic services, then there is clearly
something fundamentally wrong in how we are providing basic services in South Africa.
The current electricity and impending water crisis
Without water and power, it is highly unlikely that South Africa will be able to attain the economic
growth it needs to attain in order to foster socio-economic development and a sustainable
economy. Yet, at present it is unlikely that Eskom will resolve the power crisis soon, and it is
equally unlikely that there will be access to any new freshwater resources in short to medium
term.
Given this, the challenge to local government is to find new ways to procure electricity, potentially
through the use of small-scale embedded electricity generation, and to encourage energy
efficiency in both public investment and through the regulation of private industry. In terms of
fresh water, the challenge to local government is to reduce municipal and irrigation water
leakages, to encourage waterless and water efficient sanitation, and to encourage water wise
behaviour by consumers.
Recognising, mitigating and preparing for natural disasters
The toll of natural disasters in South Africa is at present very unclear, but what is clear is that the
annual toll of these phenomena (floods, fire and drought in particular) runs well into the billions
of Rands. Local government has a pivotal role to play with regard to preventing and mitigating
natural disasters. It can do this by ensuring its land holdings and investments do not pose a threat,
prudently considering the threat of natural disasters, as well as through regulation, ensuring that
households and the private sector adequately mitigate against natural disasters, for instance,
preventing building within flood zones or requiring an adequate fire break for fire prone
properties.
Urban economic development
One of the mandates of local government is the promotion of social and economic growth.
Notwithstanding the slow growth of the national economy, the largest metros and some
intermediate cities have growing economies that, to a large extent, support the remainder of the
country. The rate of employment growth has been in step with population growth in the metros
and throughout the country, but is not sufficient to absorb the job seekers (Turok & Borel-Saladin,
2013; Harrison, 2014). Consequently there has been little change in the unemployment rate which
influences the levels of poverty.
In declining local economies, the economic prospects are much worse; the unemployment rates
and the poverty levels are higher. As property rates are determined by the local economic base, a
depressed economy means reduced income from property taxes and an indigent population
cannot pay service charges. These municipalities require innovative and effective strategies to
attract investment, generate wealth and create employment. However, they are generally the
municipalities least able to do so due to human and financial resource constraints.
The metros, despite their positive economic growth rates, also need to grow their economies in
order to expand their rates base and fiscal base to meet the demands posed by the growing
population for services and shelter. With poverty rates between 27 percent and 46 percent
(Alexander & Kane-Berman, 2014), cross subsidisation from more affluent residents and
47
businesses will be essential to fund these demands. In promoting economic development an
inclusive approach that woos big business, courts and supports small enterprises in both the
formal economy and the home-based business and craft enterprises and survivalist street traders
in the informal economy is required.
Many of South Africa’s secondary cities have failed to profit from the agglomeration economies
and potential of their local economy (Turok & Borel-Saladin, 2013). They clearly have much to
benefit from economic development, and there are numerous case studies of successful
development or regeneration of a local economy (Donaldson & Marias, 2012). Smaller centres and
rural areas that have limited economic growth potential may have less options and may need to
focus on social development, creating the skills that residents require to succeed in a more urban
environment (Wessels, 2012; RSA, 2003).
The Constitutional mandate does not differentiate between metros and rural areas in its
obligation to that local government promote social and economic development. The Municipal
Systems Act (RSA 2000) requires municipalities to include their local economic development aims
and initiatives in the integrated development plan. The phrasing of this requirement is vague
enough to avoid the necessity of undertaking locally specific research, preparing and
implementing effective and appropriate local economic development strategies for the
municipality in question. The limited emphasis on local economic development and the lack of
personnel with the necessary skills to undertake this work are among the reasons for the limited
success of LED in local government (Rogerson, 2011). However, the promotion of economic
development is not an optional extra according to the Constitution.
The failure of local economic development and the need to grow the economy and create jobs
that can absorb the unemployed demands a more concerted effort by the state to build capacity
within local government with respect to promoting economic development (Rogerson, 2011).
There is a clear role for the SACN in this arena.
(Not so good) governance
The litany of problems besetting local government in the literature review paints a dismal picture.
Even the 20 Year Review of Local Government (RSA 2104a) uncharacteristically opens with a policy
summary of the areas that need attention rather than emphasising the successes over the past
twenty years. Table 1 demonstrates that the same systemic problems that local government was
designed to solve still hamper effective local government at present. After fourteen years, many
of the same solutions to the same problems are being presented: improve revenue collection, co-
operative governance, management and operational capacity, and deal with political interference
and corruption (RSA 2014a, Auditor General, 2015). But if these plans have not worked (yet), will
pursuing the same strategy yield different results?
One option that is being considered is the revision of municipal categories and functions (Ovens,
2013, Kruger, 2012). Others that may not be politically acceptable but may stimulate a
conversation are mentioned below.
Reducing the physical area of some local municipalities may result in more functional municipal
boundaries and more effective service delivery. Reducing the size of the municipality may increase
the number of wards and enable more direct contact between councillors and the electorate.
Furthermore, it may enable councillors to focus on the needs of specific constituencies rather than
trying to manage the conflicting demands of different groups (De Visser 2009).
48
To increase accountability to citizens, the percentage of proportional representation councillors
could be reduced (subject to provision being made for minority parties and traditional leaders)
with the majority being ward councillors. This may swing the accountability to the community
rather than the party (Alexander and Kane-Berman, 2014).
Perhaps local government has fostered dependency and not development. “Since 1994 there has
been a growing culture of dependency on the state. Communities in townships and informal
settlements have increasingly sat back, expecting the state to provide everything for them”
Chikulo, 2013: 52). “South Africa has become an entitlement state. People have come to expect
that the State will provide them with houses, water, electricity, free education, and the like. When
people see their neighbours obtaining these things, their own dissatisfaction mounts as they
become impatient for their own turn to come” (Alexander & Kane-Berman, 2014: 25). Local
government need to deal with the culture of entitlement and dependency that limits agency and
responsibility to become government that works with communities to find sustainable ways of
improving their lives.
49
References
Akinboade, O A., Kinfack, E. C. & Mokwena, M. P. 2012. An analysis of citizen satisfaction with
public service delivery in the Sedibeng district municipality of South Africa. International Journal
of Social Economics, 39(3): 182 - 199
Alexander, G. & Kane-Berman J. 2014. The 80/20 Report: Local government in 80 indicators over
20 years. Report for the SA Institute of Race Relations http://irr.org.za/reports-and-
publications/occasional-reports/files/the-80-20-report-on-local-government-26-may-2014-1.pdf
accessed 17 June 2015.
Auditor General of South Africa. 2015. Consolidated general report on the audit outcomes of local
government, 2013-14.
Bai, Z. G., Dent D. L., Olsson, L. and Schaepman, M. E. 2008. Global assessment of land
degradation and improvement. 1. Identification by remote sensing. Report 2008/01, ISRIC –
World Soil Information, Wageningen.
http://www.isric.org/isric/webdocs/docs/Report%202008_01_GLADA%20international_REV_No
v%202008.pdf Accessed 25 June 2015.
Bax, P., Gbandia, S. & Zoker, E. 2014. Ebola’s shock waves. Business Week, 25 August 2014. Issue
4391, p18-20.
Berg, J. 2004. Private Policing in South Africa: The Cape Town city improvement district -
pluralisation in practice. Society in Transition, 35(2): 224-250.
Bikam, P. & Chakwizira, J. 2014. Involvement of Traditional Leadership in land use planning and
development projects in South Africa: lessons for local government planners. International Journal
of Humanities and Social Science, 4(13): 142-152.
Brodie, N. Online: Understanding crime statistics in South Africa – what you need to know
http://africacheck.org/factsheets/a-guide-to-crime-statistics-in-south-africa-what-you-need-to-
know/, accessed 17 June 2015
Charlton, S., & Kihato, C. 2006. Reaching the poor? An analysis of the influences on the evolution
of South Africa’s housing programme. Democracy and delivery: Urban policy in South Africa, 252-
282.
Chikulo, B. C. 2013. Developmental local governance and service delivery in South Africa:
Progress, achievements and challenges. Journal of Social Development in Africa, 28(1): 35-64
Chitga-Mabugu, M. & Monkam, N. 2013. Assessing Fiscal capacity and the local government level
in South Africa. Department of Economics, University of Pretoria working paper no. 2013-76.
Coburn, J. 2013. Healthy city planning. Routledge, London.
Community Law Centre. 2007. PAPER I: Developmental local government: determining
appropriate functions and powers. Community Law Centre, University of the Western Cape.
Danneneberg, A. L., Frumpkin, H & Jackson, R. J. 2011. Making healthy places. Island Press.
Washington DC.
Darkwa, I. (2006). Post-occupancy evaluation of state-subsidised housing units in Kayamandi,
Stellenbosch (Doctoral dissertation, Stellenbosch: University of Stellenbosch).
50
Davies, R. & Thurlow, J. 2010. Formal–informal economy linkages and unemployment in South
Africa. South African Journal of Economics, 78(4): 438-459
De Lange, W. J. & van Wilgen, B. W. 2010. An economic assessment of the contribution of
biological control to the management of invasive alien plants and to the protection of ecosystem
services in South Africa.
http://researchspace.csir.co.za/dspace/bitstream/10204/4543/1/De%20Lange_2010.pdf
De Visser, J. 2009. Developmental Local Government in South Africa: Institutional Fault Lines.
Commonwealth Journal of Local Governance. Issue 2, pp 7-25.
http://epress.lib.uts.edu.au/ojs/index.php/cjlg
Denoon-Stevens, S. P. 2014. Using Land-Use Management to create transit-friendly Cities. South
Africa Cities Network, Johannesburg. Pp. 98-119.
Department of Agriculture, Forestry and Fisheries (DAFF). 2015. Status of the South African marine
fishery resources. Government Printer, Pretoria.
Department of Cooperative Development and Traditional Affairs (COGTA). 2009. The State of
Local Government in South Africa. Government Printer, Pretoria.
Department of Cooperative Development and Traditional Affairs (COGTA). 2014. Draft Integrated
Urban Development Framework. Government Printer, Pretoria.
Department of Environmental Affairs (DEA). 2011. Environmental Sustainability Indicators,
Technical Report 2011. Department of Environmental Affairs, Pretoria.
Department of Environmental Affairs (DEA). 2013a. Long-Term Adaptation Scenarios Flagship
Research Programme (LTAS) for South Africa. Climate Trends and Scenarios for South Africa.
Pretoria, South Africa.
Department of Environmental Affairs. (DEA). 2013b. State of Air in South Africa Report. Available
from: http://www.saaqis.org.za/Downloads.aspx?type=AQ Accessed 27 June 2015
Department of Provincial and Local Government (DPLG). 2004. Project Consolidate.
https://pmg.org.za/docs/2006/060906consolidate.pdf Accessed 20 June 2015.
Department of Provincial and Local Government (DPLG). 2008. 15 year review report on the state
of intergovernmental relations in South Africa.
Department of Water Affairs (DWA). 2012 Blue drop report.
https://www.dwa.gov.za/dir_ws/DWQR/subscr/ViewComDoc.asp?Docid=375, accessed 17 June
2015
Department of Water Affairs (DWA). 2014a. Executive summary for the 2013 Blue drop report.
https://www.dwa.gov.za/Documents/Executive%20Summary%20for%20the%202013%20Blue%
20Drop%20Progress%20Report.pdf , accessed 17 June 2015
Department of Water Affairs (DWA), 2014b. Executive summary for the 2013 Green drop report.
https://www.dwa.gov.za/Dir_WS/GDS/Docs/DocsDefault.aspx accessed 17 June 2015
Department of Water Affairs (DWA). 2015. Green Drop Assessment: Top 10 Performance
Analysis. https://www.dwa.gov.za/Dir_WS/GDS/DefaultTopPerformers.aspx?ProvCode=SA
51
Didier, D., Peyroux, E & Morange, M. 2012. The Spreading of the City Improvement District Model
in Johannesburg and Cape Town: Urban Regeneration and the Neoliberal Agenda in South Africa.
International Journal of Urban and Regional Research, 36(5):915–935
Didier, S, Morange, M. & Peyroux, E. 2013. The adaptive nature of neoliberalism at the local scale:
fifteen years of city improvement districts in Cape Town and Johannesburg. Antipode, 45(1):121-
139
Donaldson, R. & Marais, L. (eds). 2012. Small Town geographies in Africa. Nova Science Publishers.
New York.
Du Plessis D.J. & Boonzaaier. I. 2015. The Evolving Spatial Structure of South African Cities: A
Reflection on the Influence of Spatial Planning Policies. International Planning Studies, 20(1-2): 87-
111. DOI: 10.1080/13563475.2014.942505
Durington, M. 2006. Race, space and place in suburban Durban: an ethnographic assessment of
gated community environments and residents. GeoJournal, 66( 1/2,): 147-160
Finmark Trust. 2014. What changed in people’s lives according to FinScope since 2004? A ten year
perspective on financial inclusion in South Africa http://www.finmark.org.za/wp-
content/uploads/pubs/MedRel_FS_SA_20141.pdf, accessed 25 June 2015.
Fiscal and Financial Commission 2011. The impact of unfunded mandates in South African
Intergovernmental relations. www.ffc.co.za/index.php/docman-menu.../337-ffc-policy-briefs-03.
Fiscal and Finance Commission 2013a. Rural municipalities struggle to maximise their limited tax
base - Current own revenues insufficient to support service delivery mandates in rural
municipalities. http://www.ffc.co.za/index.php/docman-menu-item/policy-briefs-2013/157-
2013-policy-brief-1-rural-municipalities-struggle-to-maximise-their-limited-tax-base Accessed 18
June 2015
Fiscal and Finance Commission. 2013b. Final Report on the Financial and Fiscal Commission’s
Public Hearings on the Review of the Local Government Fiscal Framework www.ffc.co.za accessed
18 June 2015
Fiscal and Financial Commission 2013c. Detecting Fiscal Distress within Local Government.
http://www.ffc.co.za/index.php/docman-menu-item/policy-briefs-2013/596-2013-policy-brief-
4-detecting-fiscal-stress-within-local-government. Accessed 18 June 2015.
Fiscal and Finance Commission. 2013d. Poor Maintenance and Renewal Threatens Municipal
Service Delivery http://www.ffc.co.za/index.php/docman-menu-item/policy-briefs-2013/158-
2013-policy-brief-2-poor-maintenance-and-renewal-threatens-municipal-service-delivery,
accessed 17 June 2015
Fiscal and Finance Commission. 2014. Review of Local Government Infrastructure Grants
file:///C:/Users/Verna/Downloads/Review_of_Local_Government_Infrastructure_Grants-
Recommendations_Working_Paper-For_Distribution%20(1).pdf . Accessed. 18 June 2015
Fiscal & Financial Commission 2015 Submission for the Division of Revenue: 2016/2017.
www.ffc.co.za accessed 17 June 2015
Floyd, T. B. 1960. Town Planning in South Africa. Shuter and Shooter, Cape Town.
52
Forsyth, G.G., Kruger, F.J. & Le Maitre, D.C. 2010. National veldfire risk assessment: analysis of
exposure of social, economic and environmental assets to veldfire hazards in South Africa. CSIR.
Fox, S. 2014. Urbanisation as a global historical process: theory and evidence from sub-Saharan
Africa, in Parnell & Pieterse 2014. Africa’s urban revolution. UCT press, Cape Town.
Gërxhani, K. 2004. The Informal Sector in Developed and Less Developed Countries: A Literature
Survey. Public Choice, 120, ( 3 /4): 267-300
Glaeser, E L. 2011. Triumph of the city. Penguin. New York
Goss, H., Oranje, M. & van Huyssteen, E. 2008. Strengthening intergovernmental coordination in
support of regional development in South Africa – attempts, tools and reflections. Planning Africa
Conference 14-16 April 2008 Sandton Convention Centre, Johannesburg, South Africa
Gotsch, P., Katsaura, O., Ugur, L. & Katsang, N. 2013. Urban and community safety. Research and
policy background paper prepared for the IUDF. CoGTA.
Govender T., Barnes J.M., Pieper C.H. 2010. Housing conditions, sanitation status and associated
health risks in selected subsidized low-cost housing settlements in Cape Town, South Africa.
Habitat International. 35, 335–342.
Govender, T., Barnes, J. M., and Pieper, C.H. 2011. The impact of densification by means of
informal shacks in the backyards of low-cost houses on the environment and service delivery in
Cape Town, South Africa. Environmental Health Insights, 5, 23-52.
Grey., P. and Behrens R. 2013. A case for smarter city growth: A strategic analysis of Cape Town’s
Phase 1a BRT system and its supporting land use environment, 32nd Southern African Transport
Conference, Pretoria.
Hamdi, N. 2004. Small change. Earthscan, London.
Harmse, L. 2014. South Africa’s Gini coefficient: causes, consequences and possible responses.
Master’s dissertation: Gordon Institute of Business Science, University of Pretoria.
Harrison, P. 2006. Integrated development plans and third way politics. In Pillay, U., Tomlinson, R.
& du Toit, J. 2006. Democracy and delivery. Cape Town. HSRC Press. Pp 186-207.
Harrison, P. 2008. The origins and outcomes of South Africa’s integrated development plans. In
Donk, M., Swilling, M., Pieterse, E, & Parnell, S. Consolidating Developmental Local Government.
UCT Press Cape Town. Pp 321-337
Harrison, P. 2014. Regional and spatial development Background paper for 20 year review. RSA:
The Presidency, Pretoria.
Harrison, P & Todes, A. 2013. Spatial considerations in the development of urban policy in South
Africa: a research paper as input into the preparation of the integrated urban development
framework (IUDF) Available from: http://www.cogta.gov.za/index.php/iudf/1078-iudf-
background-report-on-spatial-transformation-12-july-1?path Accessed 17 June 2015.
Harrison, P & Todes, A. 2015. Spatial transformations in a ‘‘loosening state’’: South Africa in a
comparative perspective. Geoforum, vol 61, pp 148–162.
Hayem J. 2013. From May 2008 to 2011: Xenophobic violence and national subjectivity in South
Africa, Journal of Southern African Studies, 39(1) 77-97.
53
Hedden, S. & Cilliers, J. 2014. Parched prospects: The emerging water crisis in South Africa.
African Futures paper 11. Institute for Security Studies.
http://dspace.africaportal.org/jspui/bitstream/123456789/34626/1/AF11_15Sep2014.pdf?1
Heideman, L. 2011. Municipal Local Economic Development and the Multiplier effect: Piloting a
Community Enterprise Identification Method in South Africa and Namibia. Commonwealth Journal
of Local Governance Issue 8/9: 8-111.
Heimann, C & Oranje, M. 2008. City Improvement Districts: An exploratory overview. Town and
Regional Planning, Vol 53: pp15-25
Jobanputra, R. 2013. An investigation into the reduction of road safety risk in Cape Town through
the use of microscopic simulation modelling. (Doctoral thesis, Cape Town: University of Cape
Town).
Joseph, S & Karuri-Sebina, G. Introduction to ‘From housing to human settlements.’ South African
Cities Network, Johannesburg. Pp. 1-12
Keegan, C. 2015a. January 2015a. SA Local Government Briefing. SA Local Government
Information Centre
Keegan, C. 2015b. March 2015. SA Local Government Briefing. SA Local Government Information
Centre
Keegan, C. 2015c. April.2015. SA Local Government Briefing. SA Local Government Information
Centre
Keegan, C. 2015d. June 2015. SA Local Government Briefing. SA Local Government Information
Centre
Keegan, C. 2015e. Additional June 2015. SA Local Government Briefing. SA Local Government
Information Centre
Kenzer, M. 1999. Healthy cities: a guide to the literature. Environment and Urbanization,
11(1):201-220.
Khale, S & Worku, Z. 2013. Factors that affect municipal service delivery in Gauteng and North
West Provinces of South Africa. African Journal of Science, Technology, Innovation and
Development. Vol. 5 (1): 61–70
Kingdon, G., & Knight, J. 1999. Unemployment and wages in South Africa: A spatial approach.
Centre for the Study of African Economies, Institute of Economics and Statistics, University of
Oxford
Koelble T., Thomas A. & LiPuma, E. 2010. Institutional obstacles to service delivery in South Africa.
Social Dynamics, 36(3): 565–589
Koma, S. B. 2012. The Evolution of Developmental Local Government in South Africa: Issues,
Trends and Options. Journal of US-China Public Administration, 9(1): 53-67
Kotze, J. S. & Taylor, D. 2010. Ke Nako: Service delivery as a key challenge for the Zuma
administration. Africa Insight, 40(3): 198-212
Kroukamp, H. 2014. South African local government in a quandary: how to overcome ever-
increasing challenges to excellence in service delivery. Paper presented at Working Group IV of
54
the International Association of Schools and Institutes of Administration (IASIA) conference held
in Bangkok, Thailand, 16 – 21 July 2012.
Krugell, W., Otto, H. & van Dr Merwe, J. 2010. Local municipalities and progress with the delivery
of basic services in South Africa. South African Journal of Economics. 78(3): 307-323
Kruger, M. 2012. Municipal Viability: moving towards sustained support: A discussion document.
CoGTA, Pretoria.
Lancaster, L. 2013 Online: Where murder happens in South Africa.
https://africacheck.org/2013/09/19/where-murder-happens-in-sa/ accessed 19 June 2015
Landman, K. 2004. Gated communities in South Africa: The challenge for spatial planning and land
use management The Town Planning Review, 75(2): 151-172
Landman, K. & Liebermann, S. 2005. Planning against crime: Preventing crime with people not
barriers. SA Crime Quarterly, No 11 March, pp 21-26.
Landman, K. & Schönteich, M. 2002. Urban Fortresses: Gated communities as a reaction to crime.
African Security Review, 11(4): 71-85
Liebermann, S. & Coulson, J. 2004. Participatory mapping for crime prevention in South Africa -
local solutions to local problems. Environment and Urbanization, Vol 16 pp 125-134
Magadia, N. 2013. Local government: intergovernmental co-operation to deliver development
from a municipal base. The Parliamentarian (1):44-47
Mahajan, S. (ed). 2014. Economics of South African Townships: Special Focus on Diepsloot. World
Bank Studies. Washington, DC: World Bank.
Manyaka R. K. 2014. Collection of municipal own revenue in South Africa: Challenges and
prospects. Journal of Public Administration, Volume 49 (1): 127-139
Marias, L. 2014. The Impact of Mine Downscaling on the Free State Goldfields. Urban Forum, Vol
24, pp. 503-521.
Masinga, L. 2015. Private sector puts billions into renewable energy. Business report
http://www.iol.co.za/business/news/private-sector-puts-billions-into-renewable-energy-
1.1868899#.Va4ECfmqqko
Mautjana, M. H, & Maombe, G. 2014. Community participation or malicious compliance? Africa
Insight, 44(2):51-67
McKibbin, J., Binns, T. & Nel, E. 2012. Uplifting small towns in post-apartheid South Africa: The
experience of the Amathole Regional Economic Development Agency (Aspire). Local Economy,
27(4): 388–402
Meadows, M. E. & Hoffman, M. T. 2002. The nature, extent and causes of land degradation in
South Africa: legacy of the past, lessons for the future? Area, 34( 4):428-437.
Meyer, D. F. 2014. Exploration of solutions for revitalisation of rural areas in South Africa.
Mediterranean Journal of Social Sciences, 5 (4): 6-3-625.
Ministry of Constitutional Development and Provincial Affairs (DCD). 1998. White paper on local
government. Government Printer, Pretoria.
55
Miriftab, F. 2007. Governing Post -Spatiality: Implementing City Improvement Districts in Cape
Town. Antipode 39(4): 602-626
Momba, M. N. B., Tyafa, Z., Makala, N., Brouckaert, B. M., & Obi, C. L. 2006. Safe drinking water
still a dream in rural areas of South Africa. Case Study: The Eastern Cape Province. Water Institute
of South Africa (WISA) Biennial Conference, Durban, South Africa, 21-25 May.
Monkam, N. F. 2014. Local municipality productive efficiency and its determinants in South Africa,
Development Southern Africa, 31(2): 275-298
Municipal Demarcation Board (MDB). 2012. State of municipal capacity assessment 2010/2011.
www.demarcation.org.za/index.php/capacity-assessment
Murray, M. J. 2003. Alien Strangers in our midst: the dreaded foreign invasion and "Fortress South
Africa”. Canadian Journal of African Studies / Revue Canadienne des Études Africaines, 37(2/3):
440-466
Musvoto G. G. 2014. The historical evolution of settlement patterns and trends in South Africa:
Unlocking the log-jam of the unsustainable settlements impasse, International Journal of African
Renaissance Studies - Multi-, Inter- and Transdisciplinarity, 9(2): 154-172
National Treasury. 2015. 2015 Budget Review.
http://www.treasury.gov.za/documents/national%20budget/2015/review/chapter%202.pdf
accessed 19 June 2015
Nel, E. Taylor, B.; Hill, T.; Atkinson, D. 2011. Demographic and economic changes in small towns
in South Africa's Karoo: looking from the inside out. Urban Forum, 22(4):395-410
Nel, E. & Binns, T. 2003. Putting 'Developmental Local Government' into practice: the experience
of South Africa's towns and cities. Urban Forum, 14( 2/3):165-184.
Nel, E., Binns, T. and Bek, D. 2009. Misplaced expectations? The experience of applied local
economic development in post-apartheid South Africa. Local Economy, 24( 3): 224 — 237
Nhlanhla Nene: 2015 budget speech. 25 February 2015.
(http://www.parliament.gov.za/content/speech~11.pdf). accessed 18 June 2015.
Nicolaou-Manias, K. (ed). 2012. Infrastructure barometer 2012. Development Bank of Southern
Africa. Midrand, Johannesburg. http://www.dbsa.org/EN/About-
Us/Publications/General/Barometer%202012.pdf
Norman, R., Cairncross, E., and Witi, J., Bradshaw, D., and Collaboration, South African
Comparative Risk Assessment and others. 2007. Estimating the burden of disease attributable to
urban outdoor air pollution in South Africa in 2000. South African Medical Journal, 97(8): 782-790.
Ntema, L & Marais, L. 2010. “Trade is in our blood”: Reflections on trends and conflicts in township
trade. Centre for Development Support, University of the Free State. Bloemfontein.
OECD. 2013. OECD Economic Surveys: South Africa 2013, OECD Publishing.
http://www.treasury.gov.za/publications/other/OECD%20Economic%20Surveys%20South%20Af
rica%202013.pdf, accessed 18 June 2015.
56
Okoh, A. I., & Igbinosa, E. O. 2010. Antibiotic susceptibility profiles of some Vibrio strains isolated
from wastewater final effluents in a rural community of the Eastern Cape Province of South
Africa. BMC microbiology, 10(1), 143.
Ovens, W. 2013. 20 year review of Local government.
www.salga.org.za/.../20%20Year%20Review%20Integrated%203.pptx
Paasche, T. F. 2012. Creating parallel public spaces through private governments: a South African
case study. South African Geographical Journal. Vol. 94 (1):46–59
Papapetrou, P. 2014. Enabling Renewable Energy in South Africa, Assessing the Renewable Energy
IPP Procurement Programme. Windaba Presentation, CTICC, Cape Town, 4 November 2014.
http://www.windaba.co.za/wp-content/uploads/2014/11/Pamela-Papapetrou-Highlights-from-
the-WWF-report-on-Enabling-RE-in-SA.pdf Accessed 24 June 2015.
Pegram, G., Rollins, C. N., and Espey, Q. 1998. "Estimating the costs of diarrhoea and epidemic
dysentery in KwaZulu-Natal and South Africa." Water SA, Vol 24 pp 11-20.
Pelling, M. 2003. The vulnerability of cities. Earthscan, London.
Pelling, M. & Wisner, B. Disaster risk reduction: cases from urban Africa. Earthscan, London.
Petrella, L. 2007. Inclusive city governance – a critical tool in the fight against crime. Habitat
Debate, Vol. 13(3): 4 & 5
Pieterse, E. & Parnell, S. (eds) Africa’s urban revolution. UCT Press, Cape Town.
Pieterse, E., Parnell, S, Swilling, M. & van Donk, M. 2008. Consolidating Developmental Local
Government in van Donk, M., Swilling, M., Pieterse, E. & Parnell, S. Consolidating Developmental
Local Government. UCT Press Cape Town.
Pillay, U. 2004. Are Globally Competitive ‘City Regions’ Developing in South Africa? Formulaic
Aspirations or New Imaginations? Urban Forum, 15 (4): 340-364
Powell, D. 2012. Imperfect transition–local government reform in South Africa 1994-2012.
http://repository.uwc.ac.za/xmlui/bitstream/handle/10566/551/PowellLocalGovernment2012.p
df? 22 June 2015.
Powell, D.M., O’Donovan, M. & de Visser. J. 2015. Civic protests barometer: 2007-2014. MLGI.
Cape Town: http://mlgi.org.za/talking-good-
governance/20150219%20Civic%20Protest%20Barometer%20Published%20%20DP.pdf,
accessed 22 June 2015
Pretoruis, C. J. & Smal, M. M. 1994. Notes on the macro-economic effect of the drought.
https://www.resbank.co.za/Lists/News%20and%20Publications/Attachments/5187/05Notes%20
on%20the%20macro-economic%20effects%20of%20the%20drought.pdf accessed 27 June 2015
Prüss-Üstün, A. 2006. Preventing disease through healthy environments: towards an estimate of
the environmental burden of disease: Executive summary. World Health organisation, Geneva.
http://www.who.int/quantifying_ehimpacts/publications/prevdisexecsume.pdf?ua=1
Qobo, M. 2013. Is environmentally sustainable and inclusive growth possible? Sub-Saharan Africa
and emerging global norms on development. South African Journal of International Affairs, 20(3):
339-356. DOI: 10.1080/10220461.2013.841799
57
Reddy, P. & Wallis, M. 2012. Local economic development: a critique of the African experience.
Politeia, 31 (2): 70-88
Reddy, P. S. 2010. Democratic decentralisation and local democracy in South Africa re-examined:
quo vadis? Politeia Vol 29 No 3: 66–87
Republic of South Africa (RSA) 1993a. Constitution of the Republic of South Africa, Act 200 of 1993.
Government Printer, Pretoria.
Republic of South Africa (RSA) 1993b. Local Government Transition Act, 209 of 1993. Government
Printer, Pretoria.
Republic of South Africa (RSA) 1996. Constitution of the Republic of South Africa, Act 108 of 1996.
Government Printer, Pretoria.
Republic of South Africa (RSA) 2000. Local Government: Municipal System Act, 32 of 2000.
Government Printer, Pretoria.
Republic of South Africa (RSA): The Presidency. 2003. National Spatial Development Perspective.
Pretoria.
Republic of South Africa (RSA): The Presidency. 2014a. 20 Year Review.
Republic of South Africa (RSA): The Presidency. 2014b. 20 Year Review Background paper: Local
government
Republic of South Africa (RSA). The Presidency. 2014c. 20 year review Background paper:
Sustainable human settlements, The Presidency
Rogerson, C. M. 2010. Local economic development in South Africa: Strategic challenges.
Development Southern Africa, 27( 4): 481-495
Rogerson, C. M. 2011. Tracking local economic development policy and practice in South Africa,
1994–2009. Urban Forum, Vol 22:149–168
Rogerson, C. M. 2013. Reframing local economic development futures in South Africa. Journal of
Public Administration , 48(4): 640-655
Royal Town planning Institute (RTPI), 2014. Promoting Healthy Cities. Planning Horizons no.3
October 2014.
Schmidt, D. 2008. From spheres to tiers – conceptions of local government in South Africa in the
period 1994-2006. In Donk, M., Swilling, M., Pieterse, E, & Parnell, S. Consolidating Developmental
Local Government. UCT Press Cape Town. Pp 109-129.
Scorgie, Y. 2012. Urban air quality management and planning in South Africa. Doctoral Thesis,
University of Johannesburg.
Shambare, R. 2011. Cell phone banking adoption in South Africa. Business and economic
Research. 1(1): 1-15 E7.
http://www.macrothink.org/journal/index.php/ber/article/view/1144/1608
Simone, A & Abouhani, A. 2005. Urban Africa, Zed books. London
Simone, A T. n.d. “On Informality & Considerations for Policy”. Dark Roast Occasional Paper Series
No 3, Isandla Institute.
58
Siqwana-Ndulo, N. 2013. The informal sector in South Africa: Women street traders in Durban –
Part 1. Consultancy Africa Intelligence.
http://www.consultancyafrica.com/index.php?option=com_content&view=article&id=1286:the-
informal-sector-in-south-africa-women-street-traders-in-durban-part-1-&catid=91:rights-in-
focus&Itemid=296, accessed 17 June 2015
Smit, S. & Musango, J. K. 2015. Towards connecting green economy with informal economy in
South Africa: A review and way forward. Ecological Economics, Vol 116: 154–159
Smit, W. & Watson, V. 2011. The African Centre for Cities’ Healthy Cities CityLab: understanding
urban health in the global south. Cities, Health and Well-Being Hong Kong, November 2011.
https://files.lsecities.net/files/2011/11/2011_chw_5065_Smit-Watson.pdf, accessed 20 June
2015
Solar Wiki. 2015. Available from: https://en.wikipedia.org/wiki/Solar_power [Accessed 26 June
2015]
Solomon, H. 2012. Researching terrorism in South Africa: more questions than answers. Scientia
Militaria: South African Journal of Military Studies. 40(2): 142-165
Statistics South Africa (StatsSA). 2012 Census 2011.
http://www.statssa.gov.za/publications/P03014/P030142011.pdf
StatsSA. 2014a. Mortality and causes of death in South Africa, 2013: Findings from death
notification. [Online] beta2.statssa.gov.za/publications/P03093/P030932011.pdf Accessed 25
June
Statistics South Africa (StatsSA). 2014b. Gross domestic product Annual estimates 2004 – 2013
Regional estimates 2004 – 2013 Third quarter 2014.
http://beta2.statssa.gov.za/publications/P0441/P04413rdQuarter2014.pdf Accessed 15 June
2015
Statistics South Africa (StatsSA) 2014c. National Household Travel Survey, 2013.
www.statssa.gov.za/publications/P0320/P03202013.pdf Accessed 25 June.
Statistics South Africa (StatsSA). 2015a. Methodological report on rebasing of national poverty
lines and development of pilot provincial poverty lines. Report 03-10-11.
http://www.statssa.gov.za/publications/Report-03-10-11/Report-03-10-11.pdf Accessed 25 June
2015
Statistics South Africa, (StatsSA). 2015b. General household survey.
http://www.statssa.gov.za/publications/P0318/P03182014.pdf Accessed 25 June 2015
Steedley, A. 2014. Understanding Affordable Housing Markets: Overview report. Centre for
Affordable Housing Finance in Africa.
http://www.housingfinanceafrica.org/document/understanding-affordable-housing-markets-
overview-report
Stephens, C. 1996. Healthy cities or unhealthy islands? The health and social implications of urban
inequality. Environment and Urbanization, Vol. 8, No. 2: 9-30
Subban, M. & Theron, H. 2012. Tracing a decade of drafting, reviewing and assessing integrated
development plans in KwaZulu-Natal: Some key reflections. Town and Regional Planning, Vol 61
p21-29
59
Tau, S. F. 2013. Citizen participation as an aspect of local governance in municipalities: a South
African perspective. Journal of Public Administration, 48(1):152-160
Tennant, M. 2015. Cape Town’s MyCiti BRT – Four Years into its ‘Democracy’.
http://www.urbanafrica.net/urban-voices/cape-towns-myciti-brt-four-years-into-its-democracy/
Accessed 24 June 2015.
Tetley, S. Maree, JP, Schroeder, S. 2011. Municipal road maintenance in South Africa. IMIESA
August pp 33-41
The Housing Development Agency (HDA). 2013. South Africa: informal settlements status (2013)
http://www.thehda.co.za/uploads/images/HDA_South_Africa_Report_lr.pdf
Tichauer, C.R. and Watters, M. 2008. N2 BMT Lane- A First for South Africa. Paper presented at
the 27th Annual Southern African Transport Conference 7 - 11 July 2008 "Partnership for research
and progress in transportation", CSIR International Convention Centre, Pretoria, South Africa.
Available from: http://repository.up.ac.za/handle/2263/6514 [Accessed 27 June 2015]
Tissington, K. (2010). A Review of Housing Policy and Development in South Africa since 1994.
Socio Economic Rights Institute of South Africa (SERI).
Toerien, D. F. 2015. Economic value addition, employment, and enterprise profiles of local
authorities in the Free State, South Africa. Cogent Social Sciences, No 1: 1054610
http://dx.doi.org/10.1080/23311886.2015.1054610
Toerien, D. F., & Seaman, M. T. (2010). The enterprise ecology of towns in the Karoo, South Africa.
South African Journal of Science, 106, 24–33.
Toerien, D. F., & Seaman, M. T. (2012a, September 3–7). Paradoxes, the tyranny of structures and
enterprise development in South African towns. Presented at Towards Carnegie III Conference,
Cape Town. Available from
http://carnegie3.org.za/docs/papers/269_Toerien_Paradoxes,%20the%20tyranny%20of%20stru
ctures%20and%20enterprise%20development%20in%20SA%20towns.pdf
Toerien, D. F., & Seaman, M. T. (2012b). Proportionality in enterprise development of South
African towns. South African Journal of Science, 108, 38–47.
Toerien, D. F., & Seaman, M. T. (2012c). Regional order in the enterprise structures of selected
Eastern Cape Karoo towns. South African Geographical Journal, 94, 1–15
Toerien, D. F., & Seaman, M. T. (2014). Enterprise richness as an important characteristic of South
African towns. South African Journal of Science, 110, 20140018, 9 p.
http://dx.doi.org/10.1590/sajs.2014/20140018
Tomlinson, M. R. 1999. From rejection to resignation: beneficiaries' views on the South African
government's new housing subsidy system. Urban Studies, 36 (8): 1349-1359.
Turok, I. & Borel-Saladin, J. 2013. The Spatial Economy. Background Research Report for the
Integrated Urban Development Framework. Available from
http://www.cogta.gov.za/index.php/iudf
Turok, I. & Borel-Saladin, J. 2014. Is urbanisation in South Africa on a sustainable trajectory?
Development Southern Africa, 31(5), 675-691
60
Turok, I. 2012. Urbanisation and Development in South Africa: Economic Imperatives, Spatial
Distortions and Strategic Responses. International Institute for Environment and Development.
Available from http://pubs.iied.org/10621IIED.html.
Ugo, P.D., 2014, ‘The bus rapid transit system: A service quality dimension of commuter uptake in
Cape Town, South Africa’, Journal of Transport and Supply Chain Management 8(1), Art. #145, 10
pages. http://dx.doi.org/10.4102/jtscm.v8i1.145
UN Habitat. 2013. The relevance of street patterns and public space in urban areas. United Nations
Human Settlements Programme, Nairobi.
UN-Habitat, 2014. The state of African cities. United Nations Human Settlements Programme.
Nairobi.
United Nations Development Programme (UNDP). 2015. Human Development Index. Country
reports. South Africa available at http://hdr.undp.org/en/countries/profiles/ZAF, accessed 17
June 2015
Vale, P. 2002. Migration, xenophobia and security-making in post-apartheid South Africa,
Politikon: South African Journal of Political Studies, 29:1, 7-29.
Van der Heijden, T. 2012. Making the informal economy visible: guidelines for municipalities in
respect of adopting a more developmental approach towards the informal economy. Report
prepared for SALGA. http://led.co.za/sites/default/files/cabinet/orgname-
raw/document/2012/municipal_informal_economy_guidelines_final_june2012_v2_0.pdf
Van Huyssteen, E. & Oranje, M. 2003. Planning for crime prevention: the case of the City of
Tshwane. Safer Africa, Pretoria.
Van Huyssteen, E., Oranje, M., Robinson, S. & Makoni, E. 2009. South Africa’s city regions: a call
for contemplation... and action. Urban Forum Vol 20 pp175–194.
Van Wilgen, B.W. & De Lange, W.J. 2011. The costs and benefits of biological control of invasive
alien plants in South Africa. Centre for Invasion Biology, CSIR Natural Resources and the
Environment. Stellenbosch, South Africa.
Van Wilgen BW, Cowling RM, Marais C, Esler KJ, McConnachie M, Sharp D. 2012. Challenges in
invasive alien plant control in South Africa. S Afr J Sci. 2012; 108(11/12), Art. #1445, 3 pages.
http://dx.doi.org/10.4102/sajs.v108i11/12.1445
Van Zyl, J., Cross, C., & O’ Donovan, M. 2008. Overview of the extent and nature of the un-
bundling of South African households and the implications thereof. The Presidency: Background
paper for the 15 year review.
http://www.thepresidency.gov.za/docs/reports/15year_review/social/households.pdf
Weir-Smith, G & Ahmed, F. 2013. Unemployment in South Africa: Building a spatio-temporal
understanding. South African Journal of Geomatics, Vol. 2, No. 3, pp 218-230.
Werna, E., Harpham, T., Blue, I. & Goldstein, G. 1998. Healthy city projects in developing countries.
Earthscan, London.
Wessels, J. 2012. Small towns: development potential or poverty traps? Making sure place doesn’t
take preference over people. Presented at Towards Carnegie III Conference, University of Cape
Town. 3-7 September 2012 Cape Town.
61
Wessels, K. J., Prince, S. D., Frost, P. E. & van Zyl, D. 2006. Assessing the effects of human-induced
land degradation in the former homelands of northern South Africa with a 1 km AVHRR NDVI time-
series. Remote Sensing of Environment, Vol 91 pp 47 – 67
Wheeler, Stephen. 2009. Regions, megaregions, and sustainability. Regional Studies, Vol. 43.6, pp.
863–876, July 2009
World Health Organisation (WHO). N.d. Healthy Settings.
http://www.who.int/healthy_settings/en/, accessed 17 June 2015.
Working on fire (WOF). 2013. Fire in South Africa. [online] Available from:
http://www.workingonfire.org/index.php/about-wof/fire-in-sa
Working on fire (WoF). 2015. Fire in South Africa.
http://www.workingonfire.org/index.php/about-wof/fire-in-sa. Accessed 26 June 2015.
World Health Organisation (WHO). 2009. Global health risks: Mortality and burden of disease
attributable to selected major risks.
http://www.who.int/healthinfo/global_burden_disease/GlobalHealthRisks_report_full.pdf
Wright, C. & Godfrey, L. 2010. The impact of an unhealthy environment on human health in
South Africa. CSIR Briefing note 2009/04.
http://www.csir.co.za/nre/docs/Briefing%20Note%20No4%202010_environmental%20health_FI
NAL.pdf Accessed 22 June 2015.
Xuza, P. 2007. Ten Years and Ten Trends of Local Economic Development Practice in South Africa:
A Practitioner’s Perspective. Urban Forum, 18:117–123
Xuza, P. H. L. 2005. Renewal of small town economies: the case of Alice, Eastern Cape Province,
South Africa. African Insight, 35(4):90-96.
Zhuwakinyu, M. 2012. Water 2012-A review of South Africa’s water sector. Research Unit of
Creamer Media (Pty) Ltd. Johannesburg, South Africa
Ziervogel, G., New, M., Archer van Garderen, E., Midgley, G., Taylor, A., Hamann, R., Stuart-Hill,
S., Myers, J. & Warburton, M. 2014. Climate change impacts and adaptation in South Africa. WIREs
Clim Change 2014, vol 5, pp 605–620. doi: 10.1002/wcc.295
Zuma, B. M., Luyt, C. D., Chirenda, T. & Tandlich, R. 2012a. Flood Disaster Management in South
Africa: Legislative Framework and Current Challenges. International Conference on Applied Life
Sciences (ICALS2012) Turkey, September 10-12, 2012
Zuma, B. M., Luyt, C. D., Tandlich, R., & Chirenda, T. 2012b. Flood disaster management in South
Africa: legislative framework and current challenges. INTECH Open Access Publisher.