anne arundel county employees’ retirement · pdf fileanne arundel county...
TRANSCRIPT

Anne Arundel County Employees’ Retirement Plan
Actuarial Valuation as of January 1, 2017 to Determine the County’s Contribution for the Fiscal Year Ending June 30, 2018
Submitted by:
Thomas Lowman, FSA, EA Kristopher Seets, FSA, EA
Chief Actuary Actuary
(443) 573-3909 (443) 573-3911
[email protected] [email protected]
36 S. Charles Street, Suite 1000 Baltimore, MD 21201
Anne Arundel County Employees’ Retirement Plan
Table of Contents
Page Transmittal Letter ................................................................................................................. 1 Section I Executive Summary ....................................................................................... 2 Section II Determination of County Contributions .......................................................... 9 Section III Valuation of Assets ...................................................................................... 12 Section IV Participant Information ................................................................................. 14 Section V Summary of Plan Provisions........ ................................................................ 17 Section VI Actuarial Methods and Assumptions............................................................ 24 Section VII Glossary ....................................................................................................... 29 Appendices ........................................................................................................................ 36 Summary of Plan Funding ........................................................................... 36
Benefit Payment Projection .......................................................................... 38
Risk Metrics ................................................................................................. 39
Summary of Legislative Changes ................................................................ 40
Bolton Partners, Inc.
36 S. Charles Street Suite 1000 Baltimore, Maryland 21201 (410) 547-0500 (800) 394-0263 Fax (410) 685-1924 Employee Benefits and Investment Consulting
April 18, 2017 PERSONAL & CONFIDENTIAL Andrea Rhodes Personnel Officer Anne Arundel County Government P.O. Box 6675 Annapolis, MD 21401
Re: Employees’ Retirement Plan Valuation
Dear Andrea: The following sets forth the actuarial valuation of the Anne Arundel County Employees’ Retirement Plan as of January 1, 2017. Section 1 of the report provides a summary while Sections 2 through 6 contain the development of the County’s contribution for the 2018 fiscal year along with a summary of the census and asset data, plan provisions, assumptions and actuarial methods. Section 7 provides a glossary of many of the terms used in this report. The appendices of the report provide information for financial reporting as well as a ten-year projection of benefit payments. We are available to answer any questions on the material in this report or to provide explanations or further details as appropriate. The undersigned credentialed actuaries meet the Qualification Standards of the American Academy of Actuaries to render the actuarial opinion contained in this report. We are not aware of any direct or material indirect financial interest or relationship, including investments or other services that could create a conflict of interest, which would impair the objectivity of our work. Respectfully submitted, BOLTON PARTNERS, INC.
Thomas Lowman, FSA, EA Kristopher Seets, FSA, EA
Anne Arundel County Employees’ Retirement Plan
2
Section I. Executive Summary
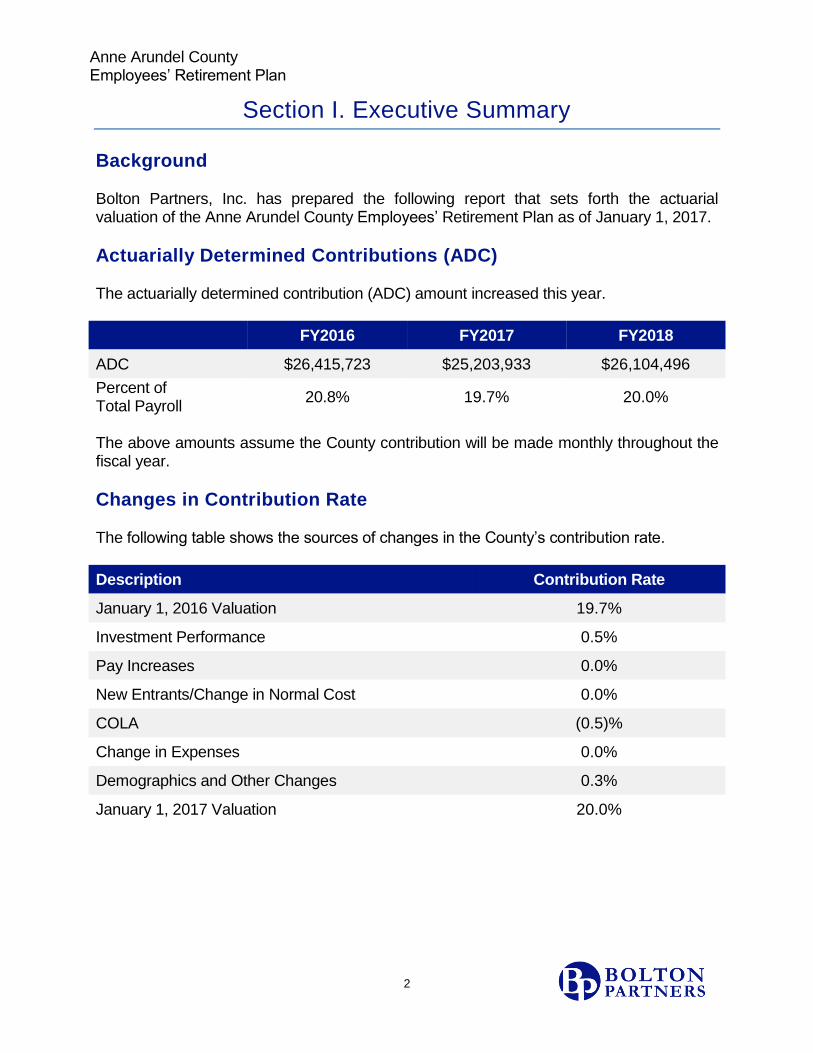
Background Bolton Partners, Inc. has prepared the following report that sets forth the actuarial valuation of the Anne Arundel County Employees’ Retirement Plan as of January 1, 2017.
Actuarially Determined Contributions (ADC) The actuarially determined contribution (ADC) amount increased this year. FY2016 FY2017 FY2018
ADC $26,415,723 $25,203,933 $26,104,496
Percent of Total Payroll
20.8% 19.7% 20.0%
The above amounts assume the County contribution will be made monthly throughout the fiscal year.
Changes in Contribution Rate The following table shows the sources of changes in the County’s contribution rate.
Description Contribution Rate
January 1, 2016 Valuation 19.7%
Investment Performance 0.5%
Pay Increases 0.0%
New Entrants/Change in Normal Cost 0.0%
COLA (0.5)%
Change in Expenses 0.0%
Demographics and Other Changes 0.3%
January 1, 2017 Valuation 20.0%
Anne Arundel County Employees’ Retirement Plan
3
Section I. Executive Summary
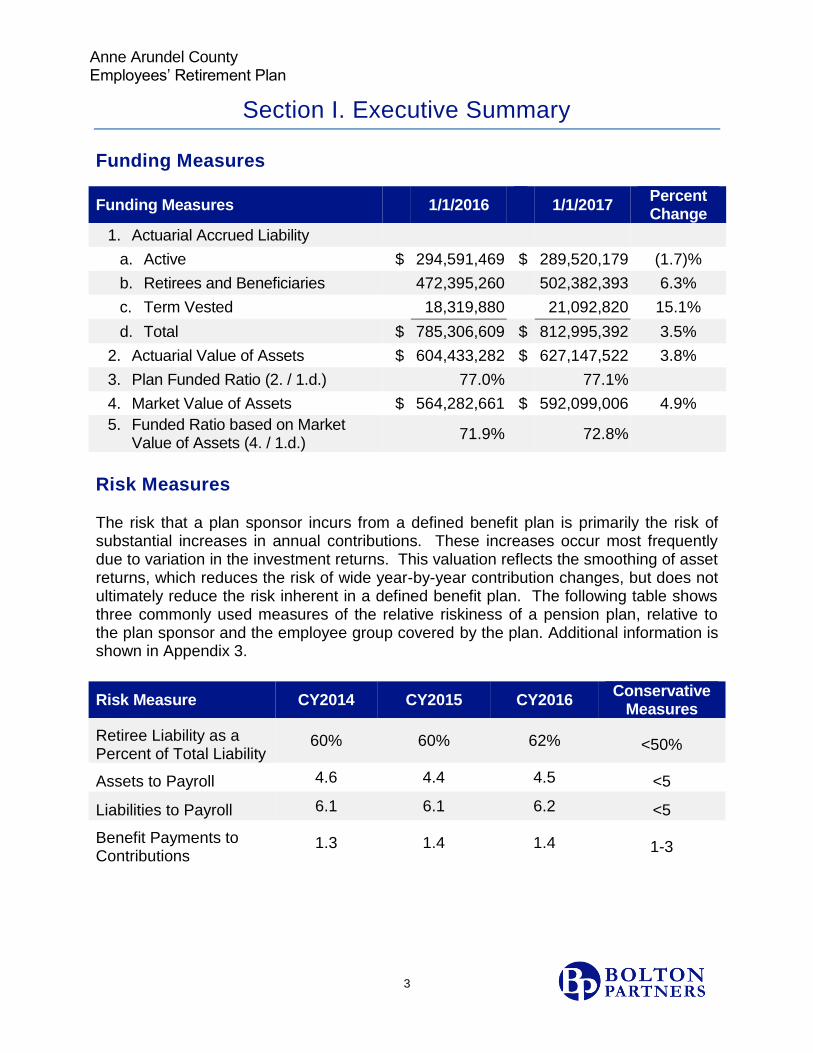
Funding Measures
Funding Measures 1/1/2016
1/1/2017 Percent Change
1. Actuarial Accrued Liability
a. Active $ 294,591,469 $ 289,520,179 (1.7)%
b. Retirees and Beneficiaries 472,395,260 502,382,393 6.3%
c. Term Vested 18,319,880 21,092,820 15.1%
d. Total $ 785,306,609 $ 812,995,392 3.5%
2. Actuarial Value of Assets $ 604,433,282 $ 627,147,522 3.8%
3. Plan Funded Ratio (2. / 1.d.) 77.0% 77.1%
4. Market Value of Assets $ 564,282,661 $ 592,099,006 4.9%
5. Funded Ratio based on Market Value of Assets (4. / 1.d.)
71.9% 72.8%
Risk Measures
The risk that a plan sponsor incurs from a defined benefit plan is primarily the risk of substantial increases in annual contributions. These increases occur most frequently due to variation in the investment returns. This valuation reflects the smoothing of asset returns, which reduces the risk of wide year-by-year contribution changes, but does not ultimately reduce the risk inherent in a defined benefit plan. The following table shows three commonly used measures of the relative riskiness of a pension plan, relative to the plan sponsor and the employee group covered by the plan. Additional information is shown in Appendix 3.
Risk Measure CY2014 CY2015 CY2016 Conservative
Measures
Retiree Liability as a Percent of Total Liability
60% 60% 62% <50%
Assets to Payroll 4.6 4.4 4.5 <5
Liabilities to Payroll 6.1 6.1 6.2 <5
Benefit Payments to Contributions
1.3 1.4 1.4 1-3
Anne Arundel County Employees’ Retirement Plan
4
Section I. Executive Summary
Experience Analysis
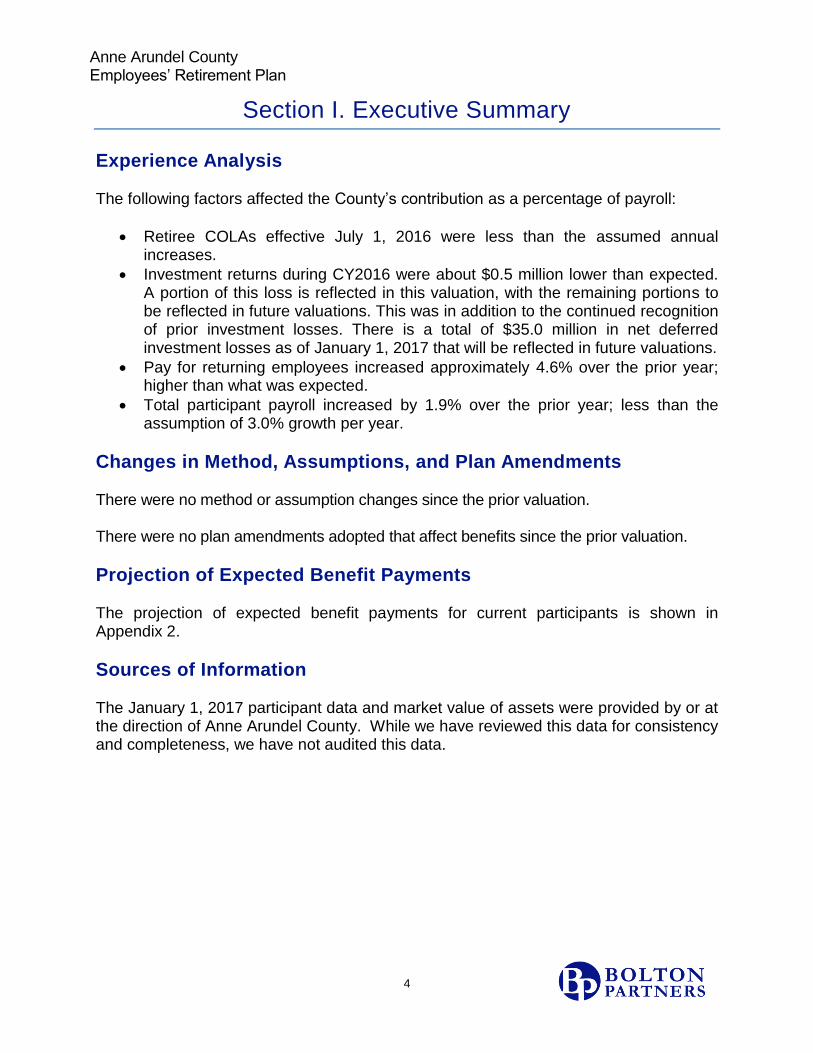
The following factors affected the County’s contribution as a percentage of payroll:
Retiree COLAs effective July 1, 2016 were less than the assumed annual increases.
Investment returns during CY2016 were about $0.5 million lower than expected. A portion of this loss is reflected in this valuation, with the remaining portions to be reflected in future valuations. This was in addition to the continued recognition of prior investment losses. There is a total of $35.0 million in net deferred investment losses as of January 1, 2017 that will be reflected in future valuations.
Pay for returning employees increased approximately 4.6% over the prior year; higher than what was expected.
Total participant payroll increased by 1.9% over the prior year; less than the assumption of 3.0% growth per year.
Changes in Method, Assumptions, and Plan Amendments
There were no method or assumption changes since the prior valuation. There were no plan amendments adopted that affect benefits since the prior valuation.
Projection of Expected Benefit Payments The projection of expected benefit payments for current participants is shown in Appendix 2.
Sources of Information The January 1, 2017 participant data and market value of assets were provided by or at the direction of Anne Arundel County. While we have reviewed this data for consistency and completeness, we have not audited this data.
Anne Arundel County Employees’ Retirement Plan
5
Section I. Executive Summary
Actuarial Certification This actuarial valuation sets forth our calculation of an estimate of the liabilities of the Anne Arundel County Employees’ Retirement Plan (the Plan), together with a comparison of these liabilities with the value of the plan assets, as submitted by Anne Arundel County Government (the County). This calculation and comparison with assets is applicable for the valuation date only. The future is uncertain, and the plan may become better funded or more poorly funded in the future. This valuation does not provide any guarantee that the plan will be able to provide the promised benefits in the future. This is a deterministic valuation in that it is based on a single set of assumptions. This set of assumptions is one possible basis for our calculations. Other assumptions may be equally valid. The future is uncertain and the plan’s actual experience will differ from those assumptions; these differences may be significant or material because these results are very sensitive to the assumptions made and, in some cases, to the interaction between the assumptions. We may consider that some factors are not material to the valuation of the plan and may not provide a specific assumption for those factors. We may have used other assumptions in the past. We will likely consider changes in assumptions at a future date. Different assumptions or scenarios within the range of possibilities may also be reasonable and results based on those assumptions would be different. As a result of the uncertainty inherent in a forward looking projection over a very long period of time, no one projection is uniquely “correct” and many alternative projections of the future could also be regarded as reasonable. Two different actuaries could, quite reasonably, arrive at different results based on the same data and different views of the future. A “sensitivity analysis” shows the degree to which results would be different if you substitute alternative assumptions within the range of possibilities for those utilized in this report. We have not been engaged to perform such a sensitivity analysis and thus the results of such an analysis are not included in this report. At the County’s request, Bolton Partners, Inc. is available to perform such a sensitivity analysis. The County is responsible for selecting the plan’s funding policy, actuarial valuation methods, asset valuation methods, and assumptions. The policies, methods and assumptions used in this valuation are those that have been so prescribed and are described in this report. The County is solely responsible for communicating to Bolton Partners, Inc. any changes required thereto.

Anne Arundel County Employees’ Retirement Plan
6
Section I. Executive Summary
Actuarial Certification (cont.) The County could reasonably ask how the valuation would change if we used a different assumption set or if plan experience exhibited variations from our assumptions. This report does not contain such an analysis. This type of analysis would be a separate assignment. In addition, decisions regarding benefit improvements, benefit changes, the trust’s investment policy, and similar issues should not be based on this valuation. These are complex issues and other factors should be considered when making such decisions. These other factors might include the anticipated vitality of the local economy and future growth expectations, as well as other economic and financial factors. The cost of this plan is determined by the benefits promised by the plan, the plan’s participant population, the investment experience of the plan and many other factors. An actuarial valuation is a budgeting tool for the County. It does not affect the cost of the plan. Different funding methods provide for different timing of contributions to the plan. As the experience of the plan evolves, it is normal for the level of contributions to the plan to change. If a contribution is not made for a particular year, either by deliberate choice or because of an error in a calculation, that contribution can be made in later years. We will not be responsible for contributions that are made at a future time rather than an earlier time. The plan sponsor is responsible for funding the cost of the plan. We make every effort to ensure that our calculations are accurately performed. These calculations are complex. Despite our best efforts, we may make a mistake. We reserve the right to correct any potential errors by amending the results of this report or by including the corrections in a future valuation report. Because modeling all aspects of a situation is not possible or practical, we may use summary information, estimates, or simplifications of calculations to facilitate the modeling of future events in an efficient and cost-effective manner. We may also exclude factors or data that are immaterial in our judgment. Use of such simplifying techniques does not, in our judgment, affect the reasonableness of valuation results for the plan. This report is based on plan provisions, census data, and asset data submitted by the County. We have relied on this information for purposes of preparing this report, but have not performed an audit. The accuracy of the results presented in this report is dependent upon the accuracy and completeness of the underlying information. The County is solely responsible for the validity and completeness of this information.

Anne Arundel County Employees’ Retirement Plan
7
Section I. Executive Summary
Actuarial Certification (cont.) The County is solely responsible for selecting the plan’s investment policies, asset allocations and individual investments. Bolton Partners, Inc.’s actuaries have not provided any investment advice to the County. The information in this report was prepared for the internal use of the County and its auditors in connection with our actuarial valuations of the pension plan. It is neither intended nor necessarily suitable for other purposes. Bolton Partners, Inc. is not responsible for the consequences of any other use or the reliance upon this report by any other party. The only purpose of this report is to provide the recommended employer contribution for the 2018 fiscal year. This report may not be used for any other purpose; Bolton Partners, Inc. is not responsible for the consequences of any unauthorized use. The calculation of actuarial liabilities for valuation purposes is based on a current estimate of future benefit payments. The calculation includes a computation of the “present value” of those estimated future benefit payments using an assumed discount rate; the higher the discount rate assumption, the lower the estimated liability will be. For purposes of estimating the liabilities (future and accrued) in this report, you selected an assumption based on the expected long-term rate of return on plan investments. Using a lower discount rate assumption, such as a rate based on long-term bond yields, could substantially increase the estimated present value of future and accrued liabilities. Because valuations are a snapshot in time and are based on estimates and assumptions that are not precise and will differ from actual experience, contribution calculations are inherently imprecise. There is no uniquely “correct” level of contributions for the coming plan year. This report provides certain financial calculations for use by the auditor. These values have been computed in accordance with our understanding of generally accepted actuarial principles and practices and fairly reflect the actuarial position of the Plan. The various actuarial assumptions and methods which have been used are, in our opinion, appropriate for the purposes of this report.
Anne Arundel County Employees’ Retirement Plan
8
Section I. Executive Summary
Actuarial Certification (cont.) The report is conditioned on the assumption of an ongoing plan and is not meant to present the actuarial position of the Plan in the case of Plan termination. Future actuarial measurements may differ significantly from the current measurements presented in this report due to such factors as the following: plan experience differing from that anticipated by the economic or demographic assumptions, changes in economic or demographic assumptions, increases or decreases expected as part of the natural operation of the methodology used for these measurements (such as the end of an amortization period or additional cost or contribution requirements based on the plan’s funded status), and changes in plan provisions or applicable law. The County should notify Bolton Partners, Inc. promptly after receipt of this report if the County disagrees with anything contained in the report or is aware of any information that would affect the results of the report that has not been communicated to Bolton Partners, Inc. or incorporated therein. The report will be deemed final and acceptable to the County unless the County promptly provides such notice to Bolton Partners, Inc. The undersigned credentialed actuaries meet the Qualification Standards of the American Academy of Actuaries to render the actuarial opinion contained herein. We are currently compliant with the Continuing Professional Development Requirement of the Society of Actuaries. We are not aware of any direct or material indirect financial interest or relationship, including investments or other services, which could create a conflict of interest that would impair the objectivity of our work. We are available to answer any questions on the material in this report to provide explanations or further details as appropriate. Bolton Partners, Inc.
Thomas Lowman, FSA, EA Kristopher Seets, FSA, EA

Anne Arundel County Employees’ Retirement Plan
9
Section II. Determination of County Contributions
Derivation of Liabilities Below is a summary of the actuarial accrued liability of the future benefits expected to be paid from the plan.
Unfunded Liability 1/1/2016 1/1/2017
1. Participants
a. Active 2,186 2,187
b. Terminated Vested 276 278
c. Disabled 76 75
d. Retirees 1,494 1,582
e. Beneficiaries 140 150
f. Total 4,172 4,272
2. Active Payroll $ 127,827,040 $ 130,312,665
3. Actuarial Accrued Liability
a. Active Participants $ 294,591,469 $ 289,520,179
b. Terminated Vested Participants 18,319,880 21,092,820
c. Retirees and Beneficiaries 472,395,260 502,382,393
d. Total $ 785,306,609 $ 812,995,392
4. Actuarial Asset Value $ 604,433,282 $ 627,147,522
5. Unfunded Actuarial Liability (3.d.- 4.) $ 180,873,327 $ 185,847,870
6. Funded Ratio (4. ÷ 3.d.) 77.0% 77.1%
Anne Arundel County Employees’ Retirement Plan
10
Section II. Determination of County Contributions
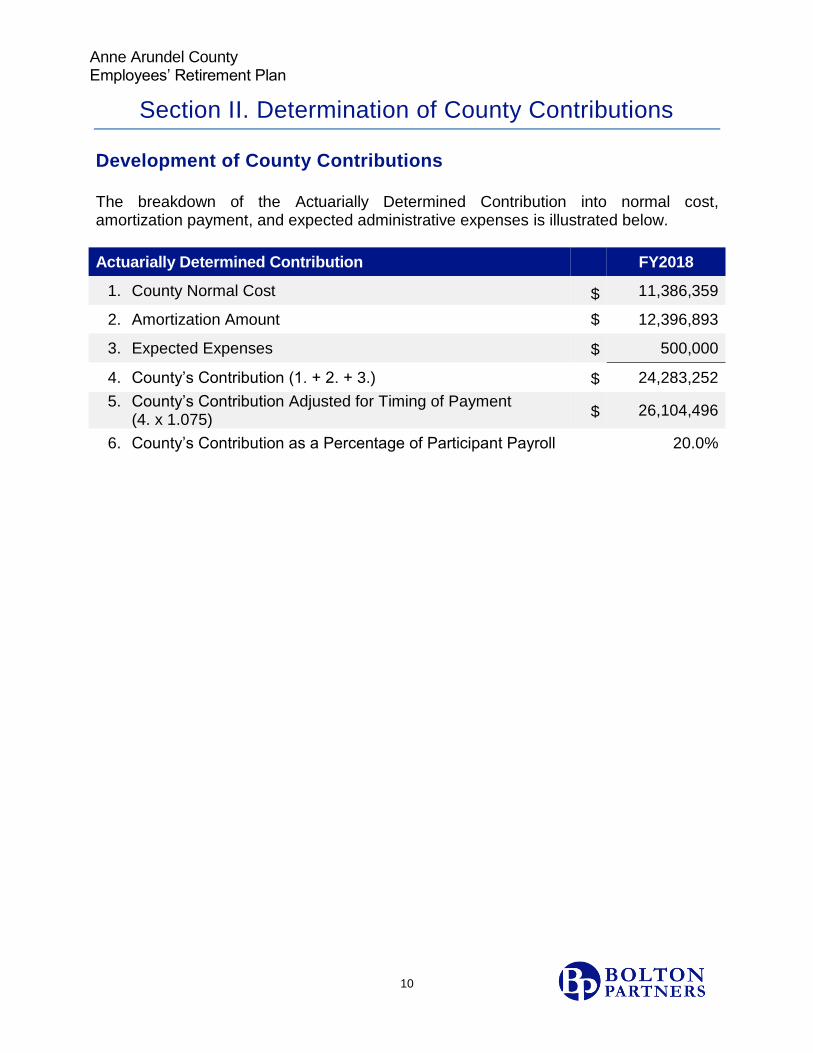
Development of County Contributions The breakdown of the Actuarially Determined Contribution into normal cost, amortization payment, and expected administrative expenses is illustrated below.
Actuarially Determined Contribution FY2018
1. County Normal Cost $ 11,386,359
2. Amortization Amount $ 12,396,893
3. Expected Expenses $ 500,000
4. County’s Contribution (1. + 2. + 3.) $ 24,283,252
5. County’s Contribution Adjusted for Timing of Payment (4. x 1.075)
$ 26,104,496
6. County’s Contribution as a Percentage of Participant Payroll 20.0%
Anne Arundel County Employees’ Retirement Plan
11
Section II. Determination of County Contributions
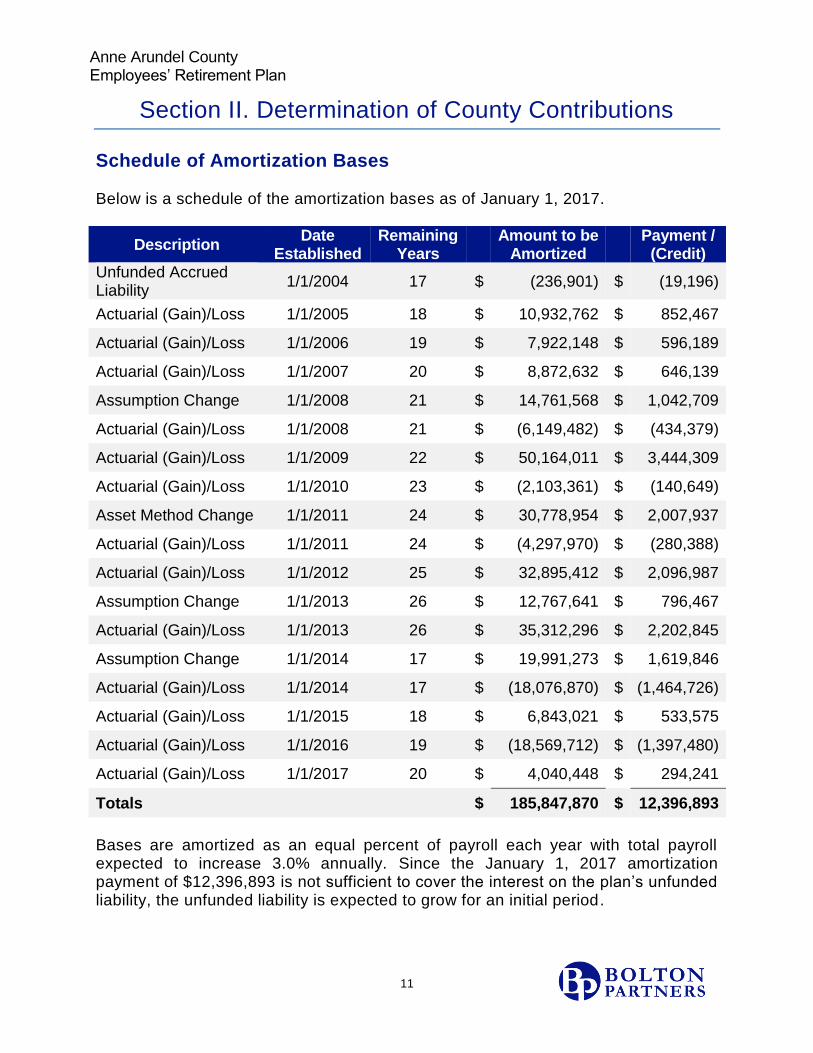
Schedule of Amortization Bases Below is a schedule of the amortization bases as of January 1, 2017.
Description Date
Established Remaining
Years
Amount to be Amortized
Payment /
(Credit) Unfunded Accrued Liability
1/1/2004 17 $ (236,901) $ (19,196)
Actuarial (Gain)/Loss 1/1/2005 18 $ 10,932,762 $ 852,467
Actuarial (Gain)/Loss 1/1/2006 19 $ 7,922,148 $ 596,189
Actuarial (Gain)/Loss 1/1/2007 20 $ 8,872,632 $ 646,139
Assumption Change 1/1/2008 21 $ 14,761,568 $ 1,042,709
Actuarial (Gain)/Loss 1/1/2008 21 $ (6,149,482) $ (434,379)
Actuarial (Gain)/Loss 1/1/2009 22 $ 50,164,011 $ 3,444,309
Actuarial (Gain)/Loss 1/1/2010 23 $ (2,103,361) $ (140,649)
Asset Method Change 1/1/2011 24 $ 30,778,954 $ 2,007,937
Actuarial (Gain)/Loss 1/1/2011 24 $ (4,297,970) $ (280,388)
Actuarial (Gain)/Loss 1/1/2012 25 $ 32,895,412 $ 2,096,987
Assumption Change 1/1/2013 26 $ 12,767,641 $ 796,467
Actuarial (Gain)/Loss 1/1/2013 26 $ 35,312,296 $ 2,202,845
Assumption Change 1/1/2014 17 $ 19,991,273 $ 1,619,846
Actuarial (Gain)/Loss 1/1/2014 17 $ (18,076,870) $ (1,464,726)
Actuarial (Gain)/Loss 1/1/2015 18 $ 6,843,021 $ 533,575
Actuarial (Gain)/Loss 1/1/2016 19 $ (18,569,712) $ (1,397,480)
Actuarial (Gain)/Loss 1/1/2017 20 $ 4,040,448 $ 294,241
Totals $ 185,847,870 $ 12,396,893
Bases are amortized as an equal percent of payroll each year with total payroll expected to increase 3.0% annually. Since the January 1, 2017 amortization payment of $12,396,893 is not sufficient to cover the interest on the plan’s unfunded liability, the unfunded liability is expected to grow for an initial period.
Anne Arundel County Employees’ Retirement Plan
12
Section III. Valuation of Assets
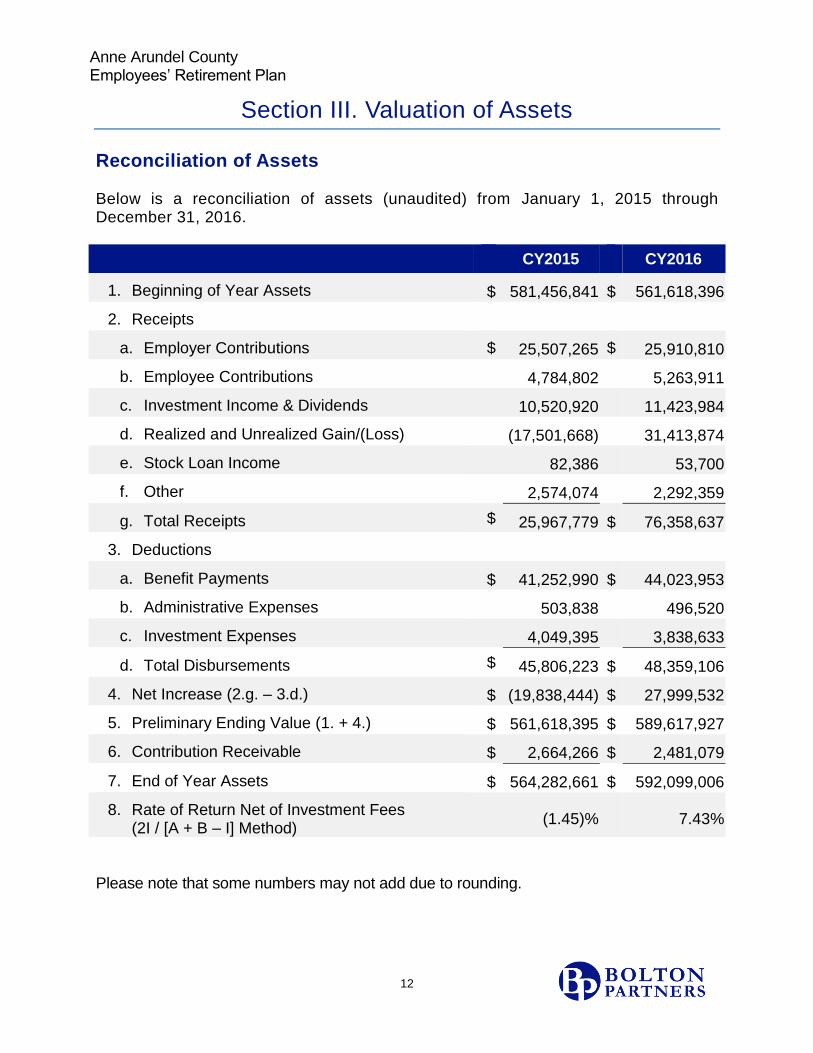
Reconciliation of Assets Below is a reconciliation of assets (unaudited) from January 1, 2015 through December 31, 2016.
CY2015 CY2016
1. Beginning of Year Assets $ 581,456,841 $ 561,618,396
2. Receipts
a. Employer Contributions $ 25,507,265 $ 25,910,810
b. Employee Contributions 4,784,802 5,263,911
c. Investment Income & Dividends 10,520,920 11,423,984
d. Realized and Unrealized Gain/(Loss) (17,501,668) 31,413,874
e. Stock Loan Income 82,386 53,700
f. Other 2,574,074 2,292,359
g. Total Receipts $ 25,967,779 $ 76,358,637
3. Deductions
a. Benefit Payments $ 41,252,990 $ 44,023,953
b. Administrative Expenses 503,838 496,520
c. Investment Expenses 4,049,395 3,838,633
d. Total Disbursements $ 45,806,223 $ 48,359,106
4. Net Increase (2.g. – 3.d.) $ (19,838,444) $ 27,999,532
5. Preliminary Ending Value (1. + 4.) $ 561,618,395 $ 589,617,927
6. Contribution Receivable $ 2,664,266 $ 2,481,079
7. End of Year Assets $ 564,282,661 $ 592,099,006
8. Rate of Return Net of Investment Fees (2I / [A + B – I] Method)
(1.45)% 7.43%
Please note that some numbers may not add due to rounding.

Anne Arundel County Employees’ Retirement Plan
13
Section III. Valuation of Assets
Calculation of Actuarial Asset Value The actuarial asset value as of January 1, 2017 is determined by spreading the asset gain or loss for each year over a five-year period. The asset gain or loss is the amount by which the actual asset return differs from the expected asset return. 1/1/2017
1. Market Value of Assets $ 592,099,006
2. Spreading of Investment (Gain)/Loss
Calendar
Year (Gain)/Loss % Deferred Amount Deferred
2016 $ 468,580 80% $ 374,864
2015 51,745,913 60% 31,047,548
2014 14,263,804 40% 5,705,522
2013 (10,397,092) 20% (2,079,418)
a. Total Deferred 35,048,516
3. Actuarial Value of Assets (1. + 2.a.) $ 627,147,522
4. Rate of Return Net of Investment Fees (2I / [A + B – I] Method)
6.1%

Anne Arundel County Employees’ Retirement Plan
14
Section IV. Participant Information
Participant Summary The following table summarizes the counts, ages and benefit information for plan participants used in this valuation.
1/1/2016 1/1/2017
1. Actives
a. Number 2,186 2,187
b. Average Age 48.9 48.8
c. Average Service 12.4 12.0
d. Average Salary $ 58,475 $ 59,585
2. Service Retirements and Beneficiaries
a. Number 1,710 1,807
b. Average Age 68.7 68.9
c. Total Annual Benefits $ 41,364,245 $ 44,606,634
3. Vested Terminations
a. Number 276 278
b. Average Age 49.4 49.7
c. Total Annual Benefits $ 2,492,719 $ 2,867,321

Anne Arundel County Employees’ Retirement Plan
15
Section IV. Participant Information
Active Age/Service Distribution Including Compensation Shown below is the distribution of active participants based on age and service. The compensation shown is the average rate of pay as of January 1, 2017.
Years of Service as of 01/01/2017
Age
Under 1 1-4 5-9 10-14 15-19 20-24 25-29 30-34 35-39
40 & Up Total
Under 25
16 19 1 - - - - - - - 36
34,745 35,358 6,412 - - - - - - - 34,282
25 - 29 34 86 16 3 - - - - - - 139
38,304 43,813 45,618 54,739 - - - - - - 42,909
30 - 34 29 76 47 17 1 - - - - - 170
47,781 49,145 52,173 50,231 59,213 - - - - - 49,917
35 - 39 23 69 48 48 17 - - - - - 205
59,148 60,867 53,984 54,312 52,635 - - - - - 56,845
40 - 44 22 72 40 45 41 11 1 - - - 232
58,412 62,290 55,848 61,412 62,759 65,942 65,362 - - - 60,911
45 - 49 11 52 51 59 45 29 28 - - - 275
53,644 56,364 50,591 63,337 63,788 67,021 69,463 - - - 60,353
50 - 54 23 55 59 62 71 35 47 18 5 - 375
52,180 45,749 57,269 63,812 68,666 72,519 73,203 64,046 65,354 - 62,360
55 - 59 17 49 62 74 56 39 59 24 14 4 398
54,611 54,441 55,924 62,039 70,236 71,140 77,822 77,494 69,221 78,764 65,571
60 - 64 6 37 35 32 26 21 23 13 15 17 225
51,000 51,459 55,319 63,086 76,604 62,464 81,039 84,797 74,583 74,550 65,870
65 - 69 2 15 6 20 19 9 11 4 4 1 91
29,037 25,116 72,216 72,371 69,931 99,493 70,213 39,286 112,367 116,027 66,315
70 & Up
4 4 8 4 11 4 1 2 2 1 41
9,938 16,280 42,659 56,193 66,264 55,604 7,694 52,862 53,695 65,749 46,556
Totals 187 534 373 364 287 148 170 61 40 23 2,187
48,191 51,161 54,023 61,439 67,092 70,346 74,625 71,769 74,287 76,704 59,585
Averages
Age 48.8
Service 12.0
Anne Arundel County Employees’ Retirement Plan
16
Section IV. Participant Information
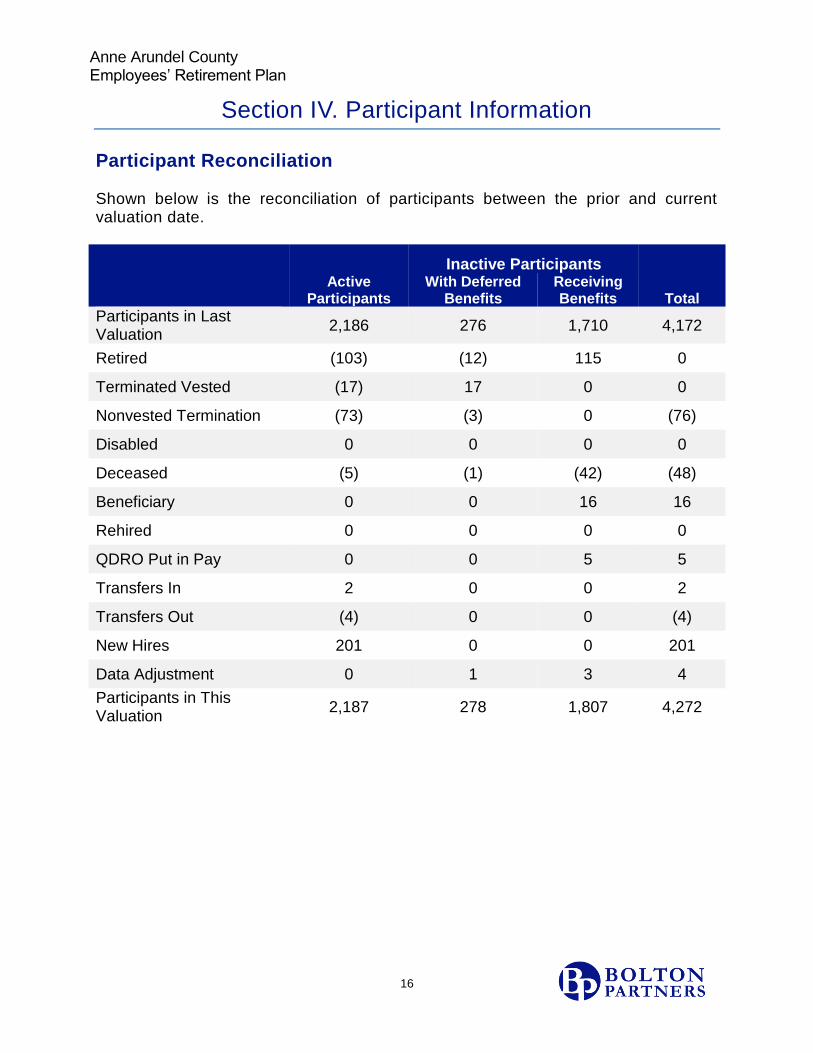
Participant Reconciliation Shown below is the reconciliation of participants between the prior and current valuation date.
Inactive Participants
Active
Participants With Deferred
Benefits Receiving Benefits Total
Participants in Last Valuation
2,186 276 1,710 4,172
Retired (103) (12) 115 0
Terminated Vested (17) 17 0 0
Nonvested Termination (73) (3) 0 (76)
Disabled 0 0 0 0
Deceased (5) (1) (42) (48)
Beneficiary 0 0 16 16
Rehired 0 0 0 0
QDRO Put in Pay 0 0 5 5
Transfers In 2 0 0 2
Transfers Out (4) 0 0 (4)
New Hires 201 0 0 201
Data Adjustment 0 1 3 4
Participants in This Valuation
2,187 278 1,807 4,272

Anne Arundel County Employees’ Retirement Plan
17
Section V. Summary of Plan Provisions
Members in Tier 1
Plan Year
January 1 – December 31.
Normal Retirement Age
Age 60 and vested, or if earlier, when the participant has reached 30 years of service.
Early Retirement Age
Age 50 and the completion of 20 years of service.
Normal Form of Benefit
Monthly life annuity with modified cash refund.
Post Retirement Cost of Living Increases Simple for Benefits Accrued as of 1/31/97
Retiree benefits are adjusted each year. The revised benefit amount is the lesser of: a. Prior year benefit plus base benefit multiplied by increase in current CPI
from CPI for prior year, or b. Benefit increased by 3% of original benefit.
Compound for Benefits Accrued after 1/31/97
Retiree benefits are adjusted each year. The revised benefit amount is the lesser of: a. Prior year benefit multiplied by 60% of the increase in the current March
CPI from March CPI for prior year, or b. Benefit increased by 2.5%.
Employee Contibutions 4% of compensation.
Anne Arundel County Employees’ Retirement Plan
18
Section V. Summary of Plan Provisions
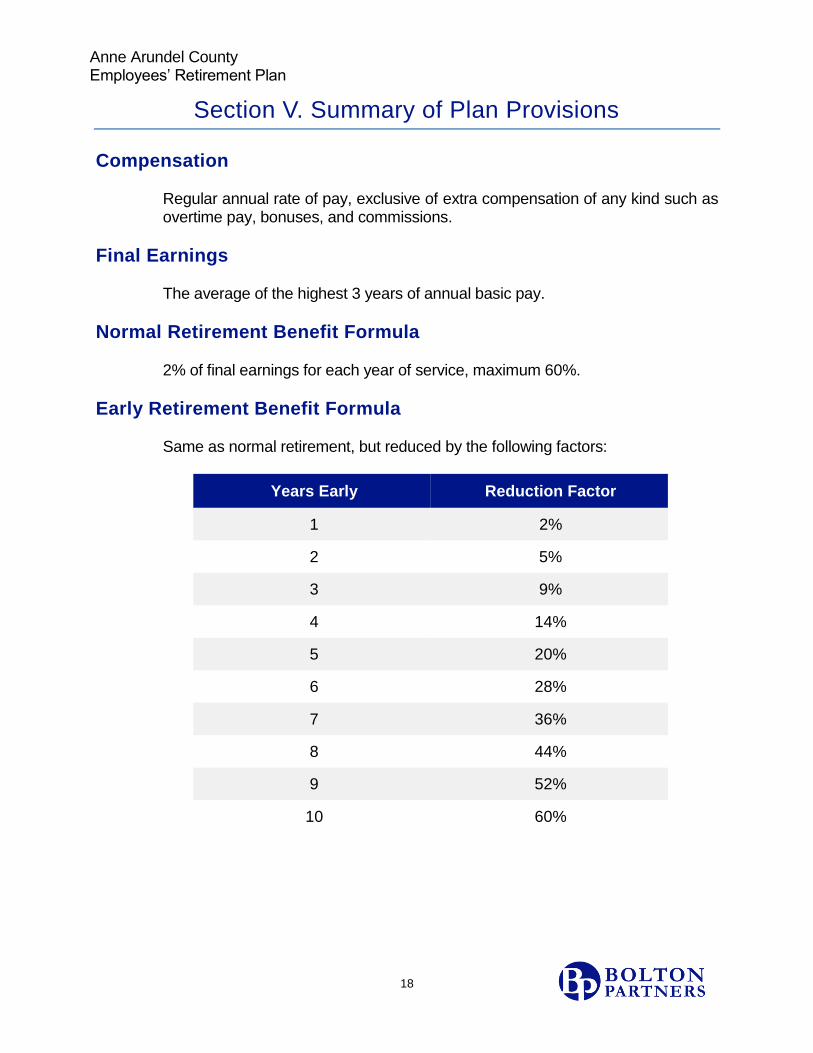
Compensation
Regular annual rate of pay, exclusive of extra compensation of any kind such as overtime pay, bonuses, and commissions.
Final Earnings
The average of the highest 3 years of annual basic pay.
Normal Retirement Benefit Formula
2% of final earnings for each year of service, maximum 60%.
Early Retirement Benefit Formula
Same as normal retirement, but reduced by the following factors:
Years Early Reduction Factor
1 2%
2 5%
3 9%
4 14%
5 20%
6 28%
7 36%
8 44%
9 52%
10 60%
Anne Arundel County Employees’ Retirement Plan
19
Section V. Summary of Plan Provisions
Termination Prior to Retirement Less than 5 Years of Service
Return of employee contributions with 4.25% interest. 5 Years of Service or more
For employees hired before July 1, 2015, at the discretion of the employee, either a return of contributions with interest or the accrued normal retirement benefit taking into account final earnings and service at date of termination, payable at normal retirement date. For employees hired on or after July 1, 2015 and County Council, appointed exempt employees, and County Executives hired on or after December 1, 2014, return of employee contributions with 4.25% interest.
10 Years of Service or more
For employees hired on or after July 1, 2015 and County Council members whose first term begins on or after December 1, 2014, at the discretion of the employee, either a return of contributions with interest or the accrued normal retirement benefit taking into account final earnings and service at date of termination, payable at normal retirement date.
Disability
Must be totally and permanently disabled (except as the result of activities specified in the County code) regardless of length of service.
Line of Duty Disability
The greater of the accrued benefit or 66 2/3% of final earnings, payable immediately, unreduced.
Non-Line of Duty Disability
Five years of service are required to receive non-duty benefits. The greater of the accrued benefit or 25% of final earnings, payable immediately, unreduced.

Anne Arundel County Employees’ Retirement Plan
20
Section V. Summary of Plan Provisions
Pre-Retirement Spouse’s Benefit Married and Eligible for Early Retirement
The greatest of:
$10 per month
50% of the final earnings
The accrued benefit, reduced actuarially for early commencement and the joint and 100% survivor form.
Other Pre-Retirement Death Benefits
Return of employee contributions with 4.25% interest plus a lump sum of 50% of final earnings.
Changes Since Prior Valuation
None.
Members in Tier 2
Plan Year
January 1 – December 31.
Normal Retirement Age
Age 60 and vested, or if earlier, when the participant has reached 30 years of service.
Early Retirement Age
Age 50 and the completion of 20 years of service.

Anne Arundel County Employees’ Retirement Plan
21
Section V. Summary of Plan Provisions
Normal Form of Benefit
Monthly life annuity.
Post Retirement Cost of Living Increases Compound for Benefits Accrued after 1/31/97
Retiree benefits are adjusted each year. The revised benefit amount is the lesser of: a. Prior year benefit multiplied by 60% of the increase in the current March
CPI from March CPI for prior year, or b. Benefit increased by 2.5%.
Employee Contibutions
No employee contributions required or allowed.
Compensation
Regular annual rate of pay, exclusive of extra compensation of any kind such as overtime pay, bonuses, and commissions.
Final Earnings
The average of the highest 3 years of the last 5 years of annual basic pay.
Normal Retirement Benefit Formula
1.0% of final earnings for each year of service.
Early Retirement Benefit Formula
Same as normal retirement, but reduced for early commencement (using the same factors as Tier 1).

Anne Arundel County Employees’ Retirement Plan
22
Section V. Summary of Plan Provisions
Termination Prior to Retirement Less than 5 Years of Service
No benefit is payable. 5 Years of Service or more
For employees hired before July 1, 2015, the accrued normal retirement benefit taking into account final earnings and service at date of termination, payable at normal retirement date. For employees hired on or after July 1, 2015 and County Council, appointed exempt employees, and County Executives hired on or after December 1, 2014, return of employee contributions with 4.25% interest.
10 Years of Service or more
For employees hired on or after July 1, 2015 and County Council members whose first term begins on or after December 1, 2014, the accrued normal retirement benefit taking into account final earnings and service at date of termination, payable at normal retirement date.
Disability
Must be totally and permanently disabled (except as the result of activities specified in the County code) regardless of length of service.
Line of Duty Disability
The greater of the accrued benefit or 66 2/3% of final earnings, payable immediately, unreduced.
Non-Line of Duty Disability
Five years of service are required to receive non-duty benefits. The greater of the accrued benefit or 25% of final earnings, payable immediately, unreduced.
Anne Arundel County Employees’ Retirement Plan
23
Section V. Summary of Plan Provisions
Pre-Retirement Spouse’s Benefit Married and Eligible for Early Retirement
The greatest of:
$10 per month
50% of the final earnings
The accrued benefit, reduced actuarially for early commencement and the joint and 100% survivor form.
Unmarried or not Eligible for Early Retirement
A lump sum of 50% of final earnings.
Changes Since Prior Valuation
None.

Anne Arundel County Employees’ Retirement Plan
24
Section VI. Actuarial Methods and Assumptions
Funding Method
Projected Unit Credit Actuarial Cost Method. The contribution equals the sum of the normal cost and the amount necessary to amortize the unfunded actuarial liabilities and any actuarial gains or losses over a period of years. Amortization payments increase 3.0%.
Asset Method
Asset smoothing method which spreads the investment gains or losses in excess of the assumed return over a five-year period. Actuarial Value of Assets recognizes adjustments resulting from an audit.
Interest
7.5% compounded annually, net of investment expenses.
Post Retirement COLA Increases
Benefits accrued before Bill 88-96 are assumed to increase by 3.0% of the original benefit each year from retirement. Benefits accrued after Bill 88-96 are assumed to increase by 1.8% of the current benefit each year from retirement.
Anne Arundel County Employees’ Retirement Plan
25
Section VI. Actuarial Methods and Assumptions
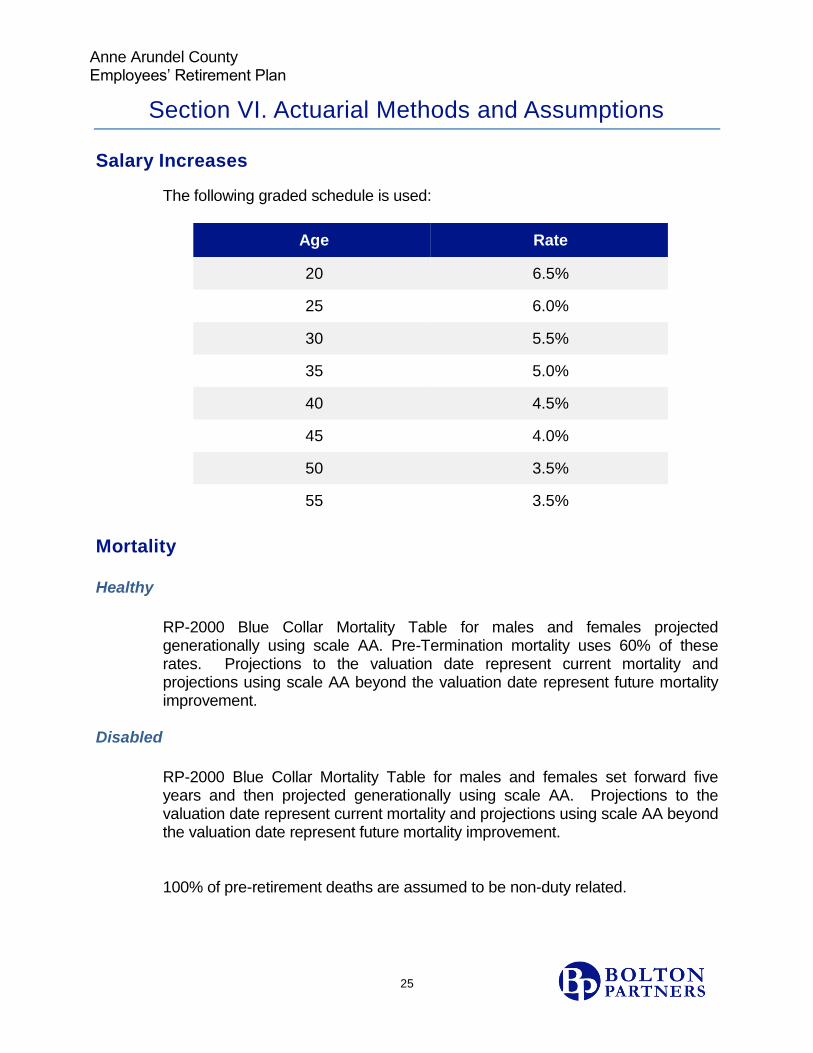
Salary Increases
The following graded schedule is used:
Age Rate
20 6.5%
25 6.0%
30 5.5%
35 5.0%
40 4.5%
45 4.0%
50 3.5%
55 3.5%
Mortality Healthy
RP-2000 Blue Collar Mortality Table for males and females projected generationally using scale AA. Pre-Termination mortality uses 60% of these rates. Projections to the valuation date represent current mortality and projections using scale AA beyond the valuation date represent future mortality improvement.
Disabled
RP-2000 Blue Collar Mortality Table for males and females set forward five years and then projected generationally using scale AA. Projections to the valuation date represent current mortality and projections using scale AA beyond the valuation date represent future mortality improvement. 100% of pre-retirement deaths are assumed to be non-duty related.
Anne Arundel County Employees’ Retirement Plan
26
Section VI. Actuarial Methods and Assumptions
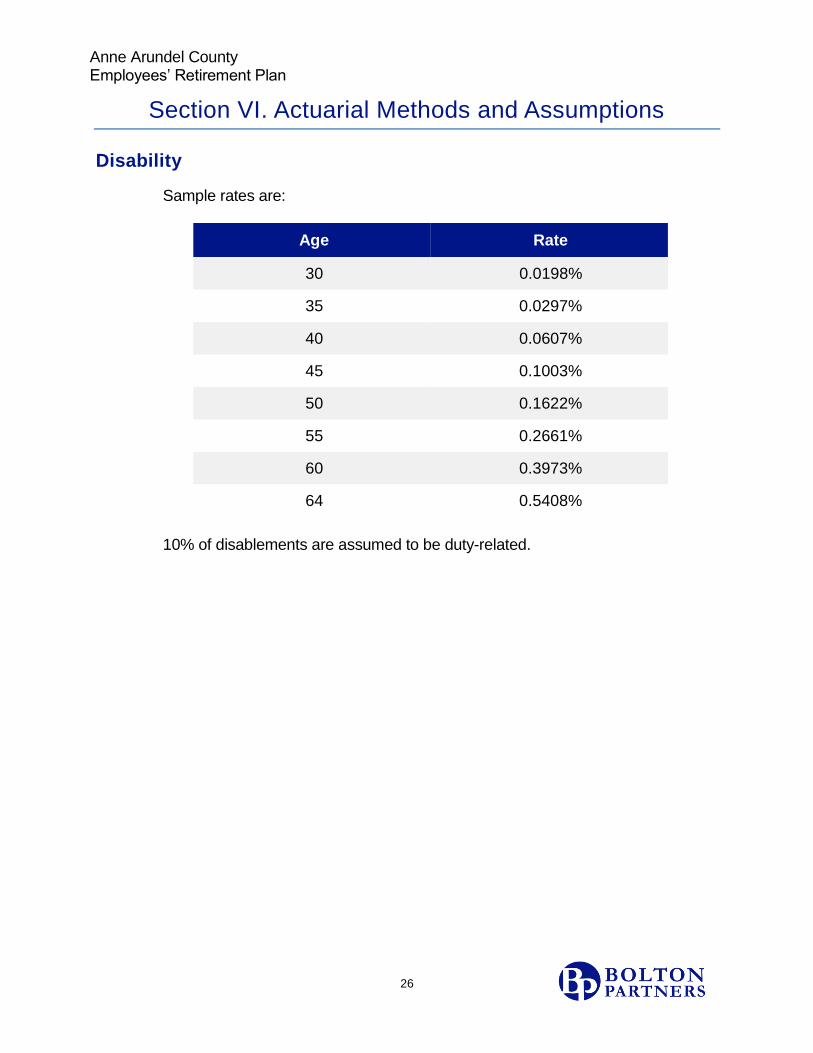
Disability
Sample rates are:
Age Rate
30 0.0198%
35 0.0297%
40 0.0607%
45 0.1003%
50 0.1622%
55 0.2661%
60 0.3973%
64 0.5408%
10% of disablements are assumed to be duty-related.
Anne Arundel County Employees’ Retirement Plan
27
Section VI. Actuarial Methods and Assumptions
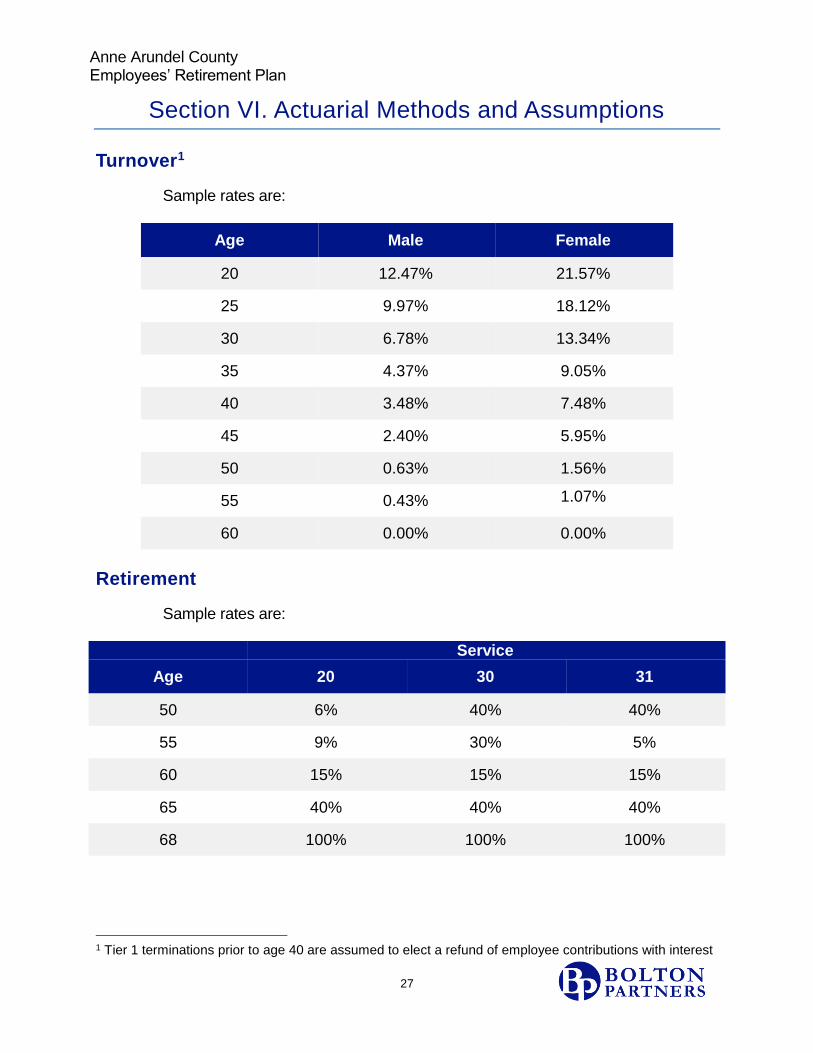
Turnover1
Sample rates are:
Age Male Female
20 12.47% 21.57%
25 9.97% 18.12%
30 6.78% 13.34%
35 4.37% 9.05%
40 3.48% 7.48%
45 2.40% 5.95%
50 0.63% 1.56%
55 0.43% 1.07%
60 0.00% 0.00%
Retirement
Sample rates are: Service
Age 20 30 31
50 6% 40% 40%
55 9% 30% 5%
60 15% 15% 15%
65 40% 40% 40%
68 100% 100% 100%
1 Tier 1 terminations prior to age 40 are assumed to elect a refund of employee contributions with interest
Anne Arundel County Employees’ Retirement Plan
28
Section VI. Actuarial Methods and Assumptions
Disability Leave
Active liabilities (which depend on credited service) are loaded by 1.5% to account for future crediting of disability service.
Military Service
Active liabilities (which depend on credited service) are loaded by 1% to account for future crediting of military service.
Marriage
It is assumed that 70% of employees are married. Husbands are assumed to be 4 years older than wives.
Other Methods and Assumptions
A load for estimated administrative expenses is included in the Actuarially Determined Contribution. The load is equal to the average of actual expenses for the two years preceding the valuation date, rounded to the nearest thousand. Males are assumed to be four years older than their spouses. The Tier 1 service cap of 60% is valued as 62% to account for Disability and Military service credit not being limited by the 30-year cap on service. Actual military service information for actives is not available. Members are assumed to stay in their current tier. The rationale for the demographic assumptions is based on the results of the December 2012 Experience Study. The economic assumptions are based on future expectations with an underlying 3.0% inflation assumption.
Changes Since Prior Valuation
None.

Anne Arundel County Employees’ Retirement Plan
29
Section VII. Glossary
Actuarial Accrued Liability (AAL) The difference between the Actuarial Present Value of Future Benefits and the Actuarial Present Value of Future Normal Costs or the portion of the present value of future benefits allocated to service before the valuation date in accordance with the actuarial cost method. Represents the present value of benefits expected to be paid from the plan in the future allocated to service prior to the date of the measurement.
Actuarial Asset Valuation Method The method of determining the value of
the assets as of a given date, used by the actuary for valuation purposes. This may be the market or fair value of plan assets or a smoothed value in order to reduce the year-to-year volatility of calculated results, such as the funded ratio and the actuarially determined contribution (ADC).
Actuarial Cost Method A procedure for allocating the Actuarial resent Value of Future Benefits and the actuarial Present Value of Future Normal costs and the Actuarial Accrued Liability. Also known as the “funding method”. Examples of actuarial cost methods include Aggregate, Entry Age Normal, Projected Unit Credit, and Pay-as-you-go.
Anne Arundel County Employees’ Retirement Plan
30
Section VII. Glossary
Actuarial Present Value of Future
Benefits (APVFB) The Actuarial Present Value of amounts which are expected to be paid at various future times to active members, retired members, beneficiaries receiving benefits, and inactive, nonretired members entitled to either a refund or a future retirement benefit. Expressed another way, it is the value that would have to be invested on the valuation date so that the amount invested plus investment earnings would provide sufficient assets to pay all projected benefits and expenses when due.
Aggregate Cost Method An actuarial cost method that spreads the cost of all future benefits in excess of plan assets as a level percentage of future salary or service. The actuarial accrued liability is set to the value of assets in this method.
Annual Determined Contributions of the
Employer(s) (ADC) The employer’s periodic determined contributions to a pension plan, calculated in accordance with the assumptions and methods used by the plan actuary. The ADC replaced the actuarially required contribution (ARC), with the replacement of GASB 27 with GASB 68.
Cost-of-Living Adjustment (COLA) An annual increase in the amount of a retired participant’s benefit intended to adjust the benefit for inflation.
Covered Group Plan members included in actuarial valuation.

Anne Arundel County Employees’ Retirement Plan
31
Section VII. Glossary
Deferred Retirement Option Program
(DROP) A program allowing a participant eligible to retire to continue working for a fixed period of time, while accumulating the benefit payments he would have received if he had retired on his entry to DROP.
Demographic Assumption Assumptions regarding the future population of pension participants, including retirement, termination, disability and mortality assumptions.
Economic Assumption Assumptions regarding future economic factors, including COLA, salary improvement, change in average wages, changes in Social Security benefits and investment returns.
Employer’s Contributions Contributions made in relation to the actuarially determined contributions of the employer (ADC). An employer has made a contribution in relation to the ADC if the employer has (a) made payments of benefits directly to or on behalf of a retiree or beneficiary, (b) made premium payments to an insurer, or (c) irrevocably transferred assets to a trust, or an equivalent arrangement, in which plan assets are dedicated to providing benefits to retirees and their beneficiaries in accordance with the terms of the plan and are legally protected from creditors of the employer(s) or plan administrator.

Anne Arundel County Employees’ Retirement Plan
32
Section VII. Glossary
Entry Age Normal (EAN) Cost Method An actuarial cost method that spreads the cost for each individual’s expected benefits over their career, either as a level percentage of pay or service. The actuarial accrued liability is the accumulated value of all past normal cost, and the unfunded accrued liability (surplus) is the excess of the AAL over the value of assets.
Expenses Plan expenses paid by the plan are divided into administrative and investment related expenses.
Funded Ratio The actuarial value of assets expressed as a percentage of the plan’s actuarial accrued liability.
GASB Government Accounting Standards Board.
GASB No. 25 and GASB No. 27 These are the government accounting
standards that set the accounting rules for public retirement systems and the employers that sponsor or contribute to them. Statement No. 27 sets the accounting rules for the employers that sponsor or contribute to public retirement systems while Statement No. 25 sets the rules for the systems themselves.
GASB No. 67 and GASB No. 68 These are the government standards that replace GASB 25 and 27 They are effective for plan years beginning after June 14, 2013 and employer fiscal years beginning after June 14, 2014.
Investment Return Assumption or Investment Rate of Return (Discount
Rate) The rate used to adjust a series of future payments to reflect the time value of money.
Anne Arundel County Employees’ Retirement Plan
33
Section VII. Glossary
Level Percentage of Projected Payroll
Amortization Method Amortization payments are calculated so that they are a constant percentage of the projected payroll of active plan members over a given number of years. The dollar amount of the payments generally will increase over time as payroll increases due to inflation; in dollars adjusted for inflation, the payments can be expected to remain level.
Normal Cost or Normal Actuarial Cost That portion of the Actuarial Present Value of pension plan benefits and expenses which is allocated to a valuation year by the Actuarial Cost Method.
Pay-as-you-go (PAYG) A method of financing a benefits plan under which the contributions to the plan are generally made at about the same time and in about the same amount as benefit payments and expenses becoming due.
Payroll Growth Rate An actuarial assumption with respect to future increases in total covered payroll attributable to inflation; used in applying the level percentage of projected payroll amortization method.
Plan Liabilities Obligations payable by the plan at the reporting date, including, primarily, benefits and refunds due and payable to plan members and beneficiaries, and accrued investment and administrative expenses. Plan liabilities do not include actuarial accrued liabilities for benefits that are not due and payable at the reporting date.

Anne Arundel County Employees’ Retirement Plan
34
Section VII. Glossary
Plan Members The individuals covered by the terms of a Pension or OPEB plan. The plan membership generally includes employees in active service, terminated employees who have accumulated benefits but are not yet receiving them, and retired employees and beneficiaries currently receiving benefits.
Projected Unit Credit (PUC) Funding
Method An actuarial cost method that spreads the employee’s benefit over their career, as a level percentage of service. The normal cost is the present value of the portion of the benefit assigned to the current year. The actuarial accrued liability is the accumulated value of all past normal cost, and the unfunded accrued liability (surplus) is the excess of the AAL over the value of assets.
Post-Employment The period between termination of employment and retirement as well as the period after retirement.
Salary Improvement An actuarial assumption regarding the increase in employees’ salaries, reflecting cost-of-living, merit and longevity increases.
Select and Ultimate Rates Actuarial assumptions that contemplate different rates for successive years. Instead of a single assumed rate with respect to, for example, the investment return assumption, the actuary may apply different rates for the early years of a projection and a single rate for all subsequent years. For example, if an actuary applies an assumed investment return of 8 percent for year 2000, 7.5 percent for 2001, and 7 percent for 2002 and thereafter, then 8 percent and 7.5 percent are select rates, and 7 percent is the ultimate rate.
Anne Arundel County Employees’ Retirement Plan
35
Section VII. Glossary
Unfunded Actuarial Accrued
Liabilities The excess of the present value of prospective pension benefits, as of the date of a pension plan valuation, over the sum of (1) the actuarial value of the assets of the plan and (2) the present value of future normal costs determined by any of several actuarial cost methods. For plans that define an accrued liability, this amount equals the excess of the accrued liability over plan assets.
Vested Plan Benefits All benefits to which current participants have a vested right based on pay and service through the valuation date. A participant has a vested right to a benefit if he/she would still be eligible to receive that benefit if employment terminated on the valuation date.

Anne Arundel County Employees’ Retirement Plan
36
Appendix 1
Summary of Funding Progress
Valuation Date
(1) Actuarial Value
of Assets
(2) Actuarial Accrued Liability
(3) Percentage
Funded (1) / (2)
(4) Unfunded Actuarial Accrued Liability (2) - (1)
(5) Annual
Covered Payroll
(6) Unfunded
Actuarial Accrued Liability as a Percentage of Covered
Payroll (4) / (5)
1/1/2008 $492,788,674 $526,341,482 93.6% $33,552,808 $117,222,681 28.6%
1/1/2009 $488,275,803 $568,194,980 85.9% $79,919,177 $124,803,488 64.0%
1/1/2010 $519,556,093 $598,841,131 86.8% $79,285,038 $126,030,706 62.9%
1/1/2011 $522,165,144 $627,269,587 83.2% $105,104,443 $123,498,129 85.1%
1/1/2012 $516,070,401 $653,653,058 79.0% $137,582,657 $120,415,534 114.3%
1/1/2013 $508,232,321 $693,580,675 73.3% $185,348,354 $116,024,717 159.7%
1/1/2014 $545,812,384 $735,729,033 74.2% $189,916,649 $115,809,426 164.0%
1/1/2015 $582,795,438 $781,105,960 74.6% $198,310,522 $127,090,869 156.0%
1/1/2016 $604,433,282 $785,306,609 77.0% $180,873,327 $127,827,040 141.5%
1/1/2017 $627,147,522 $812,995,392 77.1% $185,847,870 $130,312,665 142.6%
Analysis of the dollar amounts of net assets available for benefits, actuarial accrued liability, and unfunded actuarial accrued liability in isolation can be misleading. Expressing the net assets available for benefits as a percentage of the actuarial accrued liability provides one indication of funding status on a going-concern basis. Analysis of this percentage over time indicates whether the plan is becoming financially stronger or weaker. Generally, the greater this percentage, the stronger the plan. Trends in unfunded actuarial accrued liability and annual covered payroll are both affected by inflation. Expressing the unfunded actuarial accrued liability as a percentage of annual covered payroll approximately adjusts for the effects of inflation and aids analysis of Anne Arundel County’s progress made in accumulating sufficient assets to pay benefits when due. Generally, the smaller this percentage, the stronger the plan.

Anne Arundel County Employees’ Retirement Plan
37
Appendix 1
Summary of Contributions
Year Ended December 31 Actuarially Determined
Contribution Percentage Contributed
2014 $24,426,165 100.1%
2015 $25,654,839 99.9%
2016 $25,809,828 100%
The information presented in the required supplementary schedules was determined as part of the actuarial valuations at the dates indicated. Additional information as of the latest actuarial valuation follows. Actuarial cost method Projected unit credit Amortization Method Level percentage of pay, closed Remaining amortization period Remaining amortization periods
range from 17 to 26 years with an average effective period of 24 years. Starting with new bases in 2014, Assumption changes and gains and losses are amortized over 20 years and plan changes are amortized over the average future service of the active population at the time of change.
Asset valuation method Five-year smoothed method Actuarial assumptions:
Investment rate of return 7.5% Projected salary increase Varies by age
Post-retirement cost-of-living adjustments 3.0% for pre 2/97 accruals 1.8% for post 2/97 accruals

Anne Arundel County Employees’ Retirement Plan
38
Appendix 2
Benefit Payment Projection
The following table shows the estimated benefit payments from January 1, 2017 through December 31, 2026 based on existing members of the plan.
Calendar Year Benefits
2017 48,935,000
2018 51,832,000
2019 54,791,000
2020 57,610,000
2021 60,313,000
2022 63,138,000
2023 65,935,000
2024 68,651,000
2025 71,268,000
2026 73,903,000
Anne Arundel County Employees’ Retirement Plan
39
Appendix 3
Risk Metrics
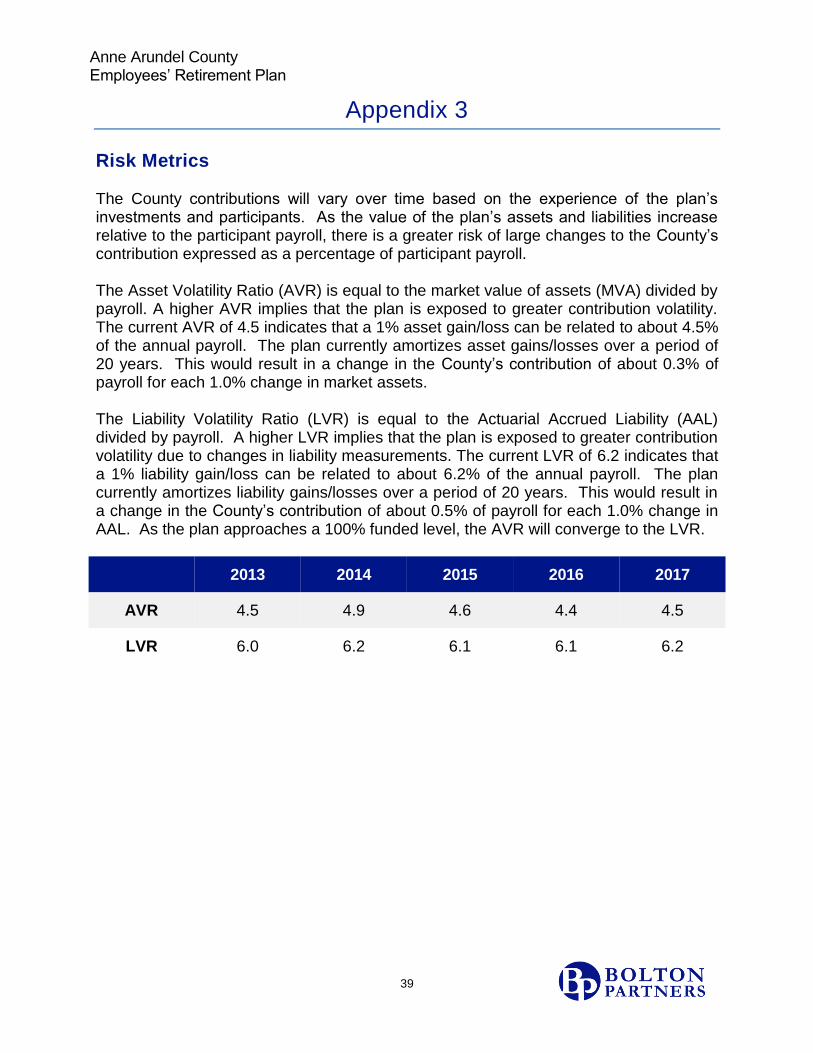
The County contributions will vary over time based on the experience of the plan’s investments and participants. As the value of the plan’s assets and liabilities increase relative to the participant payroll, there is a greater risk of large changes to the County’s contribution expressed as a percentage of participant payroll. The Asset Volatility Ratio (AVR) is equal to the market value of assets (MVA) divided by payroll. A higher AVR implies that the plan is exposed to greater contribution volatility. The current AVR of 4.5 indicates that a 1% asset gain/loss can be related to about 4.5% of the annual payroll. The plan currently amortizes asset gains/losses over a period of 20 years. This would result in a change in the County’s contribution of about 0.3% of payroll for each 1.0% change in market assets. The Liability Volatility Ratio (LVR) is equal to the Actuarial Accrued Liability (AAL) divided by payroll. A higher LVR implies that the plan is exposed to greater contribution volatility due to changes in liability measurements. The current LVR of 6.2 indicates that a 1% liability gain/loss can be related to about 6.2% of the annual payroll. The plan currently amortizes liability gains/losses over a period of 20 years. This would result in a change in the County’s contribution of about 0.5% of payroll for each 1.0% change in AAL. As the plan approaches a 100% funded level, the AVR will converge to the LVR.
2013 2014 2015 2016 2017
AVR 4.5 4.9 4.6 4.4 4.5
LVR 6.0 6.2 6.1 6.1 6.2

Anne Arundel County Employees’ Retirement Plan
40
Appendix 4
SUMMARY OF MAJOR LEGISLATIVE CHANGES County Council Bill No. 36-89 Effective 7/1/89.
Pension benefits and vesting provisions were improved. The accrual percentage per year of service was increased from 1.8% to 2.0%, permitting accrual of the maximum 60% benefit in 30 years instead of 33-1/3.
Full vesting was granted after 5 years of service. The old provisions used a graded scale granting 75% vesting after 10 years, climbing to 100% vesting after 15 years.
County Council Bill No. 34-92 Effective 6/1/92 through 8/31/92.
Participants age 50 or older with at least 20 years of service could elect to retire with an additional pension equal to 1/12 of 2% for each year of credited service. The additional amount could be taken as a pension increase, a lump sum, or as a temporary supplement to age 62. Appropriate actuarial adjustments apply.
State House Bill No. 687 Effective 7/1/90.
County employees were given the opportunity to apply for credit under the County’s plan for previous service with the State of Maryland (or a political subdivision of the State).

Anne Arundel County Employees’ Retirement Plan
41
Appendix 4
County Council Bill 90-93 Effective 12/22/93.
Plan participants are required to pay the full actuarial value for service purchases. Purchases can only be made at retirement. To be eligible, an employee must have 60 months of County service. Existing plan participants must be notified of their right to purchase service under existing law.
County Council Bill No. 82-94 Effective 10/31/94.
Transfers assets from general employees plan to A&E plan for participants who have transferred between these two plans.
County Council Bill No. 88-96 Effective 12/4/96.
The previous method of calculating cost of living increases will only apply to benefits accrued as of 1/31/97. The cost of living increase for future benefits is a compound increase equal to 60% of the annual change in the CPI, not to exceed 2.5%. Employees hired, or rehired, on or after 12/4/96 will be Tier Two employees and will have different benefits than current employees.

Anne Arundel County Employees’ Retirement Plan
42
Appendix 4
County Council Bill No. 41-99 Effective 6/15/99.
Employees paid under the deputy sheriff employees pay schedule become Tier Two members of the Detention Center Plan effective as of January 1, 1999. Service credited under the Employees’ Plan will count as credited service in the Detention Center Plan and no future benefit will be paid from the Employees’ Plan. Assets are transferred from the Employees’ Plan to the Detention Center Plan in an amount equal to the projected unit credit accrued liability in the Employees’ Plan.
Recodification Effective 2/25/2002. Allows a benefit based on disability
leave service and pre-plan military service to be paid over the 60% cap. Normal Retirement was changed to the earlier of 30 years of service or age 60.
County Council Bill No. 74-09 Effective 12/11/2009. For non-represented members, FY2010
annual pay shall be determined by increasing FY2009 annual pay by an assumed 3% for determining the final average basic pay.
County Council Bill No. 6-10 Effective 4/18/2010.
Provides for a disability benefit for those participants who are totally and permanently disabled as a result of qualified military service.

Anne Arundel County Employees’ Retirement Plan
43
Appendix 4
County Council Bill No. 98-12 Effective 5/13/2013. Changed the definition of “final average
basic pay” from highest 3 out of the last 5 years basic pays to higher 3 of all basic pays.
County Council Bill No. 97-13 Effective 4/14/2014. Members of the Employees’ Plan and
Category II members of the Detention and Deputy Sheriffs’ Plan hired on or after July 1, 2015 will be subject to 10 year vesting and 10 year normal retirement provisions. The 10 year requirement also affects the ability to purchase service or get credit for pre-plan military service. The 10 year requirement extends to County Council members hired on or after December 1, 2014.