angurugu remote towns jobs profile - nt.gov.au · web viewlibrary assistant. office manager....
TRANSCRIPT
Remote Towns Jobs Profile
ANGURUGU
JOBS PROFILE ANGURUGU1
© Northern Territory of Australia 2018
Preferred Reference: Department of Trade, Business and Innovation, 2017 Remote Towns Jobs Profiles, Northern Territory Government, June 2018, Darwin.
Disclaimer
The data in this publication were predominantly collected by conducting a face-to-face survey of businesses within town boundaries during mid-2017. The collection methodology was created in accordance with Australian Bureau of Statistics data quality framework principles. Data in this publication are only reflective of those businesses reported on as operating in the town at the time of data collection (see table at the end of publication for list of businesses reported on).
To comply with privacy legislation or where appropriate, some data in this publication may have been adjusted and will not reflect the actual data reported by businesses. As a result of this, combined with certain data not being reported by some businesses, some components may not add to totals. Changes over time may also reflect business' change in propensity to report on certain data items rather than actual changes over time. Total figures have generally not been adjusted.
Caution is advised when interpreting the comparisons made to the earlier 2011 and 2014 publications as the businesses identified and reported on and the corresponding jobs may differ between publications.
Notes for each table and chart are alphabetically ordered and listed at the end of the publication.
Any use of this report for commercial purposes is not endorsed by the Department of Trade, Business and Innovation
JOBS PROFILE ANGURUGU2
Contents
Angurugu........................................................................................................................ 4Introduction.................................................................................................................... 5Summary........................................................................................................................ 6Jobs Overview................................................................................................................. 7Jobs by Aboriginal Status................................................................................................8Jobs by Sector: Private and Public................................................................................10Job Status: Permanent and Temporary.........................................................................16Job Vacancies............................................................................................................... 19Jobs by Industry............................................................................................................21Jobs by Occupation.......................................................................................................26Jobs by Industry by Occupation....................................................................................29Jobs by Gender.............................................................................................................31Jobs by Age...................................................................................................................36Vocational Education and Training...............................................................................41Population..................................................................................................................... 45Community Development Programme.........................................................................47Businesses....................................................................................................................48Notes............................................................................................................................ 49Abbreviations and Acronyms........................................................................................50
JOBS PROFILE ANGURUGU3
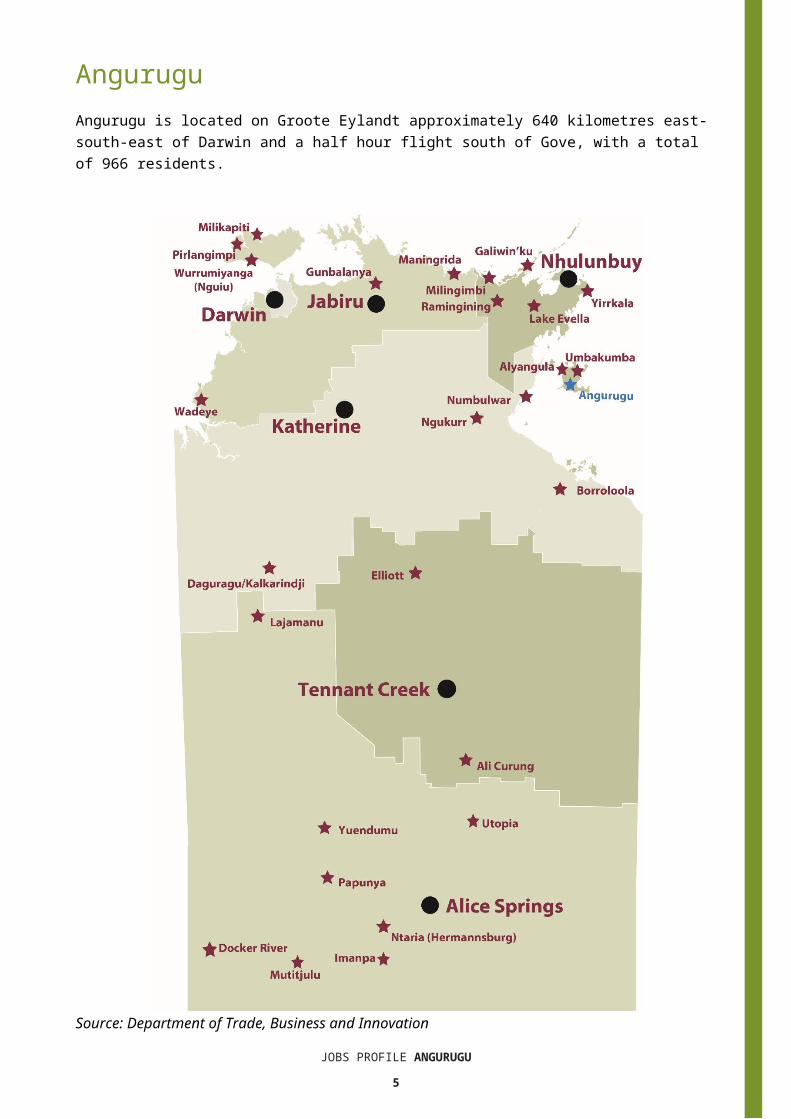
AnguruguAngurugu is located on Groote Eylandt approximately 640 kilometres east-south-east of Darwin and a half hour flight south of Gove, with a total of 966 residents.
Source: Department of Trade, Business and Innovation
JOBS PROFILE ANGURUGU4
IntroductionThis jobs profile provides a snapshot of jobs and the characteristics of job holders in Angurugu as at July 2017. It also outlines trends from the 2014 and 2011 surveys.This job profile is one of 28 profiles developed for remote towns in the Northern Territory. It is anticipated these and subsequent profiles will contribute to a robust evidence base to inform decision making in and relating to these remote Territory towns. This profile contains information collected by the Northern Territory Department of Trade, Business and Innovation from businesses operating within the town and is supplemented by other administrative data sets and information.Each profile provides up-to-date information that is intended to inform the planning and design of current and future government programs and as an evidence base to inform decision making relating to workforce development, enterprise and job opportunities.The data collection methodology and corresponding questionnaire were created in partnership with the Australian Bureau of Statistics (ABS) and in accordance with ABS data quality framework and survey principles.The surveys were predominantly conducted by the Department’s Small Business Champions and Workforce Training Coordinators, on a face-to-face basis with business representatives.The information collected and reported on represents a significant goodwill investment by those businesses and organisations that participated. Each business is listed at the end of this publication.
JOBS PROFILE ANGURUGU5
SummaryThe 2017 jobs profile was developed based on responses from 15 businesses operating within the Angurugu town boundary, three more than in the 2014 survey. Of these there were: 9 businesses from the private sector, accounting for 97 filled jobs or 54% of total
filled jobs 6 businesses from the public sector, accounting for 83 filled jobs or 46% of total
filled jobs 6 businesses participated in all three surveys (completed in 2011, 2014 and 2017).A total of 195 filled and vacant jobs in Angurugu were reported, an increase of 9 jobs from 2014.1 The 2017 profile highlights: there were 180 filled jobs of which:
o 92 jobs (51%) were filled by Aboriginal persons, a decrease of 2 jobs from 2014
o 88 jobs (49%) were filled by non-Aboriginal persons, an increase of 28 jobs from 2014
o 26% of employed Aboriginal people are working in the private sectoro Aboriginal persons accounted for 51% of job holders in the town compared to
61% in 2014o Aboriginal females made up 62% of total Aboriginal filled jobs in the town
compared to 55% in 2014 there were 15 vacant jobs, of which:
o job vacancies as a percentage of jobs decreased to 8% in 2017 from 17 % in 2014
o job vacancies equate to 1 in 13 jobso 8 of the vacancies were in the Clerical and Administrative and Professional
areas. Education and Training was the largest industry employer, with an increase in 12
filled jobs compared to 2014 the Construction industry had the greatest increase in filled jobs (39) compared to
2014 training had a decrease of 109 student numbers between 2013 and 2016 with the
largest decrease (50) in the Primary Industry training sector Community Services, Health and Education was the largest training activity sector,
although it had a decrease of 53 student numbers between 2013 and 2016.The overall population in Angurugu increased by 38 persons (5%) between 2006 and 2016 to 966 persons.
1 The number of filled jobs does not represent numbers of persons as a person may have several jobs or one job may be shared by more than one person.
JOBS PROFILE ANGURUGU6
In comparison, the overall Northern Territory population increased by 16.5% between 2006 and 2016.In 2016, the working age population (15 years and over) in Angurugu was an estimated 719 persons compared to 604 in 2006 an increase of 19%.There were 0.3 jobs in Angurugu per working age person compared to 0.4 jobs per person across the Northern Territory.
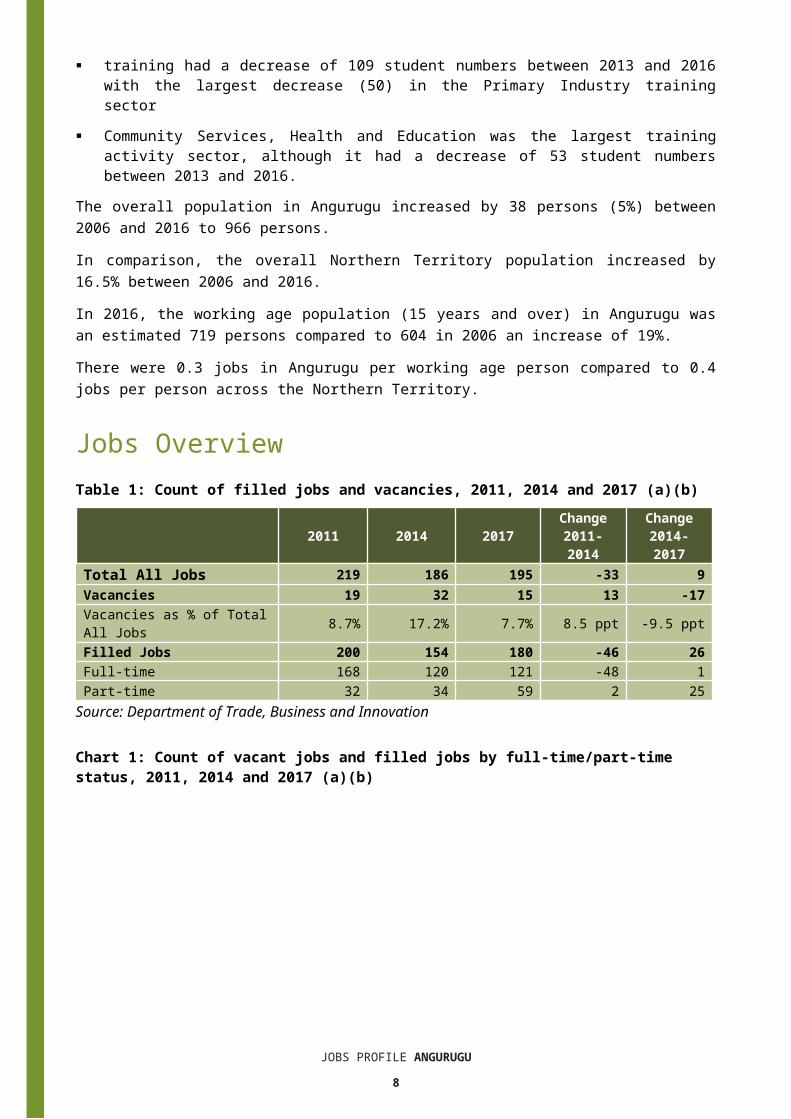
Jobs OverviewTable 1: Count of filled jobs and vacancies, 2011, 2014 and 2017 (a)(b)
2011 2014 2017Change2011-2014
Change2014-2017
Total All Jobs 219 186 195 -33 9Vacancies 19 32 15 13 -17Vacancies as % of Total All Jobs 8.7% 17.2% 7.7% 8.5 ppt -9.5 pptFilled Jobs 200 154 180 -46 26Full-time 168 120 121 -48 1Part-time 32 34 59 2 25
Source: Department of Trade, Business and Innovation
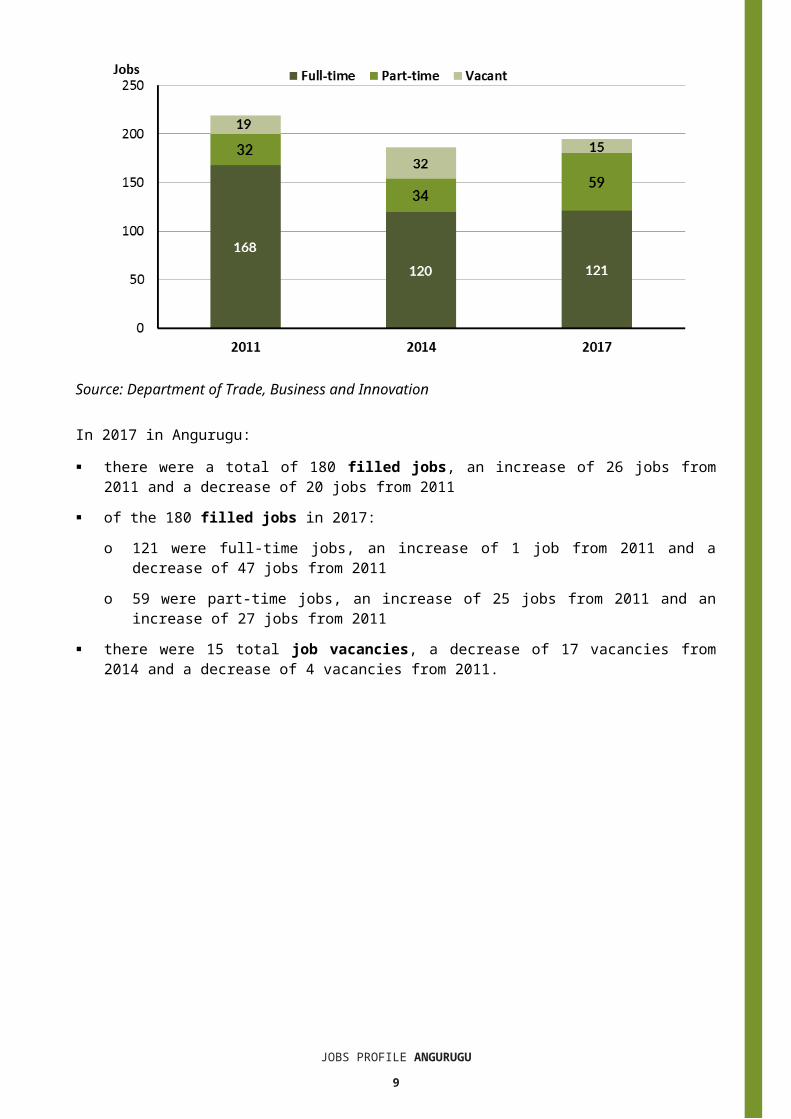
Chart 1: Count of vacant jobs and filled jobs by full-time/part-time status, 2011, 2014 and 2017 (a)(b)
Source: Department of Trade, Business and Innovation
In 2017 in Angurugu: there were a total of 180 filled jobs, an increase of 26 jobs from 2011 and a
decrease of 20 jobs from 2011 of the 180 filled jobs in 2017:
o 121 were full-time jobs, an increase of 1 job from 2011 and a decrease of 47 jobs from 2011
JOBS PROFILE ANGURUGU7
o 59 were part-time jobs, an increase of 25 jobs from 2011 and an increase of 27 jobs from 2011
there were 15 total job vacancies, a decrease of 17 vacancies from 2014 and a decrease of 4 vacancies from 2011.
JOBS PROFILE ANGURUGU8
Jobs by Aboriginal StatusChart 2: Count of filled jobs by Aboriginal status, 2011, 2014 and 2017 (a)(c)
Source: Department of Trade, Business and Innovation
In 2017 in Angurugu: of the 180 filled jobs:
o 92 jobs were filled by Aboriginal persons, a decrease of 2 jobs from 2014 and a decrease of 33 jobs from 2011
o 88 jobs were filled by non-Aboriginal persons, an increase of 28 jobs from 2014 and an increase of 13 jobs from 2011
Aboriginal persons accounted for 51% of job holders compared to 61% in 2014 and 63% in 2011.
Table 2: Count of filled jobs by full-time/part-time status and Aboriginal status of person in job, 2011, 2014 and 2017 (a)(b)(c)
Indicator
2011 2014 2017Change
2011-2014Change
2014-2017
Ab
orig
inal
Non
-Ab
orig
inal
Tot
al
Ab
orig
inal
Non
-Ab
orig
inal
Tot
al
Ab
orig
inal
Non
-Ab
orig
inal
Tot
al
Ab
orig
inal
Non
-Ab
orig
inal
Tot
al
Ab
orig
inal
Non
-Ab
orig
inal
Tot
al
Full-time 102 66 16
8 64 56 120 44 77 12
1 -38 -10 -48 -20 21 1Part-time 23 9 32 30 4 34 48 11 59 7 -5 2 18 7 25Total 12
5 75 200 94 60 15
4 92 88 180 -31 -15 -46 -2 28 26
Source: Department of Trade, Business and InnovationJOBS PROFILE ANGURUGU
9
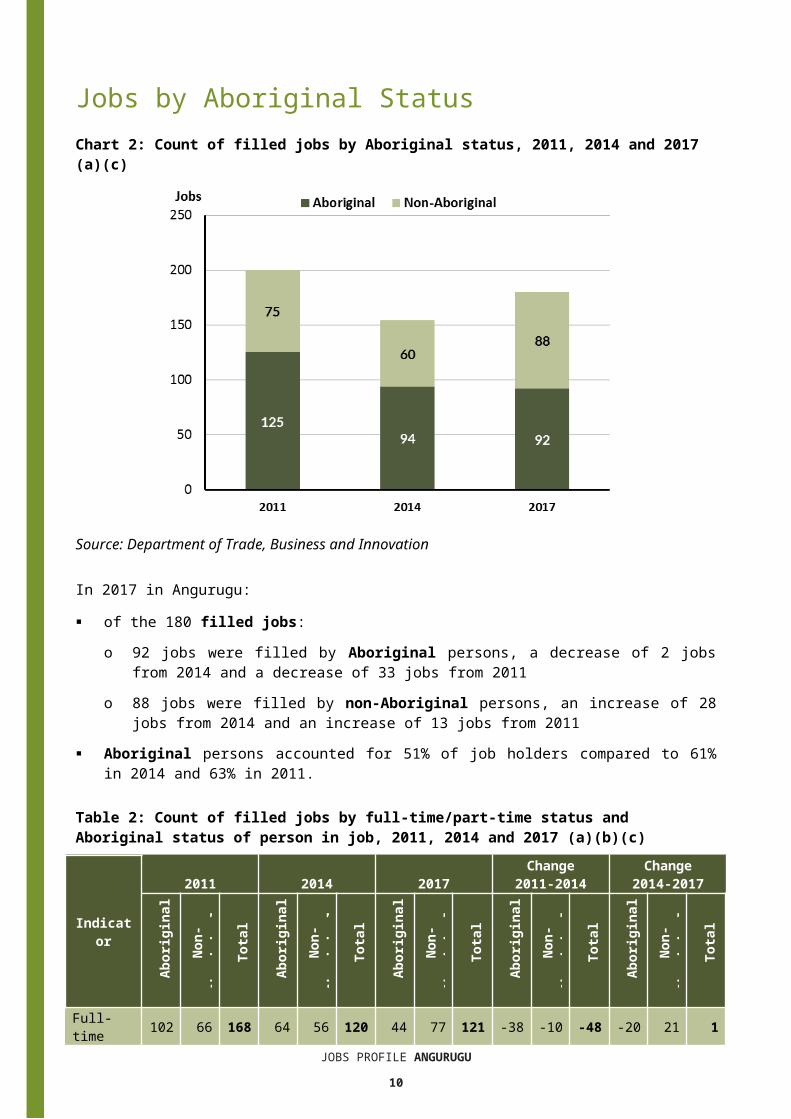
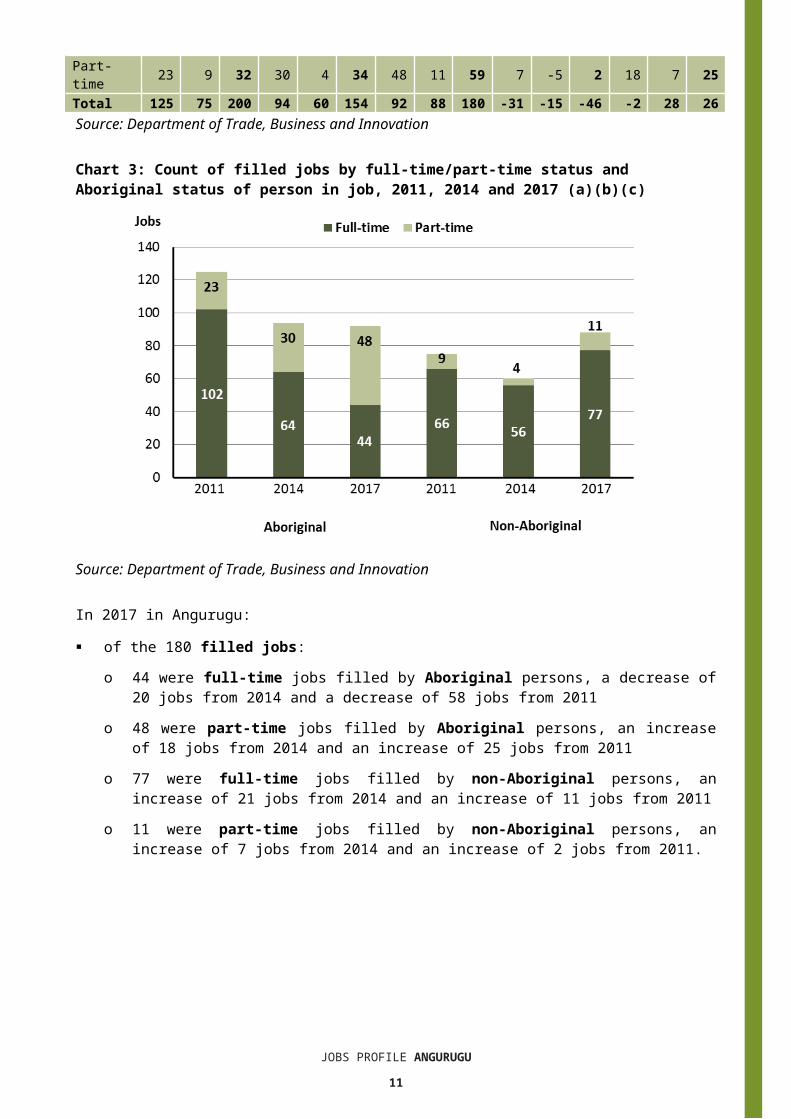
Chart 3: Count of filled jobs by full-time/part-time status and Aboriginal status of person in job, 2011, 2014 and 2017 (a)(b)(c)
Source: Department of Trade, Business and Innovation
In 2017 in Angurugu: of the 180 filled jobs:
o 44 were full-time jobs filled by Aboriginal persons, a decrease of 20 jobs from 2014 and a decrease of 58 jobs from 2011
o 48 were part-time jobs filled by Aboriginal persons, an increase of 18 jobs from 2014 and an increase of 25 jobs from 2011
o 77 were full-time jobs filled by non-Aboriginal persons, an increase of 21 jobs from 2014 and an increase of 11 jobs from 2011
o 11 were part-time jobs filled by non-Aboriginal persons, an increase of 7 jobs from 2014 and an increase of 2 jobs from 2011.
JOBS PROFILE ANGURUGU10
Jobs by Sector: Private and PublicTable 3: Count of filled jobs by sector of business and by Aboriginal status of person employed in job, 2011, 2014 and 2017 (a)(b)(c)
Indicator
2011 2014 2017Change
2011-2014Change
2014-2017
Abor
igin
al
Non
-
Tot
al
Ab
orig
inal
Non
-
Tot
al
Ab
orig
inal
Non
-
Tot
al
Ab
orig
inal
Non
-Ab
orig
inal
Tot
al
Ab
orig
inal
Non
-Ab
orig
inal
Tot
al
Public Sector 54 56
110
45
38 83 4
538 83 -9 -18 -27 0 0 0
Australian Government 3 2 5 7 1 8 5 1 6 4 -1 3 -
2 0 -2Territory Government 22 4
0 62 14
28 42 2
228 50 -8 -12 -20 8 0 8
Local Government 29 14 43 2
4 9 33 18 9 27 -5 -5 -10 -
6 0 -6Private Sector 71 1
9 90 49
22 71 4
750 97 -22 3 -19 -
2 28 26Total 12
575
200
94
60
154
92
88
180 -31 -15 -46 -
2 28 26
Source: Department of Trade, Business and Innovation
Chart 4: Count of filled jobs by sector of business, 2011, 2014 and 2017 (a)(d)
Source: Department of Trade, Business and Innovation
JOBS PROFILE ANGURUGU11
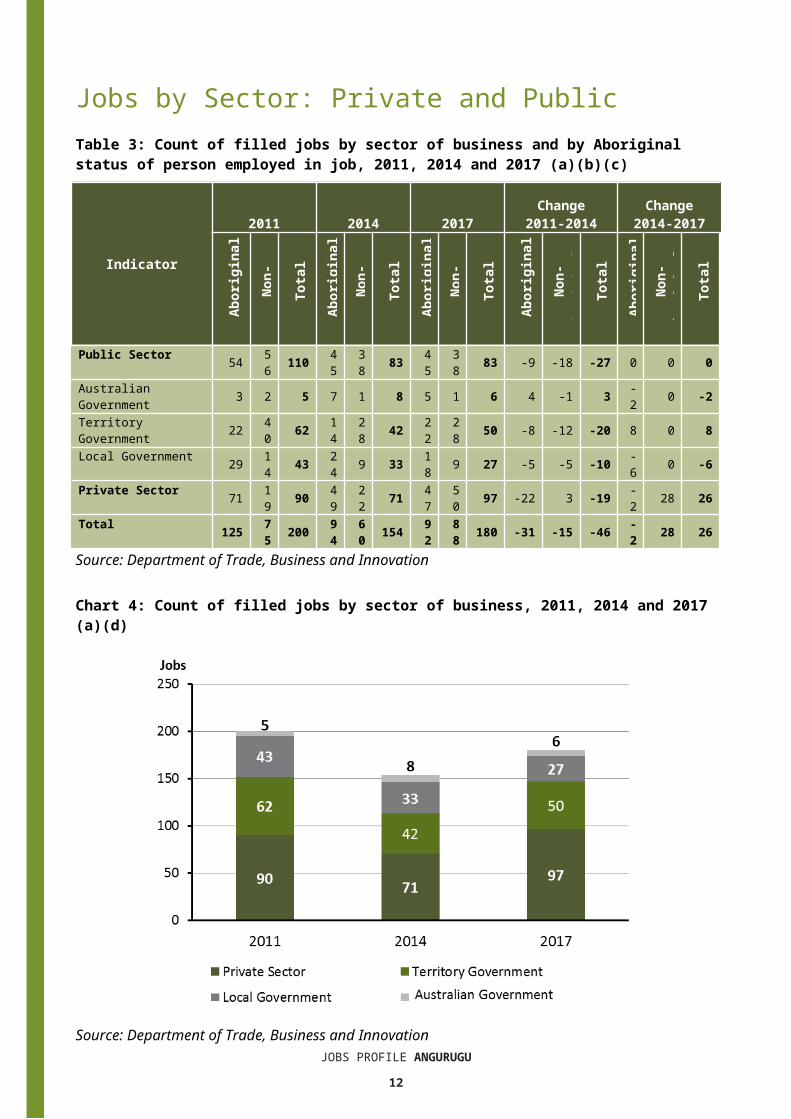
Chart 5: Percentage of filled jobs by sector of business in 2017 (a)(d)
Source: Department of Trade, Business and Innovation
In 2017 in Angurugu: there were 83 jobs in the public sector, unchanged from 2014 and a decrease of
27 jobs from 2011 of the 83 jobs in the public sector:
o 6 jobs were in the Australian Government, a decrease of 2 jobs from 2014 and an increase of 1 job from 2011
o 50 jobs were in the Territory Government, an increase of 8 jobs from 2014 and a decrease of 12 jobs from 2011
o 27 jobs were in the Local Government, a decrease of 6 jobs from 2014 and a decrease of 16 jobs from 2011
there were 97 jobs in the private sector, an increase of 26 jobs from 2014 and an increase of 7 jobs from 2011.
JOBS PROFILE ANGURUGU12
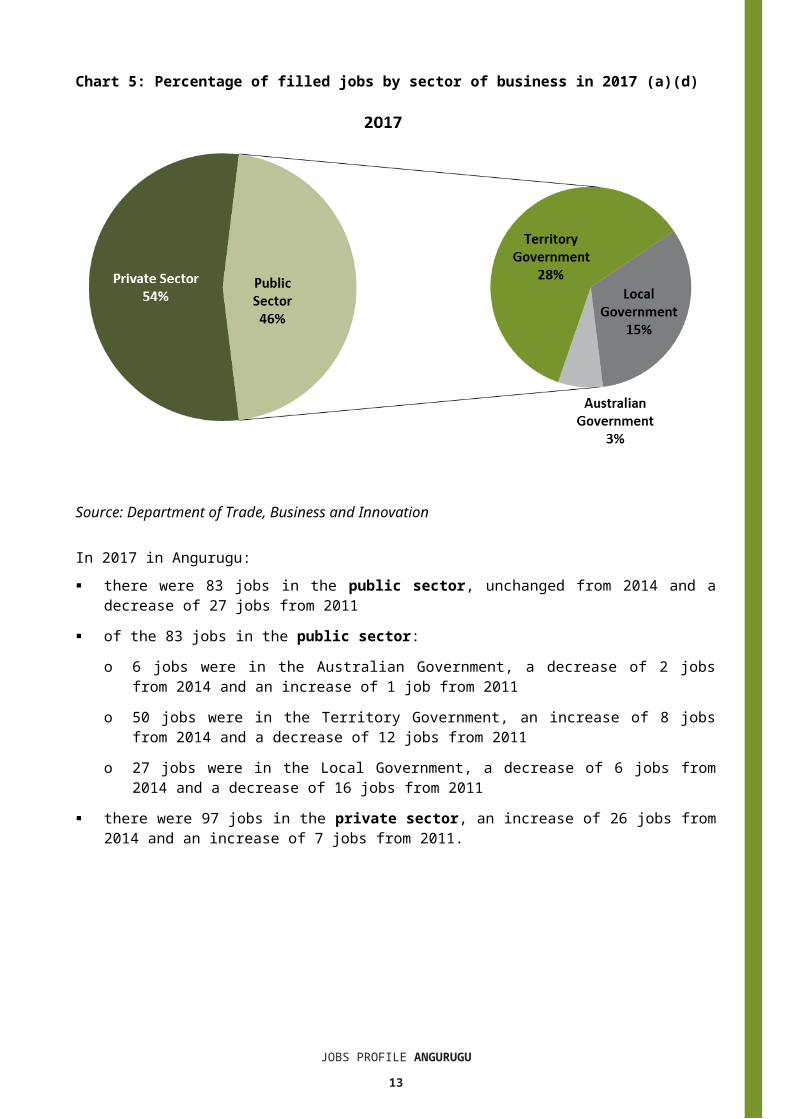
Chart 6: Count of filled jobs by sector and Aboriginal status of person in job, 2011, 2014 and 2017 (a)(c)(d)
Source: Department of Trade, Business and Innovation
In 2017 in Angurugu: of the 83 jobs in the public sector:
o 45 jobs were filled by Aboriginal persons, unchanged from 2014 and a decrease of 9 jobs from 2011
o 38 jobs were filled by non-Aboriginal persons, unchanged from 2014 and a decrease of 18 jobs from 2011
of the 97 jobs in the private sector:o 47 jobs were filled by Aboriginal persons, a decrease of 2 jobs from 2014 and
a decrease of 24 jobs from 2011o 50 jobs were filled by non-Aboriginal persons, an increase of 28 jobs from
2014 and an increase of 31 jobs from 2011.
JOBS PROFILE ANGURUGU13
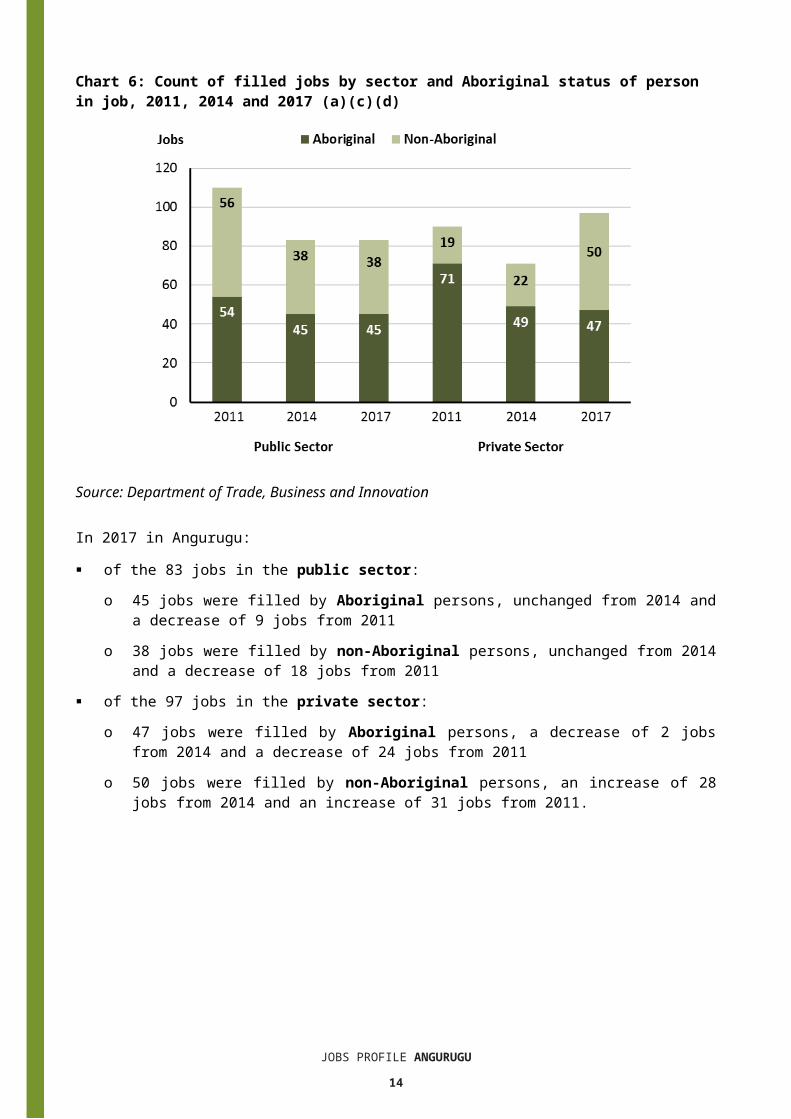
Chart 7: Count of filled jobs by sector and full-time/part-time status of person in job, 2011, 2014 and 2017 (a)(b)(d)
Source: Department of Trade, Business and Innovation
In 2017 in Angurugu: of the 83 jobs in the public sector:
o 59 were full-time jobs, unchanged from 2014 and a decrease of 24 jobs from 2011
o 24 were part-time jobs, unchanged from 2014 and a decrease of 3 jobs from 2011
97 jobs in the private sector:o 62 were full-time jobs, an increase of 1 job from 2014 and a decrease of 23
jobs from 2011o 35 were part-time jobs, an increase of 25 jobs from 2014 and an increase of
30 jobs from 2011.
JOBS PROFILE ANGURUGU14
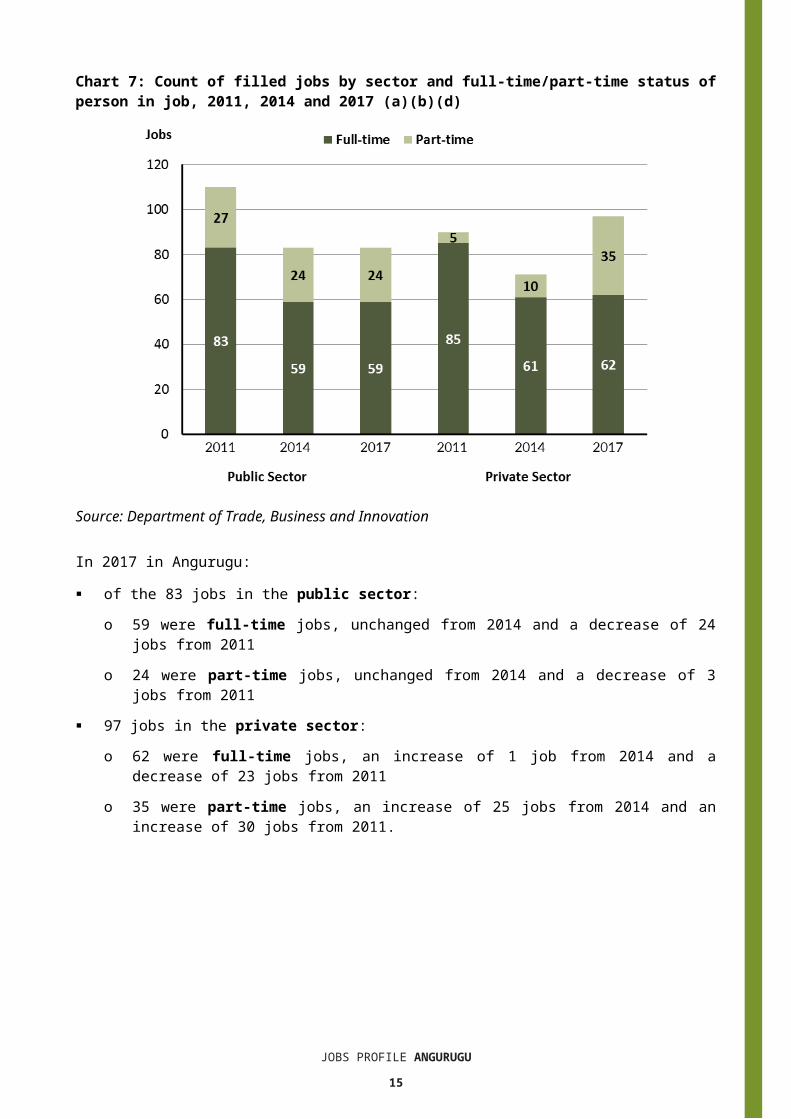
Table 4: Count of filled jobs by full-time/part-time status and Aboriginal status of person in job by sector, 2011, 2014, and 2017 (a)(b)(c)(d)
Indicator2011
Aboriginal Non-Aboriginal TotalFull-time
Part-time Total Full-
timePart-time Total Full-
timePart-time Total
Public Sector 35 19 54 48 8 56 83 27 110Private Sector 67 4 71 18 1 19 85 5 90Total 102 23 125 66 9 75 168 32 200
Indicator2014
Aboriginal Non-Aboriginal TotalFull-time
Part-time Total Full-
timePart-time Total Full-
timePart-time Total
Public Sector 23 22 45 36 2 38 59 24 83Private Sector 41 8 49 20 2 22 61 10 71Total 64 30 94 56 4 60 120 34 154
Indicator
2017Aboriginal Non-Aboriginal Total
Full-time
Part-time Total Full-
timePart-time Total Full-
timePart-time Total
Public sector 24 21 45 35 3 38 59 24 83Private Sector 20 27 47 42 8 50 62 35 97Total 64 30 92 77 11 88 121 59 180Source: Department of Trade, Business and InnovationIn 2017 in Angurugu there were: 45 jobs in the public sector filled by Aboriginal persons, unchanged from 2014
and a decrease of 9 jobs from 2011, of which:o 24 were full-time jobs, an increase of 1 job from 2014 and a decrease of 11
jobs from 2011o 21 were part-time jobs, a decrease of 1 job from 2014 and an increase of 2
jobs from 2011 47 jobs in the private sector filled by Aboriginal persons, a decrease of 2 jobs
from 2014 and a decrease of 24 jobs from 2011, of which:o 20 were full-time jobs, a decrease of 21 jobs from 2014 and a decrease of 47
jobs from 2011o 27 were part-time jobs, an increase of 19 jobs from 2014 and an increase of
23 jobs from 2011 38 jobs in the public sector filled by non-Aboriginal persons, unchanged from
2014 and a decrease of 18 jobs from 2011, of which:o 35 were full-time jobs, a decrease of 1 job from 2014 and a decrease of 13
jobs from 2011o 3 were part-time jobs, an increase of 1 job from 2014 and a decrease of 5
jobs from 2011
JOBS PROFILE ANGURUGU15
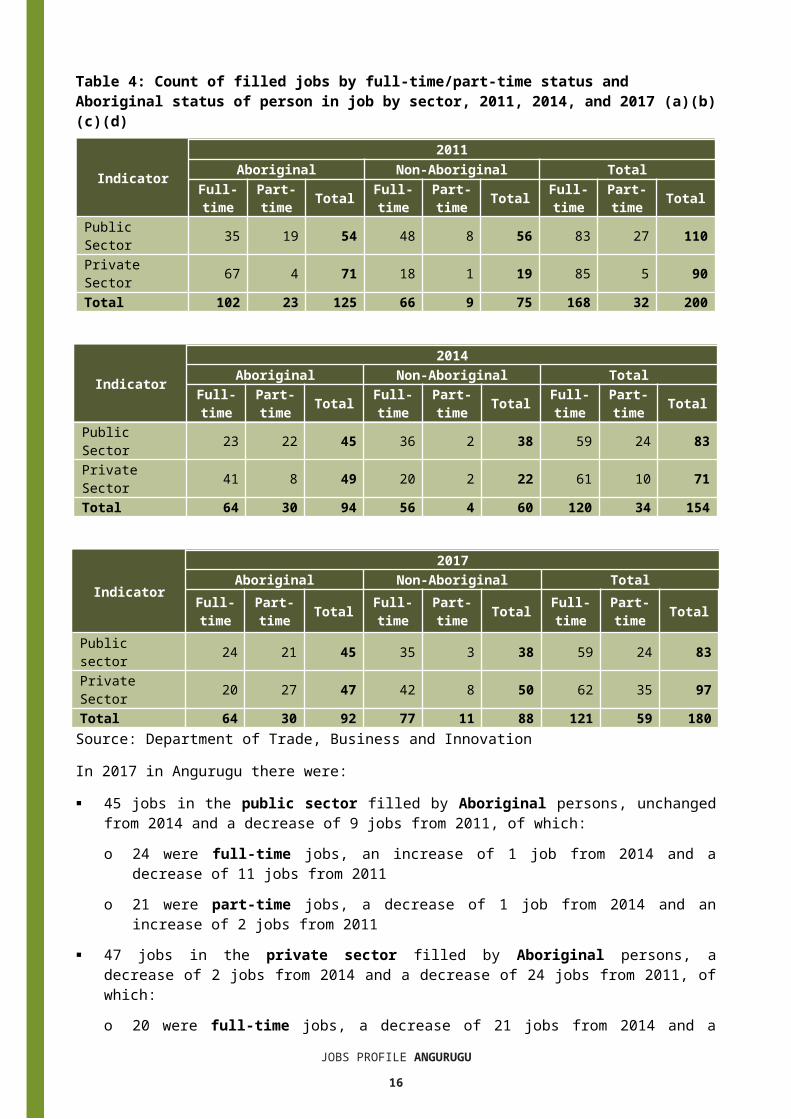
50 jobs in the private sector filled by non-Aboriginal persons, an increase of 28 jobs from 2014 and an increase of 31 jobs from 2011, of which:o 42 were full-time jobs, an increase of 22 jobs from 2014 and an increase of 24
jobs from 2011o 8 were part-time jobs, an increase of 6 jobs from 2014 and an increase of 7
jobs from 2011.
JOBS PROFILE ANGURUGU16
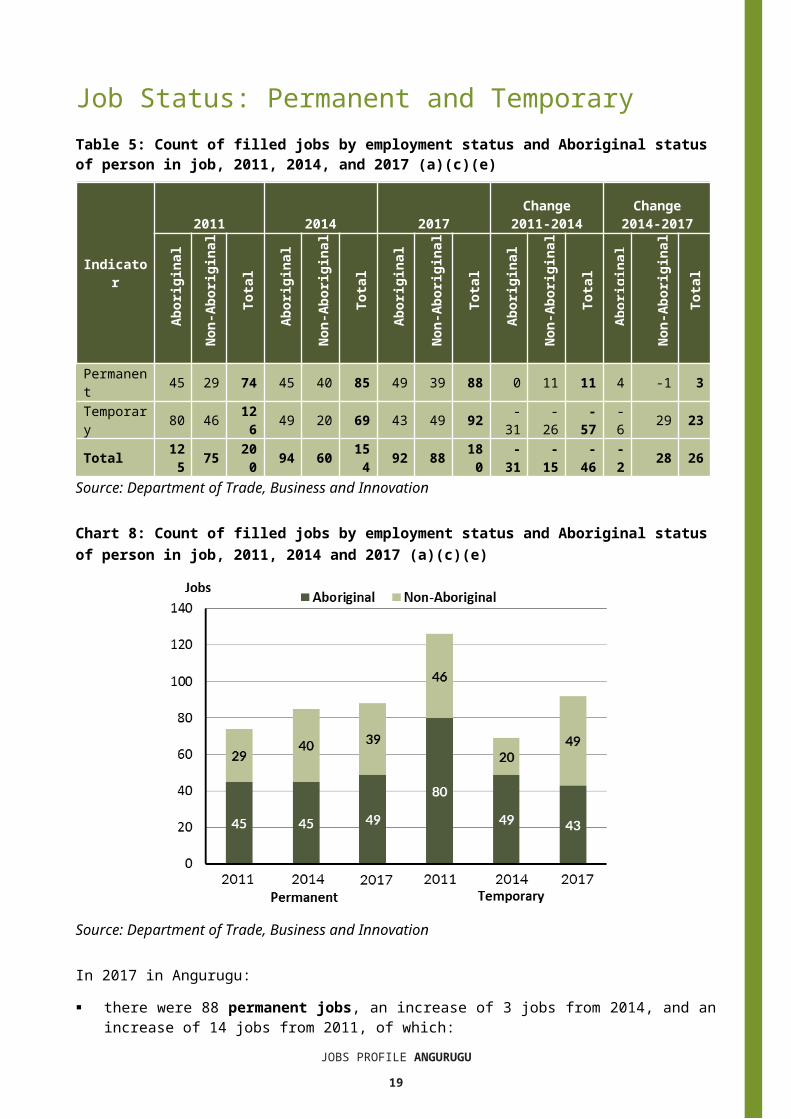
Job Status: Permanent and TemporaryTable 5: Count of filled jobs by employment status and Aboriginal status of person in job, 2011, 2014, and 2017 (a)(c)(e)
Indicator
2011 2014 2017Change
2011-2014Change
2014-2017
Ab
orig
inal
Non
-Abo
rigi
nal
Tot
al
Ab
orig
inal
Non
-Abo
rigi
nal
Tot
al
Ab
orig
inal
Non
-Abo
rigi
nal
Tot
al
Ab
orig
inal
Non
-Abo
rigi
nal
Tot
al
Ab
orig
inal
Non
-Abo
rigi
nal
Tot
al
Permanent 45 29 74 45 40 85 49 39 88 0 11 11 4 -1 3Temporary 80 46 12
6 49 20 69 43 49 92 -31 -26 -57 -6 29 2
3Total 12
5 75 200 94 60 15
4 92 88 180
-31
-15
-46
-2 28 2
6Source: Department of Trade, Business and Innovation
Chart 8: Count of filled jobs by employment status and Aboriginal status of person in job, 2011, 2014 and 2017 (a)(c)(e)
Source: Department of Trade, Business and Innovation
In 2017 in Angurugu: there were 88 permanent jobs, an increase of 3 jobs from 2014, and an increase
of 14 jobs from 2011, of which:o 49 jobs were filled by Aboriginal persons, an increase of 4 jobs from 2014 and
an increase of 4 jobs from 2011
JOBS PROFILE ANGURUGU17
o 39 jobs were filled by non-Aboriginal persons, a decrease of 1 job from 2014 and an increase of 10 jobs from 2011
there were 92 temporary jobs, an increase of 23 jobs from 2014 and a decrease of 34 jobs from 2011, of which:o 43 jobs were filled by Aboriginal persons, a decrease of 6 jobs from 2014 and
a decrease of 37 jobs from 2011o 49 jobs were filled by non-Aboriginal persons, an increase of 29 jobs from
2014 and an increase of 3 jobs from 2011.
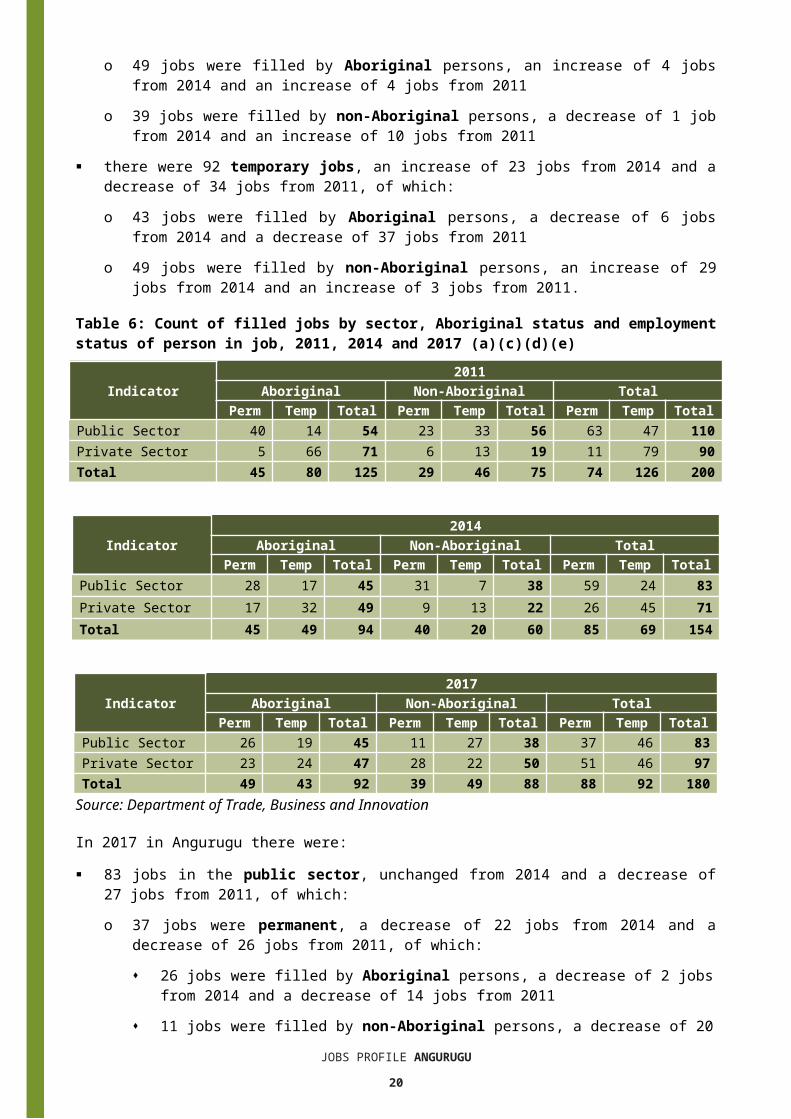
Table 6: Count of filled jobs by sector, Aboriginal status and employment status of person in job, 2011, 2014 and 2017 (a)(c)(d)(e)
Indicator2011
Aboriginal Non-Aboriginal TotalPerm Temp Total Perm Temp Total Perm Temp Total
Public Sector 40 14 54 23 33 56 63 47 110Private Sector 5 66 71 6 13 19 11 79 90Total 45 80 125 29 46 75 74 126 200
Indicator2014
Aboriginal Non-Aboriginal TotalPerm Temp Total Perm Temp Total Perm Temp Total
Public Sector 28 17 45 31 7 38 59 24 83Private Sector 17 32 49 9 13 22 26 45 71Total 45 49 94 40 20 60 85 69 154
Indicator2017
Aboriginal Non-Aboriginal TotalPerm Temp Total Perm Temp Total Perm Temp Total
Public Sector 26 19 45 11 27 38 37 46 83Private Sector 23 24 47 28 22 50 51 46 97Total 49 43 92 39 49 88 88 92 180
Source: Department of Trade, Business and Innovation
In 2017 in Angurugu there were: 83 jobs in the public sector, unchanged from 2014 and a decrease of 27 jobs
from 2011, of which:o 37 jobs were permanent, a decrease of 22 jobs from 2014 and a decrease of
26 jobs from 2011, of which: 26 jobs were filled by Aboriginal persons, a decrease of 2 jobs from 2014
and a decrease of 14 jobs from 2011 11 jobs were filled by non-Aboriginal persons, a decrease of 20 jobs from
2014 and a decrease of 12 jobs from 2011o 46 jobs were temporary, an increase of 22 jobs from 2014 and a decrease of
1 job from 2011, of which: 19 jobs were filled by Aboriginal persons, an increase of 2 jobs from 2014
and an increase of 5 jobs from 2011 27 jobs were filled by non-Aboriginal persons, an increase of 20 jobs from
JOBS PROFILE ANGURUGU18
2014 and a decrease of 6 jobs from 2011 97 jobs in the private sector, an increase of 26 jobs from 2014 and an increase of
7 jobs from 2011, of which:o 51 jobs were permanent, an increase of 25 jobs from 2014 and an increase of
40 jobs from 2011, of which: 23 jobs were filled by Aboriginal persons, an increase of 6 jobs from 2014
and an increase of 18 jobs from 2011 28 jobs were filled by non-Aboriginal persons, an increase of 19 jobs from
2014 and an increase of 22 jobs from 2011o 46 jobs were temporary, an increase of 1 job from 2014 and a decrease of 33
jobs from 2011, of which: 24 jobs were filled by Aboriginal persons, a decrease of 8 jobs from 2014
and a decrease of 42 jobs from 2011 22 jobs were filled by non-Aboriginal persons, an increase of 9 jobs from
2014 and an increase of 9 jobs from 2011.
JOBS PROFILE ANGURUGU19
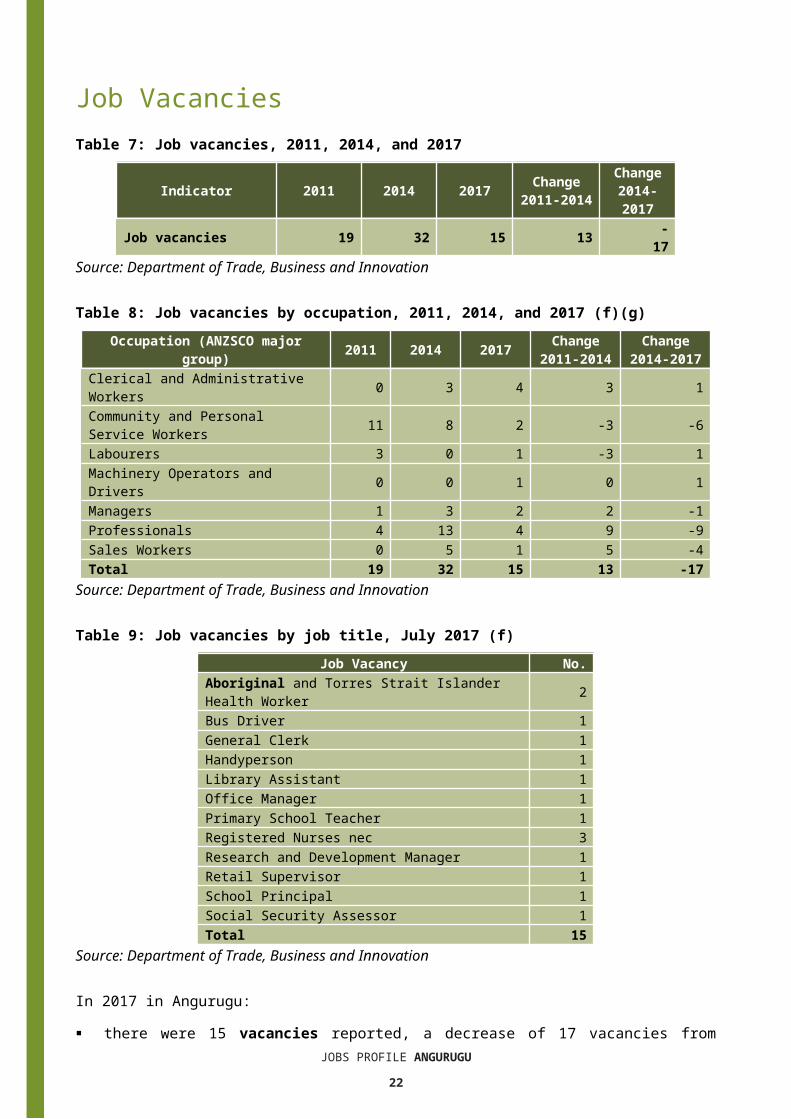
Job VacanciesTable 7: Job vacancies, 2011, 2014, and 2017
Indicator 2011 2014 2017Change2011-2014
Change2014-2017
Job vacancies 19 32 15 13 -17
Source: Department of Trade, Business and Innovation
Table 8: Job vacancies by occupation, 2011, 2014, and 2017 (f)(g)
Occupation (ANZSCO major group) 2011 2014 2017
Change2011-2014
Change2014-2017
Clerical and Administrative Workers 0 3 4 3 1Community and Personal Service Workers 11 8 2 -3 -6Labourers 3 0 1 -3 1Machinery Operators and Drivers 0 0 1 0 1Managers 1 3 2 2 -1Professionals 4 13 4 9 -9Sales Workers 0 5 1 5 -4Total 19 32 15 13 -17
Source: Department of Trade, Business and Innovation
Table 9: Job vacancies by job title, July 2017 (f)Job Vacancy No.
Aboriginal and Torres Strait Islander Health Worker 2Bus Driver 1General Clerk 1Handyperson 1Library Assistant 1Office Manager 1Primary School Teacher 1Registered Nurses nec 3Research and Development Manager 1Retail Supervisor 1School Principal 1Social Security Assessor 1Total 15
Source: Department of Trade, Business and Innovation
In 2017 in Angurugu: there were 15 vacancies reported, a decrease of 17 vacancies from 2014 and a
decrease of 4 vacancies from 2011 of the 15 reported vacancies, the largest requirements were for:
o 4 Clerical and Administrative Workers in the following jobs: General Clerk
JOBS PROFILE ANGURUGU20
Library Assistant Office Manager Social Security Assessor
o 4 Professionals in the following jobs: Registered Nurse nec Primary School Teacher
o 2 Community and Personal Service Workers in the following jobs: Aboriginal and Torres Strait Islander Health Worker.
JOBS PROFILE ANGURUGU21
Jobs by IndustryTable 10: Count of filled jobs by industry of business, 2011, 2014 and 2017 (a)(h)
Industry (ANZSIC Division)
2011 2014 2017
Chan
ge20
11-
2014
Chan
ge20
14-
2017
Total
% of Total
Total
% of Total
Total
% of Total
Total
Total
Administrative and Support Services 0 0.0% 0 0.0% 8 4.4% 0 8Agriculture, Forestry and Fishing 0 0.0% 31 20.1% 0 0.0% 31 -31Arts and Recreation Services 2 1.0% 15 9.7% 0 0.0% 13 -15Construction 80 40.0% 0 0.0% 39 21.7% -80 39Education and Training 53 26.5% 33 21.4% 45 25.0% -20 12Health Care and Social Assistance 12 6.0% 18 11.7% 21 11.7% 6 3Public Administration and Safety 48 24.0% 41 26.6% 38 21.1% -7 -3Retail Trade 3 1.5% 15 9.7% 28 15.6% 12 13Total 200 100.0
% 154 100.0% 180 100.0
% -46 26Source: Department of Trade, Business and Innovation
In 2017 in Angurugu: the Education and Training industry was the largest industry employer, with 45
filled jobs or 25% of filled jobs, an increase of 12 jobs from 2014 and a decrease of 8 jobs from 2011
other significant industry employers were:o Construction with 39 jobs (or 21.7% of filled jobs), an increase of 39 jobs from
2014 and a decrease of 41 jobs from 2011o Public Administration and Safety with 38 jobs (or 21.1% of filled jobs), a
decrease of 3 jobs from 2014 and a decrease of 10 jobs from 2011o Retail Trade with 28 jobs (or 15.6% of filled jobs), an increase of 13 jobs from
2014 and an increase of 25 jobs from 2011.
JOBS PROFILE ANGURUGU22
Table 11: Count of filled jobs by industry of business and Aboriginal status of person in job, 2011, 2014, and 2017 (a)(c)(h)
Industry (ANZSIC division)
2011 2014 2017 Change2011-2014
Change 2014-2017
Ab
orig
inal
Non
-
Tot
al
Ab
orig
inal
Non
-
Tot
al
Ab
orig
inal
Non
-
Tot
al
Ab
orig
inal
Non
-Ab
orig
inal
Tot
al
Ab
orig
inal
Non
-Ab
orig
inal
Tot
al
Administrative and Support Services
0 0 0 0 0 0 3 5 8 0 0 0 3 5 8
Agriculture, Forestry and Fishing
0 0 0 30 1 31 0 0 0 30 1 31 -30 -1 -31
Arts and Recreation Services
0 2 2 6 9 15 0 0 0 6 7 13 -6 -9 -15
Construction 65 15 80 0 0 0 12 27 39 -65 -15 -80 12 27 39Education and Training 21 32 53 11 22 33 25 20 45 -10 -10 -20 14 -2 12Electricity, Gas, Water and Waste Services
0 1 1 0 1 1 0 1 1 0 0 0 0 0 0
Health Care and Social Assistance 4 8 12 8 10 18 10 11 21 4 2 6 2 1 3Public Administration and Safety
32 16 48 31 10 41 27 11 38 -1 -6 -7 -4 1 -3
Retail Trade 2 1 3 8 7 15 15 13 28 6 6 12 7 6 13
Total 125 75 200 9
460 154 9
288 180 -31 -15 -46 -2 28 26
Source: Department of Trade, Business and Innovation
JOBS PROFILE ANGURUGU23
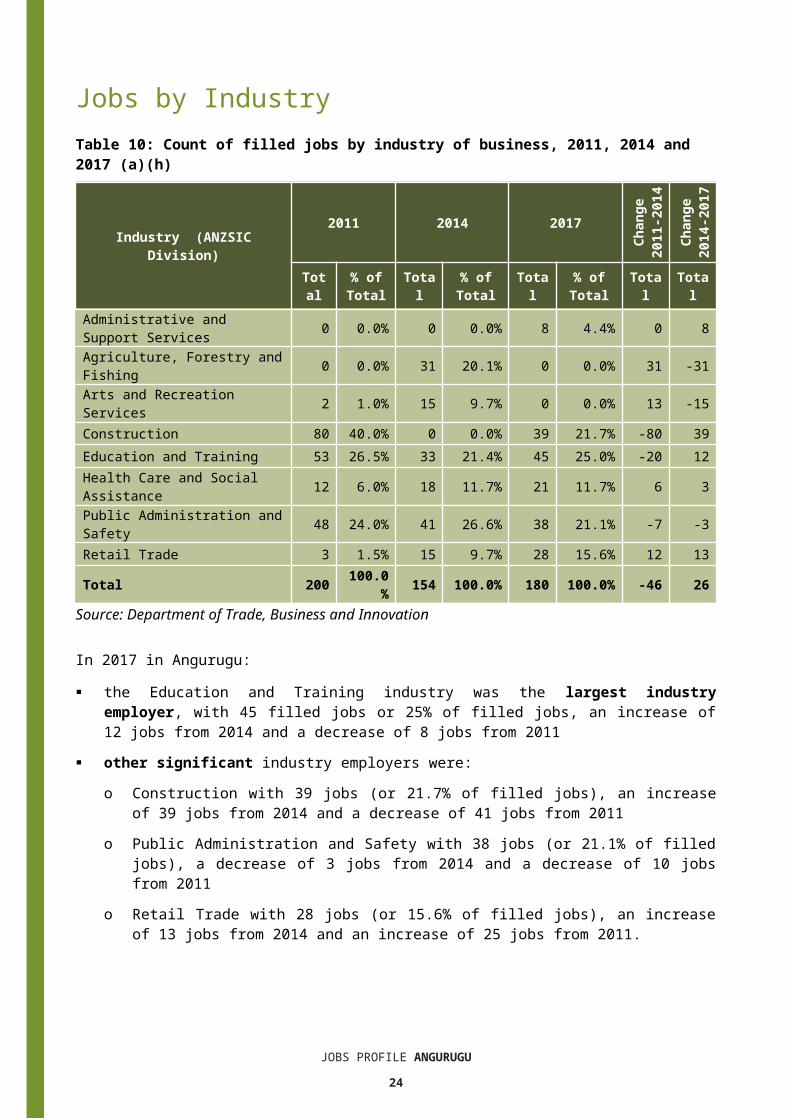
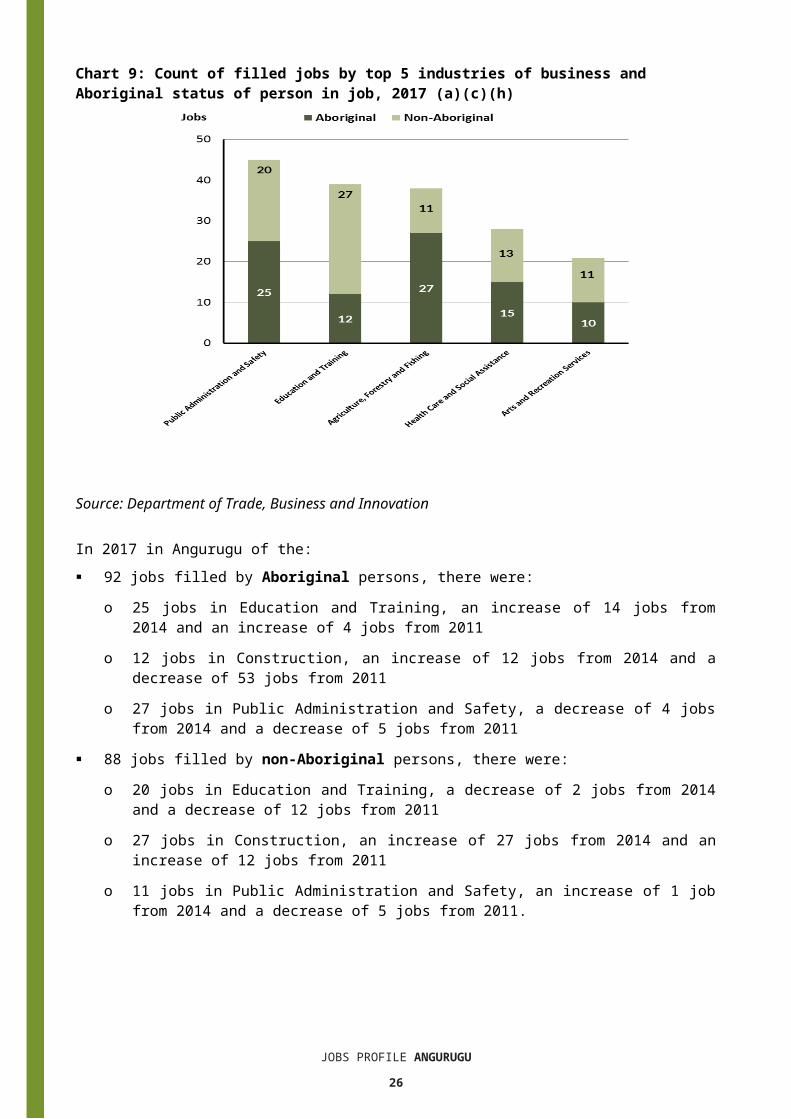
Chart 9: Count of filled jobs by top 5 industries of business and Aboriginal status of person in job, 2017 (a)(c)(h)
Source: Department of Trade, Business and Innovation
In 2017 in Angurugu of the: 92 jobs filled by Aboriginal persons, there were:
o 25 jobs in Education and Training, an increase of 14 jobs from 2014 and an increase of 4 jobs from 2011
o 12 jobs in Construction, an increase of 12 jobs from 2014 and a decrease of 53 jobs from 2011
o 27 jobs in Public Administration and Safety, a decrease of 4 jobs from 2014 and a decrease of 5 jobs from 2011
88 jobs filled by non-Aboriginal persons, there were:o 20 jobs in Education and Training, a decrease of 2 jobs from 2014 and a
decrease of 12 jobs from 2011o 27 jobs in Construction, an increase of 27 jobs from 2014 and an increase of
12 jobs from 2011o 11 jobs in Public Administration and Safety, an increase of 1 job from 2014 and
a decrease of 5 jobs from 2011.
JOBS PROFILE ANGURUGU24
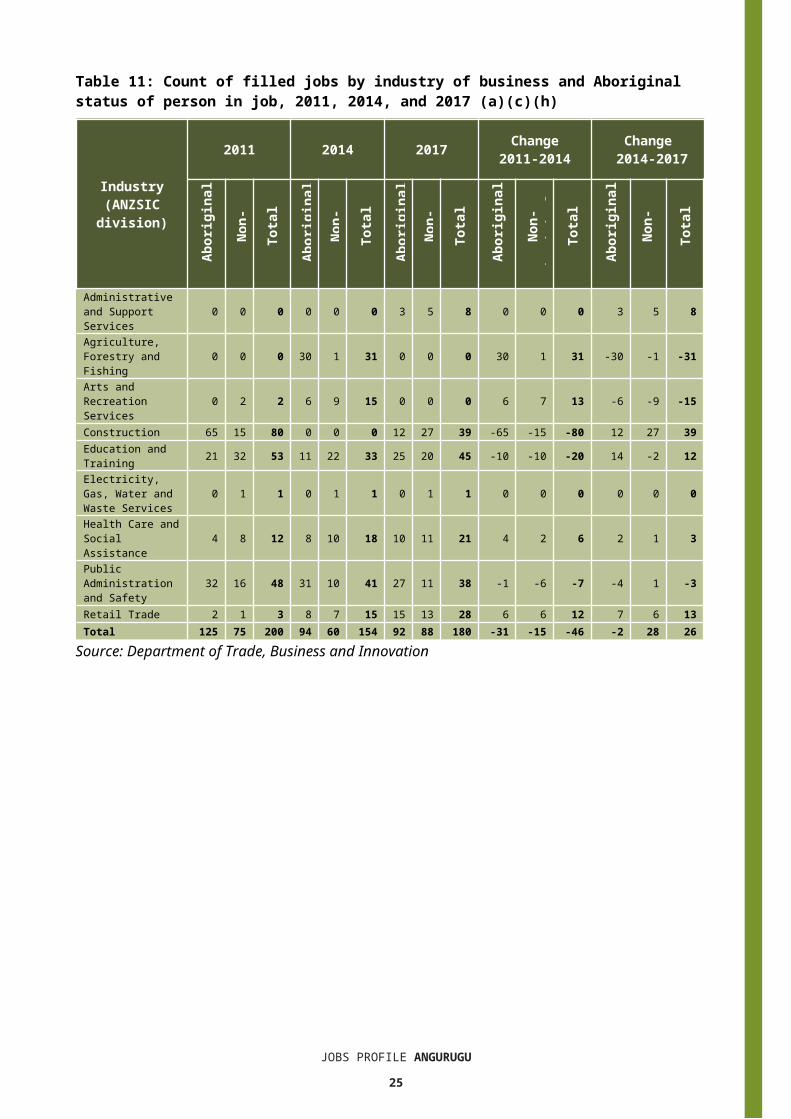
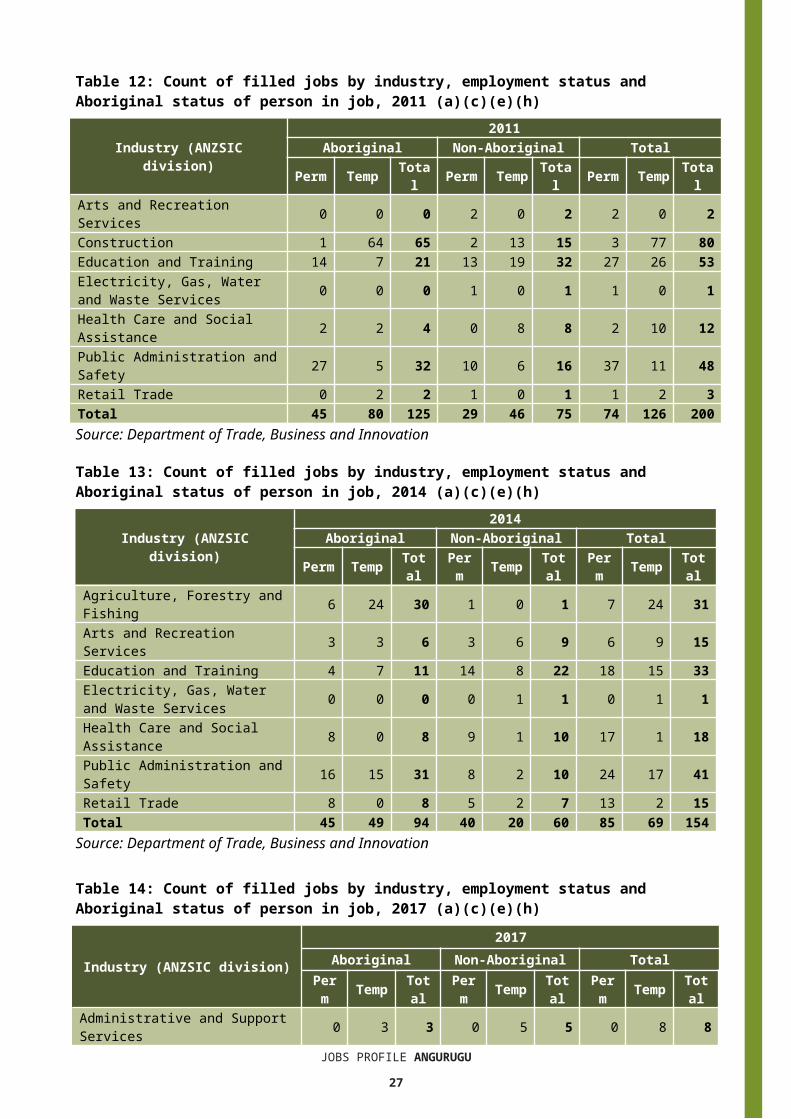
Table 12: Count of filled jobs by industry, employment status and Aboriginal status of person in job, 2011 (a)(c)(e)(h)
Industry (ANZSIC division)2011
Aboriginal Non-Aboriginal TotalPerm Temp Tot
alPerm
Temp
Total
Perm
Temp
Total
Arts and Recreation Services 0 0 0 2 0 2 2 0 2Construction 1 64 65 2 13 15 3 77 80Education and Training 14 7 21 13 19 32 27 26 53Electricity, Gas, Water and Waste Services 0 0 0 1 0 1 1 0 1Health Care and Social Assistance 2 2 4 0 8 8 2 10 12Public Administration and Safety 27 5 32 10 6 16 37 11 48Retail Trade 0 2 2 1 0 1 1 2 3Total 45 80 125 29 46 75 74 126 200Source: Department of Trade, Business and Innovation
Table 13: Count of filled jobs by industry, employment status and Aboriginal status of person in job, 2014 (a)(c)(e)(h)
Industry (ANZSIC division)2014
Aboriginal Non-Aboriginal TotalPerm
Temp
Total
Perm
Temp
Total
Perm
Temp
Total
Agriculture, Forestry and Fishing 6 24 30 1 0 1 7 24 31Arts and Recreation Services 3 3 6 3 6 9 6 9 15Education and Training 4 7 11 14 8 22 18 15 33Electricity, Gas, Water and Waste Services 0 0 0 0 1 1 0 1 1Health Care and Social Assistance 8 0 8 9 1 10 17 1 18Public Administration and Safety 16 15 31 8 2 10 24 17 41Retail Trade 8 0 8 5 2 7 13 2 15Total 45 49 94 40 20 60 85 69 154
Source: Department of Trade, Business and Innovation
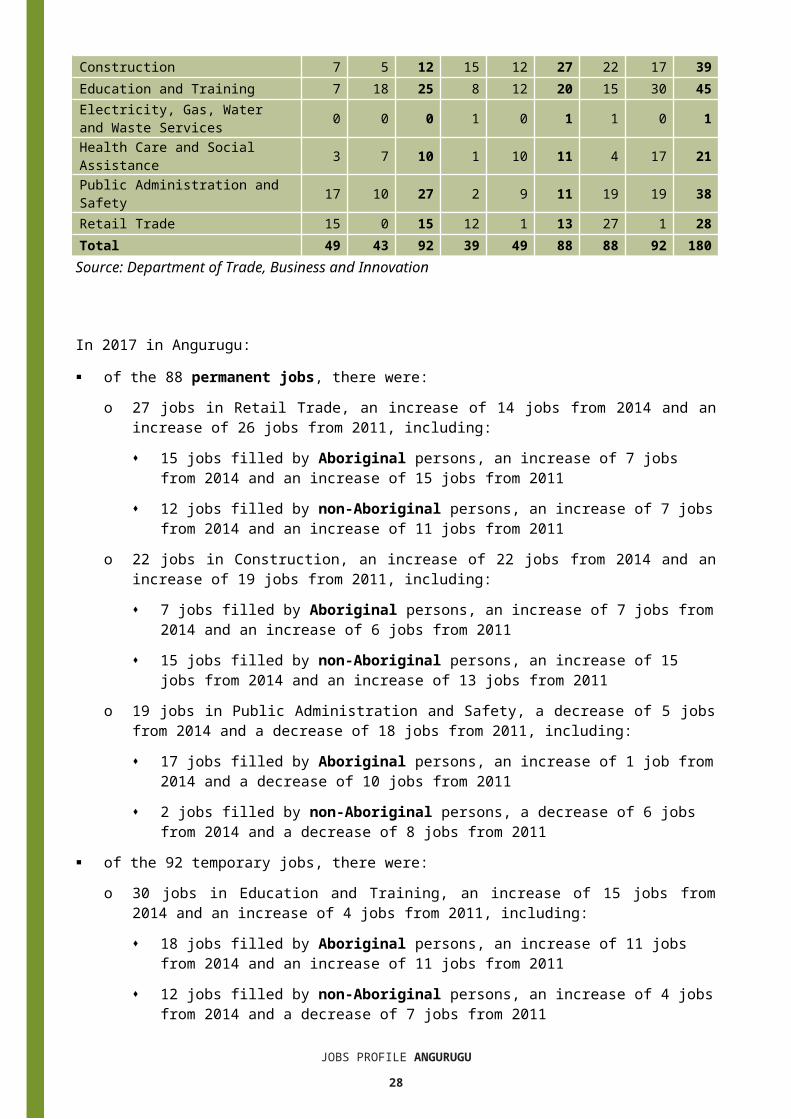
Table 14: Count of filled jobs by industry, employment status and Aboriginal status of person in job, 2017 (a)(c)(e)(h)
Industry (ANZSIC division)
2017Aboriginal Non-Aboriginal Total
Perm
Temp
Total
Perm
Temp
Total
Perm
Temp
Total
Administrative and Support Services 0 3 3 0 5 5 0 8 8
Construction 7 5 12 15 12 27 22 17 39Education and Training 7 18 25 8 12 20 15 30 45Electricity, Gas, Water and Waste Services 0 0 0 1 0 1 1 0 1Health Care and Social Assistance 3 7 10 1 10 11 4 17 21Public Administration and Safety 17 10 27 2 9 11 19 19 38
JOBS PROFILE ANGURUGU25
Retail Trade 15 0 15 12 1 13 27 1 28Total 49 43 92 39 49 88 88 92 180Source: Department of Trade, Business and Innovation
In 2017 in Angurugu: of the 88 permanent jobs, there were:
o 27 jobs in Retail Trade, an increase of 14 jobs from 2014 and an increase of 26 jobs from 2011, including: 15 jobs filled by Aboriginal persons, an increase of 7 jobs from 2014 and
an increase of 15 jobs from 2011 12 jobs filled by non-Aboriginal persons, an increase of 7 jobs from 2014
and an increase of 11 jobs from 2011o 22 jobs in Construction, an increase of 22 jobs from 2014 and an increase of
19 jobs from 2011, including: 7 jobs filled by Aboriginal persons, an increase of 7 jobs from 2014 and
an increase of 6 jobs from 2011 15 jobs filled by non-Aboriginal persons, an increase of 15 jobs from
2014 and an increase of 13 jobs from 2011o 19 jobs in Public Administration and Safety, a decrease of 5 jobs from 2014
and a decrease of 18 jobs from 2011, including: 17 jobs filled by Aboriginal persons, an increase of 1 job from 2014 and a
decrease of 10 jobs from 2011 2 jobs filled by non-Aboriginal persons, a decrease of 6 jobs from 2014
and a decrease of 8 jobs from 2011 of the 92 temporary jobs, there were:
o 30 jobs in Education and Training, an increase of 15 jobs from 2014 and an increase of 4 jobs from 2011, including: 18 jobs filled by Aboriginal persons, an increase of 11 jobs from 2014 and
an increase of 11 jobs from 2011 12 jobs filled by non-Aboriginal persons, an increase of 4 jobs from 2014
and a decrease of 7 jobs from 2011o 19 jobs in Public Administration and Safety, an increase of 2 jobs from 2014
and an increase of 8 jobs from 2011, including: 10 jobs filled by Aboriginal persons, a decrease of 5 jobs from 2014 and
an increase of 5 jobs from 2011 9 jobs filled by non-Aboriginal persons, an increase of 7 jobs from 2014
and an increase of 3 jobs from 2011o 17 jobs in Construction, an increase of 17 jobs from 2014 and a decrease of 60
jobs from 2011, including 5 jobs filled by Aboriginal persons, an increase of 5 jobs from 2014 and a
decrease of 59 jobs from 2011 12 jobs filled by non-Aboriginal persons, an increase of 12 jobs from
JOBS PROFILE ANGURUGU26
2014 and a decrease of 1 job from 2011.
JOBS PROFILE ANGURUGU27
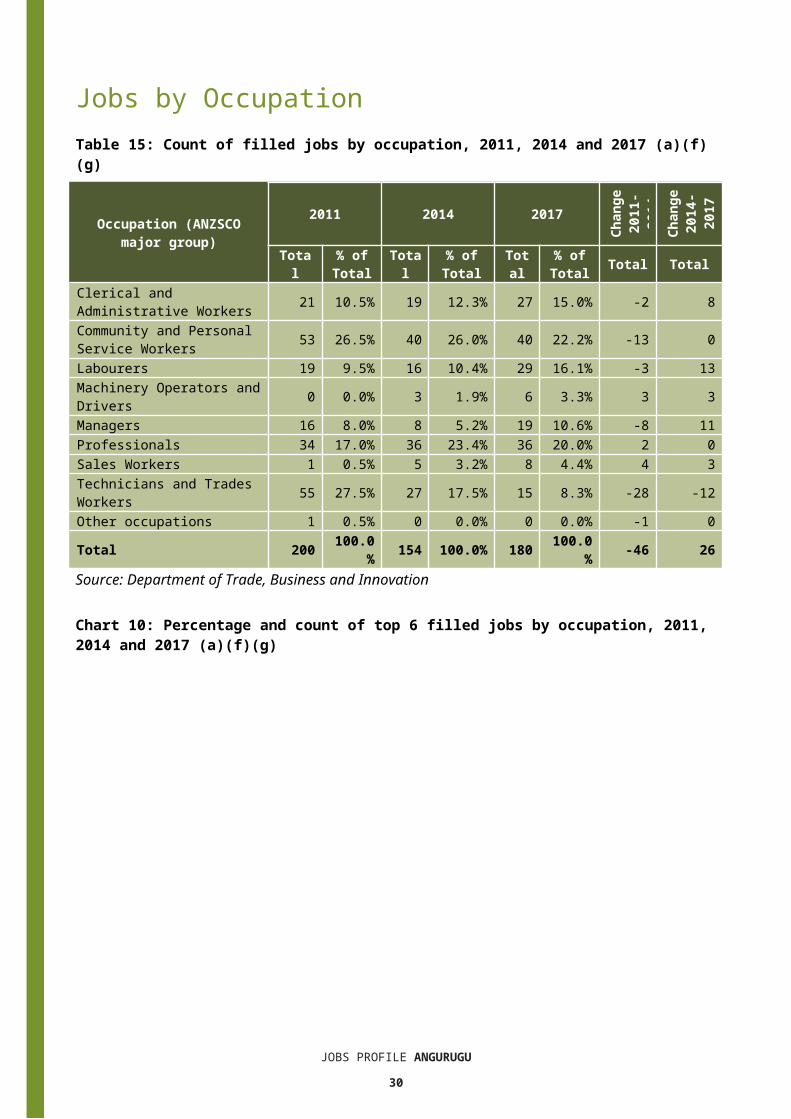
Jobs by OccupationTable 15: Count of filled jobs by occupation, 2011, 2014 and 2017 (a)(f)(g)
Occupation (ANZSCO major group)
2011 2014 2017
Chan
ge20
11-
2014
Chan
ge20
14-
2017
Total % of Total
Total
% of Total
Total
% of Total Total Total
Clerical and Administrative Workers 21 10.5% 19 12.3% 27 15.0% -2 8Community and Personal Service Workers 53 26.5% 40 26.0% 40 22.2% -13 0Labourers 19 9.5% 16 10.4% 29 16.1% -3 13Machinery Operators and Drivers 0 0.0% 3 1.9% 6 3.3% 3 3Managers 16 8.0% 8 5.2% 19 10.6% -8 11Professionals 34 17.0% 36 23.4% 36 20.0% 2 0Sales Workers 1 0.5% 5 3.2% 8 4.4% 4 3Technicians and Trades Workers 55 27.5% 27 17.5% 15 8.3% -28 -12Other occupations 1 0.5% 0 0.0% 0 0.0% -1 0Total 200 100.0
% 154 100.0% 180 100.0
% -46 26Source: Department of Trade, Business and Innovation
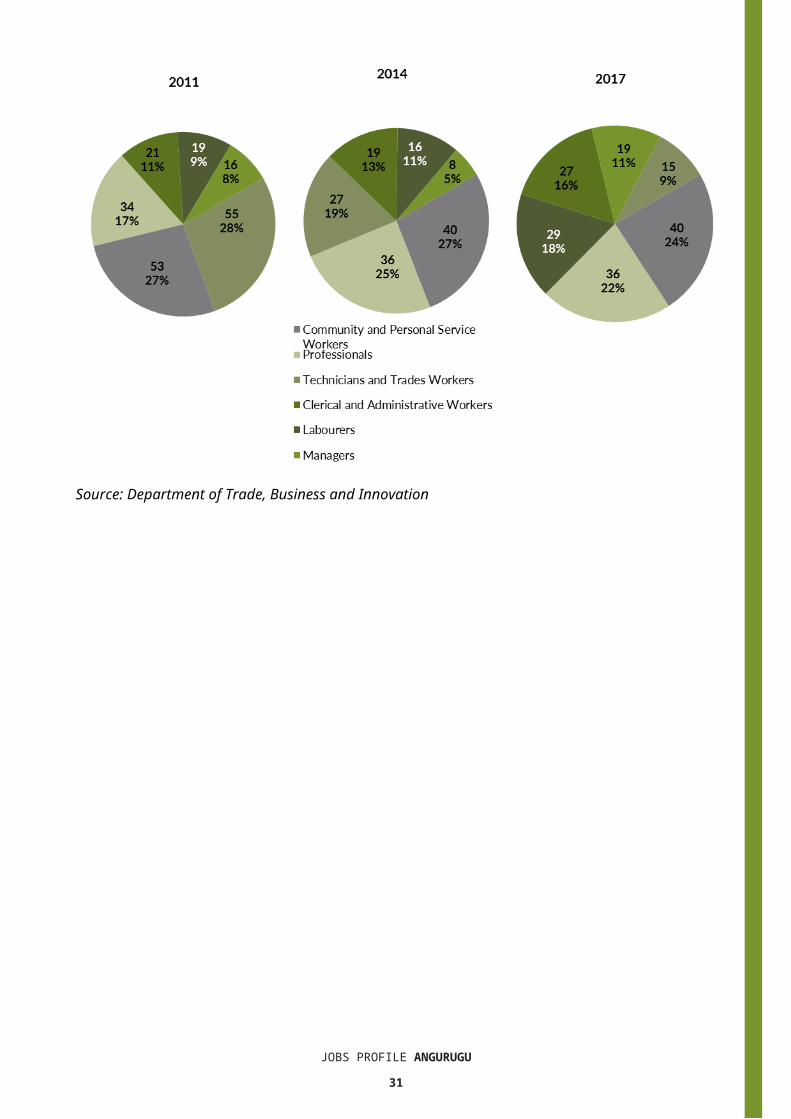
Chart 10: Percentage and count of top 6 filled jobs by occupation, 2011, 2014 and 2017 (a)(f)(g)
Source: Department of Trade, Business and Innovation
JOBS PROFILE ANGURUGU28
In 2017 in Angurugu: Community and Personal Service Workers was the largest occupation
classification in terms of filled jobs, accounting for 40 jobs (22.2% of total filled jobs), unchanged from 2014 and a decrease of 13 jobs from 2011
other significant occupation classifications were:o Professionals accounting for 36 jobs or 20% of total jobs unchanged from 2014
and an increase of 2 jobs from 2011o Labourers accounting for 29 jobs or 16.1% of total jobs an increase of 13 jobs
from 2014 and an increase of 10 jobs from 2011o Clerical and Administrative Workers accounting for 27 jobs or 15% of total jobs
an increase of 8 jobs from 2014 and an increase of 6 jobs from 2011.Table 16 Count of filled jobs by ANZSCO occupation by Aboriginal status of person employed in job, 2011, 2014 and 2017 (a)(c)(f)(g)
Occupation (ANZSCO
major group)
2011 2014 2017 Change2011-2014
Change2014-2017
Ab
orig
inal
Non
-Ab
orig
inal
Tot
al
Ab
orig
inal
Non
-Ab
orig
inal
Tot
al
Ab
orig
inal
Non
-Ab
orig
inal
Tot
al
Ab
orig
inal
Non
-Ab
orig
inal
Tot
al
Ab
orig
inal
Non
-
Tot
al
Clerical and Administrative Workers
9 12 21 7 12 19 12 15 27 -2 0 -2 5 3 8
Community and Personal Service Workers
38 15 53 28 12 40 33 7 40 -10 -3 -13 5 -5 0
Labourers 17 2 19 10 6 16 19 10 29 -7 4 -3 9 4 13Machinery Operators and Drivers
0 0 0 2 1 3 3 3 6 2 1 3 1 2 3
Managers 5 11 16 2 6 8 1 18 19 -3 -5 -8 -1 12 11
Professionals 8 26 34 13 23 36 17 19 36 5 -3 2 4 -4 0Sales Workers 1 0 1 5 0 5 6 2 8 4 0 4 1 2 3Technicians and Trades Workers 47 8 55 27 0 27 1 14 15 -20 -8 -28 -26 1
4 -12
Other occupations 0 1 1 0 0 0 0 0 0 0 -1 -1 0 0 0
Total 125 75 200 94 60 154 92 88 180 -31 -15 -46 -2 28 26
Source: Department of Trade, Business and Innovation
In 2017 in Angurugu of the: 92 jobs filled by Aboriginal persons, there were:
o 33 Community and Personal Service Workers, an increase of 5 jobs from 2014 and a decrease of 5 jobs from 2011
o 19 Labourers, an increase of 9 jobs from 2014 and an increase of 2 jobs from 2011
o 17 Professionals, an increase of 4 jobs from 2014 and an increase of 9 jobs from 2011
JOBS PROFILE ANGURUGU29
88 jobs filled by non-Aboriginal persons, there were: o 19 Professionals, a decrease of 4 jobs from 2014 and a decrease of 7 jobs from
2011o 18 Managers, an increase of 12 jobs from 2014 and an increase of 7 jobs from
2011o 15 Clerical and Administrative Workers, an increase of 3 jobs from 2014 and an
increase of 3 jobs from 2011.
JOBS PROFILE ANGURUGU30
Jobs by Industry by OccupationTable 17: Count of filled jobs by industry by occupation, 2011 (a)(f)(g)(h)
2011
Industry (ANZSIC Division)
Occupation (ANZSCO major group)
Cl
eric
al a
nd
Adm
inis
trat
ive
Co
mm
unit
y an
d Pe
rson
al
La
bour
ers
M
achi
nery
O
pera
tors
and
M
anag
ers
Pr
ofes
sion
als
Sa
les
Wor
kers
Te
chni
cian
s an
d Tr
ades
O
ther
oc
cupa
tion
s
To
tal
Arts and Recreation Services 0 0 0 0 2 0 0 0 0 2Construction 10 0 10 0 10 0 0 50 0 80Education and Training 4 25 1 0 1 22 0 0 0 53Electricity, Gas, Water and Waste Services 0 0 0 0 0 0 0 1 0 1Health Care and Social Assistance 0 3 1 0 0 7 0 0 1 12Public Administration and Safety 6 24 7 0 3 5 1 2 0 48Retail Trade 0 1 0 0 0 0 0 2 0 3Total 21 53 19 0 16 34 1 55 1 200
Source: Department of Trade, Business and Innovation
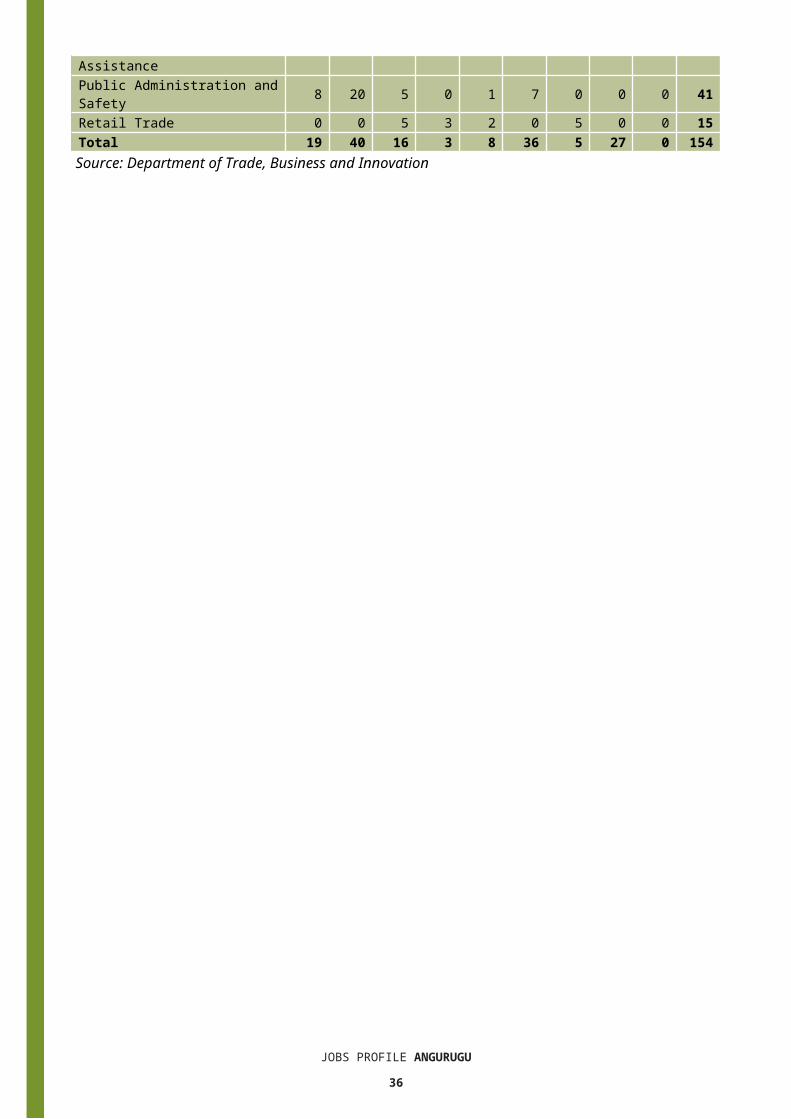
Table 18: Count of filled jobs by industry by occupation, 2014 (a)(f)(g)(h)2014
Industry (ANZSIC Division)
Occupation (ANZSCO major group)
Cl
eric
al a
nd
Adm
inis
trat
ive
Co
mm
unit
y an
d Pe
rson
al S
ervi
ce
La
bour
ers
M
achi
nery
O
pera
tors
and
M
anag
ers
Pr
ofes
sion
als
Sa
les
Wor
kers
Te
chni
cian
s an
d Tr
ades
Wor
kers
O
ther
occ
upat
ions
To
tal
Agriculture, Forestry and Fishing 2 0 2 0 0 0 0 27 0 31Arts and Recreation Services 4 1 0 0 4 6 0 0 0 15Education and Training 3 13 1 0 0 16 0 0 0 33Electricity, Gas, Water and Waste Services 0 0 1 0 0 0 0 0 0 1Health Care and Social Assistance 2 6 2 0 1 7 0 0 0 18Public Administration and Safety 8 20 5 0 1 7 0 0 0 41Retail Trade 0 0 5 3 2 0 5 0 0 15Total 19 40 16 3 8 36 5 27 0 154Source: Department of Trade, Business and Innovation
JOBS PROFILE ANGURUGU31
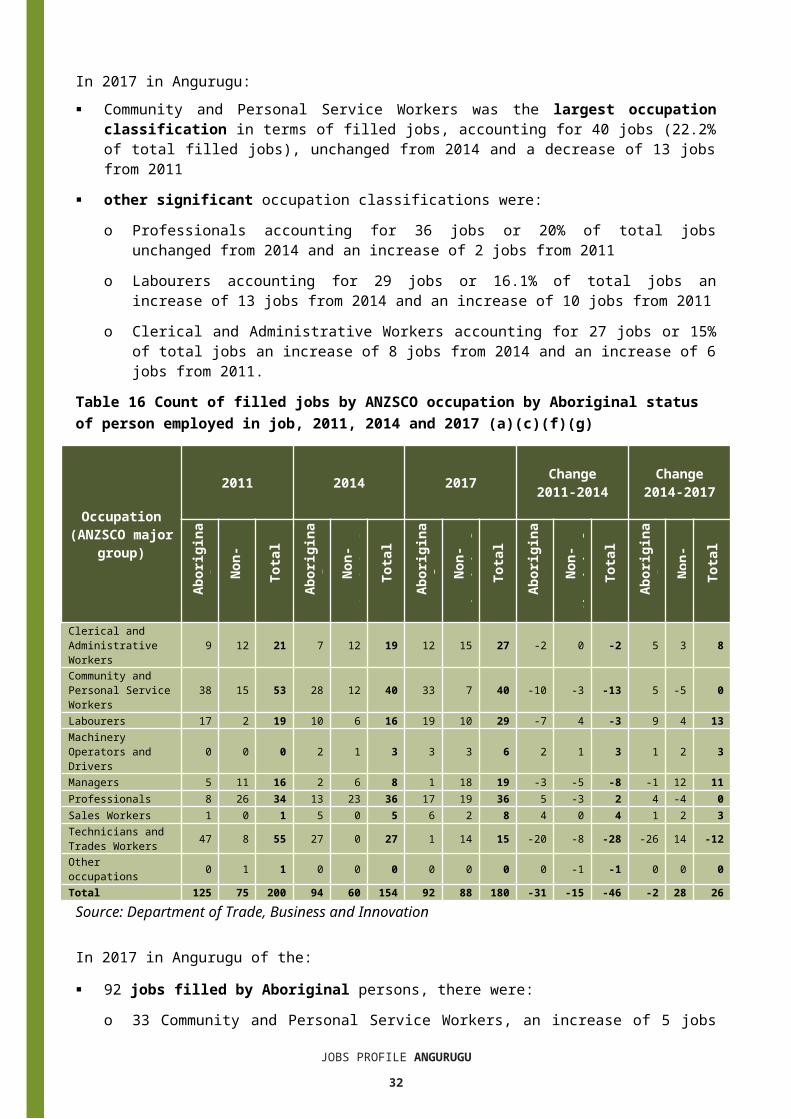
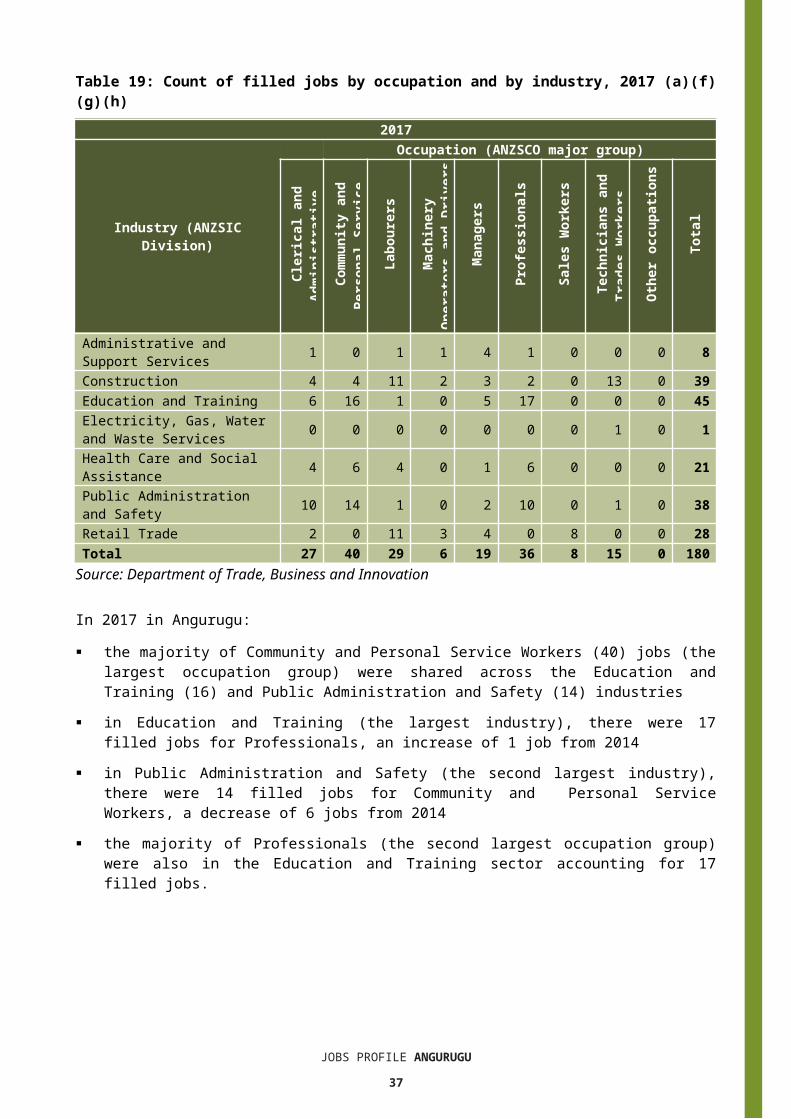
Table 19: Count of filled jobs by occupation and by industry, 2017 (a)(f)(g)(h)2017
Industry (ANZSIC Division)
Occupation (ANZSCO major group)
Cl
eric
al a
nd
Adm
inis
trat
ive
Co
mm
unit
y an
d Pe
rson
al S
ervi
ce
La
bour
ers
M
achi
nery
Ope
rato
rs
and
Dri
vers
M
anag
ers
Pr
ofes
sion
als
Sa
les
Wor
kers
Te
chni
cian
s an
d Tr
ades
Wor
kers
O
ther
occ
upat
ions
To
tal
Administrative and Support Services 1 0 1 1 4 1 0 0 0 8Construction 4 4 11 2 3 2 0 13 0 39Education and Training 6 16 1 0 5 17 0 0 0 45Electricity, Gas, Water and Waste Services 0 0 0 0 0 0 0 1 0 1Health Care and Social Assistance 4 6 4 0 1 6 0 0 0 21Public Administration and Safety 10 14 1 0 2 10 0 1 0 38Retail Trade 2 0 11 3 4 0 8 0 0 28Total 27 40 29 6 19 36 8 15 0 180
Source: Department of Trade, Business and Innovation
In 2017 in Angurugu: the majority of Community and Personal Service Workers (40) jobs (the largest
occupation group) were shared across the Education and Training (16) and Public Administration and Safety (14) industries
in Education and Training (the largest industry), there were 17 filled jobs for Professionals, an increase of 1 job from 2014
in Public Administration and Safety (the second largest industry), there were 14 filled jobs for Community and Personal Service Workers, a decrease of 6 jobs from 2014
the majority of Professionals (the second largest occupation group) were also in the Education and Training sector accounting for 17 filled jobs.
JOBS PROFILE ANGURUGU32
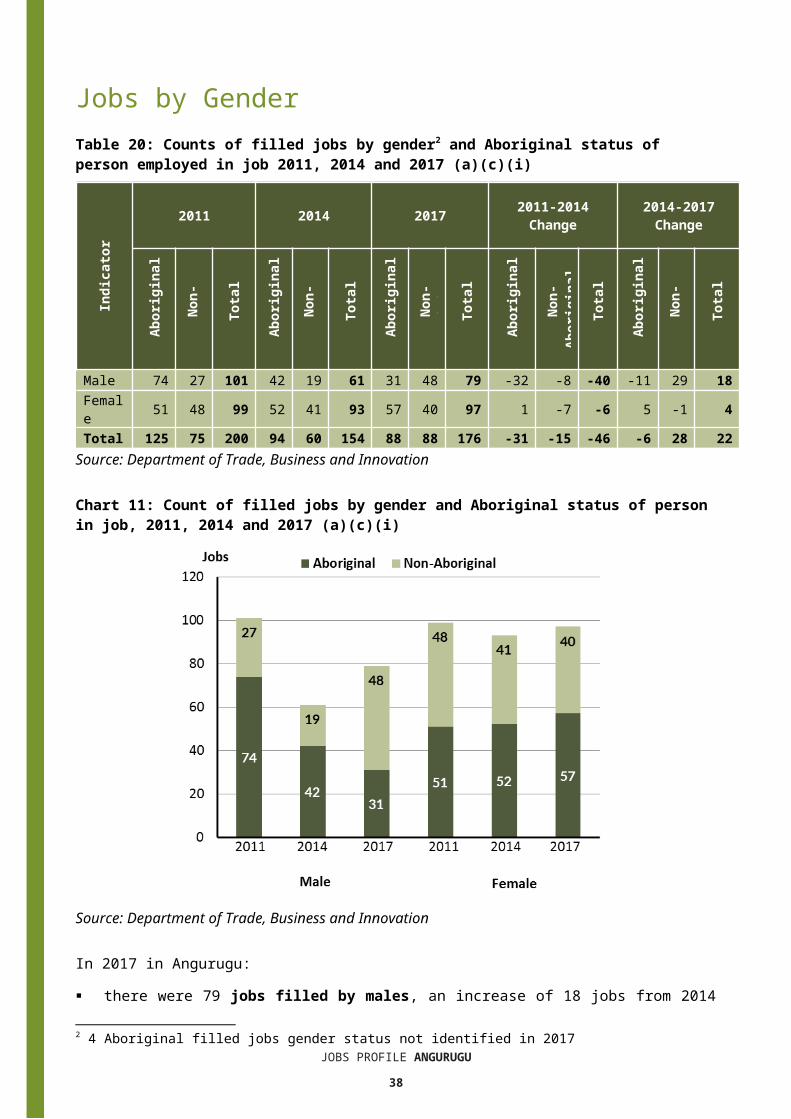
Jobs by GenderTable 20: Counts of filled jobs by gender2 and Aboriginal status of person employed in job 2011, 2014 and 2017 (a)(c)(i)
Indi
cato
r
2011 2014 2017 2011-2014 Change
2014-2017 Change
Ab
orig
inal
Non
-Ab
orig
inal
Tot
al
Ab
orig
inal
Non
-Ab
orig
inal
Tot
al
Ab
orig
inal
Non
-Ab
orig
inal
Tot
al
Ab
orig
inal
Non
-Ab
orig
inal
Tot
al
Ab
orig
inal
Non
-Ab
orig
inal
Tot
al
Male 74 27 101 42 19 61 31 48 79 -32 -8 -40 -11 29 18Female 51 48 99 52 41 93 57 40 97 1 -7 -6 5 -1 4Total 125 75 200 94 60 154 88 88 176 -31 -15 -46 -6 28 22
Source: Department of Trade, Business and Innovation
Chart 11: Count of filled jobs by gender and Aboriginal status of person in job, 2011, 2014 and 2017 (a)(c)(i)
Source: Department of Trade, Business and Innovation
In 2017 in Angurugu: there were 79 jobs filled by males, an increase of 18 jobs from 2014 and a
decrease of 22 jobs from 2011
2 4 Aboriginal filled jobs gender status not identified in 2017JOBS PROFILE ANGURUGU
33
of the 79 jobs filled by males:o 31 were Aboriginal, a decrease of 11 jobs from 2014 and a decrease of 43
jobs from 2011o 48 were non-Aboriginal, an increase of 29 jobs from 2014 and an increase of
21 jobs from 2011 there were 97 jobs filled by females, an increase of 4 jobs from 2014 and a
decrease of 2 jobs from 2011 of the 97 jobs filled by females:
o 57 were Aboriginal, an increase of 5 jobs from 2014 and an increase of 6 jobs from 2011
o 40 were non-Aboriginal, a decrease of 1 job from 2014 and a decrease of 8 jobs from 2011.
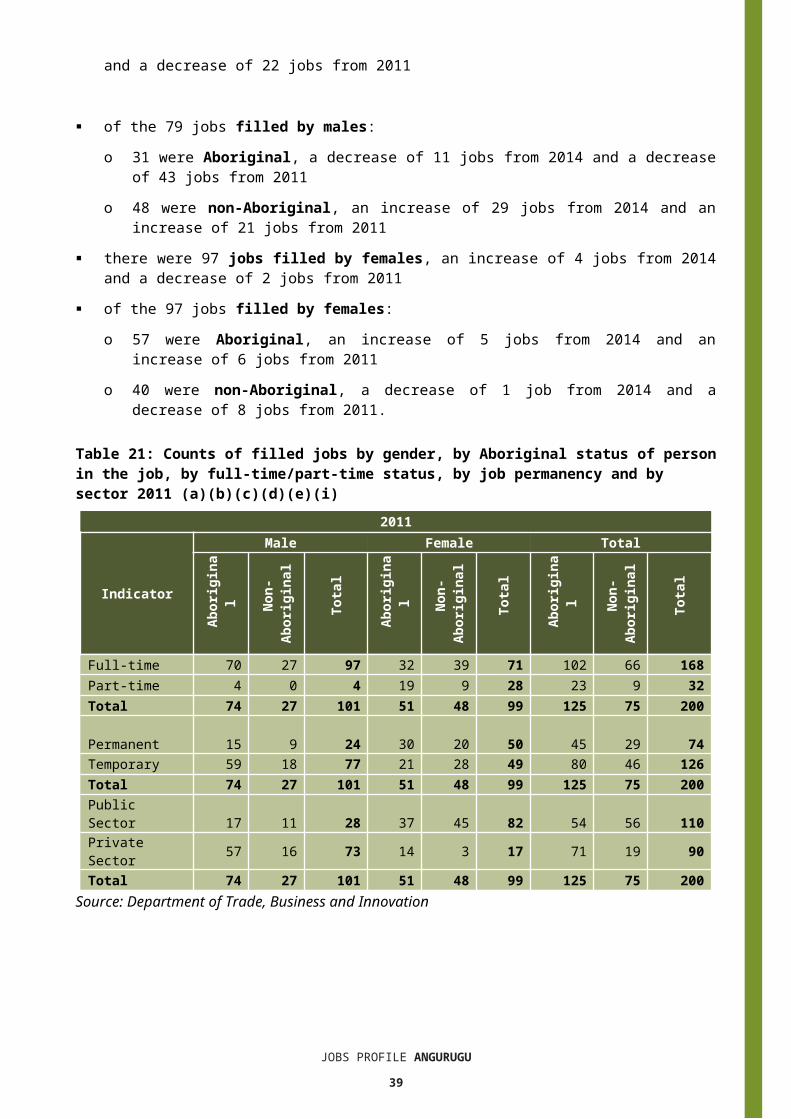
Table 21: Counts of filled jobs by gender, by Aboriginal status of person in the job, by full-time/part-time status, by job permanency and by sector 2011 (a)(b)(c)(d)(e)(i)
2011
Indicator
Male Female Total
Ab
orig
inal
Non
-Ab
orig
inal
Tot
al
Ab
orig
inal
Non
-Ab
orig
inal
Tot
al
Ab
orig
inal
Non
-Ab
orig
inal
Tot
al
Full-time 70 27 97 32 39 71 102 66 168Part-time 4 0 4 19 9 28 23 9 32Total 74 27 101 51 48 99 125 75 200
Permanent 15 9 24 30 20 50 45 29 74Temporary 59 18 77 21 28 49 80 46 126Total 74 27 101 51 48 99 125 75 200
Public Sector 17 11 28 37 45 82 54 56 110Private Sector 57 16 73 14 3 17 71 19 90Total 74 27 101 51 48 99 125 75 200
Source: Department of Trade, Business and Innovation
JOBS PROFILE ANGURUGU34
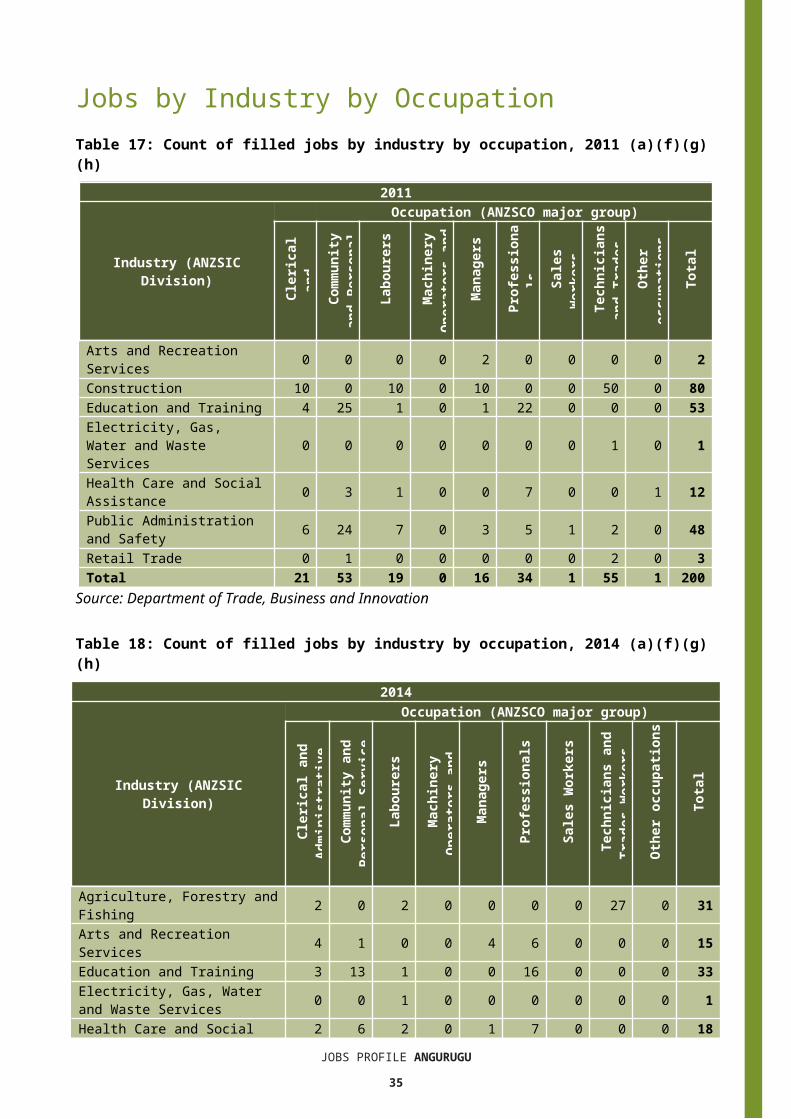
Table 22: Counts of filled jobs by gender, by Aboriginal status of person in the job, by full-time/part-time status, by job permanency and by sector 2014 (a)(b)(c)(d)(e)(i)
2014
Indicator
Male Female Total
Ab
orig
inal
Non
-Ab
orig
inal
Tot
al
Ab
orig
inal
Non
-Ab
orig
inal
Tot
al
Ab
orig
inal
Non
-Ab
orig
inal
Tot
al
Full-time 37 19 56 27 37 64 64 56 120Part-time 5 0 5 25 4 29 30 4 34Total 42 19 61 52 41 93 94 60 154
Permanent 19 11 30 26 29 55 45 40 85Temporary 23 8 31 26 12 38 49 20 69Total 42 19 61 52 41 93 94 60 154
Public Sector 19 11 30 26 27 53 45 38 83Private Sector 23 8 31 26 14 40 49 22 71Total 42 19 61 52 41 93 94 60 154
Source: Department of Trade, Business and Innovation
Table 23: Counts of filled jobs by gender3, by Aboriginal status of person in the job, by full-time/part-time status, by job permanency and by sector 2017 (a)(b)(c)(d)(e)(i)
2017
Indi
cato
r
Male Female Total
Ab
orig
inal
Non
-Ab
orig
inal
Tot
al
Ab
orig
inal
Non
-Ab
orig
inal
Tot
al
Ab
orig
inal
Non
-Ab
orig
inal
Tot
al
Full-time 17 45 62 24 32 56 44 77 121Part-time 14 3 17 33 8 41 48 11 59Total 31 48 79 57 40 97 92 88 180
Permanent 13 26 39 32 13 45 49 39 88Temporary 18 22 40 25 27 52 43 49 92Total 31 48 79 57 40 97 92 88 180
Public Sector 10 14 24 31 24 55 45 38 83Private Sector 21 34 55 26 16 42 47 50 97Total 31 48 79 57 40 97 92 88 180
Source: Department of Trade, Business and Innovation
3 4 Aboriginal filled jobs gender status not identified in 2017JOBS PROFILE ANGURUGU
35
In 2017 in Angurugu: of the 79 jobs filled by males, there were:
o 31 jobs filled by Aboriginal males, a decrease of 11 jobs from 2014 and a decrease of 43 jobs from 2011, including: 17 full-time jobs, a decrease of 20 jobs from 2014 and a decrease of 53
jobs from 2011 14 part-time jobs, an increase of 9 jobs from 2014 and an increase of 10
jobs from 2011 13 permanent jobs, a decrease of 6 jobs from 2014 and a decrease of 2
jobs from 2011 18 temporary jobs, a decrease of 5 jobs from 2014 and a decrease of 41
jobs from 2011 10 public sector jobs, a decrease of 9 jobs from 2014 and a decrease of 7
jobs from 2011 21 private sector jobs, a decrease of 2 jobs from 2014 and a decrease of
36 jobs from 2011o 48 jobs filled by non-Aboriginal males, an increase of 29 jobs from 2014 and
an increase of 21 jobs from 2011, including: 45 full-time jobs, an increase of 26 jobs from 2014 and an increase of 18
jobs from 2011 3 part-time jobs, an increase of 3 jobs from 2014 and an increase of 3 jobs
from 2011 26 permanent jobs, an increase of 15 jobs from 2014 and an increase of 17
jobs from 2011 22 temporary jobs, an increase of 14 jobs from 2014 and an increase of 4
jobs from 2011 14 public sector jobs, an increase of 3 jobs from 2014 and an increase of 3
jobs from 2011 34 private sector jobs, an increase of 26 jobs from 2014 and an increase of
18 jobs from 2011 of the 97 jobs filled by females, there were:
o 57 jobs filled by Aboriginal females, an increase of 5 jobs from 2014 and an increase of 6 jobs from 2011, including: 24 full-time jobs, a decrease of 3 jobs from 2014 and a decrease of 8 jobs
from 2011 33 part-time jobs, an increase of 8 jobs from 2014 and an increase of 14
jobs from 2011 32 permanent jobs, an increase of 6 jobs from 2014 and an increase of 2
jobs from 2011 25 temporary jobs, a decrease of 1 job from 2014 and an increase of 4 jobs
from 2011 31 public sector jobs, an increase of 5 jobs from 2014 and a decrease of 6
jobs from 2011
JOBS PROFILE ANGURUGU36
26 private sector jobs, unchanged from 2014 and an increase of 12 jobs from 2011
o 40 jobs filled by non-Aboriginal females, a decrease of 1 job from 2014 and a decrease of 8 jobs from 2011, including: 32 full-time jobs, a decrease of 5 jobs from 2014 and a decrease of 7 jobs
from 2011 8 part-time jobs, an increase of 4 jobs from 2014 and a decrease of 1 job
from 2011 13 permanent jobs, a decrease of 16 jobs from 2014 and a decrease of 7
jobs from 2011 27 temporary jobs, an increase of 15 jobs from 2014 and a decrease of 1
job from 2011 24 public sector jobs, a decrease of 3 jobs from 2014 and a decrease of 21
jobs from 2011 16 private sector jobs, an increase of 2 jobs from 2014 and an increase of
13 jobs from 2011.
JOBS PROFILE ANGURUGU37
Jobs by AgeTable 24: Counts of filled jobs by age and Aboriginal status of person employed in job, 2011, 2014 and 2017 (a)(c)(j)
Indicator
2011 2014 2017 Change2011-2014
Change2014-2017
Ab
orig
inal
Non
-Ab
orig
inal
Tot
al
Ab
orig
inal
Non
-Ab
orig
inal
Tot
al
Ab
orig
inal
Non
-Ab
orig
inal
Tot
al
Ab
orig
inal
Non
-Ab
orig
inal
Tot
al
Ab
orig
inal
Non
-
Tot
al
15-24 years 2 1 3 1 1 2 4 5 9 -1 0 -1 3 4 725-44 years 62 31 93 71 37 10
8 54 40 94 9 6 15 -17 3 -14
45+ years 61 43 104 22 22 44 30 43 73 -39 -21 -60 8 2
1 29
Total 125 75 20
0 94 60 154 92 88 18
0 -31 -15 -46 -2 28 26
Source: Department of Trade, Business and Innovation
Chart 12: Count of filled jobs by age and Aboriginal status of person in job, 2011, 2014 and 2017 (a)(c)(j)
Source: Department of Trade, Business and Innovation
In 2017 in Angurugu there were: 9 jobs filled by persons aged 15-24 years, an increase of 7 jobs from 2014 and
an increase of 6 jobs from 2011. Of these:o 4 jobs were filled by Aboriginal persons, an increase of 3 jobs from 2014 and
JOBS PROFILE ANGURUGU38
an increase of 2 jobs from 2011o 5 jobs were filled by non-Aboriginal persons, an increase of 4 jobs from 2014
and an increase of 4 jobs from 2011 94 jobs filled by persons aged 25-44 years, a decrease of 14 jobs from 2014 and
an increase of 1 job from 2011. Of these:o 54 jobs were filled by Aboriginal persons, a decrease of 17 jobs from 2014
and a decrease of 8 jobs from 2011o 40 jobs were filled by non-Aboriginal persons, an increase of 3 jobs from
2014 and an increase of 9 jobs from 2011 73 jobs filled by persons aged 45+ years, an increase of 29 jobs from 2011 and
a decrease of 31 jobs from 2011. Of these:o 30 jobs were filled by Aboriginal persons, an increase of 8 jobs from 2014 and
a decrease of 31 jobs from 2011o 43 jobs were filled by non-Aboriginal persons, an increase of 21 jobs from
2014 and unchanged from 2011.
Table 25: Counts of filled jobs by age, by Aboriginal status of person in the job, full-time/part-time status, by job permanency and by sector June-July 2011 (a)(b)(c)(d)(e)(i)
2011
Indicator
15-24 years 25-44 years 45+ years Total
Ab
orig
inal
Non
-Ab
orig
inal
Tot
al
Ab
orig
inal
Non
-Ab
orig
inal
Tot
al
Ab
orig
inal
Non
-Ab
orig
inal
Tot
al
Ab
orig
inal
Non
-Ab
orig
inal
Tot
al
Full-time 0 0 0 52 27 79 50 39 89 102 66 168
Part-time 2 1 3 10 4 14 11 4 15 23 9 32Total 2 1 3 62 31 93 61 43 10
4125 75 20
0
Permanent 1 0 1 25 10 35 19 19 38 45 29 74Temporary 1 1 2 37 21 58 42 24 66 80 46 12
6Total 2 1 3 62 31 93 61 43 10
4125 75 20
0
Public Sector 2 1 3 32 31 63 20 24 44 54 5611
0Private Sector 0 0 0 30 0 30 41 19 60 71 19 90
Total 2 1 3 62 31 93 61 43 104
125 75 20
0Source: Department of Trade, Business and Innovation
JOBS PROFILE ANGURUGU39
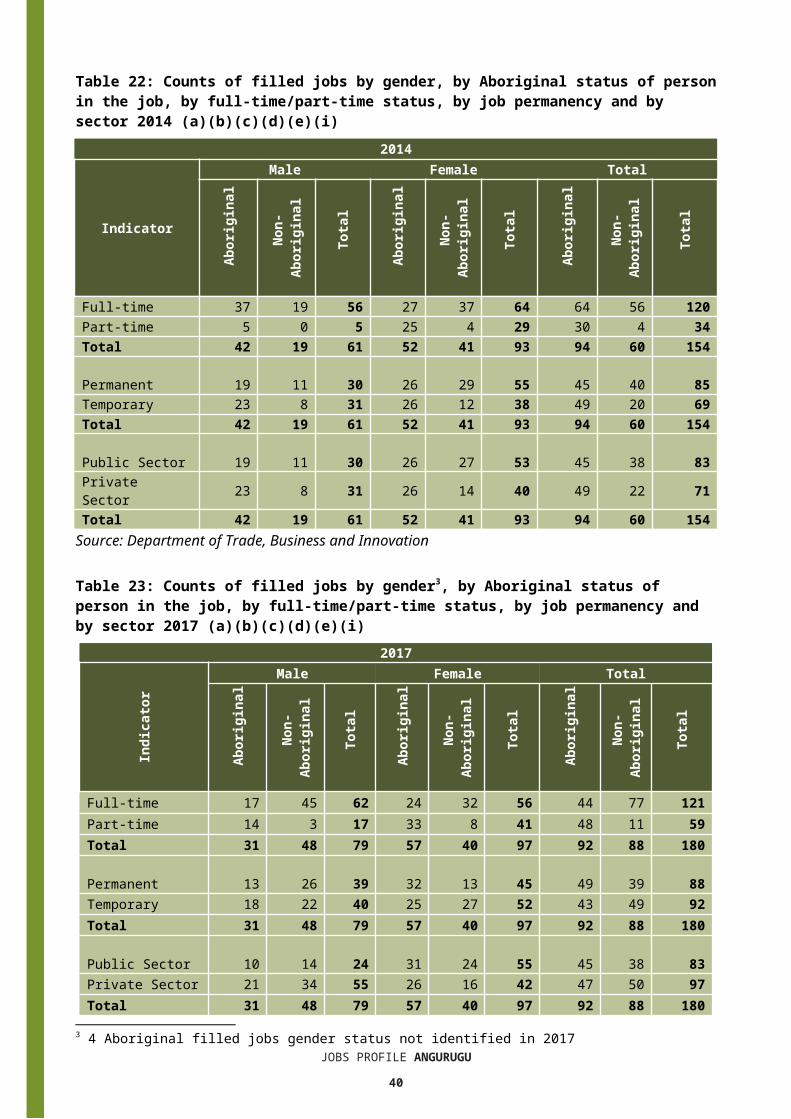
Table 26: Counts of filled jobs by age, by Aboriginal status of person in the job, by full-time/part-time status, by job permanency and by sector June-July 2014 (a)(b)(c)(d)(e)(i)
2014
Indicator
15-24 years 25-44 years 45+ years Total
Ab
orig
inal
Non
-Ab
orig
inal
Tot
al
Ab
orig
inal
Non
-Ab
orig
inal
Tot
al
Ab
orig
inal
Non
-Ab
orig
inal
Tot
al
Ab
orig
inal
Non
-Ab
orig
inal
Tot
al
Full-time 1 1 2 48 34 82 15 21 36 64 56 120Part-time 0 0 0 23 3 26 7 1 8 30 4 34Total 1 1 2 71 37 108 22 22 44 94 60 154
Permanent 1 1 2 30 22 52 14 17 31 45 40 85Temporary 0 0 0 41 15 56 8 5 13 49 20 69Total 1 1 2 71 37 108 22 22 44 94 60 154Public Sector 0 0 0 29 17 46 16 21 37 45 38 83Private Sector 1 1 2 42 20 62 6 1 7 49 22 71Total 1 1 2 71 37 108 22 22 44 94 60 154Source: Department of Trade, Business and Innovation
Table 27: Counts of filled jobs by age, by Aboriginal status of person in the job, by full-time/part-time status, by job permanency and by sector June-July 2017 (a)(b)(c)(d)(e)(i)
2017
Indicator
15-24 years 25-44 years 45+ years Total
Ab
orig
inal
Non
-Ab
orig
inal
Tot
al
Ab
orig
inal
Non
-Ab
orig
inal
Tot
al
Ab
orig
inal
Non
-Ab
orig
inal
Tot
al
Ab
orig
inal
Non
-Ab
orig
inal
Tot
al
Full-time 3 5 8 26 34 60 12 38 50 44 77 121Part-time 1 0 1 28 6 34 18 5 23 48 11 59Total 4 5 9 54 40 94 30 43 73 92 88 180
Permanent 0 3 3 30 20 50 15 16 31 49 39 88Temporary 4 2 6 24 20 44 15 27 42 43 49 92Total 4 5 9 54 40 94 30 43 73 92 88 180Public Sector 1 1 2 21 12 33 19 25 44 45 38 83Private Sector 3 4 7 33 28 61 11 18 29 47 50 97Total 4 5 9 54 40 94 30 43 73 92 88 180Source: Department of Trade, Business and Innovation
JOBS PROFILE ANGURUGU40
In 2017 in Angurugu: of the 9 jobs filled by persons aged 15-24 years, there were:
o 4 jobs filled by Aboriginal persons, of which: 3 were full-time jobs, an increase of 2 jobs from 2014 and an increase of 3
jobs from 2011 1 was a part-time job, an increase of 1 job from 2014 and a decrease of 1
job from 2011 none were permanent jobs, a decrease of 1 job from 2014 and a decrease
of 1 job from 2011 4 were temporary jobs, an increase of 4 jobs from 2014 and an increase of
3 jobs from 2011 1 was a public sector job, an increase of 1 job from 2014 and a decrease of
1 job from 2011 3 were private sector jobs, an increase of 2 jobs from 2014 and an increase
of 3 jobs from 2011 5 jobs filled by non-Aboriginal persons, of which:
5 were full-time jobs, an increase of 4 jobs from 2014 and an increase of 5 jobs from 2011
none were part-time jobs, unchanged from 2014 and a decrease of 1 job from 2011
3 were permanent jobs, an increase of 2 jobs from 2014 and an increase of 3 jobs from 2011
2 were temporary jobs, an increase of 2 jobs from 2014 and an increase of 1 job from 2011
1 was a public sector job, an increase of 1 job from 2014 and unchanged from 2011
4 were private sector jobs, an increase of 3 jobs from 2014 and an increase of 4 jobs from 2011
of the 94 jobs filled by persons aged 25-44 years, there were:o 54 jobs filled by Aboriginal persons, of which:
26 were full-time jobs, a decrease of 22 jobs from 2014 and a decrease of 26 jobs from 2011
28 were part-time jobs, an increase of 5 jobs from 2014 and an increase of 18 jobs from 2011
30 were permanent jobs, unchanged from 2014 and an increase of 5 jobs from 2011
24 were temporary jobs, a decrease of 17 jobs from 2014 and a decrease of 13 jobs from 2011
21 were public sector jobs, a decrease of 8 jobs from 2014 and a decrease of 11 jobs from 2011
33 were private sector jobs, a decrease of 9 jobs from 2014 and an increase of 3 jobs from 2011
JOBS PROFILE ANGURUGU41
o 40 jobs filled by non-Aboriginal persons, of which: 34 were full-time jobs, unchanged from 2014 and an increase of 7 jobs
from 2011 6 were part-time jobs, an increase of 3 jobs from 2014 and an increase of 2
jobs from 2011 20 were permanent jobs, a decrease of 2 jobs from 2014 and an increase
of 10 jobs from 2011 20 were temporary jobs, an increase of 5 jobs from 2014 and a decrease of
1 job from 2011 12 were public sector jobs, a decrease of 5 jobs from 2014 and a decrease
of 19 jobs from 2011 28 were private sector jobs, an increase of 8 jobs from 2014 and an
increase of 28 jobs from 2011 of the 73 jobs filled by persons aged 45+ years, there were:
o 30 jobs filled by Aboriginal persons, of which: 12 were full-time jobs, a decrease of 3 jobs from 2014 and a decrease of
38 jobs from 2011 18 were part-time jobs, an increase of 11 jobs from 2014 and an increase
of 7 jobs from 2011 15 were permanent jobs, an increase of 1 job from 2014 and a decrease of
4 jobs from 2011 15 were temporary jobs, an increase of 7 jobs from 2014 and a decrease of
27 jobs from 2011 19 were public sector jobs, an increase of 3 jobs from 2014 and a decrease
of 1 job from 2011 11 were private sector jobs, an increase of 5 jobs from 2014 and a
decrease of 30 jobs from 2011o 43 jobs filled by non-Aboriginal persons, of which:
38 were full-time jobs, an increase of 17 jobs from 2014 and a decrease of 1 job from 2011
5 were part-time jobs, an increase of 4 jobs from 2014 and an increase of 1 job from 2011
16 were permanent jobs, a decrease of 1 job from 2014 and a decrease of 3 jobs from 2011
27 were temporary jobs, an increase of 22 jobs from 2014 and an increase of 3 jobs from 2011
25 were public sector jobs, an increase of 4 jobs from 2014 and an increase of 1 job from 2011
18 were private sector jobs, an increase of 17 jobs from 2014 and a decrease of 1 job from 2011.
JOBS PROFILE ANGURUGU42
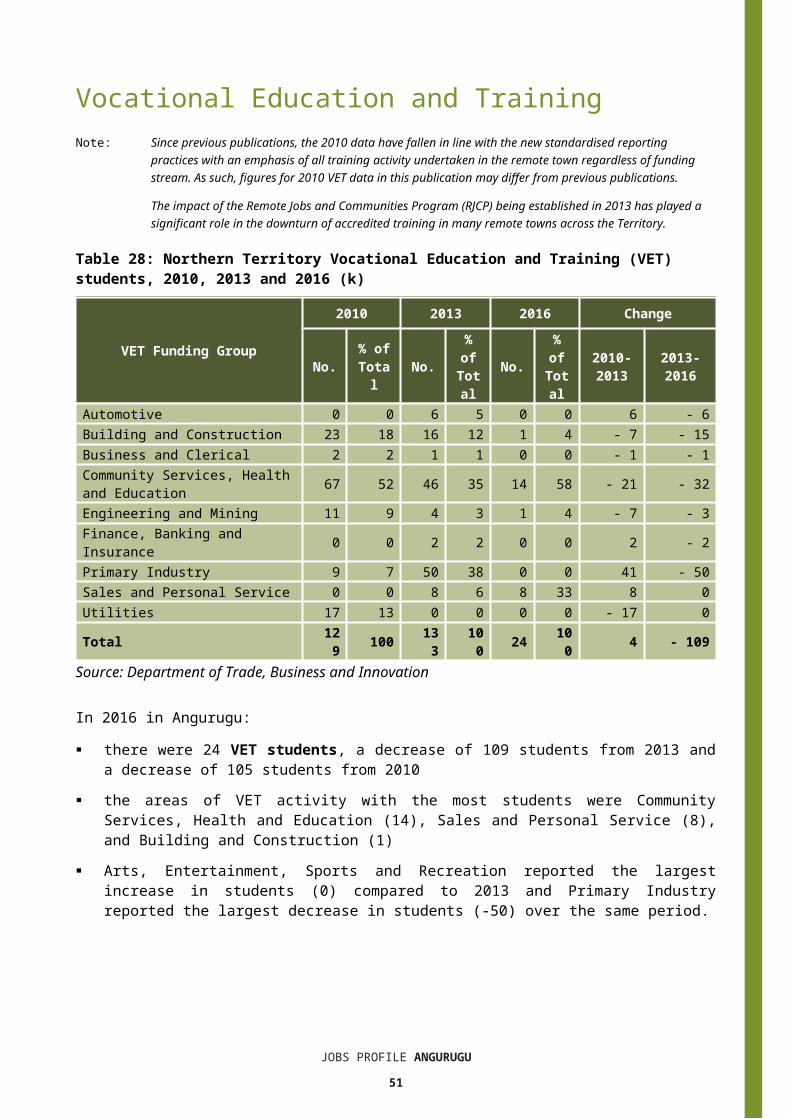
Vocational Education and TrainingNote: Since previous publications, the 2010 data have fallen in line with the new standardised
reporting practices with an emphasis of all training activity undertaken in the remote town regardless of funding stream. As such, figures for 2010 VET data in this publication may differ from previous publications.
The impact of the Remote Jobs and Communities Program (RJCP) being established in 2013 has played a significant role in the downturn of accredited training in many remote towns across the Territory.
Table 28: Northern Territory Vocational Education and Training (VET) students, 2010, 2013 and 2016 (k)
VET Funding Group
2010 2013 2016 Change
No. % of Total No.
% of
Total
No.% of
Total
2010-2013
2013-2016
Automotive 0 0 6 5 0 0 6 - 6Building and Construction 23 18 16 12 1 4 - 7 - 15Business and Clerical 2 2 1 1 0 0 - 1 - 1Community Services, Health and Education 67 52 46 35 14 58 - 21 - 32Engineering and Mining 11 9 4 3 1 4 - 7 - 3Finance, Banking and Insurance 0 0 2 2 0 0 2 - 2Primary Industry 9 7 50 38 0 0 41 - 50Sales and Personal Service 0 0 8 6 8 33 8 0Utilities 17 13 0 0 0 0 - 17 0Total 12
9 100 133
100 24 10
0 4 - 109
Source: Department of Trade, Business and Innovation
In 2016 in Angurugu: there were 24 VET students, a decrease of 109 students from 2013 and a
decrease of 105 students from 2010 the areas of VET activity with the most students were Community Services, Health
and Education (14), Sales and Personal Service (8), and Building and Construction (1)
Arts, Entertainment, Sports and Recreation reported the largest increase in students (0) compared to 2013 and Primary Industry reported the largest decrease in students (-50) over the same period.
JOBS PROFILE ANGURUGU43
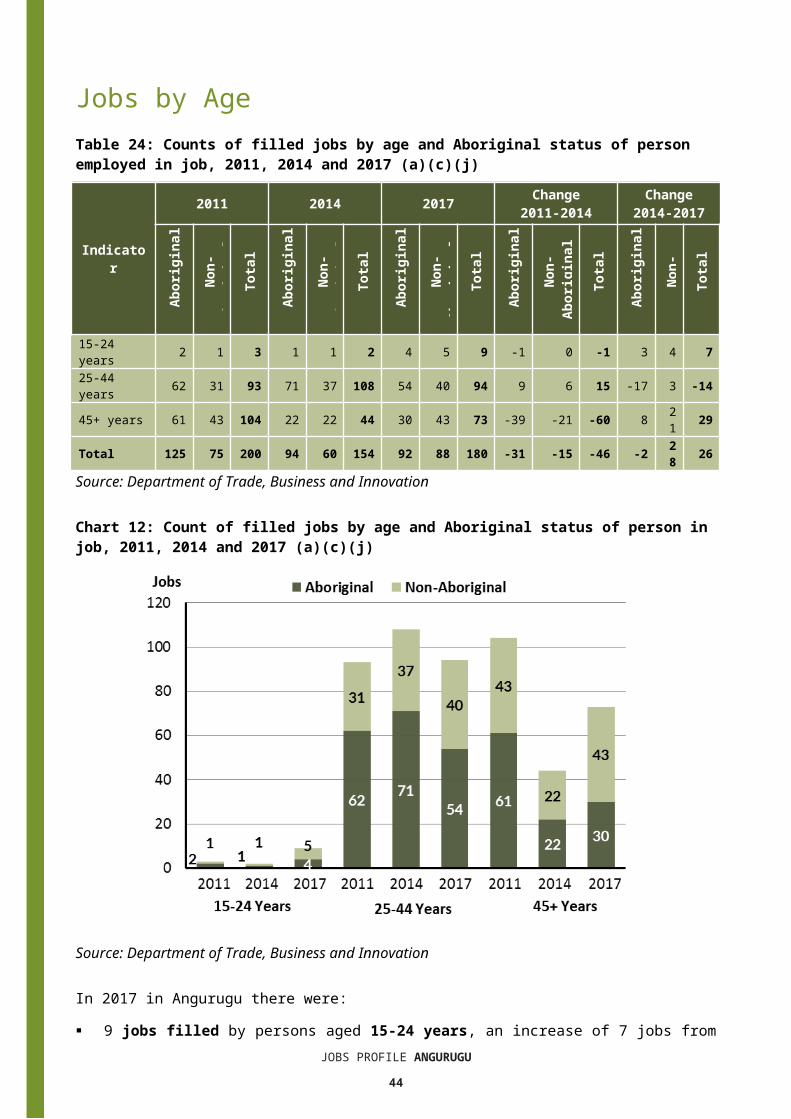
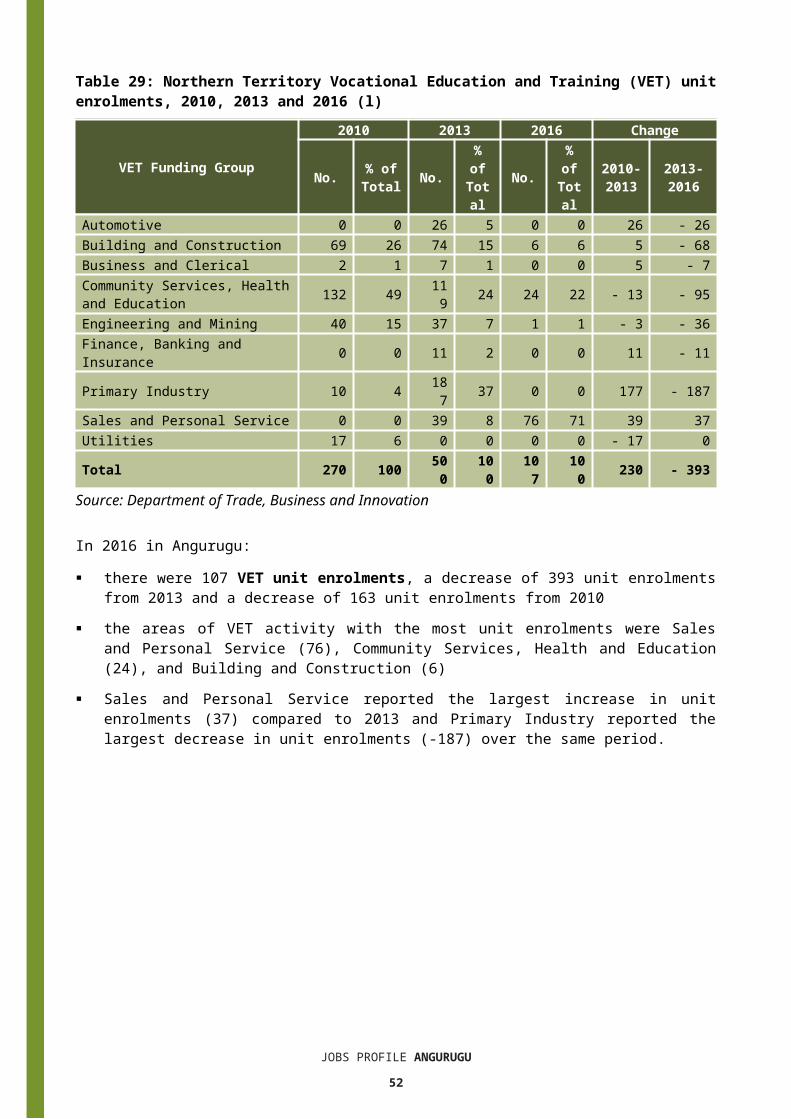
Table 29: Northern Territory Vocational Education and Training (VET) unit enrolments, 2010, 2013 and 2016 (l)
VET Funding Group
2010 2013 2016 Change
No. % of Total No.
% of
Total
No.% of
Total
2010-2013
2013-2016
Automotive 0 0 26 5 0 0 26 - 26Building and Construction 69 26 74 15 6 6 5 - 68Business and Clerical 2 1 7 1 0 0 5 - 7Community Services, Health and Education 132 49 119 24 24 22 - 13 - 95Engineering and Mining 40 15 37 7 1 1 - 3 - 36Finance, Banking and Insurance 0 0 11 2 0 0 11 - 11Primary Industry 10 4 187 37 0 0 177 - 187Sales and Personal Service 0 0 39 8 76 71 39 37Utilities 17 6 0 0 0 0 - 17 0Total 270 100 50
0 10
0 10
7 10
0 230 - 393
Source: Department of Trade, Business and Innovation
In 2016 in Angurugu: there were 107 VET unit enrolments, a decrease of 393 unit enrolments from
2013 and a decrease of 163 unit enrolments from 2010 the areas of VET activity with the most unit enrolments were Sales and Personal
Service (76), Community Services, Health and Education (24), and Building and Construction (6)
Sales and Personal Service reported the largest increase in unit enrolments (37) compared to 2013 and Primary Industry reported the largest decrease in unit enrolments (-187) over the same period.
JOBS PROFILE ANGURUGU44
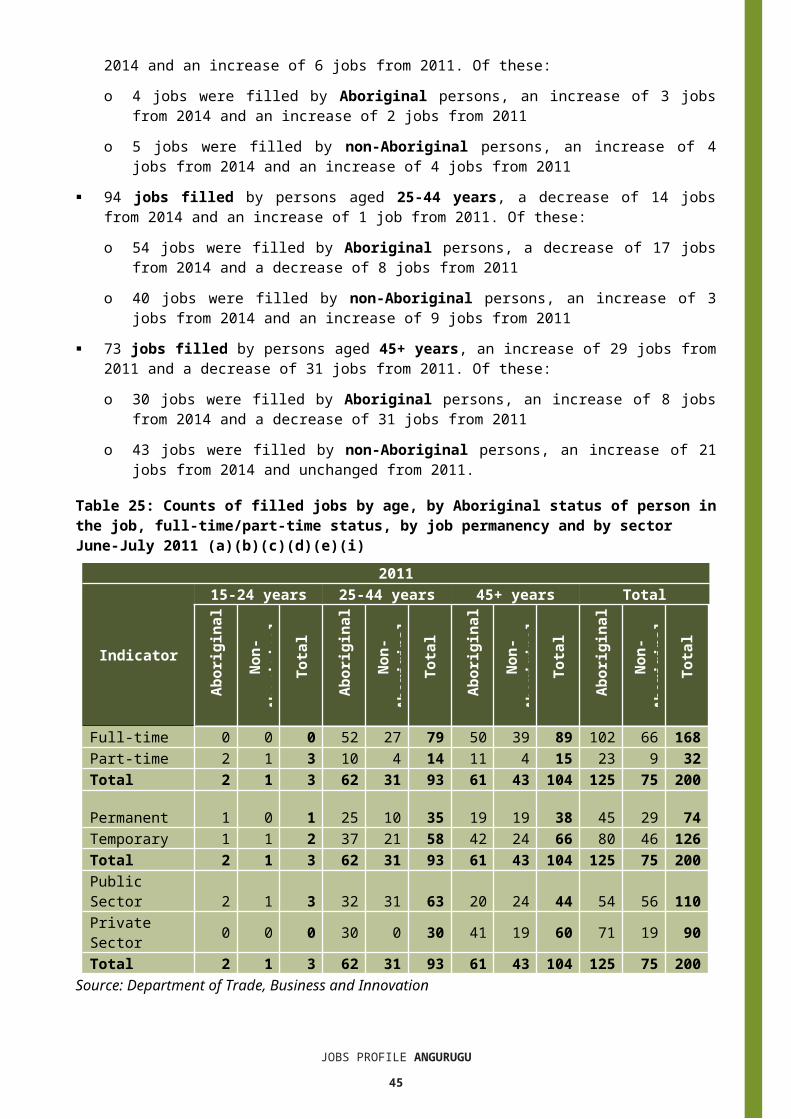
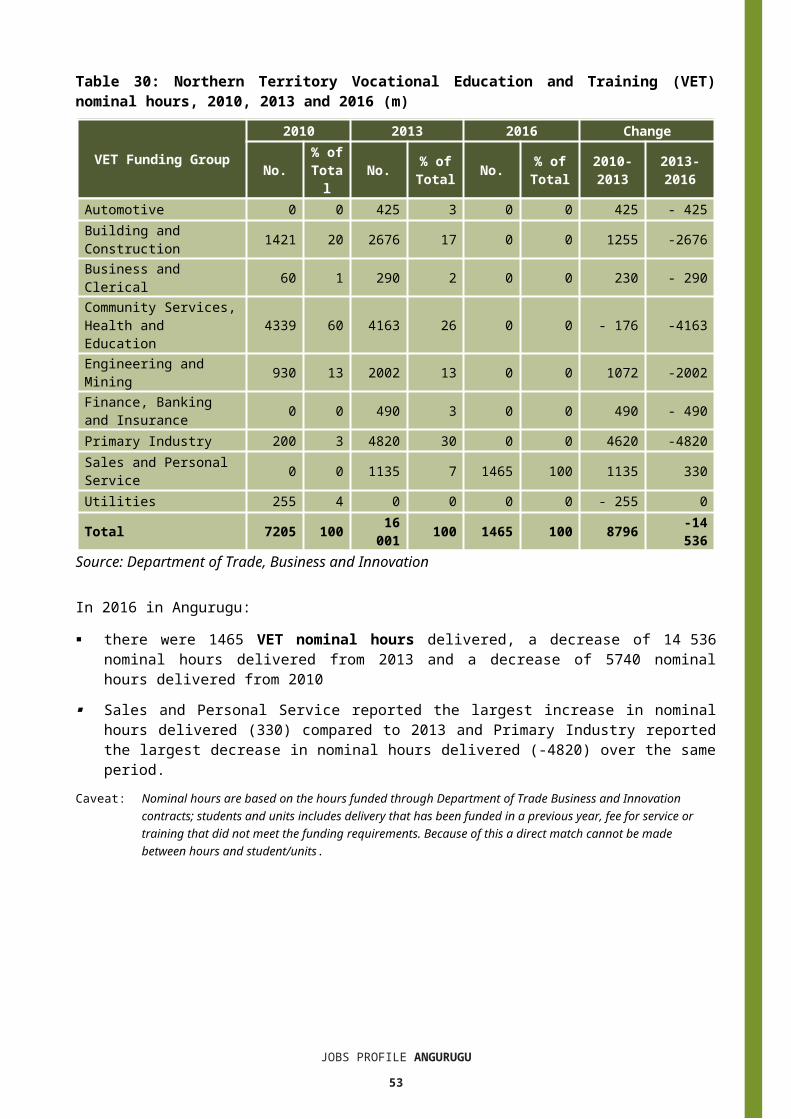
Table 30: Northern Territory Vocational Education and Training (VET) nominal hours, 2010, 2013 and 2016 (m)
VET Funding Group
2010 2013 2016 Change
No.% of
Total
No. % of Total No. % of
Total2010-2013
2013-2016
Automotive 0 0 425 3 0 0 425 - 425Building and Construction 1421 20 2676 17 0 0 1255 -2676Business and Clerical 60 1 290 2 0 0 230 - 290Community Services, Health and Education 4339 60 4163 26 0 0 - 176 -4163Engineering and Mining 930 13 2002 13 0 0 1072 -2002Finance, Banking and Insurance 0 0 490 3 0 0 490 - 490Primary Industry 200 3 4820 30 0 0 4620 -4820Sales and Personal Service 0 0 1135 7 1465 100 1135 330Utilities 255 4 0 0 0 0 - 255 0Total 7205 100 16
001 100 1465 100 8796 -14 536
Source: Department of Trade, Business and Innovation
In 2016 in Angurugu: there were 1465 VET nominal hours delivered, a decrease of 14 536 nominal
hours delivered from 2013 and a decrease of 5740 nominal hours delivered from 2010
Sales and Personal Service reported the largest increase in nominal hours delivered (330) compared to 2013 and Primary Industry reported the largest decrease in nominal hours delivered (-4820) over the same period.
Caveat: Nominal hours are based on the hours funded through Department of Trade Business and Innovation contracts; students and units includes delivery that has been funded in a previous year, fee for service or training that did not meet the funding requirements. Because of this a direct match cannot be made between hours and student/units.
JOBS PROFILE ANGURUGU45
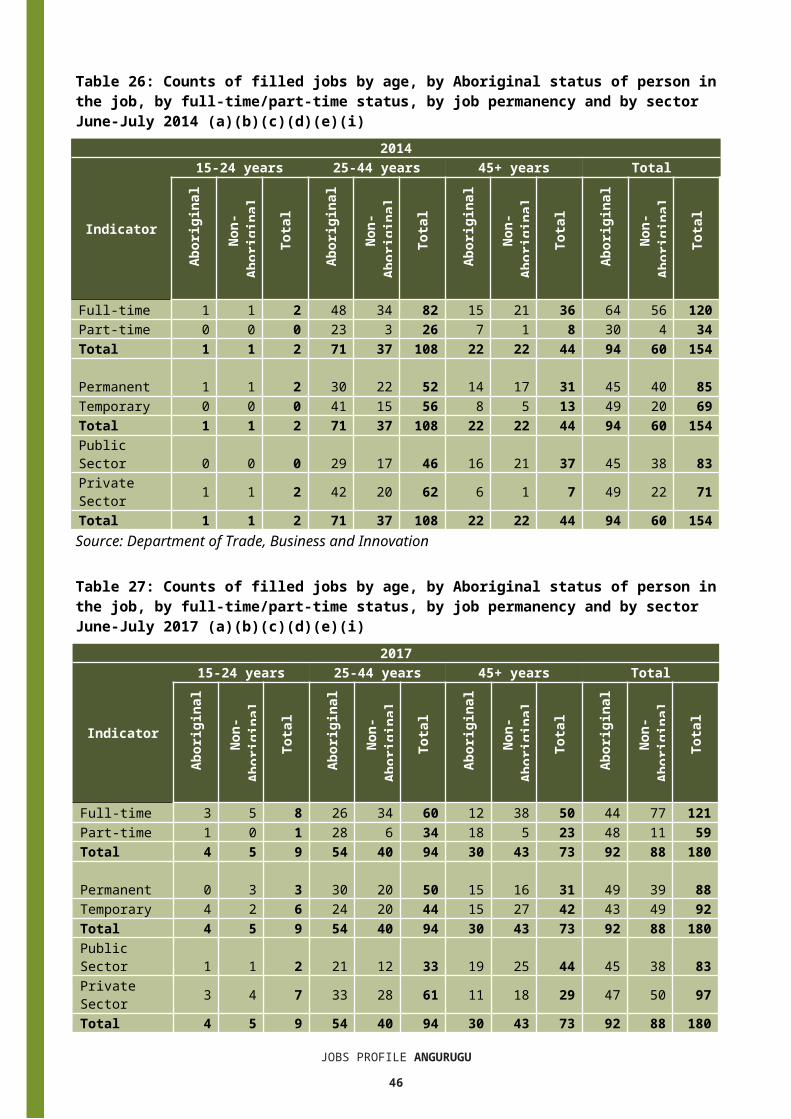
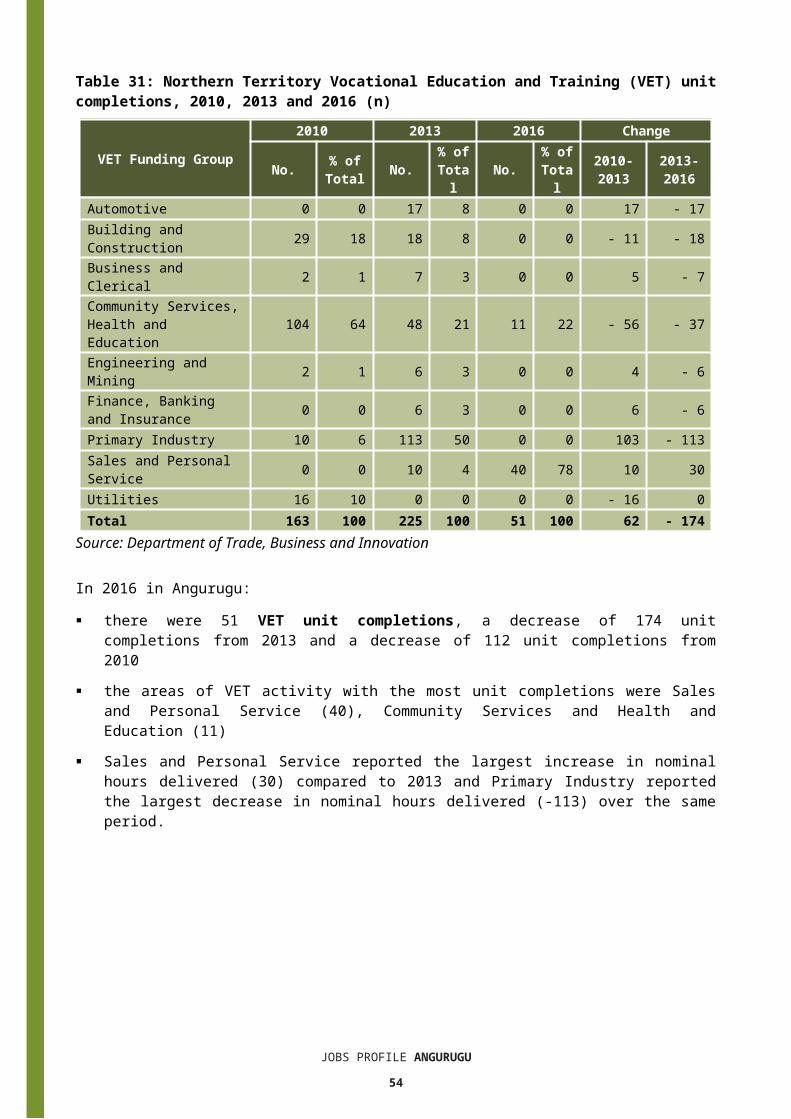
Table 31: Northern Territory Vocational Education and Training (VET) unit completions, 2010, 2013 and 2016 (n)
VET Funding Group
2010 2013 2016 Change
No. % of Total No.
% of
Total
No.% of
Total
2010-2013
2013-2016
Automotive 0 0 17 8 0 0 17 - 17Building and Construction 29 18 18 8 0 0 - 11 - 18Business and Clerical 2 1 7 3 0 0 5 - 7Community Services, Health and Education 104 64 48 21 11 22 - 56 - 37Engineering and Mining 2 1 6 3 0 0 4 - 6Finance, Banking and Insurance 0 0 6 3 0 0 6 - 6Primary Industry 10 6 113 50 0 0 103 - 113Sales and Personal Service 0 0 10 4 40 78 10 30Utilities 16 10 0 0 0 0 - 16 0Total 163 100 225 100 51 100 62 - 174
Source: Department of Trade, Business and Innovation
In 2016 in Angurugu: there were 51 VET unit completions, a decrease of 174 unit completions from
2013 and a decrease of 112 unit completions from 2010 the areas of VET activity with the most unit completions were Sales and Personal
Service (40), Community Services and Health and Education (11) Sales and Personal Service reported the largest increase in nominal hours
delivered (30) compared to 2013 and Primary Industry reported the largest decrease in nominal hours delivered (-113) over the same period.
JOBS PROFILE ANGURUGU46

PopulationTable 32: Population distribution by gender and age (p)(r)
Indicator2006 2016 Change
Male Female Total Male Femal
e Total Male Female
Total
0-4 years 47 61 108 29 24 53 -18 -37 -555-14 years 115 101 216 88 106 194 -27 5 -2215-24 years 74 100 174 125 135 260 51 35 8625-44 years 159 142 301 131 155 286 -28 13 -1545-64 years 39 64 103 64 100 164 25 36 6165+ years 11 15 26 2 7 9 -9 -8 -17TOTAL 445 483 928 439 527 966 -6 44 38
Source: Department of Trade, Business and Innovation
In 2016 in Angurugu: there were an estimated 966 persons, of which:
o 439 (45.4%) were maleo 527 (54.6%) were female
between 2006 and 2016, the overall population in Angurugu increased by 38 persons from 2006, or an average of 0.4% per year compared to 0.7% across the 28 remote towns and 1.5% Territory wide
the male population decreased by 6 persons from 2006 the female population increased by 44 persons from 2006 in 2016, the working age population (15 years and over) in Angurugu was an
estimated 719 persons (74.4% of the total population) compared with 604 persons (65.1% of the total population) in 2006. Of these:o 260 (26.9%) were between 15 and 24 years of ageo 286 (29.6%) were between 25 and 44 years of ageo 164 (17%) were between 45 and 64 years of ageo 9 (0.9%) were over 65 years of age
of the 719 persons of working age:o 322 (44.8%) were maleo 397 (55.2%) were female.
There were 0.3 jobs in Angurugu per working age person compared to 0.4 jobs per working age person across the Northern Territory.
JOBS PROFILE ANGURUGU47
Chart 13: Population by Aboriginal status compared to the 28 remote towns
and the NT (p)(q)
Source: Department of Trade, Business and Innovation
In 2016 in Angurugu: 98.3% of the population in Angurugu were Aboriginal, compared to 97.1% in
2006 89.4% of the population across all 28 remote towns were Aboriginal 28.3% of the Northern Territory population were Aboriginal.Table 33: Unemployment and participation rates by Aboriginal status compared to the NT (q)
Angurugu Northern Territory
Aboriginal
Non-Aborigin
alTotal Aborigin
alNon-
Aboriginal
Total
Unemployment rate 47.2% 0.0% 43.2% 26.7% 3.8% 7.0%Participation rate 30.7% 100.0% 32.1% 41.0% 79.9% 70.6%
Source: Department of Trade, Business and Innovation
In 2016 in Angurugu the: total unemployment rate was 43.2% compared to 7% for the total Northern
Territory Aboriginal unemployment rate was 47.2% compared to 26.7% for the total
Northern Territory non-Aboriginal unemployment rate was 0% compared to 3.8% for the total
Northern Territory total participation rate was 32.1% compared to 70.6% for the total Northern
Territory Aboriginal participation rate was 30.7% compared to 41% for the total
Northern Territory non-Aboriginal participation rate was 100% compared to 79.9% for the total
Northern Territory.JOBS PROFILE ANGURUGU
48
Community Development ProgrammeTable 34: Community Development Programme Aboriginal Job Seekers, 30 April 2018 (o)
Indicator AboriginalNo. %
Total Aboriginal Job Seekers 228 N/AAge (years)
15-24 62 27.225-44 112 49.145+ 54 23.7
Total 228 100.0Gender
Male 103 45.2Female 125 54.8
Total 228 100.0Employment Outcome - 1 July 2015 to 30 April 2018
13 Weeks 76 64.426 Weeks 42 35.6
Currently in Activities 167 Source: Department of Prime Minister and Cabinet
Chart 14: Community Development Programme Aboriginal Job Seekers by Gender and Age Group, 30 April 2018 (o)
10345.2%
12554.8%
Gender
Male Female
6227.2%
11249.1%
5423.7%
Age (years)
15-24 25-44 45+
Source: Department of Prime Minister and Cabinet
As at 30 April 2018, in Angurugu, there were 228 CDP Aboriginal job seekers, of these: 103 (45.2%) were male and 125 (54.8%) were female 62 (27.2%) were aged 15-24 years, 112 (49.1%) were aged 25-44 years, and 54
(23.7%) were aged 45+ years between 1 July 2015 and 30 April 2018, 76 had reached the 13 week reporting
milestone and 42 had reached the 26 week reporting milestone 167 were currently in activities.
JOBS PROFILE ANGURUGU49
JOBS PROFILE ANGURUGU50
BusinessesTable 35: Businesses by sector (d)(s)
Business NameReported on in 2011
Reported on in 2014
Reported on in 2017
PUBLIC SECTOR Department of Education Yes Yes YesDepartment of Health Yes Yes YesDepartment of Human Services trading as Centrelink Yes Yes YesDepartment of the Prime Minister and Cabinet Yes Yes YesEast Arnhem Regional Council Yes Yes YesTerritory Families No No YesPRIVATE SECTORAA Electrical Pty Ltd Yes No NoAnindilyakwa Services Aboriginal Corporation (ASAC) No Yes YesGEBIE Civil and Construction Pty Ltd Yes No YesGroote Eylandt & Milyakburra Youth Development Unit No Yes YesGroote Eylandt Aboriginal Trust No Yes YesGroote Eylandt Bush Shop (NT) Pty Ltd No Yes YesGroote Eylandt Linguistics Yes No NoKag, Kun Huy trading as Angurugu Chinese Takeaway No Yes YesMJD Foundation No No YesThe Trustee for AA Essential Services Trust No Yes YesWarningakalinga Aboriginal Corporation trading as Yimiljumanja Store Yes Yes YesSource: Department of Trade, Business and Innovation
Note: Business names captured across the three survey periods have been identified by the current 2017 Business ABN name listed as at 2017.
In 2017 in Angurugu there were: 15 businesses reported on, of which:
o 6 businesses were from the Public Sector (40%)o 9 businesses were from the Public Sector (60%)
8 businesses operating that were not operating in 2011.
JOBS PROFILE ANGURUGU51
Notes(a) These counts represent numbers of filled jobs and not numbers of persons. As such the
totals represent the total number of filled jobs, not the total number of employees. This count is not directly comparable to the total number of employed persons as a person may have several jobs or one job may be shared by more than one person.
(b) Full-time is defined as a job usually requiring 35 hours or more per week or that required 35 hours or more work during the reference week. Part-time is defined as a job usually requiring less than 35 hours per week or that required less than 35 hours work during the reference week. The reference week refers to the period that respondents were asked to provide information about. In most instances it would be the week prior to the week the questionnaire was completed. Questionnaires were predominantly conducted in June and July.
(c) Care needs to be taken when analysing the counts of filled jobs by the Aboriginal status of persons in the jobs. The Aboriginal status of the person employed in a job was reported by the business representative completing the questionnaire.
(d) Sector was classified using the Standard Economic Sector of Classifications of Australia (SESCA), 2008.
(e) Job permanency is classified according to what the business believes the level of job permanency is based on guidelines provided by data collectors. Those guidelines state a permanent job has paid annual and/or sick leave entitlements while a temporary job includes casual and fixed-term contract jobs.
(f) Classified according to the Australian and New Zealand Standard Classification of Occupations (ANZSCO), 2006, major occupation level.
(g) Other occupations include jobs where occupation was not stated, not known or inadequately described.
(h) Classified using the Australian and New Zealand Standard Industrial Classification (ANZSIC), 2006, division level.
(i) Care needs to be taken when analysing the counts of filled jobs by the gender of persons in the jobs. The gender of the person employed in a job is reported by the business representative completing the questionnaire.
(j) Care needs to be taken when analysing the counts of filled jobs by the age of persons in the jobs. The age of the person employed in a job is reported by the business representative completing the questionnaire.
(k) Students represent the number of individual clients that enrolled in a Vocational Education and Training unit during the calendar year.
(l) Unit enrolments represent the count of individual units that students enrolled in during the calendar year.
(m)Nominal hours delivered is the sum of the nominal hours of the units commenced during the calendar year regardless of when the course enrolment commenced.
(n) Unit completions are the count of all successfully completed units reported in the calendar year regardless of the year of commencement of the units.
(o) The Community Development Programme (CDP) supports job seekers in remote Australia to build skills, address barriers and contribute to their communities through a range of flexible activities. Under the CDP, job seekers with activity requirements are expected to do up to 25 hours per week of work-like activities that benefit their community. It should be noted that some CDP participants may be reported on within the profile if they are attached to a filled position with an employer captured in the survey. Due to confidentiality issues, data below 20 people is not published.
(p) Population estimates for both 2006 and 2016 are taken from the estimated resident population (ERP) data produced by the Australian Bureau of Statistics (ABS) and based on Australian Statistical Geography Standard (ASGS) Statistical Area Level 1 (SA1) regions. ERP are official estimates of the Australian population, which link people to a place of usual residence with Australia. All ERP data sources, including the Census of Population and Housing (Census), are subject to error (including inaccuracies in collection, recording and processing data) and should be used with caution.
(q) Indigenous population proportions, unemployment and workforce participation rates are based on ABS Census counts at ASGS Indigenous Locations (ILOCs) for each remote town.
(r) Working-age population includes all residents aged 15 years and over (commonly referred to as the civilian population) and consists of persons that are employed,
JOBS PROFILE ANGURUGU52
unemployed or not in the labour force.(s) A ‘business’ has been defined as any organisation that has undertaken productive
activities in the last year, including companies, non-profit organisations, government departments and enterprises operating within the designated remote geography (town), and has one or more employees in paid employment and an Australian Business Number (ABN).
JOBS PROFILE ANGURUGU53
Abbreviations and AcronymsABN Australian Business NumberABS Australian Bureau of StatisticsANZSCO Australian and New Zealand Standard Classification of OccupationsANZSIC Australian and New Zealand Standard Industrial ClassificationASGS Australian Statistical Geography StandardCDP Community Development ProgrammeERP Estimated Resident PopulationILOC Indigenous Locations nec Not Elsewhere ClassifiedNo. NumberPerm Permanentppt Percentage pointRJCP Remote Jobs and Communities ProgramTemp TemporarySA1 Statistical Area Level 1VET Vocational Education and Training
JOBS PROFILE ANGURUGU54