andulela investment holdings limited procedures and adequate segregation of duties to ensure an...
TRANSCRIPT
AN
DU
LE
LA
IN
VE
ST
ME
NT
HO
LD
ING
S L
IMIT
ED
IN
TE
GR
AT
ED
AN
NU
AL
RE
PO
RT
20
12
30
CONTeNTs
ANdUlelA iNvesTmeNT hOldiNgs limiTed(Registration number 1950/037061/06)
CONsOlidATed FiNANCiAl sTATemeNTsFOR The YeAR eNded 31 deCemBeR 2012
The reports and statements set out below comprise the financial statements presented to the shareholders:
Corporate governance statement 31
Directors’ responsibility and approval 32
Declaration by the Company Secretary 33
Report of the Audit, Risk and Compliance Committee
34
Directors’ report 35
Report of the independent auditors 39
Statement of financial position 40
Statement of comprehensive income 41
Statement of changes in equity 42
Statement of cash flows 44
Accounting policies 45
Notes to the financial statements 64
AN
DU
LE
LA
IN
VE
ST
ME
NT
HO
LD
ING
S L
IMIT
ED
IN
TE
GR
AT
ED
AN
NU
AL
RE
PO
RT
20
12
31
CORpORATe gOveRNANCe sTATemeNTFOR The YeAR eNded 31 deCemBeR 2012
Principles of corporate governance and structuresAll the key principles underlying the King III Code of Corporate Governance are ethically managed, with ongoing monitoring of compliance in accordance therewith and with any changes effected from time to time. Unless otherwise noted, the Group and its directors have complied with King III throughout the accounting period.
Board of DirectorsAt date hereof, the Board comprises six members, being four independent non-executive and two executive directors. The non-executive directors’ calibre and experience are of such a nature that they bring an independent value-added and objective viewpoint on all strategic decisions, processes and standards. The Chairman is an independent non-executive director. No single individual director has unfettered powers of decision-making. The Board has the following subcommittees: an Audit, Risk and Compliance Committee, a Remuneration and Nomination Committee and a Social and Ethics Committee, through which it fulfils its statutory functions.
The Remuneration and Nomination Committee is tasked with identifying appropriate potential appointments to the Board and, following an interview process, referring candidates for appointment to the Board. The committee is also tasked with setting the Group remuneration policy and advising on remuneration for executive directors, senior management and prescribed officers through a formal and transparent process. This subcommittee comprises three Independent non-executive directors and the respective functions of this committee are chaired by an Independent non-executive director as set out on page 21.
A Social and Ethics Committee is tasked with monitoring and reporting to the Board on corporate social responsibilities as well as the Group’s activities, having regard to applicable legislation, other legal requirements or prevailing codes of best practice as defined by King III. This subcommittee comprises three members and is chaired by an independent non-executive director.
Board proceduresRegular Board meetings regulate the affairs of the Company and the activities of executive management. Directors have access to the advice and services of the Company Secretary and are entitled to seek independent and professional advice about the affairs of the Company at the Company’s expense.
SponsorJava Capital acts as sponsor to the Company in compliance with the Listings Requirements of the JSE Limited.
Company SecretaryThe Company Secretary is required to provide the directors of the Company, collectively and individually, with detailed guidance as to their duties, responsibilities and powers.
The Company Secretary is also required to ensure that the directors are aware of all laws, legislation, regulations and matters of ethics and good governance relevant to or affecting the Company.
The Company Secretary is required to ensure that minutes of all shareholders’ meetings, directors’ meetings and meetings of the various subcommittees of the Board of Directors are properly recorded in accordance with the Companies Act. These minutes are circulated to all members of the Board. The Company Secretary is Mrs HI Kazi.
The Board of Directors have considered and satisfied themselves with regard to the competence, qualifications and experience of the Company Secretary.
Directors’ attendance at Board and Committee meetings under review:
Director Board Audit Remuneration
Social and
Ethics
Number of meetings held during the period under review 4 6 2 2
MJ Husain (Independent non-executive Chairman) 3/4 4/6** 2/2
A Kaka (Chief Executive Officer) 4/4 6/6* 2/2* 2/2
PC de Jager (Chief Financial Officer) 4/4 6/6* 2/2* 2/2
GR Rosenthal (Independent Non-executive Director) 4/4 6/6 2/2
PE du Preez (Independent Non-executive Director) 4/4 6/6 2/2
I Kajee (Director) 4/4 2/2
CWN Molope (Independent Non-executive Director)
appointed 1 July 2012 2/4 2/6
* By invitation.
** Resigned as member of the Audit, Risk and Compliance Committee on 1 July 2012.

AN
DU
LE
LA
IN
VE
ST
ME
NT
HO
LD
ING
S L
IMIT
ED
IN
TE
GR
AT
ED
AN
NU
AL
RE
PO
RT
20
12
32
diReCTORs’ RespONsiBiliTY ANd AppROvAlFOR The YeAR eNded 31 deCemBeR 2012
The directors are required by the Companies Act of South Africa, as amended, to maintain adequate accounting records and are responsible for the content and integrity of the financial statements and related financial information included in this report. It is their responsibility to ensure that the financial statements fairly present the state of affairs of the Company as at 31 December 2012 and the results of its operations and cash flows for the period then ended, in conformity with International Financial Reporting Standards, the SAICA Financial Reporting Guides as issued by the Accounting Practices Committee and Financial Reporting Pronouncements as issued by the Financial Reporting Standards Council, the requirements of the South African Companies Act, 2008 as amended and the JSE Limited Listings Requirements. Independent external auditors are engaged to express an independent opinion on the financial statements.
The financial statements are prepared in accordance with International Financial Reporting Standards and are based upon appropriate accounting policies consistently applied and supported by reasonable and prudent judgements and estimates.
The directors acknowledge that they are ultimately responsible for the system of internal financial control established by the Company and place considerable importance on maintaining a strong control environment. To enable the directors to meet these responsibilities, the Board of Directors sets standards for internal control aimed at reducing the risk of error or loss in a cost effective manner. The standards include the proper delegation of responsibilities within a clearly defined framework, effective accounting procedures and adequate segregation of duties to ensure an acceptable level of risk.
These controls are monitored throughout the Company and all employees are required to maintain the highest ethical standards in ensuring the Company’s business is conducted in a manner that in all reasonable circumstances is above reproach. The focus of risk management in the Company is on identifying, assessing, managing and monitoring all known forms of risk across the Company. While operating risk cannot be fully eliminated, the Company endeavours to minimise it by ensuring that appropriate infrastructure, controls, systems and ethical behaviour are applied and managed within predetermined procedures and constraints.
The directors are of the opinion, based on the information and explanations given by management, that the system of internal control provides reasonable assurance that the financial records may be relied on for the preparation of the financial statements. However, any system of internal financial control can provide only reasonable, and not absolute, assurance against material misstatement or loss.
The directors have reviewed the Company’s cash flow forecast for the year ending 31 December 2013 and, in the light of this review and the current financial position, they are satisfied that the Company has or has access to adequate resources to continue in operational existence for the foreseeable future.
Although the Board of Directors is primarily responsible for the financial affairs of the Company, they are supported by the Company’s external auditors.
The external auditors are responsible for independently reviewing and reporting on the Company’s financial statements. The financial statements have been examined by the Company’s external auditors and their report is presented on page 39.
The financial statements set out on pages 40 to 92, which have been prepared on the going concern basis, were approved by the Board of Directors on 24 June 2013 and were signed on its behalf by:
MJ Husain A KakaIndependent Non-executive Chairman Chief Executive Officer
Sandton24 June 2013
AN
DU
LE
LA
IN
VE
ST
ME
NT
HO
LD
ING
S L
IMIT
ED
IN
TE
GR
AT
ED
AN
NU
AL
RE
PO
RT
20
12
33
deClARATiON BY The COmpANY seCReTARY FOR The YeAR eNded 31 deCemBeR 2012
I declare that, to the best of my knowledge, in terms of Section 88(2)(e) of the Companies Act, No 71 of 2008 (as amended), (“the Companies Act”), the Company has lodged with the Companies and Intellectual Property Commission (“CIPC”) all such returns as are required of a public company in terms of the Companies Act and that all such returns are true, correct and up to date in respect of the financial period reported upon.
HI Kazi (Mrs)Nat Dip (Company Administration) Company Secretary
24 June 2013
AN
DU
LE
LA
IN
VE
ST
ME
NT
HO
LD
ING
S L
IMIT
ED
IN
TE
GR
AT
ED
AN
NU
AL
RE
PO
RT
20
12
34
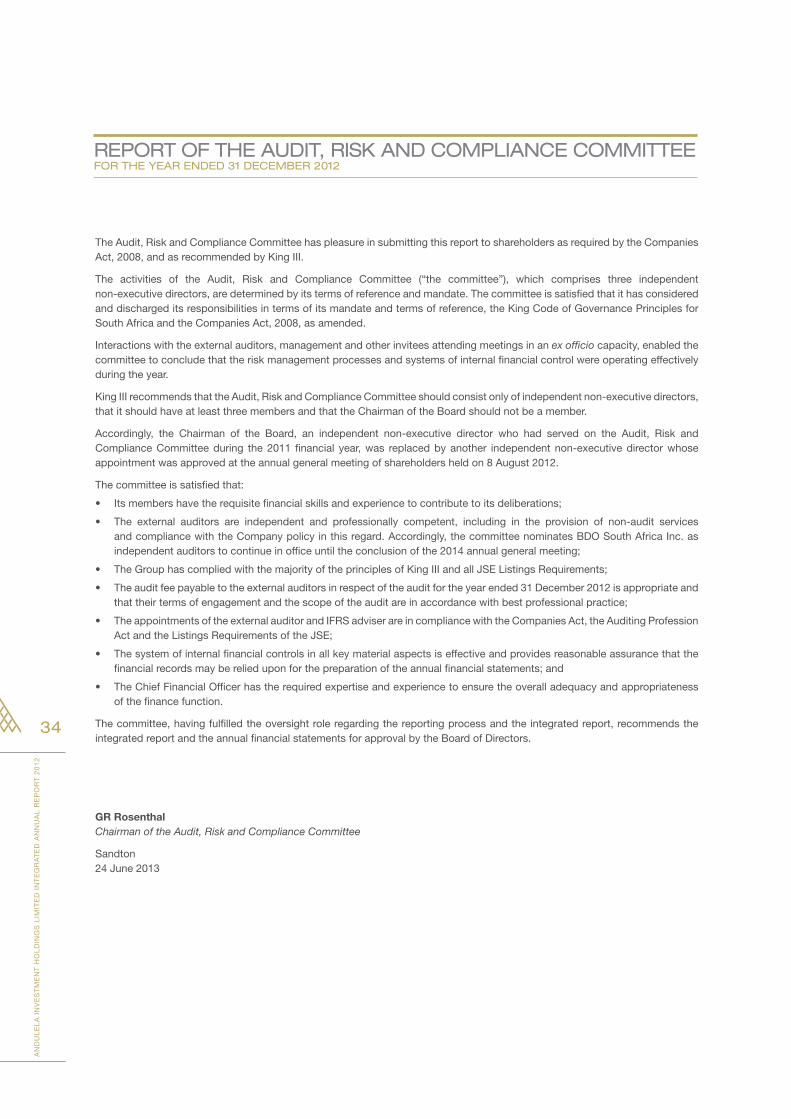
RepORT OF The AUdiT, Risk ANd COmpliANCe COmmiTTeeFOR The YeAR eNded 31 deCemBeR 2012
The Audit, Risk and Compliance Committee has pleasure in submitting this report to shareholders as required by the Companies Act, 2008, and as recommended by King III.
The activities of the Audit, Risk and Compliance Committee (“the committee”), which comprises three independent non-executive directors, are determined by its terms of reference and mandate. The committee is satisfied that it has considered and discharged its responsibilities in terms of its mandate and terms of reference, the King Code of Governance Principles for South Africa and the Companies Act, 2008, as amended.
Interactions with the external auditors, management and other invitees attending meetings in an ex officio capacity, enabled the committee to conclude that the risk management processes and systems of internal financial control were operating effectively during the year.
King III recommends that the Audit, Risk and Compliance Committee should consist only of independent non-executive directors, that it should have at least three members and that the Chairman of the Board should not be a member.
Accordingly, the Chairman of the Board, an independent non-executive director who had served on the Audit, Risk and Compliance Committee during the 2011 financial year, was replaced by another independent non-executive director whose appointment was approved at the annual general meeting of shareholders held on 8 August 2012.
The committee is satisfied that:
• Its members have the requisite financial skills and experience to contribute to its deliberations;
• The external auditors are independent and professionally competent, including in the provision of non-audit services and compliance with the Company policy in this regard. Accordingly, the committee nominates BDO South Africa Inc. as independent auditors to continue in office until the conclusion of the 2014 annual general meeting;
• The Group has complied with the majority of the principles of King III and all JSE Listings Requirements;
• The audit fee payable to the external auditors in respect of the audit for the year ended 31 December 2012 is appropriate and that their terms of engagement and the scope of the audit are in accordance with best professional practice;
• The appointments of the external auditor and IFRS adviser are in compliance with the Companies Act, the Auditing Profession Act and the Listings Requirements of the JSE;
• The system of internal financial controls in all key material aspects is effective and provides reasonable assurance that the financial records may be relied upon for the preparation of the annual financial statements; and
• The Chief Financial Officer has the required expertise and experience to ensure the overall adequacy and appropriateness of the finance function.
The committee, having fulfilled the oversight role regarding the reporting process and the integrated report, recommends the integrated report and the annual financial statements for approval by the Board of Directors.
GR RosenthalChairman of the Audit, Risk and Compliance Committee
Sandton 24 June 2013
AN
DU
LE
LA
IN
VE
ST
ME
NT
HO
LD
ING
S L
IMIT
ED
IN
TE
GR
AT
ED
AN
NU
AL
RE
PO
RT
20
12
35
diReCTORs’ RepORT
The directors have pleasure in presenting their report and annual financial statements for the year ended 31 December 2012.
1. Review of activities
Nature of business
Andulela Investment Holdings Limited is an investment holding company. The nature of the business of the Group’s subsidiaries is further detailed in the commentary below.
2. Directorate The current directors of the Company and changes in directorate during the period under review and to the date of this
report are as follows:
Name Nationality Change in appointment
MJ Husain (Chairman)# South African
A Kaka (Chief Executive Officer) South African
PC de Jager (Chief Financial Officer) South African Non-executive director with
effect from 30 June 2013
GR Rosenthal# South African
PE du Preez# South African
CWN Molope# South African Appointed 1 July 2012
I Kajee South African Resigned 9 May 2013
#Independent non-executive
3. Stated capital Authorised share capital
On 27 February 2013, shareholders approved special resolutions to increase the authorised share capital from 5 500 000 000 ordinary shares of no par value to 11 000 000 000 ordinary shares of no par value, and thereafter to consolidate the authorised share capital on a 50:1 basis, resulting in an authorised share capital of 220 000 000 ordinary shares of no par value. No changes were made to the preference share capital, which remained unchanged at 75 000 000 cumulative redeemable preference shares.
Issued share capital
11 581 435 (before the share consolidation) ordinary shares, which were held as vendor shares as at 31 December 2011, were issued at a premium of R0,39 per share in full settlement of the total purchase price of the acquisition of PRSM and its subsidiaries on 11 July 2012.
The total number of ordinary par value shares in issue at 31 December 2012 was 4 382 241 731. Following the approval by shareholders of the consolidation of the share capital on a 50:1 basis at the general meeting held on 27 February 2013, the issued share capital of the Company consists of 87 644 836 ordinary shares of no par value. The preference share capital of the Company consists of 54 107 002 cumulative redeemable preference shares of 1 cent each, following the redemption of 20 892 998 cumulative redeemable preference shares during 2012.
4. Special resolutions On 23 March 2012, at a general meeting of shareholders, the following special resolutions were passed and subsequently
registered:
• That subject to the requirements of the Companies Act, No 71 of 2008 (the “Companies Act”), the ListingsRequirements of the JSE and the detailed restrictions set out in the resolution, the repurchase of shares of the Company either by the Company or by any subsidiary of the Company was authorised;
• That the feespayableby theCompany to thenon-executivedirectors for theirservicesasdirectors (in termsof section 66 of the Companies Act) for the year ending 31 December 2011 as detailed in the resolution were authorised;
AN
DU
LE
LA
IN
VE
ST
ME
NT
HO
LD
ING
S L
IMIT
ED
IN
TE
GR
AT
ED
AN
NU
AL
RE
PO
RT
20
12
36
• That the feespayableby theCompany to thenon-executivedirectors for theirservicesasdirectors (in termsofsection 66 of the Companies Act) for the year ending 31 December 2012 as detailed in the resolution were authorised; and
• Thatanannualincreasenotexceeding10%ofthedirectors’feespayablebytheCompanytothenon-executivedirectors for their services as directors was approved for a period of two years from the passing of this special resolution, or until the date of the Annual General Meeting of shareholders to be held in 2014, whichever is the earlier.
On 8 August 2012, at the annual general meeting of shareholders, the following special resolutions were passed and subsequently registered:
• That subject to the requirements of theCompanies Act, the ListingsRequirements of the JSE, theCompany’sexisting Memorandum of Incorporation (“MOI”), and the detailed restrictions set out in the resolution, the repurchase of shares of the Company either by the Company or by any subsidiary of the Company was authorised;
• That subject to the requirements of theCompanies Act, the ListingsRequirements of the JSE, theCompany’sexisting MOI, and the detailed restrictions set out in the resolution, the Company was authorised to provide direct or indirect financial assistance, as contemplated in section 45 of the Companies Act, by way of loans, guarantees, the provision of security or otherwise, to any of its present or future subsidiaries and/or any other company or corporation that is or becomes related or inter-related (as defined in the Companies Act) to the Company for any purpose or in connection with any matter. This authority will endure until the next annual general meeting, but shall not extend beyond 2 (two) years;
• ThattheCompanywasauthorisedtoconvertbothitstotalauthorisedandissuedordinaryparvaluesharesintonopar value shares without altering the substance of the specific rights and privileges associated with each such share and to transfer all amounts standing to the credit of the share capital account and the share premium account to the stated capital account. Further authority was granted to amend the existing MOI of the Company to accommodate the above conversion to no par value shares as set out in detail in the resolution; and
• That theCompany’s existingMOI is substituted in its entiretywith the newMemorandumof Incorporationwasauthorised. The new MOI took effect subject to the filing with the CIPC of the special resolutions (together with the new MOI).
On 4 July 2012, the following special resolutions were approved by the requisite majority of the shareholders of Kilken Platinum Pty Ltd:
• ThatthecompanybeauthorisedtoprovidefinancialassistancetoKinlelaPtyLtd,awhollyownedsubsidiaryoftheCompany, for the purposes of entering into loan agreements with Absa Bank Limited; and
• TheshareholdersofKilkenPlatinumPtyLtdratifiedtheagreementsenteredintobytheCompanywithAbsaBankLimited.
5. Directors’ interests in the issued share capital of the Company As at 31 December 2012 none of the directors held any beneficial interest (direct or indirect) in the issued shares of the
Company. There have been no changes to directors’ shareholdings from 31 December 2012 to the date of approval of this annual report.
6. Directors’ interest in contracts None of the directors of the Company have any direct or indirect interests in contracts with any Group companies. There
have been no changes to directors’ interests in contracts from 31 December 2012 to the date of approval of this annual report.
7. Management agreements The Company has concluded a management services agreement with Kilken Platinum Pty Ltd and Pro Roof Steel
Merchants Pty Ltd and their subsidiaries, which includes but is not limited to providing and/or procuring financial, technical and strategic expertise and various administration and management services which became effective during the financial year on 1 January 2012.
diReCTORs’ RepORT (continued)
AN
DU
LE
LA
IN
VE
ST
ME
NT
HO
LD
ING
S L
IMIT
ED
IN
TE
GR
AT
ED
AN
NU
AL
RE
PO
RT
20
12
37
8. Borrowing limitations In terms of the Memorandum of Incorporation of the Company, the directors may exercise all the powers of the Company
to borrow money, as they consider appropriate. At 31 December 2012, the directors’ borrowing powers remained unlimited.
9. Dividends No dividend was declared or paid to the holders of ordinary shares during the year.
10. Company Secretary The secretary of the Company is Mrs HI Kazi of:
Business address 108 4th Street Parkmore Sandton 2196
Postal address PO Box 786786 Sandton City 2146
E-mail address [email protected]
11. Auditors BDO South Africa Inc. (“BDO”) and J Schoeman as the designated partner, remained the independent auditors for the
year under review. The appointment of BDO was presented to shareholders for approval at the annual general meeting of shareholders held on 8 August 2012 and duly approved in accordance with section 90(1) of the Companies Act.
12. Investment in subsidiaries and goodwill Andulela continues to hold an effective controlling interest of 83,6% in Kilken Platinum Pty Ltd (“Kilken”) through
intermediary subsidiary companies Abalengani Mining Investments Pty Ltd (“AMI”) and JB Platinum Holdings Pty Ltd (“JBPH”). Goodwill arose in 2010 on the acquisition of interest in subsidiaries. The goodwill was subsequently impaired based on a Competent Person's Report, dated 29 January 2010, of the fair value of the underlying investment in Kilken which is an operating cash-generating business operation to which the full amount of the goodwill is allocated. The Competent Person’s Report has been subsequently updated on 1 December 2012 for the year ended 31 December 2012 and based on this, no further impairment has been identified.
The Group acquired a 100% controlling interest in Pro Roof Steel Merchants Pty Ltd and its subsidiaries (“PRSM”) with effect from 1 September 2011, through the issue of 431,58 million Andulela ordinary shares in full settlement of the purchase consideration, at an issue price of 40 cents per share, based on the consolidated tangible net asset value (“NAV”) of PRSM and its subsidiaries as at 31 August 2011. No goodwill was recognised as a result of this acquisition.
The investment of PRSM was reviewed at year-end and impaired by an amount of R67,9 million.
13. Fixed assets During the financial year under review, the Group had no significant changes to the nature of its fixed assets and no
changes in the accounting policy relating to fixed assets have been adopted.
AN
DU
LE
LA
IN
VE
ST
ME
NT
HO
LD
ING
S L
IMIT
ED
IN
TE
GR
AT
ED
AN
NU
AL
RE
PO
RT
20
12
38
diReCTORs’ RepORT (continued)
14. Events subsequent to the year-end After an in-depth analysis of the PRSM Group’s operational strategy, budgets and cash flow forecasts, it was decided
to rationalise the marginal non-strategic operational manufacturing and distribution branches. As a result the Polokwane and Durban branches will be scaled down to representative sales offices at smaller premises.
Plant and equipment from these branches will be distributed amongst the Vereeniging, Pretoria and Cape Town branches where needed. Management is also negotiating more favourable structuring of the current rental agreements with the landlords.
The Nelspruit operations were sold with effect from 1 March 2013 for the book value of the fixed assets and the inventory, with the purchase consideration payable in equal instalments over 25 months from 31 March 2013. This asset was accordingly treated as a non-current asset held for sale in the statement of financial position as at 31 December 2012.
15. Commitments Capital commitments related to capital expenditure contracted to PRSM amounted to an estimated R5,7 million.
16. Going concern The annual financial statements have been prepared on the basis of accounting policies applicable to a going concern.
The basis presumes that funds will be available to finance future operations and that the realisation of assets and settlement of liabilities, contingent obligations and commitments will occur in the ordinary course of business.
For and on behalf of the Board
MJ Husain A KakaIndependent Non-Executive Chairman Chief Executive Officer
Sandton24 June 2013
DirectorsMJ Husain (Chairman)*, A Kaka (CEO), PC de Jager (CFO), GR Rosenthal*, PE du Preez*, CWN Molope*
*Independent non-executive
Registered office Company Secretary108 4th Street Parkmore Sandton 2196 HI Kazi (Mrs)
Transfer Secretaries SponsorLink Market Services Pty Ltd Java Capital13th Floor, Rennie House, 19 Ameshoff Street, Braamfontein JohannesburgPO Box 4844 Johannesburg 2000
AN
DU
LE
LA
IN
VE
ST
ME
NT
HO
LD
ING
S L
IMIT
ED
IN
TE
GR
AT
ED
AN
NU
AL
RE
PO
RT
20
12
39
RepORT OF The iNdepeNdeNT AUdiTORs FOR The YeAR eNded 31 deCemBeR 2012
To the Shareholders of Andulela Investment Holdings Limited
We have audited the consolidated and separate financial statements of Andulela Investment Holdings Limited set out on pages 40 to 92, which comprise the statements of financial position as at 31 December 2012, and the statements of comprehensive income, statements of changes in equity and statements of cash flows for the year then ended, and the notes, comprising a summary of significant accounting policies and other explanatory information.
Directors’ responsibility for the consolidated financial statementsThe Company’s directors are responsible for the preparation and fair presentation of these consolidated and separate financial statements in accordance with International Financial Reporting Standards, the SAICA Financial Reporting Guides as issued by the Accounting Practices Committee and Financial Reporting Pronouncements as issued by the Financial Reporting Standards Council and the requirements of the Companies Act of South Africa, and for such internal control as the directors determine is necessary to enable the preparation of consolidated and separate financial statements that are free from material misstatement, whether due to fraud or error.
Auditor’s responsibilityOur responsibility is to express an opinion on these consolidated and separate financial statements based on our audit. We conducted our audit in accordance with International Standards on Auditing. Those standards require that we comply with ethical requirements and plan and perform the audit to obtain reasonable assurance about whether the consolidated and separate financial statements are free from material misstatement.
An audit involves performing procedures to obtain audit evidence about the amounts and disclosures in the financial statements. The procedures selected depend on the auditor’s judgement, including the assessment of the risks of material misstatement of the financial statements, whether due to fraud or error. In making those risk assessments, the auditor considers internal control relevant to the entity’s preparation and fair presentation of the financial statements in order to design audit procedures that are appropriate in the circumstances, but not for the purpose of expressing an opinion on the effectiveness of the entity’s internal control. An audit also includes evaluating the appropriateness of accounting policies used and the reasonableness of accounting estimates made by management, as well as evaluating the overall presentation of the financial statements.
We believe that the audit evidence we have obtained is sufficient and appropriate to provide a basis for our audit opinion.
OpinionIn our opinion, the consolidated and separate financial statements fairly present, in all material respects, the consolidated and separate financial position of Andulela Investment Holdings Limited as at 31 December 2012, and its consolidated and separate financial performance and consolidated and separate cash flows for the year then ended in accordance with International Financial Reporting Standards, the SAICA Financial Reporting Guides as issued by the Accounting Practices Committee and Financial Reporting Pronouncements as issued by the Financial Reporting Standards Council and the requirements of the Companies Act of South Africa.
Other reports required by the Companies Act
As part of our audit of the consolidated and separate financial statements for the year ended 31 December 2012, we have read the directors’ report, the Audit Committee’s report and the Company Secretary’s certificate for the purpose of identifying whether there are material inconsistencies between these reports and the audited consolidated and separate financial statements. These reports are the responsibility of the respective preparers. Based on reading these reports we have not identified material inconsistencies between these reports and the audited consolidated and separate financial statements. However, we have not audited these reports and accordingly do not express an opinion on these reports.
BDO South Africa IncorporatedPer J Schoeman PartnerPractice Number: 905526E22 Wellington Road, Parktown 2193, Johannesburg
24 June 2013
AN
DU
LE
LA
IN
VE
ST
ME
NT
HO
LD
ING
S L
IMIT
ED
IN
TE
GR
AT
ED
AN
NU
AL
RE
PO
RT
20
12
40
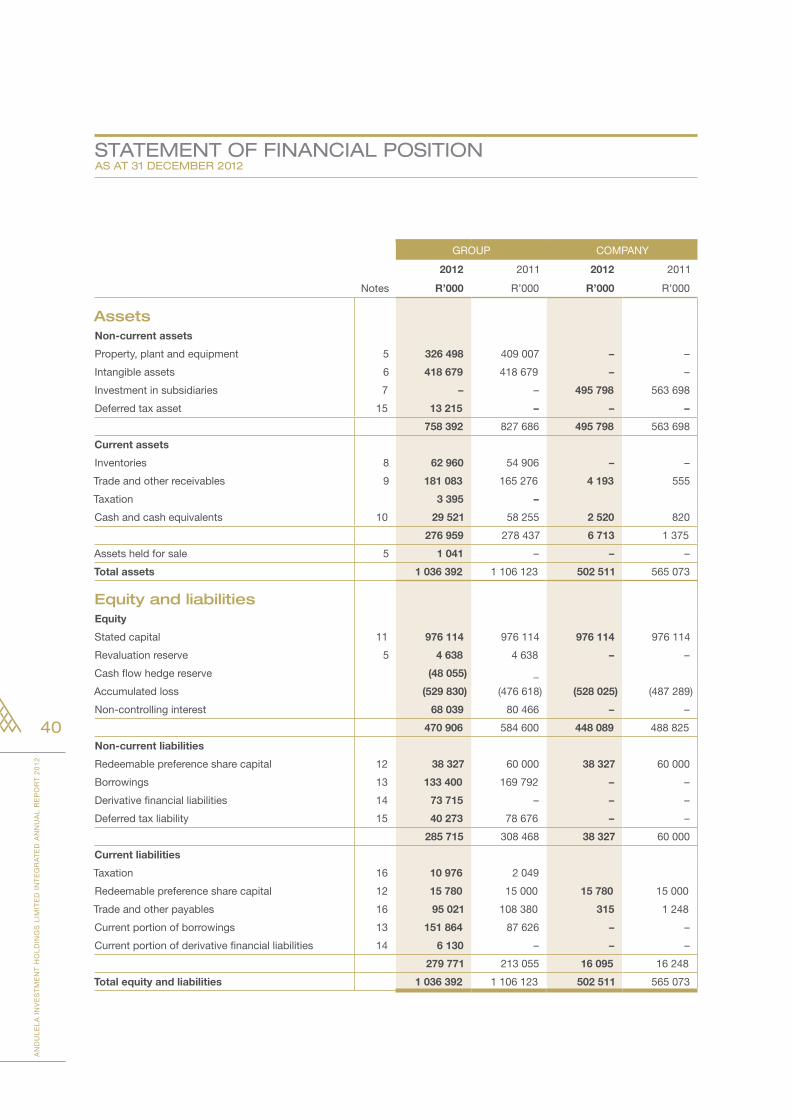
sTATemeNT OF FiNANCiAl pOsiTiONAs AT 31 deCemBeR 2012
GROUP COMPANY
2012 2011 2012 2011
Notes R’000 R’000 R’000 R’000
AssetsNon-current assets
Property, plant and equipment 5 326 498 409 007 – –
Intangible assets 6 418 679 418 679 – –
Investment in subsidiaries 7 – – 495 798 563 698
Deferred tax asset 15 13 215 – – –
758 392 827 686 495 798 563 698
Current assets
Inventories 8 62 960 54 906 – –
Trade and other receivables 9 181 083 165 276 4 193 555
Taxation 3 395 –
Cash and cash equivalents 10 29 521 58 255 2 520 820
276 959 278 437 6 713 1 375
Assets held for sale 5 1 041 – – –
Total assets 1 036 392 1 106 123 502 511 565 073
Equity and liabilitiesEquity
Stated capital 11 976 114 976 114 976 114 976 114
Revaluation reserve 5 4 638 4 638 – –
Cash flow hedge reserve (48 055) _
Accumulated loss (529 830) (476 618) (528 025) (487 289)
Non-controlling interest 68 039 80 466 – –
470 906 584 600 448 089 488 825
Non-current liabilities
Redeemable preference share capital 12 38 327 60 000 38 327 60 000
Borrowings 13 133 400 169 792 – –
Derivative financial liabilities 14 73 715 – – –
Deferred tax liability 15 40 273 78 676 – –
285 715 308 468 38 327 60 000
Current liabilities
Taxation 16 10 976 2 049
Redeemable preference share capital 12 15 780 15 000 15 780 15 000
Trade and other payables 16 95 021 108 380 315 1 248
Current portion of borrowings 13 151 864 87 626 – –
Current portion of derivative financial liabilities 14 6 130 – – –
279 771 213 055 16 095 16 248
Total equity and liabilities 1 036 392 1 106 123 502 511 565 073
AN
DU
LE
LA
IN
VE
ST
ME
NT
HO
LD
ING
S L
IMIT
ED
IN
TE
GR
AT
ED
AN
NU
AL
RE
PO
RT
20
12
41
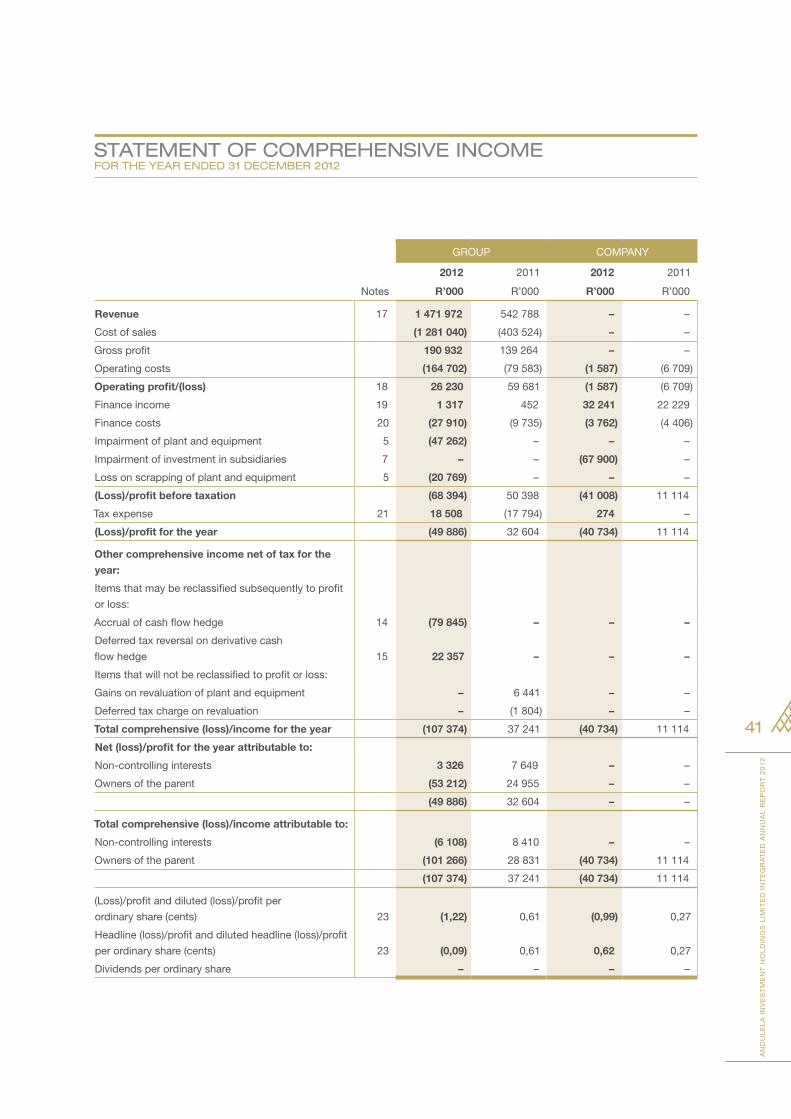
sTATemeNT OF COmpReheNsive iNCOmeFOR The YeAR eNded 31 deCemBeR 2012
GROUP COMPANY
2012 2011 2012 2011
Notes R’000 R’000 R’000 R’000
Revenue 17 1 471 972 542 788 – –
Cost of sales (1 281 040) (403 524) – –
Gross profit 190 932 139 264 – –
Operating costs (164 702) (79 583) (1 587) (6 709)
Operating profit/(loss) 18 26 230 59 681 (1 587) (6 709)
Finance income 19 1 317 452 32 241 22 229
Finance costs 20 (27 910) (9 735) (3 762) (4 406)
Impairment of plant and equipment 5 (47 262) – – –
Impairment of investment in subsidiaries 7 – – (67 900) –
Loss on scrapping of plant and equipment 5 (20 769) – – –
(Loss)/profit before taxation (68 394) 50 398 (41 008) 11 114
Tax expense 21 18 508 (17 794) 274 –
(Loss)/profit for the year (49 886) 32 604 (40 734) 11 114
Other comprehensive income net of tax for the
year:
Items that may be reclassified subsequently to profit
or loss:
Accrual of cash flow hedge 14 (79 845) – – –
Deferred tax reversal on derivative cash
flow hedge 15 22 357 – – –
Items that will not be reclassified to profit or loss:
Gains on revaluation of plant and equipment – 6 441 – –
Deferred tax charge on revaluation – (1 804) – –
Total comprehensive (loss)/income for the year (107 374) 37 241 (40 734) 11 114
Net (loss)/profit for the year attributable to:
Non-controlling interests 3 326 7 649 – –
Owners of the parent (53 212) 24 955 – –
(49 886) 32 604 – –
Total comprehensive (loss)/income attributable to:
Non-controlling interests (6 108) 8 410 – –
Owners of the parent (101 266) 28 831 (40 734) 11 114
(107 374) 37 241 (40 734) 11 114
(Loss)/profit and diluted (loss)/profit per
ordinary share (cents) 23 (1,22) 0,61 (0,99) 0,27
Headline (loss)/profit and diluted headline (loss)/profit
per ordinary share (cents) 23 (0,09) 0,61 0,62 0,27
Dividends per ordinary share – – – –
AN
DU
LE
LA
IN
VE
ST
ME
NT
HO
LD
ING
S L
IMIT
ED
IN
TE
GR
AT
ED
AN
NU
AL
RE
PO
RT
20
12
42
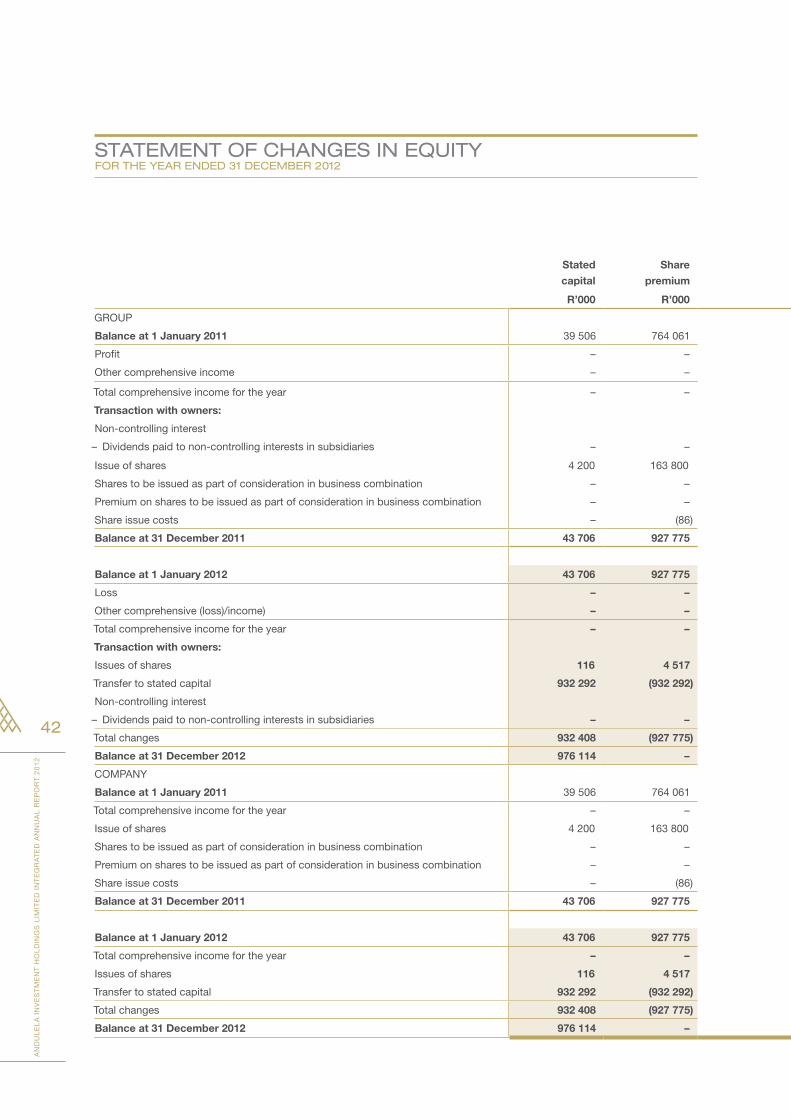
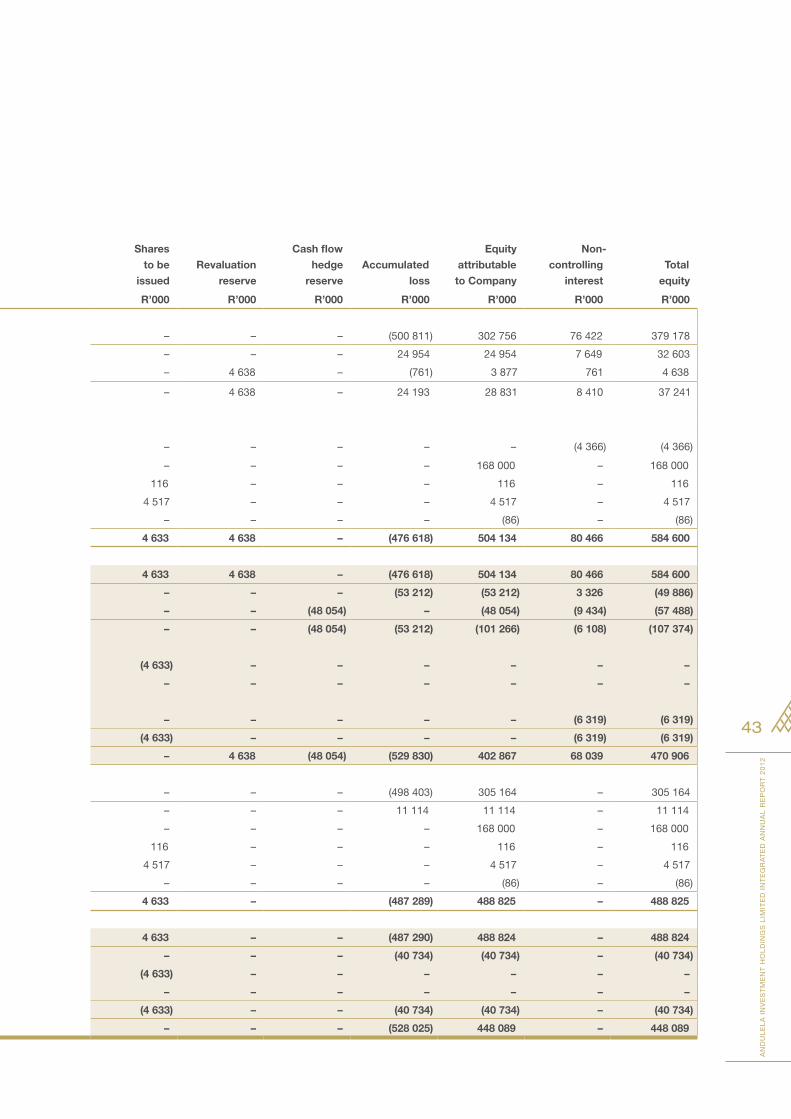
sTATemeNT OF ChANges iN eQUiTY FOR The YeAR eNded 31 deCemBeR 2012
Stated
capital
Share
premium
Shares
to be
issued
Revaluation
reserve
Cash flow
hedge
reserve
Accumulated
loss
Equity
attributable
to Company
Non-
controlling
interest
Total
equity
R’000 R’000 R’000 R’000 R’000 R’000 R’000 R’000 R’000
GROUP
Balance at 1 January 2011 39 506 764 061 – – – (500 811) 302 756 76 422 379 178
Profit – – – – – 24 954 24 954 7 649 32 603
Other comprehensive income – – – 4 638 – (761) 3 877 761 4 638
Total comprehensive income for the year – – – 4 638 – 24 193 28 831 8 410 37 241
Transaction with owners:
Non-controlling interest
– Dividends paid to non-controlling interests in subsidiaries – – – – – – – (4 366) (4 366)
Issue of shares 4 200 163 800 – – – – 168 000 – 168 000
Shares to be issued as part of consideration in business combination – – 116 – – – 116 – 116
Premium on shares to be issued as part of consideration in business combination – – 4 517 – – – 4 517 – 4 517
Share issue costs – (86) – – – – (86) – (86)
Balance at 31 December 2011 43 706 927 775 4 633 4 638 – (476 618) 504 134 80 466 584 600
Balance at 1 January 2012 43 706 927 775 4 633 4 638 – (476 618) 504 134 80 466 584 600
Loss – – – – – (53 212) (53 212) 3 326 (49 886)
Other comprehensive (loss)/income) – – – – (48 054) – (48 054) (9 434) (57 488)
Total comprehensive income for the year – – – – (48 054) (53 212) (101 266) (6 108) (107 374)
Transaction with owners:
Issues of shares 116 4 517 (4 633) – – – – – –
Transfer to stated capital 932 292 (932 292) – – – – – – –
Non-controlling interest
– Dividends paid to non-controlling interests in subsidiaries – – – – – – – (6 319) (6 319)
Total changes 932 408 (927 775) (4 633) – – – – (6 319) (6 319)
Balance at 31 December 2012 976 114 – – 4 638 (48 054) (529 830) 402 867 68 039 470 906
COMPANY
Balance at 1 January 2011 39 506 764 061 – – – (498 403) 305 164 – 305 164
Total comprehensive income for the year – – – – – 11 114 11 114 – 11 114
Issue of shares 4 200 163 800 – – – – 168 000 – 168 000
Shares to be issued as part of consideration in business combination – – 116 – – – 116 – 116
Premium on shares to be issued as part of consideration in business combination – – 4 517 – – – 4 517 – 4 517
Share issue costs – (86) – – – – (86) – (86)
Balance at 31 December 2011 43 706 927 775 4 633 – (487 289) 488 825 – 488 825
Balance at 1 January 2012 43 706 927 775 4 633 – – (487 290) 488 824 – 488 824
Total comprehensive income for the year – – – – – (40 734) (40 734) – (40 734)
Issues of shares 116 4 517 (4 633) – – – – – –
Transfer to stated capital 932 292 (932 292) – – – – – – –
Total changes 932 408 (927 775) (4 633) – – (40 734) (40 734) – (40 734)
Balance at 31 December 2012 976 114 – – – – (528 025) 448 089 – 448 089
AN
DU
LE
LA
IN
VE
ST
ME
NT
HO
LD
ING
S L
IMIT
ED
IN
TE
GR
AT
ED
AN
NU
AL
RE
PO
RT
20
12
43
Stated
capital
Share
premium
Shares
to be
issued
Revaluation
reserve
Cash flow
hedge
reserve
Accumulated
loss
Equity
attributable
to Company
Non-
controlling
interest
Total
equity
R’000 R’000 R’000 R’000 R’000 R’000 R’000 R’000 R’000
GROUP
Balance at 1 January 2011 39 506 764 061 – – – (500 811) 302 756 76 422 379 178
Profit – – – – – 24 954 24 954 7 649 32 603
Other comprehensive income – – – 4 638 – (761) 3 877 761 4 638
Total comprehensive income for the year – – – 4 638 – 24 193 28 831 8 410 37 241
Transaction with owners:
Non-controlling interest
– Dividends paid to non-controlling interests in subsidiaries – – – – – – – (4 366) (4 366)
Issue of shares 4 200 163 800 – – – – 168 000 – 168 000
Shares to be issued as part of consideration in business combination – – 116 – – – 116 – 116
Premium on shares to be issued as part of consideration in business combination – – 4 517 – – – 4 517 – 4 517
Share issue costs – (86) – – – – (86) – (86)
Balance at 31 December 2011 43 706 927 775 4 633 4 638 – (476 618) 504 134 80 466 584 600
Balance at 1 January 2012 43 706 927 775 4 633 4 638 – (476 618) 504 134 80 466 584 600
Loss – – – – – (53 212) (53 212) 3 326 (49 886)
Other comprehensive (loss)/income) – – – – (48 054) – (48 054) (9 434) (57 488)
Total comprehensive income for the year – – – – (48 054) (53 212) (101 266) (6 108) (107 374)
Transaction with owners:
Issues of shares 116 4 517 (4 633) – – – – – –
Transfer to stated capital 932 292 (932 292) – – – – – – –
Non-controlling interest
– Dividends paid to non-controlling interests in subsidiaries – – – – – – – (6 319) (6 319)
Total changes 932 408 (927 775) (4 633) – – – – (6 319) (6 319)
Balance at 31 December 2012 976 114 – – 4 638 (48 054) (529 830) 402 867 68 039 470 906
COMPANY
Balance at 1 January 2011 39 506 764 061 – – – (498 403) 305 164 – 305 164
Total comprehensive income for the year – – – – – 11 114 11 114 – 11 114
Issue of shares 4 200 163 800 – – – – 168 000 – 168 000
Shares to be issued as part of consideration in business combination – – 116 – – – 116 – 116
Premium on shares to be issued as part of consideration in business combination – – 4 517 – – – 4 517 – 4 517
Share issue costs – (86) – – – – (86) – (86)
Balance at 31 December 2011 43 706 927 775 4 633 – (487 289) 488 825 – 488 825
Balance at 1 January 2012 43 706 927 775 4 633 – – (487 290) 488 824 – 488 824
Total comprehensive income for the year – – – – – (40 734) (40 734) – (40 734)
Issues of shares 116 4 517 (4 633) – – – – – –
Transfer to stated capital 932 292 (932 292) – – – – – – –
Total changes 932 408 (927 775) (4 633) – – (40 734) (40 734) – (40 734)
Balance at 31 December 2012 976 114 – – – – (528 025) 448 089 – 448 089
AN
DU
LE
LA
IN
VE
ST
ME
NT
HO
LD
ING
S L
IMIT
ED
IN
TE
GR
AT
ED
AN
NU
AL
RE
PO
RT
20
12
44
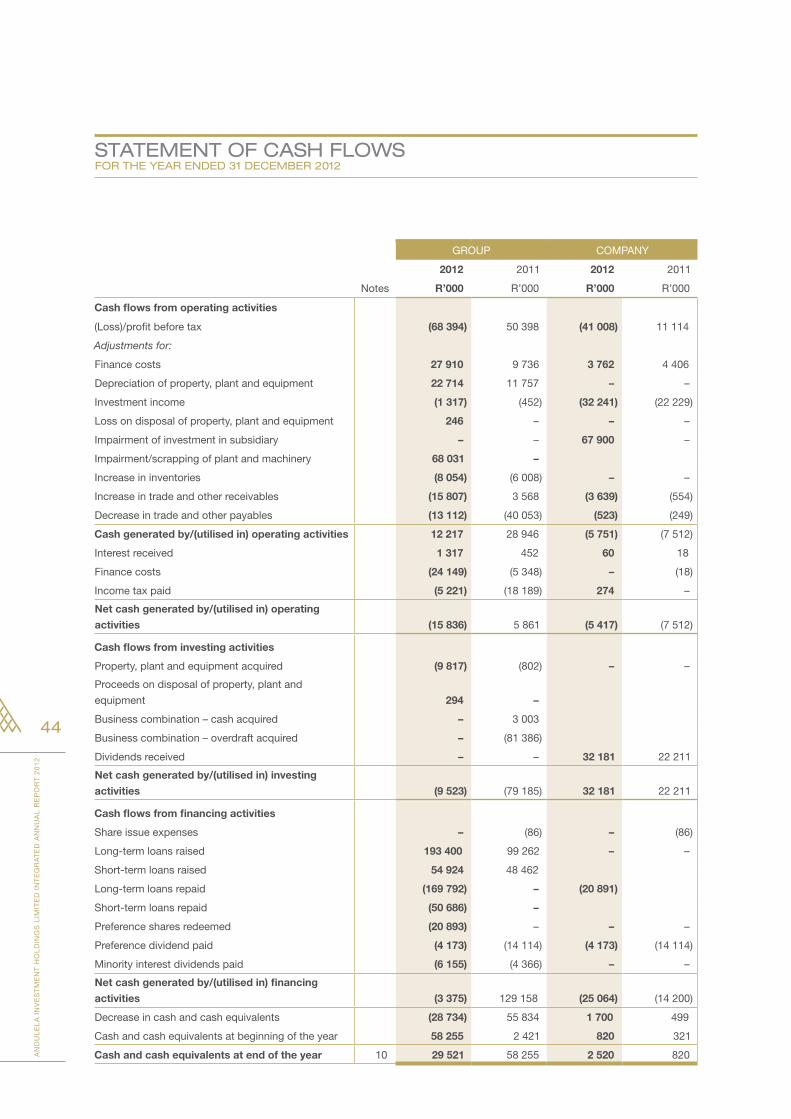
sTATemeNT OF CAsh FlOWs FOR The YeAR eNded 31 deCemBeR 2012
GROUP COMPANY
2012 2011 2012 2011
Notes R’000 R’000 R’000 R’000
Cash flows from operating activities
(Loss)/profit before tax (68 394) 50 398 (41 008) 11 114
Adjustments for:
Finance costs 27 910 9 736 3 762 4 406
Depreciation of property, plant and equipment 22 714 11 757 – –
Investment income (1 317) (452) (32 241) (22 229)
Loss on disposal of property, plant and equipment 246 – – –
Impairment of investment in subsidiary – – 67 900 –
Impairment/scrapping of plant and machinery 68 031 –
Increase in inventories (8 054) (6 008) – –
Increase in trade and other receivables (15 807) 3 568 (3 639) (554)
Decrease in trade and other payables (13 112) (40 053) (523) (249)
Cash generated by/(utilised in) operating activities 12 217 28 946 (5 751) (7 512)
Interest received 1 317 452 60 18
Finance costs (24 149) (5 348) – (18)
Income tax paid (5 221) (18 189) 274 –
Net cash generated by/(utilised in) operating
activities (15 836) 5 861 (5 417) (7 512)
Cash flows from investing activities
Property, plant and equipment acquired (9 817) (802) – –
Proceeds on disposal of property, plant and
equipment 294 –
Business combination – cash acquired – 3 003
Business combination – overdraft acquired – (81 386)
Dividends received – – 32 181 22 211
Net cash generated by/(utilised in) investing
activities (9 523) (79 185) 32 181 22 211
Cash flows from financing activities
Share issue expenses – (86) – (86)
Long-term loans raised 193 400 99 262 – –
Short-term loans raised 54 924 48 462
Long-term loans repaid (169 792) – (20 891)
Short-term loans repaid (50 686) –
Preference shares redeemed (20 893) – – –
Preference dividend paid (4 173) (14 114) (4 173) (14 114)
Minority interest dividends paid (6 155) (4 366) – –
Net cash generated by/(utilised in) financing
activities (3 375) 129 158 (25 064) (14 200)
Decrease in cash and cash equivalents (28 734) 55 834 1 700 499
Cash and cash equivalents at beginning of the year 58 255 2 421 820 321
Cash and cash equivalents at end of the year 10 29 521 58 255 2 520 820
AN
DU
LE
LA
IN
VE
ST
ME
NT
HO
LD
ING
S L
IMIT
ED
IN
TE
GR
AT
ED
AN
NU
AL
RE
PO
RT
20
12
45
ACCOUNTiNg pOliCiesFOR The YeAR eNded 31 deCemBeR 2012
1. Statement of compliance with International Financial Reporting Standards
The annual financial statements have been prepared in accordance with all applicable International Financial Reporting
Standards (“IFRS”), which includes all applicable individual International Financial Reporting Standards, International
Accounting Standards (“IAS”) and Interpretations issued by the IFRS Interpretations Committee, and the requirements of
the Companies Act of South Africa. A summary of significant accounting policies is set out in note 2.
2. Summary of significant accounting policies
2. 1 Basis of preparation
The annual financial statements have been prepared on the historical cost basis except for the measurement of financial
assets and liabilities at fair value through other comprehensive income.
The accounting policies conform with IFRS and are consistent with those followed in the preparation of the annual
financial statements for the year ended 31 December 2011.
The preparation of financial statements in compliance with adopted IFRS requires the use of certain critical accounting
estimates. It also requires Group management to exercise judgement in applying the Group's accounting policies. The
areas where significant judgements and estimates have been made in preparing the financial statements and their effect
are disclosed in note 3.
2.2 Basis of consolidation
The consolidated financial statements incorporate the financial statements of the Company and entities controlled by the
Company (its subsidiaries). Control is achieved where the Company has the power to govern the financial and operating
policies of an entity so as to obtain benefits from its activities.
Income and expenses of subsidiaries acquired or disposed of during the year are included in the consolidated statement
of comprehensive income from the effective date of acquisition and up to the effective date of disposal, as appropriate.
Total comprehensive income of subsidiaries is attributed to the owners of the Company and to the non-controlling
interests even if this results in the non-controlling interests having a deficit balance.
When necessary, adjustments are made to the financial statements of subsidiaries to bring their accounting policies into
line with those used by other members of the Group.
All intra-group transactions, balances, income and expenses are eliminated in full on consolidation.
Non-controlling interests in subsidiaries are identified separately from the Group’s equity therein. The interests of non-
controlling shareholders may be initially measured either at fair value or at the non-controlling interests’ proportionate
share of the fair value of the acquiree’s identifiable net assets. The choice of measurement basis is made on an
acquisition-by-acquisition basis. Subsequent to acquisition, the carrying amount of non-controlling interests is the
amount of those interests at initial recognition plus the non-controlling interests’ share of subsequent changes in equity.
Total comprehensive income is attributed to non-controlling interests even if this results in the non-controlling interests
having a deficit balance.
Changes in the Group’s interests in subsidiaries that do not result in a loss of control are accounted for as equity
transactions. The carrying amounts of the Group’s interests and the non-controlling interests are adjusted to reflect the
changes in their relative interests in the subsidiaries. Any difference between the amount by which the non-controlling
interests are adjusted and the fair value of the consideration paid or received is recognised directly in equity and attributed
to owners of the Company.
AN
DU
LE
LA
IN
VE
ST
ME
NT
HO
LD
ING
S L
IMIT
ED
IN
TE
GR
AT
ED
AN
NU
AL
RE
PO
RT
20
12
46
ACCOUNTiNg pOliCies (continued)FOR The YeAR eNded 31 deCemBeR 2012
2. Summary of significant accounting policies (continued)
When the Group loses control of a subsidiary, the profit or loss on disposal is calculated as the difference between
(i) the aggregate of the fair value of the consideration received and the fair value of any retained interest and (ii) the
previous carrying amount of the assets (including goodwill) and liabilities of the subsidiary and any non-controlling
interests. Amounts previously recognised in other comprehensive income in relation to the subsidiary are accounted for
(i.e. reclassified to profit or loss or transferred directly to retained earnings) in the same manner as would be required if
the relevant assets or liabilities were disposed of. The fair value of any investment retained in the former subsidiary at
the date when control is lost is regarded as the fair value on initial recognition for subsequent accounting under IAS 39
Financial Instruments: Recognition and Measurement or, when applicable, the cost on initial recognition of an investment
in an associate or jointly controlled entity.
Investments in subsidiaries and associates in the separate financial statements presented by the Company are recognised
at cost less accumulated impairment.
2.3 Business combinations
Acquisitions of businesses are accounted for using the acquisition method. The consideration transferred in a business
combination is measured at fair value, which is calculated as the sum of the acquisition-date fair values of the assets
transferred to the Group, liabilities incurred by the Group to the former owners of the acquiree and the equity interests
issued by the Group in exchange for control of the acquiree. Acquisition-related costs are generally recognised in profit
or loss as incurred.
At the acquisition date, the identifiable assets acquired and the liabilities assumed are recognised at their fair value at
the acquisition date, except that deferred tax assets or liabilities and liabilities or assets related to employee benefit
arrangements are recognised and measured in accordance with IAS 12 Income Taxes and IAS 19 Employee Benefits
respectively.
Goodwill is measured as the excess of the sum of the consideration transferred, the amount of any non-controlling
interests in the acquiree, and the fair value of the acquirer’s previously held equity interest in the acquiree (if any) over the
net of the acquisition-date amounts of the identifiable assets acquired and the liabilities assumed. If, after reassessment,
the net of the acquisition-date amounts of the identifiable assets acquired and liabilities assumed exceeds the sum of the
consideration transferred, the amount of any non-controlling interests in the acquiree and the fair value of the acquirer’s
previously held interest in the acquiree (if any), the excess is recognised immediately in profit or loss as a bargain
purchase gain.
Non-controlling interests that are present ownership interests and entitle their holders to a proportionate share of the
entity’s net assets in the event of liquidation may be initially measured either at fair value or at the non-controlling interests’
proportionate share of the recognised amounts of the acquiree’s identifiable net assets. The choice of measurement
basis is made on a transaction-by-transaction basis. Other types of non-controlling interests are measured at fair value
or, when applicable, on the basis specified in another IFRS.
The subsequent accounting for changes in the fair value of the contingent consideration that do not qualify as
measurement period adjustments depends on how the contingent consideration is classified. Contingent consideration
that is classified as equity is not remeasured at subsequent reporting dates and its subsequent settlement is accounted
for within equity. Contingent consideration that is classified as an asset or a liability is remeasured at subsequent reporting
dates in accordance with IAS 39, or IAS 37 Provisions, Contingent Liabilities and Contingent Assets, as appropriate, with
the corresponding gain or loss being recognised in profit or loss.
When a business combination is achieved in stages, the Group’s previously held equity interest in the acquiree is
remeasured to fair value at the acquisition date (i.e. the date when the Group obtains control) and the resulting gain or
loss, if any, is recognised in profit or loss. Amounts arising from interests in the acquiree prior to the acquisition date that
have previously been recognised in other comprehensive income are reclassified to profit or loss where such treatment
would be appropriate if that interest were disposed of.
AN
DU
LE
LA
IN
VE
ST
ME
NT
HO
LD
ING
S L
IMIT
ED
IN
TE
GR
AT
ED
AN
NU
AL
RE
PO
RT
20
12
47
2.4 Goodwill
Goodwill arising on an acquisition of a business is carried at cost as established at the date of acquisition of the business
(see 2.3 above) less accumulated impairment losses, if any.
For the purposes of impairment testing, goodwill is allocated to each of the Group’s cash-generating units (or groups of
cash-generating units) that is expected to benefit from the synergies of the combination.
A cash-generating unit to which goodwill has been allocated is tested for impairment annually, or more frequently when
there is an indication that the unit may be impaired. If the recoverable amount of the cash-generating unit is less than its
carrying amount, the impairment loss is allocated first to reduce the carrying amount of any goodwill allocated to the unit
and then to the other assets of the unit pro rata based on the carrying amount of each asset in the unit. Any impairment
loss for goodwill is recognised directly in profit or loss in the consolidated statement of comprehensive income. An
impairment loss recognised for goodwill is not reversed in subsequent periods.
On disposal of the relevant cash-generating unit, the attributable amount of goodwill is included in the determination of
the profit or loss on disposal.
2.5 Investments in subsidiaries
In the Company's separate annual financial statements investments in subsidiaries are carried at cost less any
accumulated impairment.
2.6 Interests in joint ventures
A joint venture is a contractual arrangement whereby the Group and other parties undertake an economic activity that is
subject to joint control (i.e. when the strategic financial and operating policy decisions relating to the activities of the joint
venture require the unanimous consent of the parties sharing control).
When a Group entity undertakes its activities under joint venture arrangements directly, the Group’s share of jointly
controlled assets and any liabilities incurred jointly with other venturers are recognised in the financial statements of the
relevant entity and classified according to their nature. Liabilities and expenses incurred directly in respect of interests
in jointly controlled assets are accounted for on an accrual basis. Income from the sale or use of the Group’s share of
the output of jointly controlled assets, and its share of joint venture expenses, are recognised when it is probable that
the economic benefits associated with the transactions will flow to/from the Group and their amount can be measured
reliably.
Joint venture arrangements that involve the establishment of a separate entity in which each venturer has an interest are
referred to as jointly controlled entities.
The Group reports its interests in jointly controlled entities using proportionate consolidation, except when the investment
is classified as held for sale, in which case it is accounted for in accordance with IFRS 5 Non-current Assets Held for
Sale and Discontinued Operations. The Group’s share of the assets, liabilities, income and expenses of jointly controlled
entities is combined with the equivalent items in the consolidated financial statements on a line-by-line basis.
Any goodwill arising on the acquisition of the Group’s interest in a jointly controlled entity is accounted for in accordance
with the Group’s accounting policy for goodwill arising in a business combination (see 2.3 and 2.4 above).
When a Group entity transacts with its jointly controlled entity, profits and losses resulting from the transactions with the
jointly controlled entity are recognised in the Group’s consolidated financial statements only to the extent of interests in
the jointly controlled entity that are not related to the Group.
2.7 Revenue recognition
Revenue is measured at the fair value of the consideration received or receivable. Revenue is shown net of value added
taxation, returns, rebates and discounts and after eliminating sales within the Group.
AN
DU
LE
LA
IN
VE
ST
ME
NT
HO
LD
ING
S L
IMIT
ED
IN
TE
GR
AT
ED
AN
NU
AL
RE
PO
RT
20
12
48
ACCOUNTiNg pOliCies (continued)FOR The YeAR eNded 31 deCemBeR 2012
2. Summary of significant accounting policies (continued)
2.7.1 Sale of goods
Revenue from the sale of goods is recognised when all the following conditions are satisfied:
• TheGrouphastransferredtothebuyerthesignificantrisksandrewardsofownershipofthegoods;
• TheGroupretainsneithercontinuingmanagerialinvolvementtothedegreeusuallyassociatedwithownershipnor
effective control over the goods sold;
• Theamountofrevenuecanbemeasuredreliably;
• ItisprobablethattheeconomicbenefitsassociatedwiththetransactionwillflowtotheGroup;and
• Thecostsincurredortobeincurredinrespectofthetransactioncanbemeasuredreliably.
Specifically, revenue from the sale of goods is recognised when goods are delivered and legal title is passed.
2.7.2 Rendering of services
Provided the amount of revenue can be measured reliably and it is probable that the Group will receive any consideration,
revenue for services is recognised in the period in which they are rendered.
2.7.3 Dividend and interest income
Dividend income from investments is recognised when the shareholder’s right to receive payment has been established
(provided that it is probable that the economic benefits will flow to the Group and the amount of income can be measured
reliably).
Interest income from a financial asset is recognised when it is probable that the economic benefits will flow to the Group
and the amount of income can be measured reliably. Interest income is accrued on a time basis, by reference to the
principal outstanding and at the effective interest rate applicable, which is the rate that exactly discounts estimated future
cash receipts through the expected life of the financial asset to that asset’s net carrying amount on initial recognition.
2.8 Leasing
Leases are classified as finance leases whenever the terms of the lease transfer substantially all the risks and rewards of
ownership to the lessee. All other leases are classified as operating leases.
2.8.1 The Group as lessor
Amounts due from lessees under finance leases are recognised as receivables at the amount of the Group’s net
investment in the leases. Finance lease income is allocated to accounting periods so as to reflect a constant periodic
rate of return on the Group’s net investment outstanding in respect of the leases.
Rental income from operating leases is recognised on a straight-line basis over the term of the relevant lease. Initial direct
costs incurred in negotiating and arranging an operating lease are added to the carrying amount of the leased asset and
recognised on a straight-line basis over the lease term.
2.8.2 The Group as lessee
Assets held under finance leases are initially recognised as assets of the Group at their fair value at the inception of the
lease or, if lower, at the present value of the minimum lease payments. The corresponding liability to the lessor is included
in the consolidated statement of financial position as a finance lease obligation.
Lease payments are apportioned between finance expenses and reduction of the lease obligation so as to achieve a
constant rate of interest on the remaining balance of the liability. Finance expenses are recognised immediately in profit
or loss, unless they are directly attributable to qualifying assets, in which case they are capitalised in accordance with the
Group’s general policy on borrowing costs (see 2.9 below). Contingent rentals are recognised as expenses in the periods
in which they are incurred.
Operating lease payments are recognised as an expense on a straight-line basis over the lease term, except where
another systematic basis is more representative of the time pattern in which economic benefits from the leased asset are
consumed. Contingent rentals arising under operating leases are recognised as an expense in the period in which they
are incurred.
AN
DU
LE
LA
IN
VE
ST
ME
NT
HO
LD
ING
S L
IMIT
ED
IN
TE
GR
AT
ED
AN
NU
AL
RE
PO
RT
20
12
49
In the event that lease incentives are received to enter into operating leases, such incentives are recognised as a liability.
The aggregate benefit of incentives is recognised as a reduction of rental expense on a straight-line basis, except where
another systematic basis is more representative of the time pattern in which economic benefits from the leased asset are
consumed.
2.9 Borrowing costs
Borrowing costs directly attributable to the acquisition, construction or production of qualifying assets, which are assets
that necessarily take a substantial period of time to get ready for their intended use or sale, are added to the cost of those
assets, until such time as the assets are substantially ready for their intended use or sale.
Investment income earned on the temporary investment of specific borrowings pending their expenditure on qualifying
assets is deducted from the borrowing costs eligible for capitalisation.
All other borrowing costs are recognised in profit or loss in the period in which they are incurred.
2.10 Property, plant and equipment
During the prior year, the Group adopted the policy of carrying plant and machinery at fair value. Valuations are based
upon assumptions including current replacement cost, forced sale value and the appropriate adjustment for each item’s
useful life recognised to date. The valuers also make reference to market evidence of current prices of the same or similar
items of plant and machinery.
The cost of an item of plant and equipment is recognised as an asset when:
• ItisprobablethatfutureeconomicbenefitsassociatedwiththeitemwillflowtotheGroup;and
• Thecostoftheitemcanbemeasuredreliably.
Property, plant and equipment is initially measured at cost.
Costs include costs incurred initially to acquire or construct an item of plant and equipment and cost incurred subsequently
to add to, replace part of, or service it. If a replacement cost is recognised in the carrying amount of an item of plant and
equipment, the carrying amount of the replaced part is derecognised.
The initial estimate of the costs of dismantling and removing the item and restoring the site on which it is located is
also included in the cost of the property, plant and equipment, where the entity is obligated to incur such expenditure,
and where the obligation arises as a result of acquiring the asset or using it for purposes other than the production of
inventories.
Major spare parts and stand-by equipment which are expected to be used for more than one period are included in
property, plant and equipment. In addition, spare parts and stand-by equipment which can only be used in connection
with an item of property, plant and equipment are accounted for as property, plant and equipment.
Major inspection costs which are a condition of continuing use of an item of property, plant and equipment and which
meet the recognition criteria above are included as a replacement in the cost of the item of property, plant and equipment.
Any remaining inspection costs from the previous inspection are derecognised.
Property, plant and equipment is carried at cost less accumulated depreciation and any impairment losses, except
for plant and machinery which is carried at revalued amount being the fair value at the date of revaluation less any
subsequent accumulated depreciation and subsequent accumulated impairment losses.
Revaluations are made with sufficient regularity such that the carrying amount does not differ materially from that which
would be determined using fair value at the end of the reporting period.
When an item of property, plant and equipment is revalued, any accumulated depreciation at the date of the revaluation
is eliminated against the gross carrying amount of the asset and the net amount restated to the revalued amount of the
asset.
Any increase in an asset’s carrying amount, as a result of a revaluation, is recognised in other comprehensive income and
accumulated in the revaluation surplus in equity. The increase is recognised in profit and loss to the extent that it reverses
a revaluation decrease of the same asset previously recognised in profit and loss.
AN
DU
LE
LA
IN
VE
ST
ME
NT
HO
LD
ING
S L
IMIT
ED
IN
TE
GR
AT
ED
AN
NU
AL
RE
PO
RT
20
12
50
ACCOUNTiNg pOliCies (continued)FOR The YeAR eNded 31 deCemBeR 2012
2. Summary of significant accounting policies (continued)
Any decrease in an asset’s carrying amount, as a result of a revaluation, is recognised in profit and loss in the current
period. The decrease is recognised in other comprehensive income to the extent of any credit balance existing in the
revaluation surplus in respect of that asset. The decrease recognised in other comprehensive income reduces the
amount accumulated in the revaluation surplus in equity.
The revaluation surplus in equity related to a specific item of property, plant and equipment is transferred directly to
retained earnings when the asset is derecognised.
Property, plant and equipment are depreciated on the straight-line basis over their expected useful lives to their estimated
residual values.
The useful lives of items of property, plant and equipment have been assessed as follows:
Item Average useful life
Plant and machinery 15 – 25 years
Furniture and fixtures 5 years
Motor vehicles 5 years
Office equipment 5 years
Computer software 3 years
Computer equipment 5 years
The residual value, useful life and depreciation method of each asset are reviewed at the end of each reporting period.
If the expectations differ from previous estimates, the change in estimate is accounted for as a change in accounting
estimate.
The depreciation charge for each period is recognised in profit or loss unless it is included in the carrying amount of
another asset.
Assets held under finance leases are depreciated over their expected useful lives on the same basis as owned assets or,
where shorter, the term of the relevant lease.
The gain or loss arising from the derecognition of an item of plant and equipment is included in profit or loss when the
item is derecognised. The gain or loss arising from the derecognition of an item of plant and equipment is determined as
the difference between the net disposal proceeds, if any, and the carrying amount of the item.
2.11 Intangible assets
Intangible assets acquired separately
Intangible assets with finite useful lives that are acquired separately are carried at cost less accumulated amortisation
and accumulated impairment losses. Amortisation is recognised on a straight-line basis over their estimated useful lives.
The estimated useful life and amortisation method are reviewed at the end of each reporting period, with the effect of any
changes in estimate being accounted for on a prospective basis. The residual values of intangible assets are reviewed
annually. Intangible assets with indefinite useful lives that are acquired separately are carried at cost less accumulated
impairment losses.
Intangible assets acquired in a business combination
Intangible assets acquired in a business combination and recognised separately from goodwill are initially recognised at
their fair value at the acquisition date (which is regarded as their cost).
Subsequent to initial recognition, intangible assets acquired in a business combination are reported at cost less
accumulated amortisation and accumulated impairment losses, on the same basis as intangible assets that are acquired
separately.
AN
DU
LE
LA
IN
VE
ST
ME
NT
HO
LD
ING
S L
IMIT
ED
IN
TE
GR
AT
ED
AN
NU
AL
RE
PO
RT
20
12
51
Derecognition of intangible assets
An intangible asset is derecognised on disposal, or when no future economic benefits are expected from use or disposal.
Gains or losses arising from derecognition of an intangible asset, measured as the difference between the net disposal
proceeds and the carrying amount of the asset, are recognised in profit or loss when the asset is derecognised.
2.12 Impairment of tangible and intangible assets other than goodwill
At the end of each reporting period, the Group reviews the carrying amounts of its tangible and intangible assets to
determine whether there is any indication that those assets have suffered an impairment loss. If any such indication
exists, the recoverable amount of the asset is estimated in order to determine the extent of the impairment loss (if any).
Where it is not possible to estimate the recoverable amount of an individual asset, the Group estimates the recoverable
amount of the cash-generating unit to which the asset belongs. Where a reasonable and consistent basis of allocation
can be identified, corporate assets are also allocated to individual cash-generating units, or otherwise they are allocated
to the smallest group of cash-generating units for which a reasonable and consistent allocation basis can be identified.
Intangible assets with indefinite useful lives and intangible assets not yet available for use are tested for impairment at
least annually, and whenever there is an indication that the asset may be impaired.
Recoverable amount is the higher of fair value less costs to sell and value in use. In assessing value in use, the estimated
future cash flows are discounted to their present value using a pre-tax discount rate that reflects current market
assessments of the time value of money and the risks specific to the asset for which the estimates of future cash flows
have not been adjusted.
If the recoverable amount of an asset (or cash-generating unit) is estimated to be less than its carrying amount, the
carrying amount of the asset (or cash-generating unit) is reduced to its recoverable amount. An impairment loss is
recognised immediately in profit or loss, unless the relevant asset is carried at a revalued amount, in which case the
impairment loss is treated as a revaluation decrease (see 2.11 above).
Where an impairment loss subsequently reverses, the carrying amount of the asset (or cash-generating unit) is increased
to the revised estimate of its recoverable amount, but so that the increased carrying amount does not exceed the
carrying amount that would have been determined had no impairment loss been recognised for the asset (or cash-
generating unit) in prior years. A reversal of an impairment loss is recognised immediately in profit or loss, unless the
relevant asset is carried at a revalued amount, in which case the reversal of the impairment loss is treated as a revaluation
increase (see 2.11 above).
2.13 Inventories
Inventories are initially recognised at cost and subsequently stated at the lower of cost and net realisable value. Costs of
inventories are determined on a weighted average basis. The cost of inventories comprises all costs of purchase, costs
of conversion and other costs incurred in bringing the inventories to their present location and condition. Net realisable
value represents the estimated selling price for inventories less all estimated costs of completion and costs necessary to
make the sale.
2.14 Provisions
Provisions are recognised when the Group has a present obligation (legal or constructive) as a result of a past event, it
is probable that the Group will be required to settle the obligation, and a reliable estimate can be made of the amount of
the obligation.
The amount recognised as a provision is the best estimate of the consideration required to settle the present obligation
at the end of the reporting period, taking into account the risks and uncertainties surrounding the obligation. When a
provision is measured using the cash flows estimated to settle the present obligation, its carrying amount is the present
value of those cash flows (where the effect of the time value of money is material).
AN
DU
LE
LA
IN
VE
ST
ME
NT
HO
LD
ING
S L
IMIT
ED
IN
TE
GR
AT
ED
AN
NU
AL
RE
PO
RT
20
12
52
ACCOUNTiNg pOliCies (continued)FOR The YeAR eNded 31 deCemBeR 2012
2. Summary of significant accounting policies (continued)
When some or all of the economic benefits required to settle a provision are expected to be recovered from a third party,
a receivable is recognised as an asset if it is virtually certain that reimbursement will be received and the amount of the
receivable can be measured reliably.
Onerous contracts
Present obligations arising under onerous contracts are recognised and measured as provisions. An onerous contract is
considered to exist where the Group has a contract under which the unavoidable costs of meeting the obligations under
the contract exceed the economic benefits expected to be received from the contract.
Restructurings
A restructuring provision is recognised when the Group has developed a detailed formal plan for the restructuring and
has raised a valid expectation in those affected that it will carry out the restructuring by starting to implement the plan
or announcing its main features to those affected by it. The measurement of a restructuring provision includes only the
direct expenditures arising from the restructuring, which are those amounts that are both necessarily entailed by the
restructuring and not associated with the ongoing activities of the entity.
Warranties
Provisions for the expected cost of warranty obligations under local sale of goods legislation are recognised at the
date of sale of the relevant products, at the directors’ best estimate of the expenditure required to settle the Group’s
obligation.
Contingent liabilities acquired in a business combination
Contingent liabilities acquired in a business combination are initially measured at fair value at the acquisition date if
they meet the recognition criterion of IFRS 3. At the end of subsequent reporting periods, such contingent liabilities
are measured at the higher of the amount that would be recognised in accordance with IAS 37 Provisions, Contingent
Liabilities and Contingent Assets and the amount initially recognised less cumulative amortisation.
2.15 Stated capital
An equity instrument is any contract that evidences a residual interest in the assets of the Company after deducting all
of its liabilities.
Ordinary shares are classified as equity. Mandatorily redeemable preference shares are classified as liabilities.
Incremental costs directly attributable to the issue of new shares or options are shown in equity as a deduction, net of
tax, from the proceeds.
2.16 Employee benefits
2.16.1 Short-term employee benefits
The cost of short-term employee benefits (those payable within 12 months after the service is rendered, such as paid
vacation leave and sick leave, bonuses, and non-monetary benefits such as medical care), are recognised in the period
in which the service is rendered and are not discounted.
The expected cost of compensated absences is recognised as an expense as the employees render services that
increase their entitlement or, in the case of non-accumulating absences, when the absence occurs. The expected cost of
profit sharing and bonus payments is recognised as an expense when there is a legal or constructive obligation to make
such payments as a result of past performance.
2.17 Foreign currency transactions
Transactions entered into by Group entities in a currency other than the currency of the primary economic environment
in which they operate are recorded at the rates ruling when the transaction occurs. Foreign currency monetary assets
and liabilities are translated at the rates ruling at the reporting date. Exchange differences arising on the retranslation of
unsettled monetary assets and liabilities are recognised immediately in profit and loss.
AN
DU
LE
LA
IN
VE
ST
ME
NT
HO
LD
ING
S L
IMIT
ED
IN
TE
GR
AT
ED
AN
NU
AL
RE
PO
RT
20
12
53
2.18 Income tax
Income tax expense represents the sum of the tax currently payable and deferred tax.
Current tax
The tax currently payable is based on taxable profit for the year. Taxable profit differs from profit as reported in the
consolidated statement of comprehensive income because of items of income or expense that are taxable or deductible
in other years and items that are never taxable or deductible. The Group’s liability for current tax is calculated using tax
rates that have been enacted or substantively enacted by the end of the reporting period.
Deferred tax
Deferred tax is recognised on temporary differences between the carrying amounts of assets and liabilities in the
consolidated financial statements and the corresponding tax bases used in the computation of taxable profit. Deferred
tax liabilities are generally recognised for all taxable temporary differences. Deferred tax assets are generally recognised
for all deductible temporary differences to the extent that it is probable that taxable profits will be available against which
those deductible temporary differences can be utilised. Such deferred tax assets and liabilities are not recognised if the
temporary difference arises from goodwill or from the initial recognition (other than in a business combination) of other
assets and liabilities in a transaction that affects neither the taxable profit nor the accounting profit.
Deferred tax liabilities are recognised for taxable temporary differences associated with investments in subsidiaries
and associates, and interests in joint ventures, except where the Group is able to control the reversal of the temporary
difference and it is probable that the temporary difference will not reverse in the foreseeable future. Deferred tax assets
arising from deductible temporary differences associated with such investments and interests are only recognised to the
extent that it is probable that there will be sufficient taxable profits against which to utilise the benefits of the temporary
differences and they are expected to reverse in the foreseeable future.
The carrying amount of deferred tax assets is reviewed at the end of each reporting period and reduced to the extent that
it is no longer probable that sufficient taxable profits will be available to allow all or part of the asset to be recovered.
Deferred tax assets and liabilities are measured at the tax rates that are expected to apply in the period in which the
liability is settled or the asset realised, based on tax rates (and tax laws) that have been enacted or substantively enacted
by the end of the reporting period. The measurement of deferred tax liabilities and assets reflects the tax consequences
that would follow from the manner in which the Group expects, at the end of the reporting period, to recover or settle the
carrying amount of its assets and liabilities.
Current and deferred tax for the year
Current and deferred tax are recognised in profit or loss, except when they relate to items that are recognised in
other comprehensive income or directly in equity, in which case, the current and deferred tax are also recognised in
other comprehensive income or directly in equity respectively. Where current tax or deferred tax arises from the initial
accounting for a business combination, the tax effect is included in the accounting for the business combination.
Secondary taxation on companies
Secondary taxation on companies is recognised in the year dividends are declared, net of dividends received. A deferred
taxation asset is recognised on unutilised STC credits when it is probable that such unused STC credits will be utilised
in the future.
2.19 Financial instruments
Financial assets and financial liabilities are recognised when a Group entity becomes a party to the contractual provisions
of the instrument.
Financial assets and financial liabilities are initially measured at fair value. Transaction costs that are directly attributable
to the acquisition or issue of financial assets and financial liabilities (other than financial assets and financial liabilities at
fair value through profit or loss) are added to or deducted from the fair value of the financial assets or financial liabilities,
as appropriate, on initial recognition. Transaction costs directly attributable to the acquisition of financial assets or
financial liabilities at fair value through profit or loss are recognised immediately in profit or loss.
AN
DU
LE
LA
IN
VE
ST
ME
NT
HO
LD
ING
S L
IMIT
ED
IN
TE
GR
AT
ED
AN
NU
AL
RE
PO
RT
20
12
54
ACCOUNTiNg pOliCies (continued)FOR The YeAR eNded 31 deCemBeR 2012
2. Summary of significant accounting policies (continued)
Fair value hierarchy
Financial assets and financial liabilities measured at fair value are classified using a fair value hierarchy that reflects the
significance of the inputs used in making the fair value measurement. The fair value hierarchy has the following levels:
(a) quoted prices (unadjusted) in active markets for identical assets or liabilities (Level 1);
(b) inputs other than quoted prices included within Level 1 that are observable for the asset or liability, either directly (i.e.
as prices) or indirectly (i.e. derived from prices) (Level 2); and
(c) inputs for the asset or liability that are not based on observable market data (unobservable inputs) (Level 3).
The level in the fair value hierarchy within which the financial asset or financial liability is categorised is determined on the
basis of the lowest level input that is significant to the fair value measurement. Financial assets and financial liabilities are
classified in their entirety into only one of the three levels.
The derivative cash flow hedge is classified as being Level 2.
2.20 Non-current assets held for sale
Non-current assets are classified as held for sale when:
• Theyareavailableforimmediatesale;
• Managementiscommittedtoaplantosell;
• Itisunlikelythatsignificantchangestotheplanwillbemadeorthattheplanwillbewithdrawn;
• Anactiveprogrammetolocateabuyerhasbeeninitiated;
• Theassetordisposalgroupisbeingmarketedatareasonablepriceinrelationtoitsfairvalue;and
• Asaleisexpectedtocompletewithin12monthsfromthedateofclassification.
Non-current assets classified as held for sale are measured at the lower of:
• TheircarryingamountimmediatelypriortobeingclassifiedasheldforsaleinaccordancewiththeGroup’saccounting
policy; and
• Fairvaluelesscoststosell.
Following their classification as held for sale, non-current assets (including those in a disposal group) are not depreciated.
2.21 Financial assets
Financial assets are classified into the following specified category: Loans and receivables. The classification depends
on the nature and purpose of the financial assets and is determined at the time of initial recognition. All regular way
purchases or sales of financial assets are recognised and derecognised on a trade date basis. Regular way purchases
or sales are purchases or sales of financial assets that require delivery of assets within the time frame established by
regulation or convention in the marketplace.
2.21.1 Loans and receivables
Loans and receivables are non-derivative financial assets with fixed or determinable payments that are not quoted in an
active market. Loans and receivables include trade and other receivables, loans to Group companies, bank balances and
cash and are measured at amortised cost using the effective interest method, less any impairment.
Cash and cash equivalents includes cash in hand, deposits held at call with banks, other short-term highly liquid
investments with original maturities of three months or less. Bank overdrafts are disclosed separately within loans and
borrowings in current liabilities on the consolidated statement of financial position.
Interest income is recognised by applying the effective interest rate, except for short-term receivables when the
recognition of interest would be immaterial.
AN
DU
LE
LA
IN
VE
ST
ME
NT
HO
LD
ING
S L
IMIT
ED
IN
TE
GR
AT
ED
AN
NU
AL
RE
PO
RT
20
12
55
2.21.2 Impairment of financial assets
Financial assets are assessed for indicators of impairment at the end of each reporting period. Financial assets are
considered to be impaired when there is objective evidence that, as a result of one or more events that occurred after the
initial recognition of the financial asset, the estimated future cash flows of the investment have been affected.
For financial assets, objective evidence of impairment could include:
• Significantfinancialdifficultyoftheissuerorcounterparty;or
• Breachofcontract,suchasadefaultordelinquencyininterestorprincipalpayments;or
• Itbecomingprobablethattheborrowerwillenterbankruptcyorfinancialre-organisation;or
• Thedisappearanceofanactivemarketforthatfinancialassetbecauseoffinancialdifficulties.
For certain categories of financial assets, such as trade receivables, assets that are assessed not to be impaired
individually are, in addition, assessed for impairment on a collective basis. Objective evidence of impairment for a
portfolio of receivables could include the Group’s past experience of collecting payments, an increase in the number of
delayed payments in the portfolio past the average credit period of 120 days, as well as observable changes in national
or local economic conditions that correlate with default on receivables.
For financial assets carried at cost, the amount of the impairment loss is measured as the difference between the asset’s
carrying amount and the present value of the estimated future cash flows discounted at the current market rate of return
for a similar financial asset. Such impairment loss will not be reversed in subsequent periods.
The carrying amount of trade receivables is reduced through the use of an allowance account. When a trade receivable
is considered uncollectible, it is written off against the allowance account. Subsequent recoveries of amounts previously
written off are credited against the allowance account. Changes in the carrying amount of the allowance account are
recognised in profit or loss.
For financial assets measured at amortised cost, if, in a subsequent period, the amount of the impairment loss decreases
and the decrease can be related objectively to an event occurring after the impairment was recognised, the previously
recognised impairment loss is reversed through profit or loss to the extent that the carrying amount of the investment at
the date the impairment is reversed does not exceed what the amortised cost would have been had the impairment not
been recognised.
2.21.3 Derecognition of financial assets
The Group derecognises a financial asset only when the contractual rights to the cash flows from the asset expire, or
when it transfers the financial asset and substantially all the risks and rewards of ownership of the asset to another entity.
If the Group neither transfers nor retains substantially all the risks and rewards of ownership and continues to control
the transferred asset, the Group recognises its retained interest in the asset and an associated liability for amounts it
may have to pay. If the Group retains substantially all the risks and rewards of ownership of a transferred financial asset,
the Group continues to recognise the financial asset and also recognises a collateralised borrowing for the proceeds
received.
On derecognition of a financial asset in its entirety, the difference between the asset’s carrying amount and the sum of the
consideration received and receivable and the cumulative gain or loss that had been recognised in other comprehensive
income and accumulated in equity is recognised in profit or loss.
On derecognition of a financial asset other than in its entirety (e.g. when the Group retains an option to repurchase part
of a transferred asset or retains a residual interest that does not result in the retention of substantially all the risks and
rewards of ownership and the Group retains control), the Group allocates the previous carrying amount of the financial
asset between the part it continues to recognise under continuing involvement, and the part it no longer recognises on
the basis of the relative fair values of those parts on the date of the transfer. The difference between the carrying amount
allocated to the part that is no longer recognised and the sum of the consideration received for the part no longer
recognised and any cumulative gain or loss allocated to it that had been recognised in other comprehensive income
is recognised in profit or loss. A cumulative gain or loss that had been recognised in other comprehensive income is
allocated between the part that continues to be recognised and the part that is no longer recognised on the basis of the
relative fair values of those parts.
AN
DU
LE
LA
IN
VE
ST
ME
NT
HO
LD
ING
S L
IMIT
ED
IN
TE
GR
AT
ED
AN
NU
AL
RE
PO
RT
20
12
56
ACCOUNTiNg pOliCies (continued)FOR The YeAR eNded 31 deCemBeR 2012
2. Summary of significant accounting policies (continued)
2.22 Hedge accounting
Hedge accounting is applied to financial assets and financial liabilities only where all of the following criteria are met:
• Atthe inceptionofthehedgethere isformaldesignationanddocumentationofthehedgingrelationshipandthe
Group's risk management objective and strategy for undertaking the hedge;
• Forcashflowhedges,thehedged iteminaforecasttransaction ishighlyprobableandpresentsanexposureto
variations in cash flows that could ultimately affect profit or loss;
• Thecumulativechangeinthefairvalueofthehedginginstrumentisexpectedtobebetween80%and125%ofthe
cumulative change in the fair value or cash flows of the hedged item attributable to the risk hedged (i.e. it is expected
to be highly effective);
• Theeffectivenessofthehedgecanbereliablymeasured;and
• Thehedgeremainshighlyeffectiveoneachdatetested.
Effectiveness is tested quarterly.
Cash flow hedges
The effective part of forward contracts designated as a hedge of the variability in cash flows of foreign currency risk
arising from firm commitments, and highly probable forecast transactions, are measured at fair value with changes in
fair value recognised in other comprehensive income and accumulated in the cash flow hedge reserve. The Group uses
such contracts to fix the cost of equipment, inventories and services, and the income from foreign currency sales, in the
functional currency of the Group entity concerned. If a highly probable forecast transaction results in the recognition of
a non-monetary asset, the cumulative loss/(gain) is added to/(subtracted from) the cost of the asset acquired ("basis
adjustment"). Otherwise the cumulative gain or loss recognised in other comprehensive income is reclassified from
the cash flow hedge reserve to profit or loss at the same time as the hedged transaction affects profit or loss. The two
transactions are recognised in the same line item.
If a forecast transaction is no longer considered highly probable but the forecast transaction is still expected to occur,
the cumulative gain or loss recognised in other comprehensive income is frozen and recognised in profit or loss in
accordance with the policy set out in the paragraph above. Subsequent changes in the fair value of the derivative are
recognised in profit or loss. If the Group closes out its position before the transaction takes place (even though it is still
expected to take place) the cumulative gain or loss on changes in fair value of the derivative is similarly recognised in
accordance with the policy set out in the paragraph above. If, at any point, the hedged transaction is no longer expected
to occur, the cumulative gain or loss is reclassified from the cash flow hedge reserve to profit or loss immediately.
The effective portion of gains and losses on derivatives used to manage cash flow interest rate risk (such as floating
to fixed interest rate swaps) is also recognised in other comprehensive income and accumulated in the cash flow
hedge reserve. However, if the Group closes out its position early, the cumulative gains and losses recognised in other
comprehensive income are frozen and reclassified from the cash flow hedge reserve to profit or loss using the effective
interest method. The ineffective portion of gains and losses on derivatives used to manage cash flow interest rate risk is
recognised in profit or loss within finance expense or finance income.
2.23 Financial liabilities and equity instruments
2.23.1 Classification as debt or equity
Debt and equity instruments issued by a Group entity are classified as either financial liabilities or as equity in accordance
with the substance of the contractual arrangements and the definitions of a financial liability and an equity instrument.
Equity instruments
An equity instrument is any contract that evidences a residual interest in the assets of an entity after deducting all of its
liabilities. Equity instruments issued by the Group are recognised at the proceeds received, net of direct issue costs.
Repurchase of the Group’s own equity instruments is recognised and deducted directly in equity. No gain or loss is
recognised in profit or loss on the purchase, sale, issue or cancellation of the Group’s own equity instruments.
AN
DU
LE
LA
IN
VE
ST
ME
NT
HO
LD
ING
S L
IMIT
ED
IN
TE
GR
AT
ED
AN
NU
AL
RE
PO
RT
20
12
57
2.24 Financial liabilities
Financial liabilities are classified as ‘other’ financial liabilities.
2.24.1 Other financial liabilities
Other financial liabilities (including borrowings, bank overdrafts and preference shares) are subsequently measured at
amortised cost using the effective interest method.
The effective interest method is a method of calculating the amortised cost of a financial liability and of allocating interest
expense over the relevant period. The effective interest rate is the rate that exactly discounts estimated future cash
payments (including all fees and points paid or received that form an integral part of the effective interest rate, transaction
costs and other premiums or discounts) through the expected life of the financial liability, or (where appropriate) a shorter
period, to the net carrying amount on initial recognition.
Trade payables and other short-term monetary liabilities are initially recognised at fair value and subsequently carried at
amortised cost using the effective interest method.
2.24.2 Derecognition of financial liabilities
The Group derecognises financial liabilities when, and only when, the Group’s obligations are discharged, cancelled or
they expire. The difference between the carrying amount of the financial liability derecognised and the consideration paid
and payable is recognised in profit or loss.
3. Critical accounting estimates and judgement In the application of the Group’s accounting policies, the directors are required to make judgements, estimates and
assumptions about the carrying amounts of assets and liabilities that are not readily apparent from other sources. The
estimates and associated assumptions are based on historical experience and other factors that are considered to be
relevant. Actual results may differ from these estimates.
3.1 Critical judgements and key sources of estimation uncertainty in applying the Company’s accounting policies
3.1.1 Judgements
The following are the critical judgements, apart from those involving estimations (see 3.1.2 below), that the directors have
made in the process of applying the Group’s accounting policies and that have the most significant effect on the amounts
recognised in the consolidated financial statements.
3.1.1.1 Revenue recognition
In making their judgement, the directors considered the detailed criteria for the recognition of revenue from the sale of
goods set out in IAS 18 Revenue and, in particular, whether the Group had transferred to the buyer the significant risks
and rewards of ownership of the goods.
The Sale of Tailings and Concentrate agreement between Kilken Platinum Pty Ltd (“Kilken”) and Rustenburg Platinum
Mines Ltd (“RPM”) provides for Kilken to purchase tailings from RPM, reprocess the tailings and sell the recovered PGM
concentrate back to RPM, and at this stage the revenue from the sale of the goods is recognised as revenue by the
Group.
3.1.2 Key sources of estimation uncertainty
The following are the key assumptions concerning the future, and other key sources of estimation uncertainty at the end
of the reporting period, that have a significant chance of creating a material adjustment to the carrying amounts of assets
and liabilities within the next financial year.
3.1.2.1 Impairment of goodwill
Determining whether goodwill is impaired requires an estimation of the value in use of the cash-generating units to which
goodwill has been allocated. The value in use calculation requires the directors to estimate the future cash flows expected
to arise from the cash-generating unit and a suitable discount rate in order to calculate present value. In determining the
carrying value of goodwill, the directors have taken account of a valuation report carried out by competent persons dated
1 December 2012. The valuation report relates to the underlying investment in Kilken.
AN
DU
LE
LA
IN
VE
ST
ME
NT
HO
LD
ING
S L
IMIT
ED
IN
TE
GR
AT
ED
AN
NU
AL
RE
PO
RT
20
12
58
ACCOUNTiNg pOliCies (continued)FOR The YeAR eNded 31 deCemBeR 2012
3. Critical accounting estimates and judgement (continued)
3.1.2.2 Property, plant and equipment (PPE)
PPE and intangible assets are considered for impairment if there is any reason to believe after applying the internal
and external impairment indicators that impairment may be necessary. Factors taken into consideration include the
economic viability of the asset itself and where it is a component of a larger cash-generating unit, the viability of the unit.
Future cash flows expected to be generated by the assets are projected, taking into account market conditions and the
expected useful lives of the assets. The present value of these cash flows, determined using an appropriate discount
rate, is compared to the current asset value and, if lower, the assets are impaired to the present value.
Valuations are based upon assumptions including current replacement cost, forced sale value and the appropriate
adjustment for each item’s useful life recognised to date. The valuers also make reference to market evidence of current
prices of the same or similar items of plant and machinery.
3.1.2.3 Asset useful lives and residual value
The Group depreciates its assets over their estimated useful lives taking into account residual values, where appropriate.
The appropriateness of its assets’ estimated useful lives, residual values and their depreciation methods are reassessed
on an annual basis. The actual lives of these assets and their respective residual values may vary depending on a variety
of factors. In reassessing asset lives, factors such as technological innovation, product life cycles and maintenance
programmes are taken into account.
Plant and machinery are carried at fair value. The Group obtains valuations performed by external valuers in order to
determine the fair value. These valuations are based upon assumptions including current replacement cost, forced sale
value and the appropriate adjustment for each item’s useful life recognised to date. The valuers also make reference to
market evidence of current prices of the same or similar items of plant and machinery.
3.1.2.4 Impairment of trade receivables and loans receivable
The Group assesses its trade receivables for impairment at each reporting date. The impairment for trade receivables is
assessed for impairment on an individual debtor basis, based on historical data and future factors. In determining whether
an impairment loss should be recorded in the statement of comprehensive income, the Group makes judgements as to
whether there is objective evidence indicating a measurable decrease in the estimated future cash flows from a financial
asset. Where objective evidence of impairment exists, future cash flows expected to be collected are projected after
taking into account market conditions and credit risk profile of the trade debtors. The present value of these cash flows,
determined using an appropriate discount rate, is compared to the carrying amount of the trade receivable and, if lower,
the trade receivables are impaired to the present value.
The carrying value less impairment provision of trade receivables and payables are assumed to approximate their fair
values.
The fair values of financial liabilities for disclosure purposes are estimated by discounting the future contractual cash
flows at the current market interest rate that is available to the Company for similar financial instruments.
3.1.2.5 Impairment of inventories
The Group assesses its inventories for impairment at each reporting date. The impairment for inventories is assessed
on an individual inventory item basis taking to account slow moving, damaged and obsolete items. Where objective
evidence of impairment exists, future cash flows expected to be collected are projected after taking into account market
conditions and scrap values. The present value of these cash flows, determined using an appropriate discount rate,
is compared to the carrying amount of the inventory items and, if lower, the relevant inventory items are impaired to
present value.
AN
DU
LE
LA
IN
VE
ST
ME
NT
HO
LD
ING
S L
IMIT
ED
IN
TE
GR
AT
ED
AN
NU
AL
RE
PO
RT
20
12
59
3.1.2.6 Taxes and deferred tax
Judgement is required in determining the provision for income tax due to the complexity of legislation. There are
many transactions and calculations for which the ultimate tax determination is uncertain during the ordinary course of
business. The Group recognises liabilities for anticipated tax audit issues based on estimates of whether additional taxes
will be due. Where the final tax outcome of these matters is different from the amounts that were initially recorded, such
differences will impact the income tax and deferred tax provisions in the period in which such determination is made. The
Group recognises the net future tax benefit related to deferred income tax assets to the extent that it is probable that the
deductible temporary differences will reverse in the foreseeable future.
Assessing the recoverability of deferred income tax assets requires the Group to make significant estimates related
to expectations of future taxable income. Estimates of future taxable income are based on forecast cash flows from
operations and the application of existing tax laws in each jurisdiction. To the extent that future cash flows and taxable
income differ significantly from estimates, the ability of the Group to realise the net deferred tax assets recorded at the
year-end date could be impacted. Deferred tax is provided for on a basis that is reflective of the expected manner of
recovery of the carrying amount of the asset, i.e. sale or use. This manner of recovery affects the rate used to determine
the deferred tax liability.
3.2 Segment reporting
Segment information is determined on the same basis as the information used by the chief operating decision-maker
for the purposes of allocating resources to segments and assessing segments’ performance. The Chief Operating
decision-maker has been identified as the executive directors who make strategic decisions. Segments have been
determined on a business unit basis by reference to the nature of the products and services engaged by the Group.
All intersegment transactions are eliminated and conducted at an arm’s length basis. The Group only has two reporting
segments due the nature of its investments in subsidiaries for the period under review.
3.3 Dividends payable
Dividend distributions to the Company’s shareholders are recognised as a liability in the Group’s financial statements in
the period in which the dividends are approved by the Company’s Board.
3.4 Earnings per share
The Group presents basic earnings per share (“EPS”) for its ordinary shares. Basic EPS is calculated by dividing the
profit or loss attributable to ordinary shareholders of the Group by the weighted average number of ordinary shares
outstanding during the period. Diluted earnings per share is determined by dividing the profit attributable to ordinary
shareholders by the weighted average number of ordinary shares outstanding adjusted for any potential dilutive effects
on all ordinary shares.
3.5 Headline earnings per share
Headline earnings per ordinary share are calculated using the weighted average number of ordinary shares in issue
during the period and are based on the earnings attributable to ordinary shareholders, after excluding those items as
required by Circular 3/2012 issued by the South African Institute of Chartered Accountants (“SAICA”).
AN
DU
LE
LA
IN
VE
ST
ME
NT
HO
LD
ING
S L
IMIT
ED
IN
TE
GR
AT
ED
AN
NU
AL
RE
PO
RT
20
12
60
4. Adoption of new and revised International Financial Reporting Standards
In the current year, the Company has adopted all new and revised Standards and Interpretations issued by the
International Accounting Standards Board (“IASB”) and the IFRS Interpretations Committee (“IFRIC”) that are relevant to
its operations and effective for annual reporting periods beginning on 1 January 2012. The adoption of these new and
revised Standards and Interpretations has not resulted in changes to the Company’s accounting policies.
At the date of authorisation of these financial statements for the year ended 31 December 2012, the following Standards
were adopted:
Title Details Effective
IAS 1 (Amendment) Presentation of Items of Other Comprehensive
Income
Annual periods commencing on or
after 1 July 2012
IFRS 7 Financial Instruments Disclosure: Transfers of
Financial Assets
Annual periods commencing on or
after 1 July 2011
At the date of the authorisation of these financial statements for the year ended 31 December 2012, the following
Standards were issued but not yet effective:
Title Details Effective
IFRS 1, First-time Adoption
of International Financial
Reporting Standards
• Amendmentsaddanexceptiontothe
retrospective application of IFRSs to
require that first-time adopters apply
the requirements in IFRS 9 Financial
Instruments and IAS 20 Accounting for
Government Grants and Disclosure of
Government Assistance prospectively to
government loans existing at the date of
transition to IFRSs.
• Annual Improvements 2009 – 2011 Cycle:
Amendments clarify the options available to
users when repeated application of
IFRS 1 is required and to add relevant
disclosure requirements.
• Annual Improvements 2009 – 2011 Cycle:
Amendments to borrowing costs.
1 January 2013
1 January 2013
1 January 2013
IFRS 7 Financial
Instruments: Disclosures
• Amendmentsrequireentitiestodisclose
gross amounts subject to rights of set-
off, amounts set off in accordance with
the accounting standards followed, and
the related net credit exposure. This
information will help investors understand
the extent to which an entity has set off
in its balance sheet and the effects of
rights of set-off on the entity's rights and
obligations.
1 January 2013
IFRS 9 Financial
Instruments
• NewStandardthatformsthefirstpart
of a three-part project to replace IAS 39
Financial Instruments: Recognition and
Measurement.
1 January 2015
ACCOUNTiNg pOliCies (continued)FOR The YeAR eNded 31 deCemBeR 2012
AN
DU
LE
LA
IN
VE
ST
ME
NT
HO
LD
ING
S L
IMIT
ED
IN
TE
GR
AT
ED
AN
NU
AL
RE
PO
RT
20
12
61
Title Details Effective
IFRS 10 Consolidated
Financial Statements
• Newstandardthatreplacesthe
consolidation requirements in SIC-12
Consolidation – Special Purpose Entities
and IAS 27 Consolidated and Separate
Financial Statements. Standard builds
on existing principles by identifying the
concept of control as the determining
factor in whether an entity should be
included within the consolidated financial
statements of the parent company and
provides additional guidance to assist in
the determination of control where this is
difficult to assess.
• Amendmentstothetransitionguidance
of IFRS 10 Consolidated Financial
Statements, IFRS 11 Joint Arrangements
and IFRS 12 Disclosure of Interests in Other
Entities, thus limiting the requirements to
provide adjusted comparative information.
• IFRS10exceptiontotheprinciplethatall
subsidiaries must be consolidated. Entities
meeting the definition of investment entities
must be accounted for at fair value under
IFRS 9 Financial Instruments or
IAS 39 Financial Instruments: Recognition
and Measurement.
1 January 2013
1 January 2013
1 January 2014
IFRS 11 Joint
Arrangements
• NewStandardthatdealswiththe
accounting for joint arrangements and
focuses on the rights and obligations of
the arrangement, rather than its legal form.
Standard requires a single method for
accounting for interests in jointly controlled
entities.
• Amendmentstothetransitionguidance
of IFRS 10 Consolidated Financial
Statements, IFRS 11 Joint Arrangements
and IFRS 12 Disclosure of Interests in Other
Entities, thus limiting the requirements to
provide adjusted comparative information.
1 January 2013
1 January 2013
AN
DU
LE
LA
IN
VE
ST
ME
NT
HO
LD
ING
S L
IMIT
ED
IN
TE
GR
AT
ED
AN
NU
AL
RE
PO
RT
20
12
62
4. Adoption of new and revised International Financial Reporting Standards (continued)
ACCOUNTiNg pOliCies (continued)FOR The YeAR eNded 31 deCemBeR 2012
Title Details Effective
IFRS 12 Disclosure of
Interests in Other Entities
• NewandcomprehensiveStandardon
disclosure requirements for all forms of
interests in other entities, including joint
arrangements, associates, special purpose
vehicles and other off-balance sheet
vehicles.
• Amendmentstothetransitionguidance
of IFRS 10 Consolidated Financial
Statements, IFRS 11 Joint Arrangements
and IFRS 12 Disclosure of Interests in Other
Entities, thus limiting the requirements to
provide adjusted comparative information.
• Newdisclosuresrequiredforinvestment
entities (as defined in IFRS 10).
1 January 2013
1 January 2013
1 January 2013
IFRS 13 Fair Value
Measurement
• Newguidanceonfairvaluemeasurement
and disclosure requirements.
1 January 2013
IAS 1 Presentation of
Financial Statements
• Annual Improvements 2009 – 2011 Cycle:
Amendments clarifying the requirements for
comparative information including minimum
and additional comparative information
required.
1 January 2013
IAS 16 Property, Plant and
Equipment
• Annual Improvements 2009 – 2011 Cycle:
Amendments to the recognition and
classification of servicing equipment.
1 January 2013
IAS 19 Employee Benefits • Amendmentstotheaccountingforcurrent
and future obligations resulting from the
provision of defined benefit plans.
1 January 2013
lAS 27 Consolidated
and Separate Financial
Statements
• Consequentialamendmentsresultingfrom
the issue of lFRS 10, 11 and 12.
• Requirementtoaccountforinterestsin
investment entities at fair value under
lFRS 9 Financial Instruments, or lAS 39
Financial Instruments: Recognition and
Measurement, in the separate financial
statements of a parent.
1 January 2013
1 January 2014
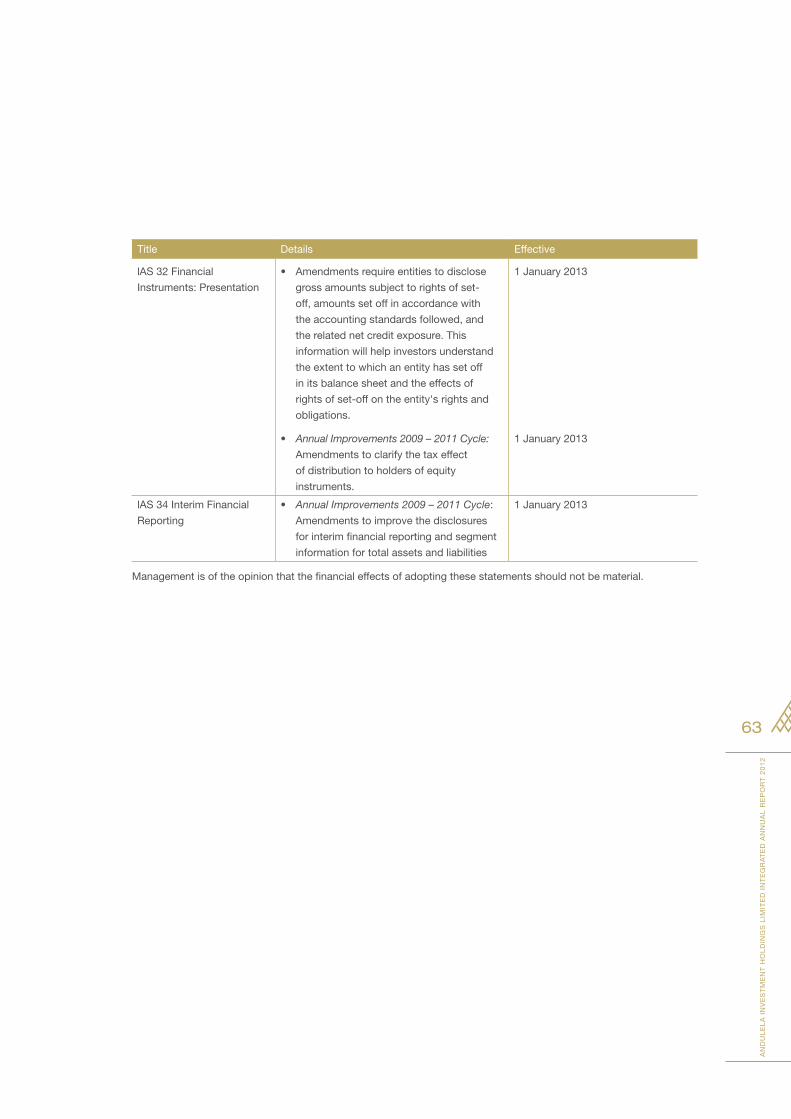
AN
DU
LE
LA
IN
VE
ST
ME
NT
HO
LD
ING
S L
IMIT
ED
IN
TE
GR
AT
ED
AN
NU
AL
RE
PO
RT
20
12
63
Title Details Effective
lAS 32 Financial
Instruments: Presentation
• Amendmentsrequireentitiestodisclose
gross amounts subject to rights of set-
off, amounts set off in accordance with
the accounting standards followed, and
the related net credit exposure. This
information will help investors understand
the extent to which an entity has set off
in its balance sheet and the effects of
rights of set-off on the entity's rights and
obligations.
• Annual Improvements 2009 – 2011 Cycle:
Amendments to clarify the tax effect
of distribution to holders of equity
instruments.
1 January 2013
1 January 2013
lAS 34 Interim Financial
Reporting
• Annual Improvements 2009 – 2011 Cycle:
Amendments to improve the disclosures
for interim financial reporting and segment
information for total assets and liabilities
1 January 2013
Management is of the opinion that the financial effects of adopting these statements should not be material.
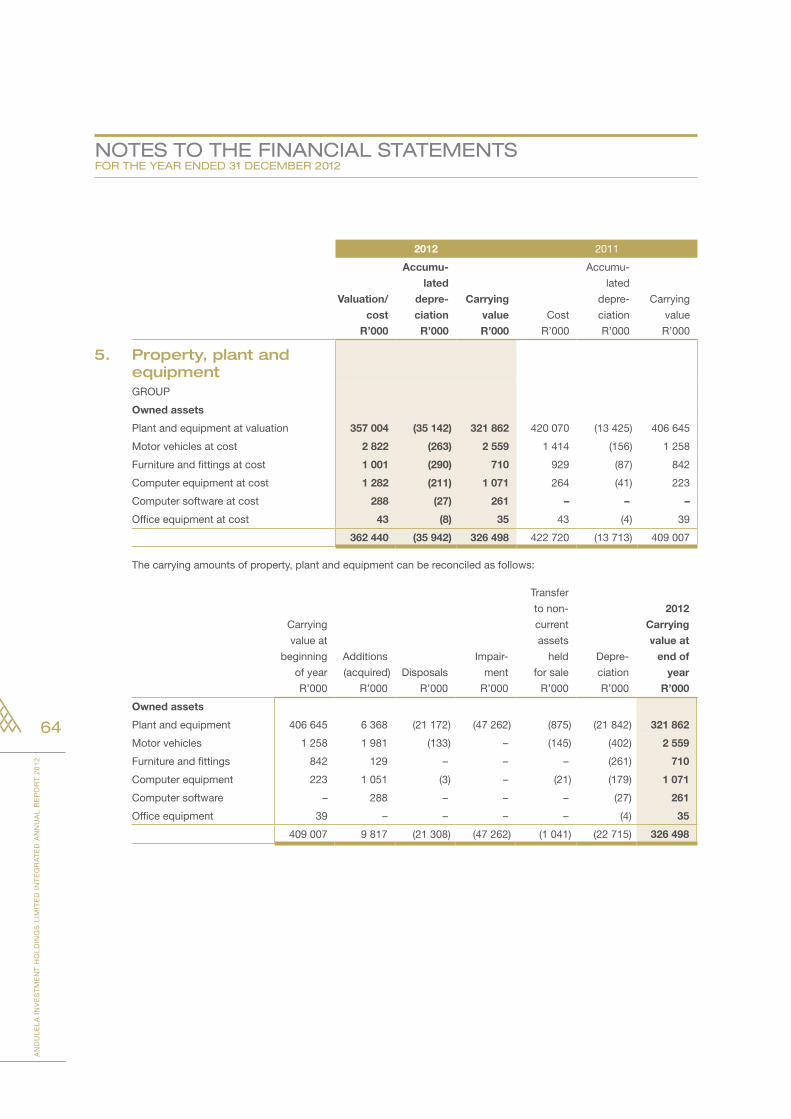
AN
DU
LE
LA
IN
VE
ST
ME
NT
HO
LD
ING
S L
IMIT
ED
IN
TE
GR
AT
ED
AN
NU
AL
RE
PO
RT
20
12
64
NOTes TO The FiNANCiAl sTATemeNTs FOR The YeAR eNded 31 deCemBeR 2012
2012 2011
Valuation/
cost
R’000
Accumu-
lated
depre-
ciation
R’000
Carrying
value
R’000
Cost
R’000
Accumu-
lated
depre-
ciation
R’000
Carrying
value
R’000
5. Property, plant and equipmentGROUP
Owned assets
Plant and equipment at valuation 357 004 (35 142) 321 862 420 070 (13 425) 406 645
Motor vehicles at cost 2 822 (263) 2 559 1 414 (156) 1 258
Furniture and fittings at cost 1 001 (290) 710 929 (87) 842
Computer equipment at cost 1 282 (211) 1 071 264 (41) 223
Computer software at cost 288 (27) 261 – – –
Office equipment at cost 43 (8) 35 43 (4) 39
362 440 (35 942) 326 498 422 720 (13 713) 409 007
The carrying amounts of property, plant and equipment can be reconciled as follows:
Carrying
value at
beginning
of year
R’000
Additions
(acquired)
R’000
Disposals
R’000
Impair-
ment
R’000
Transfer
to non-
current
assets
held
for sale
R’000
Depre-
ciation
R’000
2012
Carrying
value at
end of
year
R’000
Owned assets
Plant and equipment 406 645 6 368 (21 172) (47 262) (875) (21 842) 321 862
Motor vehicles 1 258 1 981 (133) – (145) (402) 2 559
Furniture and fittings 842 129 – – – (261) 710
Computer equipment 223 1 051 (3) – (21) (179) 1 071
Computer software – 288 – – – (27) 261
Office equipment 39 – – – – (4) 35
409 007 9 817 (21 308) (47 262) (1 041) (22 715) 326 498
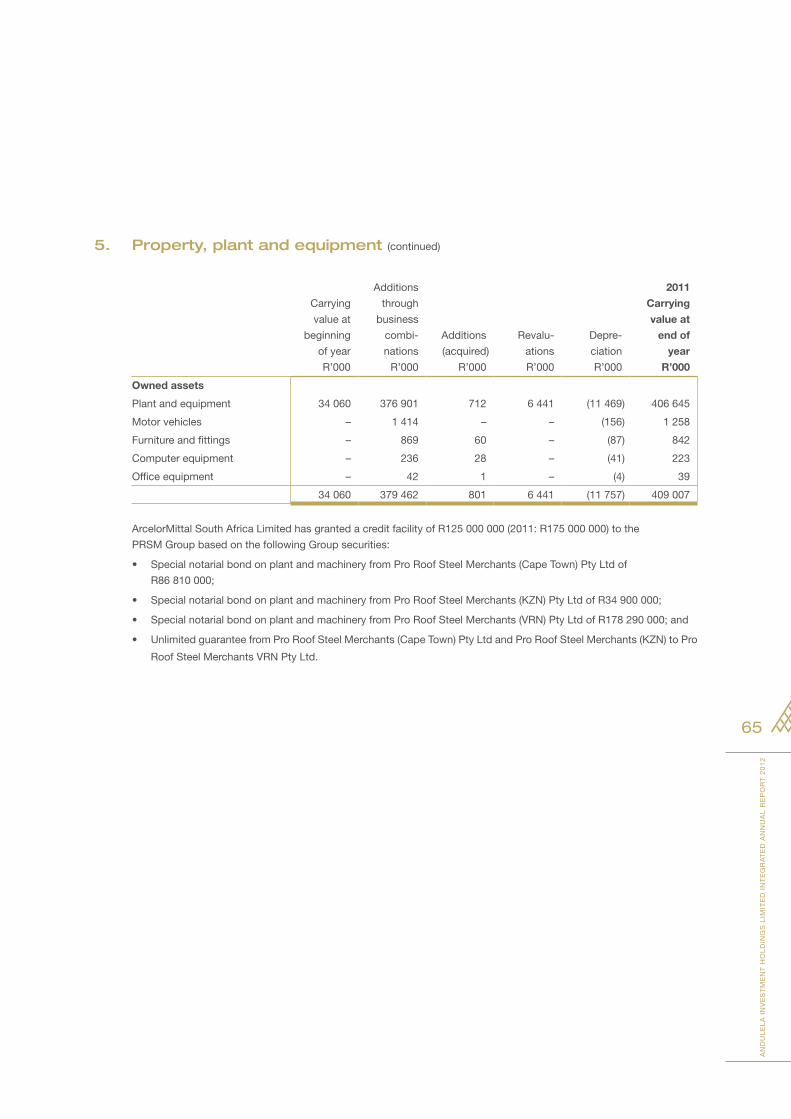
AN
DU
LE
LA
IN
VE
ST
ME
NT
HO
LD
ING
S L
IMIT
ED
IN
TE
GR
AT
ED
AN
NU
AL
RE
PO
RT
20
12
65
5. Property, plant and equipment (continued)
Carrying
value at
beginning
of year
R’000
Additions
through
business
combi-
nations
R’000
Additions
(acquired)
R’000
Revalu-
ations
R’000
Depre-
ciation
R’000
2011
Carrying
value at
end of
year
R’000
Owned assets
Plant and equipment 34 060 376 901 712 6 441 (11 469) 406 645
Motor vehicles – 1 414 – – (156) 1 258
Furniture and fittings – 869 60 – (87) 842
Computer equipment – 236 28 – (41) 223
Office equipment – 42 1 – (4) 39
34 060 379 462 801 6 441 (11 757) 409 007
ArcelorMittal South Africa Limited has granted a credit facility of R125 000 000 (2011: R175 000 000) to the
PRSM Group based on the following Group securities:
• SpecialnotarialbondonplantandmachineryfromProRoofSteelMerchants(CapeTown)PtyLtdof
R86 810 000;
• SpecialnotarialbondonplantandmachineryfromProRoofSteelMerchants(KZN)PtyLtdofR34900000;
• SpecialnotarialbondonplantandmachineryfromProRoofSteelMerchants(VRN)PtyLtdofR178290000;and
• UnlimitedguaranteefromProRoofSteelMerchants(CapeTown)PtyLtdandProRoofSteelMerchants(KZN)toPro
Roof Steel Merchants VRN Pty Ltd.
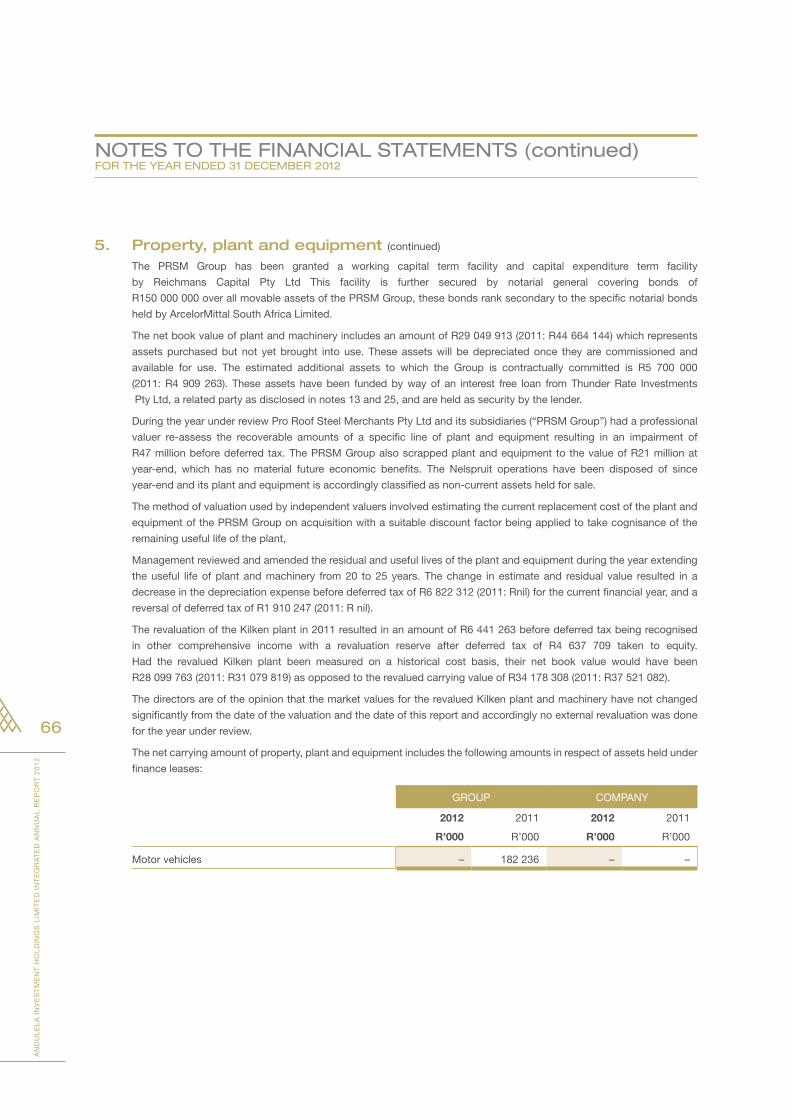
AN
DU
LE
LA
IN
VE
ST
ME
NT
HO
LD
ING
S L
IMIT
ED
IN
TE
GR
AT
ED
AN
NU
AL
RE
PO
RT
20
12
66
NOTes TO The FiNANCiAl sTATemeNTs (continued)FOR The YeAR eNded 31 deCemBeR 2012
5. Property, plant and equipment (continued)
The PRSM Group has been granted a working capital term facility and capital expenditure term facility
by Reichmans Capital Pty Ltd This facility is further secured by notarial general covering bonds of
R150 000 000 over all movable assets of the PRSM Group, these bonds rank secondary to the specific notarial bonds
held by ArcelorMittal South Africa Limited.
The net book value of plant and machinery includes an amount of R29 049 913 (2011: R44 664 144) which represents
assets purchased but not yet brought into use. These assets will be depreciated once they are commissioned and
available for use. The estimated additional assets to which the Group is contractually committed is R5 700 000
(2011: R4 909 263). These assets have been funded by way of an interest free loan from Thunder Rate Investments
Pty Ltd, a related party as disclosed in notes 13 and 25, and are held as security by the lender.
During the year under review Pro Roof Steel Merchants Pty Ltd and its subsidiaries (“PRSM Group”) had a professional
valuer re-assess the recoverable amounts of a specific line of plant and equipment resulting in an impairment of
R47 million before deferred tax. The PRSM Group also scrapped plant and equipment to the value of R21 million at
year-end, which has no material future economic benefits. The Nelspruit operations have been disposed of since
year-end and its plant and equipment is accordingly classified as non-current assets held for sale.
The method of valuation used by independent valuers involved estimating the current replacement cost of the plant and
equipment of the PRSM Group on acquisition with a suitable discount factor being applied to take cognisance of the
remaining useful life of the plant,
Management reviewed and amended the residual and useful lives of the plant and equipment during the year extending
the useful life of plant and machinery from 20 to 25 years. The change in estimate and residual value resulted in a
decrease in the depreciation expense before deferred tax of R6 822 312 (2011: Rnil) for the current financial year, and a
reversal of deferred tax of R1 910 247 (2011: R nil).
The revaluation of the Kilken plant in 2011 resulted in an amount of R6 441 263 before deferred tax being recognised
in other comprehensive income with a revaluation reserve after deferred tax of R4 637 709 taken to equity.
Had the revalued Kilken plant been measured on a historical cost basis, their net book value would have been
R28 099 763 (2011: R31 079 819) as opposed to the revalued carrying value of R34 178 308 (2011: R37 521 082).
The directors are of the opinion that the market values for the revalued Kilken plant and machinery have not changed
significantly from the date of the valuation and the date of this report and accordingly no external revaluation was done
for the year under review.
The net carrying amount of property, plant and equipment includes the following amounts in respect of assets held under
finance leases:
GROUP COMPANY
2012 2011 2012 2011
R’000 R’000 R’000 R’000
Motor vehicles – 182 236 – –
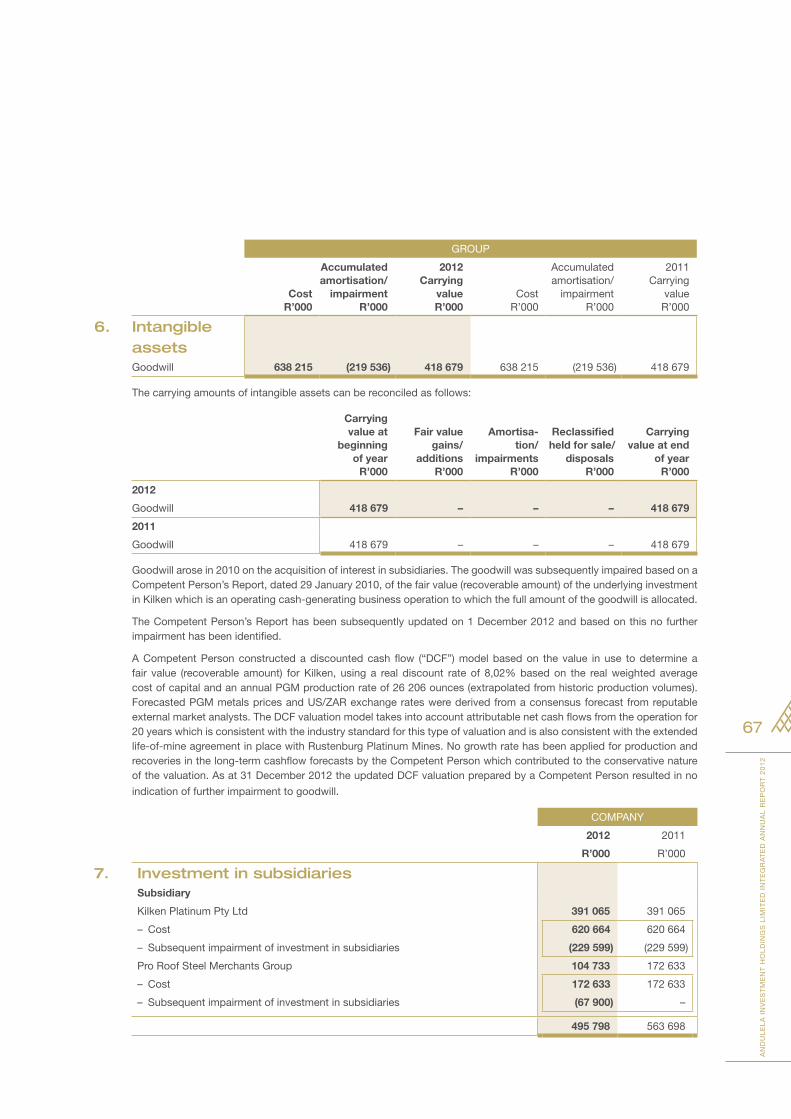
AN
DU
LE
LA
IN
VE
ST
ME
NT
HO
LD
ING
S L
IMIT
ED
IN
TE
GR
AT
ED
AN
NU
AL
RE
PO
RT
20
12
67
GROUP
CostR’000
Accumulatedamortisation/
impairmentR’000
2012 Carrying
valueR’000
CostR’000
Accumulated amortisation/
impairmentR’000
2011 Carrying
valueR’000
6. Intangible assetsGoodwill 638 215 (219 536) 418 679 638 215 (219 536) 418 679
The carrying amounts of intangible assets can be reconciled as follows:
Carrying value at
beginning of year
R’000
Fair value gains/
additionsR’000
Amortisa-tion/
impairmentsR’000
Reclassified held for sale/
disposalsR’000
Carrying value at end
of yearR’000
2012
Goodwill 418 679 – – – 418 679
2011
Goodwill 418 679 – – – 418 679
Goodwill arose in 2010 on the acquisition of interest in subsidiaries. The goodwill was subsequently impaired based on a Competent Person’s Report, dated 29 January 2010, of the fair value (recoverable amount) of the underlying investment in Kilken which is an operating cash-generating business operation to which the full amount of the goodwill is allocated.
The Competent Person’s Report has been subsequently updated on 1 December 2012 and based on this no further impairment has been identified.
A Competent Person constructed a discounted cash flow (“DCF”) model based on the value in use to determine a fair value (recoverable amount) for Kilken, using a real discount rate of 8,02% based on the real weighted average cost of capital and an annual PGM production rate of 26 206 ounces (extrapolated from historic production volumes). Forecasted PGM metals prices and US/ZAR exchange rates were derived from a consensus forecast from reputable external market analysts. The DCF valuation model takes into account attributable net cash flows from the operation for 20 years which is consistent with the industry standard for this type of valuation and is also consistent with the extended life-of-mine agreement in place with Rustenburg Platinum Mines. No growth rate has been applied for production and recoveries in the long-term cashflow forecasts by the Competent Person which contributed to the conservative nature of the valuation. As at 31 December 2012 the updated DCF valuation prepared by a Competent Person resulted in no
indication of further impairment to goodwill.
COMPANY
2012 2011
R’000 R’000
7. Investment in subsidiariesSubsidiary
Kilken Platinum Pty Ltd 391 065 391 065
– Cost 620 664 620 664
– Subsequent impairment of investment in subsidiaries (229 599) (229 599)
Pro Roof Steel Merchants Group 104 733 172 633
– Cost 172 633 172 633
– Subsequent impairment of investment in subsidiaries (67 900) –
495 798 563 698
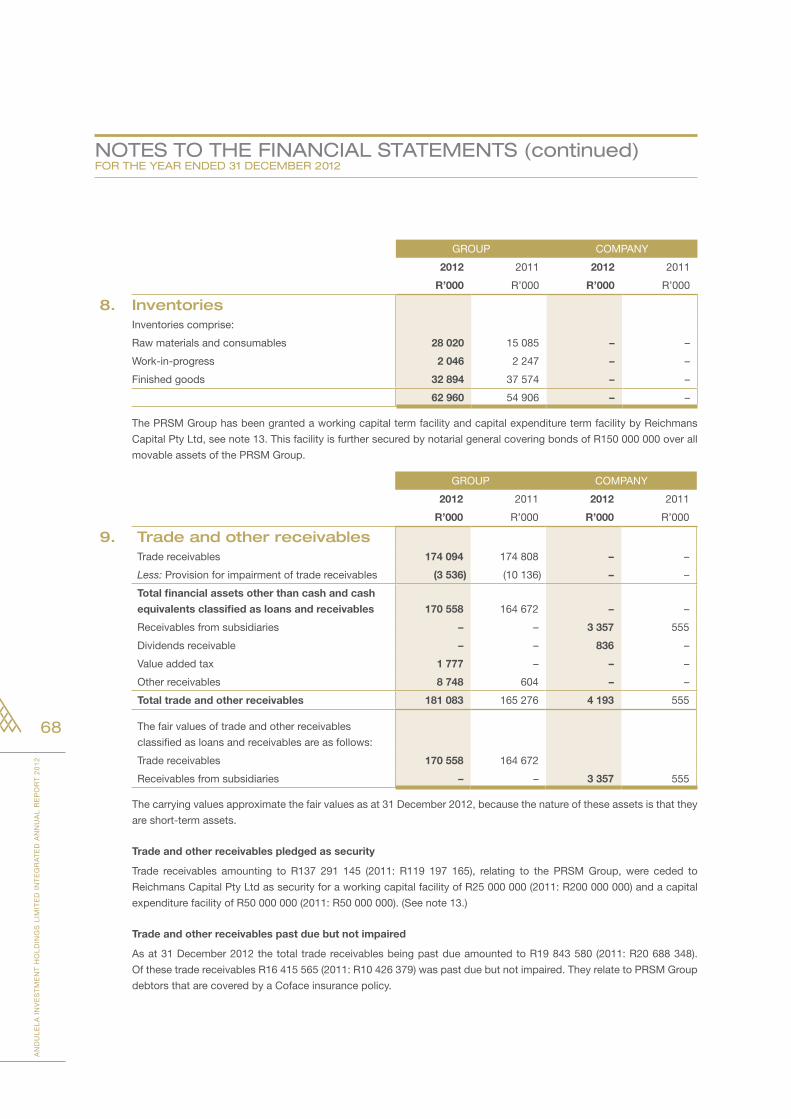
AN
DU
LE
LA
IN
VE
ST
ME
NT
HO
LD
ING
S L
IMIT
ED
IN
TE
GR
AT
ED
AN
NU
AL
RE
PO
RT
20
12
68
NOTes TO The FiNANCiAl sTATemeNTs (continued)FOR The YeAR eNded 31 deCemBeR 2012
GROUP COMPANY
2012 2011 2012 2011
R’000 R’000 R’000 R’000
8. InventoriesInventories comprise:
Raw materials and consumables 28 020 15 085 – –
Work-in-progress 2 046 2 247 – –
Finished goods 32 894 37 574 – –
62 960 54 906 – –
The PRSM Group has been granted a working capital term facility and capital expenditure term facility by Reichmans
Capital Pty Ltd, see note 13. This facility is further secured by notarial general covering bonds of R150 000 000 over all
movable assets of the PRSM Group.
GROUP COMPANY
2012 2011 2012 2011
R’000 R’000 R’000 R’000
9. Trade and other receivablesTrade receivables 174 094 174 808 – –
Less: Provision for impairment of trade receivables (3 536) (10 136) – –
Total financial assets other than cash and cash
equivalents classified as loans and receivables 170 558 164 672 – –
Receivables from subsidiaries – – 3 357 555
Dividends receivable – – 836 –
Value added tax 1 777 – – –
Other receivables 8 748 604 – –
Total trade and other receivables 181 083 165 276 4 193 555
The fair values of trade and other receivables
classified as loans and receivables are as follows:
Trade receivables 170 558 164 672
Receivables from subsidiaries – – 3 357 555
The carrying values approximate the fair values as at 31 December 2012, because the nature of these assets is that they
are short-term assets.
Trade and other receivables pledged as security
Trade receivables amounting to R137 291 145 (2011: R119 197 165), relating to the PRSM Group, were ceded to
Reichmans Capital Pty Ltd as security for a working capital facility of R25 000 000 (2011: R200 000 000) and a capital
expenditure facility of R50 000 000 (2011: R50 000 000). (See note 13.)
Trade and other receivables past due but not impaired
As at 31 December 2012 the total trade receivables being past due amounted to R19 843 580 (2011: R20 688 348).
Of these trade receivables R16 415 565 (2011: R10 426 379) was past due but not impaired. They relate to PRSM Group
debtors that are covered by a Coface insurance policy.
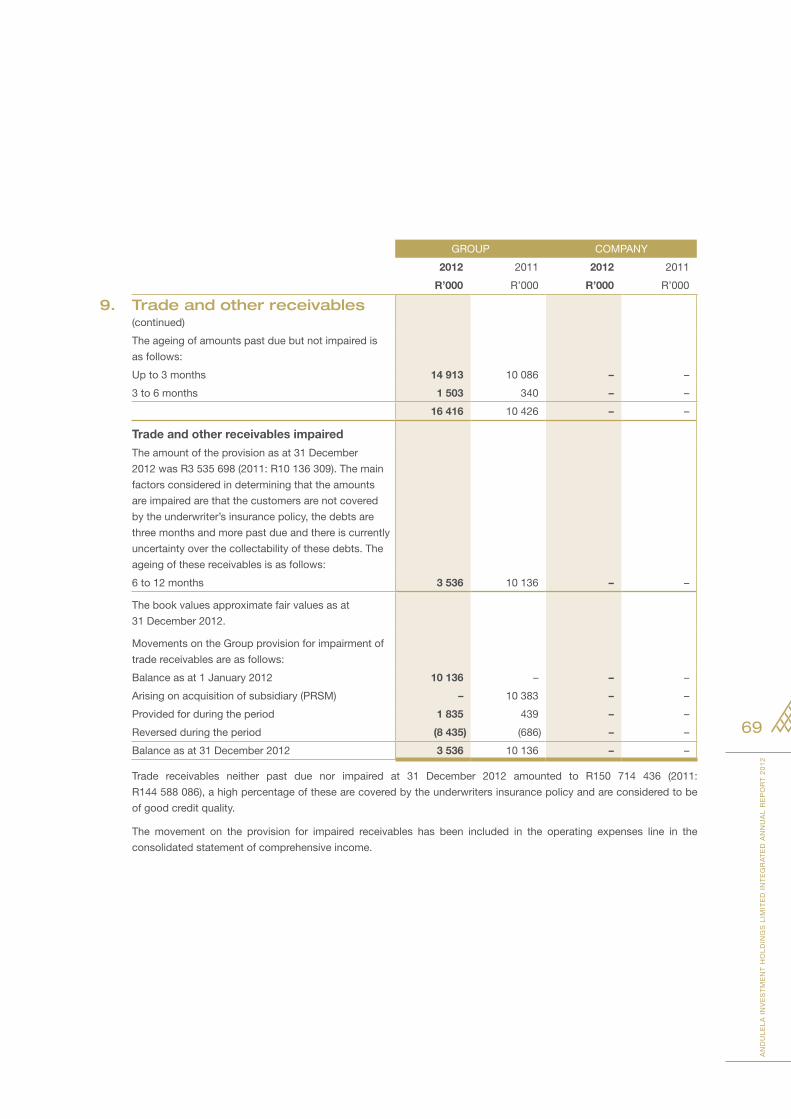
AN
DU
LE
LA
IN
VE
ST
ME
NT
HO
LD
ING
S L
IMIT
ED
IN
TE
GR
AT
ED
AN
NU
AL
RE
PO
RT
20
12
69
GROUP COMPANY
2012 2011 2012 2011
R’000 R’000 R’000 R’000
9. Trade and other receivables (continued)
The ageing of amounts past due but not impaired is
as follows:
Up to 3 months 14 913 10 086 – –
3 to 6 months 1 503 340 – –
16 416 10 426 – –
Trade and other receivables impaired
The amount of the provision as at 31 December
2012 was R3 535 698 (2011: R10 136 309). The main
factors considered in determining that the amounts
are impaired are that the customers are not covered
by the underwriter’s insurance policy, the debts are
three months and more past due and there is currently
uncertainty over the collectability of these debts. The
ageing of these receivables is as follows:
6 to 12 months 3 536 10 136 – –
The book values approximate fair values as at
31 December 2012.
Movements on the Group provision for impairment of
trade receivables are as follows:
Balance as at 1 January 2012 10 136 – – –
Arising on acquisition of subsidiary (PRSM) – 10 383 – –
Provided for during the period 1 835 439 – –
Reversed during the period (8 435) (686) – –
Balance as at 31 December 2012 3 536 10 136 – –
Trade receivables neither past due nor impaired at 31 December 2012 amounted to R150 714 436 (2011:
R144 588 086), a high percentage of these are covered by the underwriters insurance policy and are considered to be
of good credit quality.
The movement on the provision for impaired receivables has been included in the operating expenses line in the
consolidated statement of comprehensive income.
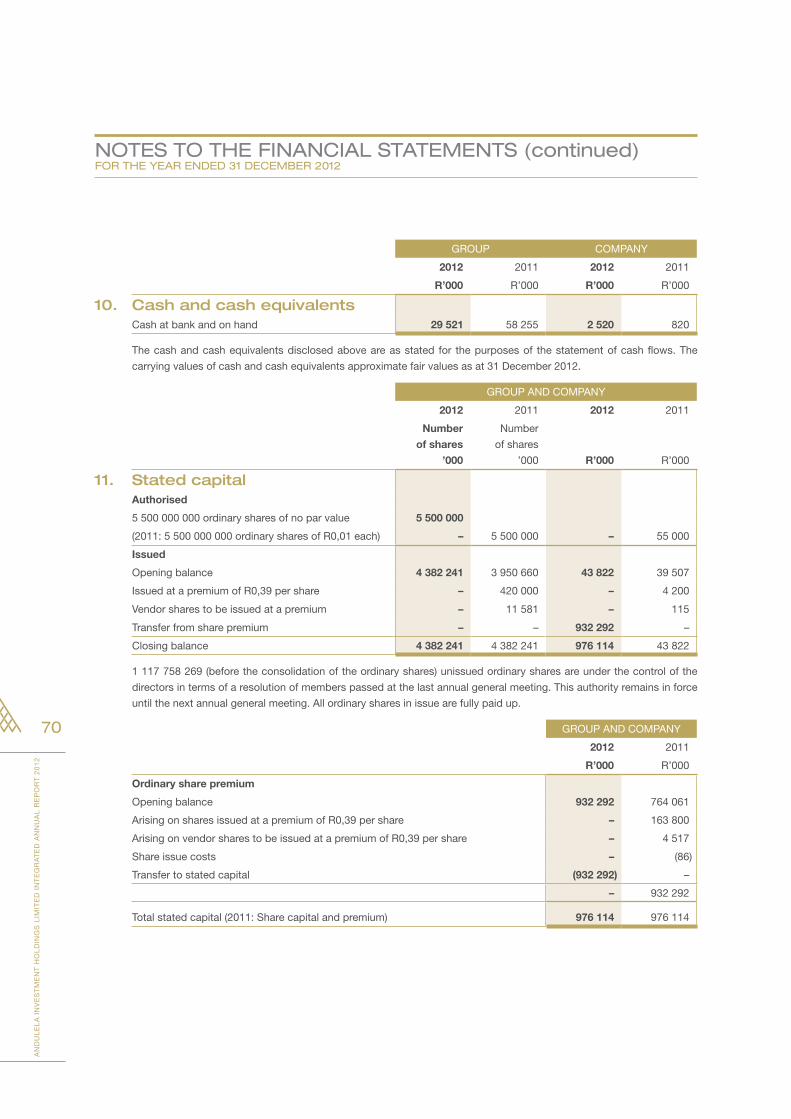
AN
DU
LE
LA
IN
VE
ST
ME
NT
HO
LD
ING
S L
IMIT
ED
IN
TE
GR
AT
ED
AN
NU
AL
RE
PO
RT
20
12
70
NOTes TO The FiNANCiAl sTATemeNTs (continued)FOR The YeAR eNded 31 deCemBeR 2012
GROUP COMPANY
2012 2011 2012 2011
R’000 R’000 R’000 R’000
10. Cash and cash equivalentsCash at bank and on hand 29 521 58 255 2 520 820
The cash and cash equivalents disclosed above are as stated for the purposes of the statement of cash flows. The
carrying values of cash and cash equivalents approximate fair values as at 31 December 2012.
GROUP AND COMPANY
2012 2011 2012 2011
Number
of shares
’000
Number
of shares
’000 R’000 R’000
11. Stated capitalAuthorised
5 500 000 000 ordinary shares of no par value 5 500 000
(2011: 5 500 000 000 ordinary shares of R0,01 each) – 5 500 000 – 55 000
Issued
Opening balance 4 382 241 3 950 660 43 822 39 507
Issued at a premium of R0,39 per share – 420 000 – 4 200
Vendor shares to be issued at a premium – 11 581 – 115
Transfer from share premium – – 932 292 –
Closing balance 4 382 241 4 382 241 976 114 43 822
1 117 758 269 (before the consolidation of the ordinary shares) unissued ordinary shares are under the control of the
directors in terms of a resolution of members passed at the last annual general meeting. This authority remains in force
until the next annual general meeting. All ordinary shares in issue are fully paid up.
GROUP AND COMPANY
2012 2011
R’000 R’000
Ordinary share premium
Opening balance 932 292 764 061
Arising on shares issued at a premium of R0,39 per share – 163 800
Arising on vendor shares to be issued at a premium of R0,39 per share – 4 517
Share issue costs – (86)
Transfer to stated capital (932 292) –
– 932 292
Total stated capital (2011: Share capital and premium) 976 114 976 114
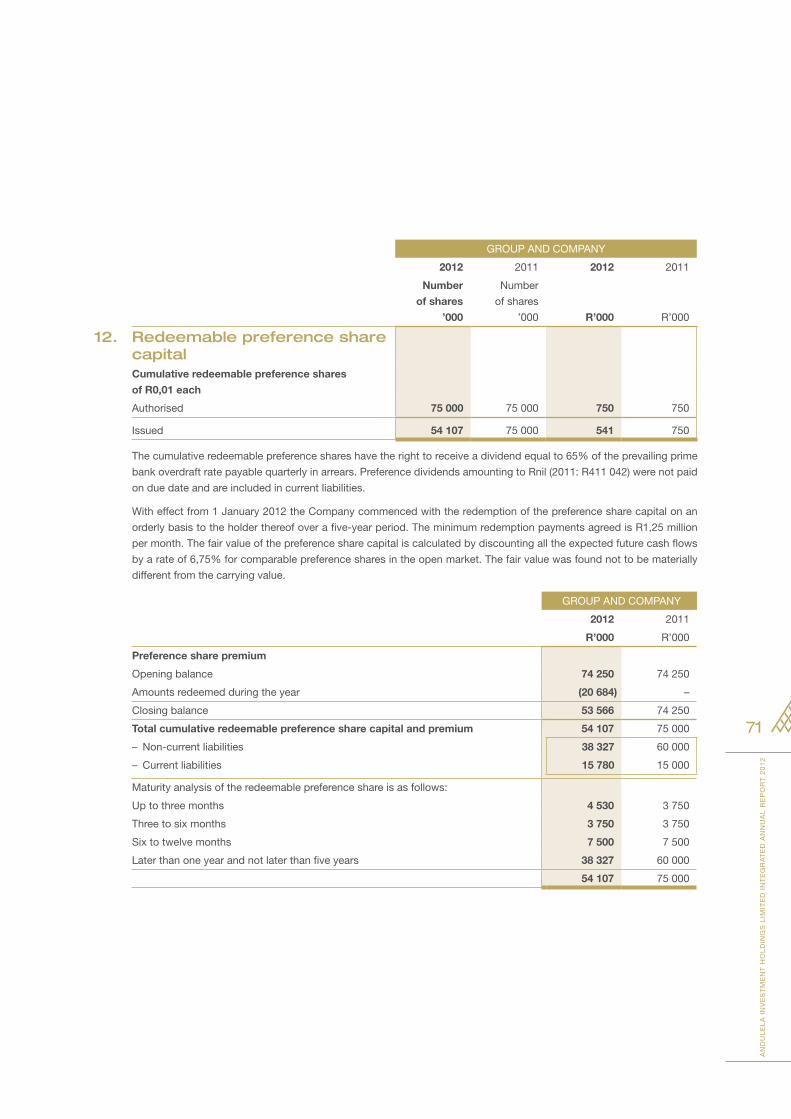
AN
DU
LE
LA
IN
VE
ST
ME
NT
HO
LD
ING
S L
IMIT
ED
IN
TE
GR
AT
ED
AN
NU
AL
RE
PO
RT
20
12
71
GROUP AND COMPANY
2012 2011 2012 2011
Number
of shares
’000
Number
of shares
’000 R’000 R’000
12. Redeemable preference share capitalCumulative redeemable preference shares
of R0,01 each
Authorised 75 000 75 000 750 750
Issued 54 107 75 000 541 750
The cumulative redeemable preference shares have the right to receive a dividend equal to 65% of the prevailing prime
bank overdraft rate payable quarterly in arrears. Preference dividends amounting to Rnil (2011: R411 042) were not paid
on due date and are included in current liabilities.
With effect from 1 January 2012 the Company commenced with the redemption of the preference share capital on an
orderly basis to the holder thereof over a five-year period. The minimum redemption payments agreed is R1,25 million
per month. The fair value of the preference share capital is calculated by discounting all the expected future cash flows
by a rate of 6,75% for comparable preference shares in the open market. The fair value was found not to be materially
different from the carrying value.
GROUP AND COMPANY
2012 2011
R’000 R’000
Preference share premium
Opening balance 74 250 74 250
Amounts redeemed during the year (20 684) –
Closing balance 53 566 74 250
Total cumulative redeemable preference share capital and premium 54 107 75 000
– Non-current liabilities 38 327 60 000
– Current liabilities 15 780 15 000
Maturity analysis of the redeemable preference share is as follows:
Up to three months 4 530 3 750
Three to six months 3 750 3 750
Six to twelve months 7 500 7 500
Later than one year and not later than five years 38 327 60 000
54 107 75 000
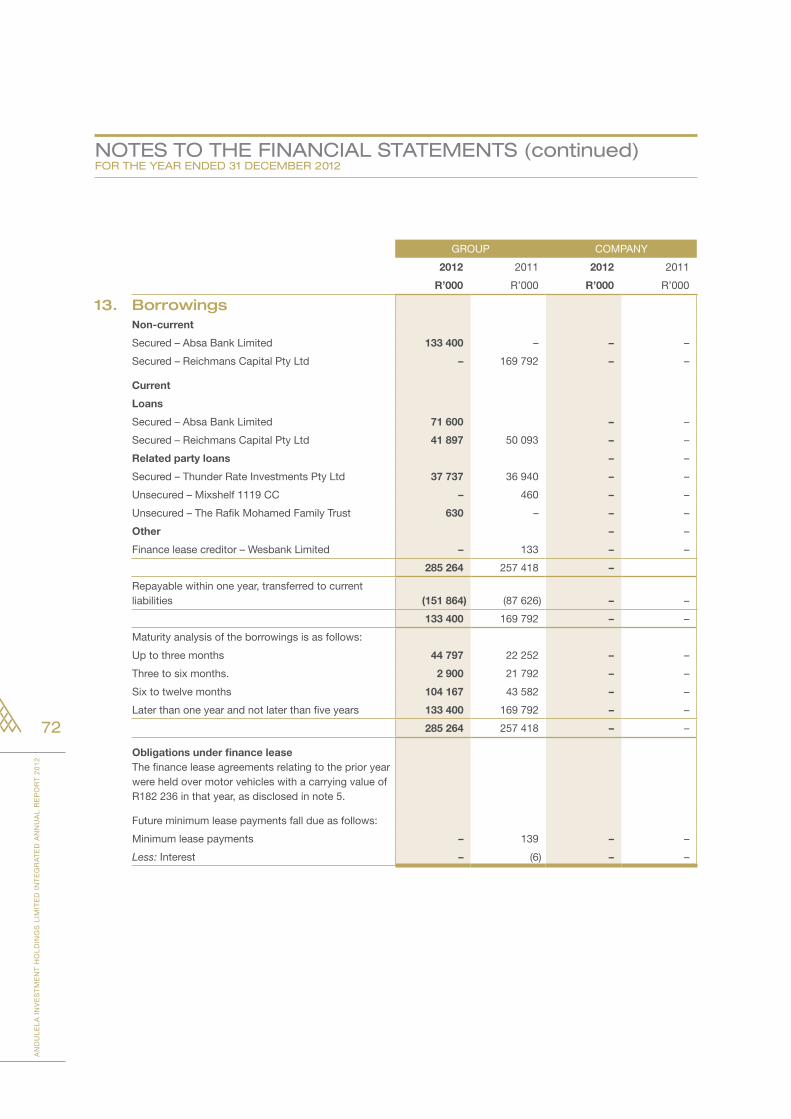
AN
DU
LE
LA
IN
VE
ST
ME
NT
HO
LD
ING
S L
IMIT
ED
IN
TE
GR
AT
ED
AN
NU
AL
RE
PO
RT
20
12
72
NOTes TO The FiNANCiAl sTATemeNTs (continued)FOR The YeAR eNded 31 deCemBeR 2012
GROUP COMPANY
2012 2011 2012 2011
R’000 R’000 R’000 R’000
13. BorrowingsNon-current
Secured – Absa Bank Limited 133 400 – – –
Secured – Reichmans Capital Pty Ltd – 169 792 – –
Current
Loans
Secured – Absa Bank Limited 71 600 – –
Secured – Reichmans Capital Pty Ltd 41 897 50 093 – –
Related party loans – –
Secured – Thunder Rate Investments Pty Ltd 37 737 36 940 – –
Unsecured – Mixshelf 1119 CC – 460 – –
Unsecured – The Rafik Mohamed Family Trust 630 – – –
Other – –
Finance lease creditor – Wesbank Limited – 133 – –
285 264 257 418 –
Repayable within one year, transferred to current liabilities (151 864) (87 626) – –
133 400 169 792 – –
Maturity analysis of the borrowings is as follows:
Up to three months 44 797 22 252 – –
Three to six months. 2 900 21 792 – –
Six to twelve months 104 167 43 582 – –
Later than one year and not later than five years 133 400 169 792 – –
285 264 257 418 – –
Obligations under finance leaseThe finance lease agreements relating to the prior year were held over motor vehicles with a carrying value of R182 236 in that year, as disclosed in note 5.
Future minimum lease payments fall due as follows:
Minimum lease payments – 139 – –
Less: Interest – (6) – –
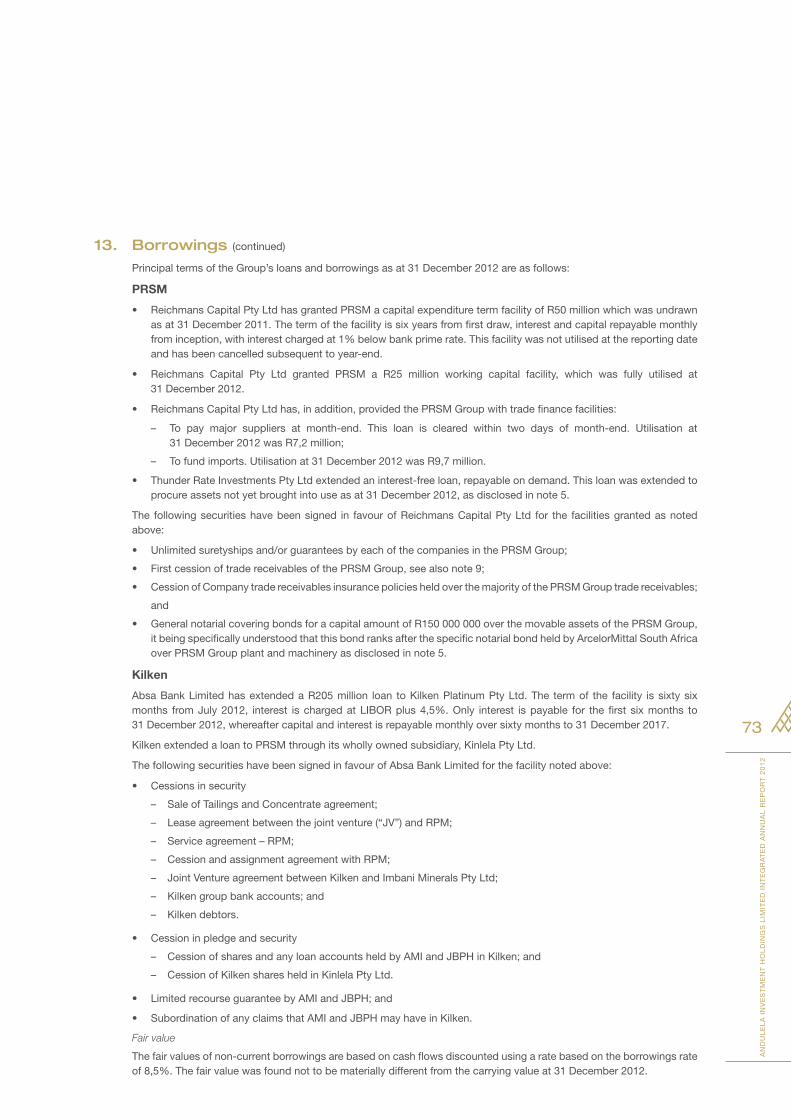
AN
DU
LE
LA
IN
VE
ST
ME
NT
HO
LD
ING
S L
IMIT
ED
IN
TE
GR
AT
ED
AN
NU
AL
RE
PO
RT
20
12
73
13. Borrowings (continued)
Principal terms of the Group’s loans and borrowings as at 31 December 2012 are as follows:
PRSM
• ReichmansCapitalPtyLtdhasgrantedPRSMacapitalexpendituretermfacilityofR50millionwhichwasundrawnas at 31 December 2011. The term of the facility is six years from first draw, interest and capital repayable monthly from inception, with interest charged at 1% below bank prime rate. This facility was not utilised at the reporting date and has been cancelled subsequent to year-end.
• Reichmans Capital Pty Ltd granted PRSM a R25 million working capital facility, which was fully utilised at 31 December 2012.
• ReichmansCapitalPtyLtdhas,inaddition,providedthePRSMGroupwithtradefinancefacilities:
– To pay major suppliers at month-end. This loan is cleared within two days of month-end. Utilisation at 31 December 2012 was R7,2 million;
– To fund imports. Utilisation at 31 December 2012 was R9,7 million.
• ThunderRateInvestmentsPtyLtdextendedaninterest-freeloan,repayableondemand.Thisloanwasextendedtoprocure assets not yet brought into use as at 31 December 2012, as disclosed in note 5.
The following securities have been signed in favour of Reichmans Capital Pty Ltd for the facilities granted as noted above:
• Unlimitedsuretyshipsand/orguaranteesbyeachofthecompaniesinthePRSMGroup;
• FirstcessionoftradereceivablesofthePRSMGroup,seealsonote9;
• CessionofCompanytradereceivablesinsurancepoliciesheldoverthemajorityofthePRSMGrouptradereceivables;
and
• GeneralnotarialcoveringbondsforacapitalamountofR150000000overthemovableassetsofthePRSMGroup,it being specifically understood that this bond ranks after the specific notarial bond held by ArcelorMittal South Africa over PRSM Group plant and machinery as disclosed in note 5.
Kilken
Absa Bank Limited has extended a R205 million loan to Kilken Platinum Pty Ltd. The term of the facility is sixty six months from July 2012, interest is charged at LIBOR plus 4,5%. Only interest is payable for the first six months to 31 December 2012, whereafter capital and interest is repayable monthly over sixty months to 31 December 2017.
Kilken extended a loan to PRSM through its wholly owned subsidiary, Kinlela Pty Ltd.
The following securities have been signed in favour of Absa Bank Limited for the facility noted above:
• Cessionsinsecurity
– Sale of Tailings and Concentrate agreement;
– Lease agreement between the joint venture (“JV”) and RPM;
– Service agreement – RPM;
– Cession and assignment agreement with RPM;
– Joint Venture agreement between Kilken and Imbani Minerals Pty Ltd;
– Kilken group bank accounts; and
– Kilken debtors.
• Cessioninpledgeandsecurity
– Cession of shares and any loan accounts held by AMI and JBPH in Kilken; and
– Cession of Kilken shares held in Kinlela Pty Ltd.
• LimitedrecourseguaranteebyAMIandJBPH;and
• Subordination of any claims that AMI and JBPH may have in Kilken.
Fair value
The fair values of non-current borrowings are based on cash flows discounted using a rate based on the borrowings rate of 8,5%. The fair value was found not to be materially different from the carrying value at 31 December 2012.
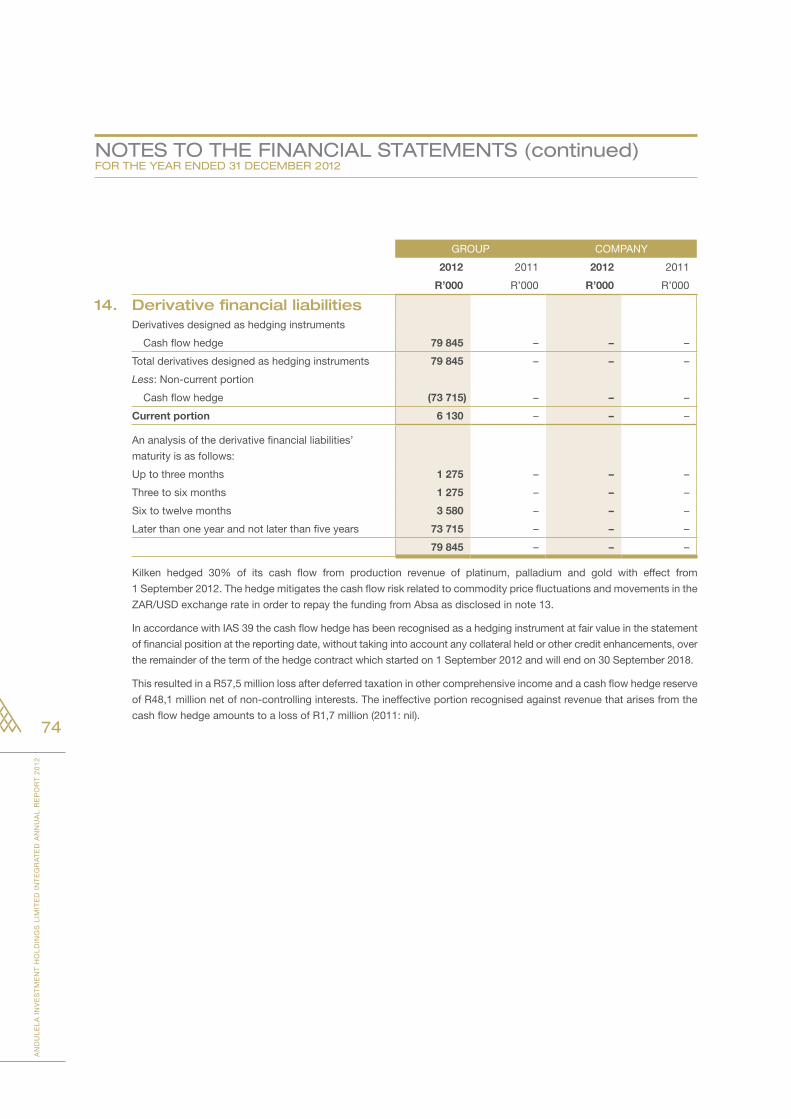
AN
DU
LE
LA
IN
VE
ST
ME
NT
HO
LD
ING
S L
IMIT
ED
IN
TE
GR
AT
ED
AN
NU
AL
RE
PO
RT
20
12
74
NOTes TO The FiNANCiAl sTATemeNTs (continued)FOR The YeAR eNded 31 deCemBeR 2012
GROUP COMPANY
2012 2011 2012 2011
R’000 R’000 R’000 R’000
14. Derivative financial liabilitiesDerivatives designed as hedging instruments
Cash flow hedge 79 845 – – –
Total derivatives designed as hedging instruments 79 845 – – –
Less: Non-current portion
Cash flow hedge (73 715) – – –
Current portion 6 130 – – –
An analysis of the derivative financial liabilities’
maturity is as follows:
Up to three months 1 275 – – –
Three to six months 1 275 – – –
Six to twelve months 3 580 – – –
Later than one year and not later than five years 73 715 – – –
79 845 – – –
Kilken hedged 30% of its cash flow from production revenue of platinum, palladium and gold with effect from
1 September 2012. The hedge mitigates the cash flow risk related to commodity price fluctuations and movements in the
ZAR/USD exchange rate in order to repay the funding from Absa as disclosed in note 13.
In accordance with IAS 39 the cash flow hedge has been recognised as a hedging instrument at fair value in the statement
of financial position at the reporting date, without taking into account any collateral held or other credit enhancements, over
the remainder of the term of the hedge contract which started on 1 September 2012 and will end on 30 September 2018.
This resulted in a R57,5 million loss after deferred taxation in other comprehensive income and a cash flow hedge reserve
of R48,1 million net of non-controlling interests. The ineffective portion recognised against revenue that arises from the
cash flow hedge amounts to a loss of R1,7 million (2011: nil).
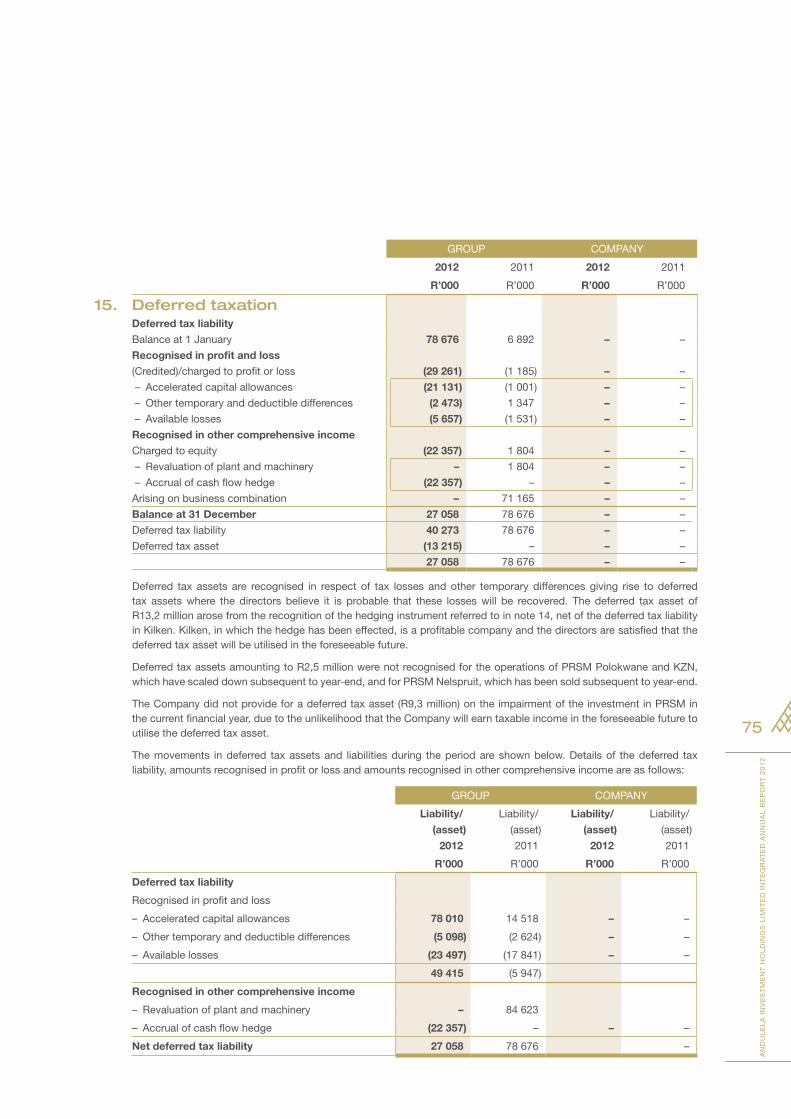
AN
DU
LE
LA
IN
VE
ST
ME
NT
HO
LD
ING
S L
IMIT
ED
IN
TE
GR
AT
ED
AN
NU
AL
RE
PO
RT
20
12
75
GROUP COMPANY
2012 2011 2012 2011
R’000 R’000 R’000 R’000
15. Deferred taxationDeferred tax liability
Balance at 1 January 78 676 6 892 – –
Recognised in profit and loss
(Credited)/charged to profit or loss (29 261) (1 185) – –
– Accelerated capital allowances (21 131) (1 001) – –
– Other temporary and deductible differences (2 473) 1 347 – –
– Available losses (5 657) (1 531) – –
Recognised in other comprehensive income
Charged to equity (22 357) 1 804 – –
– Revaluation of plant and machinery – 1 804 – –
– Accrual of cash flow hedge (22 357) – – –
Arising on business combination – 71 165 – –
Balance at 31 December 27 058 78 676 – –
Deferred tax liability 40 273 78 676 – –
Deferred tax asset (13 215) – – –
27 058 78 676 – –
Deferred tax assets are recognised in respect of tax losses and other temporary differences giving rise to deferred tax assets where the directors believe it is probable that these losses will be recovered. The deferred tax asset of R13,2 million arose from the recognition of the hedging instrument referred to in note 14, net of the deferred tax liability in Kilken. Kilken, in which the hedge has been effected, is a profitable company and the directors are satisfied that the deferred tax asset will be utilised in the foreseeable future.
Deferred tax assets amounting to R2,5 million were not recognised for the operations of PRSM Polokwane and KZN, which have scaled down subsequent to year-end, and for PRSM Nelspruit, which has been sold subsequent to year-end.
The Company did not provide for a deferred tax asset (R9,3 million) on the impairment of the investment in PRSM in the current financial year, due to the unlikelihood that the Company will earn taxable income in the foreseeable future to utilise the deferred tax asset.
The movements in deferred tax assets and liabilities during the period are shown below. Details of the deferred tax liability, amounts recognised in profit or loss and amounts recognised in other comprehensive income are as follows:
GROUP COMPANY
Liability/
(asset)
2012
Liability/
(asset)
2011
Liability/
(asset)
2012
Liability/
(asset)
2011
R’000 R’000 R’000 R’000
Deferred tax liability
Recognised in profit and loss
– Accelerated capital allowances 78 010 14 518 – –
– Other temporary and deductible differences (5 098) (2 624) – –
– Available losses (23 497) (17 841) – –
49 415 (5 947)
Recognised in other comprehensive income
– Revaluation of plant and machinery – 84 623
– Accrual of cash flow hedge (22 357) – – –
Net deferred tax liability 27 058 78 676 –
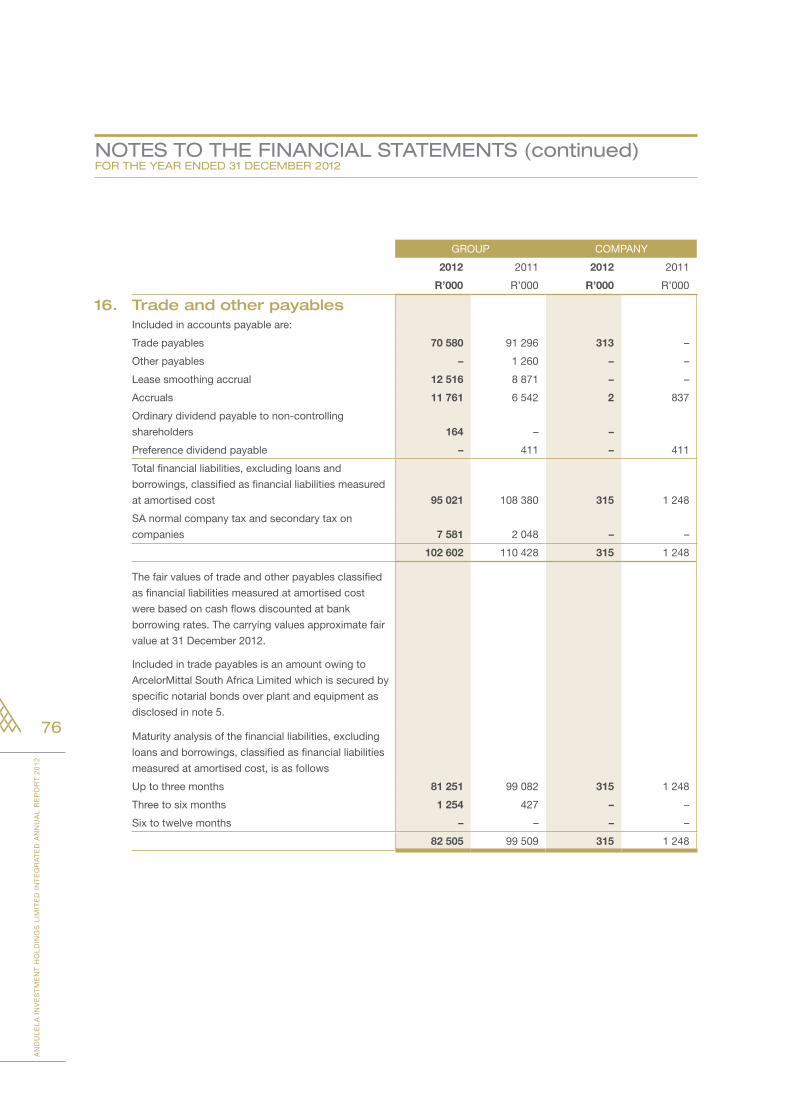
AN
DU
LE
LA
IN
VE
ST
ME
NT
HO
LD
ING
S L
IMIT
ED
IN
TE
GR
AT
ED
AN
NU
AL
RE
PO
RT
20
12
76
NOTes TO The FiNANCiAl sTATemeNTs (continued)FOR The YeAR eNded 31 deCemBeR 2012
GROUP COMPANY
2012 2011 2012 2011
R’000 R’000 R’000 R’000
16. Trade and other payablesIncluded in accounts payable are:
Trade payables 70 580 91 296 313 –
Other payables – 1 260 – –
Lease smoothing accrual 12 516 8 871 – –
Accruals 11 761 6 542 2 837
Ordinary dividend payable to non-controlling
shareholders 164 – –
Preference dividend payable – 411 – 411
Total financial liabilities, excluding loans and
borrowings, classified as financial liabilities measured
at amortised cost 95 021 108 380 315 1 248
SA normal company tax and secondary tax on
companies 7 581 2 048 – –
102 602 110 428 315 1 248
The fair values of trade and other payables classified
as financial liabilities measured at amortised cost
were based on cash flows discounted at bank
borrowing rates. The carrying values approximate fair
value at 31 December 2012.
Included in trade payables is an amount owing to
ArcelorMittal South Africa Limited which is secured by
specific notarial bonds over plant and equipment as
disclosed in note 5.
Maturity analysis of the financial liabilities, excluding
loans and borrowings, classified as financial liabilities
measured at amortised cost, is as follows
Up to three months 81 251 99 082 315 1 248
Three to six months 1 254 427 – –
Six to twelve months – – – –
82 505 99 509 315 1 248
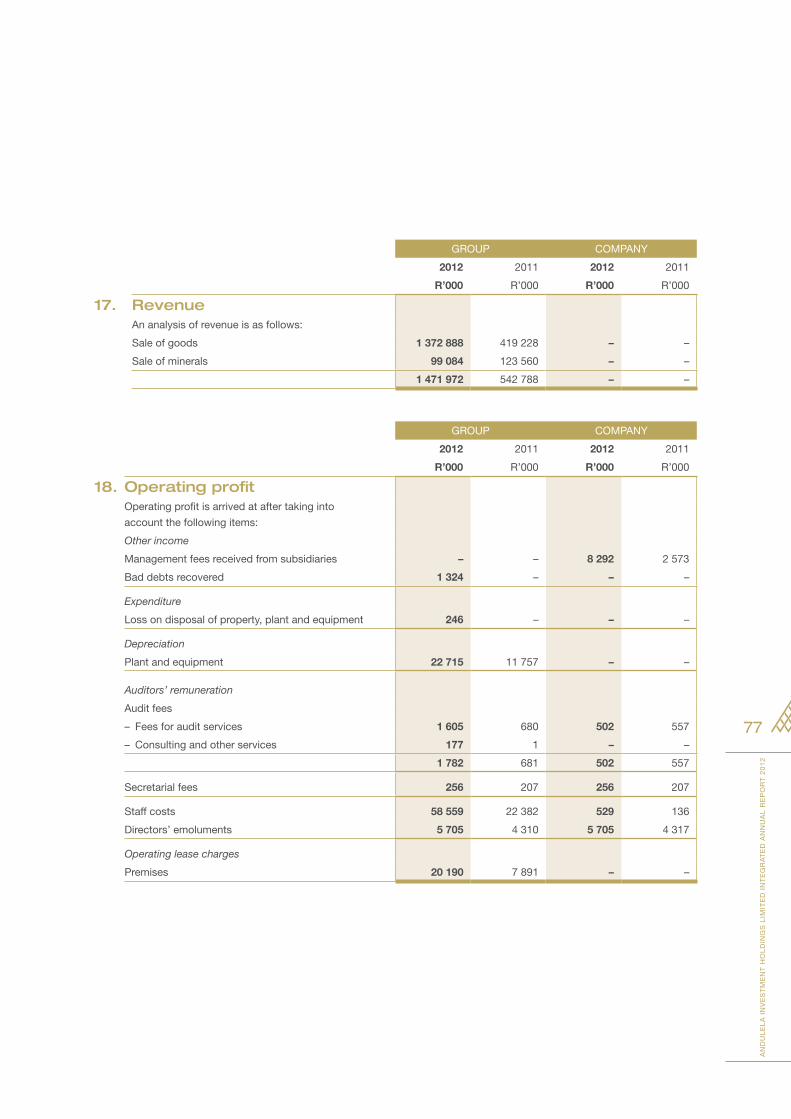
AN
DU
LE
LA
IN
VE
ST
ME
NT
HO
LD
ING
S L
IMIT
ED
IN
TE
GR
AT
ED
AN
NU
AL
RE
PO
RT
20
12
77
GROUP COMPANY
2012 2011 2012 2011
R’000 R’000 R’000 R’000
17. RevenueAn analysis of revenue is as follows:
Sale of goods 1 372 888 419 228 – –
Sale of minerals 99 084 123 560 – –
1 471 972 542 788 – –
GROUP COMPANY
2012 2011 2012 2011
R’000 R’000 R’000 R’000
18. Operating profitOperating profit is arrived at after taking into
account the following items:
Other income
Management fees received from subsidiaries – – 8 292 2 573
Bad debts recovered 1 324 – – –
Expenditure
Loss on disposal of property, plant and equipment 246 – – –
Depreciation
Plant and equipment 22 715 11 757 – –
Auditors’ remuneration
Audit fees
– Fees for audit services 1 605 680 502 557
– Consulting and other services 177 1 – –
1 782 681 502 557
Secretarial fees 256 207 256 207
Staff costs 58 559 22 382 529 136
Directors’ emoluments 5 705 4 310 5 705 4 317
Operating lease charges
Premises 20 190 7 891 – –

AN
DU
LE
LA
IN
VE
ST
ME
NT
HO
LD
ING
S L
IMIT
ED
IN
TE
GR
AT
ED
AN
NU
AL
RE
PO
RT
20
12
78
NOTes TO The FiNANCiAl sTATemeNTs (continued)FOR The YeAR eNded 31 deCemBeR 2012
GROUP COMPANY
2012 2011 2012 2011
R’000 R’000 R’000 R’000
19. Finance incomeInterest income
Interest received 1 317 452 60 18
1 317 452 60 18
All investment income relates to financial instruments
categorised as loans and receivables.
Dividend income – – 32 181 22 211
Dividends received from subsidiaries – – 32 181 22 211
1 317 452 32 241 22 229
GROUP COMPANY
2012 2011 2012 2011
R’000 R’000 R’000 R’000
20. Finance costsInterest paid on other financial liabilities
measured at amortised cost 24 148 5 347 – 18
Preference dividend 3 762 4 388 3 762 4 388
27 910 9 735 3 762 4 406
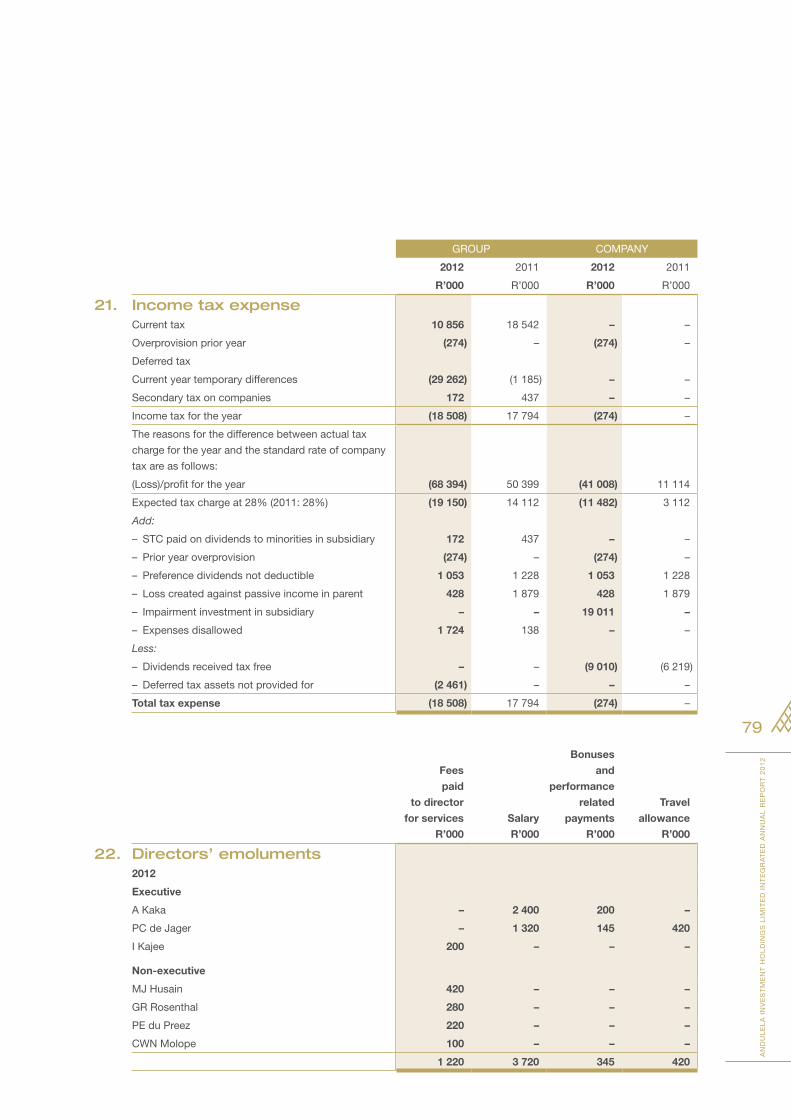
AN
DU
LE
LA
IN
VE
ST
ME
NT
HO
LD
ING
S L
IMIT
ED
IN
TE
GR
AT
ED
AN
NU
AL
RE
PO
RT
20
12
79
GROUP COMPANY
2012 2011 2012 2011
R’000 R’000 R’000 R’000
21. Income tax expenseCurrent tax 10 856 18 542 – –
Overprovision prior year (274) – (274) –
Deferred tax
Current year temporary differences (29 262) (1 185) – –
Secondary tax on companies 172 437 – –
Income tax for the year (18 508) 17 794 (274) –
The reasons for the difference between actual tax
charge for the year and the standard rate of company
tax are as follows:
(Loss)/profit for the year (68 394) 50 399 (41 008) 11 114
Expected tax charge at 28% (2011: 28%) (19 150) 14 112 (11 482) 3 112
Add:
– STC paid on dividends to minorities in subsidiary 172 437 – –
– Prior year overprovision (274) – (274) –
– Preference dividends not deductible 1 053 1 228 1 053 1 228
– Loss created against passive income in parent 428 1 879 428 1 879
– Impairment investment in subsidiary – – 19 011 –
– Expenses disallowed 1 724 138 – –
Less:
– Dividends received tax free – – (9 010) (6 219)
– Deferred tax assets not provided for (2 461) – – –
Total tax expense (18 508) 17 794 (274) –
Fees
paid
to director
for services
R’000
Salary
R’000
Bonuses
and
performance
related
payments
R’000
Travel
allowance
R’000
22. Directors’ emoluments2012
Executive
A Kaka – 2 400 200 –
PC de Jager – 1 320 145 420
I Kajee 200 – – –
Non-executive
MJ Husain 420 – – –
GR Rosenthal 280 – – –
PE du Preez 220 – – –
CWN Molope 100 – – –
1 220 3 720 345 420
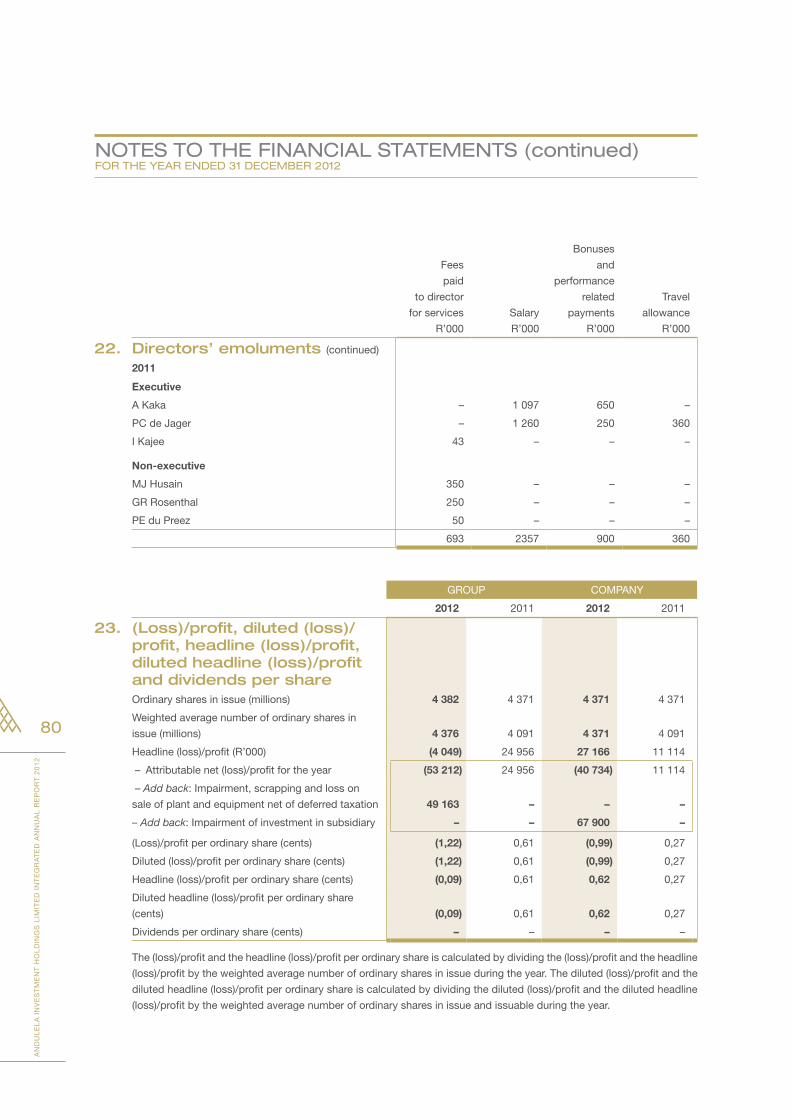
AN
DU
LE
LA
IN
VE
ST
ME
NT
HO
LD
ING
S L
IMIT
ED
IN
TE
GR
AT
ED
AN
NU
AL
RE
PO
RT
20
12
80
NOTes TO The FiNANCiAl sTATemeNTs (continued)FOR The YeAR eNded 31 deCemBeR 2012
Fees
paid
to director
for services
R’000
Salary
R’000
Bonuses
and
performance
related
payments
R’000
Travel
allowance
R’000
22. Directors’ emoluments (continued)
2011
Executive
A Kaka – 1 097 650 –
PC de Jager – 1 260 250 360
I Kajee 43 – – –
Non-executive
MJ Husain 350 – – –
GR Rosenthal 250 – – –
PE du Preez 50 – – –
693 2357 900 360
GROUP COMPANY
2012 2011 2012 2011
23. (Loss)/profit, diluted (loss)/profit, headline (loss)/profit, diluted headline (loss)/profit and dividends per shareOrdinary shares in issue (millions) 4 382 4 371 4 371 4 371
Weighted average number of ordinary shares in
issue (millions) 4 376 4 091 4 371 4 091
Headline (loss)/profit (R’000) (4 049) 24 956 27 166 11 114
– Attributable net (loss)/profit for the year (53 212) 24 956 (40 734) 11 114
– Add back: Impairment, scrapping and loss on
sale of plant and equipment net of deferred taxation 49 163 – – –
– Add back: Impairment of investment in subsidiary – – 67 900 –
(Loss)/profit per ordinary share (cents) (1,22) 0,61 (0,99) 0,27
Diluted (loss)/profit per ordinary share (cents) (1,22) 0,61 (0,99) 0,27
Headline (loss)/profit per ordinary share (cents) (0,09) 0,61 0,62 0,27
Diluted headline (loss)/profit per ordinary share
(cents) (0,09) 0,61 0,62 0,27
Dividends per ordinary share (cents) – – – –
The (loss)/profit and the headline (loss)/profit per ordinary share is calculated by dividing the (loss)/profit and the headline
(loss)/profit by the weighted average number of ordinary shares in issue during the year. The diluted (loss)/profit and the
diluted headline (loss)/profit per ordinary share is calculated by dividing the diluted (loss)/profit and the diluted headline
(loss)/profit by the weighted average number of ordinary shares in issue and issuable during the year.
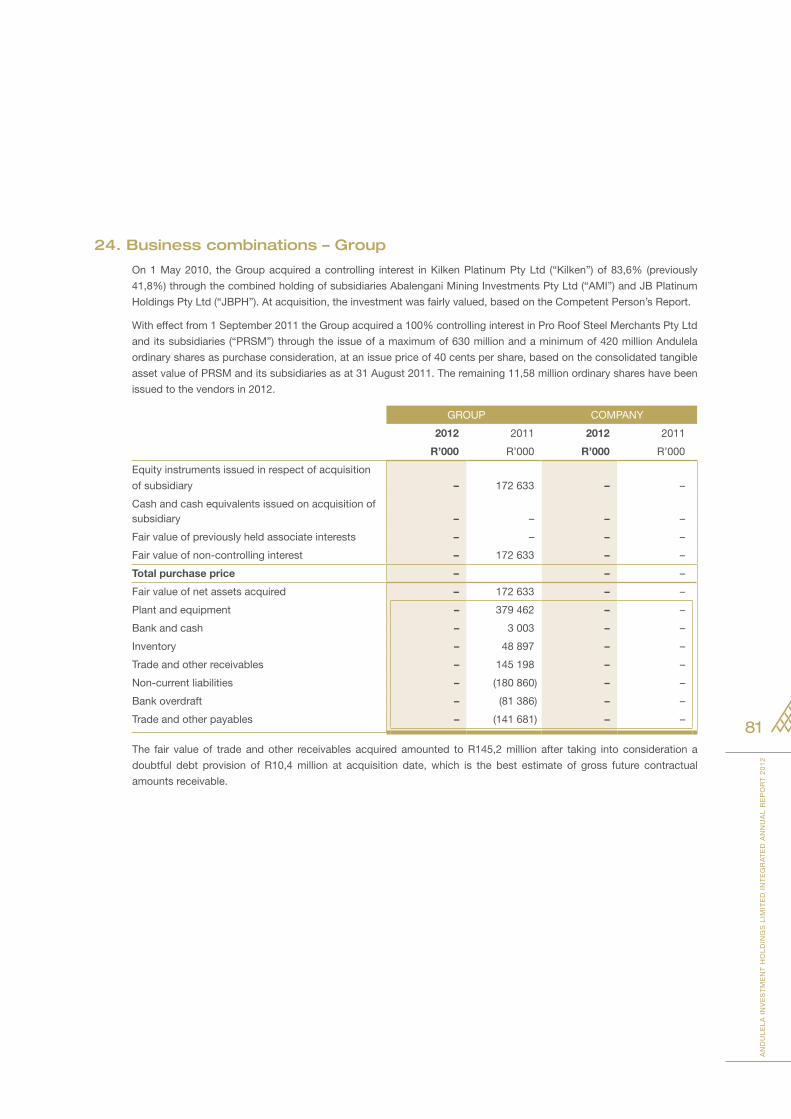
AN
DU
LE
LA
IN
VE
ST
ME
NT
HO
LD
ING
S L
IMIT
ED
IN
TE
GR
AT
ED
AN
NU
AL
RE
PO
RT
20
12
81
24. Business combinations – Group
On 1 May 2010, the Group acquired a controlling interest in Kilken Platinum Pty Ltd (“Kilken”) of 83,6% (previously
41,8%) through the combined holding of subsidiaries Abalengani Mining Investments Pty Ltd (“AMI”) and JB Platinum
Holdings Pty Ltd (“JBPH”). At acquisition, the investment was fairly valued, based on the Competent Person’s Report.
With effect from 1 September 2011 the Group acquired a 100% controlling interest in Pro Roof Steel Merchants Pty Ltd
and its subsidiaries (“PRSM”) through the issue of a maximum of 630 million and a minimum of 420 million Andulela
ordinary shares as purchase consideration, at an issue price of 40 cents per share, based on the consolidated tangible
asset value of PRSM and its subsidiaries as at 31 August 2011. The remaining 11,58 million ordinary shares have been
issued to the vendors in 2012.
GROUP COMPANY
2012 2011 2012 2011
R’000 R’000 R’000 R’000
Equity instruments issued in respect of acquisition
of subsidiary – 172 633 – –
Cash and cash equivalents issued on acquisition ofsubsidiary – – – –
Fair value of previously held associate interests – – – –
Fair value of non-controlling interest – 172 633 – –
Total purchase price – – –
Fair value of net assets acquired – 172 633 – –
Plant and equipment – 379 462 – –
Bank and cash – 3 003 – –
Inventory – 48 897 – –
Trade and other receivables – 145 198 – –
Non-current liabilities – (180 860) – –
Bank overdraft – (81 386) – –
Trade and other payables – (141 681) – –
The fair value of trade and other receivables acquired amounted to R145,2 million after taking into consideration a
doubtful debt provision of R10,4 million at acquisition date, which is the best estimate of gross future contractual
amounts receivable.
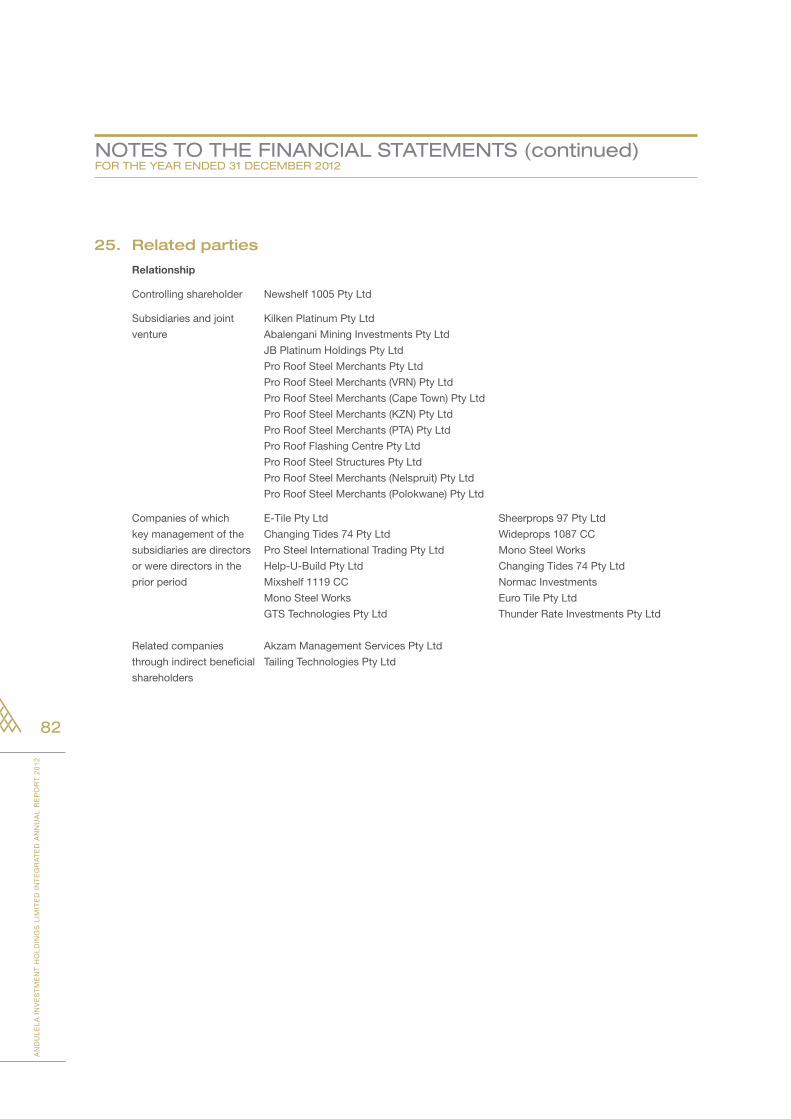
AN
DU
LE
LA
IN
VE
ST
ME
NT
HO
LD
ING
S L
IMIT
ED
IN
TE
GR
AT
ED
AN
NU
AL
RE
PO
RT
20
12
82
NOTes TO The FiNANCiAl sTATemeNTs (continued)FOR The YeAR eNded 31 deCemBeR 2012
25. Related parties
Relationship
Controlling shareholder Newshelf 1005 Pty Ltd
Subsidiaries and joint
venture
Kilken Platinum Pty Ltd
Abalengani Mining Investments Pty Ltd
JB Platinum Holdings Pty Ltd
Pro Roof Steel Merchants Pty Ltd
Pro Roof Steel Merchants (VRN) Pty Ltd
Pro Roof Steel Merchants (Cape Town) Pty Ltd
Pro Roof Steel Merchants (KZN) Pty Ltd
Pro Roof Steel Merchants (PTA) Pty Ltd
Pro Roof Flashing Centre Pty Ltd
Pro Roof Steel Structures Pty Ltd
Pro Roof Steel Merchants (Nelspruit) Pty Ltd
Pro Roof Steel Merchants (Polokwane) Pty Ltd
Companies of which
key management of the
subsidiaries are directors
or were directors in the
prior period
E-Tile Pty Ltd
Changing Tides 74 Pty Ltd
Pro Steel International Trading Pty Ltd
Help-U-Build Pty Ltd
Mixshelf 1119 CC
Mono Steel Works
GTS Technologies Pty Ltd
Sheerprops 97 Pty Ltd
Wideprops 1087 CC
Mono Steel Works
Changing Tides 74 Pty Ltd
Normac Investments
Euro Tile Pty Ltd
Thunder Rate Investments Pty Ltd
Related companies
through indirect beneficial
shareholders
Akzam Management Services Pty Ltd
Tailing Technologies Pty Ltd
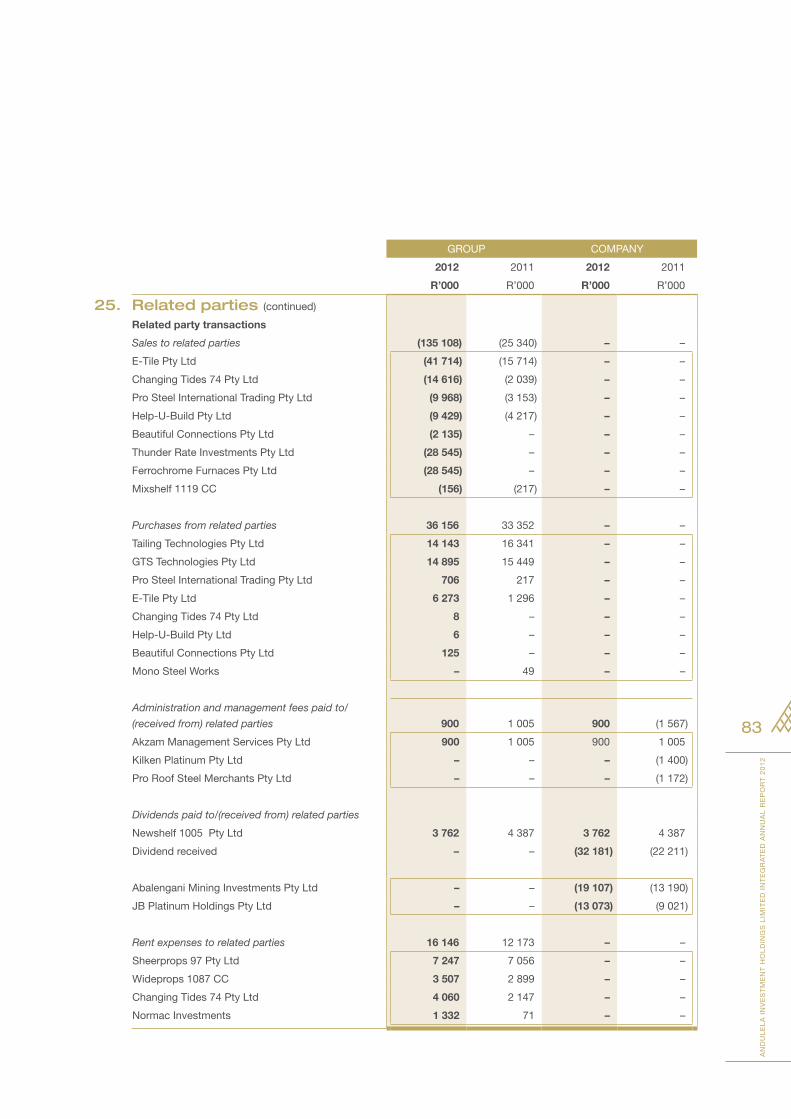
AN
DU
LE
LA
IN
VE
ST
ME
NT
HO
LD
ING
S L
IMIT
ED
IN
TE
GR
AT
ED
AN
NU
AL
RE
PO
RT
20
12
83
GROUP COMPANY
2012 2011 2012 2011
R’000 R’000 R’000 R’000
25. Related parties (continued)
Related party transactions
Sales to related parties (135 108) (25 340) – –
E-Tile Pty Ltd (41 714) (15 714) – –
Changing Tides 74 Pty Ltd (14 616) (2 039) – –
Pro Steel International Trading Pty Ltd (9 968) (3 153) – –
Help-U-Build Pty Ltd (9 429) (4 217) – –
Beautiful Connections Pty Ltd (2 135) – – –
Thunder Rate Investments Pty Ltd (28 545) – – –
Ferrochrome Furnaces Pty Ltd (28 545) – – –
Mixshelf 1119 CC (156) (217) – –
Purchases from related parties 36 156 33 352 – –
Tailing Technologies Pty Ltd 14 143 16 341 – –
GTS Technologies Pty Ltd 14 895 15 449 – –
Pro Steel International Trading Pty Ltd 706 217 – –
E-Tile Pty Ltd 6 273 1 296 – –
Changing Tides 74 Pty Ltd 8 – – –
Help-U-Build Pty Ltd 6 – – –
Beautiful Connections Pty Ltd 125 – – –
Mono Steel Works – 49 – –
Administration and management fees paid to/
(received from) related parties 900 1 005 900 (1 567)
Akzam Management Services Pty Ltd 900 1 005 900 1 005
Kilken Platinum Pty Ltd – – – (1 400)
Pro Roof Steel Merchants Pty Ltd – – – (1 172)
Dividends paid to/(received from) related parties
Newshelf 1005 Pty Ltd 3 762 4 387 3 762 4 387
Dividend received – – (32 181) (22 211)
Abalengani Mining Investments Pty Ltd – – (19 107) (13 190)
JB Platinum Holdings Pty Ltd – – (13 073) (9 021)
Rent expenses to related parties 16 146 12 173 – –
Sheerprops 97 Pty Ltd 7 247 7 056 – –
Wideprops 1087 CC 3 507 2 899 – –
Changing Tides 74 Pty Ltd 4 060 2 147 – –
Normac Investments 1 332 71 – –
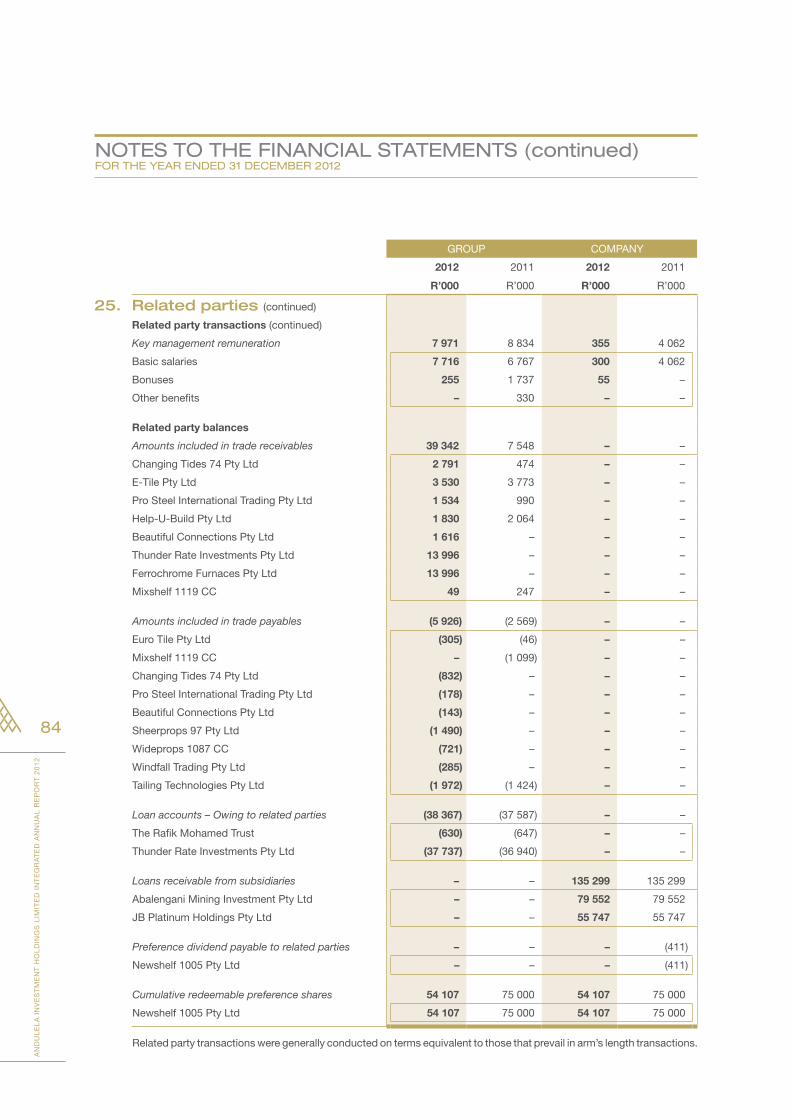
AN
DU
LE
LA
IN
VE
ST
ME
NT
HO
LD
ING
S L
IMIT
ED
IN
TE
GR
AT
ED
AN
NU
AL
RE
PO
RT
20
12
84
NOTes TO The FiNANCiAl sTATemeNTs (continued)FOR The YeAR eNded 31 deCemBeR 2012
GROUP COMPANY
2012 2011 2012 2011
R’000 R’000 R’000 R’000
25. Related parties (continued)
Related party transactions (continued)
Key management remuneration 7 971 8 834 355 4 062
Basic salaries 7 716 6 767 300 4 062
Bonuses 255 1 737 55 –
Other benefits – 330 – –
Related party balances
Amounts included in trade receivables 39 342 7 548 – –
Changing Tides 74 Pty Ltd 2 791 474 – –
E-Tile Pty Ltd 3 530 3 773 – –
Pro Steel International Trading Pty Ltd 1 534 990 – –
Help-U-Build Pty Ltd 1 830 2 064 – –
Beautiful Connections Pty Ltd 1 616 – – –
Thunder Rate Investments Pty Ltd 13 996 – – –
Ferrochrome Furnaces Pty Ltd 13 996 – – –
Mixshelf 1119 CC 49 247 – –
Amounts included in trade payables (5 926) (2 569) – –
Euro Tile Pty Ltd (305) (46) – –
Mixshelf 1119 CC – (1 099) – –
Changing Tides 74 Pty Ltd (832) – – –
Pro Steel International Trading Pty Ltd (178) – – –
Beautiful Connections Pty Ltd (143) – – –
Sheerprops 97 Pty Ltd (1 490) – – –
Wideprops 1087 CC (721) – – –
Windfall Trading Pty Ltd (285) – – –
Tailing Technologies Pty Ltd (1 972) (1 424) – –
Loan accounts – Owing to related parties (38 367) (37 587) – –
The Rafik Mohamed Trust (630) (647) – –
Thunder Rate Investments Pty Ltd (37 737) (36 940) – –
Loans receivable from subsidiaries – – 135 299 135 299
Abalengani Mining Investment Pty Ltd – – 79 552 79 552
JB Platinum Holdings Pty Ltd – – 55 747 55 747
Preference dividend payable to related parties – – – (411)
Newshelf 1005 Pty Ltd – – – (411)
Cumulative redeemable preference shares 54 107 75 000 54 107 75 000
Newshelf 1005 Pty Ltd 54 107 75 000 54 107 75 000
Related party transactions were generally conducted on terms equivalent to those that prevail in arm’s length transactions.
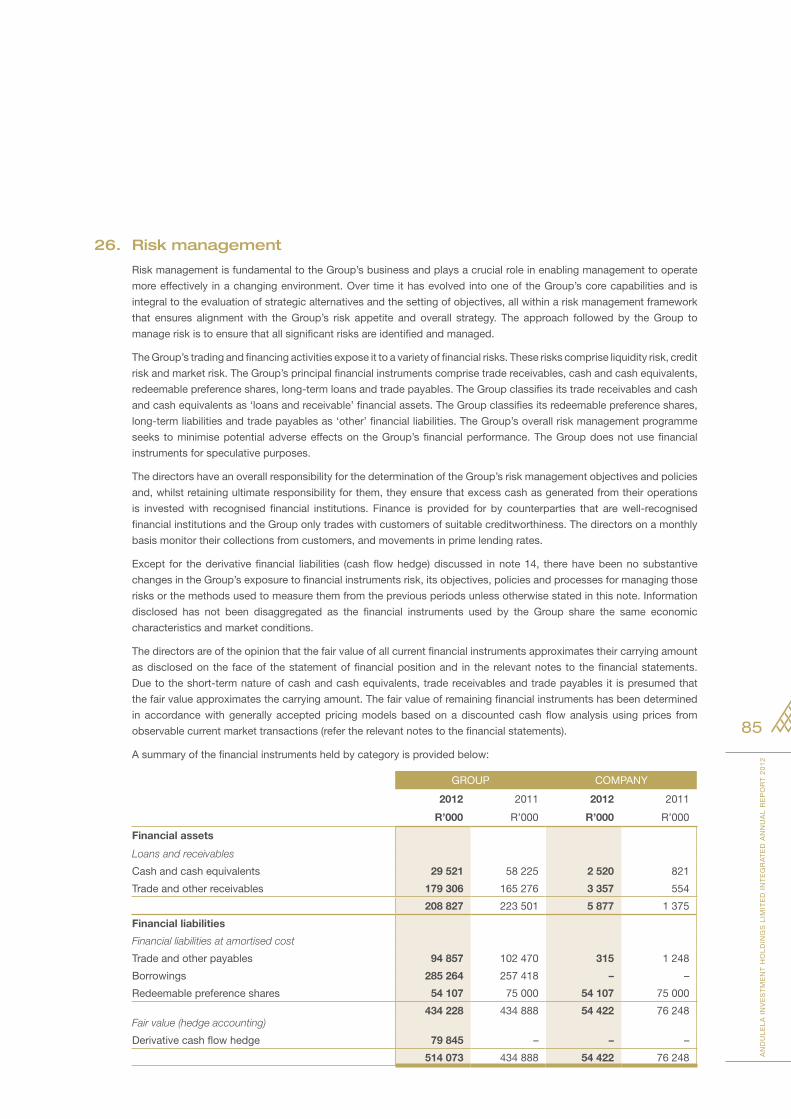
AN
DU
LE
LA
IN
VE
ST
ME
NT
HO
LD
ING
S L
IMIT
ED
IN
TE
GR
AT
ED
AN
NU
AL
RE
PO
RT
20
12
85
26. Risk management
Risk management is fundamental to the Group’s business and plays a crucial role in enabling management to operate
more effectively in a changing environment. Over time it has evolved into one of the Group’s core capabilities and is
integral to the evaluation of strategic alternatives and the setting of objectives, all within a risk management framework
that ensures alignment with the Group’s risk appetite and overall strategy. The approach followed by the Group to
manage risk is to ensure that all significant risks are identified and managed.
The Group’s trading and financing activities expose it to a variety of financial risks. These risks comprise liquidity risk, credit
risk and market risk. The Group’s principal financial instruments comprise trade receivables, cash and cash equivalents,
redeemable preference shares, long-term loans and trade payables. The Group classifies its trade receivables and cash
and cash equivalents as ‘loans and receivable’ financial assets. The Group classifies its redeemable preference shares,
long-term liabilities and trade payables as ‘other’ financial liabilities. The Group’s overall risk management programme
seeks to minimise potential adverse effects on the Group’s financial performance. The Group does not use financial
instruments for speculative purposes.
The directors have an overall responsibility for the determination of the Group’s risk management objectives and policies
and, whilst retaining ultimate responsibility for them, they ensure that excess cash as generated from their operations
is invested with recognised financial institutions. Finance is provided for by counterparties that are well-recognised
financial institutions and the Group only trades with customers of suitable creditworthiness. The directors on a monthly
basis monitor their collections from customers, and movements in prime lending rates.
Except for the derivative financial liabilities (cash flow hedge) discussed in note 14, there have been no substantive
changes in the Group’s exposure to financial instruments risk, its objectives, policies and processes for managing those
risks or the methods used to measure them from the previous periods unless otherwise stated in this note. Information
disclosed has not been disaggregated as the financial instruments used by the Group share the same economic
characteristics and market conditions.
The directors are of the opinion that the fair value of all current financial instruments approximates their carrying amount
as disclosed on the face of the statement of financial position and in the relevant notes to the financial statements.
Due to the short-term nature of cash and cash equivalents, trade receivables and trade payables it is presumed that
the fair value approximates the carrying amount. The fair value of remaining financial instruments has been determined
in accordance with generally accepted pricing models based on a discounted cash flow analysis using prices from
observable current market transactions (refer the relevant notes to the financial statements).
A summary of the financial instruments held by category is provided below:
GROUP COMPANY
2012 2011 2012 2011
R’000 R’000 R’000 R’000
Financial assets
Loans and receivables
Cash and cash equivalents 29 521 58 225 2 520 821
Trade and other receivables 179 306 165 276 3 357 554
208 827 223 501 5 877 1 375
Financial liabilities
Financial liabilities at amortised cost
Trade and other payables 94 857 102 470 315 1 248
Borrowings 285 264 257 418 – –
Redeemable preference shares 54 107 75 000 54 107 75 000
434 228 434 888 54 422 76 248Fair value (hedge accounting)
Derivative cash flow hedge 79 845 – – –
514 073 434 888 54 422 76 248
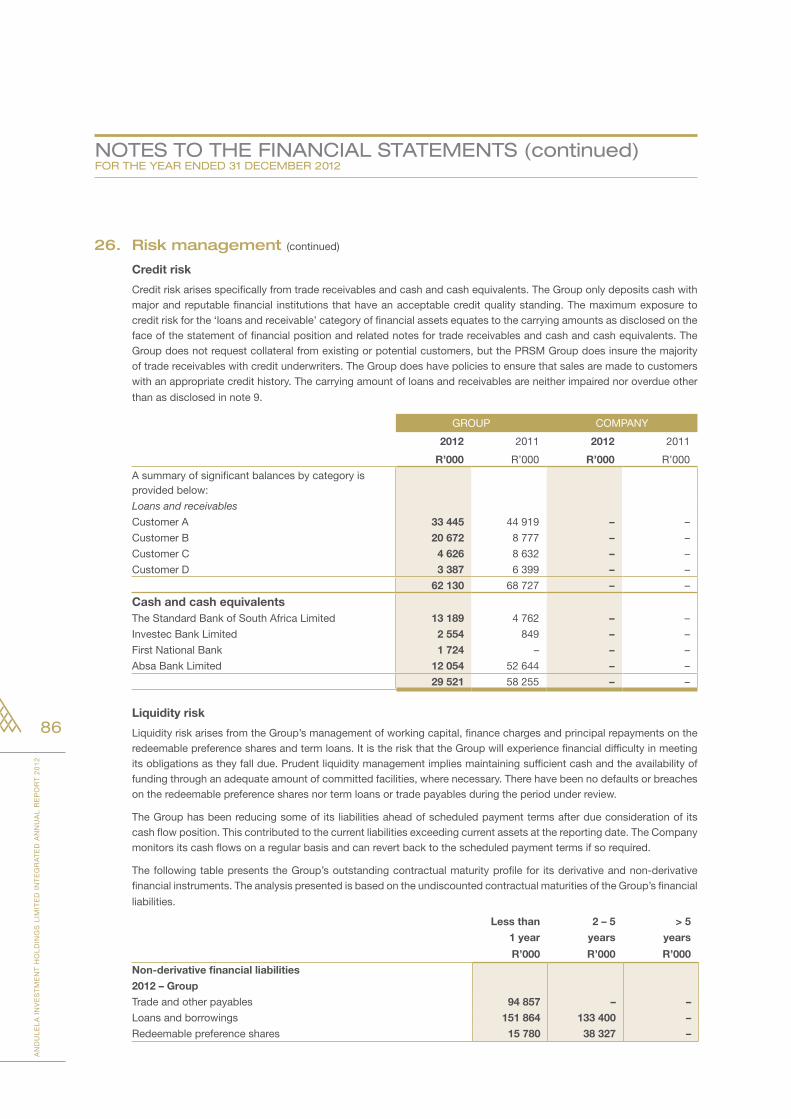
AN
DU
LE
LA
IN
VE
ST
ME
NT
HO
LD
ING
S L
IMIT
ED
IN
TE
GR
AT
ED
AN
NU
AL
RE
PO
RT
20
12
86
NOTes TO The FiNANCiAl sTATemeNTs (continued)FOR The YeAR eNded 31 deCemBeR 2012
26. Risk management (continued)
Credit risk
Credit risk arises specifically from trade receivables and cash and cash equivalents. The Group only deposits cash with major and reputable financial institutions that have an acceptable credit quality standing. The maximum exposure to credit risk for the ‘loans and receivable’ category of financial assets equates to the carrying amounts as disclosed on the face of the statement of financial position and related notes for trade receivables and cash and cash equivalents. The Group does not request collateral from existing or potential customers, but the PRSM Group does insure the majority of trade receivables with credit underwriters. The Group does have policies to ensure that sales are made to customers with an appropriate credit history. The carrying amount of loans and receivables are neither impaired nor overdue other
than as disclosed in note 9.
GROUP COMPANY
2012 2011 2012 2011
R’000 R’000 R’000 R’000
A summary of significant balances by category is provided below:
Loans and receivables
Customer A 33 445 44 919 – –
Customer B 20 672 8 777 – –
Customer C 4 626 8 632 – –
Customer D 3 387 6 399 – –
62 130 68 727 – –
Cash and cash equivalentsThe Standard Bank of South Africa Limited 13 189 4 762 – –
Investec Bank Limited 2 554 849 – –
First National Bank 1 724 – – –
Absa Bank Limited 12 054 52 644 – –
29 521 58 255 – –
Liquidity risk
Liquidity risk arises from the Group’s management of working capital, finance charges and principal repayments on the redeemable preference shares and term loans. It is the risk that the Group will experience financial difficulty in meeting its obligations as they fall due. Prudent liquidity management implies maintaining sufficient cash and the availability of funding through an adequate amount of committed facilities, where necessary. There have been no defaults or breaches on the redeemable preference shares nor term loans or trade payables during the period under review.
The Group has been reducing some of its liabilities ahead of scheduled payment terms after due consideration of its cash flow position. This contributed to the current liabilities exceeding current assets at the reporting date. The Company monitors its cash flows on a regular basis and can revert back to the scheduled payment terms if so required.
The following table presents the Group’s outstanding contractual maturity profile for its derivative and non-derivative financial instruments. The analysis presented is based on the undiscounted contractual maturities of the Group’s financial
liabilities.
Less than
1 year
2 – 5
years
> 5
years
R’000 R’000 R’000
Non-derivative financial liabilities
2012 – Group
Trade and other payables 94 857 – –
Loans and borrowings 151 864 133 400 –
Redeemable preference shares 15 780 38 327 –
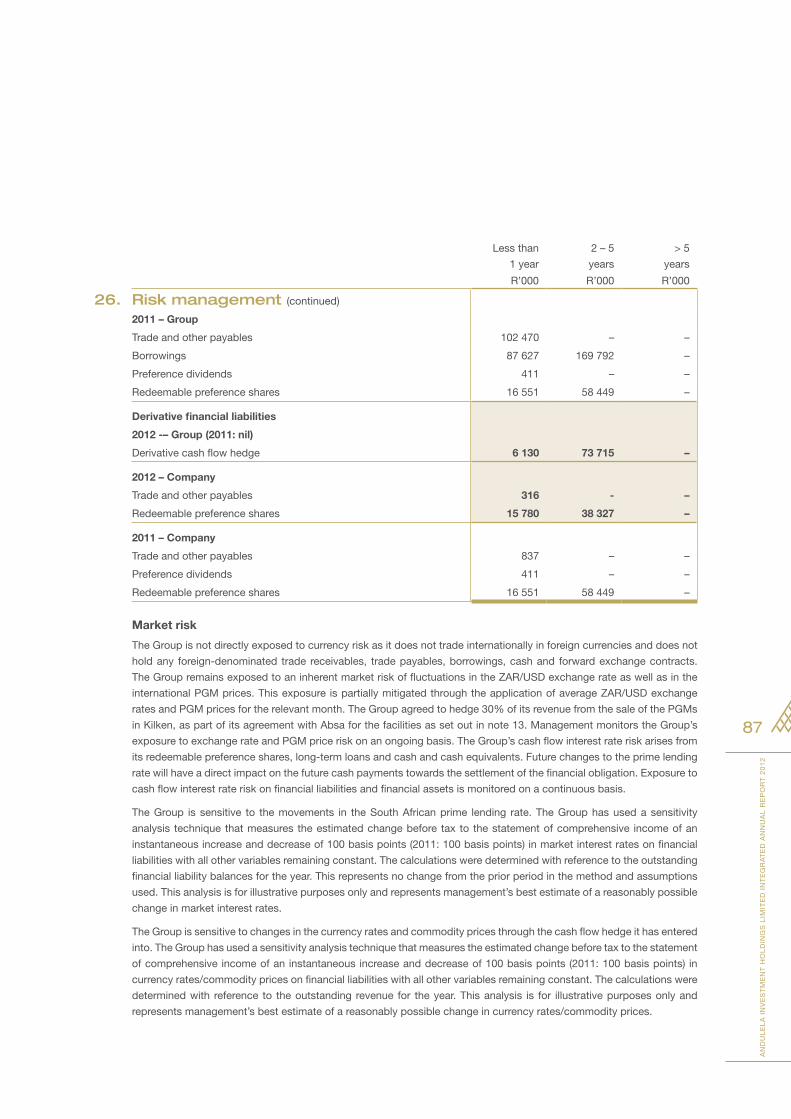
AN
DU
LE
LA
IN
VE
ST
ME
NT
HO
LD
ING
S L
IMIT
ED
IN
TE
GR
AT
ED
AN
NU
AL
RE
PO
RT
20
12
87
Less than
1 year
2 – 5
years
> 5
years
R’000 R’000 R’000
26. Risk management (continued)
2011 – Group
Trade and other payables 102 470 – –
Borrowings 87 627 169 792 –
Preference dividends 411 – –
Redeemable preference shares 16 551 58 449 –
Derivative financial liabilities
2012 -– Group (2011: nil)
Derivative cash flow hedge 6 130 73 715 –
2012 – Company
Trade and other payables 316 - –
Redeemable preference shares 15 780 38 327 –
2011 – Company
Trade and other payables 837 – –
Preference dividends 411 – –
Redeemable preference shares 16 551 58 449 –
Market risk
The Group is not directly exposed to currency risk as it does not trade internationally in foreign currencies and does not
hold any foreign-denominated trade receivables, trade payables, borrowings, cash and forward exchange contracts.
The Group remains exposed to an inherent market risk of fluctuations in the ZAR/USD exchange rate as well as in the
international PGM prices. This exposure is partially mitigated through the application of average ZAR/USD exchange
rates and PGM prices for the relevant month. The Group agreed to hedge 30% of its revenue from the sale of the PGMs
in Kilken, as part of its agreement with Absa for the facilities as set out in note 13. Management monitors the Group’s
exposure to exchange rate and PGM price risk on an ongoing basis. The Group’s cash flow interest rate risk arises from
its redeemable preference shares, long-term loans and cash and cash equivalents. Future changes to the prime lending
rate will have a direct impact on the future cash payments towards the settlement of the financial obligation. Exposure to
cash flow interest rate risk on financial liabilities and financial assets is monitored on a continuous basis.
The Group is sensitive to the movements in the South African prime lending rate. The Group has used a sensitivity
analysis technique that measures the estimated change before tax to the statement of comprehensive income of an
instantaneous increase and decrease of 100 basis points (2011: 100 basis points) in market interest rates on financial
liabilities with all other variables remaining constant. The calculations were determined with reference to the outstanding
financial liability balances for the year. This represents no change from the prior period in the method and assumptions
used. This analysis is for illustrative purposes only and represents management’s best estimate of a reasonably possible
change in market interest rates.
The Group is sensitive to changes in the currency rates and commodity prices through the cash flow hedge it has entered
into. The Group has used a sensitivity analysis technique that measures the estimated change before tax to the statement
of comprehensive income of an instantaneous increase and decrease of 100 basis points (2011: 100 basis points) in
currency rates/commodity prices on financial liabilities with all other variables remaining constant. The calculations were
determined with reference to the outstanding revenue for the year. This analysis is for illustrative purposes only and
represents management’s best estimate of a reasonably possible change in currency rates/commodity prices.
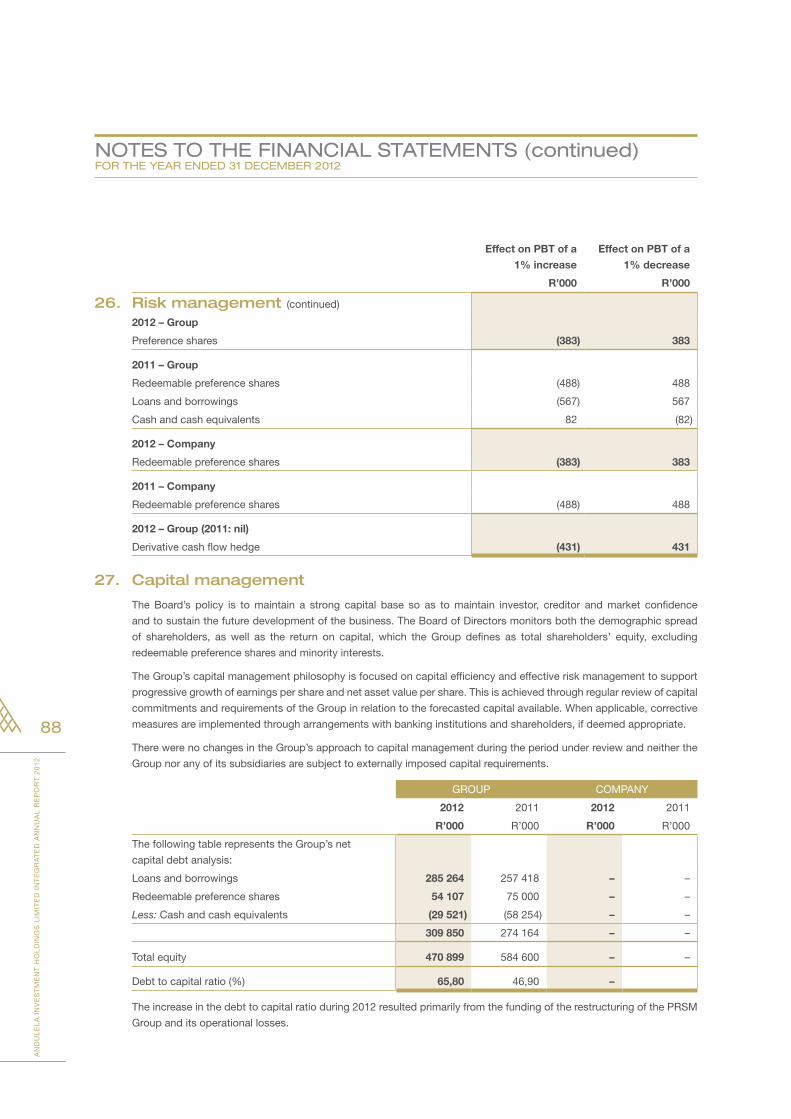
AN
DU
LE
LA
IN
VE
ST
ME
NT
HO
LD
ING
S L
IMIT
ED
IN
TE
GR
AT
ED
AN
NU
AL
RE
PO
RT
20
12
88
NOTes TO The FiNANCiAl sTATemeNTs (continued)FOR The YeAR eNded 31 deCemBeR 2012
Effect on PBT of a
1% increase
Effect on PBT of a
1% decrease
R’000 R’000
26. Risk management (continued)
2012 – Group
Preference shares (383) 383
2011 – Group
Redeemable preference shares (488) 488
Loans and borrowings (567) 567
Cash and cash equivalents 82 (82)
2012 – Company
Redeemable preference shares (383) 383
2011 – Company
Redeemable preference shares (488) 488
2012 – Group (2011: nil)
Derivative cash flow hedge (431) 431
27. Capital management
The Board’s policy is to maintain a strong capital base so as to maintain investor, creditor and market confidence
and to sustain the future development of the business. The Board of Directors monitors both the demographic spread
of shareholders, as well as the return on capital, which the Group defines as total shareholders’ equity, excluding
redeemable preference shares and minority interests.
The Group’s capital management philosophy is focused on capital efficiency and effective risk management to support
progressive growth of earnings per share and net asset value per share. This is achieved through regular review of capital
commitments and requirements of the Group in relation to the forecasted capital available. When applicable, corrective
measures are implemented through arrangements with banking institutions and shareholders, if deemed appropriate.
There were no changes in the Group’s approach to capital management during the period under review and neither the
Group nor any of its subsidiaries are subject to externally imposed capital requirements.
GROUP COMPANY
2012 2011 2012 2011
R’000 R’000 R’000 R’000
The following table represents the Group’s net
capital debt analysis:
Loans and borrowings 285 264 257 418 – –
Redeemable preference shares 54 107 75 000 – –
Less: Cash and cash equivalents (29 521) (58 254) – –
309 850 274 164 – –
Total equity 470 899 584 600 – –
Debt to capital ratio (%) 65,80 46,90 –
The increase in the debt to capital ratio during 2012 resulted primarily from the funding of the restructuring of the PRSM
Group and its operational losses.
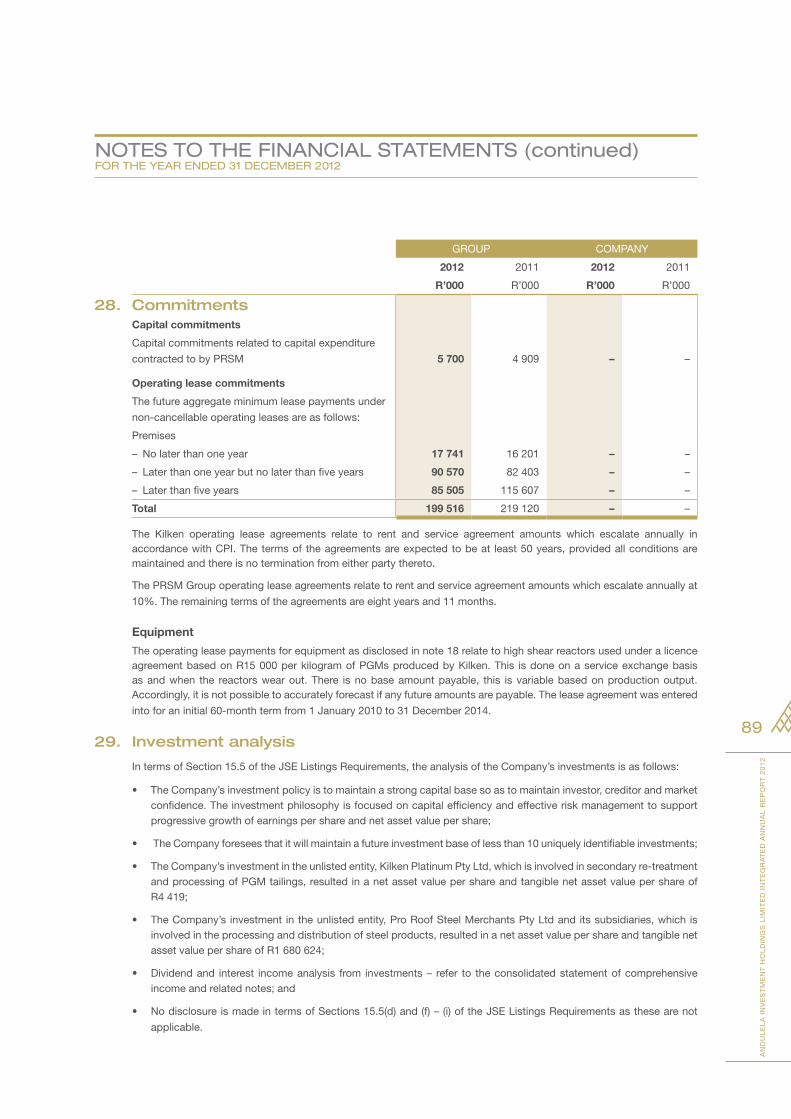
AN
DU
LE
LA
IN
VE
ST
ME
NT
HO
LD
ING
S L
IMIT
ED
IN
TE
GR
AT
ED
AN
NU
AL
RE
PO
RT
20
12
89
NOTes TO The FiNANCiAl sTATemeNTs (continued)FOR The YeAR eNded 31 deCemBeR 2012
GROUP COMPANY
2012 2011 2012 2011
R’000 R’000 R’000 R’000
28. CommitmentsCapital commitments
Capital commitments related to capital expenditure
contracted to by PRSM 5 700 4 909 – –
Operating lease commitments
The future aggregate minimum lease payments under
non-cancellable operating leases are as follows:
Premises
– No later than one year 17 741 16 201 – –
– Later than one year but no later than five years 90 570 82 403 – –
– Later than five years 85 505 115 607 – –
Total 199 516 219 120 – –
The Kilken operating lease agreements relate to rent and service agreement amounts which escalate annually in accordance with CPI. The terms of the agreements are expected to be at least 50 years, provided all conditions are maintained and there is no termination from either party thereto.
The PRSM Group operating lease agreements relate to rent and service agreement amounts which escalate annually at
10%. The remaining terms of the agreements are eight years and 11 months.
Equipment
The operating lease payments for equipment as disclosed in note 18 relate to high shear reactors used under a licence agreement based on R15 000 per kilogram of PGMs produced by Kilken. This is done on a service exchange basis as and when the reactors wear out. There is no base amount payable, this is variable based on production output. Accordingly, it is not possible to accurately forecast if any future amounts are payable. The lease agreement was entered
into for an initial 60-month term from 1 January 2010 to 31 December 2014.
29. Investment analysis
In terms of Section 15.5 of the JSE Listings Requirements, the analysis of the Company’s investments is as follows:
• TheCompany’sinvestmentpolicyistomaintainastrongcapitalbasesoastomaintaininvestor,creditorandmarketconfidence. The investment philosophy is focused on capital efficiency and effective risk management to support progressive growth of earnings per share and net asset value per share;
• TheCompanyforeseesthatitwillmaintainafutureinvestmentbaseoflessthan10uniquelyidentifiableinvestments;
• TheCompany’sinvestmentintheunlistedentity,KilkenPlatinumPtyLtd,whichisinvolvedinsecondaryre-treatmentand processing of PGM tailings, resulted in a net asset value per share and tangible net asset value per share of R4 419;
• TheCompany’sinvestmentintheunlistedentity,ProRoofSteelMerchantsPtyLtdanditssubsidiaries,whichisinvolved in the processing and distribution of steel products, resulted in a net asset value per share and tangible net asset value per share of R1 680 624;
• Dividendand interest incomeanalysis from investments– refer to theconsolidatedstatementofcomprehensiveincome and related notes; and
• NodisclosureismadeintermsofSections15.5(d)and(f)–(i)oftheJSEListingsRequirementsasthesearenot
applicable.
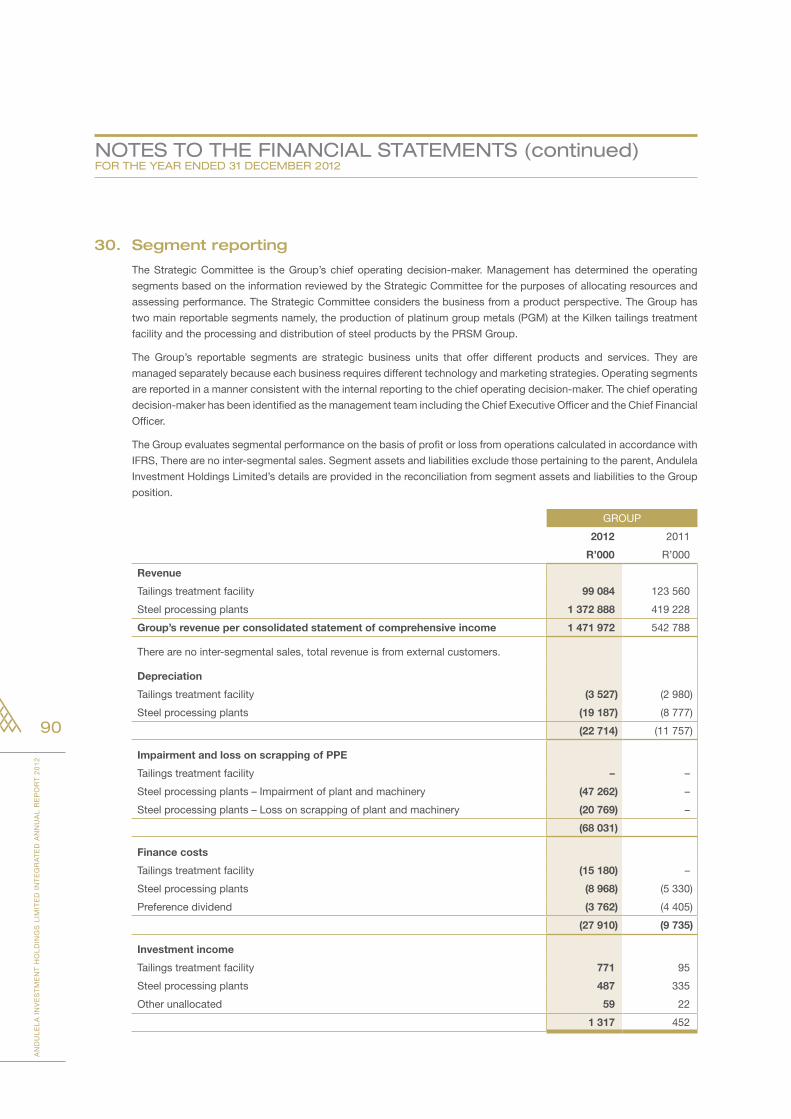
AN
DU
LE
LA
IN
VE
ST
ME
NT
HO
LD
ING
S L
IMIT
ED
IN
TE
GR
AT
ED
AN
NU
AL
RE
PO
RT
20
12
90
NOTes TO The FiNANCiAl sTATemeNTs (continued)FOR The YeAR eNded 31 deCemBeR 2012
30. Segment reporting
The Strategic Committee is the Group’s chief operating decision-maker. Management has determined the operating
segments based on the information reviewed by the Strategic Committee for the purposes of allocating resources and
assessing performance. The Strategic Committee considers the business from a product perspective. The Group has
two main reportable segments namely, the production of platinum group metals (PGM) at the Kilken tailings treatment
facility and the processing and distribution of steel products by the PRSM Group.
The Group’s reportable segments are strategic business units that offer different products and services. They are
managed separately because each business requires different technology and marketing strategies. Operating segments
are reported in a manner consistent with the internal reporting to the chief operating decision-maker. The chief operating
decision-maker has been identified as the management team including the Chief Executive Officer and the Chief Financial
Officer.
The Group evaluates segmental performance on the basis of profit or loss from operations calculated in accordance with
IFRS, There are no inter-segmental sales. Segment assets and liabilities exclude those pertaining to the parent, Andulela
Investment Holdings Limited’s details are provided in the reconciliation from segment assets and liabilities to the Group
position.
GROUP
2012 2011
R’000 R’000
Revenue
Tailings treatment facility 99 084 123 560
Steel processing plants 1 372 888 419 228
Group’s revenue per consolidated statement of comprehensive income 1 471 972 542 788
There are no inter-segmental sales, total revenue is from external customers.
Depreciation
Tailings treatment facility (3 527) (2 980)
Steel processing plants (19 187) (8 777)
(22 714) (11 757)
Impairment and loss on scrapping of PPE
Tailings treatment facility – –
Steel processing plants – Impairment of plant and machinery (47 262) –
Steel processing plants – Loss on scrapping of plant and machinery (20 769) –
(68 031)
Finance costs
Tailings treatment facility (15 180) –
Steel processing plants (8 968) (5 330)
Preference dividend (3 762) (4 405)
(27 910) (9 735)
Investment income
Tailings treatment facility 771 95
Steel processing plants 487 335
Other unallocated 59 22
1 317 452
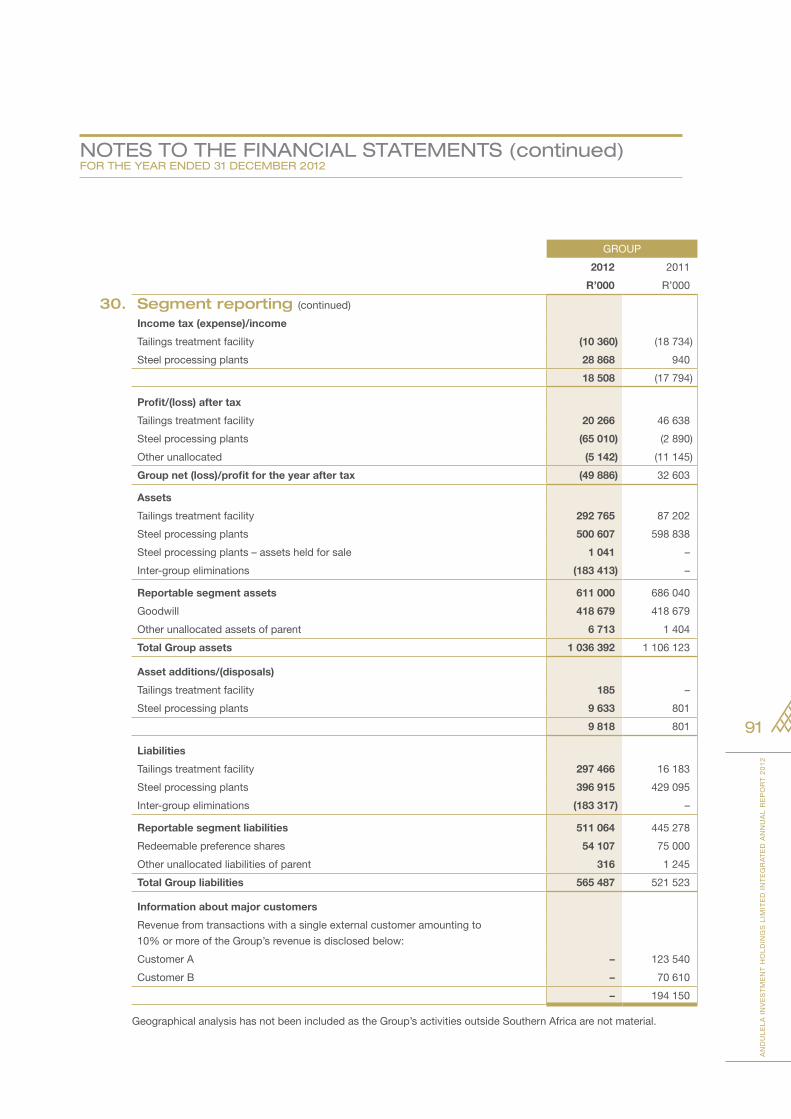
AN
DU
LE
LA
IN
VE
ST
ME
NT
HO
LD
ING
S L
IMIT
ED
IN
TE
GR
AT
ED
AN
NU
AL
RE
PO
RT
20
12
91
NOTes TO The FiNANCiAl sTATemeNTs (continued)FOR The YeAR eNded 31 deCemBeR 2012
GROUP
2012 2011
R’000 R’000
30. Segment reporting (continued)
Income tax (expense)/income
Tailings treatment facility (10 360) (18 734)
Steel processing plants 28 868 940
18 508 (17 794)
Profit/(loss) after tax
Tailings treatment facility 20 266 46 638
Steel processing plants (65 010) (2 890)
Other unallocated (5 142) (11 145)
Group net (loss)/profit for the year after tax (49 886) 32 603
Assets
Tailings treatment facility 292 765 87 202
Steel processing plants 500 607 598 838
Steel processing plants – assets held for sale 1 041 –
Inter-group eliminations (183 413) –
Reportable segment assets 611 000 686 040
Goodwill 418 679 418 679
Other unallocated assets of parent 6 713 1 404
Total Group assets 1 036 392 1 106 123
Asset additions/(disposals)
Tailings treatment facility 185 –
Steel processing plants 9 633 801
9 818 801
Liabilities
Tailings treatment facility 297 466 16 183
Steel processing plants 396 915 429 095
Inter-group eliminations (183 317) –
Reportable segment liabilities 511 064 445 278
Redeemable preference shares 54 107 75 000
Other unallocated liabilities of parent 316 1 245
Total Group liabilities 565 487 521 523
Information about major customers
Revenue from transactions with a single external customer amounting to
10% or more of the Group’s revenue is disclosed below:
Customer A – 123 540
Customer B – 70 610
– 194 150
Geographical analysis has not been included as the Group’s activities outside Southern Africa are not material.
AN
DU
LE
LA
IN
VE
ST
ME
NT
HO
LD
ING
S L
IMIT
ED
IN
TE
GR
AT
ED
AN
NU
AL
RE
PO
RT
20
12
92
31. Events subsequent to the year-end After an in-depth analysis of the PRSM Group’s operational strategy, budgets and cash flow forecasts, it was decided
to rationalise the marginal non-strategic operational manufacturing and distribution branches. As a result the Polokwane
and Durban branches will be scaled down to representative sales offices at smaller premises.
Plant and equipment from these branches will be distributed amongst the Vereeniging, Pretoria and Cape Town branches
where needed. Management is also negotiating more favourable structuring of the current rental agreements with the
landlords.
The Nelspruit operations were sold with effect from 1 March 2013 for the book value of the fixed assets and the inventory,
with the purchase consideration payable in equal instalments over 25 months from 31 March 2013. This asset was
accordingly treated as a non-current asset held for sale in the statement of financial position as at 31 December 2012.
32. Going concern The annual financial statements have been prepared on the basis of accounting policies applicable to a going concern.
The basis presumes that funds will be available to finance future operations and that the realisation of assets and
settlement of liabilities, contingent obligations and commitments will occur in the ordinary course of business.
NOTes TO The FiNANCiAl sTATemeNTs (continued)FOR The YeAR eNded 31 deCemBeR 2012
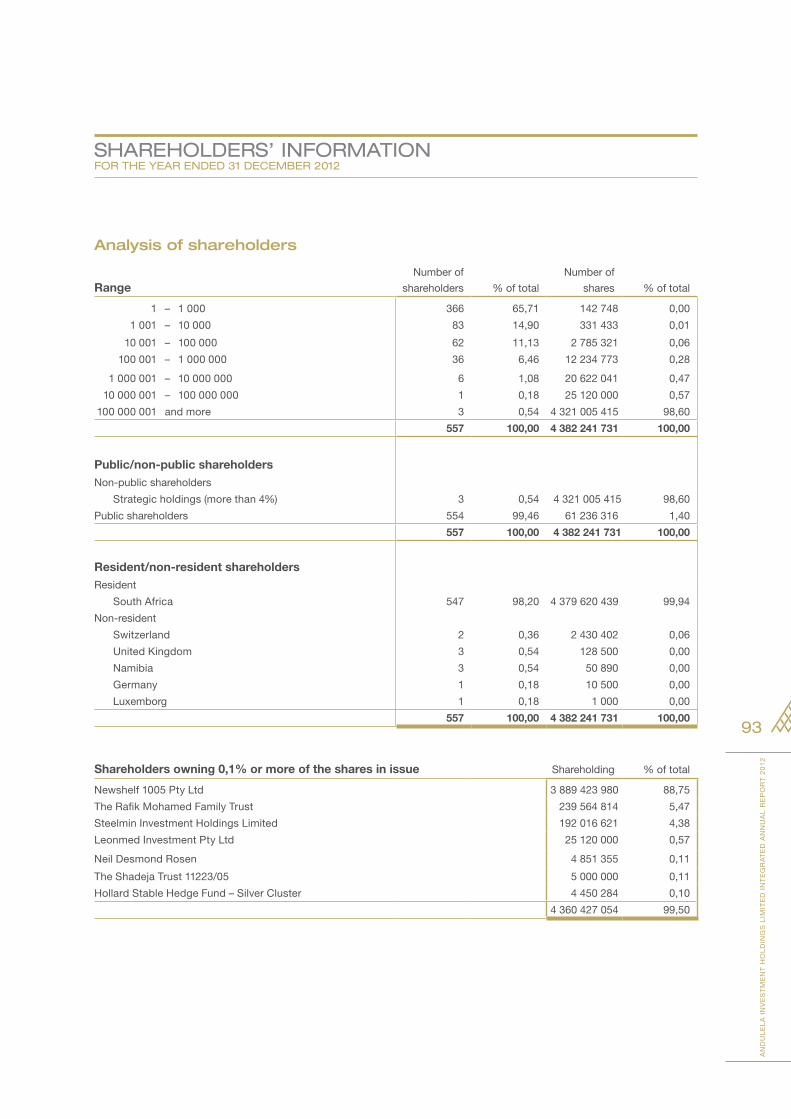
AN
DU
LE
LA
IN
VE
ST
ME
NT
HO
LD
ING
S L
IMIT
ED
IN
TE
GR
AT
ED
AN
NU
AL
RE
PO
RT
20
12
93
shARehOldeRs’ iNFORmATiONFOR The YeAR eNded 31 deCemBeR 2012
Analysis of shareholders
RangeNumber of
shareholders % of total
Number of
shares % of total
1 – 1 000 366 65,71 142 748 0,00
1 001 – 10 000 83 14,90 331 433 0,01
10 001 – 100 000 62 11,13 2 785 321 0,06
100 001 – 1 000 000 36 6,46 12 234 773 0,28
1 000 001 – 10 000 000 6 1,08 20 622 041 0,47
10 000 001 – 100 000 000 1 0,18 25 120 000 0,57
100 000 001 and more 3 0,54 4 321 005 415 98,60
557 100,00 4 382 241 731 100,00
Public/non-public shareholdersNon-public shareholders
Strategic holdings (more than 4%) 3 0,54 4 321 005 415 98,60
Public shareholders 554 99,46 61 236 316 1,40
557 100,00 4 382 241 731 100,00
Resident/non-resident shareholdersResident
South Africa 547 98,20 4 379 620 439 99,94
Non-resident
Switzerland 2 0,36 2 430 402 0,06
United Kingdom 3 0,54 128 500 0,00
Namibia 3 0,54 50 890 0,00
Germany 1 0,18 10 500 0,00
Luxemborg 1 0,18 1 000 0,00
557 100,00 4 382 241 731 100,00
Shareholders owning 0,1% or more of the shares in issue Shareholding % of total
Newshelf 1005 Pty Ltd 3 889 423 980 88,75
The Rafik Mohamed Family Trust 239 564 814 5,47
Steelmin Investment Holdings Limited 192 016 621 4,38
Leonmed Investment Pty Ltd 25 120 000 0,57
Neil Desmond Rosen 4 851 355 0,11
The Shadeja Trust 11223/05 5 000 000 0,11
Hollard Stable Hedge Fund – Silver Cluster 4 450 284 0,10
4 360 427 054 99,50