android malware detection based on system calls · android malware detection based on system calls...
TRANSCRIPT
Android Malware Detection Basedon System Calls
Marko Dimjasevic, Simone Atzeni,Ivo Ugrina, Zvonimir Rakamaric
UUCS-15-003
School of ComputingUniversity of Utah
Salt Lake City, UT 84112 USA
May 15, 2015
Abstract
With Android being the most widespread mobile platform, protecting it against maliciousapplications is essential. Android users typically install applications from large remoterepositories, which provides ample opportunities for malicious newcomers. In this paper,we propose a simple, and yet highly effective technique for detecting malicious Androidapplications on a repository level. Our technique performs automatic classification basedon tracking system calls while applications are executed in a sandbox environment. Weimplemented the technique in a tool called MALINE, and performed extensive empiricalevaluation on a suite of around 12,000 applications. The evaluation yields an overall de-tection accuracy of 93% with a 5% benign application classification error, while resultsare improved to a 96% detection accuracy with up-sampling. This indicates that our tech-nique is viable to be used in practice. Finally, we show that even simplistic feature choicesare highly effective, suggesting that more heavyweight approaches should be thoroughly(re)evaluated.
Android Malware Detection Based on System CallsMarko Dimjasevic, Simone Atzeni, Zvonimir Rakamaric
University of Utah, USA{marko,simone,zvonimir}@cs.utah.edu
Ivo UgrinaUniversity of Zagreb, Croatia
Abstract—With Android being the most widespread mobileplatform, protecting it against malicious applications is essential.Android users typically install applications from large remoterepositories, which provides ample opportunities for maliciousnewcomers. In this paper, we propose a simple, and yet highlyeffective technique for detecting malicious Android applica-tions on a repository level. Our technique performs automaticclassification based on tracking system calls while applicationsare executed in a sandbox environment. We implemented thetechnique in a tool called MALINE, and performed extensiveempirical evaluation on a suite of around 12,000 applications.The evaluation yields an overall detection accuracy of 93% witha 5% benign application classification error, while results areimproved to a 96% detection accuracy with up-sampling. Thisindicates that our technique is viable to be used in practice.Finally, we show that even simplistic feature choices are highlyeffective, suggesting that more heavyweight approaches shouldbe thoroughly (re)evaluated.
I. INTRODUCTION
The global market for mobile devices has exploded in thepast several years, and according to some estimates the numberof smartphone users alone reached 1.7 billion worldwide in2014. Android is the most popular mobile platform, holdingnearly 85% of the global smartphone market share [1]. One ofthe main advantages of mobile devices such as smartphonesis that they allow for numerous customizations and extensionsthrough downloading and installing applications from publicapplication markets. The largest of such markets (e.g., GooglePlay, Apple App Store) have more than one million applica-tions available for download each, and there are more than100 billion mobile device applications installed worldwide.
This clearly provides a fertile environment for maliciousactivities, including development and distribution of malware.A recent study [2] estimates that the total amount of malwareacross all mobile platforms grew exponentially at the rate of600% between 03/2012 and 03/2013. Around 92% of malwareapplications found in this study target Android. In a relatedstudy [3], similar statistics are reported — the number ofmalicious applications in the Google Play store grew around400% from 2011 to 2013, while at the same time the numberof malicious applications removed annually by Google hasdropped from 60% in 2011 to 23% in 2013. Due to the sharpincrease in the total amount of malware, the percentage ofremoved malware dropped significantly despite the fact thatthe absolute number actually increased from roughly 7,000in 2011 to nearly 10,000 in 2013. While companies suchas Google regularly scan their official application marketusing advanced, proprietary tools, this process is still often
ineffective as the above numbers illustrate. There are alsounofficial, open markets where often no scanning is beingperformed, partially because there is a lack of solid freelyavailable solutions and tools. As a consequence, Androidmalware detection has been an active area of research in thepast several years, both in industry and academia. Currently,published approaches can be broadly categorized into manualexpert-based approaches, and automatic static- or dynamic-analysis-based techniques.
Expert-based approaches detect malware by relying onmanually specified malware features, such as requested per-missions [4] or application signatures [5], [6]. This requiressignificant manual effort by an expert user, is often easy tocircumvent by malware writers, and targets existing, specifictypes of malware, thereby not providing protection fromevolving malicious applications.
Static-analysis-based techniques typically search for simi-larities to known malware. This often works well in practicesince new malware is typically just a variation of the existingones. Several such techniques look for code variations [7],[8], which becomes ineffective when faced with advancedcode obfuscation techniques. Hence, researchers have beenexploring more high-level properties of code that can beextracted statically, such as call graphs [9]. Unfortunately,even those approaches can be evaded by leveraging well-known drawbacks of static analysis. For example, generatedcall graphs are typically over-approximations, and hence canbe obfuscated by adding many dummy, unreachable functioncalls. In addition, native code is hard to analyze statically, andhence malicious behavior can be hidden there.
Dynamic analysis techniques typically run applications in asandbox environment or on real devices in order to extract in-formation about the application behavior. The extracted behav-ior information is then automatically analyzed for maliciousbehavior using various techniques, such as machine learning.Recent techniques is this category often observe applicationbehavior by tracing system calls in a virtualized environ-ment [10]–[12]. However, both static analysis and dynamicanalysis proponents made various claims, often contradictingones — including claims that are based on questionablydesigned experiments — on effectiveness of malware detectionbased on system calls.
In this paper, we propose a dynamic Android malwaredetection approach based on tracking system calls, and weimplement it as a free and open-source tool called MALINE.Our work was initially inspired by a similar approach proposed

for desktop malware detection [13], albeit we provide simplerfeature encodings, an Android-specific tool flow, and extensiveempirical evaluation. We provide several encodings of behav-ior fingerprints of applications into features for subsequentclassification. We performed an extensive empirical evaluationon a set of more than 12,000 Android applications. We analyzehow the quality of malware classifiers is affected across severaldimensions, including the choice of an encoding of systemcalls into features, the relative sizes of benign and maliciousdata sets used in experiments, the choice of a classificationalgorithm, and the size and type of inputs that drive a dynamicanalysis. Furthermore, we show that the structure of systemcall sequences observed during application executions conveysin itself a lot of information about application behaviors. Ourevaluation sheds light on several such aspects, and showsthat the proposed combinations can be effective: our approachyields overall detection accuracy of 93% with a 5% benignapplication classification error. Finally, we provide guidelinesfor domain experts when making choices on malware detectiontools for Android, such as MALINE.
Our approach provides several key benefits. By guardingthe users at the repository level, a malicious application isdetected early and before it is made publicly available forinstallation. This saves scarce energy resources on the devicesby delegating the detection task to a trusted remote party,while at the same time protecting users’ data, privacy, andpayment accounts. System call monitoring is out of reach ofmalicious applications, i.e., they cannot affect the monitoringprocess. Hence, our analysis that relies on monitoring systemcalls happens with higher privileges than those of maliciousapplications. In addition, tracking system calls entering thekernel (and not calls at the Java library level) enables us tocapture malicious behavior potentially hidden in native code.Since our approach is based on coupling of a dynamic analysiswith classification based on machine learning, it is completelyautomatic. We require no source code, and we capture dynamicbehavior of applications as opposed to their code propertiessuch as call graphs; hence, our approach is mostly immuneto common, simple obfuscation techniques. The advantagesof our approach make it complementary to many existingapproaches, such as the ones based on static analysis.
Our contributions are summarized as follows:• We propose a completely automatic approach to An-
droid malware detection on the application repositorylevel using system calls tracking and classification basedon machine learning, including a novel heuristics-basedencoding of system calls into features.
• We implement the approach in a tool called MALINE,and perform extensive empirical evaluation on more than12,000 applications. We show that MALINE effectivelydiscovers malware with a very low rate of false positives.
• We compare several feature extraction strategies andclassifiers. In particular, we show that the effectivenessof even very simplistic feature choices (e.g., frequency ofsystem calls) is comparable to much more heavyweightapproaches. Hence, our results provide a solid baseline
Applications
Android Framework
Libraries/Runtime
Linux Kernel
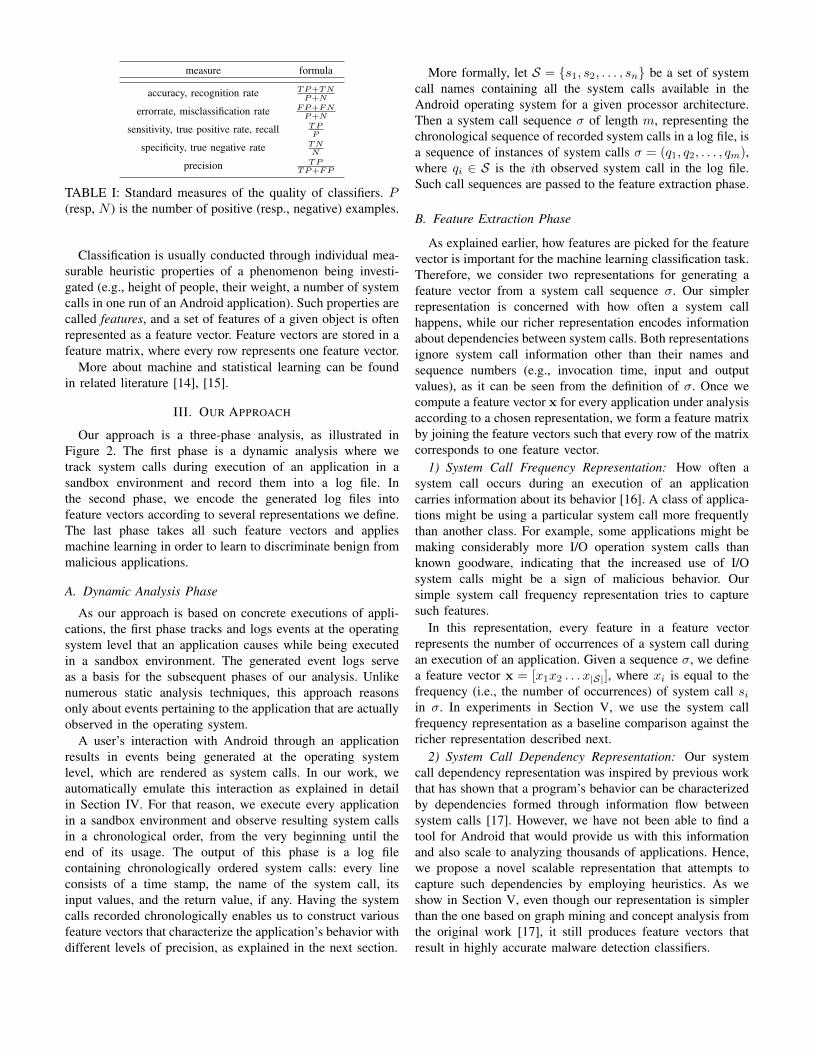
Fig. 1: Abstraction layers of the Android architecture.
and guidance for future research in this area.
II. PRELIMINARIES
A. System Calls
A system call is a mechanism for a program to requesta service from the underlying operating system’s kernel. InAndroid, system calls are created by information flowingthrough a multi-layered architecture depicted in Figure 1. Forexample, an Android text messaging application, located at thehighest level of the architecture, might receive a user requestto send an SMS message. The request is transformed into arequest to the Telephony Manager service in the ApplicationFramework. Next, the Android runtime receives the requestfrom the service, and it executes it in the Dalvik VirtualMachine.1 The execution transforms it into a collection oflibrary calls, which eventually result in multiple system callsbeing made to the Linux kernel. One of the system calls willbe sendmsg:
sendmsg(int sockfd, const struct msghdr* msg,
unsigned int flags)
It is a system call used to send a message on a socket.The generated sequence of system calls represents a low-levelequivalent of the SMS message being sent in the applicationat the highest level of abstraction. Information flows in theopposite direction in a similar fashion.
B. Machine Learning
Our malware detection problem is an instance of a classi-fication problem in machine learning, and is solved using aclassifier algorithm. More specifically, it is an example of abinary classification problem since it explores connections be-tween the behavior of an application and its goodware/malware(only two choices) label. The two groups are commonly calleda positive and a negative group. If a positive example (e.g., anapplication in our case) is classified into the positive (resp.,negative) group, we obtained a true positive/TP (resp., falsenegative/FN). Analogously, we define true negative/TN andfalse positive/FP. Table I gives standard measures of thequality of classification prediction used in machine learningbased on these terms.
1As of Android version 5.0, the Dalvik Virtual Machine is replaced withan application runtime environment called ART.
measure formula
accuracy, recognition rate TP+TNP+N
errorrate, misclassification rate FP+FNP+N
sensitivity, true positive rate, recall TPP
specificity, true negative rate TNN
precision TPTP+FP
TABLE I: Standard measures of the quality of classifiers. P(resp, N ) is the number of positive (resp., negative) examples.
Classification is usually conducted through individual mea-surable heuristic properties of a phenomenon being investi-gated (e.g., height of people, their weight, a number of systemcalls in one run of an Android application). Such properties arecalled features, and a set of features of a given object is oftenrepresented as a feature vector. Feature vectors are stored in afeature matrix, where every row represents one feature vector.
More about machine and statistical learning can be foundin related literature [14], [15].
III. OUR APPROACH
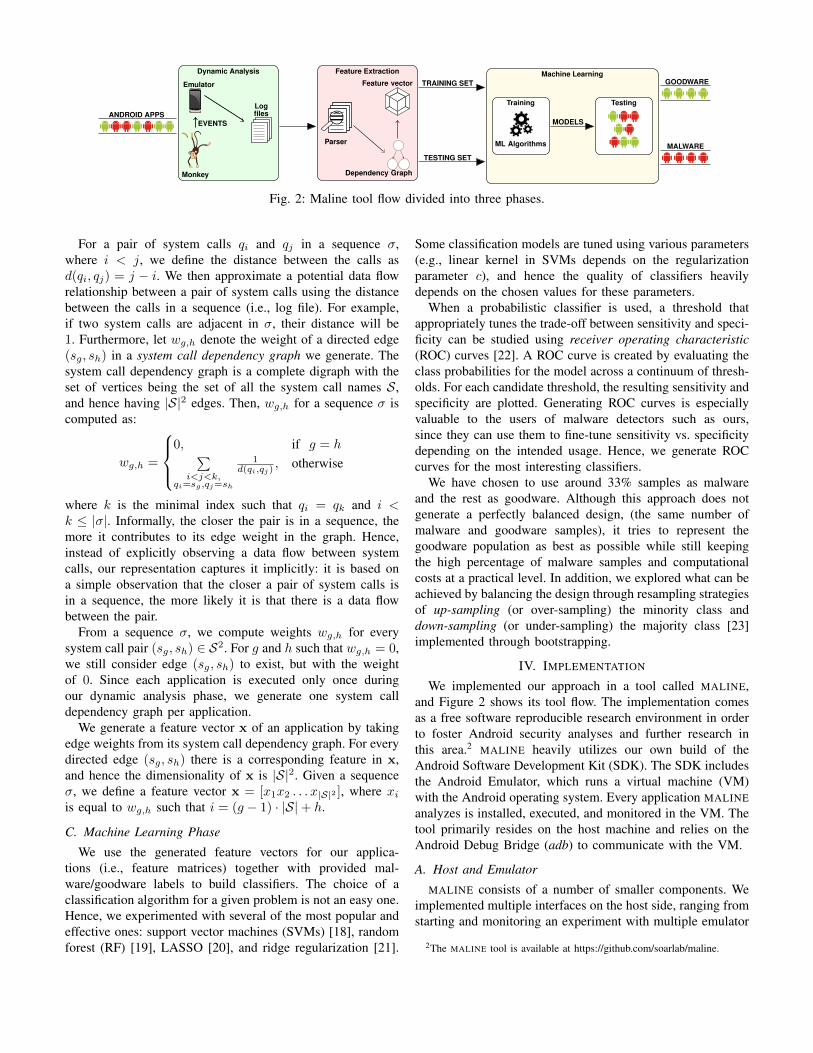
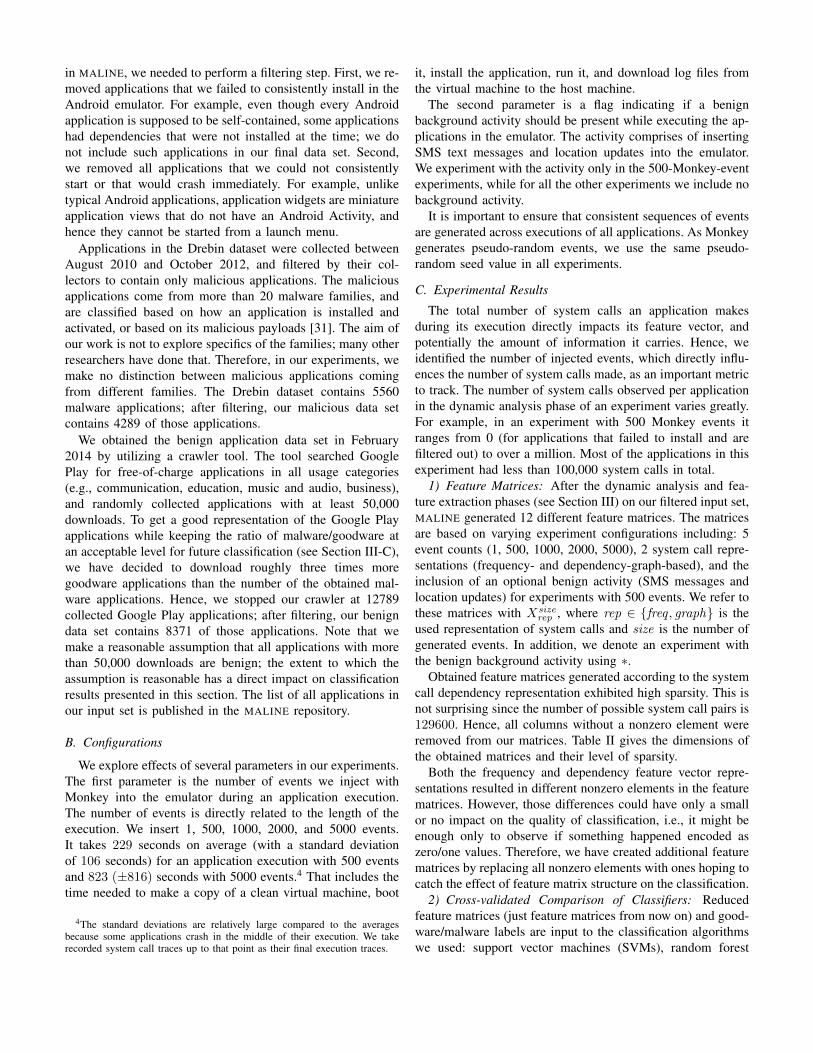
Our approach is a three-phase analysis, as illustrated inFigure 2. The first phase is a dynamic analysis where wetrack system calls during execution of an application in asandbox environment and record them into a log file. Inthe second phase, we encode the generated log files intofeature vectors according to several representations we define.The last phase takes all such feature vectors and appliesmachine learning in order to learn to discriminate benign frommalicious applications.
A. Dynamic Analysis Phase
As our approach is based on concrete executions of appli-cations, the first phase tracks and logs events at the operatingsystem level that an application causes while being executedin a sandbox environment. The generated event logs serveas a basis for the subsequent phases of our analysis. Unlikenumerous static analysis techniques, this approach reasonsonly about events pertaining to the application that are actuallyobserved in the operating system.
A user’s interaction with Android through an applicationresults in events being generated at the operating systemlevel, which are rendered as system calls. In our work, weautomatically emulate this interaction as explained in detailin Section IV. For that reason, we execute every applicationin a sandbox environment and observe resulting system callsin a chronological order, from the very beginning until theend of its usage. The output of this phase is a log filecontaining chronologically ordered system calls: every lineconsists of a time stamp, the name of the system call, itsinput values, and the return value, if any. Having the systemcalls recorded chronologically enables us to construct variousfeature vectors that characterize the application’s behavior withdifferent levels of precision, as explained in the next section.
More formally, let S = {s1, s2, . . . , sn} be a set of systemcall names containing all the system calls available in theAndroid operating system for a given processor architecture.Then a system call sequence σ of length m, representing thechronological sequence of recorded system calls in a log file, isa sequence of instances of system calls σ = (q1, q2, . . . , qm),where qi ∈ S is the ith observed system call in the log file.Such call sequences are passed to the feature extraction phase.
B. Feature Extraction Phase
As explained earlier, how features are picked for the featurevector is important for the machine learning classification task.Therefore, we consider two representations for generating afeature vector from a system call sequence σ. Our simplerrepresentation is concerned with how often a system callhappens, while our richer representation encodes informationabout dependencies between system calls. Both representationsignore system call information other than their names andsequence numbers (e.g., invocation time, input and outputvalues), as it can be seen from the definition of σ. Once wecompute a feature vector x for every application under analysisaccording to a chosen representation, we form a feature matrixby joining the feature vectors such that every row of the matrixcorresponds to one feature vector.
1) System Call Frequency Representation: How often asystem call occurs during an execution of an applicationcarries information about its behavior [16]. A class of applica-tions might be using a particular system call more frequentlythan another class. For example, some applications might bemaking considerably more I/O operation system calls thanknown goodware, indicating that the increased use of I/Osystem calls might be a sign of malicious behavior. Oursimple system call frequency representation tries to capturesuch features.
In this representation, every feature in a feature vectorrepresents the number of occurrences of a system call duringan execution of an application. Given a sequence σ, we definea feature vector x = [x1x2 . . . x|S|], where xi is equal to thefrequency (i.e., the number of occurrences) of system call siin σ. In experiments in Section V, we use the system callfrequency representation as a baseline comparison against thericher representation described next.
2) System Call Dependency Representation: Our systemcall dependency representation was inspired by previous workthat has shown that a program’s behavior can be characterizedby dependencies formed through information flow betweensystem calls [17]. However, we have not been able to find atool for Android that would provide us with this informationand also scale to analyzing thousands of applications. Hence,we propose a novel scalable representation that attempts tocapture such dependencies by employing heuristics. As weshow in Section V, even though our representation is simplerthan the one based on graph mining and concept analysis fromthe original work [17], it still produces feature vectors thatresult in highly accurate malware detection classifiers.
ANDROID APPS
Dynamic Analysis
Emulator
Monkey
Logfiles
EVENTS
Feature Extraction
Parser
Feature vector
Dependency Graph
TRAINING SET
TESTING SET
Machine Learning
Training
ML Algorithms
Testing
MODELS
GOODWARE
MALWARE
Fig. 2: Maline tool flow divided into three phases.
For a pair of system calls qi and qj in a sequence σ,where i < j, we define the distance between the calls asd(qi, qj) = j − i. We then approximate a potential data flowrelationship between a pair of system calls using the distancebetween the calls in a sequence (i.e., log file). For example,if two system calls are adjacent in σ, their distance will be1. Furthermore, let wg,h denote the weight of a directed edge(sg, sh) in a system call dependency graph we generate. Thesystem call dependency graph is a complete digraph with theset of vertices being the set of all the system call names S,and hence having |S|2 edges. Then, wg,h for a sequence σ iscomputed as:
wg,h =
0, if g = h∑i<j<k,
qi=sg,qj=sh
1d(qi,qj)
, otherwise
where k is the minimal index such that qi = qk and i <k ≤ |σ|. Informally, the closer the pair is in a sequence, themore it contributes to its edge weight in the graph. Hence,instead of explicitly observing a data flow between systemcalls, our representation captures it implicitly: it is based ona simple observation that the closer a pair of system calls isin a sequence, the more likely it is that there is a data flowbetween the pair.
From a sequence σ, we compute weights wg,h for everysystem call pair (sg, sh) ∈ S2. For g and h such that wg,h = 0,we still consider edge (sg, sh) to exist, but with the weightof 0. Since each application is executed only once duringour dynamic analysis phase, we generate one system calldependency graph per application.
We generate a feature vector x of an application by takingedge weights from its system call dependency graph. For everydirected edge (sg, sh) there is a corresponding feature in x,and hence the dimensionality of x is |S|2. Given a sequenceσ, we define a feature vector x = [x1x2 . . . x|S|2 ], where xiis equal to wg,h such that i = (g − 1) · |S|+ h.
C. Machine Learning Phase
We use the generated feature vectors for our applica-tions (i.e., feature matrices) together with provided mal-ware/goodware labels to build classifiers. The choice of aclassification algorithm for a given problem is not an easy one.Hence, we experimented with several of the most popular andeffective ones: support vector machines (SVMs) [18], randomforest (RF) [19], LASSO [20], and ridge regularization [21].
Some classification models are tuned using various parameters(e.g., linear kernel in SVMs depends on the regularizationparameter c), and hence the quality of classifiers heavilydepends on the chosen values for these parameters.
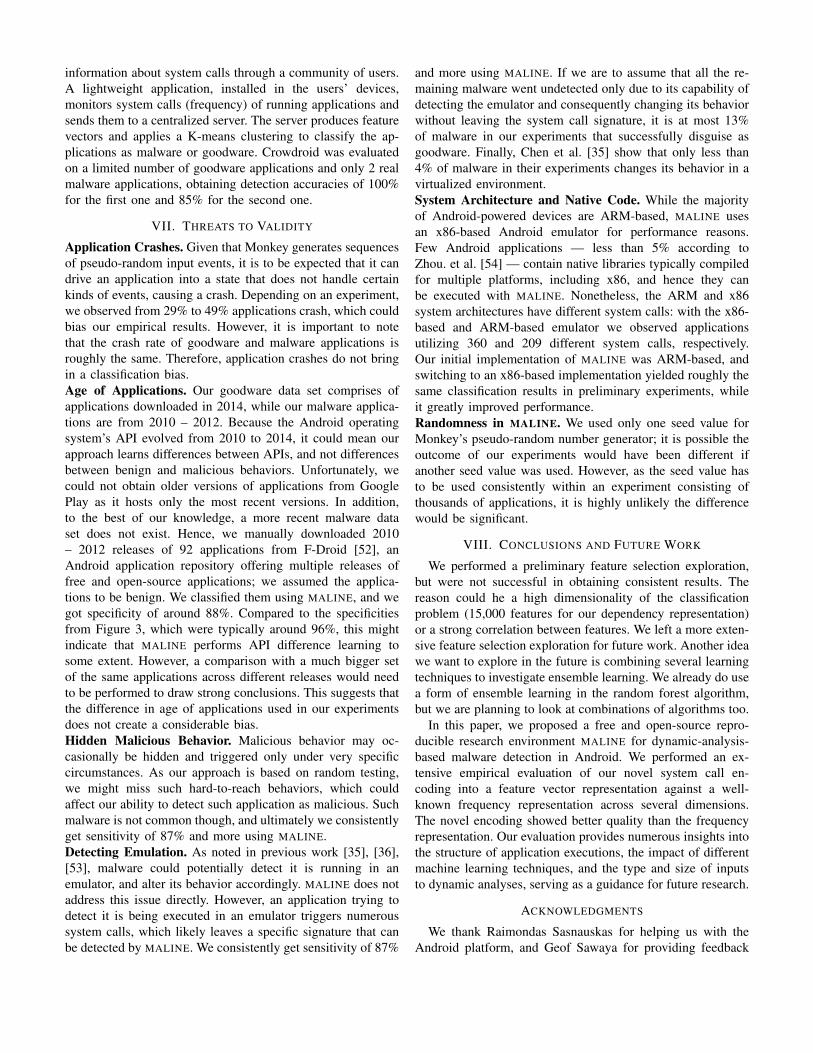
When a probabilistic classifier is used, a threshold thatappropriately tunes the trade-off between sensitivity and speci-ficity can be studied using receiver operating characteristic(ROC) curves [22]. A ROC curve is created by evaluating theclass probabilities for the model across a continuum of thresh-olds. For each candidate threshold, the resulting sensitivity andspecificity are plotted. Generating ROC curves is especiallyvaluable to the users of malware detectors such as ours,since they can use them to fine-tune sensitivity vs. specificitydepending on the intended usage. Hence, we generate ROCcurves for the most interesting classifiers.
We have chosen to use around 33% samples as malwareand the rest as goodware. Although this approach does notgenerate a perfectly balanced design, (the same number ofmalware and goodware samples), it tries to represent thegoodware population as best as possible while still keepingthe high percentage of malware samples and computationalcosts at a practical level. In addition, we explored what can beachieved by balancing the design through resampling strategiesof up-sampling (or over-sampling) the minority class anddown-sampling (or under-sampling) the majority class [23]implemented through bootstrapping.
IV. IMPLEMENTATION
We implemented our approach in a tool called MALINE,and Figure 2 shows its tool flow. The implementation comesas a free software reproducible research environment in orderto foster Android security analyses and further research inthis area.2 MALINE heavily utilizes our own build of theAndroid Software Development Kit (SDK). The SDK includesthe Android Emulator, which runs a virtual machine (VM)with the Android operating system. Every application MALINEanalyzes is installed, executed, and monitored in the VM. Thetool primarily resides on the host machine and relies on theAndroid Debug Bridge (adb) to communicate with the VM.
A. Host and Emulator
MALINE consists of a number of smaller components. Weimplemented multiple interfaces on the host side, ranging fromstarting and monitoring an experiment with multiple emulator
2The MALINE tool is available at https://github.com/soarlab/maline.
instances running in parallel to machine-learning differencesbetween applications based on the processed data obtainedfrom emulator instances. It is the host side that coordinates andcontrols all such activities. For example, it creates and starts apristine installation of Android in an emulator instance, waitsfor Android to boot, then installs an application in it, starts theapplication, and waits for it to finish so it can analyze systemcalls the application has made during its execution.
We use the emulator, which is built on top of QEMU [24],in the dynamic analysis phase of our approach (see Figure 2).For every application we create a pristine sandboxed environ-ment since the emulator enables us to easily create a cleaninstallation of Android. It is important that each applicationis executed in a clean and controlled environment to makesure nothing is left behind from previous executions and tobe able to monitor the execution. Hence, every application’sexecution is completely independent of executions of all theother analyzed applications.
1) Custom Build of Android SDK: In our implementation,we used the Android 4.4.3 KitKat release, which utilizesAndroid API version 19. However, we have our own build ofthe Android system implemented on top of the official sourcecode repositories. The main reason for the custom build isto prevent bugs we found in the Android SDK throughoutmultiple releases. Our build is a compilation of parts fromdifferent versions such that the functionality we needed fromthe SDK works as expected.
Our build also features a modification to the Monkeytool (we describe the tool later) to have better control overexperiments. The default Monkey version injects an eventinto a system queue and moves onto the next event rightaway, without waiting for the queued event to be executed.However, to make Android more responsive, its developersdecided to drop events from the queue when under heavyload. In our experiments, this would mean that events thatMonkey injects might be discarded, thereby compromising thedynamic analysis of an application under test. To make surethe Android system does not drop events, we have slightlymodified Monkey so that it waits for each event to be executedbefore proceeding to the next event.
B. Automatic Execution of Applications
In order to scale to thousands of applications, our dynamicanalysis phase implements an automatic application executionprocess. The process starts with making a clean copy ofour default virtual machine. The copy contains only whatis installed by default in a fresh installation of the Androidoperating system from the Android Open Source Project. Oncethe installation boots, we use adb to send an application fromthe host machine to the VM for installation. Next, we startthe application and immediately begin tracing system callsrelated to the operating system process of the application withthe strace tool. The system calls are recorded into a log file.
We simulate a user interaction with an Android device byinjecting both internal and external events into the emulator.Internal events are sent to the application itself, such as
screen clicks, touches, and gestures. We use the Monkeytool [25] as our internal event generator (see Figure 2). Itsends a parameterized number of the events to the application,with a 100 ms pause period between consecutive events ifapplicable3. Unlike internal events, which are delivered to theapplication, external events are delivered to the emulator andinclude events that come from interacting with an externalenvironment. In our experiments, for external events we focuson generating text messages and location updates only sincethose are sometimes related to malicious behaviors.
Even though a system calls log file, forming a chronologicalsequence of low-level operations, contains rich information(e.g., time stamp, input and output values), we preserve onlysystem call names and their order. We stop an applicationexecution when all internal events generated by Monkey aredelivered and executed. Finally, the log file is pulled from theVM to the host machine for parsing.
In the next step we apply a feature vector representation,either the system call frequency representation or the systemcall dependency representation as explained in Section III.The output is a textual feature vector file per log file, i.e.per application, listing all the features. Finally, we combineall the feature vectors into a single matrix where each matrixrow corresponds to one feature vector, i.e. one application.
C. Classification
Using the feature matrix generated from logs and previouslyobtained labels denoting malware/goodware for applications,we proceed with performing a classification. We experimentedwith several classification algorithms: random forest, SVMs,LASSO, and ridge regression. An implementation of SVMsis based on libSVM [26], while all the other algorithms areimplemented in R [27] using the language’s libraries [28]. Thescripts are heavily parallelized and adjusted to be run on clus-ters or supercomputers. For example, running a random forestmodel on a feature matrix from a system call dependencygraph sample takes at least 32 GB of RAM in one instance of5-fold cross-validation.
V. EVALUATION
We evaluated MALINE by utilizing a set of 32-core machineswith 128 GB of RAM running Ubuntu 12.04. The machinesare part of the Emulab testing infrastructure [29]. We wrotescripts to automatize and parallelize all of our experiments,without which our extensive experimental evaluation wouldnot be possible. In our experiments, we use only the x86Android emulator; the resulting x86 system call set S has 360system calls.
A. Input Data Set
In order to evaluate MALINE, we obtained applications fromGoogle Play as goodware and the Drebin dataset [30] asmalware. Before we could start using the collected applications
3The pause between two consecutive events may not be applicable foractions that are time-dependent, such as screen tapping.
in MALINE, we needed to perform a filtering step. First, we re-moved applications that we failed to consistently install in theAndroid emulator. For example, even though every Androidapplication is supposed to be self-contained, some applicationshad dependencies that were not installed at the time; we donot include such applications in our final data set. Second,we removed all applications that we could not consistentlystart or that would crash immediately. For example, unliketypical Android applications, application widgets are miniatureapplication views that do not have an Android Activity, andhence they cannot be started from a launch menu.
Applications in the Drebin dataset were collected betweenAugust 2010 and October 2012, and filtered by their col-lectors to contain only malicious applications. The maliciousapplications come from more than 20 malware families, andare classified based on how an application is installed andactivated, or based on its malicious payloads [31]. The aim ofour work is not to explore specifics of the families; many otherresearchers have done that. Therefore, in our experiments, wemake no distinction between malicious applications comingfrom different families. The Drebin dataset contains 5560malware applications; after filtering, our malicious data setcontains 4289 of those applications.
We obtained the benign application data set in February2014 by utilizing a crawler tool. The tool searched GooglePlay for free-of-charge applications in all usage categories(e.g., communication, education, music and audio, business),and randomly collected applications with at least 50,000downloads. To get a good representation of the Google Playapplications while keeping the ratio of malware/goodware atan acceptable level for future classification (see Section III-C),we have decided to download roughly three times moregoodware applications than the number of the obtained mal-ware applications. Hence, we stopped our crawler at 12789collected Google Play applications; after filtering, our benigndata set contains 8371 of those applications. Note that wemake a reasonable assumption that all applications with morethan 50,000 downloads are benign; the extent to which theassumption is reasonable has a direct impact on classificationresults presented in this section. The list of all applications inour input set is published in the MALINE repository.
B. Configurations
We explore effects of several parameters in our experiments.The first parameter is the number of events we inject withMonkey into the emulator during an application execution.The number of events is directly related to the length of theexecution. We insert 1, 500, 1000, 2000, and 5000 events.It takes 229 seconds on average (with a standard deviationof 106 seconds) for an application execution with 500 eventsand 823 (±816) seconds with 5000 events.4 That includes thetime needed to make a copy of a clean virtual machine, boot
4The standard deviations are relatively large compared to the averagesbecause some applications crash in the middle of their execution. We takerecorded system call traces up to that point as their final execution traces.
it, install the application, run it, and download log files fromthe virtual machine to the host machine.
The second parameter is a flag indicating if a benignbackground activity should be present while executing the ap-plications in the emulator. The activity comprises of insertingSMS text messages and location updates into the emulator.We experiment with the activity only in the 500-Monkey-eventexperiments, while for all the other experiments we include nobackground activity.
It is important to ensure that consistent sequences of eventsare generated across executions of all applications. As Monkeygenerates pseudo-random events, we use the same pseudo-random seed value in all experiments.
C. Experimental Results
The total number of system calls an application makesduring its execution directly impacts its feature vector, andpotentially the amount of information it carries. Hence, weidentified the number of injected events, which directly influ-ences the number of system calls made, as an important metricto track. The number of system calls observed per applicationin the dynamic analysis phase of an experiment varies greatly.For example, in an experiment with 500 Monkey events itranges from 0 (for applications that failed to install and arefiltered out) to over a million. Most of the applications in thisexperiment had less than 100,000 system calls in total.
1) Feature Matrices: After the dynamic analysis and fea-ture extraction phases (see Section III) on our filtered input set,MALINE generated 12 different feature matrices. The matricesare based on varying experiment configurations including: 5event counts (1, 500, 1000, 2000, 5000), 2 system call repre-sentations (frequency- and dependency-graph-based), and theinclusion of an optional benign activity (SMS messages andlocation updates) for experiments with 500 events. We refer tothese matrices with Xsize
rep , where rep ∈ {freq , graph} is theused representation of system calls and size is the number ofgenerated events. In addition, we denote an experiment withthe benign background activity using ∗.
Obtained feature matrices generated according to the systemcall dependency representation exhibited high sparsity. This isnot surprising since the number of possible system call pairs is129600. Hence, all columns without a nonzero element wereremoved from our matrices. Table II gives the dimensions ofthe obtained matrices and their level of sparsity.
Both the frequency and dependency feature vector repre-sentations resulted in different nonzero elements in the featurematrices. However, those differences could have only a smallor no impact on the quality of classification, i.e., it might beenough only to observe if something happened encoded aszero/one values. Therefore, we have created additional featurematrices by replacing all nonzero elements with ones hoping tocatch the effect of feature matrix structure on the classification.
2) Cross-validated Comparison of Classifiers: Reducedfeature matrices (just feature matrices from now on) and good-ware/malware labels are input to the classification algorithmswe used: support vector machines (SVMs), random forest
full matrix reduced matrixType non-zero (%) columns non-zero (%)X1
freq 12.48 118 38.09
X500freq∗ 17.30 137 45.48
X500freq 17.27 138 45.07
X1000freq 17.65 136 46.72
X2000freq 17.93 138 46.79
X5000freq 18.15 136 48.04
X1graph 1.49 11112 17.42
X500graph∗ 3.01 15101 25.83
X500graph 2.99 15170 25.61
X1000graph 3.12 15137 26.79
X2000graph 3.22 15299 27.34
X5000graph 3.29 15262 27.97
TABLE II: Comparison of the number of nonzero elements inthe reduced (zero-columns removed) and full feature matrices.
(RF), LASSO, and ridge regression. To avoid possible over-fitting, we employed double 5-fold cross-validation on the setof applications to tune parameters and test models. To enablecomparison between different classifiers for different featurematrices, the same folds were used in the model buildingamong different classification models. Prior to building thefinal model on the whole training set, all classifiers were firsttuned by appropriate model selection techniques to derive thebest parameters. The SVMs algorithm in particular required anexpensive tuning phase: for each dataset we had to run 5-foldcross-validation to find the best C and γ parameters. Hence,we had to run the training and testing phases with differentvalues of C (ranging from 2−5 to 215) and γ (ranging from2−15 to 23) for the 5 different splits of training and testing set.In the end, the best kernel to use with SVMs was the RadialBasis Function (RBF) kernel.
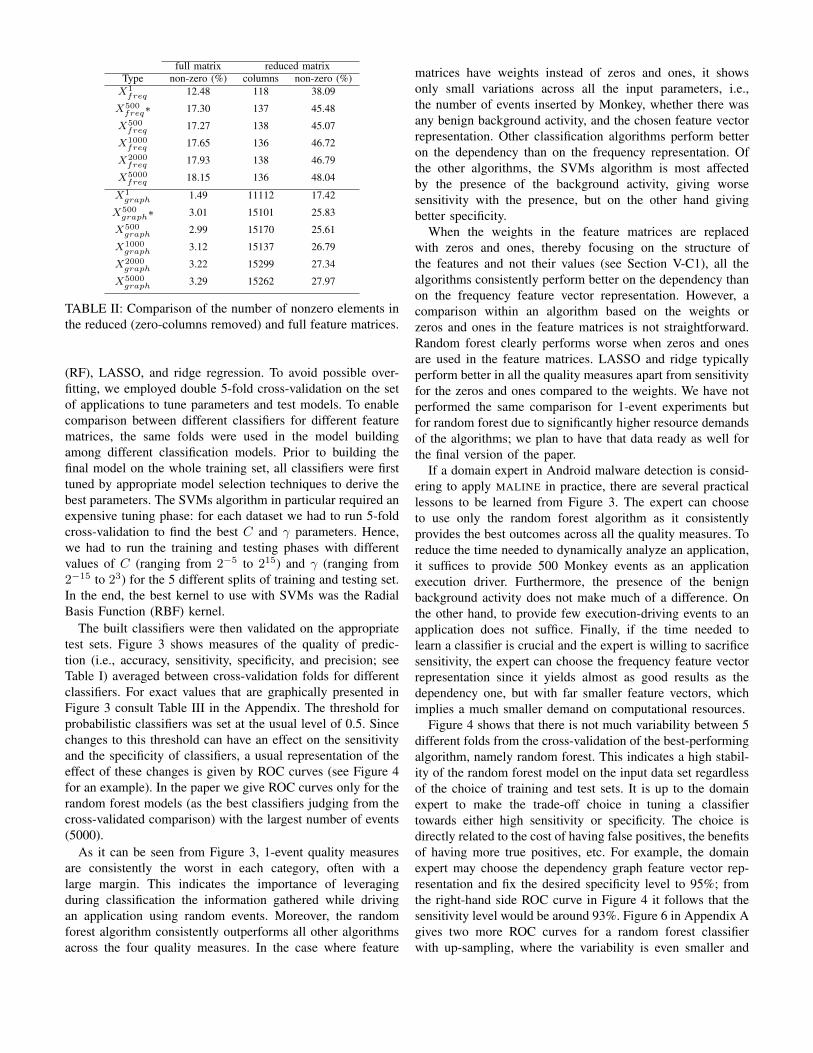
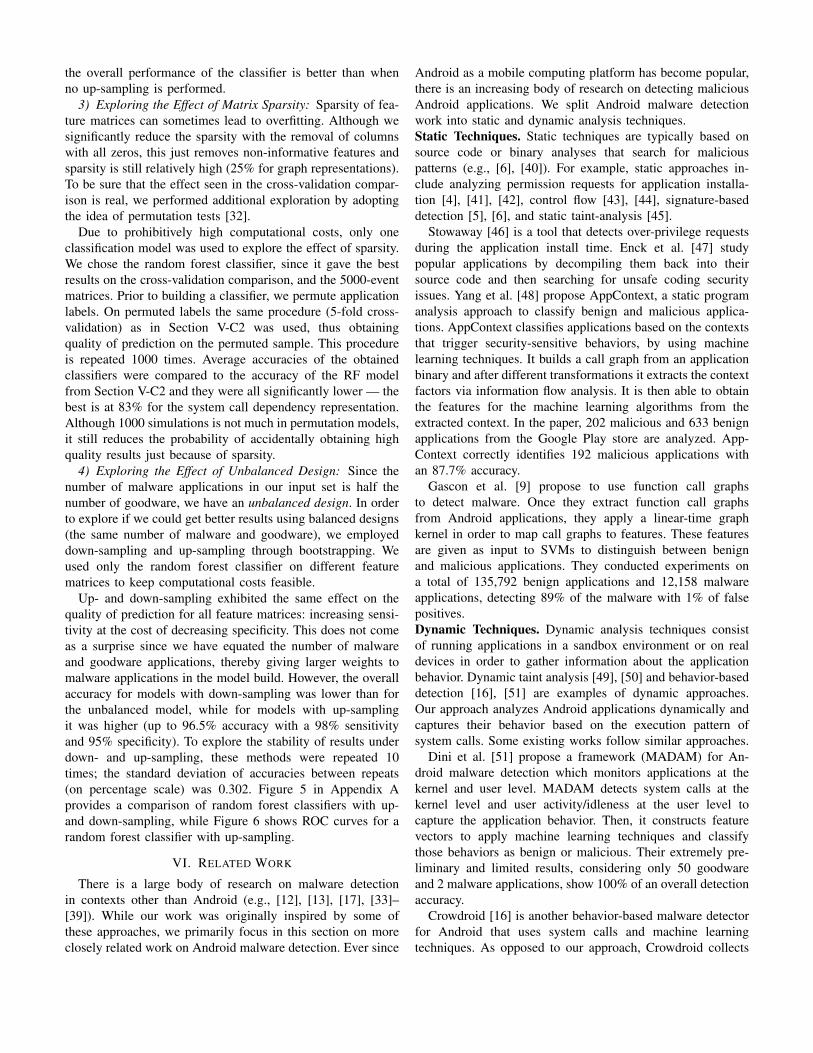
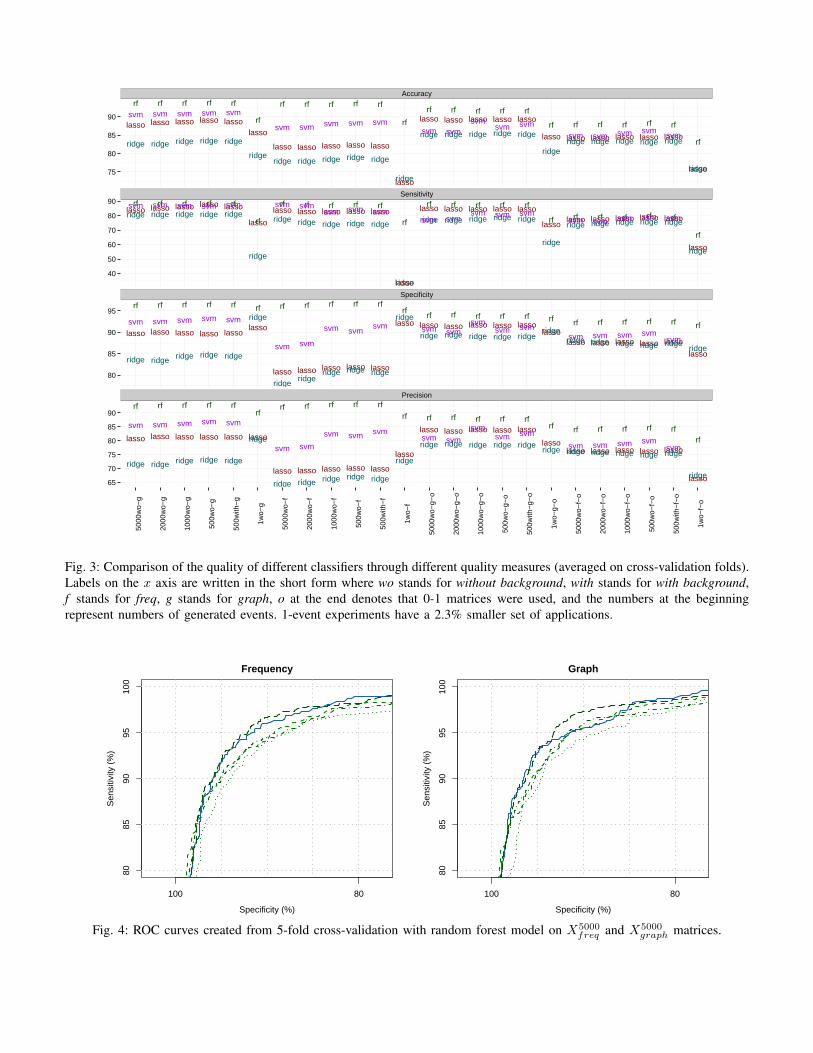
The built classifiers were then validated on the appropriatetest sets. Figure 3 shows measures of the quality of predic-tion (i.e., accuracy, sensitivity, specificity, and precision; seeTable I) averaged between cross-validation folds for differentclassifiers. For exact values that are graphically presented inFigure 3 consult Table III in the Appendix. The threshold forprobabilistic classifiers was set at the usual level of 0.5. Sincechanges to this threshold can have an effect on the sensitivityand the specificity of classifiers, a usual representation of theeffect of these changes is given by ROC curves (see Figure 4for an example). In the paper we give ROC curves only for therandom forest models (as the best classifiers judging from thecross-validated comparison) with the largest number of events(5000).
As it can be seen from Figure 3, 1-event quality measuresare consistently the worst in each category, often with alarge margin. This indicates the importance of leveragingduring classification the information gathered while drivingan application using random events. Moreover, the randomforest algorithm consistently outperforms all other algorithmsacross the four quality measures. In the case where feature
matrices have weights instead of zeros and ones, it showsonly small variations across all the input parameters, i.e.,the number of events inserted by Monkey, whether there wasany benign background activity, and the chosen feature vectorrepresentation. Other classification algorithms perform betteron the dependency than on the frequency representation. Ofthe other algorithms, the SVMs algorithm is most affectedby the presence of the background activity, giving worsesensitivity with the presence, but on the other hand givingbetter specificity.
When the weights in the feature matrices are replacedwith zeros and ones, thereby focusing on the structure ofthe features and not their values (see Section V-C1), all thealgorithms consistently perform better on the dependency thanon the frequency feature vector representation. However, acomparison within an algorithm based on the weights orzeros and ones in the feature matrices is not straightforward.Random forest clearly performs worse when zeros and onesare used in the feature matrices. LASSO and ridge typicallyperform better in all the quality measures apart from sensitivityfor the zeros and ones compared to the weights. We have notperformed the same comparison for 1-event experiments butfor random forest due to significantly higher resource demandsof the algorithms; we plan to have that data ready as well forthe final version of the paper.
If a domain expert in Android malware detection is consid-ering to apply MALINE in practice, there are several practicallessons to be learned from Figure 3. The expert can chooseto use only the random forest algorithm as it consistentlyprovides the best outcomes across all the quality measures. Toreduce the time needed to dynamically analyze an application,it suffices to provide 500 Monkey events as an applicationexecution driver. Furthermore, the presence of the benignbackground activity does not make much of a difference. Onthe other hand, to provide few execution-driving events to anapplication does not suffice. Finally, if the time needed tolearn a classifier is crucial and the expert is willing to sacrificesensitivity, the expert can choose the frequency feature vectorrepresentation since it yields almost as good results as thedependency one, but with far smaller feature vectors, whichimplies a much smaller demand on computational resources.
Figure 4 shows that there is not much variability between 5different folds from the cross-validation of the best-performingalgorithm, namely random forest. This indicates a high stabil-ity of the random forest model on the input data set regardlessof the choice of training and test sets. It is up to the domainexpert to make the trade-off choice in tuning a classifiertowards either high sensitivity or specificity. The choice isdirectly related to the cost of having false positives, the benefitsof having more true positives, etc. For example, the domainexpert may choose the dependency graph feature vector rep-resentation and fix the desired specificity level to 95%; fromthe right-hand side ROC curve in Figure 4 it follows that thesensitivity level would be around 93%. Figure 6 in Appendix Agives two more ROC curves for a random forest classifierwith up-sampling, where the variability is even smaller and
the overall performance of the classifier is better than whenno up-sampling is performed.
3) Exploring the Effect of Matrix Sparsity: Sparsity of fea-ture matrices can sometimes lead to overfitting. Although wesignificantly reduce the sparsity with the removal of columnswith all zeros, this just removes non-informative features andsparsity is still relatively high (25% for graph representations).To be sure that the effect seen in the cross-validation compar-ison is real, we performed additional exploration by adoptingthe idea of permutation tests [32].
Due to prohibitively high computational costs, only oneclassification model was used to explore the effect of sparsity.We chose the random forest classifier, since it gave the bestresults on the cross-validation comparison, and the 5000-eventmatrices. Prior to building a classifier, we permute applicationlabels. On permuted labels the same procedure (5-fold cross-validation) as in Section V-C2 was used, thus obtainingquality of prediction on the permuted sample. This procedureis repeated 1000 times. Average accuracies of the obtainedclassifiers were compared to the accuracy of the RF modelfrom Section V-C2 and they were all significantly lower — thebest is at 83% for the system call dependency representation.Although 1000 simulations is not much in permutation models,it still reduces the probability of accidentally obtaining highquality results just because of sparsity.
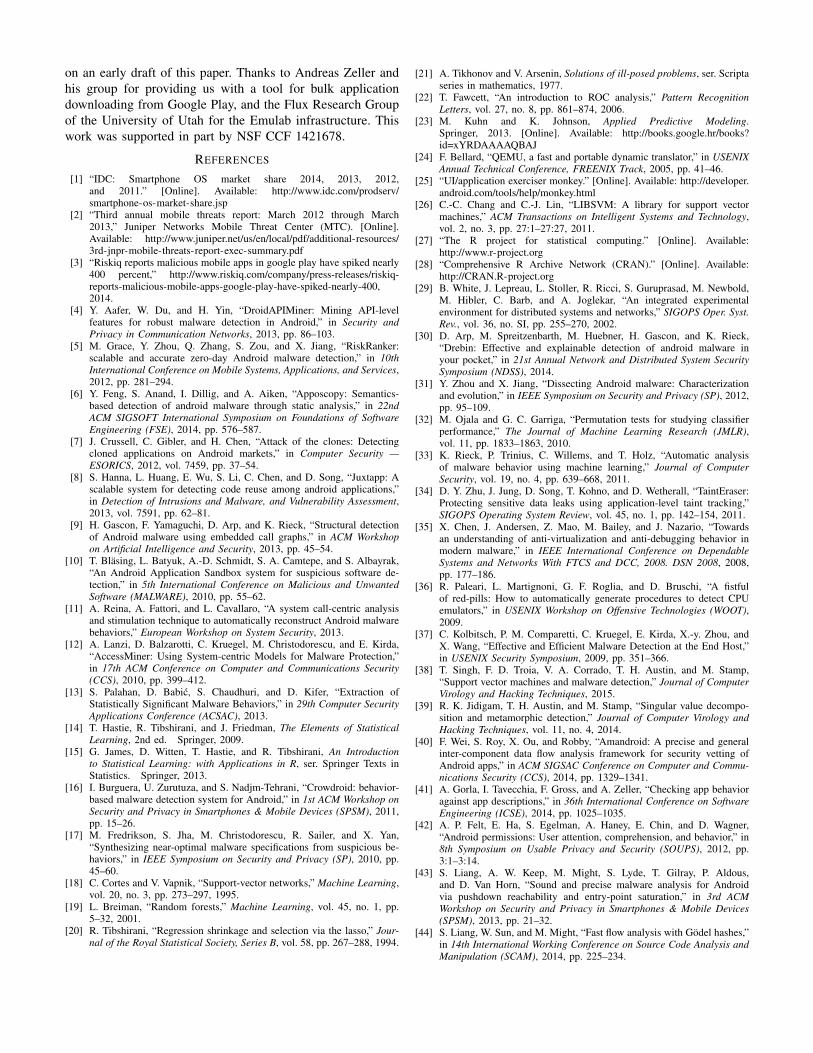
4) Exploring the Effect of Unbalanced Design: Since thenumber of malware applications in our input set is half thenumber of goodware, we have an unbalanced design. In orderto explore if we could get better results using balanced designs(the same number of malware and goodware), we employeddown-sampling and up-sampling through bootstrapping. Weused only the random forest classifier on different featurematrices to keep computational costs feasible.
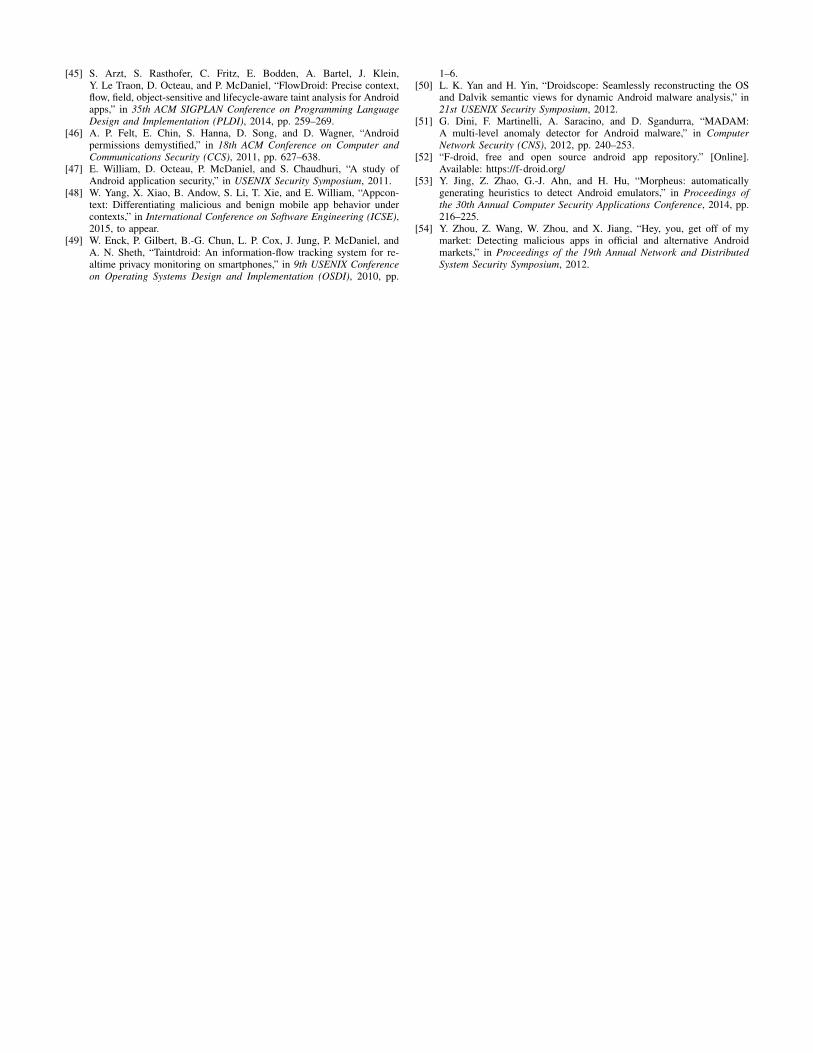
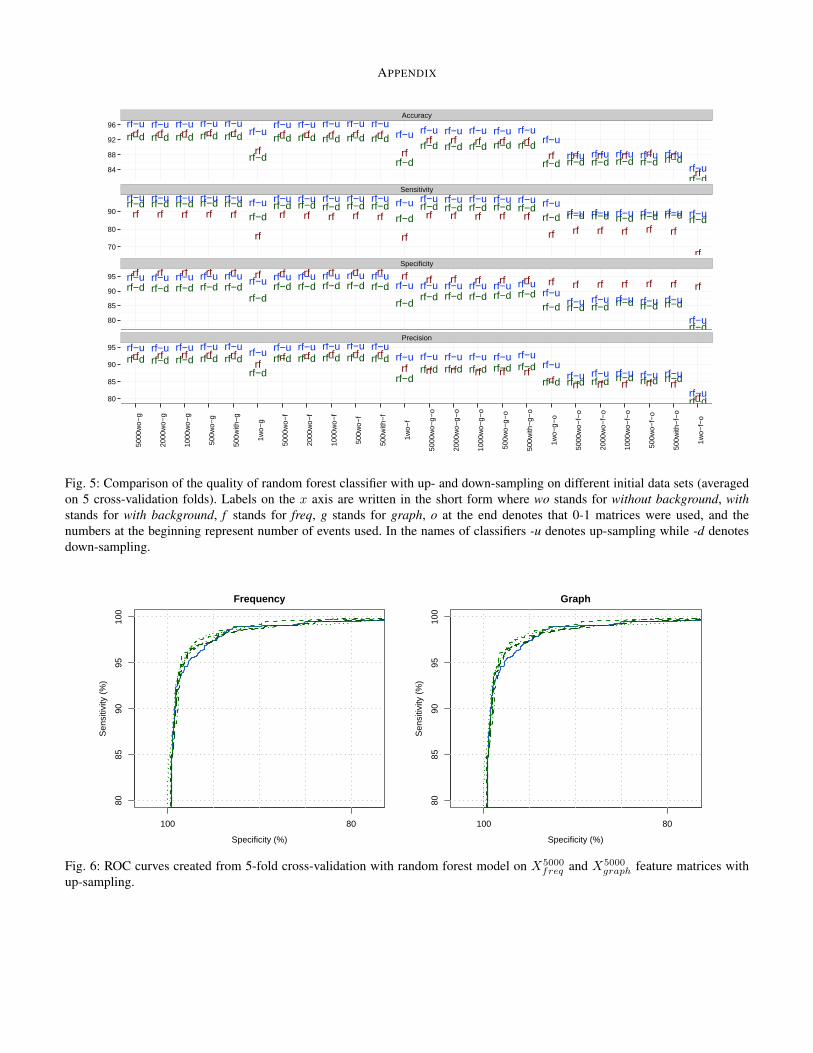
Up- and down-sampling exhibited the same effect on thequality of prediction for all feature matrices: increasing sensi-tivity at the cost of decreasing specificity. This does not comeas a surprise since we have equated the number of malwareand goodware applications, thereby giving larger weights tomalware applications in the model build. However, the overallaccuracy for models with down-sampling was lower than forthe unbalanced model, while for models with up-samplingit was higher (up to 96.5% accuracy with a 98% sensitivityand 95% specificity). To explore the stability of results underdown- and up-sampling, these methods were repeated 10times; the standard deviation of accuracies between repeats(on percentage scale) was 0.302. Figure 5 in Appendix Aprovides a comparison of random forest classifiers with up-and down-sampling, while Figure 6 shows ROC curves for arandom forest classifier with up-sampling.
VI. RELATED WORK
There is a large body of research on malware detectionin contexts other than Android (e.g., [12], [13], [17], [33]–[39]). While our work was originally inspired by some ofthese approaches, we primarily focus in this section on moreclosely related work on Android malware detection. Ever since
Android as a mobile computing platform has become popular,there is an increasing body of research on detecting maliciousAndroid applications. We split Android malware detectionwork into static and dynamic analysis techniques.Static Techniques. Static techniques are typically based onsource code or binary analyses that search for maliciouspatterns (e.g., [6], [40]). For example, static approaches in-clude analyzing permission requests for application installa-tion [4], [41], [42], control flow [43], [44], signature-baseddetection [5], [6], and static taint-analysis [45].
Stowaway [46] is a tool that detects over-privilege requestsduring the application install time. Enck et al. [47] studypopular applications by decompiling them back into theirsource code and then searching for unsafe coding securityissues. Yang et al. [48] propose AppContext, a static programanalysis approach to classify benign and malicious applica-tions. AppContext classifies applications based on the contextsthat trigger security-sensitive behaviors, by using machinelearning techniques. It builds a call graph from an applicationbinary and after different transformations it extracts the contextfactors via information flow analysis. It is then able to obtainthe features for the machine learning algorithms from theextracted context. In the paper, 202 malicious and 633 benignapplications from the Google Play store are analyzed. App-Context correctly identifies 192 malicious applications withan 87.7% accuracy.
Gascon et al. [9] propose to use function call graphsto detect malware. Once they extract function call graphsfrom Android applications, they apply a linear-time graphkernel in order to map call graphs to features. These featuresare given as input to SVMs to distinguish between benignand malicious applications. They conducted experiments ona total of 135,792 benign applications and 12,158 malwareapplications, detecting 89% of the malware with 1% of falsepositives.Dynamic Techniques. Dynamic analysis techniques consistof running applications in a sandbox environment or on realdevices in order to gather information about the applicationbehavior. Dynamic taint analysis [49], [50] and behavior-baseddetection [16], [51] are examples of dynamic approaches.Our approach analyzes Android applications dynamically andcaptures their behavior based on the execution pattern ofsystem calls. Some existing works follow similar approaches.
Dini et al. [51] propose a framework (MADAM) for An-droid malware detection which monitors applications at thekernel and user level. MADAM detects system calls at thekernel level and user activity/idleness at the user level tocapture the application behavior. Then, it constructs featurevectors to apply machine learning techniques and classifythose behaviors as benign or malicious. Their extremely pre-liminary and limited results, considering only 50 goodwareand 2 malware applications, show 100% of an overall detectionaccuracy.
Crowdroid [16] is another behavior-based malware detectorfor Android that uses system calls and machine learningtechniques. As opposed to our approach, Crowdroid collects
lasso
rf
ridge
svmlasso
rf
ridge
svmlasso
rf
ridge
svmlasso
rf
ridge
svmlasso
rf
ridge
svm
lasso
rf
ridgelasso
rf
ridge
svm
lasso
rf
ridge
svm
lasso
rf
ridge
svm
lasso
rf
ridge
svm
lasso
rf
ridge
svm
lasso
rf
ridge
lassorf
ridgesvmlasso
rf
ridgesvm
lassorf
ridge
svm lassorf
ridgesvm
lassorf
ridgesvm
lasso
rf
ridge
lasso
rf
ridgesvm lasso
rf
ridgesvm lasso
rf
ridgesvm lasso
rf
ridgesvm
lasso
rf
ridgesvm
lasso
rf
ridge
lassorf
ridgesvm lassorf
ridgesvm lassorf
ridgesvm lassorf
ridgesvm lassorf
ridgesvm
lassorf
ridge
lassorf
ridge
svmlasso
rf
ridge
svmlasso
rf
ridge
svm lassorf
ridge
svm lassorf
ridge
svm
lasso
rf
ridge
lassorf
ridgesvmlassorf
ridgesvmlassorf
ridgesvm lassorf
ridgesvmlassorf
ridgesvm
lassorf
ridge
lassorfridgesvm lassorf
ridgesvm lassorfridgesvm lassorf
ridgesvm lassorf
ridgesvm
lasso
rf
ridge
lasso
rf
ridge
svmlasso
rf
ridge
svmlasso
rf
ridge
svm
lasso
rf
ridge
svm
lasso
rf
ridge
svmlasso
rfridge
lasso
rf
ridge
svm
lasso
rf
ridge
svm
lasso
rf
ridge
svm
lasso
rf
ridge
svm
lasso
rf
ridge
svm lasso
rfridge
lassorf
ridgesvm lasso
rf
ridgesvmlasso
rf
ridge
svm lassorf
ridgesvm
lassorf
ridgesvm
lasso
rf
ridge
lasso
rf
ridgesvmlasso
rf
ridgesvm
lasso
rf
ridgesvm
lasso
rf
ridge
svmlasso
rf
ridgesvm
lasso
rf
ridge
lasso
rf
ridge
svmlasso
rf
ridge
svm
lasso
rf
ridge
svm
lasso
rf
ridge
svm
lasso
rf
ridge
svm
lasso
rf
ridge
lasso
rf
ridge
svm
lasso
rf
ridge
svm
lasso
rf
ridge
svm
lasso
rf
ridge
svm
lasso
rf
ridge
svm
lasso
rf
ridge
lasso
rf
ridgesvm
lasso
rf
ridgesvmlasso
rf
ridge
svm lassorf
ridgesvm
lassorf
ridgesvm
lasso
rf
ridge lasso
rf
ridgesvm
lasso
rf
ridgesvm
lasso
rf
ridgesvm
lasso
rf
ridge
svmlasso
rf
ridgesvm
lasso
rf
ridge
Accuracy
Sensitivity
Specificity
Precision
75
80
85
90
40
50
60
70
80
90
80
85
90
95
65
70
75
80
85
90
5000
wo−
g
2000
wo−
g
1000
wo−
g
500w
o−g
500w
ith−
g
1wo−
g
5000
wo−
f
2000
wo−
f
1000
wo−
f
500w
o−f
500w
ith−
f
1wo−
f
5000
wo−
g−o
2000
wo−
g−o
1000
wo−
g−o
500w
o−g−
o
500w
ith−
g−o
1wo−
g−o
5000
wo−
f−o
2000
wo−
f−o
1000
wo−
f−o
500w
o−f−
o
500w
ith−
f−o
1wo−
f−o
Fig. 3: Comparison of the quality of different classifiers through different quality measures (averaged on cross-validation folds).Labels on the x axis are written in the short form where wo stands for without background, with stands for with background,f stands for freq, g stands for graph, o at the end denotes that 0-1 matrices were used, and the numbers at the beginningrepresent numbers of generated events. 1-event experiments have a 2.3% smaller set of applications.
Frequency
Specificity (%)
Sen
sitiv
ity (
%)
8085
9095
100
100 80
Graph
Specificity (%)
Sen
sitiv
ity (
%)
8085
9095
100
100 80
Fig. 4: ROC curves created from 5-fold cross-validation with random forest model on X5000freq and X5000
graph matrices.
information about system calls through a community of users.A lightweight application, installed in the users’ devices,monitors system calls (frequency) of running applications andsends them to a centralized server. The server produces featurevectors and applies a K-means clustering to classify the ap-plications as malware or goodware. Crowdroid was evaluatedon a limited number of goodware applications and only 2 realmalware applications, obtaining detection accuracies of 100%for the first one and 85% for the second one.
VII. THREATS TO VALIDITY
Application Crashes. Given that Monkey generates sequencesof pseudo-random input events, it is to be expected that it candrive an application into a state that does not handle certainkinds of events, causing a crash. Depending on an experiment,we observed from 29% to 49% applications crash, which couldbias our empirical results. However, it is important to notethat the crash rate of goodware and malware applications isroughly the same. Therefore, application crashes do not bringin a classification bias.Age of Applications. Our goodware data set comprises ofapplications downloaded in 2014, while our malware applica-tions are from 2010 – 2012. Because the Android operatingsystem’s API evolved from 2010 to 2014, it could mean ourapproach learns differences between APIs, and not differencesbetween benign and malicious behaviors. Unfortunately, wecould not obtain older versions of applications from GooglePlay as it hosts only the most recent versions. In addition,to the best of our knowledge, a more recent malware dataset does not exist. Hence, we manually downloaded 2010– 2012 releases of 92 applications from F-Droid [52], anAndroid application repository offering multiple releases offree and open-source applications; we assumed the applica-tions to be benign. We classified them using MALINE, and wegot specificity of around 88%. Compared to the specificitiesfrom Figure 3, which were typically around 96%, this mightindicate that MALINE performs API difference learning tosome extent. However, a comparison with a much bigger setof the same applications across different releases would needto be performed to draw strong conclusions. This suggests thatthe difference in age of applications used in our experimentsdoes not create a considerable bias.Hidden Malicious Behavior. Malicious behavior may oc-casionally be hidden and triggered only under very specificcircumstances. As our approach is based on random testing,we might miss such hard-to-reach behaviors, which couldaffect our ability to detect such application as malicious. Suchmalware is not common though, and ultimately we consistentlyget sensitivity of 87% and more using MALINE.Detecting Emulation. As noted in previous work [35], [36],[53], malware could potentially detect it is running in anemulator, and alter its behavior accordingly. MALINE does notaddress this issue directly. However, an application trying todetect it is being executed in an emulator triggers numeroussystem calls, which likely leaves a specific signature that canbe detected by MALINE. We consistently get sensitivity of 87%
and more using MALINE. If we are to assume that all the re-maining malware went undetected only due to its capability ofdetecting the emulator and consequently changing its behaviorwithout leaving the system call signature, it is at most 13%of malware in our experiments that successfully disguise asgoodware. Finally, Chen et al. [35] show that only less than4% of malware in their experiments changes its behavior in avirtualized environment.System Architecture and Native Code. While the majorityof Android-powered devices are ARM-based, MALINE usesan x86-based Android emulator for performance reasons.Few Android applications — less than 5% according toZhou. et al. [54] — contain native libraries typically compiledfor multiple platforms, including x86, and hence they canbe executed with MALINE. Nonetheless, the ARM and x86system architectures have different system calls: with the x86-based and ARM-based emulator we observed applicationsutilizing 360 and 209 different system calls, respectively.Our initial implementation of MALINE was ARM-based, andswitching to an x86-based implementation yielded roughly thesame classification results in preliminary experiments, whileit greatly improved performance.Randomness in MALINE. We used only one seed value forMonkey’s pseudo-random number generator; it is possible theoutcome of our experiments would have been different ifanother seed value was used. However, as the seed value hasto be used consistently within an experiment consisting ofthousands of applications, it is highly unlikely the differencewould be significant.
VIII. CONCLUSIONS AND FUTURE WORK
We performed a preliminary feature selection exploration,but were not successful in obtaining consistent results. Thereason could he a high dimensionality of the classificationproblem (15,000 features for our dependency representation)or a strong correlation between features. We left a more exten-sive feature selection exploration for future work. Another ideawe want to explore in the future is combining several learningtechniques to investigate ensemble learning. We already do usea form of ensemble learning in the random forest algorithm,but we are planning to look at combinations of algorithms too.
In this paper, we proposed a free and open-source repro-ducible research environment MALINE for dynamic-analysis-based malware detection in Android. We performed an ex-tensive empirical evaluation of our novel system call en-coding into a feature vector representation against a well-known frequency representation across several dimensions.The novel encoding showed better quality than the frequencyrepresentation. Our evaluation provides numerous insights intothe structure of application executions, the impact of differentmachine learning techniques, and the type and size of inputsto dynamic analyses, serving as a guidance for future research.
ACKNOWLEDGMENTS
We thank Raimondas Sasnauskas for helping us with theAndroid platform, and Geof Sawaya for providing feedback
on an early draft of this paper. Thanks to Andreas Zeller andhis group for providing us with a tool for bulk applicationdownloading from Google Play, and the Flux Research Groupof the University of Utah for the Emulab infrastructure. Thiswork was supported in part by NSF CCF 1421678.
REFERENCES
[1] “IDC: Smartphone OS market share 2014, 2013, 2012,and 2011.” [Online]. Available: http://www.idc.com/prodserv/smartphone-os-market-share.jsp
[2] “Third annual mobile threats report: March 2012 through March2013,” Juniper Networks Mobile Threat Center (MTC). [Online].Available: http://www.juniper.net/us/en/local/pdf/additional-resources/3rd-jnpr-mobile-threats-report-exec-summary.pdf
[3] “Riskiq reports malicious mobile apps in google play have spiked nearly400 percent,” http://www.riskiq.com/company/press-releases/riskiq-reports-malicious-mobile-apps-google-play-have-spiked-nearly-400,2014.
[4] Y. Aafer, W. Du, and H. Yin, “DroidAPIMiner: Mining API-levelfeatures for robust malware detection in Android,” in Security andPrivacy in Communication Networks, 2013, pp. 86–103.
[5] M. Grace, Y. Zhou, Q. Zhang, S. Zou, and X. Jiang, “RiskRanker:scalable and accurate zero-day Android malware detection,” in 10thInternational Conference on Mobile Systems, Applications, and Services,2012, pp. 281–294.
[6] Y. Feng, S. Anand, I. Dillig, and A. Aiken, “Apposcopy: Semantics-based detection of android malware through static analysis,” in 22ndACM SIGSOFT International Symposium on Foundations of SoftwareEngineering (FSE), 2014, pp. 576–587.
[7] J. Crussell, C. Gibler, and H. Chen, “Attack of the clones: Detectingcloned applications on Android markets,” in Computer Security —ESORICS, 2012, vol. 7459, pp. 37–54.
[8] S. Hanna, L. Huang, E. Wu, S. Li, C. Chen, and D. Song, “Juxtapp: Ascalable system for detecting code reuse among android applications,”in Detection of Intrusions and Malware, and Vulnerability Assessment,2013, vol. 7591, pp. 62–81.
[9] H. Gascon, F. Yamaguchi, D. Arp, and K. Rieck, “Structural detectionof Android malware using embedded call graphs,” in ACM Workshopon Artificial Intelligence and Security, 2013, pp. 45–54.
[10] T. Blasing, L. Batyuk, A.-D. Schmidt, S. A. Camtepe, and S. Albayrak,“An Android Application Sandbox system for suspicious software de-tection,” in 5th International Conference on Malicious and UnwantedSoftware (MALWARE), 2010, pp. 55–62.
[11] A. Reina, A. Fattori, and L. Cavallaro, “A system call-centric analysisand stimulation technique to automatically reconstruct Android malwarebehaviors,” European Workshop on System Security, 2013.
[12] A. Lanzi, D. Balzarotti, C. Kruegel, M. Christodorescu, and E. Kirda,“AccessMiner: Using System-centric Models for Malware Protection,”in 17th ACM Conference on Computer and Communications Security(CCS), 2010, pp. 399–412.
[13] S. Palahan, D. Babic, S. Chaudhuri, and D. Kifer, “Extraction ofStatistically Significant Malware Behaviors,” in 29th Computer SecurityApplications Conference (ACSAC), 2013.
[14] T. Hastie, R. Tibshirani, and J. Friedman, The Elements of StatisticalLearning, 2nd ed. Springer, 2009.
[15] G. James, D. Witten, T. Hastie, and R. Tibshirani, An Introductionto Statistical Learning: with Applications in R, ser. Springer Texts inStatistics. Springer, 2013.
[16] I. Burguera, U. Zurutuza, and S. Nadjm-Tehrani, “Crowdroid: behavior-based malware detection system for Android,” in 1st ACM Workshop onSecurity and Privacy in Smartphones & Mobile Devices (SPSM), 2011,pp. 15–26.
[17] M. Fredrikson, S. Jha, M. Christodorescu, R. Sailer, and X. Yan,“Synthesizing near-optimal malware specifications from suspicious be-haviors,” in IEEE Symposium on Security and Privacy (SP), 2010, pp.45–60.
[18] C. Cortes and V. Vapnik, “Support-vector networks,” Machine Learning,vol. 20, no. 3, pp. 273–297, 1995.
[19] L. Breiman, “Random forests,” Machine Learning, vol. 45, no. 1, pp.5–32, 2001.
[20] R. Tibshirani, “Regression shrinkage and selection via the lasso,” Jour-nal of the Royal Statistical Society, Series B, vol. 58, pp. 267–288, 1994.
[21] A. Tikhonov and V. Arsenin, Solutions of ill-posed problems, ser. Scriptaseries in mathematics, 1977.
[22] T. Fawcett, “An introduction to ROC analysis,” Pattern RecognitionLetters, vol. 27, no. 8, pp. 861–874, 2006.
[23] M. Kuhn and K. Johnson, Applied Predictive Modeling.Springer, 2013. [Online]. Available: http://books.google.hr/books?id=xYRDAAAAQBAJ
[24] F. Bellard, “QEMU, a fast and portable dynamic translator,” in USENIXAnnual Technical Conference, FREENIX Track, 2005, pp. 41–46.
[25] “UI/application exerciser monkey.” [Online]. Available: http://developer.android.com/tools/help/monkey.html
[26] C.-C. Chang and C.-J. Lin, “LIBSVM: A library for support vectormachines,” ACM Transactions on Intelligent Systems and Technology,vol. 2, no. 3, pp. 27:1–27:27, 2011.
[27] “The R project for statistical computing.” [Online]. Available:http://www.r-project.org
[28] “Comprehensive R Archive Network (CRAN).” [Online]. Available:http://CRAN.R-project.org
[29] B. White, J. Lepreau, L. Stoller, R. Ricci, S. Guruprasad, M. Newbold,M. Hibler, C. Barb, and A. Joglekar, “An integrated experimentalenvironment for distributed systems and networks,” SIGOPS Oper. Syst.Rev., vol. 36, no. SI, pp. 255–270, 2002.
[30] D. Arp, M. Spreitzenbarth, M. Huebner, H. Gascon, and K. Rieck,“Drebin: Effective and explainable detection of android malware inyour pocket,” in 21st Annual Network and Distributed System SecuritySymposium (NDSS), 2014.
[31] Y. Zhou and X. Jiang, “Dissecting Android malware: Characterizationand evolution,” in IEEE Symposium on Security and Privacy (SP), 2012,pp. 95–109.
[32] M. Ojala and G. C. Garriga, “Permutation tests for studying classifierperformance,” The Journal of Machine Learning Research (JMLR),vol. 11, pp. 1833–1863, 2010.
[33] K. Rieck, P. Trinius, C. Willems, and T. Holz, “Automatic analysisof malware behavior using machine learning,” Journal of ComputerSecurity, vol. 19, no. 4, pp. 639–668, 2011.
[34] D. Y. Zhu, J. Jung, D. Song, T. Kohno, and D. Wetherall, “TaintEraser:Protecting sensitive data leaks using application-level taint tracking,”SIGOPS Operating System Review, vol. 45, no. 1, pp. 142–154, 2011.
[35] X. Chen, J. Andersen, Z. Mao, M. Bailey, and J. Nazario, “Towardsan understanding of anti-virtualization and anti-debugging behavior inmodern malware,” in IEEE International Conference on DependableSystems and Networks With FTCS and DCC, 2008. DSN 2008, 2008,pp. 177–186.
[36] R. Paleari, L. Martignoni, G. F. Roglia, and D. Bruschi, “A fistfulof red-pills: How to automatically generate procedures to detect CPUemulators,” in USENIX Workshop on Offensive Technologies (WOOT),2009.
[37] C. Kolbitsch, P. M. Comparetti, C. Kruegel, E. Kirda, X.-y. Zhou, andX. Wang, “Effective and Efficient Malware Detection at the End Host,”in USENIX Security Symposium, 2009, pp. 351–366.
[38] T. Singh, F. D. Troia, V. A. Corrado, T. H. Austin, and M. Stamp,“Support vector machines and malware detection,” Journal of ComputerVirology and Hacking Techniques, 2015.
[39] R. K. Jidigam, T. H. Austin, and M. Stamp, “Singular value decompo-sition and metamorphic detection,” Journal of Computer Virology andHacking Techniques, vol. 11, no. 4, 2014.
[40] F. Wei, S. Roy, X. Ou, and Robby, “Amandroid: A precise and generalinter-component data flow analysis framework for security vetting ofAndroid apps,” in ACM SIGSAC Conference on Computer and Commu-nications Security (CCS), 2014, pp. 1329–1341.
[41] A. Gorla, I. Tavecchia, F. Gross, and A. Zeller, “Checking app behavioragainst app descriptions,” in 36th International Conference on SoftwareEngineering (ICSE), 2014, pp. 1025–1035.
[42] A. P. Felt, E. Ha, S. Egelman, A. Haney, E. Chin, and D. Wagner,“Android permissions: User attention, comprehension, and behavior,” in8th Symposium on Usable Privacy and Security (SOUPS), 2012, pp.3:1–3:14.
[43] S. Liang, A. W. Keep, M. Might, S. Lyde, T. Gilray, P. Aldous,and D. Van Horn, “Sound and precise malware analysis for Androidvia pushdown reachability and entry-point saturation,” in 3rd ACMWorkshop on Security and Privacy in Smartphones & Mobile Devices(SPSM), 2013, pp. 21–32.
[44] S. Liang, W. Sun, and M. Might, “Fast flow analysis with Godel hashes,”in 14th International Working Conference on Source Code Analysis andManipulation (SCAM), 2014, pp. 225–234.
[45] S. Arzt, S. Rasthofer, C. Fritz, E. Bodden, A. Bartel, J. Klein,Y. Le Traon, D. Octeau, and P. McDaniel, “FlowDroid: Precise context,flow, field, object-sensitive and lifecycle-aware taint analysis for Androidapps,” in 35th ACM SIGPLAN Conference on Programming LanguageDesign and Implementation (PLDI), 2014, pp. 259–269.
[46] A. P. Felt, E. Chin, S. Hanna, D. Song, and D. Wagner, “Androidpermissions demystified,” in 18th ACM Conference on Computer andCommunications Security (CCS), 2011, pp. 627–638.
[47] E. William, D. Octeau, P. McDaniel, and S. Chaudhuri, “A study ofAndroid application security,” in USENIX Security Symposium, 2011.
[48] W. Yang, X. Xiao, B. Andow, S. Li, T. Xie, and E. William, “Appcon-text: Differentiating malicious and benign mobile app behavior undercontexts,” in International Conference on Software Engineering (ICSE),2015, to appear.
[49] W. Enck, P. Gilbert, B.-G. Chun, L. P. Cox, J. Jung, P. McDaniel, andA. N. Sheth, “Taintdroid: An information-flow tracking system for re-altime privacy monitoring on smartphones,” in 9th USENIX Conferenceon Operating Systems Design and Implementation (OSDI), 2010, pp.
1–6.[50] L. K. Yan and H. Yin, “Droidscope: Seamlessly reconstructing the OS
and Dalvik semantic views for dynamic Android malware analysis,” in21st USENIX Security Symposium, 2012.
[51] G. Dini, F. Martinelli, A. Saracino, and D. Sgandurra, “MADAM:A multi-level anomaly detector for Android malware,” in ComputerNetwork Security (CNS), 2012, pp. 240–253.
[52] “F-droid, free and open source android app repository.” [Online].Available: https://f-droid.org/
[53] Y. Jing, Z. Zhao, G.-J. Ahn, and H. Hu, “Morpheus: automaticallygenerating heuristics to detect Android emulators,” in Proceedings ofthe 30th Annual Computer Security Applications Conference, 2014, pp.216–225.
[54] Y. Zhou, Z. Wang, W. Zhou, and X. Jiang, “Hey, you, get off of mymarket: Detecting malicious apps in official and alternative Androidmarkets,” in Proceedings of the 19th Annual Network and DistributedSystem Security Symposium, 2012.
APPENDIX
rf rf rf rf rf
rf
rf rf rf rf rf
rfrf rf rf rf rf
rf rf rf rf rf rf
rf
rf−d
rf−u
rf−drf−u
rf−drf−u
rf−d
rf−urf−drf−u
rf−drf−u
rf−drf−u
rf−d
rf−urf−drf−u
rf−drf−u
rf−drf−u
rf−d
rf−urf−d
rf−u
rf−drf−u
rf−drf−u
rf−d
rf−urf−drf−u
rf−drf−u
rf−drf−u
rf−drf−u
rf−d
rf−u
rf−drf−u
rf−d
rf−u
rf−d
rf−u
rf rf rf rf rf
rf
rf rf rf rf rf
rf
rf rf rf rf rf
rf rf rf rf rf rf
rf
rf−drf−u
rf−drf−urf−drf−u
rf−drf−u
rf−drf−u
rf−drf−urf−drf−u
rf−drf−u
rf−drf−u
rf−drf−urf−drf−u
rf−drf−u
rf−drf−u
rf−drf−urf−drf−u
rf−drf−u
rf−drf−u
rf−drf−urf−drf−u
rf−drf−u
rf−d
rf−u
rf−drf−urf−d
rf−urf−drf−u
rf rf rf rf rf rf rf rf rf rf rf rf rf rf rf rf rf rf rf rf rf rf rf rfrf−drf−u
rf−drf−urf−drf−u
rf−drf−urf−d
rf−u
rf−drf−u
rf−drf−u
rf−drf−urf−d
rf−u
rf−drf−urf−drf−u
rf−drf−urf−d
rf−u
rf−drf−urf−drf−u
rf−drf−urf−d
rf−u
rf−drf−urf−drf−u
rf−drf−u
rf−d
rf−u
rf−drf−u
rf−d
rf−u
rf−drf−u
rf rf rf rf rfrf
rf rf rf rf rfrf rf rf rf rf rf
rf rf rf rf rf rfrf
rf−drf−u
rf−drf−urf−drf−u
rf−drf−urf−d
rf−u
rf−drf−u
rf−drf−u
rf−drf−urf−d
rf−u
rf−drf−u
rf−drf−u
rf−drf−urf−d
rf−u
rf−drf−urf−drf−u
rf−drf−urf−d
rf−u
rf−drf−u
rf−drf−u
rf−drf−u
rf−d
rf−u
rf−drf−u
rf−d
rf−u
rf−d
rf−u
Accuracy
Sensitivity
Specificity
Precision
84
88
92
96
70
80
90
80
85
90
95
80
85
90
95
5000
wo−
g
2000
wo−
g
1000
wo−
g
500w
o−g
500w
ith−
g
1wo−
g
5000
wo−
f
2000
wo−
f
1000
wo−
f
500w
o−f
500w
ith−
f
1wo−
f
5000
wo−
g−o
2000
wo−
g−o
1000
wo−
g−o
500w
o−g−
o
500w
ith−
g−o
1wo−
g−o
5000
wo−
f−o
2000
wo−
f−o
1000
wo−
f−o
500w
o−f−
o
500w
ith−
f−o
1wo−
f−o
Fig. 5: Comparison of the quality of random forest classifier with up- and down-sampling on different initial data sets (averagedon 5 cross-validation folds). Labels on the x axis are written in the short form where wo stands for without background, withstands for with background, f stands for freq, g stands for graph, o at the end denotes that 0-1 matrices were used, and thenumbers at the beginning represent number of events used. In the names of classifiers -u denotes up-sampling while -d denotesdown-sampling.
Frequency
Specificity (%)
Sen
sitiv
ity (
%)
8085
9095
100
100 80
Graph
Specificity (%)
Sen
sitiv
ity (
%)
8085
9095
100
100 80
Fig. 6: ROC curves created from 5-fold cross-validation with random forest model on X5000freq and X5000
graph feature matrices withup-sampling.
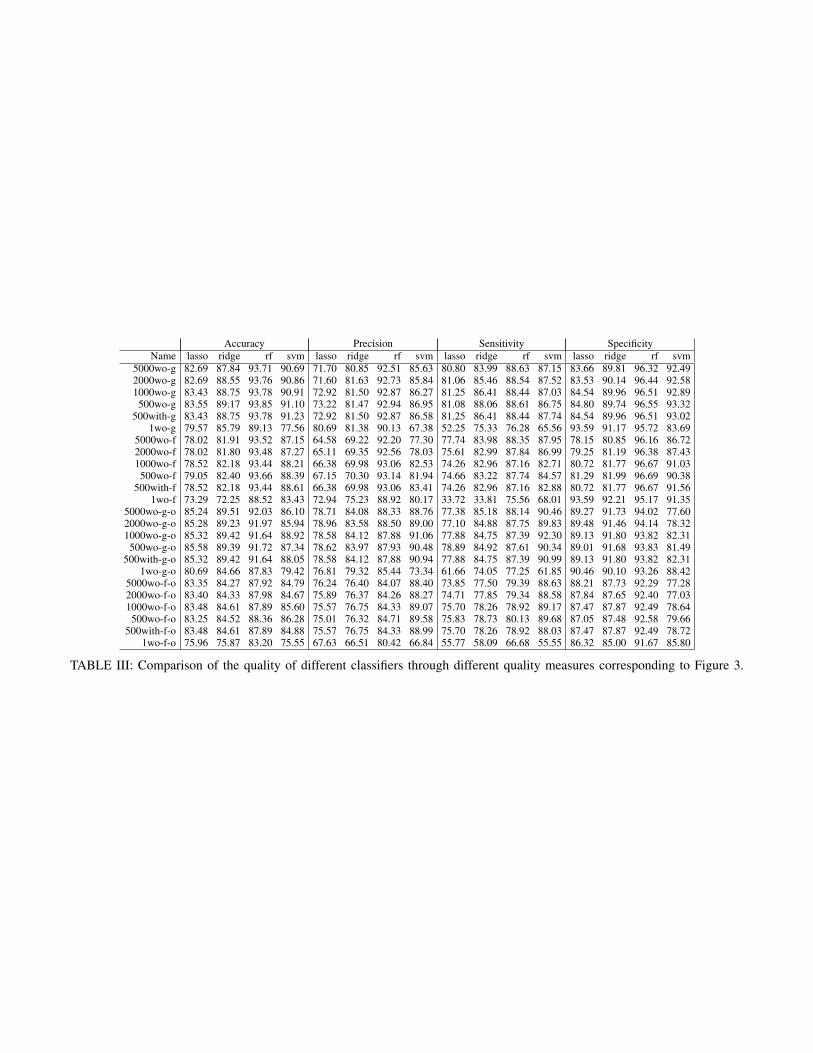
Accuracy Precision Sensitivity SpecificityName lasso ridge rf svm lasso ridge rf svm lasso ridge rf svm lasso ridge rf svm
5000wo-g 82.69 87.84 93.71 90.69 71.70 80.85 92.51 85.63 80.80 83.99 88.63 87.15 83.66 89.81 96.32 92.492000wo-g 82.69 88.55 93.76 90.86 71.60 81.63 92.73 85.84 81.06 85.46 88.54 87.52 83.53 90.14 96.44 92.581000wo-g 83.43 88.75 93.78 90.91 72.92 81.50 92.87 86.27 81.25 86.41 88.44 87.03 84.54 89.96 96.51 92.89500wo-g 83.55 89.17 93.85 91.10 73.22 81.47 92.94 86.95 81.08 88.06 88.61 86.75 84.80 89.74 96.55 93.32
500with-g 83.43 88.75 93.78 91.23 72.92 81.50 92.87 86.58 81.25 86.41 88.44 87.74 84.54 89.96 96.51 93.021wo-g 79.57 85.79 89.13 77.56 80.69 81.38 90.13 67.38 52.25 75.33 76.28 65.56 93.59 91.17 95.72 83.69
5000wo-f 78.02 81.91 93.52 87.15 64.58 69.22 92.20 77.30 77.74 83.98 88.35 87.95 78.15 80.85 96.16 86.722000wo-f 78.02 81.80 93.48 87.27 65.11 69.35 92.56 78.03 75.61 82.99 87.84 86.99 79.25 81.19 96.38 87.431000wo-f 78.52 82.18 93.44 88.21 66.38 69.98 93.06 82.53 74.26 82.96 87.16 82.71 80.72 81.77 96.67 91.03500wo-f 79.05 82.40 93.66 88.39 67.15 70.30 93.14 81.94 74.66 83.22 87.74 84.57 81.29 81.99 96.69 90.38
500with-f 78.52 82.18 93.44 88.61 66.38 69.98 93.06 83.41 74.26 82.96 87.16 82.88 80.72 81.77 96.67 91.561wo-f 73.29 72.25 88.52 83.43 72.94 75.23 88.92 80.17 33.72 33.81 75.56 68.01 93.59 92.21 95.17 91.35
5000wo-g-o 85.24 89.51 92.03 86.10 78.71 84.08 88.33 88.76 77.38 85.18 88.14 90.46 89.27 91.73 94.02 77.602000wo-g-o 85.28 89.23 91.97 85.94 78.96 83.58 88.50 89.00 77.10 84.88 87.75 89.83 89.48 91.46 94.14 78.321000wo-g-o 85.32 89.42 91.64 88.92 78.58 84.12 87.88 91.06 77.88 84.75 87.39 92.30 89.13 91.80 93.82 82.31500wo-g-o 85.58 89.39 91.72 87.34 78.62 83.97 87.93 90.48 78.89 84.92 87.61 90.34 89.01 91.68 93.83 81.49
500with-g-o 85.32 89.42 91.64 88.05 78.58 84.12 87.88 90.94 77.88 84.75 87.39 90.99 89.13 91.80 93.82 82.311wo-g-o 80.69 84.66 87.83 79.42 76.81 79.32 85.44 73.34 61.66 74.05 77.25 61.85 90.46 90.10 93.26 88.42
5000wo-f-o 83.35 84.27 87.92 84.79 76.24 76.40 84.07 88.40 73.85 77.50 79.39 88.63 88.21 87.73 92.29 77.282000wo-f-o 83.40 84.33 87.98 84.67 75.89 76.37 84.26 88.27 74.71 77.85 79.34 88.58 87.84 87.65 92.40 77.031000wo-f-o 83.48 84.61 87.89 85.60 75.57 76.75 84.33 89.07 75.70 78.26 78.92 89.17 87.47 87.87 92.49 78.64500wo-f-o 83.25 84.52 88.36 86.28 75.01 76.32 84.71 89.58 75.83 78.73 80.13 89.68 87.05 87.48 92.58 79.66
500with-f-o 83.48 84.61 87.89 84.88 75.57 76.75 84.33 88.99 75.70 78.26 78.92 88.03 87.47 87.87 92.49 78.721wo-f-o 75.96 75.87 83.20 75.55 67.63 66.51 80.42 66.84 55.77 58.09 66.68 55.55 86.32 85.00 91.67 85.80
TABLE III: Comparison of the quality of different classifiers through different quality measures corresponding to Figure 3.