ancient dna perspectives on american colonization and population history
TRANSCRIPT
Ancient DNA Perspectives on American Colonizationand Population History
Jennifer A. Raff,1,2* Deborah A. Bolnick,3 Justin Tackney,1 and Dennis H. O’Rourke1
1Department of Anthropology, University of Utah, Salt Lake City, UT2Department of Medicine, Endocrinology Division, Feinberg School of Medicine, Northwestern University3Department of Anthropology, University of Texas, Austin, TX
KEY WORDS Americas; ancient DNA; genetics
ABSTRACT Ancient DNA (aDNA) analyses have pro-ven to be important tools in understanding human popu-lation dispersals, settlement patterns, interactionsbetween prehistoric populations, and the development ofregional population histories. Here, we review the pub-lished results of sixty-three human populations fromthroughout the Americas and compare the levels of di-versity and geographic patterns of variation in the an-cient samples with contemporary genetic variation in theAmericas in order to investigate the evolution of theNative American gene pool over time. Our analysis of
mitochondrial haplogroup frequencies and prehistoricpopulation genetic diversity presents a complex evolu-tionary picture. Although the broad genetic structure ofAmerican prehistoric populations appears to have beenestablished relatively early, we nevertheless identifyexamples of genetic discontinuity over time in selectregions. We discuss the implications this finding mayhave for our interpretation of the genetic evidence forthe initial colonization of the Americas and its subse-quent population history. Am J Phys Anthropol 146:503–514, 2011. VVC 2011 Wiley Periodicals, Inc.
Since the early reviews by O’Rourke et al. (2000a) andKaestle and Horsburgh (2002), ancient DNA (aDNA)studies have continued to shed light on regional prehis-tory, the distribution of pathogens and disease in ancientAmerica, and the effects of evolutionary forces on NativeAmerican population genetic structure. A few studieshave also attempted to use aDNA analyses to addresslarger questions of inter-continental colonizations and/orpopulation movements (e.g., Kemp et al., 2007; Rasmus-sen et al., 2010). In this article, we have two primaryaims. First, we review the findings of ancient mitochon-drial DNA (mtDNA) studies published over the last sev-eral years. Second, we draw on these studies to comparethe published mtDNA haplogroup frequencies of ancientand modern Native American populations in order toextend the earlier analyses of O’Rourke et al. (2000b)and provide a comprehensive geographic and temporalpicture of Native American genetic diversity. Documen-tation of the extent and patterning of ancient geneticvariation relative to modern populations will yield im-portant insights into the evolutionary forces that gaverise to the modern Native American gene pool and per-mit more informed hypotheses regarding the origin andhistory of populations in this hemisphere.Although the timing, geographic routes, and number
of initial colonizations into the Western Hemisphere arestill contested, it is widely agreed that all genetic compo-nents of Native American populations—except those dueto more recent demographic collapse and admixture frompost-1492 European contact—trace their origins to asampling of Asian populations before the last glacialmaximum (LGM) (Tamm et al., 2007; Wang et al., 2007;Fagundes et al., 2008; Gonzalez-Jose et al., 2008; Mulli-gan et al., 2008; Schroeder et al., 2009; Yang et al.,2010). Following the LGM, founder effects and other evo-lutionary processes further shaped Native Americangenetic variation during the expansion into the Ameri-can continents. The archaeological evidence, hypothetical
demographic models of colonizing populations, andgenetic signatures of the peopling of the Americasobserved in modern populations have been reviewedrecently elsewhere (Goebel et al., 2008; Kemp andSchurr, 2010; O’Rourke and Raff, 2010; Perego et al.,2010).Ancient DNA studies are uniquely situated to investi-
gate the extent and patterns of genetic diversity in pastpopulations and the results of gene flow, genetic drift,and population bottlenecks across time and space. aDNAstudies provide important benchmarks not only for eval-uation of coalescent models in genome evolution but alsofor testing general demographic models of the develop-ment of genetic diversity in colonizing populations, andfor beginning to critically evaluate alternative scenariosbearing on the dispersal of populations into the Ameri-cas. As a starting point for evaluating alternative migra-tion scenarios, we compare patterns of genetic variabilityin ancient and contemporary populations in the Ameri-cas. Since the vast majority of aDNA studies havefocused on mtDNA, because of its high copy number percell, maternal inheritance, and rapid evolution, we also
Additional Supporting Information may be found in the onlineversion of this article.
Jennifer A. Raff and Deborah A. Bolnick contributed equally tothis manuscript.
*Correspondence to: Jennifer A. Raff, Department of Medicine En-docrinology Division, Feinberg School of Medicine, NorthwesternUniversity, Chicago IL 606-3008. E-mail: [email protected]
Received 25 March 2011; accepted 7 July 2011
DOI 10.1002/ajpa.21594Published online 13 September 2011 in Wiley Online Library
(wileyonlinelibrary.com).
VVC 2011 WILEY PERIODICALS, INC.
AMERICAN JOURNAL OF PHYSICAL ANTHROPOLOGY 146:503–514 (2011)
focus our attention on variation in this genome.Although a few aDNA studies have also evaluated Y-chromosome haplotypes, too few such studies exist to beinformative in a continental survey. Accordingly, we donot include Y-chromosome diversity in our review.
ANCIENT DNA VARIATION IN THE AMERICAS
Both archaeological research and studies of genetic di-versity in modern populations indicate an initial coloni-zation of the Americas sometime before 15,000 yearsbefore present (YBP). However, the vast majority ofaDNA studies on prehistoric American populations arebased on samples dating to the last 5,000 years. Thehandful of older aDNA results in the Americas postdatethe estimated colonization time(s) by several thousandsof years (Smith et al., 2005; Kemp et al., 2007; Gilbert etal., 2008a; Kemp and Schurr, 2010). Moreover, the ear-liest samples studied, those most likely to be most in-formative for colonization questions, are from single indi-viduals, rendering most standard population genetic an-alytical methods inappropriate. Although the presence ofspecific haplotypes at early points in time can be con-firmed with small numbers of older samples, genetic di-versity in a larger cross section of population(s) before orconcurrent with the continental colonization cannot beascertained from such data. Furthermore, ancient DNAstudies focused on more recent remains investigate di-versity patterns that have been shaped by thousands ofyears of demographic processes within the Americas.These more recent prehistoric populations are not appro-priate stand-ins for the initial inferred source popula-tion, but they are informative for questions of regionalprehistory that do not require great time depth. Prehis-toric population movements, for example, can be reliablytracked with the larger sample sizes and tighter chrono-logical control characteristic of many aDNA studies withsamples from the past few thousand years. Such studiesalso provide a baseline from which to view the geo-graphic pattern of variation in modern Native Americanpopulations, and they provide a benchmark from whichto evaluate coalescent models for the origin of the Ameri-can Indian/Alaska Native gene pool.In what follows, we summarize and evaluate the
results from ancient DNA studies published in the lastdozen years that may inform our understanding of thecolonization and population history of the Americas. Webegin with a review of the studies on the earliest materi-als available from the Americas, followed by a summaryand analysis of temporally more recent material by geo-graphic area.
Mitochondrial markers and terminology
Because various screening methods have been used inaDNA studies, and because there is not yet a standar-dized nomenclature in mitochondrial genetics (but seeKemp and Schurr, 2010), we use the following definitionsto simplify our discussion and, hopefully, reduce confu-sion. Haplogroup is used to signify a group of mtDNAsthat share a defined set of marker states, either in thefirst hypervariable region (HVS I) or the coding region ofthe molecule, and are therefore considered to be phyloge-netically related. We use the term haplotype to refer todistinct subsets of mtDNAs within a haplogroup thatshare one or more variants in common beyond thoseused to define the haplogroup. There are currently fif-
teen recognized founding mtDNA haplotypes in theAmericas (Perego et al., 2010). Sequence variants usedto define haplogroups and haplotypes are summarized inO’Rourke and Raff (2010) and Van Oven and Kayser(2009). Finally, we use the term lineage to indicate thepresence of additional variants beyond those that definehaplotypes.
METHODS
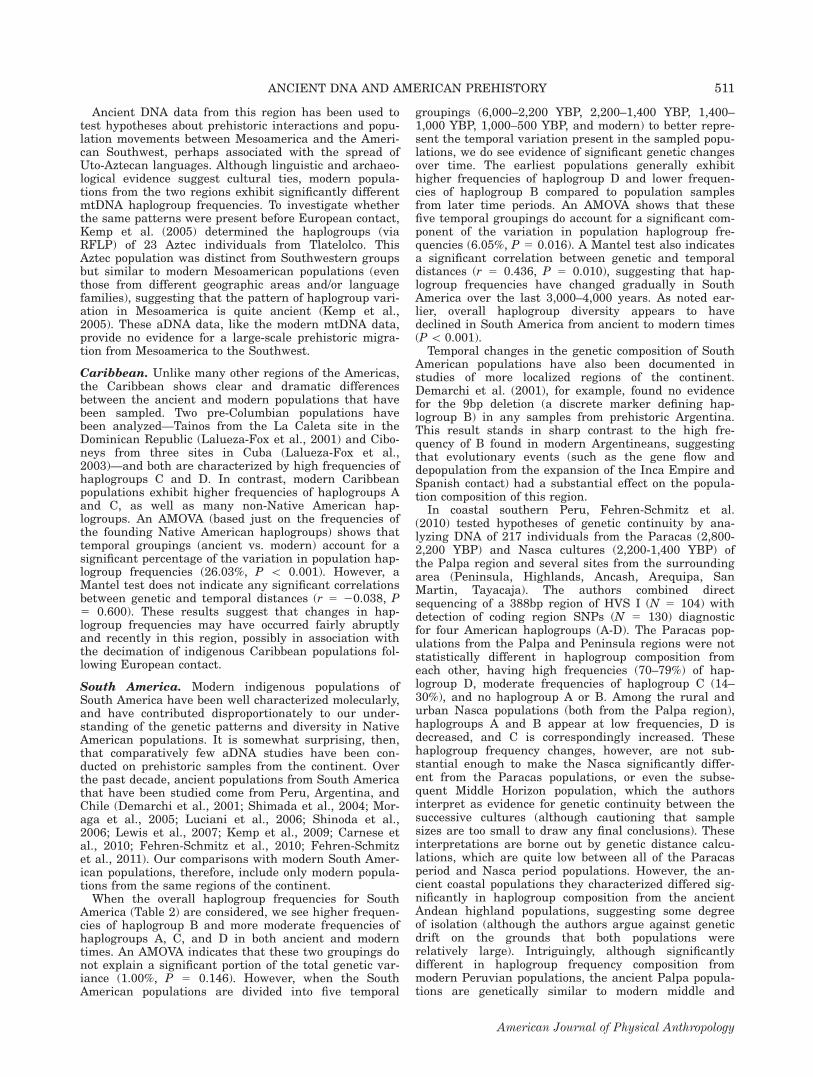
Because of the focus in early aDNA studies on a verylimited number of restriction sites and a length polymor-phism, the most useful comparison among all aDNAsamples published over the last few years is by mtDNAhaplogroup. Accordingly, mtDNA haplogroup frequenciesfor the ancient populations discussed here are given inTable 1, and geographic locations for all populations areshown in Figure 1. We also compiled haplogroup fre-quency data (from the published literature) for 98 mod-ern Native American populations from the regions ofNorth and South America where ancient populationshave been studied (Supporting Information Table 1). Toevaluate the extent of differentiation among populationsgrouped both geographically and temporally (usually an-cient vs. modern, but additional temporal categorieswere added when the data permitted), we performedanalyses of molecular variance (AMOVA) in the com-puter package Arlequin 3.5 (Excoffier and Lischer, 2010).FST values were estimated for population pairs and Man-tel tests were performed in Arlequin 3.5 to assess corre-lations between genetic distances and temporal distances(in years) to evaluate the role of time on population dif-ferentiation. If the samples in an ancient populationspanned an extended time period, the average time wasused in calculating temporal distances (but see our com-ments on the limitations of this approach below). Re-gional haplogroup frequencies in ancient and moderntimes were also calculated (Table 2), and principal com-ponents analysis (PCA) was performed using R version2.10.1 (R Development Core Team, 2009) to illustrategenetic similarities and differences. The first two princi-pal components are reported, representing 64.2% of theobserved haplogroup variation.Finally, haplogroup diversities (h) for populations (Ta-
ble 1) and geographic regions (Table 2) were calculatedusing Arlequin 3.5. We performed a linear regression ofpopulation haplogroup diversity on time in R to investi-gate changes in haplogroup diversity levels over time,and an analysis of variance (ANOVA) was conductedusing R to assess the influence of temporal and geo-graphic groupings on population haplogroup diversities.We also used t-tests to compare the overall haplogroupdiversity in ancient and modern times for each geo-graphic region. It should be noted that the regional esti-mates of ancient haplogroup diversity/haplogroup fre-quencies represent composite measures based on popula-tion samples that may span many centuries. We are wellaware of the difficulties inherent in using temporally dis-persed samples from aDNA studies in population geneticanalyses. We employ these methods here as a firstapproximation to evaluating stasis or change in geneticstructure over time, but believe the results should beviewed more properly as qualitative rather than quanti-tative assessments. As such, they may serve as guide-lines for future research in American population historyusing modern genomic methods.
504 J.A. RAFF ET AL.
American Journal of Physical Anthropology
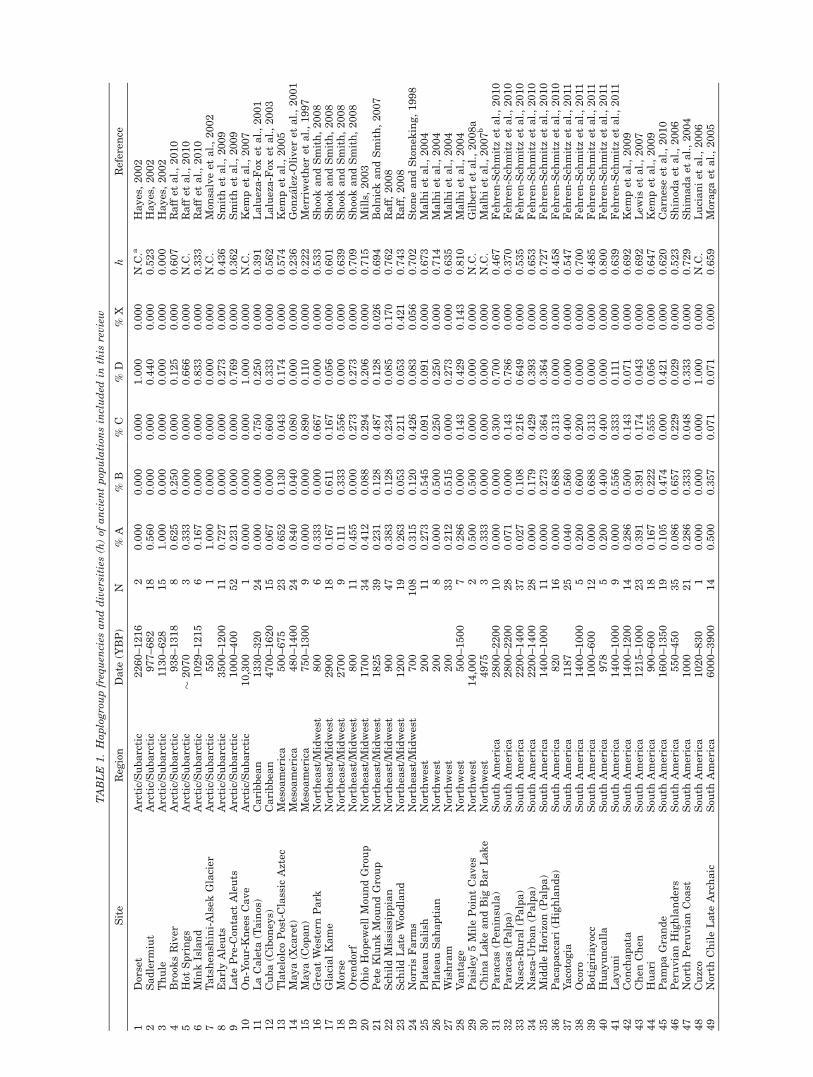
TABLE
1.Haplogroupfrequen
cies
anddiversities
(h)of
ancien
tpop
ulation
sincluded
inthis
review
Site
Reg
ion
Date
(YBP)
N%
A%
B%
C%
D%
Xh
Referen
ce
1Dorset
Arctic/Subarctic
2260–1216
20.000
0.000
0.000
1.000
0.000
N.C.a
Hayes,2002
2Sadlerm
iut
Arctic/Subarctic
977–682
18
0.560
0.000
0.000
0.440
0.000
0.523
Hayes,2002
3Thule
Arctic/Subarctic
1130–628
15
1.000
0.000
0.000
0.000
0.000
0.000
Hayes,2002
4Brook
sRiver
Arctic/Subarctic
938–1318
80.625
0.250
0.000
0.125
0.000
0.607
Raffet
al.,2010
5Hot
Springs
Arctic/Subarctic
�2070
30.333
0.000
0.000
0.666
0.000
N.C.
Raffet
al.,2010
6MinkIsland
Arctic/Subarctic
1029–1215
60.167
0.000
0.000
0.833
0.000
0.333
Raffet
al.,2010
7Tatshen
shini-Alsek
Glacier
Arctic/Subarctic
550
11.000
0.000
0.000
0.000
0.000
N.C.
Mon
salveet
al.,2002
8EarlyAleuts
Arctic/Subarctic
3500–1200
110.727
0.000
0.000
0.273
0.000
0.436
Smithet
al.,2009
9Late
Pre-C
ontact
Aleuts
Arctic/Subarctic
1000–400
52
0.231
0.000
0.000
0.769
0.000
0.362
Smithet
al.,2009
10
On-You
r-Knee
sCave
Arctic/Subarctic
10,300
10.000
0.000
0.000
1.000
0.000
N.C.
Kem
pet
al.,2007
11LaCaleta
(Tainos)
Caribbea
n1330–320
24
0.000
0.000
0.750
0.250
0.000
0.391
Lalueza-Fox
etal.,2001
12
Cuba(C
ibon
eys)
Caribbea
n4700–1620
15
0.067
0.000
0.600
0.333
0.000
0.562
Lalueza-Fox
etal.,2003
13
TlatelolcoPost-Classic
Aztec
Mesoa
merica
500–675
23
0.652
0.130
0.043
0.174
0.000
0.574
Kem
pet
al.,2005
14
Maya(X
caret)
Mesoa
merica
480–1400
24
0.840
0.040
0.080
0.000
0.000
0.236
Gon
zalez-Oliver
etal.,2001
15
Maya(C
opan)
Mesoa
merica
750–1300
90.000
0.000
0.890
0.110
0.000
0.222
Merriwether
etal.,1997
16
GreatWestern
Park
Northea
st/M
idwest
800
60.333
0.000
0.667
0.000
0.000
0.533
Shoo
kandSmith,2008
17
GlacialKame
Northea
st/M
idwest
2900
18
0.167
0.611
0.167
0.056
0.000
0.601
Shoo
kandSmith,2008
18
Morse
Northea
st/M
idwest
2700
90.111
0.333
0.556
0.000
0.000
0.639
Shoo
kandSmith,2008
19
Orendorf
Northea
st/M
idwest
800
110.455
0.000
0.273
0.273
0.000
0.709
Shoo
kandSmith,2008
20
Ohio
Hop
ewellMou
ndGroup
Northea
st/M
idwest
1700
34
0.412
0.088
0.294
0.206
0.000
0.715
Mills,2003
21
PeteKlunkMou
ndGroup
Northea
st/M
idwest
1825
39
0.231
0.128
0.487
0.128
0.026
0.694
BolnickandSmith,2007
22
Sch
ildMississippian
Northea
st/M
idwest
900
47
0.383
0.128
0.234
0.085
0.170
0.762
Raff,2008
23
Sch
ildLate
Woo
dland
Northea
st/M
idwest
1200
19
0.263
0.053
0.211
0.053
0.421
0.743
Raff,2008
24
NorrisFarm
sNorthea
st/M
idwest
700
108
0.315
0.120
0.426
0.083
0.056
0.702
StoneandStonek
ing,1998
25
PlateauSalish
Northwest
200
110.273
0.545
0.091
0.091
0.000
0.673
Malhiet
al.,2004
26
PlateauSahaptian
Northwest
200
80.000
0.500
0.250
0.250
0.000
0.714
Malhiet
al.,2004
27
Wishram
Northwest
200
33
0.212
0.515
0.000
0.273
0.000
0.635
Malhiet
al.,2004
28
Vantage
Northwest
500–1500
70.286
0.000
0.143
0.429
0.143
0.810
Malhiet
al.,2004
29
Paisley5MilePointCaves
Northwest
14,000
20.500
0.500
0.000
0.000
0.000
N.C.
Gilbertet
al.,2008a
30
ChinaLakeandBig
BarLake
Northwest
4975
30.333
0.000
0.000
0.000
0.000
N.C.
Malhiet
al.,2007b
31
Paracas(Pen
insu
la)
Sou
thAmerica
2800–2200
10
0.000
0.000
0.300
0.700
0.000
0.467
Feh
ren-Sch
mitzet
al.,2010
32
Paracas(Palpa)
Sou
thAmerica
2800–2200
28
0.071
0.000
0.143
0.786
0.000
0.370
Feh
ren-Sch
mitzet
al.,2010
33
Nasca-R
ural(Palpa)
Sou
thAmerica
2200–1400
37
0.027
0.108
0.216
0.649
0.000
0.535
Feh
ren-Sch
mitzet
al.,2010
34
Nasca-U
rban(Palpa)
Sou
thAmerica
2200–1400
28
0.000
0.179
0.429
0.393
0.000
0.653
Feh
ren-Sch
mitzet
al.,2010
35
Middle
Horizon
(Palpa)
Sou
thAmerica
1400–1000
110.000
0.273
0.364
0.364
0.000
0.727
Feh
ren-Sch
mitzet
al.,2010
36
Pacapaccari
(Highlands)
Sou
thAmerica
820
16
0.000
0.688
0.313
0.000
0.000
0.458
Feh
ren-Sch
mitzet
al.,2010
37
Yacotogia
Sou
thAmerica
1187
25
0.040
0.560
0.400
0.000
0.000
0.547
Feh
ren-Sch
mitzet
al.,2011
38
Ocoro
Sou
thAmerica
1400–1000
50.200
0.600
0.200
0.000
0.000
0.700
Feh
ren-Sch
mitzet
al.,2011
39
Botigiriayocc
Sou
thAmerica
1000–600
12
0.000
0.688
0.313
0.000
0.000
0.485
Feh
ren-Sch
mitzet
al.,2011
40
Huayuncalla
Sou
thAmerica
978
50.200
0.400
0.400
0.000
0.000
0.800
Feh
ren-Sch
mitzet
al.,2011
41
Layuni
Sou
thAmerica
1400–1000
90.000
0.556
0.333
0.111
0.000
0.639
Feh
ren-Sch
mitzet
al.,2011
42
Con
chapata
Sou
thAmerica
1400–1200
14
0.286
0.500
0.143
0.071
0.000
0.692
Kem
pet
al.,2009
43
Chen
Chen
Sou
thAmerica
1215–1000
23
0.391
0.391
0.174
0.043
0.000
0.692
Lew
iset
al.,2007
44
Huari
Sou
thAmerica
900–600
18
0.167
0.222
0.555
0.056
0.000
0.647
Kem
pet
al.,2009
45
PampaGrande
Sou
thAmerica
1600–1350
19
0.105
0.474
0.000
0.421
0.000
0.620
Carn
eseet
al.,2010
46
PeruvianHighlanders
Sou
thAmerica
550–450
35
0.086
0.657
0.229
0.029
0.000
0.523
Shinod
aet
al.,2006
47
North
PeruvianCoa
stSou
thAmerica
1000
21
0.286
0.333
0.048
0.333
0.000
0.729
Shim
adaet
al.,2004
48
Cuzco
Sou
thAmerica
1020–830
10.000
0.000
0.000
1.000
0.000
N.C.
Lucianiet
al.,2006
49
North
ChileLate
Archaic
Sou
thAmerica
6000–3900
14
0.500
0.357
0.071
0.071
0.000
0.659
Moragaet
al.,2005
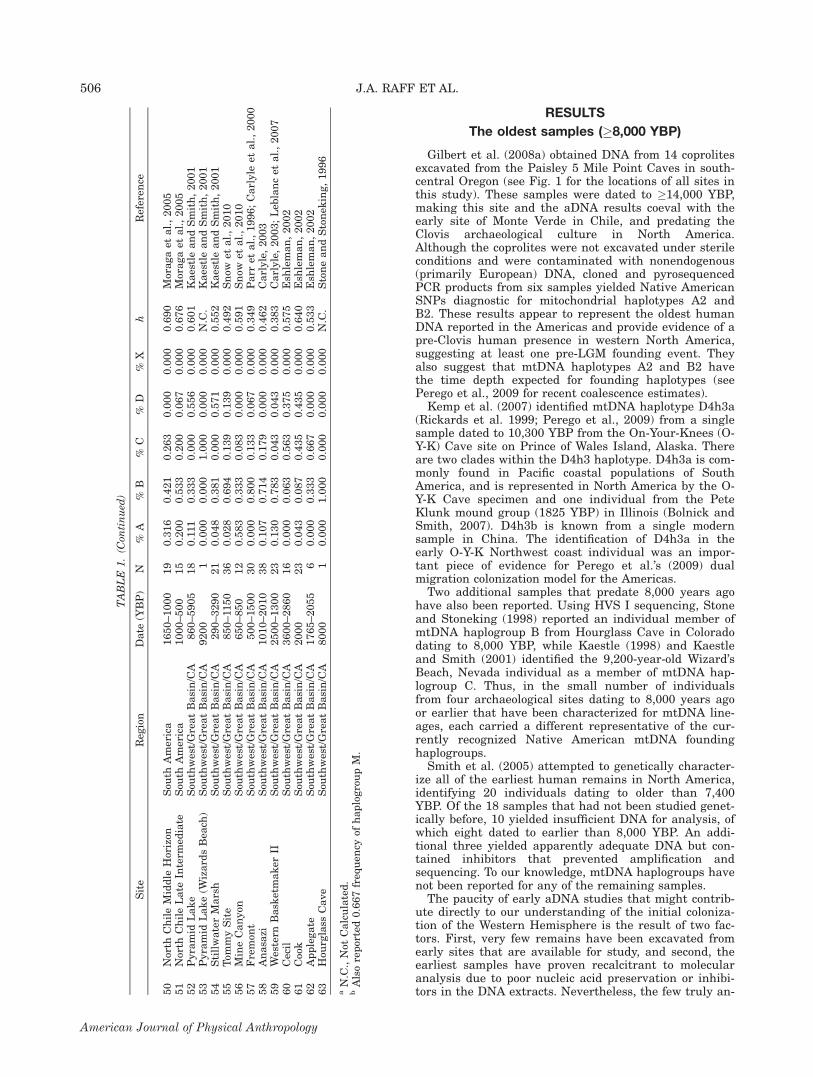
RESULTS
The oldest samples (�8,000 YBP)
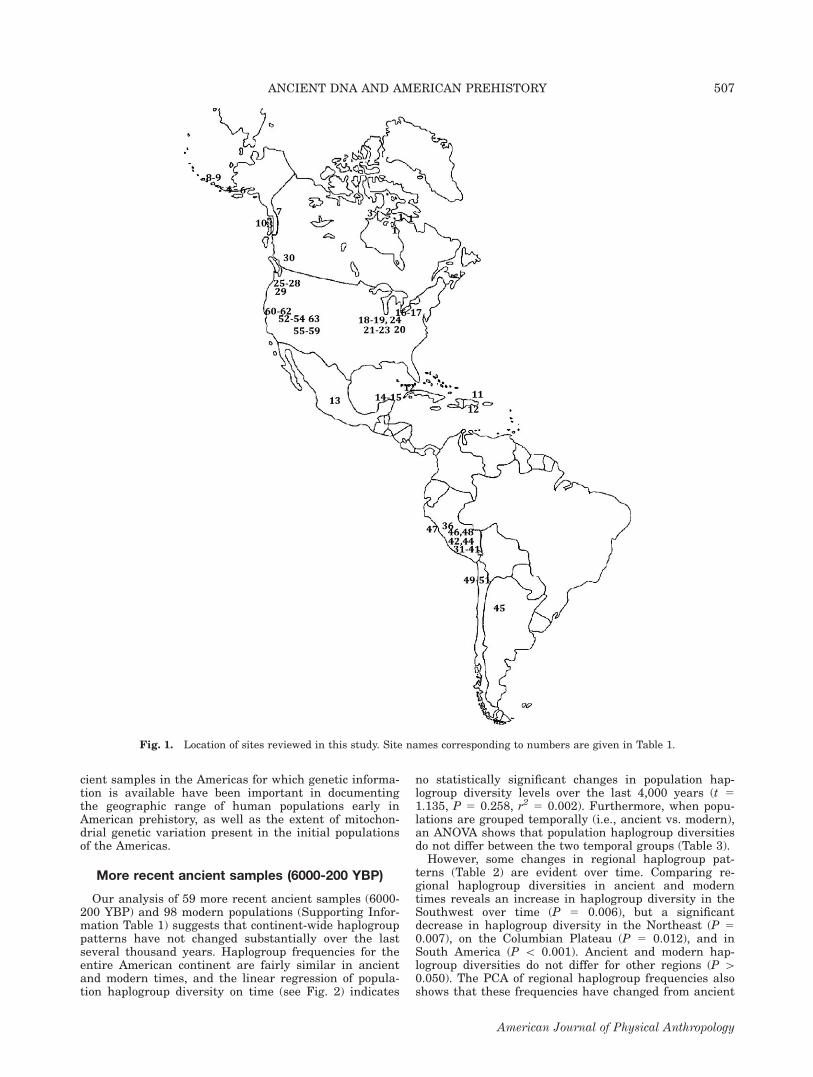
Gilbert et al. (2008a) obtained DNA from 14 coprolitesexcavated from the Paisley 5 Mile Point Caves in south-central Oregon (see Fig. 1 for the locations of all sites inthis study). These samples were dated to �14,000 YBP,making this site and the aDNA results coeval with theearly site of Monte Verde in Chile, and predating theClovis archaeological culture in North America.Although the coprolites were not excavated under sterileconditions and were contaminated with nonendogenous(primarily European) DNA, cloned and pyrosequencedPCR products from six samples yielded Native AmericanSNPs diagnostic for mitochondrial haplotypes A2 andB2. These results appear to represent the oldest humanDNA reported in the Americas and provide evidence of apre-Clovis human presence in western North America,suggesting at least one pre-LGM founding event. Theyalso suggest that mtDNA haplotypes A2 and B2 havethe time depth expected for founding haplotypes (seePerego et al., 2009 for recent coalescence estimates).Kemp et al. (2007) identified mtDNA haplotype D4h3a
(Rickards et al. 1999; Perego et al., 2009) from a singlesample dated to 10,300 YBP from the On-Your-Knees (O-Y-K) Cave site on Prince of Wales Island, Alaska. Thereare two clades within the D4h3 haplotype. D4h3a is com-monly found in Pacific coastal populations of SouthAmerica, and is represented in North America by the O-Y-K Cave specimen and one individual from the PeteKlunk mound group (1825 YBP) in Illinois (Bolnick andSmith, 2007). D4h3b is known from a single modernsample in China. The identification of D4h3a in theearly O-Y-K Northwest coast individual was an impor-tant piece of evidence for Perego et al.’s (2009) dualmigration colonization model for the Americas.Two additional samples that predate 8,000 years ago
have also been reported. Using HVS I sequencing, Stoneand Stoneking (1998) reported an individual member ofmtDNA haplogroup B from Hourglass Cave in Coloradodating to 8,000 YBP, while Kaestle (1998) and Kaestleand Smith (2001) identified the 9,200-year-old Wizard’sBeach, Nevada individual as a member of mtDNA hap-logroup C. Thus, in the small number of individualsfrom four archaeological sites dating to 8,000 years agoor earlier that have been characterized for mtDNA line-ages, each carried a different representative of the cur-rently recognized Native American mtDNA foundinghaplogroups.Smith et al. (2005) attempted to genetically character-
ize all of the earliest human remains in North America,identifying 20 individuals dating to older than 7,400YBP. Of the 18 samples that had not been studied genet-ically before, 10 yielded insufficient DNA for analysis, ofwhich eight dated to earlier than 8,000 YBP. An addi-tional three yielded apparently adequate DNA but con-tained inhibitors that prevented amplification andsequencing. To our knowledge, mtDNA haplogroups havenot been reported for any of the remaining samples.The paucity of early aDNA studies that might contrib-
ute directly to our understanding of the initial coloniza-tion of the Western Hemisphere is the result of two fac-tors. First, very few remains have been excavated fromearly sites that are available for study, and second, theearliest samples have proven recalcitrant to molecularanalysis due to poor nucleic acid preservation or inhibi-tors in the DNA extracts. Nevertheless, the few truly an-
TABLE
1.(C
ontinued
)
Site
Reg
ion
Date
(YBP)
N%
A%
B%
C%
D%
Xh
Referen
ce
50
North
ChileMiddle
Horizon
Sou
thAmerica
1650–1000
19
0.316
0.421
0.263
0.000
0.000
0.690
Moragaet
al.,2005
51
North
ChileLate
Interm
ediate
Sou
thAmerica
1000–500
15
0.200
0.533
0.200
0.067
0.000
0.676
Moragaet
al.,2005
52
Pyramid
Lake
Sou
thwest/GreatBasin/CA
860–5905
18
0.111
0.333
0.000
0.556
0.000
0.601
KaestleandSmith,2001
53
Pyramid
Lake(W
izard
sBea
ch)
Sou
thwest/GreatBasin/CA
9200
10.000
0.000
1.000
0.000
0.000
N.C.
KaestleandSmith,2001
54
StillwaterMarsh
Sou
thwest/GreatBasin/CA
290–3290
21
0.048
0.381
0.000
0.571
0.000
0.552
KaestleandSmith,2001
55
Tom
mySite
Sou
thwest/GreatBasin/CA
850–11
50
36
0.028
0.694
0.139
0.139
0.000
0.492
Snow
etal.,2010
56
MineCanyon
Sou
thwest/GreatBasin/CA
650–850
12
0.583
0.333
0.083
0.000
0.000
0.591
Snow
etal.,2010
57
Fremon
tSou
thwest/GreatBasin/CA
500–1500
30
0.000
0.800
0.133
0.067
0.000
0.349
Parr
etal.,1996;Carlyle
etal.,2000
58
Anasa
ziSou
thwest/GreatBasin/CA
1010–2010
38
0.107
0.714
0.179
0.000
0.000
0.462
Carlyle,2003
59
Western
Bask
etmaker
IISou
thwest/GreatBasin/CA
2500–1300
23
0.130
0.783
0.043
0.043
0.000
0.383
Carlyle,2003;Leb
lancet
al.,2007
60
Cecil
Sou
thwest/GreatBasin/CA
3600–2860
16
0.000
0.063
0.563
0.375
0.000
0.575
Esh
leman,2002
61
Coo
kSou
thwest/GreatBasin/CA
2000
23
0.043
0.087
0.435
0.435
0.000
0.640
Esh
leman,2002
62
Applegate
Sou
thwest/GreatBasin/CA
1765–2055
60.000
0.333
0.667
0.000
0.000
0.533
Esh
leman,2002
63
Hou
rglass
Cave
Sou
thwest/GreatBasin/CA
8000
10.000
1.000
0.000
0.000
0.000
N.C.
StoneandStonek
ing,1996
aN.C.,Not
Calculated.
bAlsoreported0.667freq
uen
cyof
haplogroupM.
506 J.A. RAFF ET AL.
American Journal of Physical Anthropology
cient samples in the Americas for which genetic informa-tion is available have been important in documentingthe geographic range of human populations early inAmerican prehistory, as well as the extent of mitochon-drial genetic variation present in the initial populationsof the Americas.
More recent ancient samples (6000-200 YBP)
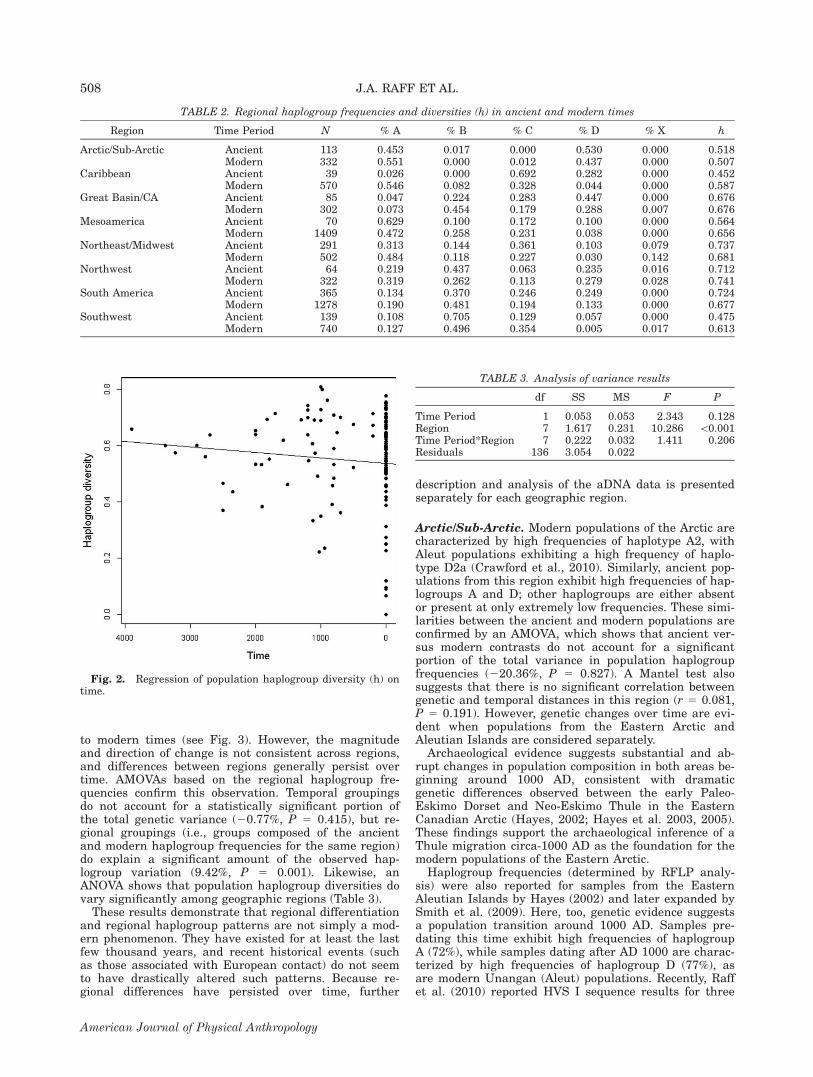
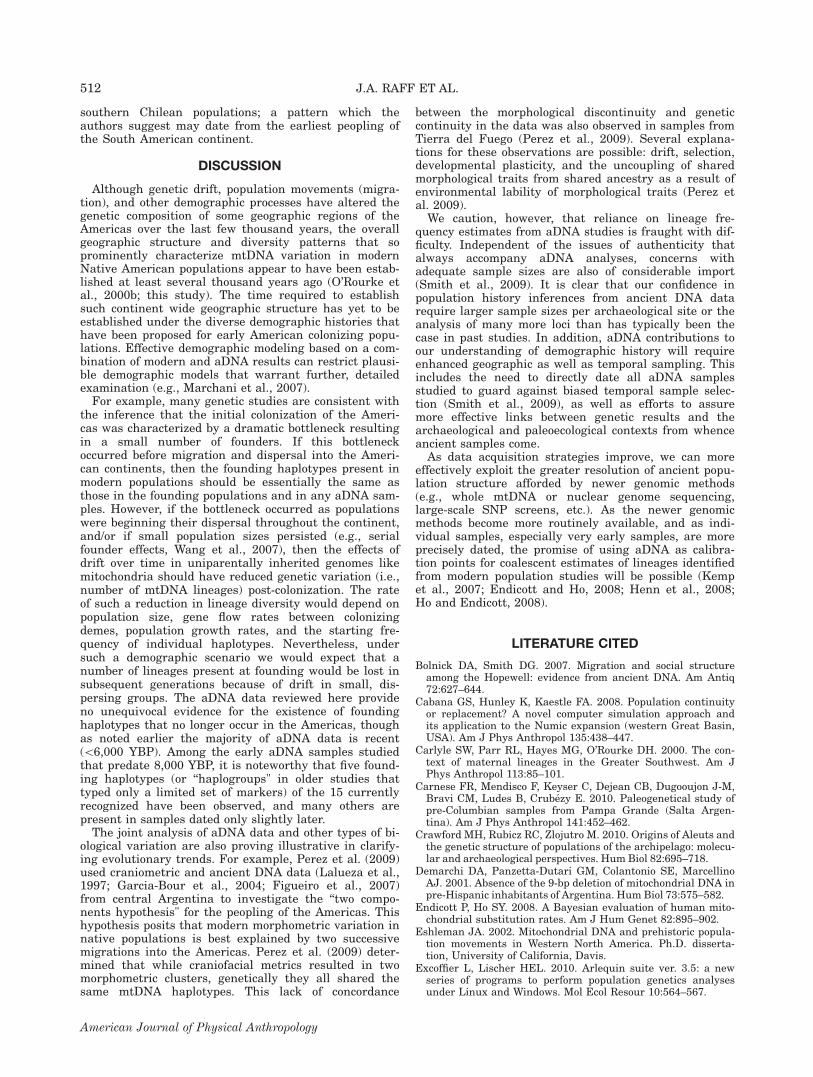
Our analysis of 59 more recent ancient samples (6000-200 YBP) and 98 modern populations (Supporting Infor-mation Table 1) suggests that continent-wide haplogrouppatterns have not changed substantially over the lastseveral thousand years. Haplogroup frequencies for theentire American continent are fairly similar in ancientand modern times, and the linear regression of popula-tion haplogroup diversity on time (see Fig. 2) indicates
no statistically significant changes in population hap-logroup diversity levels over the last 4,000 years (t 51.135, P 5 0.258, r2 5 0.002). Furthermore, when popu-lations are grouped temporally (i.e., ancient vs. modern),an ANOVA shows that population haplogroup diversitiesdo not differ between the two temporal groups (Table 3).However, some changes in regional haplogroup pat-
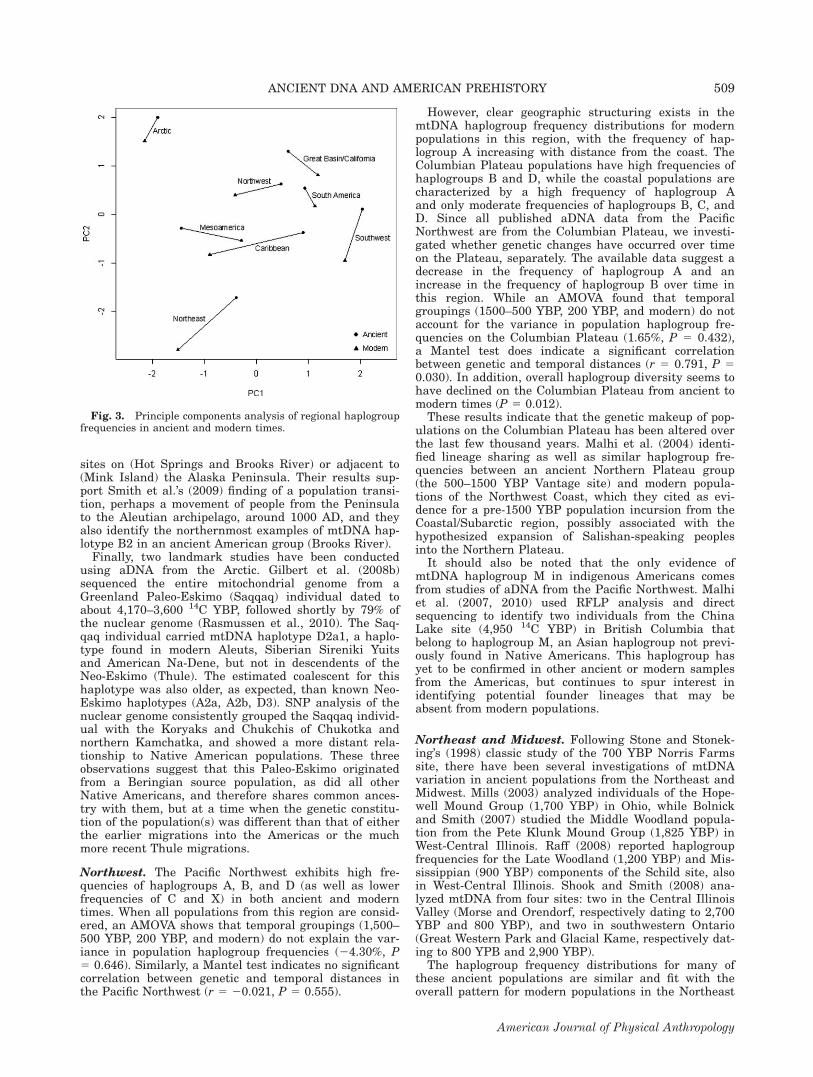
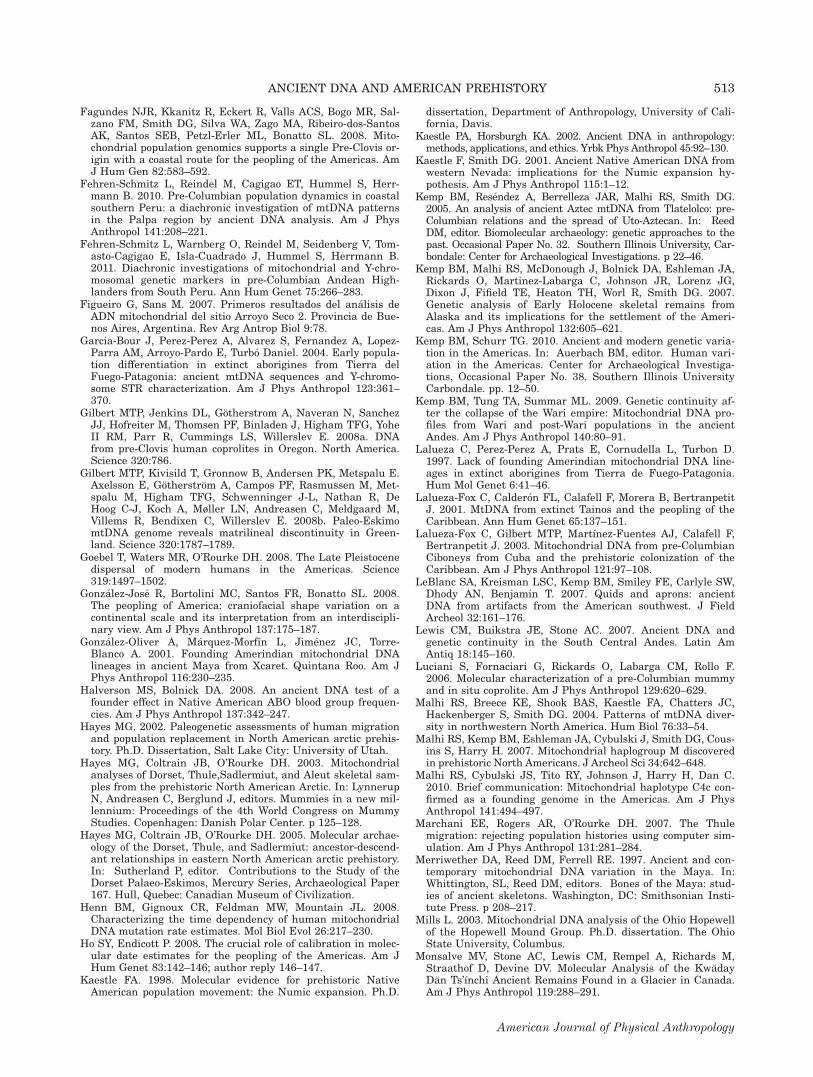
terns (Table 2) are evident over time. Comparing re-gional haplogroup diversities in ancient and moderntimes reveals an increase in haplogroup diversity in theSouthwest over time (P 5 0.006), but a significantdecrease in haplogroup diversity in the Northeast (P 50.007), on the Columbian Plateau (P 5 0.012), and inSouth America (P \ 0.001). Ancient and modern hap-logroup diversities do not differ for other regions (P [0.050). The PCA of regional haplogroup frequencies alsoshows that these frequencies have changed from ancient
Fig. 1. Location of sites reviewed in this study. Site names corresponding to numbers are given in Table 1.
507ANCIENT DNA AND AMERICAN PREHISTORY
American Journal of Physical Anthropology
to modern times (see Fig. 3). However, the magnitudeand direction of change is not consistent across regions,and differences between regions generally persist overtime. AMOVAs based on the regional haplogroup fre-quencies confirm this observation. Temporal groupingsdo not account for a statistically significant portion ofthe total genetic variance (20.77%, P 5 0.415), but re-gional groupings (i.e., groups composed of the ancientand modern haplogroup frequencies for the same region)do explain a significant amount of the observed hap-logroup variation (9.42%, P 5 0.001). Likewise, anANOVA shows that population haplogroup diversities dovary significantly among geographic regions (Table 3).These results demonstrate that regional differentiation
and regional haplogroup patterns are not simply a mod-ern phenomenon. They have existed for at least the lastfew thousand years, and recent historical events (suchas those associated with European contact) do not seemto have drastically altered such patterns. Because re-gional differences have persisted over time, further
description and analysis of the aDNA data is presentedseparately for each geographic region.
Arctic/Sub-Arctic. Modern populations of the Arctic arecharacterized by high frequencies of haplotype A2, withAleut populations exhibiting a high frequency of haplo-type D2a (Crawford et al., 2010). Similarly, ancient pop-ulations from this region exhibit high frequencies of hap-logroups A and D; other haplogroups are either absentor present at only extremely low frequencies. These simi-larities between the ancient and modern populations areconfirmed by an AMOVA, which shows that ancient ver-sus modern contrasts do not account for a significantportion of the total variance in population haplogroupfrequencies (220.36%, P 5 0.827). A Mantel test alsosuggests that there is no significant correlation betweengenetic and temporal distances in this region (r 5 0.081,P 5 0.191). However, genetic changes over time are evi-dent when populations from the Eastern Arctic andAleutian Islands are considered separately.Archaeological evidence suggests substantial and ab-
rupt changes in population composition in both areas be-ginning around 1000 AD, consistent with dramaticgenetic differences observed between the early Paleo-Eskimo Dorset and Neo-Eskimo Thule in the EasternCanadian Arctic (Hayes, 2002; Hayes et al. 2003, 2005).These findings support the archaeological inference of aThule migration circa-1000 AD as the foundation for themodern populations of the Eastern Arctic.Haplogroup frequencies (determined by RFLP analy-
sis) were also reported for samples from the EasternAleutian Islands by Hayes (2002) and later expanded bySmith et al. (2009). Here, too, genetic evidence suggestsa population transition around 1000 AD. Samples pre-dating this time exhibit high frequencies of haplogroupA (72%), while samples dating after AD 1000 are charac-terized by high frequencies of haplogroup D (77%), asare modern Unangan (Aleut) populations. Recently, Raffet al. (2010) reported HVS I sequence results for three
Fig. 2. Regression of population haplogroup diversity (h) ontime.
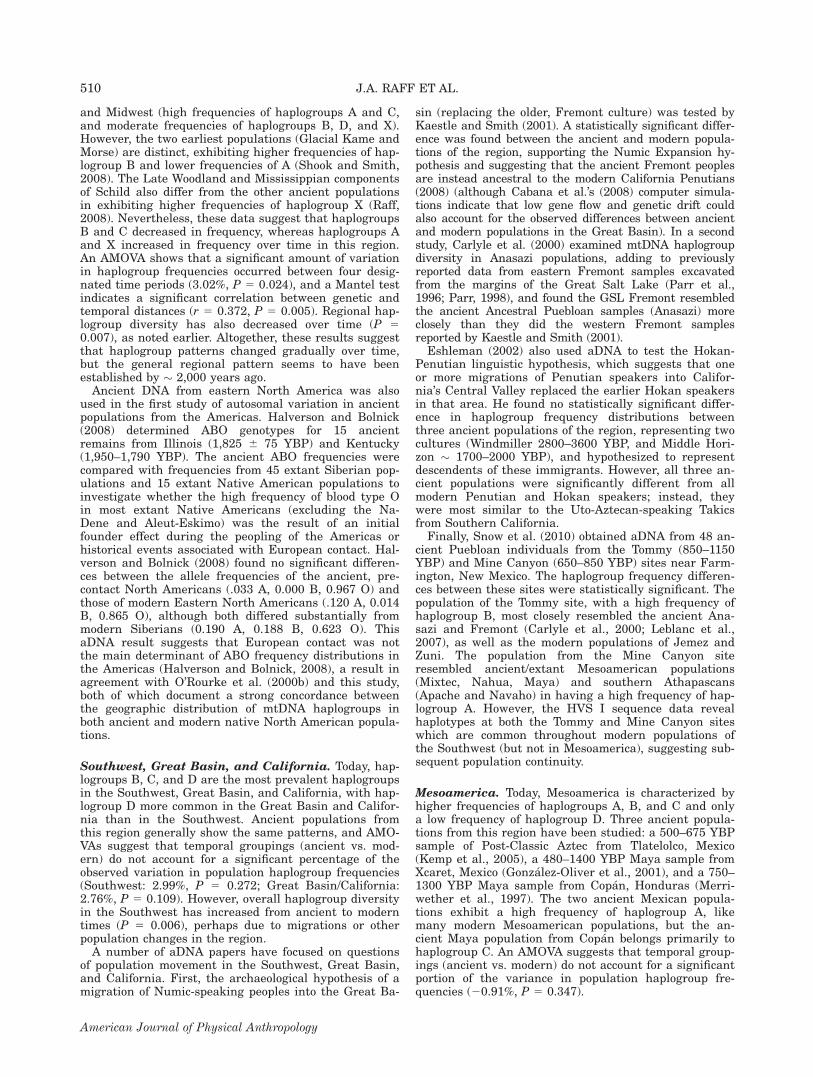
TABLE 2. Regional haplogroup frequencies and diversities (h) in ancient and modern times
Region Time Period N % A % B % C % D % X h
Arctic/Sub-Arctic Ancient 113 0.453 0.017 0.000 0.530 0.000 0.518Modern 332 0.551 0.000 0.012 0.437 0.000 0.507
Caribbean Ancient 39 0.026 0.000 0.692 0.282 0.000 0.452Modern 570 0.546 0.082 0.328 0.044 0.000 0.587
Great Basin/CA Ancient 85 0.047 0.224 0.283 0.447 0.000 0.676Modern 302 0.073 0.454 0.179 0.288 0.007 0.676
Mesoamerica Ancient 70 0.629 0.100 0.172 0.100 0.000 0.564Modern 1409 0.472 0.258 0.231 0.038 0.000 0.656
Northeast/Midwest Ancient 291 0.313 0.144 0.361 0.103 0.079 0.737Modern 502 0.484 0.118 0.227 0.030 0.142 0.681
Northwest Ancient 64 0.219 0.437 0.063 0.235 0.016 0.712Modern 322 0.319 0.262 0.113 0.279 0.028 0.741
South America Ancient 365 0.134 0.370 0.246 0.249 0.000 0.724Modern 1278 0.190 0.481 0.194 0.133 0.000 0.677
Southwest Ancient 139 0.108 0.705 0.129 0.057 0.000 0.475Modern 740 0.127 0.496 0.354 0.005 0.017 0.613
TABLE 3. Analysis of variance results
df SS MS F P
Time Period 1 0.053 0.053 2.343 0.128Region 7 1.617 0.231 10.286 \0.001Time Period*Region 7 0.222 0.032 1.411 0.206Residuals 136 3.054 0.022
508 J.A. RAFF ET AL.
American Journal of Physical Anthropology
sites on (Hot Springs and Brooks River) or adjacent to(Mink Island) the Alaska Peninsula. Their results sup-port Smith et al.’s (2009) finding of a population transi-tion, perhaps a movement of people from the Peninsulato the Aleutian archipelago, around 1000 AD, and theyalso identify the northernmost examples of mtDNA hap-lotype B2 in an ancient American group (Brooks River).Finally, two landmark studies have been conducted
using aDNA from the Arctic. Gilbert et al. (2008b)sequenced the entire mitochondrial genome from aGreenland Paleo-Eskimo (Saqqaq) individual dated toabout 4,170–3,600 14C YBP, followed shortly by 79% ofthe nuclear genome (Rasmussen et al., 2010). The Saq-qaq individual carried mtDNA haplotype D2a1, a haplo-type found in modern Aleuts, Siberian Sireniki Yuitsand American Na-Dene, but not in descendents of theNeo-Eskimo (Thule). The estimated coalescent for thishaplotype was also older, as expected, than known Neo-Eskimo haplotypes (A2a, A2b, D3). SNP analysis of thenuclear genome consistently grouped the Saqqaq individ-ual with the Koryaks and Chukchis of Chukotka andnorthern Kamchatka, and showed a more distant rela-tionship to Native American populations. These threeobservations suggest that this Paleo-Eskimo originatedfrom a Beringian source population, as did all otherNative Americans, and therefore shares common ances-try with them, but at a time when the genetic constitu-tion of the population(s) was different than that of eitherthe earlier migrations into the Americas or the muchmore recent Thule migrations.
Northwest. The Pacific Northwest exhibits high fre-quencies of haplogroups A, B, and D (as well as lowerfrequencies of C and X) in both ancient and moderntimes. When all populations from this region are consid-ered, an AMOVA shows that temporal groupings (1,500–500 YBP, 200 YBP, and modern) do not explain the var-iance in population haplogroup frequencies (24.30%, P5 0.646). Similarly, a Mantel test indicates no significantcorrelation between genetic and temporal distances inthe Pacific Northwest (r 5 20.021, P 5 0.555).
However, clear geographic structuring exists in themtDNA haplogroup frequency distributions for modernpopulations in this region, with the frequency of hap-logroup A increasing with distance from the coast. TheColumbian Plateau populations have high frequencies ofhaplogroups B and D, while the coastal populations arecharacterized by a high frequency of haplogroup Aand only moderate frequencies of haplogroups B, C, andD. Since all published aDNA data from the PacificNorthwest are from the Columbian Plateau, we investi-gated whether genetic changes have occurred over timeon the Plateau, separately. The available data suggest adecrease in the frequency of haplogroup A and anincrease in the frequency of haplogroup B over time inthis region. While an AMOVA found that temporalgroupings (1500–500 YBP, 200 YBP, and modern) do notaccount for the variance in population haplogroup fre-quencies on the Columbian Plateau (1.65%, P 5 0.432),a Mantel test does indicate a significant correlationbetween genetic and temporal distances (r 5 0.791, P 50.030). In addition, overall haplogroup diversity seems tohave declined on the Columbian Plateau from ancient tomodern times (P 5 0.012).These results indicate that the genetic makeup of pop-
ulations on the Columbian Plateau has been altered overthe last few thousand years. Malhi et al. (2004) identi-fied lineage sharing as well as similar haplogroup fre-quencies between an ancient Northern Plateau group(the 500–1500 YBP Vantage site) and modern popula-tions of the Northwest Coast, which they cited as evi-dence for a pre-1500 YBP population incursion from theCoastal/Subarctic region, possibly associated with thehypothesized expansion of Salishan-speaking peoplesinto the Northern Plateau.It should also be noted that the only evidence of
mtDNA haplogroup M in indigenous Americans comesfrom studies of aDNA from the Pacific Northwest. Malhiet al. (2007, 2010) used RFLP analysis and directsequencing to identify two individuals from the ChinaLake site (4,950 14C YBP) in British Columbia thatbelong to haplogroup M, an Asian haplogroup not previ-ously found in Native Americans. This haplogroup hasyet to be confirmed in other ancient or modern samplesfrom the Americas, but continues to spur interest inidentifying potential founder lineages that may beabsent from modern populations.
Northeast and Midwest. Following Stone and Stonek-ing’s (1998) classic study of the 700 YBP Norris Farmssite, there have been several investigations of mtDNAvariation in ancient populations from the Northeast andMidwest. Mills (2003) analyzed individuals of the Hope-well Mound Group (1,700 YBP) in Ohio, while Bolnickand Smith (2007) studied the Middle Woodland popula-tion from the Pete Klunk Mound Group (1,825 YBP) inWest-Central Illinois. Raff (2008) reported haplogroupfrequencies for the Late Woodland (1,200 YBP) and Mis-sissippian (900 YBP) components of the Schild site, alsoin West-Central Illinois. Shook and Smith (2008) ana-lyzed mtDNA from four sites: two in the Central IllinoisValley (Morse and Orendorf, respectively dating to 2,700YBP and 800 YBP), and two in southwestern Ontario(Great Western Park and Glacial Kame, respectively dat-ing to 800 YPB and 2,900 YBP).The haplogroup frequency distributions for many of
these ancient populations are similar and fit with theoverall pattern for modern populations in the Northeast
Fig. 3. Principle components analysis of regional haplogroupfrequencies in ancient and modern times.
509ANCIENT DNA AND AMERICAN PREHISTORY
American Journal of Physical Anthropology
and Midwest (high frequencies of haplogroups A and C,and moderate frequencies of haplogroups B, D, and X).However, the two earliest populations (Glacial Kame andMorse) are distinct, exhibiting higher frequencies of hap-logroup B and lower frequencies of A (Shook and Smith,2008). The Late Woodland and Mississippian componentsof Schild also differ from the other ancient populationsin exhibiting higher frequencies of haplogroup X (Raff,2008). Nevertheless, these data suggest that haplogroupsB and C decreased in frequency, whereas haplogroups Aand X increased in frequency over time in this region.An AMOVA shows that a significant amount of variationin haplogroup frequencies occurred between four desig-nated time periods (3.02%, P 5 0.024), and a Mantel testindicates a significant correlation between genetic andtemporal distances (r 5 0.372, P 5 0.005). Regional hap-logroup diversity has also decreased over time (P 50.007), as noted earlier. Altogether, these results suggestthat haplogroup patterns changed gradually over time,but the general regional pattern seems to have beenestablished by � 2,000 years ago.Ancient DNA from eastern North America was also
used in the first study of autosomal variation in ancientpopulations from the Americas. Halverson and Bolnick(2008) determined ABO genotypes for 15 ancientremains from Illinois (1,825 6 75 YBP) and Kentucky(1,950–1,790 YBP). The ancient ABO frequencies werecompared with frequencies from 45 extant Siberian pop-ulations and 15 extant Native American populations toinvestigate whether the high frequency of blood type Oin most extant Native Americans (excluding the Na-Dene and Aleut-Eskimo) was the result of an initialfounder effect during the peopling of the Americas orhistorical events associated with European contact. Hal-verson and Bolnick (2008) found no significant differen-ces between the allele frequencies of the ancient, pre-contact North Americans (.033 A, 0.000 B, 0.967 O) andthose of modern Eastern North Americans (.120 A, 0.014B, 0.865 O), although both differed substantially frommodern Siberians (0.190 A, 0.188 B, 0.623 O). ThisaDNA result suggests that European contact was notthe main determinant of ABO frequency distributions inthe Americas (Halverson and Bolnick, 2008), a result inagreement with O’Rourke et al. (2000b) and this study,both of which document a strong concordance betweenthe geographic distribution of mtDNA haplogroups inboth ancient and modern native North American popula-tions.
Southwest, Great Basin, and California. Today, hap-logroups B, C, and D are the most prevalent haplogroupsin the Southwest, Great Basin, and California, with hap-logroup D more common in the Great Basin and Califor-nia than in the Southwest. Ancient populations fromthis region generally show the same patterns, and AMO-VAs suggest that temporal groupings (ancient vs. mod-ern) do not account for a significant percentage of theobserved variation in population haplogroup frequencies(Southwest: 2.99%, P 5 0.272; Great Basin/California:2.76%, P 5 0.109). However, overall haplogroup diversityin the Southwest has increased from ancient to moderntimes (P 5 0.006), perhaps due to migrations or otherpopulation changes in the region.A number of aDNA papers have focused on questions
of population movement in the Southwest, Great Basin,and California. First, the archaeological hypothesis of amigration of Numic-speaking peoples into the Great Ba-
sin (replacing the older, Fremont culture) was tested byKaestle and Smith (2001). A statistically significant differ-ence was found between the ancient and modern popula-tions of the region, supporting the Numic Expansion hy-pothesis and suggesting that the ancient Fremont peoplesare instead ancestral to the modern California Penutians(2008) (although Cabana et al.’s (2008) computer simula-tions indicate that low gene flow and genetic drift couldalso account for the observed differences between ancientand modern populations in the Great Basin). In a secondstudy, Carlyle et al. (2000) examined mtDNA haplogroupdiversity in Anasazi populations, adding to previouslyreported data from eastern Fremont samples excavatedfrom the margins of the Great Salt Lake (Parr et al.,1996; Parr, 1998), and found the GSL Fremont resembledthe ancient Ancestral Puebloan samples (Anasazi) moreclosely than they did the western Fremont samplesreported by Kaestle and Smith (2001).Eshleman (2002) also used aDNA to test the Hokan-
Penutian linguistic hypothesis, which suggests that oneor more migrations of Penutian speakers into Califor-nia’s Central Valley replaced the earlier Hokan speakersin that area. He found no statistically significant differ-ence in haplogroup frequency distributions betweenthree ancient populations of the region, representing twocultures (Windmiller 2800–3600 YBP, and Middle Hori-zon � 1700–2000 YBP), and hypothesized to representdescendents of these immigrants. However, all three an-cient populations were significantly different from allmodern Penutian and Hokan speakers; instead, theywere most similar to the Uto-Aztecan-speaking Takicsfrom Southern California.Finally, Snow et al. (2010) obtained aDNA from 48 an-
cient Puebloan individuals from the Tommy (850–1150YBP) and Mine Canyon (650–850 YBP) sites near Farm-ington, New Mexico. The haplogroup frequency differen-ces between these sites were statistically significant. Thepopulation of the Tommy site, with a high frequency ofhaplogroup B, most closely resembled the ancient Ana-sazi and Fremont (Carlyle et al., 2000; Leblanc et al.,2007), as well as the modern populations of Jemez andZuni. The population from the Mine Canyon siteresembled ancient/extant Mesoamerican populations(Mixtec, Nahua, Maya) and southern Athapascans(Apache and Navaho) in having a high frequency of hap-logroup A. However, the HVS I sequence data revealhaplotypes at both the Tommy and Mine Canyon siteswhich are common throughout modern populations ofthe Southwest (but not in Mesoamerica), suggesting sub-sequent population continuity.
Mesoamerica. Today, Mesoamerica is characterized byhigher frequencies of haplogroups A, B, and C and onlya low frequency of haplogroup D. Three ancient popula-tions from this region have been studied: a 500–675 YBPsample of Post-Classic Aztec from Tlatelolco, Mexico(Kemp et al., 2005), a 480–1400 YBP Maya sample fromXcaret, Mexico (Gonzalez-Oliver et al., 2001), and a 750–1300 YBP Maya sample from Copan, Honduras (Merri-wether et al., 1997). The two ancient Mexican popula-tions exhibit a high frequency of haplogroup A, likemany modern Mesoamerican populations, but the an-cient Maya population from Copan belongs primarily tohaplogroup C. An AMOVA suggests that temporal group-ings (ancient vs. modern) do not account for a significantportion of the variance in population haplogroup fre-quencies (20.91%, P 5 0.347).
510 J.A. RAFF ET AL.
American Journal of Physical Anthropology
Ancient DNA data from this region has been used totest hypotheses about prehistoric interactions and popu-lation movements between Mesoamerica and the Ameri-can Southwest, perhaps associated with the spread ofUto-Aztecan languages. Although linguistic and archaeo-logical evidence suggest cultural ties, modern popula-tions from the two regions exhibit significantly differentmtDNA haplogroup frequencies. To investigate whetherthe same patterns were present before European contact,Kemp et al. (2005) determined the haplogroups (viaRFLP) of 23 Aztec individuals from Tlatelolco. ThisAztec population was distinct from Southwestern groupsbut similar to modern Mesoamerican populations (eventhose from different geographic areas and/or languagefamilies), suggesting that the pattern of haplogroup vari-ation in Mesoamerica is quite ancient (Kemp et al.,2005). These aDNA data, like the modern mtDNA data,provide no evidence for a large-scale prehistoric migra-tion from Mesoamerica to the Southwest.
Caribbean. Unlike many other regions of the Americas,the Caribbean shows clear and dramatic differencesbetween the ancient and modern populations that havebeen sampled. Two pre-Columbian populations havebeen analyzed—Tainos from the La Caleta site in theDominican Republic (Lalueza-Fox et al., 2001) and Cibo-neys from three sites in Cuba (Lalueza-Fox et al.,2003)—and both are characterized by high frequencies ofhaplogroups C and D. In contrast, modern Caribbeanpopulations exhibit higher frequencies of haplogroups Aand C, as well as many non-Native American hap-logroups. An AMOVA (based just on the frequencies ofthe founding Native American haplogroups) shows thattemporal groupings (ancient vs. modern) account for asignificant percentage of the variation in population hap-logroup frequencies (26.03%, P \ 0.001). However, aMantel test does not indicate any significant correlationsbetween genetic and temporal distances (r 5 20.038, P5 0.600). These results suggest that changes in hap-logroup frequencies may have occurred fairly abruptlyand recently in this region, possibly in association withthe decimation of indigenous Caribbean populations fol-lowing European contact.
South America. Modern indigenous populations ofSouth America have been well characterized molecularly,and have contributed disproportionately to our under-standing of the genetic patterns and diversity in NativeAmerican populations. It is somewhat surprising, then,that comparatively few aDNA studies have been con-ducted on prehistoric samples from the continent. Overthe past decade, ancient populations from South Americathat have been studied come from Peru, Argentina, andChile (Demarchi et al., 2001; Shimada et al., 2004; Mor-aga et al., 2005; Luciani et al., 2006; Shinoda et al.,2006; Lewis et al., 2007; Kemp et al., 2009; Carnese etal., 2010; Fehren-Schmitz et al., 2010; Fehren-Schmitzet al., 2011). Our comparisons with modern South Amer-ican populations, therefore, include only modern popula-tions from the same regions of the continent.When the overall haplogroup frequencies for South
America (Table 2) are considered, we see higher frequen-cies of haplogroup B and more moderate frequencies ofhaplogroups A, C, and D in both ancient and moderntimes. An AMOVA indicates that these two groupings donot explain a significant portion of the total genetic var-iance (1.00%, P 5 0.146). However, when the SouthAmerican populations are divided into five temporal
groupings (6,000–2,200 YBP, 2,200–1,400 YBP, 1,400–1,000 YBP, 1,000–500 YBP, and modern) to better repre-sent the temporal variation present in the sampled popu-lations, we do see evidence of significant genetic changesover time. The earliest populations generally exhibithigher frequencies of haplogroup D and lower frequen-cies of haplogroup B compared to population samplesfrom later time periods. An AMOVA shows that thesefive temporal groupings do account for a significant com-ponent of the variation in population haplogroup fre-quencies (6.05%, P 5 0.016). A Mantel test also indicatesa significant correlation between genetic and temporaldistances (r 5 0.436, P 5 0.010), suggesting that hap-logroup frequencies have changed gradually in SouthAmerica over the last 3,000–4,000 years. As noted ear-lier, overall haplogroup diversity appears to havedeclined in South America from ancient to modern times(P\ 0.001).Temporal changes in the genetic composition of South
American populations have also been documented instudies of more localized regions of the continent.Demarchi et al. (2001), for example, found no evidencefor the 9bp deletion (a discrete marker defining hap-logroup B) in any samples from prehistoric Argentina.This result stands in sharp contrast to the high fre-quency of B found in modern Argentineans, suggestingthat evolutionary events (such as the gene flow anddepopulation from the expansion of the Inca Empire andSpanish contact) had a substantial effect on the popula-tion composition of this region.In coastal southern Peru, Fehren-Schmitz et al.
(2010) tested hypotheses of genetic continuity by ana-lyzing DNA of 217 individuals from the Paracas (2,800-2,200 YBP) and Nasca cultures (2,200-1,400 YBP) ofthe Palpa region and several sites from the surroundingarea (Peninsula, Highlands, Ancash, Arequipa, SanMartin, Tayacaja). The authors combined directsequencing of a 388bp region of HVS I (N 5 104) withdetection of coding region SNPs (N 5 130) diagnosticfor four American haplogroups (A-D). The Paracas pop-ulations from the Palpa and Peninsula regions were notstatistically different in haplogroup composition fromeach other, having high frequencies (70–79%) of hap-logroup D, moderate frequencies of haplogroup C (14–30%), and no haplogroup A or B. Among the rural andurban Nasca populations (both from the Palpa region),haplogroups A and B appear at low frequencies, D isdecreased, and C is correspondingly increased. Thesehaplogroup frequency changes, however, are not sub-stantial enough to make the Nasca significantly differ-ent from the Paracas populations, or even the subse-quent Middle Horizon population, which the authorsinterpret as evidence for genetic continuity between thesuccessive cultures (although cautioning that samplesizes are too small to draw any final conclusions). Theseinterpretations are borne out by genetic distance calcu-lations, which are quite low between all of the Paracasperiod and Nasca period populations. However, the an-cient coastal populations they characterized differed sig-nificantly in haplogroup composition from the ancientAndean highland populations, suggesting some degreeof isolation (although the authors argue against geneticdrift on the grounds that both populations wererelatively large). Intriguingly, although significantlydifferent in haplogroup frequency composition frommodern Peruvian populations, the ancient Palpa popula-tions are genetically similar to modern middle and
511ANCIENT DNA AND AMERICAN PREHISTORY
American Journal of Physical Anthropology
southern Chilean populations; a pattern which theauthors suggest may date from the earliest peopling ofthe South American continent.
DISCUSSION
Although genetic drift, population movements (migra-tion), and other demographic processes have altered thegenetic composition of some geographic regions of theAmericas over the last few thousand years, the overallgeographic structure and diversity patterns that soprominently characterize mtDNA variation in modernNative American populations appear to have been estab-lished at least several thousand years ago (O’Rourke etal., 2000b; this study). The time required to establishsuch continent wide geographic structure has yet to beestablished under the diverse demographic histories thathave been proposed for early American colonizing popu-lations. Effective demographic modeling based on a com-bination of modern and aDNA results can restrict plausi-ble demographic models that warrant further, detailedexamination (e.g., Marchani et al., 2007).For example, many genetic studies are consistent with
the inference that the initial colonization of the Ameri-cas was characterized by a dramatic bottleneck resultingin a small number of founders. If this bottleneckoccurred before migration and dispersal into the Ameri-can continents, then the founding haplotypes present inmodern populations should be essentially the same asthose in the founding populations and in any aDNA sam-ples. However, if the bottleneck occurred as populationswere beginning their dispersal throughout the continent,and/or if small population sizes persisted (e.g., serialfounder effects, Wang et al., 2007), then the effects ofdrift over time in uniparentally inherited genomes likemitochondria should have reduced genetic variation (i.e.,number of mtDNA lineages) post-colonization. The rateof such a reduction in lineage diversity would depend onpopulation size, gene flow rates between colonizingdemes, population growth rates, and the starting fre-quency of individual haplotypes. Nevertheless, undersuch a demographic scenario we would expect that anumber of lineages present at founding would be lost insubsequent generations because of drift in small, dis-persing groups. The aDNA data reviewed here provideno unequivocal evidence for the existence of foundinghaplotypes that no longer occur in the Americas, thoughas noted earlier the majority of aDNA data is recent(\6,000 YBP). Among the early aDNA samples studiedthat predate 8,000 YBP, it is noteworthy that five found-ing haplotypes (or ‘‘haplogroups" in older studies thattyped only a limited set of markers) of the 15 currentlyrecognized have been observed, and many others arepresent in samples dated only slightly later.The joint analysis of aDNA data and other types of bi-
ological variation are also proving illustrative in clarify-ing evolutionary trends. For example, Perez et al. (2009)used craniometric and ancient DNA data (Lalueza et al.,1997; Garcia-Bour et al., 2004; Figueiro et al., 2007)from central Argentina to investigate the ‘‘two compo-nents hypothesis" for the peopling of the Americas. Thishypothesis posits that modern morphometric variation innative populations is best explained by two successivemigrations into the Americas. Perez et al. (2009) deter-mined that while craniofacial metrics resulted in twomorphometric clusters, genetically they all shared thesame mtDNA haplotypes. This lack of concordance
between the morphological discontinuity and geneticcontinuity in the data was also observed in samples fromTierra del Fuego (Perez et al., 2009). Several explana-tions for these observations are possible: drift, selection,developmental plasticity, and the uncoupling of sharedmorphological traits from shared ancestry as a result ofenvironmental lability of morphological traits (Perez etal. 2009).We caution, however, that reliance on lineage fre-
quency estimates from aDNA studies is fraught with dif-ficulty. Independent of the issues of authenticity thatalways accompany aDNA analyses, concerns withadequate sample sizes are also of considerable import(Smith et al., 2009). It is clear that our confidence inpopulation history inferences from ancient DNA datarequire larger sample sizes per archaeological site or theanalysis of many more loci than has typically been thecase in past studies. In addition, aDNA contributions toour understanding of demographic history will requireenhanced geographic as well as temporal sampling. Thisincludes the need to directly date all aDNA samplesstudied to guard against biased temporal sample selec-tion (Smith et al., 2009), as well as efforts to assuremore effective links between genetic results and thearchaeological and paleoecological contexts from whenceancient samples come.As data acquisition strategies improve, we can more
effectively exploit the greater resolution of ancient popu-lation structure afforded by newer genomic methods(e.g., whole mtDNA or nuclear genome sequencing,large-scale SNP screens, etc.). As the newer genomicmethods become more routinely available, and as indi-vidual samples, especially very early samples, are moreprecisely dated, the promise of using aDNA as calibra-tion points for coalescent estimates of lineages identifiedfrom modern population studies will be possible (Kempet al., 2007; Endicott and Ho, 2008; Henn et al., 2008;Ho and Endicott, 2008).
LITERATURE CITED
Bolnick DA, Smith DG. 2007. Migration and social structureamong the Hopewell: evidence from ancient DNA. Am Antiq72:627–644.
Cabana GS, Hunley K, Kaestle FA. 2008. Population continuityor replacement? A novel computer simulation approach andits application to the Numic expansion (western Great Basin,USA). Am J Phys Anthropol 135:438–447.
Carlyle SW, Parr RL, Hayes MG, O’Rourke DH. 2000. The con-text of maternal lineages in the Greater Southwest. Am JPhys Anthropol 113:85–101.
Carnese FR, Mendisco F, Keyser C, Dejean CB, Dugooujon J-M,Bravi CM, Ludes B, Crubezy E. 2010. Paleogenetical study ofpre-Columbian samples from Pampa Grande (Salta Argen-tina). Am J Phys Anthropol 141:452–462.
Crawford MH, Rubicz RC, Zlojutro M. 2010. Origins of Aleuts andthe genetic structure of populations of the archipelago: molecu-lar and archaeological perspectives. Hum Biol 82:695–718.
Demarchi DA, Panzetta-Dutari GM, Colantonio SE, MarcellinoAJ. 2001. Absence of the 9-bp deletion of mitochondrial DNA inpre-Hispanic inhabitants of Argentina. Hum Biol 73:575–582.
Endicott P, Ho SY. 2008. A Bayesian evaluation of human mito-chondrial substitution rates. Am J Hum Genet 82:895–902.
Eshleman JA. 2002. Mitochondrial DNA and prehistoric popula-tion movements in Western North America. Ph.D. disserta-tion, University of California, Davis.
Excoffier L, Lischer HEL. 2010. Arlequin suite ver. 3.5: a newseries of programs to perform population genetics analysesunder Linux and Windows. Mol Ecol Resour 10:564–567.
512 J.A. RAFF ET AL.
American Journal of Physical Anthropology
Fagundes NJR, Kkanitz R, Eckert R, Valls ACS, Bogo MR, Sal-zano FM, Smith DG, Silva WA, Zago MA, Ribeiro-dos-SantosAK, Santos SEB, Petzl-Erler ML, Bonatto SL. 2008. Mito-chondrial population genomics supports a single Pre-Clovis or-igin with a coastal route for the peopling of the Americas. AmJ Hum Gen 82:583–592.
Fehren-Schmitz L, Reindel M, Cagigao ET, Hummel S, Herr-mann B. 2010. Pre-Columbian population dynamics in coastalsouthern Peru: a diachronic investigation of mtDNA patternsin the Palpa region by ancient DNA analysis. Am J PhysAnthropol 141:208–221.
Fehren-Schmitz L, Warnberg O, Reindel M, Seidenberg V, Tom-asto-Cagigao E, Isla-Cuadrado J, Hummel S, Herrmann B.2011. Diachronic investigations of mitochondrial and Y-chro-mosomal genetic markers in pre-Columbian Andean High-landers from South Peru. Ann Hum Genet 75:266–283.
Figueiro G, Sans M. 2007. Primeros resultados del analisis deADN mitochondrial del sitio Arroyo Seco 2. Provincia de Bue-nos Aires, Argentina. Rev Arg Antrop Biol 9:78.
Garcia-Bour J, Perez-Perez A, Alvarez S, Fernandez A, Lopez-Parra AM, Arroyo-Pardo E, Turbo Daniel. 2004. Early popula-tion differentiation in extinct aborigines from Tierra delFuego-Patagonia: ancient mtDNA sequences and Y-chromo-some STR characterization. Am J Phys Anthropol 123:361–370.
Gilbert MTP, Jenkins DL, Gotherstrom A, Naveran N, SanchezJJ, Hofreiter M, Thomsen PF, Binladen J, Higham TFG, YoheII RM, Parr R, Cummings LS, Willerslev E. 2008a. DNAfrom pre-Clovis human coprolites in Oregon. North America.Science 320:786.
Gilbert MTP, Kivisild T, Gronnow B, Andersen PK, Metspalu E.Axelsson E, Gotherstrom A, Campos PF, Rasmussen M, Met-spalu M, Higham TFG, Schwenninger J-L, Nathan R, DeHoog C-J, Koch A, Møller LN, Andreasen C, Meldgaard M,Villems R, Bendixen C, Willerslev E. 2008b. Paleo-EskimomtDNA genome reveals matrilineal discontinuity in Green-land. Science 320:1787–1789.
Goebel T, Waters MR, O’Rourke DH. 2008. The Late Pleistocenedispersal of modern humans in the Americas. Science319:1497–1502.
Gonzalez-Jose R, Bortolini MC, Santos FR, Bonatto SL. 2008.The peopling of America: craniofacial shape variation on acontinental scale and its interpretation from an interdiscipli-nary view. Am J Phys Anthropol 137:175–187.
Gonzalez-Oliver A, Marquez-Morfın L, Jimenez JC, Torre-Blanco A. 2001. Founding Amerindian mitochondrial DNAlineages in ancient Maya from Xcaret. Quintana Roo. Am JPhys Anthropol 116:230–235.
Halverson MS, Bolnick DA. 2008. An ancient DNA test of afounder effect in Native American ABO blood group frequen-cies. Am J Phys Anthropol 137:342–247.
Hayes MG. 2002. Paleogenetic assessments of human migrationand population replacement in North American arctic prehis-tory. Ph.D. Dissertation, Salt Lake City: University of Utah.
Hayes MG, Coltrain JB, O’Rourke DH. 2003. Mitochondrialanalyses of Dorset, Thule,Sadlermiut, and Aleut skeletal sam-ples from the prehistoric North American Arctic. In: LynnerupN, Andreasen C, Berglund J, editors. Mummies in a new mil-lennium: Proceedings of the 4th World Congress on MummyStudies. Copenhagen: Danish Polar Center. p 125–128.
Hayes MG, Coltrain JB, O’Rourke DH. 2005. Molecular archae-ology of the Dorset, Thule, and Sadlermiut: ancestor-descend-ant relationships in eastern North American arctic prehistory.In: Sutherland P, editor. Contributions to the Study of theDorset Palaeo-Eskimos, Mercury Series, Archaeological Paper167. Hull, Quebec: Canadian Museum of Civilization.
Henn BM, Gignoux CR, Feldman MW, Mountain JL. 2008.Characterizing the time dependency of human mitochondrialDNA mutation rate estimates. Mol Biol Evol 26:217–230.
Ho SY, Endicott P. 2008. The crucial role of calibration in molec-ular date estimates for the peopling of the Americas. Am JHum Genet 83:142–146; author reply 146–147.
Kaestle FA. 1998. Molecular evidence for prehistoric NativeAmerican population movement: the Numic expansion. Ph.D.
dissertation, Department of Anthropology, University of Cali-fornia, Davis.
Kaestle PA, Horsburgh KA. 2002. Ancient DNA in anthropology:methods, applications, and ethics. Yrbk Phys Anthropol 45:92–130.
Kaestle F, Smith DG. 2001. Ancient Native American DNA fromwestern Nevada: implications for the Numic expansion hy-pothesis. Am J Phys Anthropol 115:1–12.
Kemp BM, Resendez A, Berrelleza JAR, Malhi RS, Smith DG.2005. An analysis of ancient Aztec mtDNA from Tlatelolco: pre-Columbian relations and the spread of Uto-Aztecan. In: ReedDM, editor. Biomolecular archaeology: genetic approaches to thepast. Occasional Paper No. 32. Southern Illinois University, Car-bondale: Center for Archaeological Investigations. p 22–46.
Kemp BM, Malhi RS, McDonough J, Bolnick DA, Eshleman JA,Rickards O, Martinez-Labarga C, Johnson JR, Lorenz JG,Dixon J, Fifield TE, Heaton TH, Worl R, Smith DG. 2007.Genetic analysis of Early Holocene skeletal remains fromAlaska and its implications for the settlement of the Ameri-cas. Am J Phys Anthropol 132:605–621.
Kemp BM, Schurr TG. 2010. Ancient and modern genetic varia-tion in the Americas. In: Auerbach BM, editor. Human vari-ation in the Americas. Center for Archaeological Investiga-tions, Occasional Paper No. 38. Southern Illinois UniversityCarbondale. pp. 12–50.
Kemp BM, Tung TA, Summar ML. 2009. Genetic continuity af-ter the collapse of the Wari empire: Mitochondrial DNA pro-files from Wari and post-Wari populations in the ancientAndes. Am J Phys Anthropol 140:80–91.
Lalueza C, Perez-Perez A, Prats E, Cornudella L, Turbon D.1997. Lack of founding Amerindian mitochondrial DNA line-ages in extinct aborigines from Tierra de Fuego-Patagonia.Hum Mol Genet 6:41–46.
Lalueza-Fox C, Calderon FL, Calafell F, Morera B, BertranpetitJ. 2001. MtDNA from extinct Tainos and the peopling of theCaribbean. Ann Hum Genet 65:137–151.
Lalueza-Fox C, Gilbert MTP, Martınez-Fuentes AJ, Calafell F,Bertranpetit J. 2003. Mitochondrial DNA from pre-ColumbianCiboneys from Cuba and the prehistoric colonization of theCaribbean. Am J Phys Anthropol 121:97–108.
LeBlanc SA, Kreisman LSC, Kemp BM, Smiley FE, Carlyle SW,Dhody AN, Benjamin T. 2007. Quids and aprons: ancientDNA from artifacts from the American southwest. J FieldArcheol 32:161–176.
Lewis CM, Buikstra JE, Stone AC. 2007. Ancient DNA andgenetic continuity in the South Central Andes. Latin AmAntiq 18:145–160.
Luciani S, Fornaciari G, Rickards O, Labarga CM, Rollo F.2006. Molecular characterization of a pre-Columbian mummyand in situ coprolite. Am J Phys Anthropol 129:620–629.
Malhi RS, Breece KE, Shook BAS, Kaestle FA, Chatters JC,Hackenberger S, Smith DG. 2004. Patterns of mtDNA diver-sity in northwestern North America. Hum Biol 76:33–54.
Malhi RS, Kemp BM, Eshleman JA, Cybulski J, Smith DG, Cous-ins S, Harry H. 2007. Mitochondrial haplogroup M discoveredin prehistoric North Americans. J Archeol Sci 34:642–648.
Malhi RS, Cybulski JS, Tito RY, Johnson J, Harry H, Dan C.2010. Brief communication: Mitochondrial haplotype C4c con-firmed as a founding genome in the Americas. Am J PhysAnthropol 141:494–497.
Marchani EE, Rogers AR, O’Rourke DH. 2007. The Thulemigration: rejecting population histories using computer sim-ulation. Am J Phys Anthropol 131:281–284.
Merriwether DA, Reed DM, Ferrell RE. 1997. Ancient and con-temporary mitochondrial DNA variation in the Maya. In:Whittington, SL, Reed DM, editors. Bones of the Maya: stud-ies of ancient skeletons. Washington, DC: Smithsonian Insti-tute Press. p 208–217.
Mills L. 2003. Mitochondrial DNA analysis of the Ohio Hopewellof the Hopewell Mound Group. Ph.D. dissertation. The OhioState University, Columbus.
Monsalve MV, Stone AC, Lewis CM, Rempel A, Richards M,Straathof D, Devine DV. Molecular Analysis of the KwadayDan Ts’ınchi Ancient Remains Found in a Glacier in Canada.Am J Phys Anthropol 119:288–291.
513ANCIENT DNA AND AMERICAN PREHISTORY
American Journal of Physical Anthropology
Moraga M, Santoro CM, Standen VG, Carvallo P, RothhammerF. 2005. Microevolution in prehistoric Andean populations:chronologic mtDNA variation in the desert valleys of northernChile. Am J Phys Anthropol 127:170–181.
Mulligan CJ, Kitchen A, Miyamoto MM. 2008. Updated three-stagemodel for the peopling of the Americas. PLoSOne.3:e3199.
O’Rourke DH, Hayes MG, Carlyle SW. 2000a. Ancient DNA stud-ies in physical anthropology. Ann Rev Anthropol 29:217–242.
O’Rourke DH, Hayes MG, Carlyle SW. 2000b. Spatial and tem-poral stability of mtDNA haplogroup frequencies in nativeNorth America. Hum Biol 72:15–34.
O’Rourke DH, Raff JA. 2010. The human genetic history of theAmericas: the final frontier. Curr Biol 20:R202–R207.
Parr RL, Carlyle SW, O’Rourke DH. 1996. Ancient DNA analy-sis of Fremont Amerindians of the Great Salt Lake wetlands.Am J Phys Anthropol 99:507–518.
Parr RL. 1998. Molecular genetic analysis of the Great SaltLake wetlands Fremont. Unpublished Ph.D. dissertation.Department of Anthropology, Salt Lake City: University ofUtah.
Perego UA, Achilli A, Angerhofer N, Accetturo M, Pala M, Oli-vieri A, Kashani BH, Ritchie KH, Scozzari R, Kong Q-P,Myres NM, Salas A, Semino O, Bandelt H-J, Woodward SR,Torroni A. 2009. Distinctive but concomitant Paleo-Indianmigration routes from Beringia marked by two rare mtDNAhaplogroups. Curr Biol 19:1–8.
Perego UA, Angerhofer N, Pala M, Olivieri A, Lancioni H,Kashani BH, Carossa V, Ekins JE, Gomez-Carballa A, HuberG, Zimmermann B, Corach D, Babudri N, Panara F, MyresNM, Parson W, Semino O, Salas A, Woodward SR, Achilli A,Torroni A. 2010. The initial peopling of the Americas: a grow-ing number of founding mitochondrial genomes from Beringia.Genome Res 20:1174–1179.
Perez SI, Bernal V, Gonzalez PN, Sardi M and Politis GG.2009. Discrepancy between cranial and DNA data of earlyAmericans: implications for American peopling. PLoS ONE4(5):e5746. doi:10.1371/journal.pone.0005746.
Raff JA. 2008. An ancient DNA perspective on the prehistory ofthe Lower Illinois Valley. Ph.D. dissertation. Indiana Univer-sity, Bloomington.
Raff JA, Tackney J, O’Rourke DH. 2010. South from Alaska: apilot aDNA study of genetic history on the Alaska Peninsulaand the Eastern Aleutians. Hum Biol 82:677–693.
Rasmussen M, Li Y, Lindgreen S, Pedersen JS, Albrechtsen A.Moltke I, Metspalu M, Metspalu E, Kivisild T, Gupta R, Ber-talan M, Nielsen K, Gilbert MTP, Wang Y, Raghavan M, Cam-pos PF, Kamp HM, Wilson AS, Gledhill A, Tridico S, BunceM, Lorenzen ED, Binladen J, Guo X, Zhao J, Zhang X, ZhangH, Li Z, Chen M, Orlando L, Kristiansen K, Bak M, Tom-merup N, Bendixen C, Pierre TL, Grønnow B, Meldgaard M,Andreasen C, Fedorova SA, Osipova LP, Higham TFG, Ram-sey CB, Hansen TVO, Nielsen FC, Crawford MH, Brunak S,Sicheritz-Pointen T, Villems R, Nielsen R, Krogh A, Wang J,Willerslev E. 2010. Ancient human genome sequence of anextinct Palaeo-Eskimo. Nature 463:757–762.
Rickards O, Martınez-Labarga C, Lum JK, De Stefano GF,Cann RL. 1999. mtDNA history of the Cayapa Amerinds of
Ecuador: detection of additional founding lineages for theNative American populations. Am J Hum Genet 65:519–530.
Schroeder KB, Jakobsson M, Crawford MH, Schurr TG, BocaSM, Conrad DF, Tito RY, Osipova LP, Tarskaia LA, ZhadanovSI, Wall JD, Pritchard JK, Malhi RS, Smith DG, RosenbergNA. 2009. Haplotypic background of a private allele at highfrequency in the Americas. Mol Biol Evol 26:995–1016.
Shimada I, Shinoda K, Farnum J, Corruccini R, Watanabe H.2004. An integrated analysis of pre-Hispanic mortuary prac-tices. Curr Anthropol 45:369–390.
Shinoda K, Adachi N, Guillen S, Shimada I. 2006. Mitochon-drial DNA analysis of ancient Peruvian highlanders. Am JPhys Anthropol 131:98–107.
Shook BAS, Smith DG. 2008. Using ancient mtDNA to recon-struct the population history of northeastern North America.Am J Phys Anthropol 137:14–29.
Smith S, Hayes MG, Cabana G, Huff C, Coltrain JB, O’RourkeDH. 2009. Inferring population continuity versus replacementwith aDNA: a cautionary tale from the Aleutian Islands. HumBiol 81:19–38.
Smith DG, Malhi RS, Eshleman JA, Kaestle FA, Kemp BM.2005. Mitochondrial DNA Haplogroups of Paleoamericans inNorth America. In: Bonnichsen R, Lepper BT, Stanford D,Waters MR, editors. Paleoamerican origins: beyond Clovis.College Station, TX: Texas A&M University Press. p 243–254.
Snow MH, Durand KR, Smith DG. 2010. Ancestral PuebloanmtDNA in context of the greater southwest. J Archeol Sci37:1635–1645.
Stone A, Stoneking M. 1998. mtDNA analysis of a prehistoricOneota population: implications for the peopling of the NewWorld. Am J Hum Gen 62:1153–1170.
Tamm E, Kivisild T, Reidla M, Metspalu M, Smith DG, Mulli-gan CJ, Bravis CM, Rickards O, Martinez-Labarga C, Khus-nutdinova EK, Fedrova SA, Golubenko MV, Stepanov VA,Grubina MA, Zhadanov SI, Ossipova LP, Damba L, VoevodaMI, Dipierri JE, Villems R, Malhi RS. 2007. Beringian stand-still and spread of Native American founders. PLoS ONE2:e829.
Van Oven M, Kayser M. 2009. Updated comprehensive phyloge-netic tree of global human mitochondrial DNA variation. HumMutat 30:E386–E394.
Wang S, Lewis CM, Jakobsson M, Ramachandran S, Ray N,Bedoya G, Rojas W, Parra MV, Molina JA, Gallo C, MazzottiG, Poletti G, Hill K, Hurtado AM, Labuda D, Klitz W, Bar-rantes R, Bortolini MC, Salzano FM, Petzl-Erler ML, TsunetoLT, Llop E, Rothhammer F, Excoffier L, Feldman MW, Rosen-berg NA, Ruiz-Linares A. 2007. Genetic variation and popula-tion structure in Native Americans. PLoS Genet 3:e185.
Yang NN, Mazieres S, Bravi C, Ray N, Wang S, Burley M-W,Bedoya G, Rojas W, Parra MV, Molina JA, Gallo C, Poletti G,Hill K, Hurtado AM, Petzl-Erler ML, Tsuneto LT, Klintz W,Barrantes R, Llop E, Rothhammer F, Labuda D, Salzano FM,Bortolini M-C, Excoffier L, Dugoujon JM, Ruiz-Linares A.2010. Contrasting patterns of nuclear and mtDNA diversityin Native American populations. Ann Hum Genet 74:525–538.
514 J.A. RAFF ET AL.
American Journal of Physical Anthropology