ancestry informative markers for fine-scale individual assignment to worldwide populations
TRANSCRIPT
Ancestry informative markers for fine-scale individualassignment to worldwide populations
Peristera Paschou,1 Jamey Lewis,2 Asif Javed,2,3 Petros Drineas2
ABSTRACTBackground and aims The analysis of large-scalegenetic data from thousands of individuals has revealedthe fact that subtle population genetic structure can bedetected at levels that were previously unimaginable.Using the Human Genome Diversity Panel as reference(51 populations - 650,000 SNPs), this works describesa systematic evaluation of the resolution that can beachieved for the inference of genetic ancestry, evenwhen small panels of genetic markers are used.Methods and results A comprehensive investigation ofhuman population structure around the world isundertaken by leveraging the power of PrincipalComponents Analysis (PCA). The problem is dissectedinto hierarchical steps and a decision tree for theprediction of individual ancestry is proposed. A completeleave-one-out validation experiment demonstrates that,using all available SNPs, assignment of individuals totheir self-reported populations of origin is essentiallyperfect. Ancestry informative genetic markers areselected using two different metrics (In and correlationwith PCA scores). A thorough cross-validationexperiment indicates that, in most cases here, thenumber of SNPs needed for ancestry inference can besuccessfully reduced to less than 0.1% of the original650,000 while retaining close to 100% accuracy. Thisreduction can be achieved using a novel clustering-basedredundancy removal algorithm that is also introducedhere. Finally, the applicability of our suggested SNPpanels is tested on HapMap Phase 3 populations.Conclusion The proposed methods and ancestryinformative marker panels, in combination with theincreasingly more comprehensive databases of humangenetic variation, open new horizons in a variety of fields,ranging from the study of human evolution andpopulation history, to medical genetics and forensics.
INTRODUCTIONThe patterns of human genetic variation aroundthe globe have been forged by the history of thehuman population. As indicated from fossil recordsand population genetics studies, anatomicallymodern humans first appeared in Africa some200 000e150 000 years ago.1e3 About 60 000 yearsago humans left Africa in waves of migrations and,through a sequential chain of colonies, spread tooccupy most of today ’s land masses. During thisjourney they encountered different environmentsand climates and came in contact with novelpathogens and animals. They formed localcommunities, separated by geographic, linguistic,cultural, and social barriers. Mutation, genetic drift,and natural selection operated in parallel withdemographic and historical events to weave the
patterns of human variation in extant populations.The result of this interplay was the imprint ofgenetic ancestry and population structure carried inthe genome of each individual.Analysing microsatellite markers that spanned
the entire genome, Rosenberg et al4 were the first toreport on the patterns of human genetic variationand population genetic structure based on genomewide data, revealing clines of genetic diversityaround the world. The advent of modern technolo-gies and the realisation of the HapMap projectallowed the detailed characterisation of humangenetic variation across all chromosomes in diversepopulations using dense marker maps.5e7 Never-theless, the thorough evaluation of the extent offine-scale genetic structure among closely neigh-bouring populations, as well as the study of theability to infer individual membership down toa particular population within a continent, haveonly begun in the past 3 years.8e12 The initial releaseof dense genotypic data on the Human GenomeDiversity Panel (HGDP),8 a collection of samplesincluding more than 1000 individuals from 51populations from around the world,13 14 showedthat fine-scale population differentiation was indeedpossible, when hundreds of thousands of singlenucleotide polymorphisms (SNPs) were studied.The complex fine-scale genetic structure of Euro-pean populations was recently presented in evengreater detail with data available from multiple,closely neighbouring populations, revealing strongcorrelation of genetic background with geographicalcoordinates.9e12 Similar results were obtained fromthe first fine -scale study of African diversity,15
focusing on 121 African populations.With the volume of rich genotypic data rapidly
increasingdthanks to high throughput genotypingand the availability of dense geographic samplesdprincipal components analysis (PCA) emerged asa powerful technique that can be used to summariseand process the vast amounts of available informa-tion. PCA is a linear dimensionality reduction tech-nique that can effectively extract the fundamentalstructure of a dataset without any need for modellingof the data. It has been used to decompose thecomplex genetic structure of human populations4 8 16
and it can be successfully applied to infer geneticancestry aswell as substructure in a given sample.17 18
Importantly, it has become an effective tool for thecorrection of biases produced by the existence ofstratification in large scale, genome wide associationstudies seeking to uncover the genetic basis ofcomplex disorders.17e19
Using PCA, as well as a fast, efficient imple-mentation of a maximum likelihood methodimplemented in the software frappe,20 Li et al8
< Additional methods, figuresand tables are published onlineonly. To view these files pleasevisit the journal online (http://jmg.bmj.com).1Department of MolecularBiology and Genetics,Democritus University of Thrace,Alexandroupoli, Greece2Department of ComputerScience, Rensselaer PolytechnicInstitute, Troy, New York, USA3Computational Biology Group,IBM T.J. Watson ResearchCenter, Yorktown Heights, NewYork, USA
Correspondence toDr Peristera Paschou,Department of MolecularBiology and Genetics,Democritus University of Thrace,Panepistimioupoli, Dragana,Ktirio 8, Alexandroupoli 68100,Greece;[email protected]
Received 18 February 2010Revised 28 April 2010Accepted 1 June 2010Published Online First4 October 2010
J Med Genet 2010;47:835e847. doi:10.1136/jmg.2010.078212 835
Original article
group.bmj.com on April 30, 2014 - Published by jmg.bmj.comDownloaded from
analysed the HGDP samples focusing on the top few axes ofvariation, as revealed by PCA, and found that individualancestry and substructure were detectable with very high reso-lution. Biswas et al16 further explored the structure identified byPCA in this dataset, performing a thorough examination oflower order principal components (PCs) that they foundsignificantly correlated with structure in the complete dataset orin subsets of the data corresponding to the seven predefinedbroad geographic regions of the HGDP data. They showed that,although most researchers traditionally focus on the top fewaxes of variation in a dataset, substantial information aboutpopulation structure exists in lower ranked PCs. They proceededto identify all SNPs that were significantly correlated with thetop two PCs and showed that, to some extent, these markerscould be used to reconstruct the structure of the completedataset. However, they did not attempt to evaluate the perfor-mance of small panels of ancestry informative markers (AIMs)for ancestry inference or population structure identification. Infact, given all 51 HGDP populations from around the world, noprevious study has attempted the systematic evaluation of thepotential to infer the ancestry of a given individual down toa particular population using small panels of SNPs. It should alsobe emphasised that no previous study of such large scale hasactually viewed the question of inferring individual ancestry asa classification problem. Classification is a goal which is parallel,but more challenging, than simply analysing genetic data fromdifferent populations in order to investigate the extent to whichthese populations can be differentiated. Classification involvescross-validation experiments of assigning individuals of“unknown” origin to one of several reference populations.
The identification of AIMs is a topic that has attractedconsiderable attention due to the value of such markers indiverse areas, ranging from forensics, to population genetics,conservation genetics, and medical genetics. Different metricshave been proposed in order to select such markers. Most ofthem (eg, d, Wright’s FST, etc) rely on the maximisation of allelefrequency differences between predefined populations.21e27
A closely correlated measure, informativeness for assignment(In), as defined by Rosenberg et al,28 computes a mutual infor-mation based metric on allele frequencies. Leveraging the prop-erties of PCA we described a method that identifies SNPs thatare correlated with significant PCs (PCA correlated SNPs or PCAinformative markersdPCAIMs for short).18 In fact, wedemonstrated that small panels of such SNPs can successfullyreproduce the structure of a dataset, as identified by PCA,without any prior knowledge or hypothesis on the origin ofstudied individuals or artificial assignment of individuals topredefined clusters.18 29
The results described herein are a systematic investigation, ata worldwide level, of the extent to which an individual ofunknown origin can be assigned to a particular population usingonly information from small panels of carefully selected SNPs.Using the HGDP data from 51 populations and 650 000 SNPs asreference,8 we first performed a comprehensive investigation ofthe structure of the dataset as identified by PCA. Instead ofseeking to uncover information in lower ranked PCs, wedissected the problem into hierarchical steps, proposing a deci-sion tree for the prediction of individual ancestry. Afterprocessing information at each level we proceeded to analyse thenext one, exposing the picture of population structure in furtherresolution until all meaningful information was extracted. AIMswere selected using two different metrics (In28 and PCAscores18). Faced with the problem of redundancy in the infor-mation carried by the selected AIMs, we proposed and evaluated
a simple, clustering-based, strategy in order to minimise thenumber of markers needed for the inference of populationstructure. In order to estimate the generalisation error of ourmethods, we ran over 800 PCA computations and report resultson a thorough cross-validation experiment. Finally, we tested theapplicability of our suggested SNP panels on HapMap Phase 3populations. Our results demonstrate that fine-scale inference ofindividual ancestry is indeed possible even with small, albeitjudiciously selected, sets of genetic markers.
METHODSDatasetsWe studied a previously described dataset of 1043 individualsfrom 51 populations from around the world.8 These samples canbe classified into seven broad geographic regions (Africa, MiddleEast, Europe, Central South Asia, East Asia, Oceania, andAmerica). The samples have been genotyped for approximately650 000 SNPs across the genome using the Illumina 650Y array.As a second dataset we also studied SNPs for the selectedancestry informative panels from the HapMap Phase 3 databaseon the Yoruba (YRI), African American from Southwest USA(ASW), Luhya in Webuye, Kenya (LWK), Maasai in Kinyawa,Kenya (MKK), CEPH European (CEU), Italian from Tuscany(TSI), Chinese from Beijing and the Denver Metropolitan area(CHB and CHD), Japanese (JPT), Gujarati Indians in Houston,Texas (GIH), and Mexicans in Los Angeles, California (MEX)samples.5e7 For all datasets we only considered SNPs on auto-somal chromosomes in our analysis. We excluded SNPs withmore than 10% missing entries, and we analysed a total of643 862 SNPs. A small number of outlier individuals were alsoremoved from further analysis. Full details on preprocessing andencoding the data are provided in the supplementary material.
Selecting ancestry informative markers and removingredundancyIn order to select ancestry informative markers (AIMs), we usedtwo previously described procedures. The first procedure18 29
returns the so-called PCA informative markers or PCAIMs forshort and is based on the well documented fact that PCA revealspopulation structure.17 18 30e33 The PCAIM selection algorithmfirst determines the number of significant principal components(and thus the number of informative eigenSNPs) in the data (see
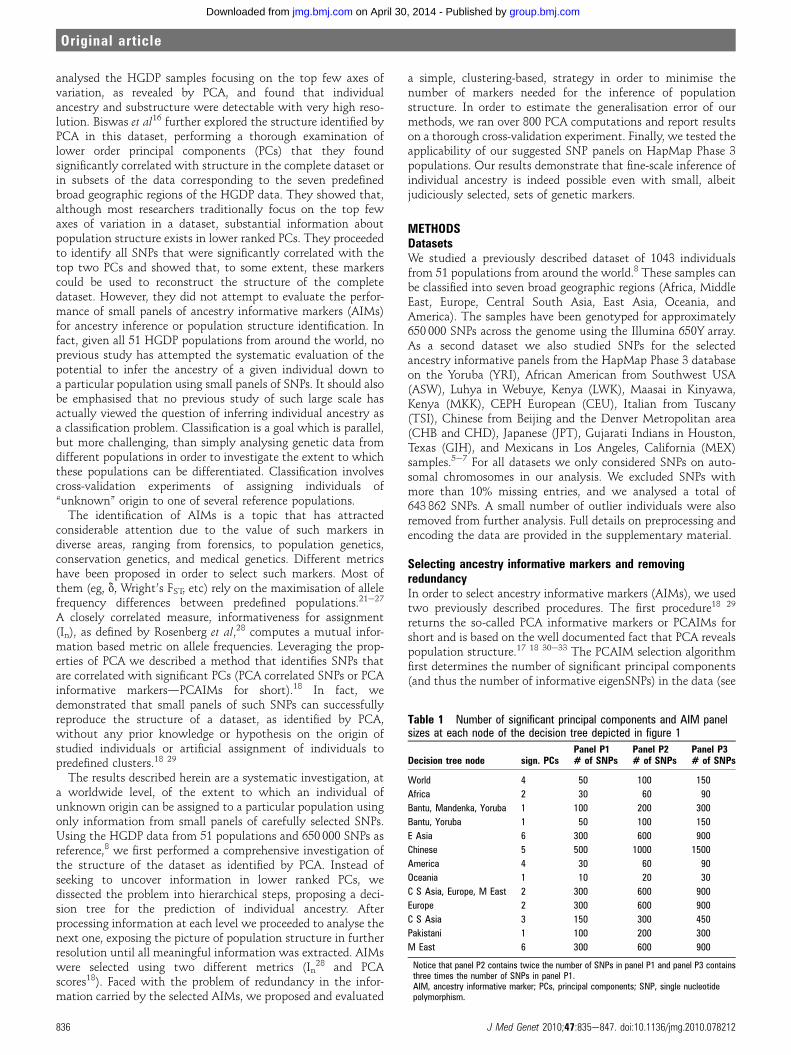
Table 1 Number of significant principal components and AIM panelsizes at each node of the decision tree depicted in figure 1
Decision tree node sign. PCsPanel P1 Panel P2 Panel P3# of SNPs # of SNPs # of SNPs
World 4 50 100 150
Africa 2 30 60 90
Bantu, Mandenka, Yoruba 1 100 200 300
Bantu, Yoruba 1 50 100 150
E Asia 6 300 600 900
Chinese 5 500 1000 1500
America 4 30 60 90
Oceania 1 10 20 30
C S Asia, Europe, M East 2 300 600 900
Europe 2 300 600 900
C S Asia 3 150 300 450
Pakistani 1 100 200 300
M East 6 300 600 900
Notice that panel P2 contains twice the number of SNPs in panel P1 and panel P3 containsthree times the number of SNPs in panel P1.AIM, ancestry informative marker; PCs, principal components; SNP, single nucleotidepolymorphism.
836 J Med Genet 2010;47:835e847. doi:10.1136/jmg.2010.078212
Original article
group.bmj.com on April 30, 2014 - Published by jmg.bmj.comDownloaded from

table 1 for the number of significant principal components andsupplementary material for a detailed description of how thisnumber was determined for the purposes of the analysespresented here). Subsequently, a score is assigned to each SNP,with higher scores corresponding to SNPs that correlate wellwith all informative eigenSNPs. The algorithm returns the topscoring SNPs, and we have demonstrated that these PCAIMs arevery efficient for ancestry prediction.18 The second procedurecomputes the so-called informativeness for assignment (In)metric, a mutual information based statistic that takes intoaccount self-reported ancestry information from the sampledindividuals.28 We call the selected markers In AIMs for short.
It is worth noting that neither method takes any specialmeasures in order to avoid redundancy in the set of identifiedmarkers. Such redundancy, especially in the case of dense sets ofSNP markers, is typically due to tight linkage disequilibrium. InPaschou et al29 we proposed a linear-algebraic method to removeredundancy from the selected PCAIMs. Our methodology wasbased on reducing the redundancy removal problem to theso-called column subset selection problem and on leveragingalgorithms and software that are available for the latter problem.Subsequent to our work, Boutsidis et al34 reported a simpler,alternative strategy for redundancy removal within the contextof data analysis: given genotypic information on m individualsand r AIMs (either PCAIMs or In AIMs), as well as a target panelsize k, cluster the r AIMs in k clusters and return one represen-tative AIM from each cluster. This strategy reduces the redun-dancy removal problem to a clustering problem, for whichefficient and highly accurate software packages are available. Anadditional advantage of clustering is that instead of returning justa set of k non-redundant AIMs, it also returns k lists (clusters) ofAIMs. Within each list, the selected markers are, at least to someextent, interchangeable. This makes the task of interpreting thefunctionality of selected AIMs easier and also provides someflexibility to researchers that are interested in forming ancestryinformative panels to choose alternative markers.
In light of the above discussion, we evaluated clustering viastraightforward methods as a solution for the redundancyremoval problem. More specifically, we used the publicly avail-able software ClutoCluster35 with default parameters. Ourmetric of similarity was the cosine of the angle between them-dimensional vectors representing the AIMs, which exactlycoincides with the metric of similarity used by PCA. We alsocompared the performance of clustering for redundancy removalto the method of Paschou et al29 and found the two methods toperform comparably (data not shown), with clustering beingabout five times slower but slightly more accurate. This obser-vation, combined with the improved interpretability of clus-tering, seems to support the conclusions of Boutsidis et al34 thatclustering is a very useful way of addressing the redundancyremoval problem.
Ancestry prediction via nearest neighboursWe model ancestry prediction using panels of AIMs as thefollowing task: given a database of m individuals of known (eg,self-reported) population of origin, genotyped on a panel of kAIMs, and a new individual of unknown ancestry genotyped onthe same panel, we seek to predict the population of origin ofthe new sample. This is a standard classification problem and inorder to address it we chose to use one of the most intuitivemethods available in the machine learning literature, namelya nearest neighbour (NN) approach. NN-type algorithms firstcompute the distance of the new sample from the m individualsin the database and then identify the n ‘nearest neighbours’ of
the new sample. A majority voting strategy is used in order toassign a population of origin to the new sample. We experi-mented with different values of n (the number of nearestneighbours) ranging from five up to 10 in increments of onewithout observing a consistent advantage in using any valueabove five. Thus, we chose to fix n to five; as a result, in order toassign an individual to a population X we necessitate that atleast three of its five nearest neighbours belong to the samepopulation X. If such consensus cannot be reached, we do notreturn a prediction. We will refer from now on to our classifi-cation methodology as 5-NN. Finally, in order to deal withindividuals that are far away from the reference populations, weaugmented our nearest neighbour computation with a simpleconfidence metric discarding nearest neighbours whose distanceexceeds the 95% threshold in the distribution of observeddistances. Individuals with three or more ‘discarded’ nearestneighbours are classified as unknown.In almost all our experiments we chose the identity-by-state
(IBS) distance as our metric of similarity. IBS simply measuresthe number of alleles that agree between the genotypes of thetwo samples. The only exception is one experiment where werepresented the genotypic data of the HGDP individuals byprojecting them on the top few eigenSNPs, which results infractional values for the genotypes. Since the IBS distance wasnot immediately applicable in this setting, we used a standardgeneralisation, the Euclidean distance, instead.To conclude, we note that more advanced classification
methodologies and/or better distance metrics might be appli-cable to our task. It is quite interesting and exciting that stan-dard, simple methods such as 5-NN and IBS are highly accurateand very useful. Finally, details on our validation and cross-validation experiments, as well as our accuracy metrics, areavailable in the supplementary material.
RESULTSDecomposing the structure of worldwide human populationsWe decided to dissect the problem of recovering individualancestry at a fine scale into hierarchical steps, thus attempting todecompose worldwide human population structure. Weperformed a detailed investigation of the observed patterns ofgenetic variation and population relationships in the studiedsamples as captured by PCA (see plots of projections of thesamples on the top eigenSNPs at the online material at http://www.cs.rpi.edu/wdrinep/HGDPAIMS/). Our aim was to split theavailable populations into groups and levels in a decision tree untilall meaningful information provided by PCA could be extracted.Thus, we clustered populations into groups according to geog-raphy; membership to these groups was fine-tuned based on visualinspection of the top 10 PCs for each such group of populations.Our analysis is summarised in the decision tree for individualassignment to a particular population as shown in figure 1.According to the above scheme, and as we will describe in
detail in the following sections, individuals are first classified toone of five broad geographic regions: Africa, Europe-Middle East-Central South Asia, East Asia, Oceania, and America. Movingfurther down in the decision tree, individuals are classified intolower level nodes and are finally assigned to the deepest clusterthat can be inferred given the HGDP dataset. Depending on thecomplexity of population structure within each region, as wellas the genetic homogeneity of populations sampled for each ofthese regions, one or more levels may follow the initial assign-ment of an individual to one of the five broad geographic clustersof the initial node of our tree (world node, figure 1).
J Med Genet 2010;47:835e847. doi:10.1136/jmg.2010.078212 837
Original article
group.bmj.com on April 30, 2014 - Published by jmg.bmj.comDownloaded from
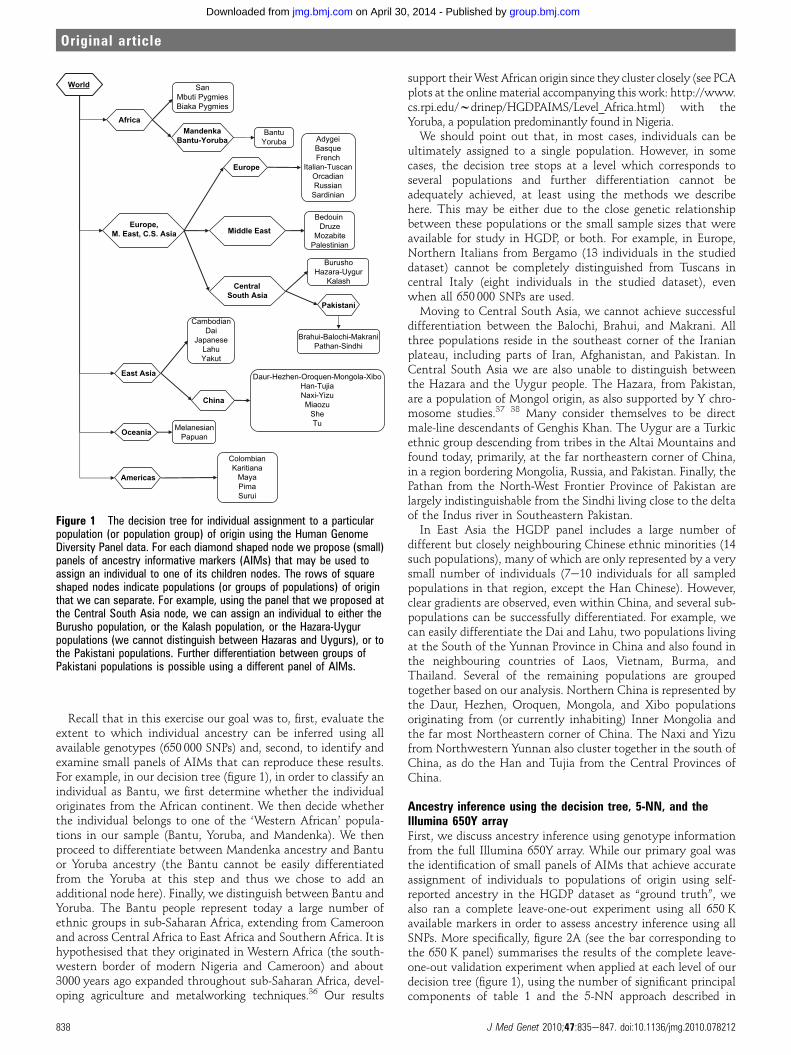
Recall that in this exercise our goal was to, first, evaluate theextent to which individual ancestry can be inferred using allavailable genotypes (650 000 SNPs) and, second, to identify andexamine small panels of AIMs that can reproduce these results.For example, in our decision tree (figure 1), in order to classify anindividual as Bantu, we first determine whether the individualoriginates from the African continent. We then decide whetherthe individual belongs to one of the ‘Western African’ popula-tions in our sample (Bantu, Yoruba, and Mandenka). We thenproceed to differentiate between Mandenka ancestry and Bantuor Yoruba ancestry (the Bantu cannot be easily differentiatedfrom the Yoruba at this step and thus we chose to add anadditional node here). Finally, we distinguish between Bantu andYoruba. The Bantu people represent today a large number ofethnic groups in sub-Saharan Africa, extending from Cameroonand across Central Africa to East Africa and Southern Africa. It ishypothesised that they originated in Western Africa (the south-western border of modern Nigeria and Cameroon) and about3000 years ago expanded throughout sub-Saharan Africa, devel-oping agriculture and metalworking techniques.36 Our results
support theirWest African origin since they cluster closely (see PCAplots at the online material accompanying this work: http://www.cs.rpi.edu/wdrinep/HGDPAIMS/Level_Africa.html) with theYoruba, a population predominantly found in Nigeria.We should point out that, in most cases, individuals can be
ultimately assigned to a single population. However, in somecases, the decision tree stops at a level which corresponds toseveral populations and further differentiation cannot beadequately achieved, at least using the methods we describehere. This may be either due to the close genetic relationshipbetween these populations or the small sample sizes that wereavailable for study in HGDP, or both. For example, in Europe,Northern Italians from Bergamo (13 individuals in the studieddataset) cannot be completely distinguished from Tuscans incentral Italy (eight individuals in the studied dataset), evenwhen all 650 000 SNPs are used.Moving to Central South Asia, we cannot achieve successful
differentiation between the Balochi, Brahui, and Makrani. Allthree populations reside in the southeast corner of the Iranianplateau, including parts of Iran, Afghanistan, and Pakistan. InCentral South Asia we are also unable to distinguish betweenthe Hazara and the Uygur people. The Hazara, from Pakistan,are a population of Mongol origin, as also supported by Y chro-mosome studies.37 38 Many consider themselves to be directmale-line descendants of Genghis Khan. The Uygur are a Turkicethnic group descending from tribes in the Altai Mountains andfound today, primarily, at the far northeastern corner of China,in a region bordering Mongolia, Russia, and Pakistan. Finally, thePathan from the North-West Frontier Province of Pakistan arelargely indistinguishable from the Sindhi living close to the deltaof the Indus river in Southeastern Pakistan.In East Asia the HGDP panel includes a large number of
different but closely neighbouring Chinese ethnic minorities (14such populations), many of which are only represented by a verysmall number of individuals (7e10 individuals for all sampledpopulations in that region, except the Han Chinese). However,clear gradients are observed, even within China, and several sub-populations can be successfully differentiated. For example, wecan easily differentiate the Dai and Lahu, two populations livingat the South of the Yunnan Province in China and also found inthe neighbouring countries of Laos, Vietnam, Burma, andThailand. Several of the remaining populations are groupedtogether based on our analysis. Northern China is represented bythe Daur, Hezhen, Oroquen, Mongola, and Xibo populationsoriginating from (or currently inhabiting) Inner Mongolia andthe far most Northeastern corner of China. The Naxi and Yizufrom Northwestern Yunnan also cluster together in the south ofChina, as do the Han and Tujia from the Central Provinces ofChina.
Ancestry inference using the decision tree, 5-NN, and theIllumina 650Y arrayFirst, we discuss ancestry inference using genotype informationfrom the full Illumina 650Y array. While our primary goal wasthe identification of small panels of AIMs that achieve accurateassignment of individuals to populations of origin using self-reported ancestry in the HGDP dataset as “ground truth”, wealso ran a complete leave-one-out experiment using all 650 Kavailable markers in order to assess ancestry inference using allSNPs. More specifically, figure 2A (see the bar corresponding tothe 650 K panel) summarises the results of the complete leave-one-out validation experiment when applied at each level of ourdecision tree (figure 1), using the number of significant principalcomponents of table 1 and the 5-NN approach described in
Africa
Europe,M. East, C.S. Asia
East Asia
Oceania
Americas
SanMbuti PygmiesBiaka Pygmies
BantuYoruba
Europe
Middle East
CentralSouth Asia
AdygeiBasqueFrench
Italian-TuscanOrcadianRussian
Sardinian
Bedouin Druze
MozabitePalestinian
Pakistani
BurushoHazara-Uygur
Kalash
Brahui-Balochi-MakraniPathan-Sindhi
China
CambodianDai
JapaneseLahuYakut
MelanesianPapuan
ColombianKaritiana
MayaPimaSurui
Daur-Hezhen-Oroquen-Mongola-XiboHan-TujiaNaxi-YizuMiaozu
SheTu
World
MandenkaBantu-Yoruba
Figure 1 The decision tree for individual assignment to a particularpopulation (or population group) of origin using the Human GenomeDiversity Panel data. For each diamond shaped node we propose (small)panels of ancestry informative markers (AIMs) that may be used toassign an individual to one of its children nodes. The rows of squareshaped nodes indicate populations (or groups of populations) of originthat we can separate. For example, using the panel that we proposed atthe Central South Asia node, we can assign an individual to either theBurusho population, or the Kalash population, or the Hazara-Uygurpopulations (we cannot distinguish between Hazaras and Uygurs), or tothe Pakistani populations. Further differentiation between groups ofPakistani populations is possible using a different panel of AIMs.
838 J Med Genet 2010;47:835e847. doi:10.1136/jmg.2010.078212
Original article
group.bmj.com on April 30, 2014 - Published by jmg.bmj.comDownloaded from
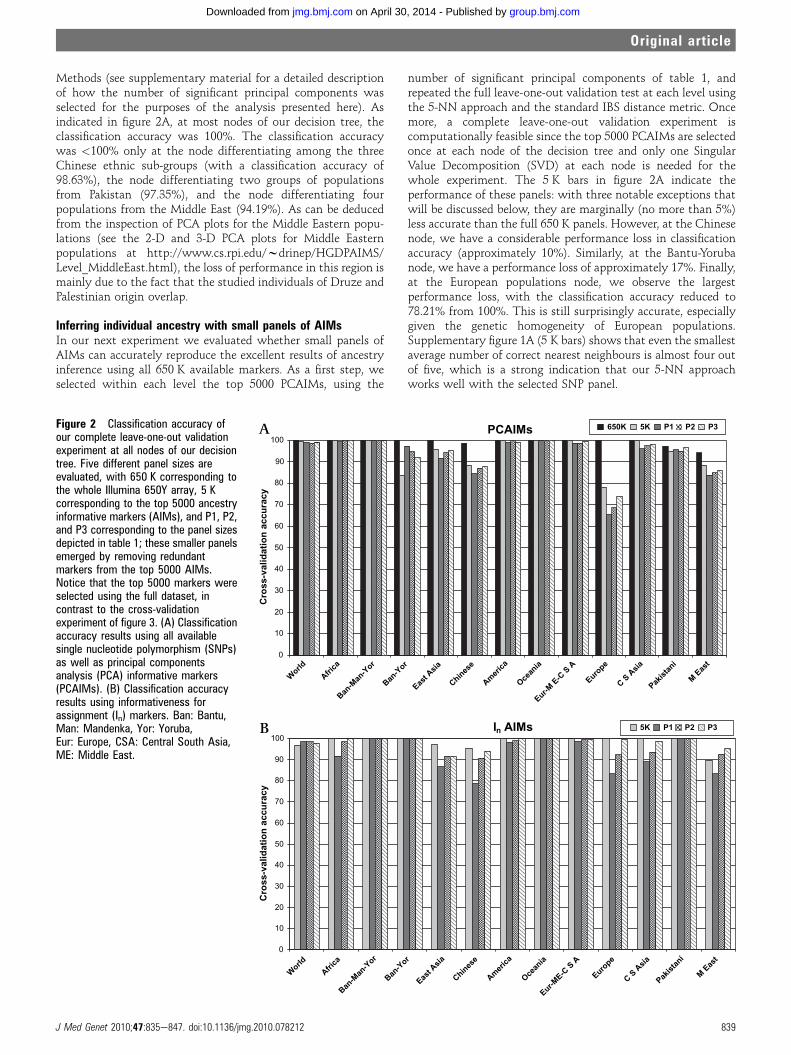
Methods (see supplementary material for a detailed descriptionof how the number of significant principal components wasselected for the purposes of the analysis presented here). Asindicated in figure 2A, at most nodes of our decision tree, theclassification accuracy was 100%. The classification accuracywas <100% only at the node differentiating among the threeChinese ethnic sub-groups (with a classification accuracy of98.63%), the node differentiating two groups of populationsfrom Pakistan (97.35%), and the node differentiating fourpopulations from the Middle East (94.19%). As can be deducedfrom the inspection of PCA plots for the Middle Eastern popu-lations (see the 2-D and 3-D PCA plots for Middle Easternpopulations at http://www.cs.rpi.edu/wdrinep/HGDPAIMS/Level_MiddleEast.html), the loss of performance in this region ismainly due to the fact that the studied individuals of Druze andPalestinian origin overlap.
Inferring individual ancestry with small panels of AIMsIn our next experiment we evaluated whether small panels ofAIMs can accurately reproduce the excellent results of ancestryinference using all 650 K available markers. As a first step, weselected within each level the top 5000 PCAIMs, using the
number of significant principal components of table 1, andrepeated the full leave-one-out validation test at each level usingthe 5-NN approach and the standard IBS distance metric. Oncemore, a complete leave-one-out validation experiment iscomputationally feasible since the top 5000 PCAIMs are selectedonce at each node of the decision tree and only one SingularValue Decomposition (SVD) at each node is needed for thewhole experiment. The 5 K bars in figure 2A indicate theperformance of these panels: with three notable exceptions thatwill be discussed below, they are marginally (no more than 5%)less accurate than the full 650 K panels. However, at the Chinesenode, we have a considerable performance loss in classificationaccuracy (approximately 10%). Similarly, at the Bantu-Yorubanode, we have a performance loss of approximately 17%. Finally,at the European populations node, we observe the largestperformance loss, with the classification accuracy reduced to78.21% from 100%. This is still surprisingly accurate, especiallygiven the genetic homogeneity of European populations.Supplementary figure 1A (5 K bars) shows that even the smallestaverage number of correct nearest neighbours is almost four outof five, which is a strong indication that our 5-NN approachworks well with the selected SNP panel.
Figure 2 Classification accuracy ofour complete leave-one-out validationexperiment at all nodes of our decisiontree. Five different panel sizes areevaluated, with 650 K corresponding tothe whole Illumina 650Y array, 5 Kcorresponding to the top 5000 ancestryinformative markers (AIMs), and P1, P2,and P3 corresponding to the panel sizesdepicted in table 1; these smaller panelsemerged by removing redundantmarkers from the top 5000 AIMs.Notice that the top 5000 markers wereselected using the full dataset, incontrast to the cross-validationexperiment of figure 3. (A) Classificationaccuracy results using all availablesingle nucleotide polymorphism (SNPs)as well as principal componentsanalysis (PCA) informative markers(PCAIMs). (B) Classification accuracyresults using informativeness forassignment (In) markers. Ban: Bantu,Man: Mandenka, Yor: Yoruba,Eur: Europe, CSA: Central South Asia,ME: Middle East.
PCAIMs
0
10
20
30
40
50
60
70
80
90
100
World
Africa
Ban-M
an-Y
or
Ban-Y
or
East A
sia
Chines
e
Amer
ica
Ocean
ia
Eur-M E
-C S
A
Europe
C S A
sia
Pakist
ani
M Eas
t
Cro
ss-v
alid
atio
n a
ccu
racy
650K 5K P1 P2 P3
In AIMs
0
10
20
30
40
50
60
70
80
90
100
World
Africa
Ban-M
an-Y
or
Ban-Y
or
East A
sia
Chines
e
Amer
ica
Ocean
ia
Eur-ME-C
S A
Europe
C S A
sia
Pakist
ani
M Eas
t
Cro
ss-v
alid
atio
n a
ccu
racy
5K P1 P2 P3
A
B
J Med Genet 2010;47:835e847. doi:10.1136/jmg.2010.078212 839
Original article
group.bmj.com on April 30, 2014 - Published by jmg.bmj.comDownloaded from

We already observed in prior work29 that such panels of AIMstend to contain large amounts of redundant markers, mainly dueto linkage disequilibrium (LD) between densely typed markers.Thus, our next step was the removal of redundant markers viathe clustering technique described in Methods. We experimentedwith numerous panel sizes and we chose to report results onthree different panels (P1, P2, and P3) for each node in ourdecision tree. The panel sizes are connected: the number ofmarkers in P2 is equal to twice the number of markers in P1, andthe number of markers in P3 is equal to three times the numberof markers in P1 (table 1). Not surprisingly, the number ofmarkers necessary for ancestry inference is very different at thevarious nodes of the decision tree, reflecting the fact that certain(groups of) populations are more or less genetically homoge-neous. For example, by inspecting figure 2A and table 1, weconclude that, within the setting of this experiment, 50 SNPssuffice to classify an individual to one of the five broadgeographic regions at the topmost node of our decision tree withan accuracy of 98.9%. Individuals who fall within the Europe-Middle East-Central South Asia cluster can be further assignedto one of these three regions using an additional 300 SNPs(98.7% accuracy). Thus, this experiment indicates that 350 SNPsachieve almost perfect classification accuracy in assigning indi-viduals to one of the seven broad geographic regions sampled inthe HGDP.
A few interesting observations arise by inspecting figure 2A.First, even our smallest panels of AIMs (panels P1) achieve veryhigh accuracy at most nodes of our decision tree. A notable lossof performance is observed when attempting to classify Euro-pean individuals. In this case, using 300 markers we can achieve65.4% classification accuracy, which improves to 73.7% using900 markers. This is still well below the 100% accuracy that isachieved using all 650 000 SNPs, but quite close to the 78.2%accuracy that is achieved using the top 5000 PCAIMs. Much lessdramatic losses in accuracy (not exceeding 5%) are observed forthe closely related Chinese populations (with 500 markersachieving 84.2% classification accuracy, and 1500 markersachieving 87.7% classification accuracy), as well as the MiddleEastern and, to a lesser degree, the East Asian populations. Wealso observe that, in general, our largest panels (panels P3)perform as well as the top 5000 PCAIMs before the redundancyremoval step. This seems to reinforce the conjecture thatredundancy removal from the top PCAIMs does not significantlyaffect performance. One additional observation is the improve-ment in classification accuracy using the non-redundant panelsin the Bantu-Yoruba case, which is probably due to artefactsrelated to the removal of a large number of uninformative SNPsfrom the initial panel.
We repeated this experiment using AIMs which were selectedbased on the metric of In. Figure 2B and supplementary figure 1Bshow that, in this exploratory experiment where AIMs areselected using all available individuals, all In AIMs panels achievevery high accuracy for population assignment around the world,even within Europe, China, and the Middle East, where popu-lation differentiation with the PCAIM panels was less accurate.Two observations are immediate: first, when comparing figure2A, B, the accuracy trends are quite similar. In particular, Europeand China are the worst performing regions in both cases,especially when using the small panels P1, P2, and P3. MiddleEast is also more complex, as explained above. The secondobservation is that the better performance of the In SNPs in thiscase is due to the fact that it is a supervised method and thus, inthe setting of this experiment at least, it probably overfits thedata and selects exactly the SNPs that differentiate the various
populations. Unfortunately, this superior performance is nota good predictor of the generalisation error in a true cross-vali-dation experiment, where certain individuals are left out duringthe selection of AIMs. Indeed, as we shall see in the next section,in a true cross-validation setting the performance of In SNPpanels drops and the resulting panels have comparable orsomewhat worse performance than the PCAIMs panels.
Cross-validation experiment: leave-seven-out cross-validationusing the HGDP datasetIn our first cross-validation experiment we performed 50 splitsof the HGDP dataset, where in each split we constructed a testset consisting of seven individuals from HGDP, one from each ofthe seven broad geographic regions (Africa, Europe, Middle East,South Central Asia, East Asia, Oceania, and America). Theremaining individuals were used as a training set in order toselect PCAIMs and In AIMs, as well as input for our 5-NNclassification scheme. In each split, care was taken in order toavoid testing the same individual twice. (This was not possiblein Oceania, where the number of available individuals was <50.)Figure 3A and supplementary figures 2A, 3, 4, and 7 summarisethe performance of our PCAIM panels over all 50 3 7¼350individuals in all test sets, while figure 3B and supplementaryfigures 2B, 5, 6, and 8 demonstrate the corresponding results forIn AIMs.The overall performance of our approach using even small
panels of PCAIMs is quite remarkable at most nodes of thedecision tree in figure 1, even when fine scale populationdifferentiation is the target, both using PCAIMs and In AIMs. Inalmost every case, results are comparable to the validationresults presented in the previous section. However, in threeregions, we do observe a loss in performance. The separation ofBantu and Yoruba individuals proves more difficult. UsingPCAIMs the classification accuracy ranges from 64e72%depending on the panel size (50 up to 150 PCAIMs) while it liesbetween 57e86% with In AIMs. Using PCAIMs within EastAsia, we are able to achieve a classification accuracy rangingfrom 82% (using 300 SNPs) up to (almost) 90% (using 900SNPs), while In AIMs reach 85% with 600 SNPs. Within thisregion, a group of closely related Chinese populations are themost resistant to prediction, with accuracies that do not exceed61% even using 1500 PCAIMs (57% with In AIMs). In theMiddle East the classification accuracy using PCAIMs panelsranges from 75% (using 300 SNPs) up to 80% (using 900 SNPs),with comparable results for In AIMs. As mentioned earlier, thisis due to the difficulty in distinguishing between the Druze andPalestinians, who cannot be separated even using all 650 000SNPs.In Europe, recall that 650 000 SNPs achieve essentially 100%
classification accuracy, while with 5000 PCAIMs (selected usingall available Europeans as training set) the accuracy drops to78.2%. In our cross-validation experiment, the classificationaccuracy ranges from 51% using 300 PCAIMs up to 68% using900 PCAIMs. Notice that for our PCAIMs analysis, thesenumbers agree fairly well with the numbers reported in figure 2for our validation experiment. On the contrary, although the InAIMs seemed to perform better at this stage in the validationexperiment, in this leave-seven-out cross-validation test, theirperformance is actually comparable to PCAIMs, indicating thatIn AIMs overfit the data. Supplementary figure 4 illustrates infurther detail the performance of our smallest and largestPCAIM panels (P1 and P3) in Europe (see supplementary figure 6for corresponding results for In AIMs). The Russian, Adygei,Sardinian, and Basque individuals in our test sets are predicted
840 J Med Genet 2010;47:835e847. doi:10.1136/jmg.2010.078212
Original article
group.bmj.com on April 30, 2014 - Published by jmg.bmj.comDownloaded from
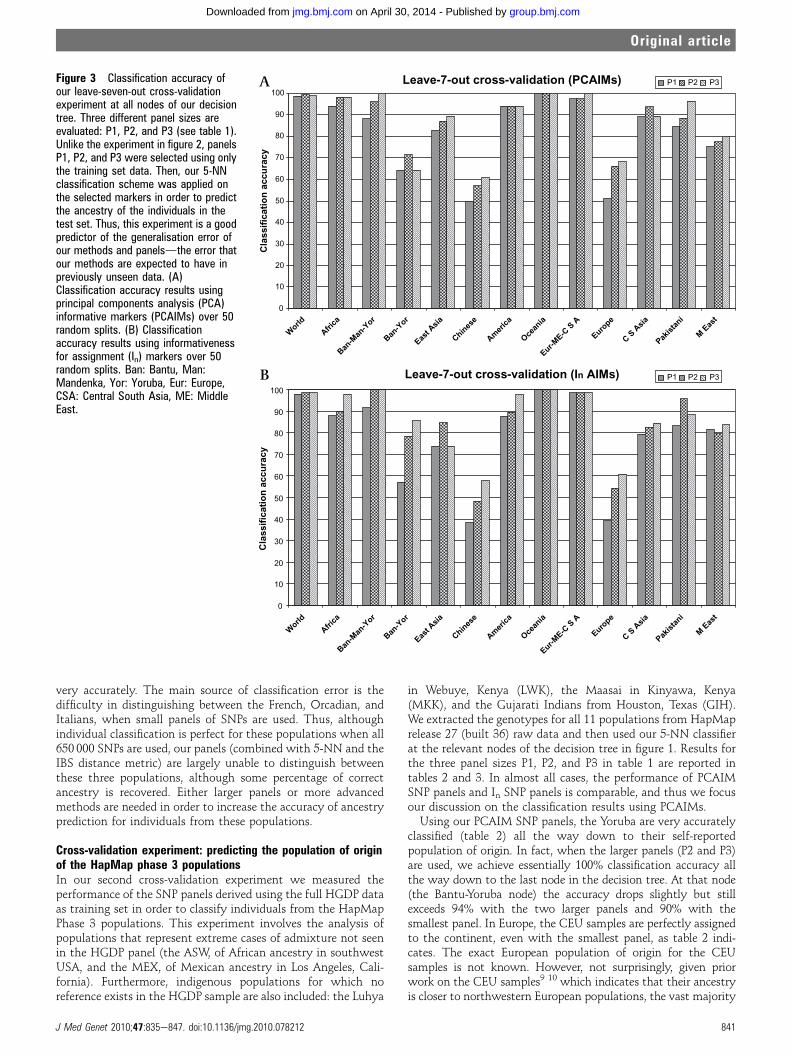
very accurately. The main source of classification error is thedifficulty in distinguishing between the French, Orcadian, andItalians, when small panels of SNPs are used. Thus, althoughindividual classification is perfect for these populations when all650 000 SNPs are used, our panels (combined with 5-NN and theIBS distance metric) are largely unable to distinguish betweenthese three populations, although some percentage of correctancestry is recovered. Either larger panels or more advancedmethods are needed in order to increase the accuracy of ancestryprediction for individuals from these populations.
Cross-validation experiment: predicting the population of originof the HapMap phase 3 populationsIn our second cross-validation experiment we measured theperformance of the SNP panels derived using the full HGDP dataas training set in order to classify individuals from the HapMapPhase 3 populations. This experiment involves the analysis ofpopulations that represent extreme cases of admixture not seenin the HGDP panel (the ASW, of African ancestry in southwestUSA, and the MEX, of Mexican ancestry in Los Angeles, Cali-fornia). Furthermore, indigenous populations for which noreference exists in the HGDP sample are also included: the Luhya
in Webuye, Kenya (LWK), the Maasai in Kinyawa, Kenya(MKK), and the Gujarati Indians from Houston, Texas (GIH).We extracted the genotypes for all 11 populations from HapMaprelease 27 (built 36) raw data and then used our 5-NN classifierat the relevant nodes of the decision tree in figure 1. Results forthe three panel sizes P1, P2, and P3 in table 1 are reported intables 2 and 3. In almost all cases, the performance of PCAIMSNP panels and In SNP panels is comparable, and thus we focusour discussion on the classification results using PCAIMs.Using our PCAIM SNP panels, the Yoruba are very accurately
classified (table 2) all the way down to their self-reportedpopulation of origin. In fact, when the larger panels (P2 and P3)are used, we achieve essentially 100% classification accuracy allthe way down to the last node in the decision tree. At that node(the Bantu-Yoruba node) the accuracy drops slightly but stillexceeds 94% with the two larger panels and 90% with thesmallest panel. In Europe, the CEU samples are perfectly assignedto the continent, even with the smallest panel, as table 2 indi-cates. The exact European population of origin for the CEUsamples is not known. However, not surprisingly, given priorwork on the CEU samples9 10 which indicates that their ancestryis closer to northwestern European populations, the vast majority
Figure 3 Classification accuracy ofour leave-seven-out cross-validationexperiment at all nodes of our decisiontree. Three different panel sizes areevaluated: P1, P2, and P3 (see table 1).Unlike the experiment in figure 2, panelsP1, P2, and P3 were selected using onlythe training set data. Then, our 5-NNclassification scheme was applied onthe selected markers in order to predictthe ancestry of the individuals in thetest set. Thus, this experiment is a goodpredictor of the generalisation error ofour methods and panelsdthe error thatour methods are expected to have inpreviously unseen data. (A)Classification accuracy results usingprincipal components analysis (PCA)informative markers (PCAIMs) over 50random splits. (B) Classificationaccuracy results using informativenessfor assignment (In) markers over 50random splits. Ban: Bantu, Man:Mandenka, Yor: Yoruba, Eur: Europe,CSA: Central South Asia, ME: MiddleEast.
Leave-7-out cross-validation (PCAIMs)
0
10
20
30
40
50
60
70
80
90
100
World
Africa
Ban-M
an-Y
or
Ban-Y
or
East A
sia
Chines
e
Amer
ica
Ocean
ia
Eur-ME-C
S A
Europe
C S A
sia
Pakist
ani
M Eas
t
World
Africa
Ban-M
an-Y
or
Ban-Y
or
East A
sia
Chines
e
Amer
ica
Ocean
ia
Eur-ME-C
S A
Europe
C S A
sia
Pakist
ani
M Eas
t
Cla
ssif
icat
ion
acc
ura
cy
0
10
20
30
40
50
60
70
80
90
100
Cla
ssif
icat
ion
acc
ura
cy
Leave-7-out cross-validation (In AIMs)
P1 P2 P3
P1 P2 P3
A
B
J Med Genet 2010;47:835e847. doi:10.1136/jmg.2010.078212 841
Original article
group.bmj.com on April 30, 2014 - Published by jmg.bmj.comDownloaded from
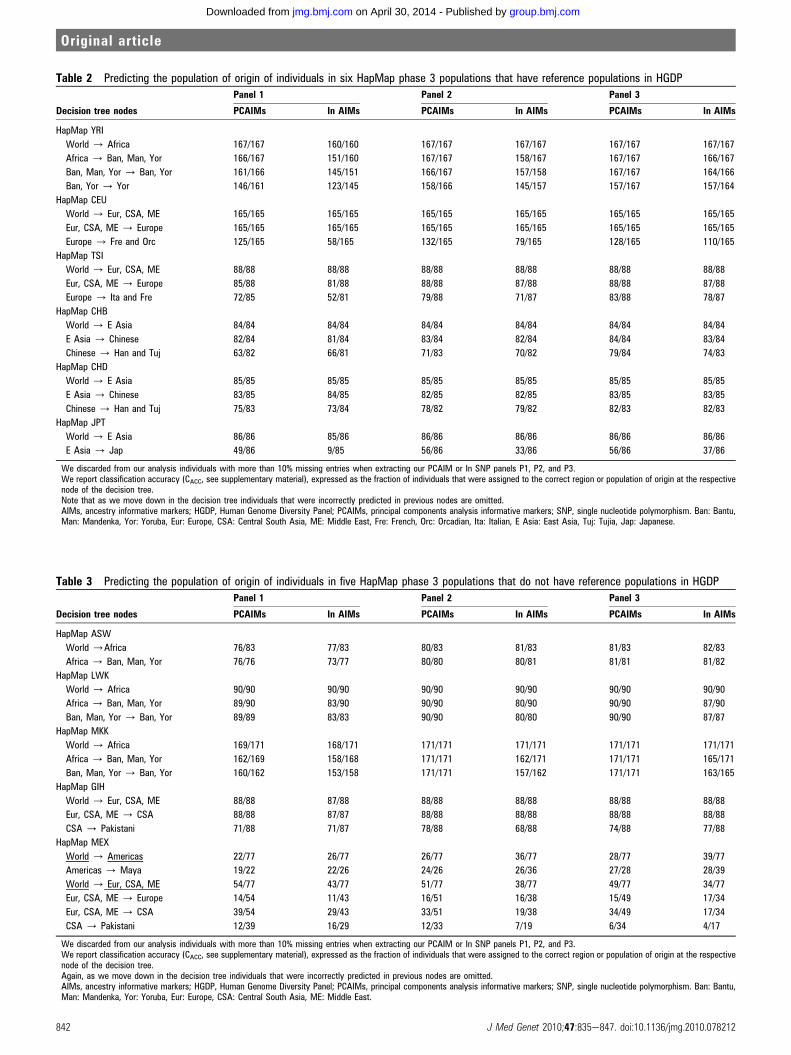
Table 2 Predicting the population of origin of individuals in six HapMap phase 3 populations that have reference populations in HGDP
Decision tree nodes
Panel 1 Panel 2 Panel 3
PCAIMs In AIMs PCAIMs In AIMs PCAIMs In AIMs
HapMap YRI
World / Africa 167/167 160/160 167/167 167/167 167/167 167/167
Africa / Ban, Man, Yor 166/167 151/160 167/167 158/167 167/167 166/167
Ban, Man, Yor / Ban, Yor 161/166 145/151 166/167 157/158 167/167 164/166
Ban, Yor / Yor 146/161 123/145 158/166 145/157 157/167 157/164
HapMap CEU
World / Eur, CSA, ME 165/165 165/165 165/165 165/165 165/165 165/165
Eur, CSA, ME / Europe 165/165 165/165 165/165 165/165 165/165 165/165
Europe / Fre and Orc 125/165 58/165 132/165 79/165 128/165 110/165
HapMap TSI
World / Eur, CSA, ME 88/88 88/88 88/88 88/88 88/88 88/88
Eur, CSA, ME / Europe 85/88 81/88 88/88 87/88 88/88 87/88
Europe / Ita and Fre 72/85 52/81 79/88 71/87 83/88 78/87
HapMap CHB
World / E Asia 84/84 84/84 84/84 84/84 84/84 84/84
E Asia / Chinese 82/84 81/84 83/84 82/84 84/84 83/84
Chinese / Han and Tuj 63/82 66/81 71/83 70/82 79/84 74/83
HapMap CHD
World / E Asia 85/85 85/85 85/85 85/85 85/85 85/85
E Asia / Chinese 83/85 84/85 82/85 82/85 83/85 83/85
Chinese / Han and Tuj 75/83 73/84 78/82 79/82 82/83 82/83
HapMap JPT
World / E Asia 86/86 85/86 86/86 86/86 86/86 86/86
E Asia / Jap 49/86 9/85 56/86 33/86 56/86 37/86
We discarded from our analysis individuals with more than 10% missing entries when extracting our PCAIM or In SNP panels P1, P2, and P3.We report classification accuracy (CACC, see supplementary material), expressed as the fraction of individuals that were assigned to the correct region or population of origin at the respectivenode of the decision tree.Note that as we move down in the decision tree individuals that were incorrectly predicted in previous nodes are omitted.AIMs, ancestry informative markers; HGDP, Human Genome Diversity Panel; PCAIMs, principal components analysis informative markers; SNP, single nucleotide polymorphism. Ban: Bantu,Man: Mandenka, Yor: Yoruba, Eur: Europe, CSA: Central South Asia, ME: Middle East, Fre: French, Orc: Orcadian, Ita: Italian, E Asia: East Asia, Tuj: Tujia, Jap: Japanese.
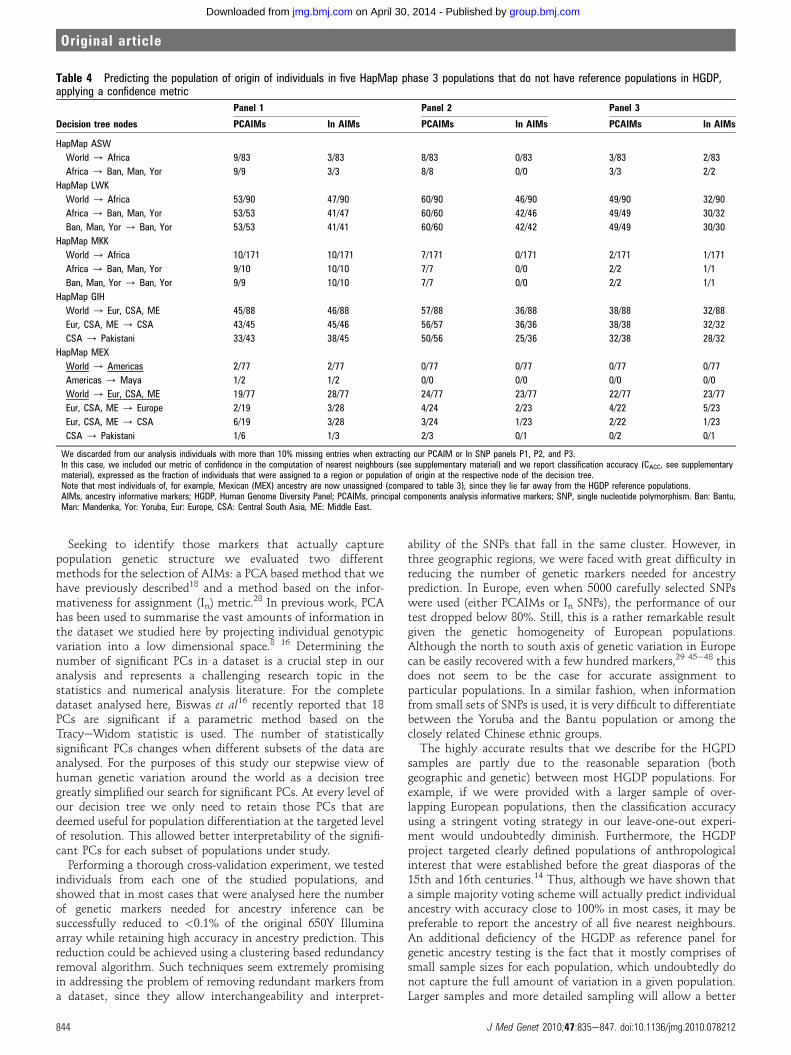
Table 3 Predicting the population of origin of individuals in five HapMap phase 3 populations that do not have reference populations in HGDP
Decision tree nodes
Panel 1 Panel 2 Panel 3
PCAIMs In AIMs PCAIMs In AIMs PCAIMs In AIMs
HapMap ASW
World /Africa 76/83 77/83 80/83 81/83 81/83 82/83
Africa / Ban, Man, Yor 76/76 73/77 80/80 80/81 81/81 81/82
HapMap LWK
World / Africa 90/90 90/90 90/90 90/90 90/90 90/90
Africa / Ban, Man, Yor 89/90 83/90 90/90 80/90 90/90 87/90
Ban, Man, Yor / Ban, Yor 89/89 83/83 90/90 80/80 90/90 87/87
HapMap MKK
World / Africa 169/171 168/171 171/171 171/171 171/171 171/171
Africa / Ban, Man, Yor 162/169 158/168 171/171 162/171 171/171 165/171
Ban, Man, Yor / Ban, Yor 160/162 153/158 171/171 157/162 171/171 163/165
HapMap GIH
World / Eur, CSA, ME 88/88 87/88 88/88 88/88 88/88 88/88
Eur, CSA, ME / CSA 88/88 87/87 88/88 88/88 88/88 88/88
CSA / Pakistani 71/88 71/87 78/88 68/88 74/88 77/88
HapMap MEX
World / Americas 22/77 26/77 26/77 36/77 28/77 39/77
Americas / Maya 19/22 22/26 24/26 26/36 27/28 28/39
World / Eur, CSA, ME 54/77 43/77 51/77 38/77 49/77 34/77
Eur, CSA, ME / Europe 14/54 11/43 16/51 16/38 15/49 17/34
Eur, CSA, ME / CSA 39/54 29/43 33/51 19/38 34/49 17/34
CSA / Pakistani 12/39 16/29 12/33 7/19 6/34 4/17
We discarded from our analysis individuals with more than 10% missing entries when extracting our PCAIM or In SNP panels P1, P2, and P3.We report classification accuracy (CACC, see supplementary material), expressed as the fraction of individuals that were assigned to the correct region or population of origin at the respectivenode of the decision tree.Again, as we move down in the decision tree individuals that were incorrectly predicted in previous nodes are omitted.AIMs, ancestry informative markers; HGDP, Human Genome Diversity Panel; PCAIMs, principal components analysis informative markers; SNP, single nucleotide polymorphism. Ban: Bantu,Man: Mandenka, Yor: Yoruba, Eur: Europe, CSA: Central South Asia, ME: Middle East.
842 J Med Genet 2010;47:835e847. doi:10.1136/jmg.2010.078212
Original article
group.bmj.com on April 30, 2014 - Published by jmg.bmj.comDownloaded from

of the CEU individuals are classified as French or Orcadian; theseare our most Northwestern European HGDP populations. Theorigin of the TSI individuals is predicted as French or Italian. Asdescribed in the previous section, Italians can be classified asFrench or Italian with 100% classification accuracy using panelP1; this accuracy drops to 50% when we seek to classify them asItalians only using the same panel.
Results for the three East Asian populations are shown intable 2. Regarding the CHB sample, our largest PCAIMs panelalmost perfectly assigns the HapMap CHB subjects to the Han/Tujia group, with accuracy exceeding 94% even at the last rele-vant node. Even our smallest panel does a good job predictingthe population of origin, with almost 100% accuracy at the firsttwo nodes and 77% accuracy at the last node. The CHD are alsoaccurately assigned to the Chinese group. The situation isslightly worse for the Japanese sample, where we observed theleast successful performance in this cross-validation experiment.While we easily achieve 100% accuracy in classifying the Japa-nese samples to East Asia with all three panels, within East Asiawe only achieve 65% accuracy in assigning the JPT samples tothe Japanese population even with our largest PCAIMs panel.The remaining 35% of the JPT samples are assigned to Chinesepopulations. This seems to indicate that more markers arenecessary at this level; it is worth noting that using all 650 000SNPs we achieve 98% accuracy in classifying the JPT samples asJapanese. Using our largest panel (P3), 56 out of the 86 studiedJPT individuals have three or more of their five nearest neigh-bours in the HGDP Japanese sample, an additional 19 have twoof their five neighbours in the HGDP Japanese sample, sevenhave one of their five neighbours in the HGDP Japanese sample,and only four have no neighbours in the HGDP Japanese sample.This seems to indicate that we can at least partially captureJapanese ancestry for the vast majority of the HapMap JPTsamples. We should also note that this is one node of the deci-sion tree where the performance of In SNPs is considerably worsethan PCAIMs (up to 43% classification accuracy with the largestpanel).
Moving on to the populations for which we have no referencein the HGDP dataset, we observe that, in most cases, individualsare classified to the closest geographically neighbouring popu-lation available (table 3). The individuals from populations ofAfrican ancestry (ASW, LWK, and MKK) are assigned to Africawith essentially 100% accuracy, even with our smallest panel (50SNPs, P1). The predominantly Western African origin of AfricanAmericans is also well documented, and, appropriately, ourpanels also classify them as West African. The Bantu speakingLWK from Kenya are classified as Bantu or Yoruba, as are theMKK from Kenya. About two thirds of the population in Kenyais represented by Bantu tribes, which is the closest neighbouringpopulation in the HGDP panel to the MKK and LWK. TheGujarati Indians (GIH), originating from Gujarat (the mostwestern state of India and immediately adjacent to Pakistan) areeasily placed in Central South Asia where they are classified asPakistanis. Finally, the analysis of Mexicans from California(MEX) yields slightly unexpected results. With the smallestPCAIM panels, 14 individuals are assigned to Europe, 22 areassigned to America, and 39 to Central South Asia (where theyare ultimately classified as Pakistani or Afghans). Although thiscase illustrates the limitations of the method for extremelyadmixed populations, it could also indicate a higher thanexpected degree of Punjabi Mexican American ancestry in thisCalifornian Mexican sample. The Punjabi Mexican Americans(people of Mexican and Pakistani or Indian ancestry) originatefrom the Sacramento valley in California.39
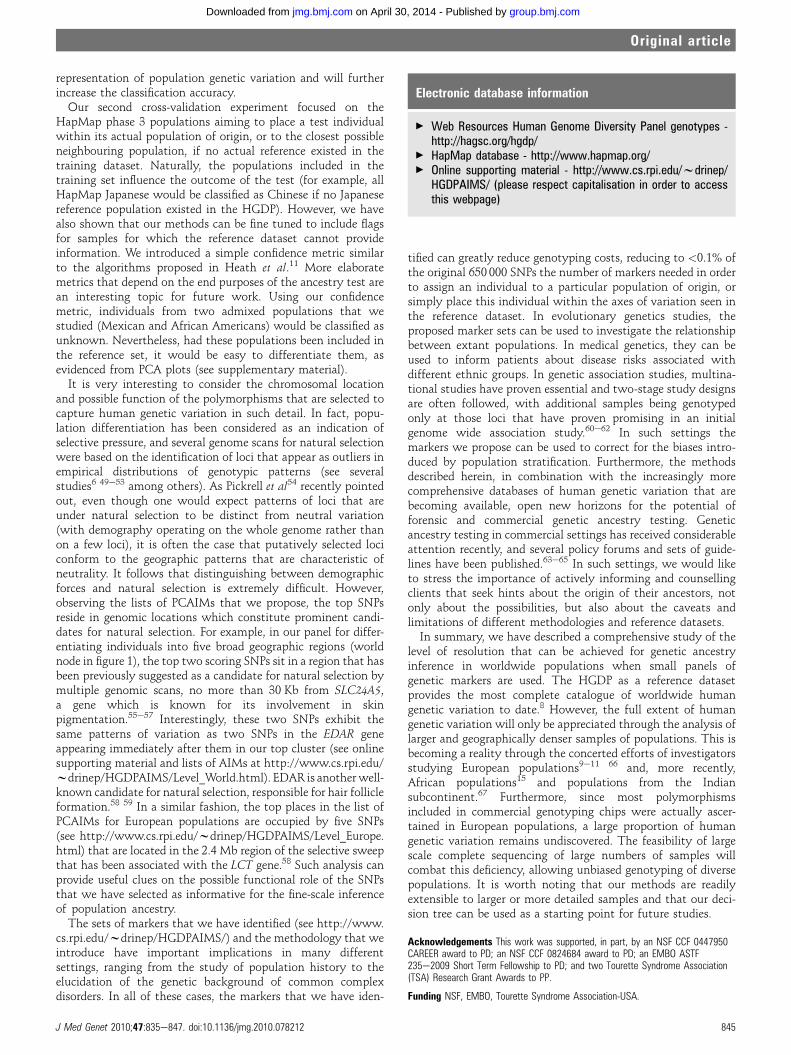
Studying the PCA plots for these ‘untested’ populations(supplementary figures 9e19) it is clear that individual geneticdistances are often far from any one of our HGDP referencepopulations. In order to address this issue, we decided to applya more stringent test, introducing a simple confidence metric forour assignments. More specifically, our confidencemetric discardsthe nearest neighbours (out of the top five) of an individual, forwhich the corresponding distance is an outlier (exceeds thestandard 95% threshold) in the distribution of observed distances(see supplementarymaterial for details). Individuals with three ormore ‘discarded’ nearest neighbours are classified as unknown.Results for the HapMap populations when this confidencethreshold is applied at the top two levels of the decision tree infigure 1 are shown in table 4 and supplementary table 1. Thepower of this methodology, as well as the fact that certainHapMap phase 3 populations have no reference samples inHGDP, is highlighted with the majority of the individuals clas-sified as unknown, sometimes even at the topmost level.
DISCUSSIONDespite the relatively low levels of genetic differentiation amonggeographically defined human populations when compared toother mammalian species, population genetics analysis canuncover the genetic signatures left on regional populations, bydemographic, environmental, and historical factors.40e44 In thiswork, we investigated the extent to which geographically closepopulations can be discerned based on genetic informationalone. To this end, we analysed data from 1043 individuals and51 populations from around the world, genotyped for 650 000SNPs (HGDP dataset).8 In doing so, we undertook a compre-hensive evaluation of population genetic structure around theworld. We report on the feasibility of fine scale genetic ancestrytesting on a global scale, not only using information from thewhole genome (650 000 SNPs) but, importantly, evaluating theperformance of small panels of judiciously selected geneticmarkers. In order to tackle this challenging task we proposea hierarchical decomposition of worldwide human populationstructure. A decision tree is formed, thus enabling the stepwiseassignment of individuals to their region and, ultimately,population of origin, as well as the sequential selection ofsubsets of genetic markers that can be used for ancestry infer-ence. Moving through the proposed decision tree investigatorshave the opportunity to tailor their needs for marker selectionaccording to the desired level of resolution and/or prior infor-mation on the origin of the samples under study.Through this scheme we achieve very accurate prediction of
individual ancestry when this particular set of 51 populations isconsidered. We should point out that (see Results) in some casesour decision tree stops at a group of two or three populationsand further differentiation cannot be adequately achieved, atleast with the methods proposed here. So, for instance, using thegiven dataset we cannot and do not seek to distinguish betweenItalians and Tuscans or among Northern Chinese populations.The fact that in some cases certain populations are indistin-guishable from one another and are grouped together (evenwhen information from all 650 000 SNPs is used), could be dueto the close genetic relationship among these populations or thesmall sample sizes that are included in this dataset. Thus, ourdecision tree provides insight into the level of populationdifferentiation that can be achieved using the HGDP as referenceif all 650 000 SNPs are used. In fact, we demonstrate that theaccuracy of prediction of individual ancestry at a fine scale isessentially 100% for the targets that we propose.
J Med Genet 2010;47:835e847. doi:10.1136/jmg.2010.078212 843
Original article
group.bmj.com on April 30, 2014 - Published by jmg.bmj.comDownloaded from
Seeking to identify those markers that actually capturepopulation genetic structure we evaluated two differentmethods for the selection of AIMs: a PCA based method that wehave previously described18 and a method based on the infor-mativeness for assignment (In) metric.28 In previous work, PCAhas been used to summarise the vast amounts of information inthe dataset we studied here by projecting individual genotypicvariation into a low dimensional space.8 16 Determining thenumber of significant PCs in a dataset is a crucial step in ouranalysis and represents a challenging research topic in thestatistics and numerical analysis literature. For the completedataset analysed here, Biswas et al16 recently reported that 18PCs are significant if a parametric method based on theTracyeWidom statistic is used. The number of statisticallysignificant PCs changes when different subsets of the data areanalysed. For the purposes of this study our stepwise view ofhuman genetic variation around the world as a decision treegreatly simplified our search for significant PCs. At every level ofour decision tree we only need to retain those PCs that aredeemed useful for population differentiation at the targeted levelof resolution. This allowed better interpretability of the signifi-cant PCs for each subset of populations under study.
Performing a thorough cross-validation experiment, we testedindividuals from each one of the studied populations, andshowed that in most cases that were analysed here the numberof genetic markers needed for ancestry inference can besuccessfully reduced to <0.1% of the original 650Y Illuminaarray while retaining high accuracy in ancestry prediction. Thisreduction could be achieved using a clustering based redundancyremoval algorithm. Such techniques seem extremely promisingin addressing the problem of removing redundant markers froma dataset, since they allow interchangeability and interpret-
ability of the SNPs that fall in the same cluster. However, inthree geographic regions, we were faced with great difficulty inreducing the number of genetic markers needed for ancestryprediction. In Europe, even when 5000 carefully selected SNPswere used (either PCAIMs or In SNPs), the performance of ourtest dropped below 80%. Still, this is a rather remarkable resultgiven the genetic homogeneity of European populations.Although the north to south axis of genetic variation in Europecan be easily recovered with a few hundred markers,29 45e48 thisdoes not seem to be the case for accurate assignment toparticular populations. In a similar fashion, when informationfrom small sets of SNPs is used, it is very difficult to differentiatebetween the Yoruba and the Bantu population or among theclosely related Chinese ethnic groups.The highly accurate results that we describe for the HGPD
samples are partly due to the reasonable separation (bothgeographic and genetic) between most HGDP populations. Forexample, if we were provided with a larger sample of over-lapping European populations, then the classification accuracyusing a stringent voting strategy in our leave-one-out experi-ment would undoubtedly diminish. Furthermore, the HGDPproject targeted clearly defined populations of anthropologicalinterest that were established before the great diasporas of the15th and 16th centuries.14 Thus, although we have shown thata simple majority voting scheme will actually predict individualancestry with accuracy close to 100% in most cases, it may bepreferable to report the ancestry of all five nearest neighbours.An additional deficiency of the HGDP as reference panel forgenetic ancestry testing is the fact that it mostly comprises ofsmall sample sizes for each population, which undoubtedly donot capture the full amount of variation in a given population.Larger samples and more detailed sampling will allow a better
Table 4 Predicting the population of origin of individuals in five HapMap phase 3 populations that do not have reference populations in HGDP,applying a confidence metric
Decision tree nodes
Panel 1 Panel 2 Panel 3
PCAIMs In AIMs PCAIMs In AIMs PCAIMs In AIMs
HapMap ASW
World / Africa 9/83 3/83 8/83 0/83 3/83 2/83
Africa / Ban, Man, Yor 9/9 3/3 8/8 0/0 3/3 2/2
HapMap LWK
World / Africa 53/90 47/90 60/90 46/90 49/90 32/90
Africa / Ban, Man, Yor 53/53 41/47 60/60 42/46 49/49 30/32
Ban, Man, Yor / Ban, Yor 53/53 41/41 60/60 42/42 49/49 30/30
HapMap MKK
World / Africa 10/171 10/171 7/171 0/171 2/171 1/171
Africa / Ban, Man, Yor 9/10 10/10 7/7 0/0 2/2 1/1
Ban, Man, Yor / Ban, Yor 9/9 10/10 7/7 0/0 2/2 1/1
HapMap GIH
World / Eur, CSA, ME 45/88 46/88 57/88 36/88 38/88 32/88
Eur, CSA, ME / CSA 43/45 45/46 56/57 36/36 38/38 32/32
CSA / Pakistani 33/43 38/45 50/56 25/36 32/38 28/32
HapMap MEX
World / Americas 2/77 2/77 0/77 0/77 0/77 0/77
Americas / Maya 1/2 1/2 0/0 0/0 0/0 0/0
World / Eur, CSA, ME 19/77 28/77 24/77 23/77 22/77 23/77
Eur, CSA, ME / Europe 2/19 3/28 4/24 2/23 4/22 5/23
Eur, CSA, ME / CSA 6/19 3/28 3/24 1/23 2/22 1/23
CSA / Pakistani 1/6 1/3 2/3 0/1 0/2 0/1
We discarded from our analysis individuals with more than 10% missing entries when extracting our PCAIM or In SNP panels P1, P2, and P3.In this case, we included our metric of confidence in the computation of nearest neighbours (see supplementary material) and we report classification accuracy (CACC, see supplementarymaterial), expressed as the fraction of individuals that were assigned to a region or population of origin at the respective node of the decision tree.Note that most individuals of, for example, Mexican (MEX) ancestry are now unassigned (compared to table 3), since they lie far away from the HGDP reference populations.AIMs, ancestry informative markers; HGDP, Human Genome Diversity Panel; PCAIMs, principal components analysis informative markers; SNP, single nucleotide polymorphism. Ban: Bantu,Man: Mandenka, Yor: Yoruba, Eur: Europe, CSA: Central South Asia, ME: Middle East.
844 J Med Genet 2010;47:835e847. doi:10.1136/jmg.2010.078212
Original article
group.bmj.com on April 30, 2014 - Published by jmg.bmj.comDownloaded from
representation of population genetic variation and will furtherincrease the classification accuracy.
Our second cross-validation experiment focused on theHapMap phase 3 populations aiming to place a test individualwithin its actual population of origin, or to the closest possibleneighbouring population, if no actual reference existed in thetraining dataset. Naturally, the populations included in thetraining set influence the outcome of the test (for example, allHapMap Japanese would be classified as Chinese if no Japanesereference population existed in the HGDP). However, we havealso shown that our methods can be fine tuned to include flagsfor samples for which the reference dataset cannot provideinformation. We introduced a simple confidence metric similarto the algorithms proposed in Heath et al.11 More elaboratemetrics that depend on the end purposes of the ancestry test arean interesting topic for future work. Using our confidencemetric, individuals from two admixed populations that westudied (Mexican and African Americans) would be classified asunknown. Nevertheless, had these populations been included inthe reference set, it would be easy to differentiate them, asevidenced from PCA plots (see supplementary material).
It is very interesting to consider the chromosomal locationand possible function of the polymorphisms that are selected tocapture human genetic variation in such detail. In fact, popu-lation differentiation has been considered as an indication ofselective pressure, and several genome scans for natural selectionwere based on the identification of loci that appear as outliers inempirical distributions of genotypic patterns (see severalstudies6 49e53 among others). As Pickrell et al54 recently pointedout, even though one would expect patterns of loci that areunder natural selection to be distinct from neutral variation(with demography operating on the whole genome rather thanon a few loci), it is often the case that putatively selected lociconform to the geographic patterns that are characteristic ofneutrality. It follows that distinguishing between demographicforces and natural selection is extremely difficult. However,observing the lists of PCAIMs that we propose, the top SNPsreside in genomic locations which constitute prominent candi-dates for natural selection. For example, in our panel for differ-entiating individuals into five broad geographic regions (worldnode in figure 1), the top two scoring SNPs sit in a region that hasbeen previously suggested as a candidate for natural selection bymultiple genomic scans, no more than 30 Kb from SLC24A5,a gene which is known for its involvement in skinpigmentation.55e57 Interestingly, these two SNPs exhibit thesame patterns of variation as two SNPs in the EDAR geneappearing immediately after them in our top cluster (see onlinesupporting material and lists of AIMs at http://www.cs.rpi.edu/wdrinep/HGDPAIMS/Level_World.html). EDAR is another well-known candidate for natural selection, responsible for hair follicleformation.58 59 In a similar fashion, the top places in the list ofPCAIMs for European populations are occupied by five SNPs(see http://www.cs.rpi.edu/wdrinep/HGDPAIMS/Level_Europe.html) that are located in the 2.4 Mb region of the selective sweepthat has been associated with the LCT gene.58 Such analysis canprovide useful clues on the possible functional role of the SNPsthat we have selected as informative for the fine-scale inferenceof population ancestry.
The sets of markers that we have identified (see http://www.cs.rpi.edu/wdrinep/HGDPAIMS/) and the methodology that weintroduce have important implications in many differentsettings, ranging from the study of population history to theelucidation of the genetic background of common complexdisorders. In all of these cases, the markers that we have iden-
tified can greatly reduce genotyping costs, reducing to <0.1% ofthe original 650 000 SNPs the number of markers needed in orderto assign an individual to a particular population of origin, orsimply place this individual within the axes of variation seen inthe reference dataset. In evolutionary genetics studies, theproposed marker sets can be used to investigate the relationshipbetween extant populations. In medical genetics, they can beused to inform patients about disease risks associated withdifferent ethnic groups. In genetic association studies, multina-tional studies have proven essential and two-stage study designsare often followed, with additional samples being genotypedonly at those loci that have proven promising in an initialgenome wide association study.60e62 In such settings themarkers we propose can be used to correct for the biases intro-duced by population stratification. Furthermore, the methodsdescribed herein, in combination with the increasingly morecomprehensive databases of human genetic variation that arebecoming available, open new horizons for the potential offorensic and commercial genetic ancestry testing. Geneticancestry testing in commercial settings has received considerableattention recently, and several policy forums and sets of guide-lines have been published.63e65 In such settings, we would liketo stress the importance of actively informing and counsellingclients that seek hints about the origin of their ancestors, notonly about the possibilities, but also about the caveats andlimitations of different methodologies and reference datasets.In summary, we have described a comprehensive study of the
level of resolution that can be achieved for genetic ancestryinference in worldwide populations when small panels ofgenetic markers are used. The HGDP as a reference datasetprovides the most complete catalogue of worldwide humangenetic variation to date.8 However, the full extent of humangenetic variation will only be appreciated through the analysis oflarger and geographically denser samples of populations. This isbecoming a reality through the concerted efforts of investigatorsstudying European populations9e11 66 and, more recently,African populations15 and populations from the Indiansubcontinent.67 Furthermore, since most polymorphismsincluded in commercial genotyping chips were actually ascer-tained in European populations, a large proportion of humangenetic variation remains undiscovered. The feasibility of largescale complete sequencing of large numbers of samples willcombat this deficiency, allowing unbiased genotyping of diversepopulations. It is worth noting that our methods are readilyextensible to larger or more detailed samples and that our deci-sion tree can be used as a starting point for future studies.
Acknowledgements This work was supported, in part, by an NSF CCF 0447950CAREER award to PD; an NSF CCF 0824684 award to PD; an EMBO ASTF235e2009 Short Term Fellowship to PD; and two Tourette Syndrome Association(TSA) Research Grant Awards to PP.
Funding NSF, EMBO, Tourette Syndrome Association-USA.
Electronic database information
< Web Resources Human Genome Diversity Panel genotypes -http://hagsc.org/hgdp/
< HapMap database - http://www.hapmap.org/< Online supporting material - http://www.cs.rpi.edu/wdrinep/
HGDPAIMS/ (please respect capitalisation in order to accessthis webpage)
J Med Genet 2010;47:835e847. doi:10.1136/jmg.2010.078212 845
Original article
group.bmj.com on April 30, 2014 - Published by jmg.bmj.comDownloaded from
Competing interests None.
Ethics approval This study was conducted with the approval of the RPI, DemocritusUniversity of Thrace.
Provenance and peer review Not commissioned; externally peer reviewed.
REFERENCES1. Stringer CB, Andrews P. Genetic and fossil evidence for the origin of modern
humans. Science 1988;239:1263e8.2. Jobling M, Hurles M, Tyler-Smith C. Human evolutionary genetics: origins, people,
and disease. New York, USA, Garland Science, 2003.3. Cavalli-Sforza LL, Menozzi P, Piazza A. The history and geography of human genes.
Princeton, New Jersey: Princeton University Press, Princeton, 1994.4. Rosenberg N, Pritchard J, Weber J, Cann H, Kidd K, Zhivotovsky LA, Feldman MW.
Genetic structure of human populations. Science 2002;298:2381e5.5. The International HapMap Consortium. The international HapMap project. Nature
2003;426:789e96.6. The International HapMap Consortium. A haplotype map of the human genome.
Nature 2005;437:1299e320.7. Frazer KA,Ballinger DG, Cox DR, Hinds DA,Stuve LL, Gibbs RA, Belmont JW, BoudreauA,
Hardenbol P, Leal SM, Pasternak S, Wheeler DA, Willis TD, Yu F, Yang H, Zeng C, Gao Y,Hu H, HuW, Li C, LinW, Liu S, Pan H, Tang X,Wang J, WangW, Yu J, Zhang B, Zhang Q,Zhao H, Zhao H, Zhou J, Gabriel SB, Barry R, Blumenstiel B, Camargo A, Defelice M,Faggart M, Goyette M, Gupta S, Moore J, Nguyen H, Onofrio RC, Parkin M, Roy J, Stahl E,Winchester E, Ziaugra L, Altshuler D, Shen Y, Yao Z, Huang W, Chu X, He Y, Jin L, Liu Y,Shen Y, Sun W, Wang H, Wang Y, Wang Y, Xiong X, Xu L, Waye MM, Tsui SK, Xue H,Wong JT, Galver LM, Fan JB, Gunderson K, Murray SS, Oliphant AR, Chee MS,Montpetit A, Chagnon F, Ferretti V, Leboeuf M, Olivier JF, Phillips MS, Roumy S, Sallee C,Verner A, Hudson TJ, Kwok PY, Cai D, Koboldt DC, Miller RD, Pawlikowska L,Taillon-Miller P, Xiao M, Tsui LC, Mak W, Song YQ, Tam PK, Nakamura Y, Kawaguchi T,Kitamoto T, Morizono T, Nagashima A, Ohnishi Y, Sekine A, Tanaka T, Tsunoda T,Deloukas P, Bird CP, DelgadoM, Dermitzakis ET, Gwilliam R, Hunt S,Morrison J, Powell D,Stranger BE, Whittaker P, Bentley DR, Daly MJ, de Bakker PI, Barrett J, Chretien YR,Maller J, McCarroll S, Patterson N, Pe’er I, Price A, Purcell S, Richter DJ, Sabeti P,Saxena R, Schaffner SF, Sham PC, Varilly P, Altshuler D, Stein LD, Krishnan L, Smith AV,Tello-Ruiz MK, Thorisson GA, Chakravarti A, Chen PE, Cutler DJ, Kashuk CS, Lin S,Abecasis GR, GuanW, Li Y,Munro HM, Qin ZS, Thomas DJ,McVean G, Auton A, Bottolo L,Cardin N, Eyheramendy S, Freeman C, Marchini J, Myers S, Spencer C, Stephens M,Donnelly P, Cardon LR, Clarke G, Evans DM, Morris AP, Weir BS, Tsunoda T, Mullikin JC,Sherry ST, Feolo M, Skol A, Zhang H, Zeng C, Zhao H, Matsuda I, Fukushima Y,Macer DR,Suda E, Rotimi CN, Adebamowo CA, Ajayi I, Aniagwu T, Marshall PA, Nkwodimmah C,Royal CD, Leppert MF, Dixon M, Peiffer A, Qiu R, Kent A, Kato K, Niikawa N, Adewole IF,Knoppers BM, Foster MW, Clayton EW, Watkin J, Gibbs RA, Belmont JW, Muzny D,Nazareth L, Sodergren E, Weinstock GM, Wheeler DA, Yakub I, Gabriel SB, Onofrio RC,Richter DJ, Ziaugra L, Birren BW, Daly MJ, Altshuler D, Wilson RK, Fulton LL, Rogers J,Burton J, Carter NP, Clee CM, GriffithsM, JonesMC,McLay K, PlumbRW, RossMT, SimsSK, Willey DL, Chen Z, Han H, Kang L, Godbout M, Wallenburg JC, L’Archeveque P,Bellemare G, Saeki K, Wang H, An D, Fu H, Li Q, Wang Z, Wang R, Holden AL, Brooks LD,McEwen JE, Guyer MS, Wang VO, Peterson JL, Shi M, Spiegel J, Sung LM, Zacharia LF,Collins FS, Kennedy K, Jamieson R, Stewart J. International HapMap Consortium. Asecond generation human haplotype map of over 3.1 million SNPs. Nature2007;449:851e61.
8. Li JZ, Absher DM, Tang H, Southwick AM, Casto AM, Ramachandran S, Cann HM,Barsh GS, Feldman M, Cavalli-Sforza LL, Myers RM. Worldwide human relationshipsinferred from genome-wide patterns of variation. Science 2008;319:1100e4.
9. Lao O, Lu TT, Nothnagel M, Junge O, Freitag-Wolf S, Caliebe A, Balascakova M,Bertranpetit J, Bindoff LA, Comas D, Holmlund G, Kouvatsi A, Macek M, Mollet I,Parson W, Palo J, Ploski R, Sajantila A, Tagliabracci A, Gether U, Werge T,Rivadeneira F, Hofman A, Uitterlinden AG, Gieger C, Wichmann HE, Ruther A,Schreiber S, Becker C, Nurnberg P, Nelson MR, Krawczak M, Kayser M. Correlationbetween genetic and geographic structure in Europe. Curr Biol 2008;18:1241e8.
10. Novembre J, Johnson T, Bryc K, Kutalik Z, Boyko AR, Auton A, Indap A, King KS,Bergmann S, Nelson MR, Stephens M, Bustamante CD. Genes mirror geographywithin Europe. Nature 2008;456:98e101.
11. Heath SC, Gut IG, Brennan P, McKay JD, Bencko V, Fabianova E, Foretova L,Georges M, Janout V, Kabesch M, Krokan HE, Elvestad MB, Lissowska J, Mates D,Rudnai P, Skorpen F, Schreiber S, Soria JM, Syvanen AC, Meneton P, Hercberg S,Galan P, Szeszenia-Dabrowska N, Zaridze D, Genin E, Cardon LR, Lathrop M.Investigation of the fine structure of European populations with applications todisease association studies. Eur J Hum Genet 2008;16:1413e29.
12. McEvoy BP, Montgomery GW, McRae AF, Ripatti S, Perola M, Spector TD,Cherkas L, Ahmadi KR, Boomsma D, Willemsen G, Hottenga JJ, Pedersen NL,Magnusson PK, Kyvik KO, Christensen K, Kaprio J, Heikkila K, Palotie A, Widen E,Muilu J, Syvanen AC, Liljedahl U, Hardiman O, Cronin S, Peltonen L, Martin NG,Visscher PM. Geographical structure and differential natural selection among NorthEuropean populations. Genome Res 2009;19:804e14.
13. Cann HM, de Toma C, Cazes L, Legrand MF, Morel V, Piouffre L, Bodmer J,Bodmer WF, Bonne-Tamir B, Cambon-Thomsen A, Chen Z, Chu J, Carcassi C,Contu L, Du R, Excoffier L, Ferrara GB, Friedlaender JS, Groot H, Gurwitz D, Jenkins T,Herrera RJ, Huang X, Kidd J, Kidd KK, Langaney A, Lin AA, Mehdi SQ, Parham P,Piazza A, Pistillo MP, Qian Y, Shu Q, Xu J, Zhu S, Weber JL, Greely HT, Feldman MW,
Thomas G, Dausset J, Cavalli-Sforza LL. A human genome diversity cell line panel.Science 2002;296:261e2.
14. Cavalli-Sforza LL. The human genome diversity project: past, present and future.Nat Rev Genet 2005;6:333e40.
15. Tishkoff SA, Reed FA, Friedlaender FR, Ehret C, Ranciaro A, Froment A, Hirbo JB,Awomoyi AA, Bodo JM, Doumbo O, Ibrahim M, Juma AT, Kotze MJ, Lema G,Moore JH, Mortensen H, Nyambo TB, Omar SA, Powell K, Pretorius GS, Smith MW,Thera MA, Wambebe C, Weber JL, Williams SM. The genetic structure and history ofAfricans and African Americans. Science 2009;324:1035e44.
16. Biswas S, Scheinfeldt LB, Akey JM. Genome-wide insights into the patterns anddeterminants of fine-scale population structure in humans. Am J Hum Genet2009;84:641e50.
17. Price A, Patterson N, Plenge R, Weinblatt M, Shadick N, Reich D. Principalcomponents analysis corrects for stratification in genome-wide association studies.Nat Genet 2006;38:904e9.
18. Paschou P, Ziv E, Burchard EG, Choudhry S, Rodriguez-Cintron W, Mahoney MW,Drineas P. PCA-correlated SNPs for structure identification in worldwide humanpopulations. PLoS Genet 2007;3:1672e86.
19. Campbell C, Ogburn E, Lunetta K, Lyon H, Freedman M, Groop LC, Altshuler D,Ardlie KG, Hirschhorn JN. Demonstrating stratification in a European Americanpopulation. Nat Genet 2005;37:868e72.
20. Tang H, Quertermous T, Rodriguez B, Kardia S, Zhu X, Brown A, Pankow JS,Province MA, Hunt SC, Boerwinkle E, Schork NJ, Risch NJ. Genetic structure,self-identified race/ethnicity, and confounding in case-control association studies.Am J Hum Genet 2005;76:268e75.
21. Wright S. The genetical structure of populations. Ann Eugen 1951;15:323e54.22. Michael D, Claiborne Stephens J, Winkler C, Lomb DA, Ramsburg M, Boaze R,
Stewart C, Charbonneau L, Goldman D, Albaugh BJ, Goedert JJ, Palmer Beasley R,Hwang LY, Buchbinder S, Weedon M, Johnson PA, Eichelberger M, O’ Brien SJ.Polymorphic admix-ture typing in human ethnic populations. Am J Hum Genet1994;55:788e808.
23. McKeigue P. Mapping genes that underlie ethnic differences in disease risk:methods for detecting linkage in admixed populations, by conditioning on parentaladmixture. Am J Hum Genet 1998;63:241e51.
24. Parra E, Marcini A, Akey J, Martinson J, Batzer M, Cooper R, Forrester T, Allison DB,Deka R, Ferrell RE, Shriver MD. Estimating African American admixture proportions byuse of population-specific alleles. Am J Hum Genet 1998;63:1839e51.
25. Collins-Schramm H, Phillips C, Operario D, Lee J, Weber JL, Hanson RL, KnowlerWC, Cooper R, Li H, Seldin MF. Ethnic-difference markers for use in mapping byadmixture linkage diseuilibrium. Am J Hum Genet 2002;70:737e50.
26. Pfaff C, Barnholtz-Sloan J, Wagner J, Long JC. Information on ancestry from geneticmarkers. Genet Epidemiol 2004;26:305e15.
27. Weir B, Cardon L, Anderson A, Nielsen D, Hill WG. Measures of human populationstructure show heterogeneity among genomic regions. Genome Res2005;15:1468e76.
28. Rosenberg N, Li L, Ward R, Pritchard JK. Informativeness of genetic markers forinference of ancestry. Am J Hum Genet 2003;73:1402e22.
29. Paschou P, Drineas P, Lewis J, Nievergelt CM, Nickerson DA, Smith JD, Ridker PM,Chasman DI, Krauss RM, Ziv E. Tracing sub-structure in the European Americanpopulation with PCA-informative markers. PLoS Genet 2008;4:e1000114.
30. Menozzi P, Piazza A, Cavalli-Sforza L. Synthetic maps of human gene frequencies inEuropeans. Science 1978;201:786e92.
31. Shriver M, Mei R, Parra E, Sonpar V, Halder I, Tishkoff SA, Schurr TG, Zhadanov SI,Osipova LP, Brutsaert TD, Friedlaender J, Jorde LB, Watkins WS, Bamshad MJ,Gutierrez G, Loi H, Matsuzaki H, Kittles RA, Argyropoulos G, Fernandez JR, Akey JM,Jones KW. Large-scale SNP analysis reveals clustered and continuous patterns ofhuman genetic variation. Hum Genomics 2005;2:81e9.
32. Patterson N, Price A, Reich D. Population structure and eigenanalysis. PLoS Genet2006;2:e190.
33. Liu N, Zhao H. A non-parametric approach to population structure inference usingmultilocus genotypes. Hum Genomics 2006;2:353e64.
34. Boutsidis C, Sun J, Anerousis N. Clustered subset selection and its applications onit service metrics. In: ACM Conference on Information and Knowledge Management(CIKM). Eds.Shanahan JG, Amer-Yahia S, Manolescu I, Zhang Y, Evans DA, Kolcz A,Choi KS, Chowdhury A ACM (Association for Computing Machinery), New York, USA,2008.
35. Zhao Y, Karypis G. Evaluation of hierarchical clustering algorithms for documentdatasets. In: ACM Conference on Information and Knowledge Management (CIKM).ACM (Association for Computing Machinery), New York, USA. 2002:515e24.
36. Beleza S, Gusmo L, Amorim A. The genetic legacy of western Bantu migrations.Hum Genet 2005;117:366e75.
37. Qamar R, Ayub Q, Mohyuddin A, Helgason A, Mazhar K, Mansoor A, Zerjal T, Tyler-Smith C, Mehdi SQ. Y-chromosomal DNA variation in Pakistan. Am J Hum Genet2002;70:1107e24.
38. Zerjal T, Xue Y, Bertorelle G, Wells RS, BaoW, Zhu S, Qamar R, Ayub Q, Mohyuddin A,Fu S, Li P, Yuldasheva N, Ruzibakiev R, Xu J, Shu Q, Du R, Yang H, Hurles ME, RobinsonE, Gerelsaikhan T, Dashnyam B, Mehdi SQ, Tyler-Smith C. The genetic legacy of theMongols. Am J Hum Genet 2003;72:717e21.
39. Leonard K. California’s Punjabi Mexican Americans. Ethnic choices made by thedescendants of Punjabi pioneers and their Mexican wives World & I. 1989;4:612e23.
40. Jorde LB, Watkins WS, Bamshad MJ, Dixon ME, Ricker CE, Seielstad MT,Batzer MA. The distribution of human genetic diversity: a comparison of
846 J Med Genet 2010;47:835e847. doi:10.1136/jmg.2010.078212
Original article
group.bmj.com on April 30, 2014 - Published by jmg.bmj.comDownloaded from

mitochondrial, autosomal, and Y-chromosome data. Am J Hum Genet2000;66:979e88.
41. Bamshad M, Wooding S, Salisbury BA, Stephens JC. Deconstructing therelationship between genetics and race. Nat Rev Genet 2004;5:598e609.
42. Tishkoff SA, Kidd KK. Implications of biogeography of human populations for “race”and medicine. Nat Genet 2004;36:S21e7.
43. Coop G, Pickrell JK, Novembre J, Kudaravalli S, Li J, Absher D, Myers RM,Cavalli-Sforza LL, Feldman MW, Pritchard JK. The role of geography in humanadaptation. PLoS Genet 2009;5:e1000500.
44. Nielsen R, Hubisz MJ, Hellmann I, Torgerson D, Andres AM, Albrechtsen A,Gutenkunst R, Adams MD, Cargill M, Boyko A, Indap A, Bustamante CD, Clark AG.Darwinian and demographic forces affecting human protein coding genes. GenomeRes 2009;19:838e49.
45. Seldin M, Shigeta R, Villoslada P, Selmi C, Tuomilehto J, Silva G, Belmont JW,Klareskog L, Gregersen PK. European population substructure: clustering of northernand southern populations. PLoS Genet 2006;2:e143.
46. Bauchet M,McEvoy B, Pearson LN, Quillen EE, Sarkisian T, Hovhannesyan K, Deka R,Bradley DG, Shriver MD. Measuring European population stratification with microarraygenotype data. Am J Hum Genet 2007;80:948e56.
47. Price A, Butler J, Patterson N, Capelli C, Pascali VL, Scarnicci F, Ruiz-Linares A,Groop L, Saetta AA, Korkolopoulou P, Seligsohn U, Waliszewska A, Schirmer C,Ardlie K, Ramos A, Nemesh J, Arbeitman L, Goldstein DB, Reich D, Hirschhorn JN.Discerning the ancestry of European Americans in genetic association studies.PLoS Genet 2008;4:e236.
48. Tian C, Plenge R, Ransom M, Lee A, Villoslada P, Selmi C, Klareskog L, Pulver AE,Qi L, Gregersen PK, Seldin MF. Analysis and application of European geneticsubstructure using 300 K SNP information. PLoS Genet 2008;4:e4.
49. Akey JM, Zhang G, Zhang K, Jin L, Shriver MD. Interrogating a high-density SNPmap for signatures of natural selection. Genome Res 2002;12:1805e14.
50. KayserM,Brauer S, StonekingM.A genomescan to detect candidate regions influencedby local natural selection in human populations. Mol Biol Evol 2003;20:893e900.
51. Shriver M, Kennedy G, Parra E, Lawson H, Sonpar V, Huang J, Akey JM, Jones KW.The genomic distribution of population substructure in four populations using 8,525autosomal SNPs. Hum Genomics 2004;1:274e86.
52. Myles S, Tang K, Somel M, Green RE, Kelso J, Stoneking M. Identification andanalysis of genomic regions with large between-population differentiation in humans.Ann Hum Genet 2008;72:99e110.
53. Barreiro LB, Laval G, Quach H, Patin E, Quintana-Murci L. Natural selection hasdriven population differentiation in modern humans. Nat Genet 2008;40:340e5.
54. Pickrell JK, Coop G, Novembre J, Kudaravalli S, Li JZ, Absher D, Srinivasan BS,Barsh GS, Myers RM, Feldman MW, Pritchard JK. Signals of recent positive selectionin a worldwide sample of human populations. Genome Res 2009;19:826e37.
55. Lamason RL, Mohideen MA, Mest JR, Wong AC, Norton HL, Aros MC, Jurynec MJ,Mao X, Humphreville VR, Humbert JE, Sinha S, Moore JL, Jagadeeswaran P, Zhao W,Ning G, Makalowska I, McKeigue PM, O’donnell D, Kittles R, Parra EJ, Mangini NJ,Grunwald DJ, Shriver MD, Canfield VA, Cheng KC. SLC24A5, a putative cationexchanger, affects pigmentation in zebrafish and humans. Science 2005;310:1782e6.
56. Norton HL, Kittles RA, Parra E, McKeigue P, Mao X, Cheng K, Canfield VA, BradleyDG, McEvoy B, Shriver MD. Genetic evidence for the convergent evolution of lightskin in Europeans and East Asians. Mol Biol Evol 2007;24:710e22.
57. Sturm RA. Molecular genetics of human pigmentation diversity. Hum Mol Genet2009;18:9e17.
58. Sabeti PC, Varilly P, Fry B, Lohmueller J, Hostetter E, Cotsapas C, Xie X, Byrne EH,McCarroll SA, Gaudet R, Schaffner SF, Lander ES, Frazer KA, Ballinger DG, Cox DR,Hinds DA, Stuve LL, Gibbs RA, Belmont JW, Boudreau A, Hardenbol P, Leal SM,Pasternak S, Wheeler DA, Willis TD, Yu F, Yang H, Zeng C, Gao Y, Hu H, Hu W, Li C,Lin W, Liu S, Pan H, Tang X, Wang J, Wang W, Yu J, Zhang B, Zhang Q, Zhao H,
Zhao H, Zhou J, Gabriel SB, Barry R, Blumenstiel B, Camargo A, Defelice M,Faggart M, Goyette M, Gupta S, Moore J, Nguyen H, Onofrio RC, Parkin M, Roy J,Stahl E, Winchester E, Ziaugra L, Altshuler D, Shen Y, Yao Z, Huang W, Chu X, He Y,Jin L, Liu Y, Shen Y, Sun W, Wang H, Wang Y, Wang Y, Xiong X, Xu L, Waye MM,Tsui SK, Xue H, Wong JT, Galver LM, Fan JB, Gunderson K, Murray SS, Oliphant AR,Chee MS, Montpetit A, Chagnon F, Ferretti V, Leboeuf M, Olivier JF, Phillips MS,Roumy S, Sallee C, Verner A, Hudson TJ, Kwok PY, Cai D, Koboldt DC, Miller RD,Pawlikowska L, Taillon-Miller P, Xiao M, Tsui LC, Mak W, Song YQ, Tam PK,Nakamura Y, Kawaguchi T, Kitamoto T, Morizono T, Nagashima A, Ohnishi Y,Sekine A, Tanaka T, Tsunoda T, Deloukas P, Bird CP, Delgado M, Dermitzakis ET,Gwilliam R, Hunt S, Morrison J, Powell D, Stranger BE, Whittaker P, Bentley DR,Daly MJ, de Bakker PI, Barrett J, Chretien YR, Maller J, McCarroll S, Patterson N,Pe’er I, Price A, Purcell S, Richter DJ, Sabeti P, Saxena R, Schaffner SF, Sham PC,Varilly P, Altshuler D, Stein LD, Krishnan L, Smith AV, Tello-Ruiz MK, Thorisson GA,Chakravarti A, Chen PE, Cutler DJ, Kashuk CS, Lin S, Abecasis GR, Guan W, Li Y,Munro HM, Qin ZS, Thomas DJ, McVean G, Auton A, Bottolo L, Cardin N,Eyheramendy S, Freeman C, Marchini J, Myers S, Spencer C, Stephens M,Donnelly P, Cardon LR, Clarke G, Evans DM, Morris AP, Weir BS, Tsunoda T,Johnson TA, Mullikin JC, Sherry ST, Feolo M, Skol A, Zhang H, Zeng C, Zhao H,Matsuda I, Fukushima Y, Macer DR, Suda E, Rotimi CN, Adebamowo CA, Ajayi I,Aniagwu T, Marshall PA, Nkwodimmah C, Royal CD, Leppert MF, Dixon M, Peiffer A,Qiu R, Kent A, Kato K, Niikawa N, Adewole IF, Knoppers BM, Foster MW,Clayton EW, Watkin J, Gibbs RA, Belmont JW, Muzny D, Nazareth L, Sodergren E,Weinstock GM, Wheeler DA, Yakub I, Gabriel SB, Onofrio RC, Richter DJ, Ziaugra L,Birren BW, Daly MJ, Altshuler D, Wilson RK, Fulton LL, Rogers J, Burton J, Carter NP,Clee CM, Griffiths M, Jones MC, McLay K, Plumb RW, Ross MT, Sims SK, Willey DL,Chen Z, Han H, Kang L, Godbout M, Wallenburg JC, L’Archeveque P, Bellemare G,Saeki K, Wang H, An D, Fu H, Li Q, Wang Z, Wang R, Holden AL, Brooks LD,McEwen JE, Guyer MS, Wang VO, Peterson JL, Shi M, Spiegel J, Sung LM,Zacharia LF, Collins FS, Kennedy K, Jamieson R, Stewart J; International HapMapConsortium. Genome-wide detection and characterization of positive selection inhuman populations. Nature 2007;449:913e18.
59. Botchkarev VA, Fessing MY. Edar signaling in the control of hair follicledevelopment. J Investig Dermatol Symp Proc 2005;10:247e51.
60. McCarthy MI, Hirschhorn JN. Genome-wide association studies: potential nextsteps on a genetic journey. Hum Mol Genet 2008;17:156e65.
61. Cichon S, Craddock N, Daly M, Faraone SV, Gejman PV, Kelsoe J, Lehner T,Levinson DF, Moran A, Sklar P, Sullivan PF; Psychiatric GWAS ConsortiumCoordinating Committee. Genome-wide association studies: history, rationale, andprospects for psychiatric disorders. Am J Psychiatry 2009;166:540e56.
62. Cooper RS, Tayo B, Zhu X. Genome-wide association studies: implications formultiethnic samples. Hum Mol Genet 2008;17:151e5.
63. Bolnick DA, Fullwiley D, Duster T, Cooper RS, Fujimura JH, Kahn J, Kaufman JS,Marks J, Morning A, Nelson A, Ossorio P, Reardon J, Reverby SM, TallBear K.Genetics. The science and business of genetic ancestry testing. Science2007;318:399e400.
64. Anon. ASHG ancestry testing statement, 13 November 2008. Bethesda, MD: ASHG,2008.
65. Soo-Jin Lee S, Bolnick DA, Duster T, Ossorio P, Tallbear K. Genetics. The illusivegold standard in genetic ancestry testing. Science 2009;325:38e9.
66. NelsonMR, Bryc K, King KS, Indap A, Boyko AR, Novembre J, Briley LP, Maruyama Y,Waterworth DM, Waeber G, Vollenweider P, Oksenberg JR, Hauser SL, Stirnadel HA,Kooner JS, Chambers JC, Jones B, Mooser V, Bustamante CD, Roses AD, Burns DK,EhmMG, Lai EH. The Population Reference Sample, POPRES: a resource for population,disease, and pharmacological genetics research. Am J Hum Genet 2008;83:347e58.
67. Reich D, Thangaraj K, Patterson N, Price AL, Singh L. Reconstructing Indianpopulation history. Nature 2009;461:489e94.
J Med Genet 2010;47:835e847. doi:10.1136/jmg.2010.078212 847
Original article
group.bmj.com on April 30, 2014 - Published by jmg.bmj.comDownloaded from

doi: 10.1136/jmg.2010.0782122010
2010 47: 835-847 originally published online October 4,J Med Genet Peristera Paschou, Jamey Lewis, Asif Javed, et al. populationsindividual assignment to worldwide Ancestry informative markers for fine-scale
http://jmg.bmj.com/content/47/12/835.full.htmlUpdated information and services can be found at:
These include:
Data Supplement http://jmg.bmj.com/content/suppl/2010/11/29/jmg.2010.078212.DC1.html
"Web Only Data"
References
http://jmg.bmj.com/content/47/12/835.full.html#related-urlsArticle cited in:
http://jmg.bmj.com/content/47/12/835.full.html#ref-list-1This article cites 61 articles, 15 of which can be accessed free at:
serviceEmail alerting
the box at the top right corner of the online article.Receive free email alerts when new articles cite this article. Sign up in
Notes
http://group.bmj.com/group/rights-licensing/permissionsTo request permissions go to:
http://journals.bmj.com/cgi/reprintformTo order reprints go to:
http://group.bmj.com/subscribe/To subscribe to BMJ go to:
group.bmj.com on April 30, 2014 - Published by jmg.bmj.comDownloaded from