analyzing fracture patterns in theran wall paintings
TRANSCRIPT
The 11th International Symposium on Virtual Reality, Archaeology and Cultural Heritage VAST (2010)A. Artusi, M. Joly-Parvex, G. Lucet, A. Ribes, and D. Pitzalis (Editors)
Analyzing Fracture Patterns in Theran Wall Paintings
H. Shin1 & C. Doumas2 & T. Funkhouser1 & S. Rusinkiewicz1 & K. Steiglitz1 & A. Vlachopoulos3 & T. Weyrich4
1Princeton University, Princeton, NJ USA2National University of Athens, Athens, Greece & Akrotiri Excavation, Thera, Greece
3University of Ioannina, Ioannina, Greece & Akrotiri Excavation, Thera, Greece4University College London, London, UK
Abstract
In this paper, we analyze the fracture patterns observed in wall paintings excavated from Akrotiri, a Bronze AgeAegean city destroyed by earthquakes preceding a volcanic eruption on Thera (modern Santorini) around 1630BC. We use interactive programs to trace detailed fragment boundaries in images of manually reconstructed wallpaintings. Then, we use geometric analysis algorithms to study the shapes and contacts of those fragment bound-aries, producing statistical distributions of lengths, angles, areas, and adjacencies found in assembled paintings.The result is a statistical model that suggests a hierarchical fracture pattern, where fragments break into twopieces recursively along cracks nearly orthogonal to previous ones. This model could be useful for predictingfracture patterns of other wall paintings and/or for guiding future computer-assisted reconstruction algorithms.
1. Introduction
Reconstruction of fractured ancient artifacts such as fres-coes, pots, statues, and tablets is important because it helpsarcheologists make inferences about past civilizations andcultures. Unfortunately, reconstruction is usually a painstak-ingly labor-intensive job which may take several months oreven years to complete by hand if the number of fragmentsis very large.
To overcome this problem, several computer scientistshave worked on automated reconstruction systems that ac-quire photographs and/or laser scans of fragments and thenuse computer algorithms to assemble them [WC08]. Exam-ple projects of this type include Stitch [CWAB01] and FormaUrbis Romae [KL06]. They typically use combinatorial al-gorithms to search for the arrangement of fragments thatoptimizes a scoring function, usually designed heuristicallybased on the compatibility of properties in adjacent frag-ments. While they have demonstrated some success, theystill are not able to assemble complete artifacts from manyfragments automatically [WC08].
In this paper, we utilize analysis of previously recon-structed wall paintings to learn statistics of correct fragmentarrangements. Our goal is to gather data that can be used tocharacterize the arrangements of fragments typically found
in reconstructions so that more principled scoring functionscan be developed and generative models of crack forma-tion can be evaluated. We use interactive programs to tracedetailed fragment boundaries in images of manually recon-structed wall paintings. Then, we use geometric analysis al-gorithms to study the shapes and contacts of those fragmentboundaries, producing statistical distributions of lengths, an-gles, areas, and adjacencies found in assembled arrange-ments of fragments.
We believe that these statistics reveal valuable informa-tion that could guide future scoring functions and/or genera-tive models. Loosely speaking, we find that: 1) fragmentstend to be nearly convex polygons with 3-8 sides, 2) thedistribution of fragment areas roughly follows an exponen-tial distribution, 3) “edges” between two adjacent fragmentstend to be nearly straight, and 4) “junctions” most often ap-pear with three fragments coming together in a T-junction.
We believe that these observations support the hypothesisthat the cracks formed as the result of a hierarchical pro-cess, where fragments were broken recursively into two sub-fragments along nearly straight cracks nearly orthogonal toprevious cracks. Investigating this hypothesis with statisti-cal analysis of continuous-valued properties of reconstructedwall paintings is the most novel contribution of our work.
c© The Eurographics Association 2010.
H. Shin et al. / Analyzing Fracture Patterns in Theran Wall Paintings
2. Related Work
There has been a long history of work on computer-aided reconstruction of fractured objects in archeol-ogy [KDS09, WC08]. Most previous work has focused onfinding pairwise matches between adjacent fragments byaligning patterns in their surface colors [PPR∗08], polygonalboundaries [PPE02, dGLS02], normal maps [TFBW∗10],and/or fractured edges [BTFN∗08, HFG∗06, PK03]. Thesemethods have been successful in cases where the fragmentshave highly distinctive features [HFG∗06], the reconstructedobjects are surfaces of revolution [KS04, KS08, WC06]),and/or when domain-specific features can be used to iden-tify potential matches [KL06]. However, they have not beenable to automatically reconstruct archoelogical artifacts witha multitude of flat, partially eroded fragments [WC08].
There are two significant problems. First, it is intractibleto exhaustively search the space of potential fragment align-ments (Θ(N!) for N fragments) [DD07]. Second, it is diffi-cult to devise a “scoring function” that effectively discrim-inates correct alignments from incorrect ones. As a result,most prior reconstruction algorithms have employed heuris-tics to prune the search space based on expected relation-ships between adjacent fragments. For example, in the do-main of jigsaw puzzle solving [FG64], the boundary of eachpiece can be partitioned robustly into discrete features repre-senting “tabs,” “indents,” “corners,” and “border edges,” andonly certain types of arrangements are possible when join-ing those features (e.g., corners abut with corners, tabs alignwith indents, border edges continue across several pieces,etc.). Thus, it is possible to prune the space of potentialmatches significantly, and puzzles with up to 200 pieces canbe solved [GMB04]. Our goal is to generalize these meth-ods to the domain of wall painting reconstruction, where re-lationships between adjacent fragments are not so clear-cutand thus must be described statistically.
Statistical analysis of fracture patterns has a long historyin mechanics [Gri21], geology [Clo55], forensics [MMR06],paleontology [BRY09], and several other fields. In 1962,Lachenbruch classified fracture patterns as either orthog-onal (e.g., hierarchical) or non-orthogonal (e.g., hexago-nal) [Lac62]. He observed that junctions are often at rightangles in orthogonal structures. In 1968, Rats proposed a“rule of identical areas” suggesting that stone blocks breakinto nearly equally-sized pieces until a minimum block sizeis reached and observed that orthogonal fracture patternshave predominantly four-sided fragments [Rat68]. Mulheranobserved that crack networks in thin films are statisticallyself-similar, suggesting that fragment areas have an expo-nential distribuiton. Other specialists have studied hierarchi-cal fracture patterns in ceramics [KMM98], chalk [Caw77],clay [TS08], polymer coatings [Han02], mud [BPC05], andother materials.
Within archeology, the most closely related work is byMcBride et al. [MK03], who observed that the vast major-
ity of junctions appear where three fragments join in a “T”junction (70-89%) and that discernable corners in fragmentcontours usually align in pairwise fragment matches (77-78% have at least one corner aligned). They utilized theseobservations in a reconstruction algorithm that consideredonly pairwise matches that align corners, demonstrating re-sults for test data sets with 13-25 fragments. While this worktakes a significant first step in the direction of our paper,it provides only very coarse statistics (i.e., counts of thenumber of junctions falling into certain pre-defined cases).The authors do not trace the boundaries of fragments and/orgather continuous-valued descriptions of how fragments arearranged (e.g., areas, lengths, angles, etc.), and they do notadvocate a specific model of the fracture process, and thustheir statistical analysis and range of applications are not asgeneral as ours.
3. Methods
The main contribution of our work is a statistical model forthe crack pattern of a fractured wall painting. Starting froma high-resolution image of a manually reconstructed fresco,we use an interactive program to trace contours around ev-ery fragment in the image and then gather statistical distribu-tions of spatial properties that characterize the observed ar-rangement of fragments. These statistics form a data-drivenprobabilistic model for the fracture pattern.
Our test case is a wall painting called “Crocus Gathererand Potnia” (top left of Figure 1), which was recovered fromthe Xeste 3 building at the archeological site of Akrotiri,Thera. This was a Late Bronze Age city destroyed circa1630 B.C. by earthquakes preceding a volcanic eruption.The city, well preserved by volcanic ash, has been the siteof an excavation since 1967, and dozens of wall paintingshave been recovered and are being reassembled [Dou92].
The wall paintings were constructed on an interior wallthat was covered first by mud and straw, then by a layerof lime plaster roughly 1 cm thick. The designs, which in-clude both buon fresco and fresco secco areas, were appliedto a final thin layer of fine plaster [Dou92]. The wall paint-ings are excavated in thousands of small fragments, cleanedand conserved, then manually reassembled by skilled cura-tors over the course of many years. The “Potnia” measures3.2 m in width and 2.3 m in height, and we work with ahigh-resolution image produced by stiching together a largenumber of digital photographs [Pap09].
Our goal is to develop a processing pipeline to analyze thefracture patterns in this and other wall paintings. The follow-ing two subsections describe the main steps of this process-ing pipeline: contour tracing and contour analysis. Potentialapplications are discussed in Section 4, and Section 5 pro-vides a summary of our findings and topics for future work.
c© The Eurographics Association 2010.
H. Shin et al. / Analyzing Fracture Patterns in Theran Wall Paintings
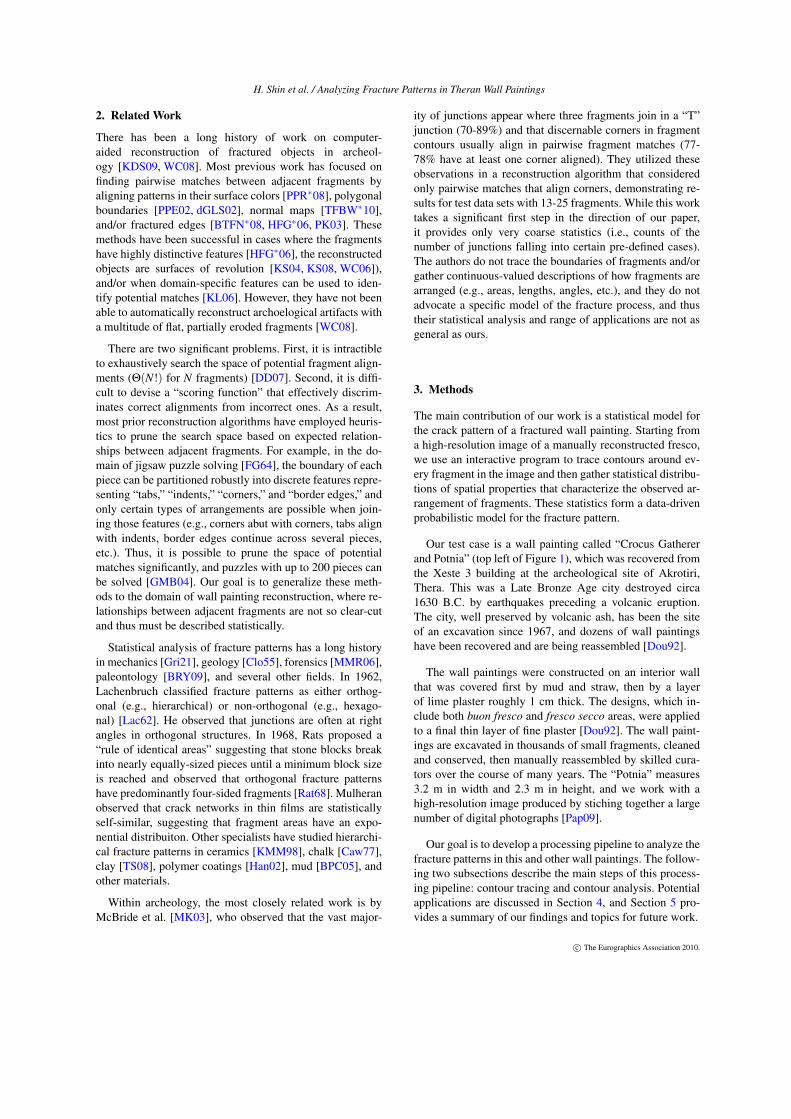
Figure 1: High-resolution color image of a reconstructed Theran wall painting called “Crocus Gatherer and Potnia” (repub-lished with permission from Figs 122-128 of “The Wall Paintings of Thera” [Dou92]). The painting (3.22 x 2.30 meters) wasphotographed at 80 pixels per centimeter by George Papandreou [Pap09] (top left), and then every fragment was outlined witha contour tracing program to yield a polygonal mesh representation (bottom left) with 4,147 fragments, including 156 gaps,10,994 edges (blue lines), and 4,921 junctions. A zoomed view of the polygonal mesh is shown on the right.
3.1. Contour Tracing
Beginning with a high-resolution color image of a manuallyreconstructed fresco (top left of Figure 1), our first goal is totrace the contour outlining the perimeter of every fragment(bottom left of Figure 1). This goal is challenging becausea single fresco may have thousands of fragments and thecracks between those fragments may form a complex net-work of contours, requiring millions of points to capture thepaths of all cracks accurately (Figure 1).
Ideally, we could write a computer program that wouldextract fragment contours from a color image automatically.However, cracks are difficult to detect robustly, especiallyin painted regions where crack patterns are inter-mixed withcolor patterns [BH03]. As a result, it is difficult for a com-puter to discover the topology and gross placement of con-tours completely automatically, as there are many situationsin which the global structure of the fracture pattern must beunderstood in order to determine the correct placement andconnectivity of junctions (a task that people are very goodat). Alternatively, we could ask a person to trace every con-tour with an interactive tracing program. However, it wouldbe tedious and error-prone for a person to trace the path ofevery crack accurately (at pixel precision), since cracks typ-
ically have many “wiggles” that would be difficult to traceinteractively (a task that computers are good at). So, we takea hybrid approach.
We have implemented a semi-automatic program to tracefragment boundary contours inspired by the “intelligent scis-soring” approach of Mortensen and Barrett [MB95]. Theuser begins by clicking on a junction or other point of in-terest. Then, as she moves the mouse away from the clicked“anchor” point, the computer interactively displays the opti-mal computed path between the anchor and the current cur-sor position. The user may click to place another anchorpoint, freezing the current curve, or click on a previously-placed curve or anchor, joining the curve to a newly-createdjunction.
The optimal path minimizes an energy function designedto snap to cracks in the image. Because the cracks appeardarker than the surrounding plaster, we define the energyfunction E at each pixel to be smaller when the pixel’s in-tensity is lower than its neighbors’:
E =[1+ I(p)− max
q∈N (p)I(q)
]n. (1)
The exponent n is used to determine the strength of snap-ping: lower values favor short paths, while higher ones al-
c© The Eurographics Association 2010.
H. Shin et al. / Analyzing Fracture Patterns in Theran Wall Paintings
low the path to deviate more from a straight line in orderto follow cracks. (We found that n = 8 provides a reason-able tradeoff.) Dijkstra’s algorithm is used to efficiently findshortest paths at run time.
The bottom-left and rightmost images in Figure 1 showscreenshots of the program after the contour tracing processis complete (i.e., after approximately 20 hours of user in-put). The result is a polygonal mesh covering the image,where each polygon represents a fragment or gap (markedby the user), each edge represents a sequence of points alongthe boundary between two fragments (shown in blue), andeach vertex represents a junction at a position where multipleedges/fragments meet. Since junctions and edges are sharedbetween fragments, topological (adjacencies) and geometricproperties (e.g., angles, lengths, and areas) are easily com-puted from the polygonal mesh.
3.2. Contour Analysis
Once we have a polygonal mesh output by the contour trac-ing program, we analyze its geometric and topological prop-erties with the goal of building a statistical model of itscrack pattern. Specifically, we investigate properties of frag-ments (adjacencies, area, convexity, and circularity), edges(lengths, angles, straightness, and corner types), and junc-tions (adjacencies, angles, and corner types). We presentstatistics gathered during our analysis in this section and dis-cuss possible applications in the next.
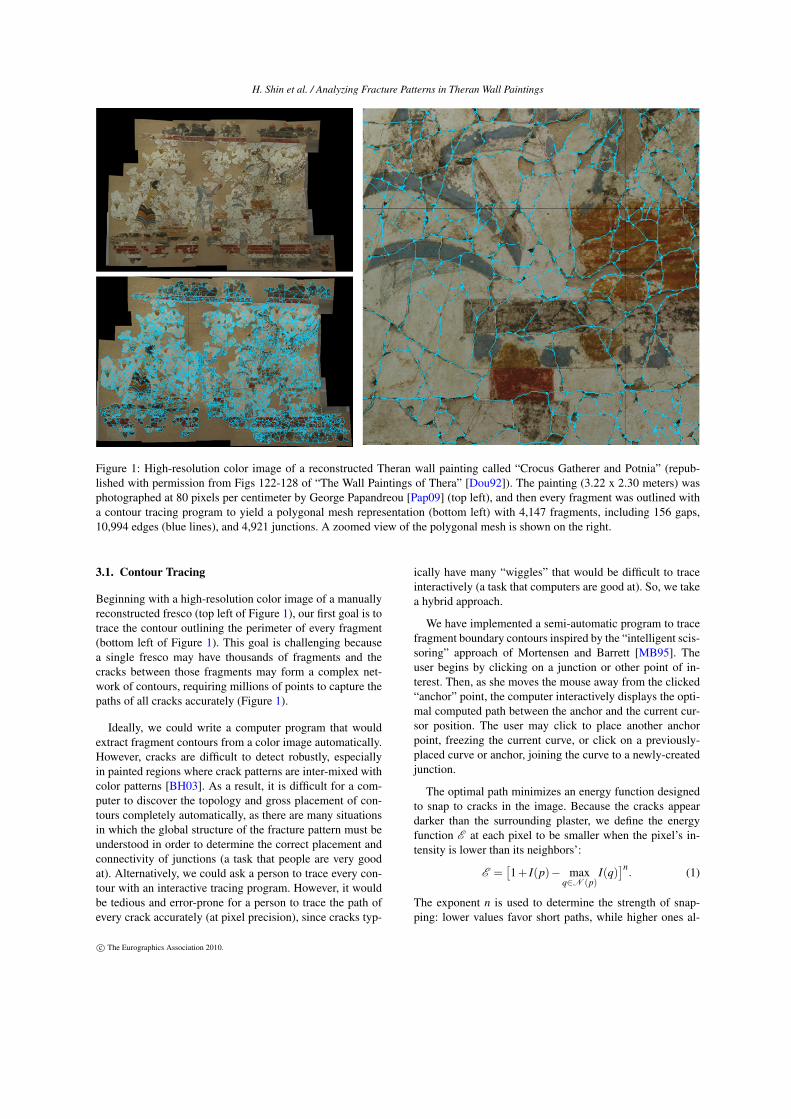
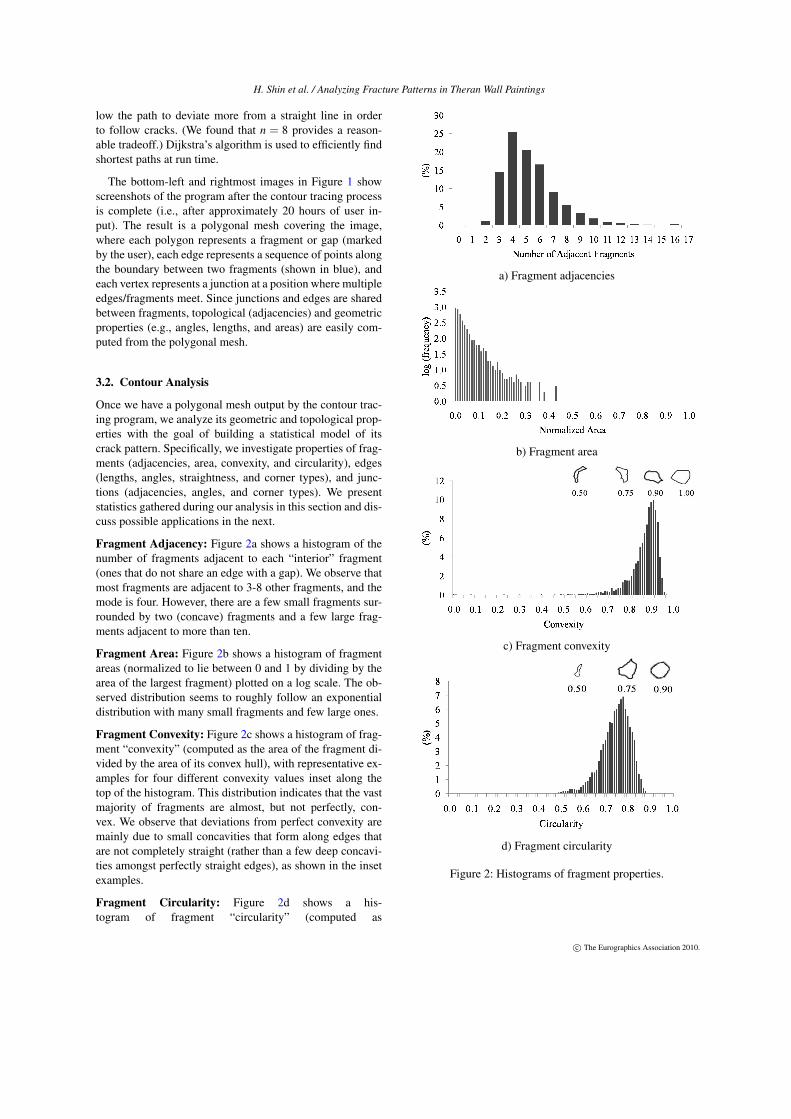
Fragment Adjacency: Figure 2a shows a histogram of thenumber of fragments adjacent to each “interior” fragment(ones that do not share an edge with a gap). We observe thatmost fragments are adjacent to 3-8 other fragments, and themode is four. However, there are a few small fragments sur-rounded by two (concave) fragments and a few large frag-ments adjacent to more than ten.
Fragment Area: Figure 2b shows a histogram of fragmentareas (normalized to lie between 0 and 1 by dividing by thearea of the largest fragment) plotted on a log scale. The ob-served distribution seems to roughly follow an exponentialdistribution with many small fragments and few large ones.
Fragment Convexity: Figure 2c shows a histogram of frag-ment “convexity” (computed as the area of the fragment di-vided by the area of its convex hull), with representative ex-amples for four different convexity values inset along thetop of the histogram. This distribution indicates that the vastmajority of fragments are almost, but not perfectly, con-vex. We observe that deviations from perfect convexity aremainly due to small concavities that form along edges thatare not completely straight (rather than a few deep concavi-ties amongst perfectly straight edges), as shown in the insetexamples.
Fragment Circularity: Figure 2d shows a his-togram of fragment “circularity” (computed as
a) Fragment adjacencies
b) Fragment area
c) Fragment convexity
d) Fragment circularity
Figure 2: Histograms of fragment properties.
c© The Eurographics Association 2010.
H. Shin et al. / Analyzing Fracture Patterns in Theran Wall Paintings
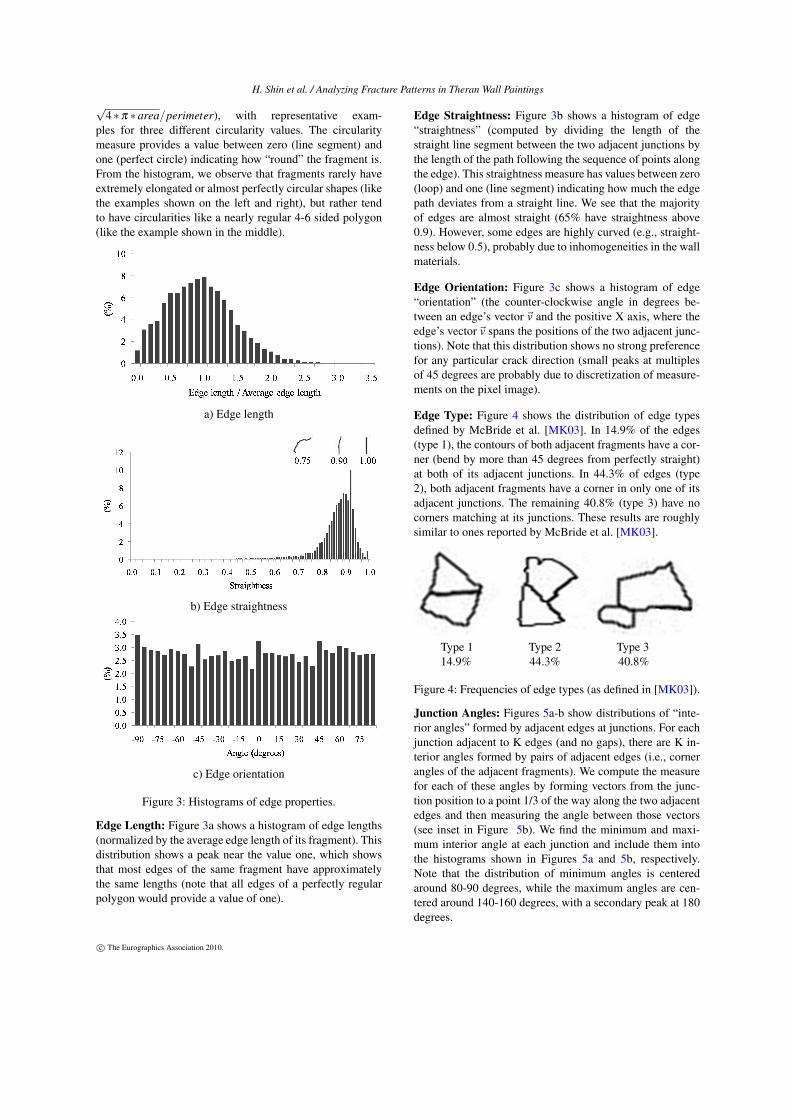
√4∗π ∗area/perimeter), with representative exam-
ples for three different circularity values. The circularitymeasure provides a value between zero (line segment) andone (perfect circle) indicating how “round” the fragment is.From the histogram, we observe that fragments rarely haveextremely elongated or almost perfectly circular shapes (likethe examples shown on the left and right), but rather tendto have circularities like a nearly regular 4-6 sided polygon(like the example shown in the middle).
a) Edge length
b) Edge straightness
c) Edge orientation
Figure 3: Histograms of edge properties.
Edge Length: Figure 3a shows a histogram of edge lengths(normalized by the average edge length of its fragment). Thisdistribution shows a peak near the value one, which showsthat most edges of the same fragment have approximatelythe same lengths (note that all edges of a perfectly regularpolygon would provide a value of one).
Edge Straightness: Figure 3b shows a histogram of edge“straightness” (computed by dividing the length of thestraight line segment between the two adjacent junctions bythe length of the path following the sequence of points alongthe edge). This straightness measure has values between zero(loop) and one (line segment) indicating how much the edgepath deviates from a straight line. We see that the majorityof edges are almost straight (65% have straightness above0.9). However, some edges are highly curved (e.g., straight-ness below 0.5), probably due to inhomogeneities in the wallmaterials.
Edge Orientation: Figure 3c shows a histogram of edge“orientation” (the counter-clockwise angle in degrees be-tween an edge’s vector ~v and the positive X axis, where theedge’s vector~v spans the positions of the two adjacent junc-tions). Note that this distribution shows no strong preferencefor any particular crack direction (small peaks at multiplesof 45 degrees are probably due to discretization of measure-ments on the pixel image).
Edge Type: Figure 4 shows the distribution of edge typesdefined by McBride et al. [MK03]. In 14.9% of the edges(type 1), the contours of both adjacent fragments have a cor-ner (bend by more than 45 degrees from perfectly straight)at both of its adjacent junctions. In 44.3% of edges (type2), both adjacent fragments have a corner in only one of itsadjacent junctions. The remaining 40.8% (type 3) have nocorners matching at its junctions. These results are roughlysimilar to ones reported by McBride et al. [MK03].
Type 1 Type 2 Type 314.9% 44.3% 40.8%
Figure 4: Frequencies of edge types (as defined in [MK03]).
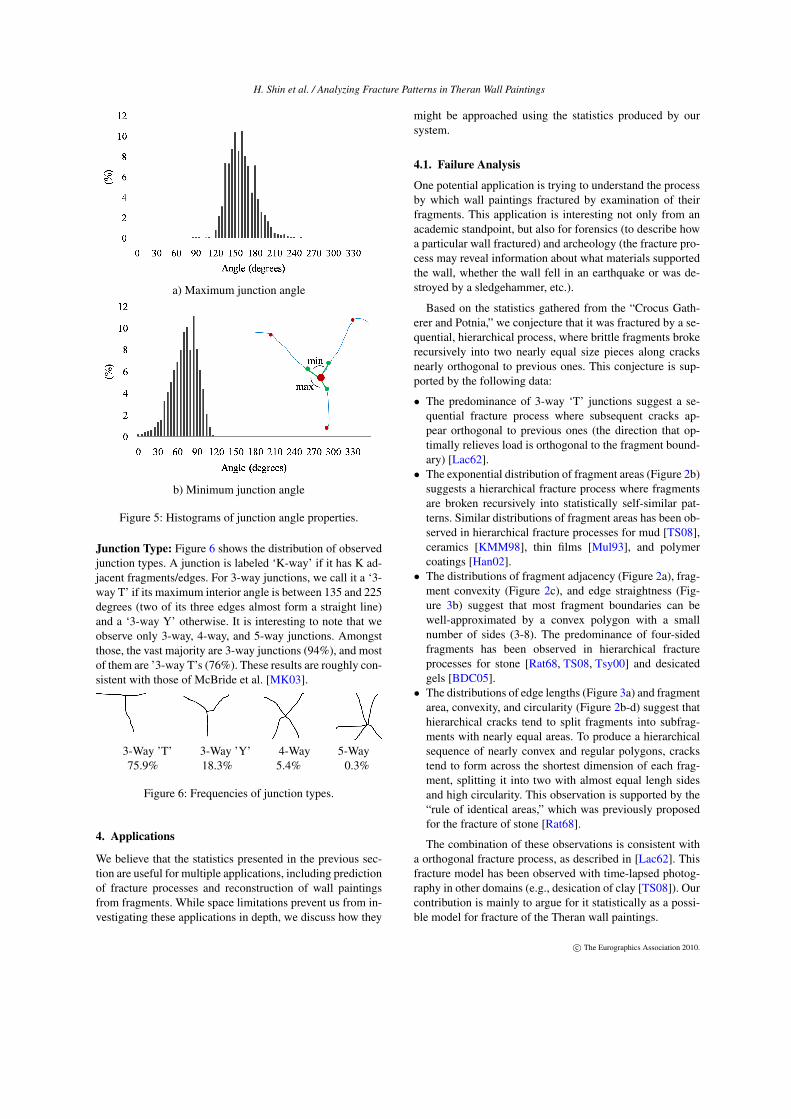
Junction Angles: Figures 5a-b show distributions of “inte-rior angles” formed by adjacent edges at junctions. For eachjunction adjacent to K edges (and no gaps), there are K in-terior angles formed by pairs of adjacent edges (i.e., cornerangles of the adjacent fragments). We compute the measurefor each of these angles by forming vectors from the junc-tion position to a point 1/3 of the way along the two adjacentedges and then measuring the angle between those vectors(see inset in Figure 5b). We find the minimum and maxi-mum interior angle at each junction and include them intothe histograms shown in Figures 5a and 5b, respectively.Note that the distribution of minimum angles is centeredaround 80-90 degrees, while the maximum angles are cen-tered around 140-160 degrees, with a secondary peak at 180degrees.
c© The Eurographics Association 2010.
H. Shin et al. / Analyzing Fracture Patterns in Theran Wall Paintings
a) Maximum junction angle
b) Minimum junction angle
Figure 5: Histograms of junction angle properties.
Junction Type: Figure 6 shows the distribution of observedjunction types. A junction is labeled ‘K-way’ if it has K ad-jacent fragments/edges. For 3-way junctions, we call it a ‘3-way T’ if its maximum interior angle is between 135 and 225degrees (two of its three edges almost form a straight line)and a ‘3-way Y’ otherwise. It is interesting to note that weobserve only 3-way, 4-way, and 5-way junctions. Amongstthose, the vast majority are 3-way junctions (94%), and mostof them are ’3-way T’s (76%). These results are roughly con-sistent with those of McBride et al. [MK03].
3-Way ’T’ 3-Way ’Y’ 4-Way 5-Way75.9% 18.3% 5.4% 0.3%
Figure 6: Frequencies of junction types.
4. Applications
We believe that the statistics presented in the previous sec-tion are useful for multiple applications, including predictionof fracture processes and reconstruction of wall paintingsfrom fragments. While space limitations prevent us from in-vestigating these applications in depth, we discuss how they
might be approached using the statistics produced by oursystem.
4.1. Failure Analysis
One potential application is trying to understand the processby which wall paintings fractured by examination of theirfragments. This application is interesting not only from anacademic standpoint, but also for forensics (to describe howa particular wall fractured) and archeology (the fracture pro-cess may reveal information about what materials supportedthe wall, whether the wall fell in an earthquake or was de-stroyed by a sledgehammer, etc.).
Based on the statistics gathered from the “Crocus Gath-erer and Potnia,” we conjecture that it was fractured by a se-quential, hierarchical process, where brittle fragments brokerecursively into two nearly equal size pieces along cracksnearly orthogonal to previous ones. This conjecture is sup-ported by the following data:
• The predominance of 3-way ‘T’ junctions suggest a se-quential fracture process where subsequent cracks ap-pear orthogonal to previous ones (the direction that op-timally relieves load is orthogonal to the fragment bound-ary) [Lac62].
• The exponential distribution of fragment areas (Figure 2b)suggests a hierarchical fracture process where fragmentsare broken recursively into statistically self-similar pat-terns. Similar distributions of fragment areas has been ob-served in hierarchical fracture processes for mud [TS08],ceramics [KMM98], thin films [Mul93], and polymercoatings [Han02].
• The distributions of fragment adjacency (Figure 2a), frag-ment convexity (Figure 2c), and edge straightness (Fig-ure 3b) suggest that most fragment boundaries can bewell-approximated by a convex polygon with a smallnumber of sides (3-8). The predominance of four-sidedfragments has been observed in hierarchical fractureprocesses for stone [Rat68, TS08, Tsy00] and desicatedgels [BDC05].
• The distributions of edge lengths (Figure 3a) and fragmentarea, convexity, and circularity (Figure 2b-d) suggest thathierarchical cracks tend to split fragments into subfrag-ments with nearly equal areas. To produce a hierarchicalsequence of nearly convex and regular polygons, crackstend to form across the shortest dimension of each frag-ment, splitting it into two with almost equal lengh sidesand high circularity. This observation is supported by the“rule of identical areas,” which was previously proposedfor the fracture of stone [Rat68].
The combination of these observations is consistent witha orthogonal fracture process, as described in [Lac62]. Thisfracture model has been observed with time-lapsed photog-raphy in other domains (e.g., desication of clay [TS08]). Ourcontribution is mainly to argue for it statistically as a possi-ble model for fracture of the Theran wall paintings.
c© The Eurographics Association 2010.
H. Shin et al. / Analyzing Fracture Patterns in Theran Wall Paintings
4.2. Reconstruction
A second application is computer-assisted reconstruction ofobjects from fragments. Much research has been devoted tothis problem over the last few decades [WC08], but to ourknowledge none has explicitly utilized a statistical model ofa fracture process to guide reconstruction.
Most systems use combinatorial algorithms to search forarrangements of fragments that optimize a scoring functionmeasuring the compatibility of properties in adjacent frag-ments. For example, Brown et al. [BTFN∗08] built a systemfor reconstruction of Theran wall paintings that used laserscanners to acquire 3D surface geometry for every fragment,exhaustive search algorithms to test pairwise alignments offragments at regularly spaced contact points and a functionbased on distances between aligned surface points to scorepotential matches. The system does not explicitly considerproperties of junctions or clusters of more than two frag-ments.
We conjecture that it is possible to improve both searchalgorithms and scoring functions by considering the processby which artifacts were fractured. In particular, if the Theranwall paintings were indeed broken by the hierarchical pro-cess proposed in the previous subsection, then that processcould be reversed by a bottom-up reconstruction algorithm.Since hierarchical fracture processes produce self-similarpatterns at every scale, correctly arranged clusters of frag-ments should have the same statistical properties as thoseobserved for the original fragments. So, an algorithm couldutlize the statistical distributions reported in Section 3.2 todesign a scoring function that guides a bottom-up search al-gorithm.
For example, rather than exhaustively searching all pair-wise alignments of fragments [BTFN∗08], it would be pos-sible to consider only matches where corners align (as in[MK03]) and then score them probabilistically based onthe statistical properties of the edge, junctions, and mergedfragments. For the Theran wall painting studied in this pa-per, highest probability matches produce edges that are al-most straight, junction angles that sum to approximately180 degrees, and merged fragments that are almost convex,highly circular, and have 3-8 approximately straight edges(of these criteria, only edge straightness has been consid-ered as a matching criterion by previous reconstruction sys-tems [KK01, MK03]). We believe that these criteria couldbe incorporated into a scoring function for reconstruction ofother Theran wall paintings and possibly other archeologi-cal artifacts to improve efficiency and accuracy. A study cur-rently being performed to validate this hypothesis has shownpromising initial results.
5. Conclusion and Future Work
In this paper, we have described methods to analyze thefracture patterns observed in a manually reconstructed wall
paintings. We describe an interactive program to trace de-tailed fragment boundaries in images and geometric analy-sis algorithms to produce statistical distributions of lengths,angles, areas, and adjacencies found in the traced fragmentarrangements. The result is a statistical model that suggestsa hierarchical fracture pattern, where fragments break re-cursively into two nearly equal size pieces along cracksnearly orthogonal to previous ones. We believe that thismodel could be useful for understanding fracture mecha-nisms and/or for guiding future computer-assisted recon-struction algorithms.
While this study takes a small step, our approach has sev-eral limitations and there are many avenues for future re-search. As a next step, future work should perform analy-sis of many different wall paintings and ideally many dif-ferent artifact types. Although our data set has over 4,000fragments, they are all from the same wall painting, and soit may not be representative of other wall paintings or otherartifacts made from different materials. We plan to gathermore data and to make our tools publicly available so thatanalysis and comparison of different archeological artifactscan be performed in the future.
A second interesting topic for future work is to developsimulations and mathematical models of hierarchical frac-ture processes and then compare the statistics predicted bythose simulations/models with the ones observed in this pa-per. This approach is taken in previous work in other ap-plication domains [DGA05, IO09, Mou05], but it would beinteresting to investigate (parameters for) a model of hierar-chical fracture of brittle materials to match the patterns ob-served in archeology. Moreover, the proposed hierarchicalfracture model could be confirmed with high speed video, aswas done for fracture under biaxial loading in [Ols07].
Finally, further research is required to understand exactlyhow to utilize the observed statistics and proposed fracturemodel presented in this paper to guide a reconstruction algo-rithm. Several ideas of how to do this are discussed in Sec-tion 4.2, but exploring them fully is still a topic for futurework.
References[BDC05] BOHN S., DOUADY S., COUDER Y.: Four sided do-
mains in hierarchical space dividing patterns. Phys. Rev. Lett. 94(2005). 6
[BH03] BAZIN P.-L., HENRY A.: Wall drawer: A simple solutionto traditional drawing and photographic recording of archaeolog-ical features. Journal of Field Archaeology (2003). 3
[BPC05] BOHN S., PAUCHARD L., COUDER Y.: Hierarchicalcrack patterns as formed by successive domain divisions. I. tem-poral and geometrical hierarchy. Physical Review E 71, 4 (2005).2
[BRY09] BHANDARKAR S., ROBINSON R., YU J.: Virtualmulti-fracture craniofacial reconstruction using computer visionand graph matching. Computerized Medical Imaging and Graph-ics 33 (Jan 2009), 333–342. 2
c© The Eurographics Association 2010.
H. Shin et al. / Analyzing Fracture Patterns in Theran Wall Paintings
[BTFN∗08] BROWN B., TOLER-FRANKLIN C., NEHAB D.,BURNS M., DOBKIN D., VLACHOPOULOS A., DOUMAS C.,RUSINKIEWICZ S., WEYRICH T.: A system for high-volume ac-quisition and matching of fresco fragments: reassembling theranwall paintings. SIGGRAPH ’08: SIGGRAPH 2008 papers (Aug2008). 2, 7
[Caw77] CAWSEY D. C.: The measurement of fracture patterns inthe chalk of southern england. Engineering Geology 11 (1977),201–215. 2
[Clo55] CLOOS E.: Experimental analysis of fracture patterns.Geological Society of America 66, 3 (1955). 2
[CWAB01] COOPER D., WILLIS A., ANDREWS S., BAKER J.:Assembling virtual pots from 3d measurements of their frag-ments. Proceedings of the 2001 conference on Virtual reality(Jan 2001). 1
[DD07] DEMAINE E., DEMAINE M.: Jigsaw puzzles, edgematching, and polyomino packing: Connections and complexity.Graphs and Combinatorics 23 (Jun 2007), 195–208. 2
[DGA05] DESBENOIT B., GALIN E., AKKOUCHE S.: Modelingcracks and fractures. The Visual Computer 21, 8 (Jan 2005), 717–726. 7
[dGLS02] DA GAMA LEITÃO H. C., STOLFI J.: A multiscalemethod for the reassembly of two-dimensional fragmented ob-jects. Pattern Analysis and Machine Intelligence, IEEE Transac-tions on 24, 9 (Sep 2002), 1239 – 1251. 2
[Dou92] DOUMAS C.: The Wall-Paintings of Thera. Thera Foun-dation, 1992. 2, 3
[FG64] FREEMAN H., GARDER L.: Apictorial jigsaw puzzles:The computer solution of a problem in pattern recognition. Elec-tronic Computers, IEEE Transactions on EC-13, 2 (Apr 1964),118 – 127. 2
[GMB04] GOLDBERG D., MALON C., BERN M.: A global ap-proach to automatic solution of jigsaw puzzles. ComputationalGeometry: Theory and Applications 28, 2-3 (Jan 2004), 165–174.2
[Gri21] GRIFFITH A.: The phenomena of rupture and flow insolids. Philosophical Transactions of the Royal Society of Lon-don A 221 (1921), 163–198. 2
[Han02] HANDGE U.: Analysis of a shear-lag model with non-linear elastic stress transfer for sequential cracking of polymer.Journal of Materials Science 37, 22 (2002), 4775–4782. 2, 6
[HFG∗06] HUANG Q., FLÖRY S., GELFAND N., HOFER M.,POTTMANN H.: Reassembling fractured objects by geometricmatching. SIGGRAPH ’06: SIGGRAPH 2006 Papers (Jul 2006).2
[IO09] IBEN H., O’BRIEN J.: Generating surface crack patterns.Graphical Models 71, 6 (2009), 198–206. 7
[KDS09] KLEBER F., DIEM M., SABLATNIG R.: Torn documentanalysis as a prerequisite for reconstruction. Virtual Systems andMultimedia, 2009. VSMM ’09. 15th International Conference on(Sep 2009), 143 – 148. 2
[KK01] KONG W., KIMIA B.: On solving 2d and 3d puzzlesusing curve matching. IEEE Computer Society Conference onComputer Vision . . . (Jan 2001), 583–590. 7
[KL06] KOLLER D., LEVOY M.: Computer-aided reconstructionand new matches in the forma urbis romae. Bullettino Della Com-missione Archeologica Comunale di Roma (2006), 103–125. 1,2
[KMM98] KORNETTA W., MENDIRATTA S., MENTEIRO J.:Topological and geometrical properties of crack patterns pro-duced by the thermal shock in ceramics. Physical Review E 57,3 (1998). 2, 6
[KS04] KAMPEL M., SABLATNIG R.: 3d puzzling of archeolog-ical fragments. Proc. of 9th Computer Vision Winter Workshop(2004). 2
[KS08] KARASIK A., SMILANSKY U.: 3d scanning technologyas a standard archaeological tool for pottery analysis: practiceand . . . . Journal of Archaeological Science (Jan 2008). 2
[Lac62] LACHENBRUCH A.: Mechanics of thermal contractioncracks and icewedge polygons in permafrost. Geol. Soc. Amer.Spec 70 (1962). 2, 6
[MB95] MORTENSEN E. N., BARRETT W. A.: Intelligent scis-sors for image composition. In Computer Graphics (Proc. SIG-GRAPH ‘95) (1995). 3
[MK03] MCBRIDE J., KIMIA B.: Archaeological fragment re-construction using curve-matching. Proceedings of the 2003Conference on Computer Vision and Pattern Recognition Work-shop (CVPRW’03) (Jan 2003). 2, 5, 6, 7
[MMR06] MCDANELS S., MAYEAUX B., RUSSELL R.: Anoverview of the space shuttle columbia accident from recoverythrough reconstruction. Journal of Failure Analysis and Preven-tion 6, 1 (Jan 2006), 82–91. 2
[Mou05] MOULD D.: Image-guided fracture. In Graphics Inter-face (2005), pp. 219–226. 7
[Mul93] MULHERAN P.: Crack networks in thin films. Philo-sophical Magazine Letters 68, 2 (1993), 63–68. 6
[Ols07] OLSON J.: Fracture aperture, length and pattern geom-etry development under biaxial loading: a numerical study withapplications to natural, cross-jointed systems. In The Relation-ship between Damage and Localization. The Geological Societyof London, 2007, pp. 123–142. 7
[Pap09] PAPANDREOU G.: Image Analysis and Computer Vision:Theory and Applications in the Restoration of Ancient Wall Paint-ings. PhD thesis, Nat. Tech. Univ. of Athens, Greece, 2009. 2,3
[PK03] PAPAIOANNOU G., KARABASSI E.: On the automaticassemblage of arbitrary broken solid artefacts. Image and VisionComputing 21, 5 (Jan 2003), 401–412. 2
[PPE02] PAPAODYSSEUS C., PANAGOPOULOS T., EXARHOSM.: Contour-shape based reconstruction of fragmented, 1600b.c. wall paintings. IEEE Transactions on Signal Processing 50,6 (Aug 2002), 1277–1288. 2
[PPR∗08] PAPAODYSSEUS C., PANAGOPOULOS M.,ROUSOPOULOS P., GALANOPOULOS G., DOUMAS C.:Geometric templates used in the Akrotiri (Thera) wall-paintings.Antiquity 82, 316 (Jan 2008), 401–408. 2
[Rat68] RATS M. V.: Nonuniformity of Rocks and Their PhysicalProperties [in Russian]. Nauka, 1968. 2, 6
[TFBW∗10] TOLER-FRANKLIN C., BROWN B., WEYRICH T.,FUNKHOUSER T., RUSINKIEWICZ S.: Multi-Feature Matchingof Fresco Fragments. Tech. Rep. TR-874-10, Princeton Univer-sity, Department of Computer Science, 2010. 2
[TS08] TANG C., SHI B.: Influencing factors of geometricalstructure of surface shrinkage cracks in clayey soils. EngineeringGeology 101, 3-4 (October 2008). 2, 6
[Tsy00] TSYGANKOV S.: On preferred dimensions and shapes ofblocks. Journal of Mining Science 36, 1 (2000). 6
[WC06] WILLIS A., COOPER D.: Estimating a-priori unknown3d axially symmetric surfaces from noisy measurements of theirfragments. Proc. 3rd Int. Symp. 3-D Data Processing, Visualiza-tion, and Transmission (Jan 2006), 334–341. 2
[WC08] WILLIS A., COOPER D.: Computational reconstructionof ancient artifacts. Signal Processing Magazine, IEEE 25, 4 (Jun2008), 65–83. 1, 2, 7
c© The Eurographics Association 2010.