analysis on financial results-qiv 201314
TRANSCRIPT
Analysis of Quarterly Results Quarter IV : 2013-14
June 16, 2014
Prepared By: Parag PitliyaInternal Audit Department
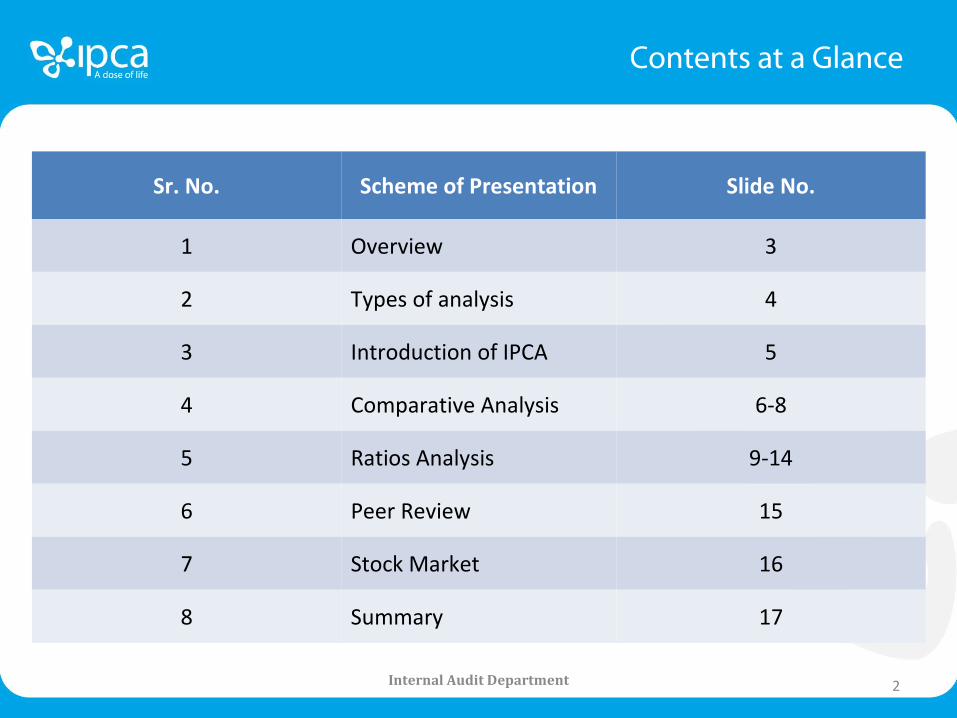
Contents at a Glance
2Internal Audit Department
Sr. No. Scheme of Presentation Slide No.
1 Overview 3
2 Types of analysis 4
3 Introduction of IPCA 5
4 Comparative Analysis 6-8
5 Ratios Analysis 9-14
6 Peer Review 15
7 Stock Market 16
8 Summary 17
Overview
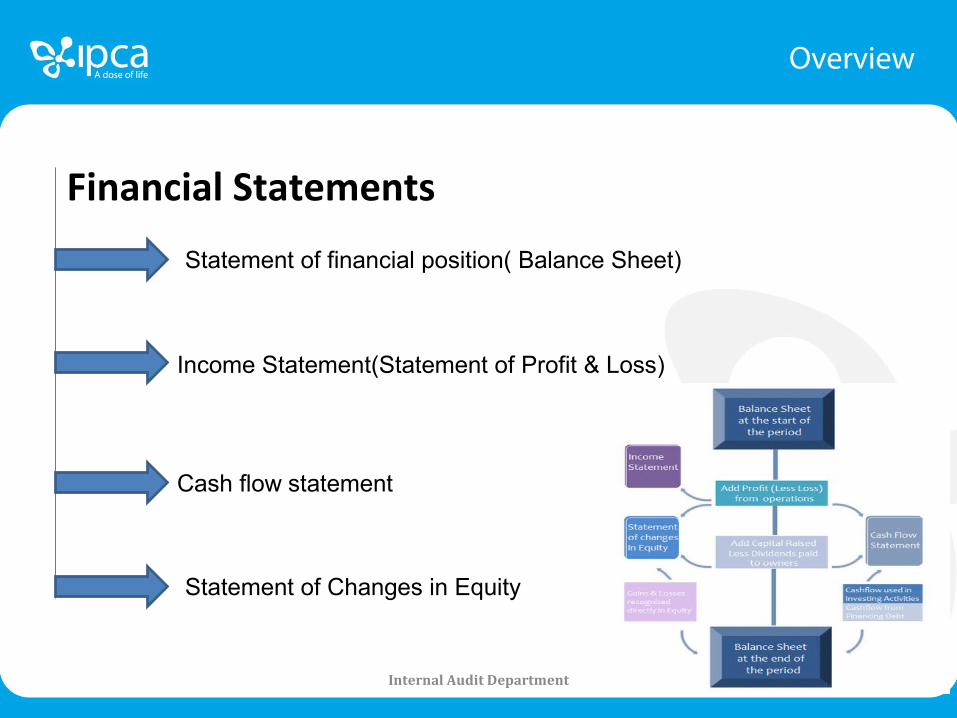
Financial Statements
3Internal Audit Department
Statement of financial position( Balance Sheet)
Income Statement(Statement of Profit & Loss)
Cash flow statement
Statement of Changes in Equity
Types of Analysis
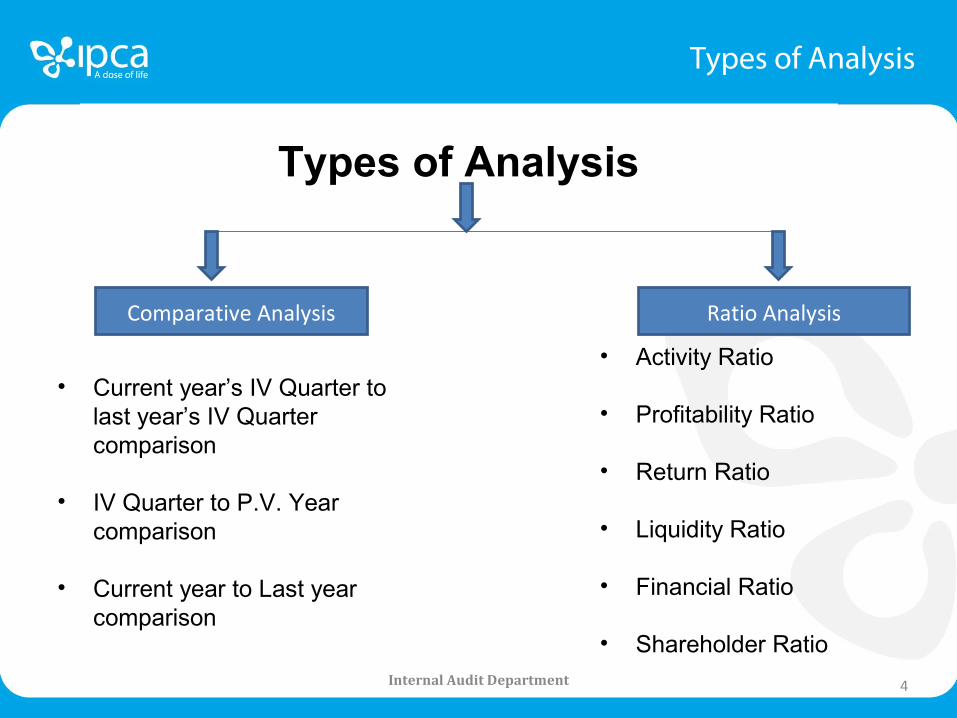
Types of Analysis
4Internal Audit Department
Comparative Analysis Ratio Analysis
• Current year’s IV Quarter to last year’s IV Quarter comparison
• IV Quarter to P.V. Year comparison
• Current year to Last year comparison
• Activity Ratio
• Profitability Ratio
• Return Ratio
• Liquidity Ratio
• Financial Ratio
• Shareholder Ratio
Introduction of IPCA
5Internal Audit Department
Comparative Analysis
6Internal Audit Department
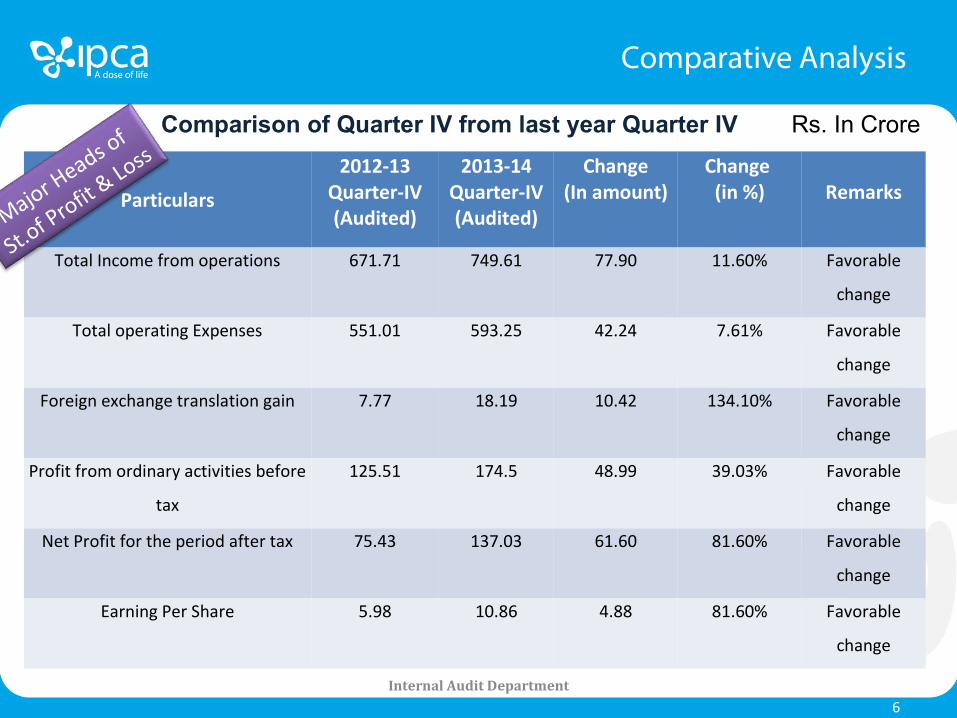
Rs. In CroreComparison of Quarter IV from last year Quarter IV
Particulars
2012-13Quarter-IV(Audited)
2013-14Quarter-IV(Audited)
Change(In amount)
Change (in %) Remarks
Total Income from operations 671.71 749.61 77.90 11.60% Favorable
change
Total operating Expenses 551.01 593.25 42.24 7.61% Favorable
change
Foreign exchange translation gain 7.77 18.19 10.42 134.10% Favorable
change
Profit from ordinary activities before
tax
125.51 174.5 48.99 39.03% Favorable
change
Net Profit for the period after tax 75.43 137.03 61.60 81.60% Favorable
change
Earning Per Share 5.98 10.86 4.88 81.60% Favorable
change
Major Heads o
f
St.of P
rofit & Loss
Comparative Analysis
7Internal Audit Department
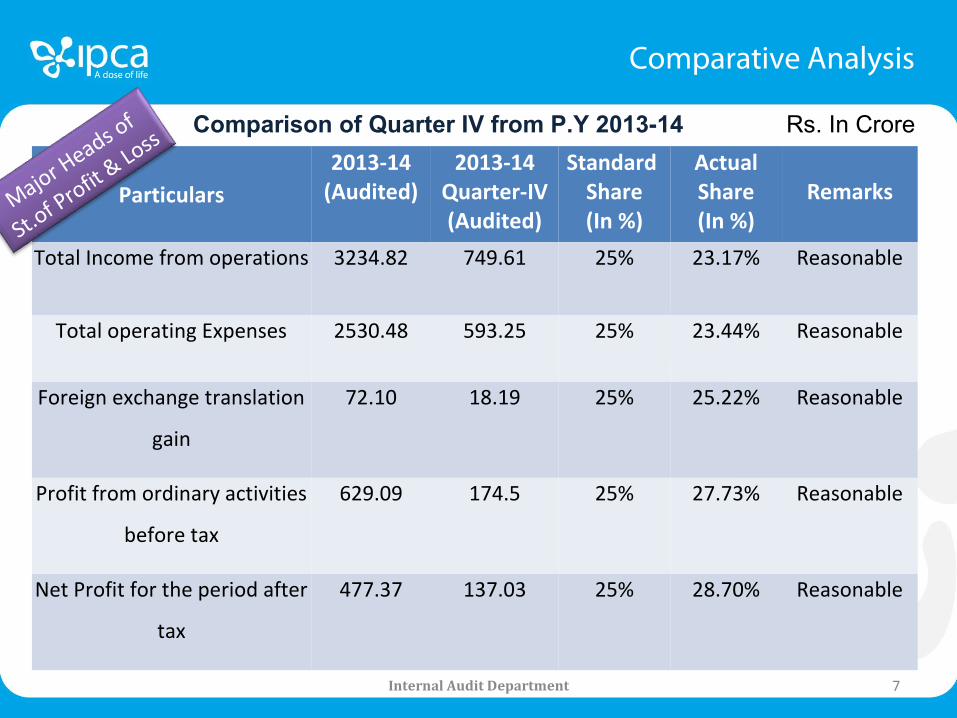
Comparison of Quarter IV from P.Y 2013-14 Rs. In Crore
Particulars2013-14
(Audited)2013-14
Quarter-IV(Audited)
Standard Share(In %)
Actual Share(In %)
Remarks
Total Income from operations 3234.82 749.61 25% 23.17% Reasonable
Total operating Expenses 2530.48 593.25 25% 23.44% Reasonable
Foreign exchange translation
gain
72.10 18.19 25% 25.22% Reasonable
Profit from ordinary activities
before tax
629.09 174.5 25% 27.73% Reasonable
Net Profit for the period after
tax
477.37 137.03 25% 28.70% Reasonable
Major Heads o
f
St.of P
rofit & Loss
Comparative Analysis
8Internal Audit Department
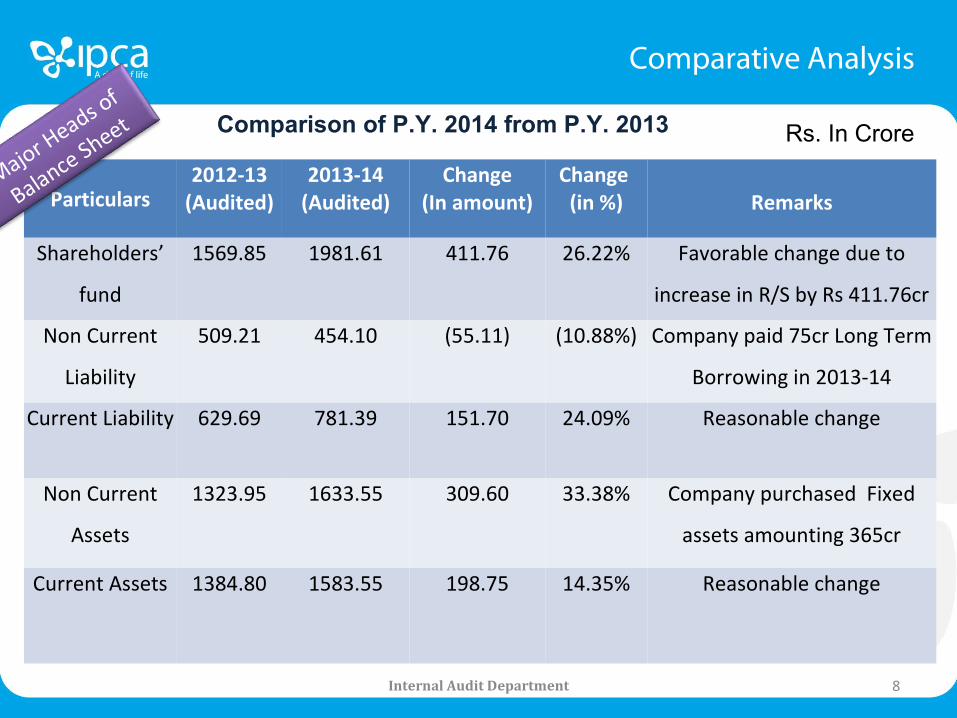
Comparison of P.Y. 2014 from P.Y. 2013 Rs. In Crore
Particulars2012-13
(Audited)2013-14
(Audited)Change
(In amount)Change
(in %) Remarks
Shareholders’
fund
1569.85 1981.61 411.76 26.22% Favorable change due to
increase in R/S by Rs 411.76cr
Non Current
Liability
509.21 454.10 (55.11) (10.88%) Company paid 75cr Long Term
Borrowing in 2013-14
Current Liability 629.69 781.39 151.70 24.09% Reasonable change
Non Current
Assets
1323.95 1633.55 309.60 33.38% Company purchased Fixed
assets amounting 365cr
Current Assets 1384.80 1583.55 198.75 14.35% Reasonable change
Major Heads o
f
Balance Sheet
Internal Audit Department 9
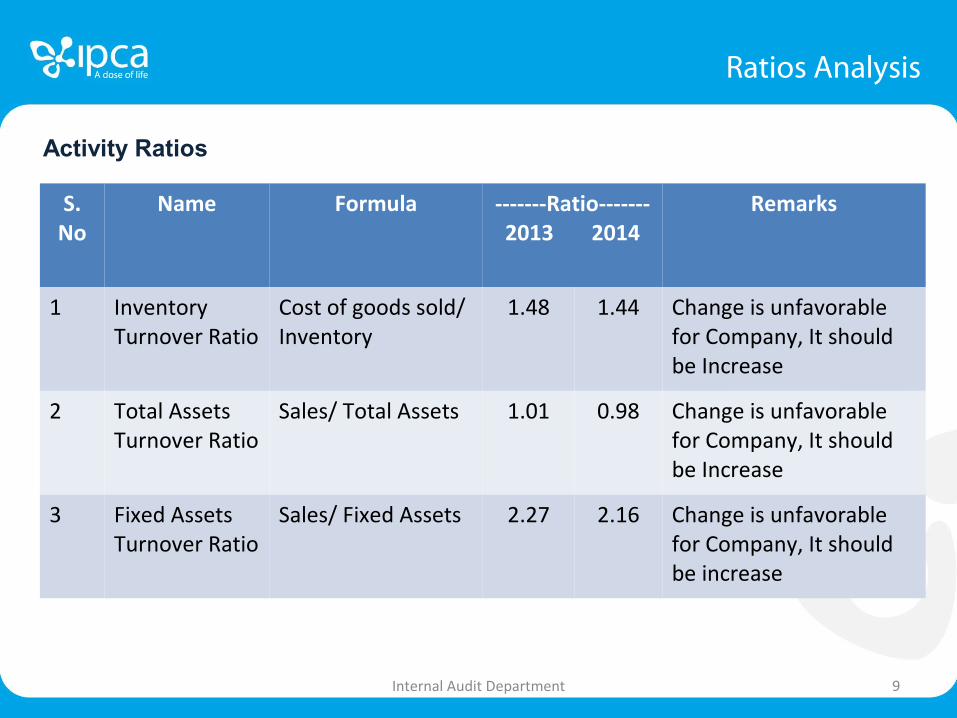
S. No
Name Formula -------Ratio-------2013 2014
Remarks
1 Inventory Turnover Ratio
Cost of goods sold/ Inventory
1.48 1.44 Change is unfavorable for Company, It should be Increase
2 Total Assets Turnover Ratio
Sales/ Total Assets 1.01 0.98 Change is unfavorable for Company, It should be Increase
3 Fixed Assets Turnover Ratio
Sales/ Fixed Assets 2.27 2.16 Change is unfavorable for Company, It should be increase
Activity Ratios
Ratios Analysis

Internal Audit Department 10
S. No
Name Formula -------------Ratio--------- 2013 2014
Remarks
1 Gross Profit Margin
Gross Income/ Sales
0.60 0.65 Favorable :-G.P. Ratio Increased by 8.33% in P.Y. 2013-14
2 Operating Profit Margin
Operating Income/ Sales
0.19 0.21 Favorable change in P.Y. 2013-14
Profitability Ratios
Ratios Analysis
Internal Audit Department 11
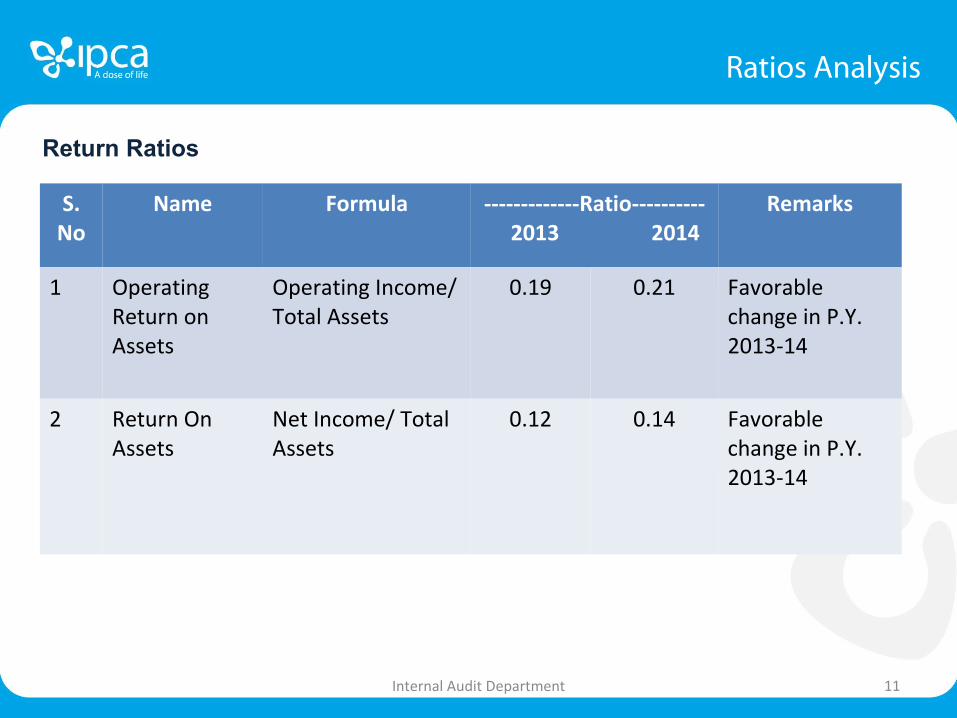
S. No
Name Formula -------------Ratio---------- 2013 2014
Remarks
1 Operating Return on Assets
Operating Income/ Total Assets
0.19 0.21 Favorable change in P.Y. 2013-14
2 Return On Assets
Net Income/ Total Assets
0.12 0.14 Favorable change in P.Y. 2013-14
Return Ratios
Ratios Analysis
12Internal Audit Department
Ratios Analysis
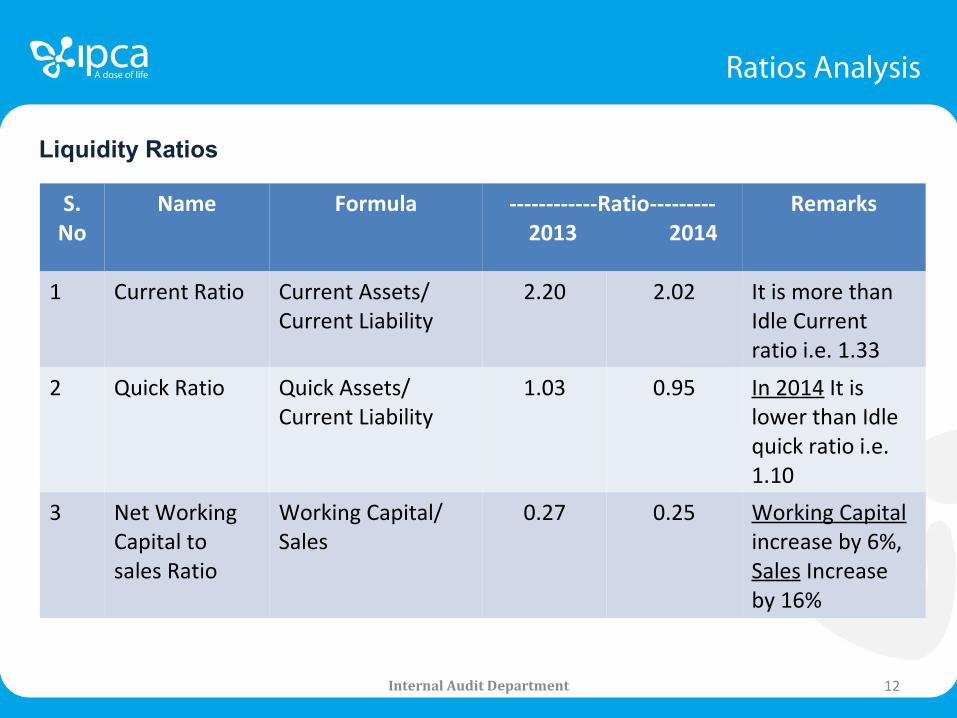
Liquidity Ratios
S. No
Name Formula ------------Ratio--------- 2013 2014
Remarks
1 Current Ratio Current Assets/ Current Liability
2.20 2.02 It is more than Idle Current ratio i.e. 1.33
2 Quick Ratio Quick Assets/ Current Liability
1.03 0.95 In 2014 It is lower than Idle quick ratio i.e. 1.10
3 Net Working Capital to sales Ratio
Working Capital/ Sales
0.27 0.25 Working Capital increase by 6%,Sales Increase by 16%
Internal Audit Department 13
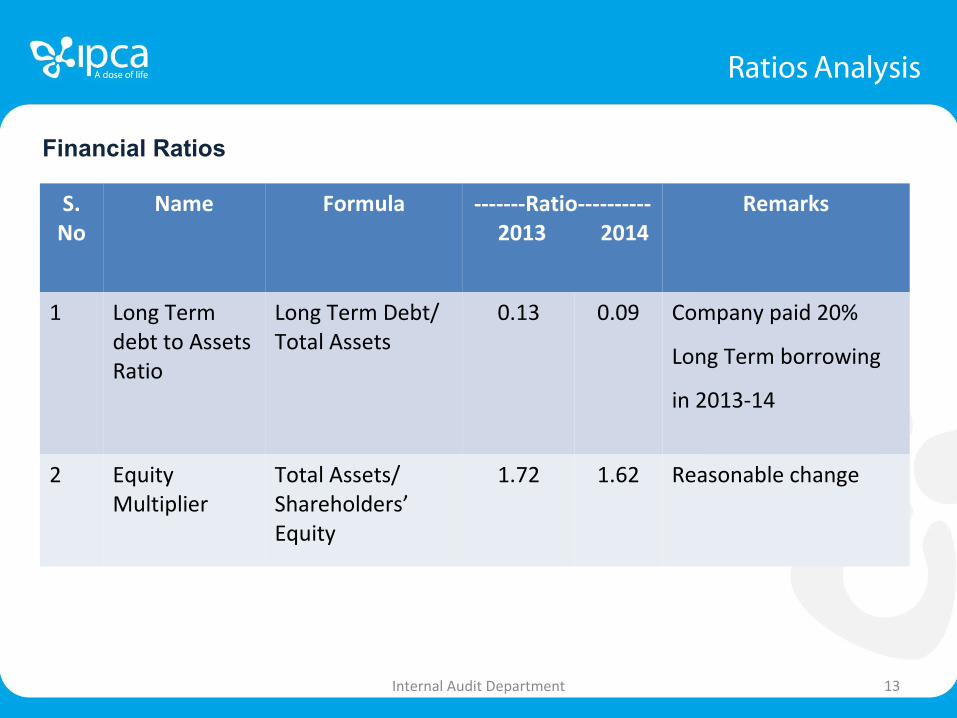
S. No
Name Formula -------Ratio---------- 2013 2014
Remarks
1 Long Term debt to Assets Ratio
Long Term Debt/ Total Assets
0.13 0.09 Company paid 20%
Long Term borrowing
in 2013-14
2 Equity Multiplier
Total Assets/ Shareholders’ Equity
1.72 1.62 Reasonable change
Financial Ratios
Ratios Analysis
Internal Audit Department 14
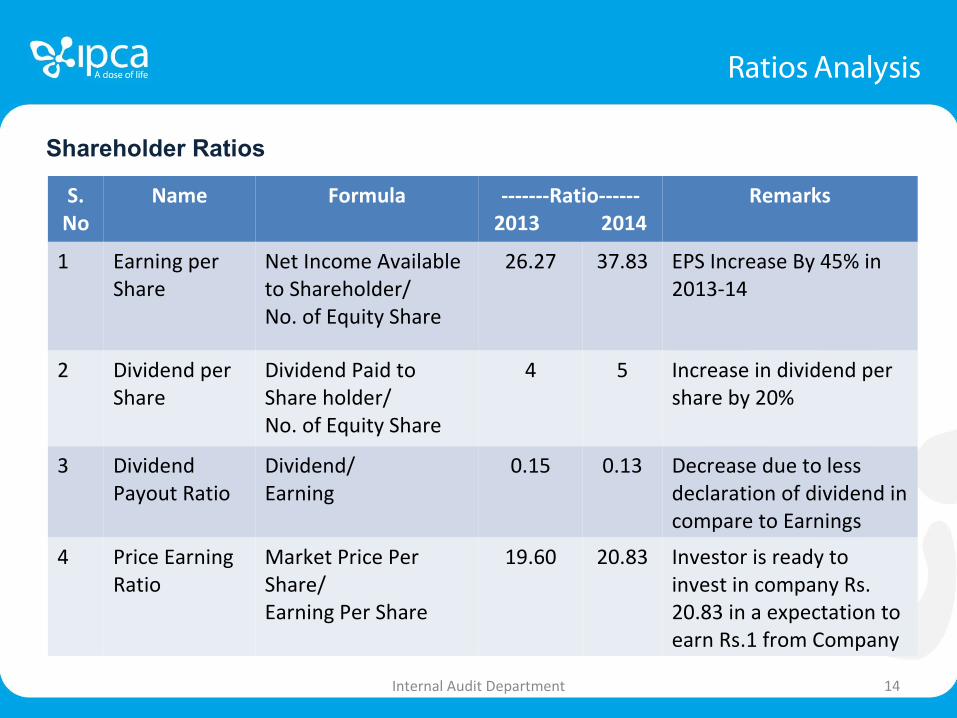
S. No
Name Formula -------Ratio------ 2013 2014
Remarks
1 Earning per Share
Net Income Available to Shareholder/No. of Equity Share
26.27 37.83 EPS Increase By 45% in 2013-14
2 Dividend per Share
Dividend Paid to Share holder/No. of Equity Share
4 5 Increase in dividend per share by 20%
3 Dividend Payout Ratio
Dividend/Earning
0.15 0.13 Decrease due to less declaration of dividend in compare to Earnings
4 Price Earning Ratio
Market Price Per Share/Earning Per Share
19.60 20.83 Investor is ready to invest in company Rs. 20.83 in a expectation to earn Rs.1 from Company
Shareholder Ratios
Ratios Analysis
Peer Review
15Internal Audit Department
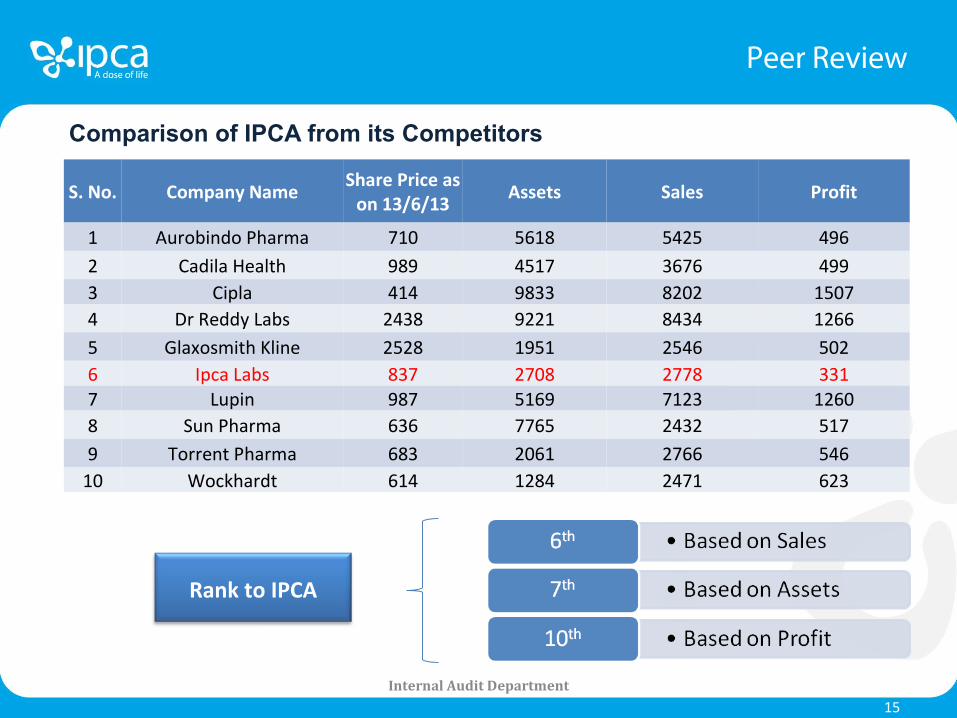
S. No. Company NameShare Price as
on 13/6/13Assets Sales Profit
1 Aurobindo Pharma 710 5618 5425 4962 Cadila Health 989 4517 3676 4993 Cipla 414 9833 8202 15074 Dr Reddy Labs 2438 9221 8434 12665 Glaxosmith Kline 2528 1951 2546 5026 Ipca Labs 837 2708 2778 3317 Lupin 987 5169 7123 12608 Sun Pharma 636 7765 2432 5179 Torrent Pharma 683 2061 2766 546
10 Wockhardt 614 1284 2471 623
Comparison of IPCA from its Competitors
Rank to IPCA
Stock Market
16Internal Audit Department
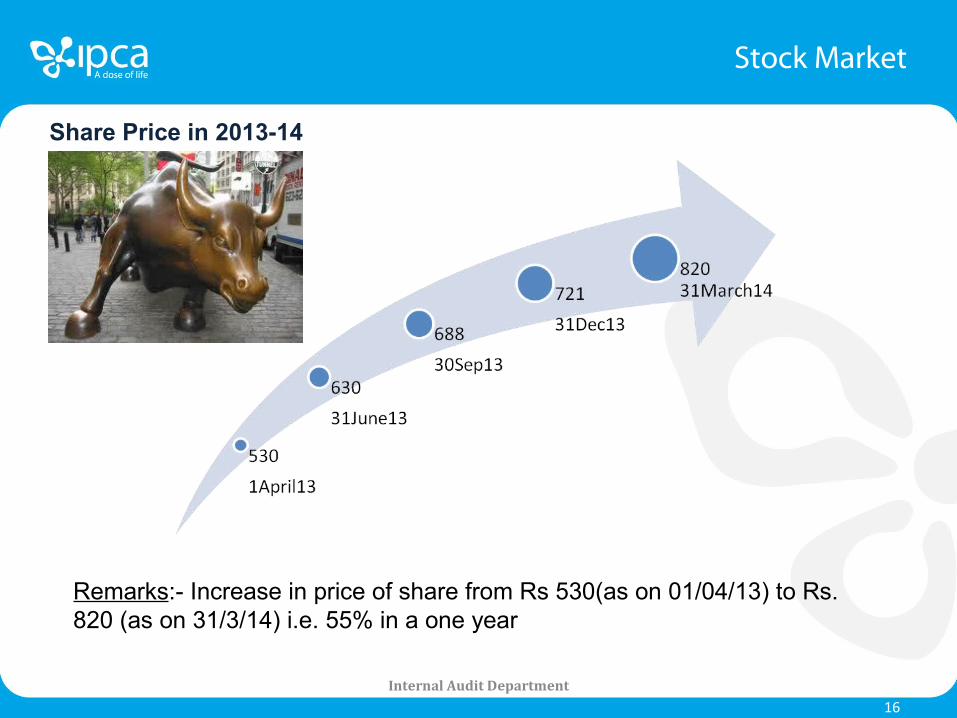
Share Price in 2013-14
Remarks:- Increase in price of share from Rs 530(as on 01/04/13) to Rs. 820 (as on 31/3/14) i.e. 55% in a one year
Internal Audit Department 17
Summary
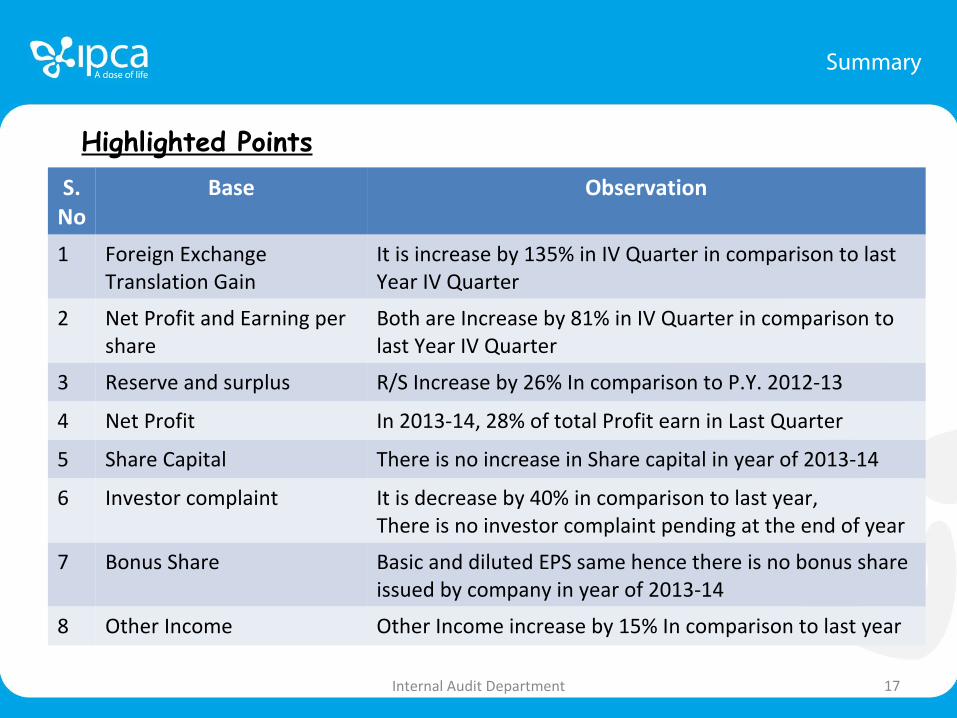
Highlighted PointsS.
NoBase Observation
1 Foreign Exchange Translation Gain
It is increase by 135% in IV Quarter in comparison to last Year IV Quarter
2 Net Profit and Earning per share
Both are Increase by 81% in IV Quarter in comparison to last Year IV Quarter
3 Reserve and surplus R/S Increase by 26% In comparison to P.Y. 2012-13
4 Net Profit In 2013-14, 28% of total Profit earn in Last Quarter
5 Share Capital There is no increase in Share capital in year of 2013-14
6 Investor complaint It is decrease by 40% in comparison to last year,There is no investor complaint pending at the end of year
7 Bonus Share Basic and diluted EPS same hence there is no bonus share issued by company in year of 2013-14
8 Other Income Other Income increase by 15% In comparison to last year
18
Thank You
Internal Audit Department