analysis of pharmacist-provided medication therapy management
TRANSCRIPT

18 Journal of Managed Care Pharmacy JMCP January/February 2009 Vol. 15, No. 1 www.amcp.org
ABSTRACT
BACKGROUND: Although community pharmacists have historically been paid primarily for drug distribution and dispensing services, medication therapy management (MTM) services evolved in the 1990s as a means for pharmacists and other providers to assist physicians and patients in managing clinical, service, and cost outcomes of drug therapy. The Medicare Prescription Drug, Improvement, and Modernization Act of 2003 (MMA 2003) and the subsequent implementation of Medicare Part D in January 2006 for the more than 20 million Medicare beneficiaries enrolled in the Part D benefit formalized MTM services for a subset of high-cost patients. Although Medicare Part D has provided a new oppor-tunity for defining the value of pharmacist-provided MTM services in the health care system, few publications exist which quantify changes in the provision of pharmacist-provided MTM services over time.
OBJECTIVES: To (a) describe the changes over a 7-year period in the primary types of MTM services provided by community pharmacies that have contracted with drug plan sponsors through an MTM administrative services company, and (b) quantify potential MTM-related cost savings based on pharmacists’ self-assessments of the likely effects of their interventions on health care utilization.
METHODS: Medication therapy management claims from a multi-state MTM administrative services company were analyzed over the 7-year period from January 1, 2000, through December 31, 2006. Data extracted from each MTM claim included patient demographics (e.g., age and gender), the drug and type that triggered the intervention (e.g., drug therapeutic class and therapy type as either acute, intermittent, or chronic), and specific information about the service provided (e.g., Reason, Action, Result, and Estimated Cost Avoidance [ECA]). ECA values are derived from average national health care utilization costs, which are applied to pharmacist self-assessment of the “reasonable and foreseeable” outcome of the intervention. ECA values are updated annu-ally for medical care inflation.
RESULTS: From a database of nearly 100,000 MTM claims, a conven-ience sample of 50 plan sponsors was selected. After exclusion of claims with missing or potentially duplicate data, there were 76,148 claims for 23,798 patients from community pharmacy MTM providers in 47 states. Over the 7-year period from January 1, 2000, through December 31, 2006, the mean ([SD] median) pharmacy reimbursement was $8.44 ([$5.19] $7.00) per MTM service, and the mean ([SD] median) ECA was $93.78 ([$1,022.23] $5.00). During the 7-year period, pharmacist-provided MTM interventions changed from primarily education and monitoring for new or changed prescription therapies to prescriber consultations regarding cost-efficacy management (Pearson chi-square P < 0.001). Services also shifted from claims involving acute medications (e.g. penicillin antibiotics, macrolide antibiotics, and narcotic analgesics) to services involving chronic medications (e.g., lipid lowering agents, angiotensin-converting enzyme [ACE] inhibitors, and beta-blockers; P < 0.001), resulting in significant changes in the therapeutic classes associated with MTM claims and an increase in the proportion of older patients served (P < 0.001). These trends resulted in higher pharmacy reimbursements and greater ECA per claim over time (P < 0.001).
CONCLUSION: MTM interventions over a 7-year period evolved from primarily the provision of patient education involving acute medications
Analysis of Pharmacist-Provided Medication Therapy Management (MTM) Services in Community Pharmacies Over 7 Years
Mitchell J. Barnett, PharmD, MS; Jessica Frank, PharmD; Heidi Wehring, PharmD; Brand Newland, PharmD; Shannon VonMuenster, PharmD; Patty Kumbera, BSPharm; Tom Halterman, BSPharm; and Paul J. Perry, PhD
RESEARCH
towards consultation-type services for chronic medications. These changes were associated with increases in reimbursement amounts and pharmacist-estimated cost savings. It is uncertain if this shift in service type is a result of clinical need, documentation requirements, or reimbursement opportunities.
J Manag Care Pharm. 2009;15(1):18-31
Copyright © 2009, Academy of Managed Care Pharmacy. All rights reserved.
• Communitypharmacistshavehistoricallybeenpaidprimarilyfordrugdistributionanddispensingservices.
• Medication Therapy Management (MTM) was officially rec-ognized in the Medicare Prescription Drug, Improvement,and Modernization Act of 2003 (MMA 2003), including theobjectivestoincreasepatientadherence,preventdrugcompli-cations,andenhancepatientunderstandingoftheirmedicationtherapy.
• Todate,pharmacist-providedMTMserviceshavebeenshownto reduce patient out-of-pocket costs through interventionssuchasgenericsubstitutionandtherapeuticinterchange.
What is already known about this subject
• MTM services provided by community pharmacists havechanged significantly over a relatively short period of time.MTM interventions appear to be evolving from the provi-sion of patient education regarding acutemedications towardconsultation-type serviceswith prescribers regarding chronicmedications.
• Thisevolutioninpharmacistintervention-typewasassociatedwithhigherpharmacyreimbursementsforMTMservices.
• Basedonpharmacists’self-assessmentsoftheexpectedeffectsoftheirinterventionsonhealthcareutilization,estimatedcostavoidance attributable to MTM has increased over time andexceedsthepharmacistreimbursementamountfortheperfor-manceoftheseservices.
What this study adds
Medication TherapyManagement (MTM) was officiallyrecognized byCongress in theMedicare PrescriptionDrug, Improvement, andModernization Act of 2003
(MMA2003).1Section423.153(d)ofMMA2003establishedtherequirements thatMedicare PartD plansmustmeet regardingquality and cost control, including the requirements forMTM

www.amcp.org Vol. 15, No. 1 January/February 2009 JMCP Journal of Managed Care Pharmacy 19
Analysis of Pharmacist-Provided Medication Therapy Management (MTM) Services in Community Pharmacies Over 7 Years
Programs“designed”to“optimizetherapeuticoutcomesthroughimprovedmedicationuse”and“reducetheriskofadverseevents,includingadversedrugreactions.”2TheCentersforMedicareandMedicaidServices (CMS)requireeachMedicarePartDplan toestablishanMTMprogramfortargetedbeneficiariesaspartofitsbenefit.3CMSclassifiestargetedbeneficiariesasPartDenrolleeswhohavemultiplechronicdiseasestates(numberandtypedeter-minedbytheplansponsor),aretakingmultiplePartDcovereddrugs(numberdeterminedbytheplansponsor),andarelikelyto incur annual costs of at least $4,000 for all PartD-covereddrugs(2006predeterminedlevelspecifiedbytheSecretary).2PartDplansarerequiredtoofferanMTMbenefittothoseenrolleeswhomeetthesecriteriabutmayalsoextendthebenefittoallplanenrollees.PlanscanchoosetooffertheMTMbenefitasanopt-inoropt-outbenefit.
Requirements of anMTMprogramasoutlinedbyCMSaresomewhat ambiguous; however, CMS does require that pro-gramsbedesignedto increasepatientadherence tomedicationregimens, enhance patient understanding of their medicationtherapy, and prevent drug complications, conflicts, and druginteractions. Although several professional pharmacy associa-tionshaveattemptedtointerpretCMSguidanceanddefinespe-cific requirementsofMTM for thepharmacyprofession,MTMservicesprovidedtoMedicarebeneficiariescontinuetovaryfromsponsortosponsor.4-8
Communitypharmacistshavehistoricallybeenpaidprimar-ily for drug distribution and dispensing services provided topatients.Byyear-end2008,mostpharmacistshaveheardofMTMandmanyhavebegunprovidingMTMservicesintheirpracticesetting.SomepharmacistshavebeenprovidingMTM-likepro-fessional services for years by participating in programs suchas Project Improve Persistence and Compliance with Therapy(ImPACT),theAshevilleProject,orotheremployer-orcommer-ciallysponsoredprograms.9-10However, theadventofMedicarePartDprovidespharmacistswithalargeropportunitytoperformprofessional services and receive compensation for theirmedi-cation expertise.Medicare PartD also creates a relatively newopportunity to better define the value of pharmacist-providedMTMservicestothehealthcaresystem,althoughassessmentofthevalueof suchpharmacist-providedMTMservices is still initsinfancy.11
OutcomesPharmaceuticalHealthCareisapharmacist-ownedand pharmacist-operated MTM administrative services com-pany that began operation in 1999 to advance the delivery offace-to-face pharmacist-provided MTM services in communitypharmacies.Feesarecollectedby theMTMadministrative ser-vicescompanyfromhealthplansorotherbenefitproviders,andpharmaciesareinturnreimbursedbytheadministrativeservicescompanyforMTMservicesprovidedtoeligibleenrollees.
Since1999, thisMTMadministrative services companyhasbuilt a comprehensive system enabling pharmacist-providedMTM services, which includes: a national pharmacy network,
pharmacist trainingmodules,an Internet-baseddocumentationand billing system, quality assurance procedures, claim pay-mentprocessing,anddatareporting.ThisMTMadministrativeservicescompanyhasadministeredprogramsonbehalfofself-insuredemployers,unionhealthplans,astateMedicaidprogram,pharmaceuticalmanufacturers(e.g.,complianceandpersistenceprogramsorcommunity-basedresearchprojects),MedicarePartD plan sponsors (including both Prescription Drug Plans andMedicareAdvantagePlans)andothers.
AnearlyinnovationforthisMTMadministrativeservicescom-panywasthedevelopmentandimplementationofaproprietaryInternet-baseddocumentationandbillingsystemin2000,allow-ingthecaptureofclaiminformationsubmittedbyparticipatingpharmacies.12TheinformationcollectedduringtheprovisionofMTMservicesover7yearsthrough2006representsperhapsthemostextensiveMTMdatabaseavailable.Further,thedatabaseisparticularly suited to quantify changes in pharmacist-providedMTMservicesovertimebecauseitincludesdetailedinformationabout each intervention, patient-level demographics, and esti-matesofcostsavingsassociatedwithpharmacistinterventions.
AnalysesofaconveniencesubsampleofMTMplansponsorsinthedatabaseofthisMTMadministrativeservicecompanyovera7-yeartimeframearepresentedhereforthefirsttime.Specificobjectives of this study were to (a) identify trends associatedwith the provision ofMTM services provided by pharmacists,and (b) quantify potential MTM-related cost savings derivedfrompharmacists’ self-assessmentsof the likely impactof theirinterventions on health care utilization. Consent (P#0108) forthis study was approved by the Touro University InstitutionalReviewBoard.
■■ MethodsDatabase and PatientsTheMTMadministrativeservicecompany’sdatabaseiscomprisedofMTMservicescollectedfrompharmacy-submittedclaimsforpharmacist-provided interventions. MTM program sponsorsidentifypatientseligibleforMTMservicesandprovidetheMTMadministrative services companywith prescription claims dataforeacheligiblemember.TheprescriptionclaimsdataarethenusedtoreferpatientstoprimarydispensingpharmaciesthroughtheInternet-baseddocumentationandbillingsystem.Thephar-macist identifies when a patient needs anMTM service (“pullreferral”)inadditiontoactingontargetedinterventionssentbytheMTMadministrative servicescompany (“push referral”) forspecific patients. Payments to pharmacies are processedwhenclaims are submitted through the proprietary Internet-basedMTMdocumentationsystem.TheInternet-basedsystemcapturesinformationgatheredduringthepharmacistdocumentationpro-cess and includesdetailed information about each interventionprovided.Data are stored by client (plan sponsor) and can bequeriedthroughanInternetinterface.PharmaciesbecomeMTMproviders in the network of thisMTM administrative services

20 Journal of Managed Care Pharmacy JMCP January/February 2009 Vol. 15, No. 1 www.amcp.org
Analysis of Pharmacist-Provided Medication Therapy Management (MTM) Services in Community Pharmacies Over 7 Years
companybycompletinganetworkparticipationagreement,andeachpharmacist that providesMTM services at the participat-ing pharmacymust complete a “Personal Pharmacist” trainingprogram.ThetrainingprogramincludesthedetailsofbillinganddocumentationforMTMservices,suchasselectionofthemostreasonableandforeseeableestimatedcostavoidance(ECA)levelforeach interventionprovided(e.g., routineeducation/monitor-ingnotexpectedtoresultincostsavingsvs.avoidanceofinpa-tienthospitalization).The7-year timeperiodof this studywasJanuary1,2000,throughDecember31,2006.
The network of pharmacies for this MTM administrativeservices company includes adiversemixof independent, fran-chise,chain,health-system,andconsultantpharmacyproviders,locatedin47statesduringthetimeperiodofthisstudy.EligiblepatientsforMTMservicesprovidedbycommunitypharmacistsaremembersofbenefitplansthathavecontractedwiththeMTMadministrativeservicescompany.SomeMTMsponsorschoosetooffertheMTMbenefittoasubsetofenrollees(e.g.,highprescrip-tionutilizers,targeteddiseasestates),whileotherschoosetoofferthebenefittoallenrollees.Benefitplansorinsuranceprovidershire the MTM administrative services company to serve as abusinesspartnerintheadministrationofMTMservices,includ-ingqualitycontrol.TheMTMadministrativeservicescompanyfunctionsasastand-aloneentity,enablingpharmacistsaccesstoagroupofenrolleeseligibleforMTMservicesaswellasprovidinganefficientmechanismwithwhichtobillandreceivepaymentfortheseservices.ProgramfeescollectedbytheMTMadminis-trativeservicescompanyfromMTMsponsorsaretypicallycapi-tatedfees(i.e.,permemberpermonth)andareusedtoreimbursepharmaciesforMTMservicesprovidedtobenefitenrolleesandtocoverprogramadministrativecosts.
Outcome ClaimsThedocumentationofanMTMclaimisa5-stepprocess.Inthefirst 3 steps of claim documentation, the pharmacist selects aReason,Action,andResult.TheReasoncanbethoughtofasthe“IndicationforService,”theActionthe“ProfessionalService”pro-vided,andtheResultthe“OutcomeofService”oftheinterven-tion.13To facilitate thedocumentationprocess,Reason,Action,andResultfieldsarelinkedinasequentialmanner,wherebytheselectionofaReasongovernspossiblechoicesforAction,andtheselectionofanActiongovernspossiblechoicesforResult.
ThefourthstepintheMTMdocumentationprocessinvolvesthe pharmacist choosing the most reasonable and foreseeableECAlevel,aseverityratingoftheMTMserviceprovided.ECAisderivedfromaveragenationalhealthcareutilizationcostsusingapreviouslydevelopedmethodology.14-15Thepharmacist-derivedassessmentsof “reasonableand foreseeable”outcomes fromtheintervention are linked to actual ECAdollar values (e.g., $307peravoidedphysicianvisit,$605peravoidedemergency roomvisit,and$17,706peravoidedhospitaladmissionin2006).ECAvaluesareupdatedannuallytoreflectinflation.Inthefinalstepof
thedocumentationprocess,pharmacistsarerequiredtoprovidedetailednotespertainingtotheinterventionandsubstantiatetherationalefortheECAlevelselected.Therequirednotesareinputasfreetext.
AproprietaryMTMclaimworksheet, similar to aphysiciansuperbill,ismadeavailableforpharmaciststouseatthepointofservice (Appendix). Pharmacist worksheet information is usedtogenerateMTMclaiminformationwhichissubmittedviatheonlinedocumentationandbillingsystem.ThisInternet-mediatedinterfaceisformattedtobesimilartotheMTMclaimworksheetto facilitate real timecaptureof information.Thedata fields intheMTMclaimdocumentationarelistedinTable1.ProfessionalservicefeesfortheMTMservicesprovidedaretiedtotheReason-Action-ResultfieldsselectedontheclaimworksheetanddefinedbythefeescheduleoftheMTMadministrativeservicescompany.Because the Reason, Action, and Result fields are linked, asdescribedabove,thechoiceofReason(IndicationforService)ineffectdeterminestheMTMfeeassociatedwiththeintervention.MTMfeesare$0and$2 forclaimswithaResult (OutcomeofService)ofPatientorPrescriberRefusal,respectively.
Toensureahighlevelofqualityandprovideafeedbackmech-anism,anoutsidecompanyverifies the integrityofeachclaim.Thequalityassuranceteamcomprisesclinicalpharmacists,andeach claim is reviewedbefore reimbursement to thepharmacyisprocessed.ThequalityassuranceprocessincludesverificationthatMTMclaimdocumentationisinaccordancewiththeMTMadministrative services company’s policies andprocedures andthattheECAlevelselectedisreasonableandforeseeable.ClaimslackingsufficientdocumentationoftheMTMserviceprovided,aswellasthosewithaninappropriateECAlevel(e.g.,ECALevel6[avoidanceofahospitaladmission]isinappropriatelyselectedfor a cost efficacymanagement [therapeutic substitution] inter-vention) are returned to thepharmacist for further reviewandresubmissionorrejection.Claimsrejectedforinsufficientdocu-mentationorinappropriateorunverifiableECAlevelrepresentasmallpercentage(<3.0%)oftotalclaimsandwerenotincludedinthisanalysis.
Data Elements Data extracted from each claim included patient demographicinformation (e.g., age and gender), specific information aboutthemedication triggering the intervention(e.g.,dateofservice,therapeutic class, and therapy type specified as acute, chronicor intermediate/other), and specific information about the ser-viceprovided(e.g.,Reason,Action,Result,ECAandassociatedECAdollar amount).Acute therapy includedmedicationsusedfora limited timeperiod (e.g., antibioticandone-timenarcoticanalgesic prescriptions), chronic therapy included medicationsprescribed for chronicconditions (e.g., lipid-loweringandanti-hypertensive medications), and intermediate/other medicationsincludedprimarilyseasonalallergytreatments.Inaddition,phar-macypaymentinformationwasextracted.

www.amcp.org Vol. 15, No. 1 January/February 2009 JMCP Journal of Managed Care Pharmacy 21
Analysis of Pharmacist-Provided Medication Therapy Management (MTM) Services in Community Pharmacies Over 7 Years
TABLE 1 Documentation of Interventions and Description of Levels of Estimated Cost Avoidance (ECA)a
1. Indication for MTM Service (REASON) Description/Examples
1.1Complexdrugtherapy Typicallyappliestothepresentationofapatienttakingmultiplemedications(e.g.,apatienttaking4ormorechronicmedications).Afewplansponsorshaveslightlydifferentthresholds(e.g.,6ormorechronicmedications).
1.2Cost-efficacymanagement Anorderforadrugproductwhereamorecost-effectivetherapeuticalternativeisavailable(e.g.,apatientisprescribedatier-3medicationwhenatier-1medicationisavailableandappropriatefortheindication).
1.3Neworchangedtherapy Anordertoinitiatenewprescriptiontherapyorchangeanexistingprescriptiontherapy(e.g.,patientpresentswithanewprescriptionforanantibiotic).
1.4OTCtherapy PatientwithanuntreatedindicationforOTCtherapy(e.g.,malepatientwithanenlargedprostateseekspharmacist’sadviceonavoidingcoldmedicationcontaininganantihistamine).
Drug Therapy Problems Detected
1.5 Drug Therapy Indication1.5a.Needstherapy Patientwithanuntreatedindicationforprescriptiontherapy(e.g.,apatientispost-myocardialinfarctionand
hasnotbeenprescribedabeta-blocker).
1.5b.Unnecessarytherapy Anordertoinitiateorcontinuedrugtherapythatisnotindicated(e.g.,patientcontinuedonhistamine-2blockerorproton-pumpinhibitortherapyafterresolutionofanacutegastrointestinalepisode).
1.6 Drug Therapy Efficacy1.6a.Suboptimaldrugselection Anordertoinitiateorcontinueadrugtherapywithsuboptimalefficacy(e.g.,patientwithsystolicheartfailure
receivesanewprescriptionforpropranololorotherbeta-blockernotshowntodecreasemortality).
1.6b.Insufficientdoseorduration Anordertoinitiateorcontinuedrugtherapyatadoseordurationinsufficienttobeeffective(e.g.,apatientpresentswithuncontrolledbloodsugarandisnotonoptimaldoseofantidiabeticmedication).
1.7 Drug Therapy Safety1.7a.Adversedrugreaction Adrugorderwithanadversereactionrisksignificantenoughtorenderthetherapyunsafe,includingside
effectsandallergicoridiosyncraticreactions(e.g.,patientisonstatintherapyandreportslegpain).
1.7b.Druginteraction Adrugorderwithadruginteractionrisksignificantenoughtorenderthetherapyunsafe(e.g.,patientisprescribedsildenafilandanitratebydifferentprescribers).
1.7c.Excessivedoseorduration Anordertoinitiateorcontinuedrugtherapyatadoseordurationtooexcessivetobesafe(e.g.antibioticfora6year-oldpatientprescribedatanadultdosage).
1.8 Drug Therapy Compliance1.8a.Overuse Patienthasdemonstratedoveruseofadrugproductandasaresultisnoncompliant(e.g.,30-daysupplyof
medicationlasts15days).
1.8b.Underuse Patienthasdemonstratedunderuseofadrugproductandasaresultisnoncompliant.(e.g.,patient’sasthmaisnotcontrolledduetounderuseoflong-actinginhalerandoveruseofshort-actinginhaler).
1.8c.Administrationtechnique Apatientwhohasdemonstratedinappropriateadministration/techniqueofadrugproductandasaresultisnon-compliant(e.g.inappropriateinhalertechnique).
1.9Other Apatientorphysicianinterventionthatresultsinasignificanthealthcarecostorqualityimprovementthatdoesnotcorrespondwithotheravailablebillingcodes.
2. Professional Service (ACTION)2.1.CMR Comprehensivereviewofapatient’sdrugprofiletoidentifyanycost-efficacyissuesordrugtherapyproblems.
2.2Prescriberconsultation Consultingaprescribertorecommendadrugorderchangeduetoeitheracost-efficacyissueordrugtherapyproblem.
2.3Patientconsultation Consultingapatienttoaddressacost-efficacyissueorcompliance-relateddrugtherapyproblem.
2.4Patienteducationand monitoring
Patienteducationandmonitoringofadrugtherapy.Minimumpatienteducationincludesinformationrelatedtothenameofthedrug,therapeuticclass,directionsforuse,sideeffects,warnings,storagerequirements,misseddoseactions,andappropriatewrittenmaterial.Minimumpatientmonitoringincludescollectinginformationaboutchangeinpatient-reportablesymptoms,sideeffects,compliance,andadditionalpatientquestions.
2.5Patientcomplianceconsultation Consultingapatienttoaddressmedicationoveruse,underuse,orinappropriateadministrationtechnique.Pharmacistshouldprovidefollow-upmonitoringtoassessifcompliancehasbeenaltered.
2.6Other Professionalserviceprovidednotcoveredinabove(e.g.,patient-specificspecialproject).
3. Outcome of Service (RESULT)3.1CMRwithdrugtherapyproblem(s) CompletionofaCMRthatresultsinanadditionalinterventionbeingconductedduetotheidentificationofa
cost-efficacyissueoradrugtherapyproblem.
3.2CMRwithoutdrugtherapyproblem(s) CompletionofaCMRthatdoesnotresultinanadditionalintervention.
3.3Initiationofacost-effective drug
Prescriberapprovalofamorecost-effectivedrugfollowingapharmacistrecommendationtochangeadrugorderduetoacost-efficacyissue.
3.4Therapeuticsuccess Amonitoringsituationinwhichthepharmacisthasdeterminedthatapatient’scondition(s)areresolvedorstabilizedasaresultofdrugtherapy.

22 Journal of Managed Care Pharmacy JMCP January/February 2009 Vol. 15, No. 1 www.amcp.org
Analysis of Pharmacist-Provided Medication Therapy Management (MTM) Services in Community Pharmacies Over 7 Years
Study Sample Aconvenience sampleof 50MTMprograms covering a7-yeartimeperiodfromJanuary1,2000,throughDecember31,2006wasselectedforanalysis.The50programsrepresentedapproxi-mately90%ofthedrugplansponsorsoftheMTMadministra-
tiveservicescompany.Somedatawerenotavailableforanalysisbecause of confidentiality agreements with some drug plansponsors and a few drug plan sponsors that did not use theInternet-basedsystem.Inaddition,severalindividualizeddiseasemanagementprogramsusing the Internet-based systemduring
3.5Therapeuticfailure Monitoringsituationinwhichthepharmacisthasdeterminedthatapatient’scondition(s)areunresolved,unstable,orworsenedasaresultofdrugtherapy.
Drug Therapy Problems Resolved
3.6 Drug Therapy Indication3.6aInitiatednewtherapy Prescriberapprovalofapharmacistrecommendationtoinitiateadrugorderforanuntreatedindication.
3.6bDiscontinuedtherapy Prescriberapprovalofapharmacistrecommendationtodiscontinueadrugorderthatisnotindicated.
3.7 Drug Therapy Efficacy3.7aChangeddrug Prescriberapprovalofapharmacistrecommendationtochangeadrugorderthathassuboptimalefficacy.
3.7bIncreaseddose/duration Prescriberapprovalofapharmacistrecommendationtochangeadrugorderthathasadoseordurationinsufficienttobeeffective.
3.8 Drug Therapy Safety3.8aAlteredregimen/changeddrug Prescriberapprovalofapharmacistrecommendationtochangeadrugorderwithanadversereactionordrug
interactionrisksignificantenoughtorenderthetherapyunsafe.
3.8bDecreaseddose/duration Prescriberapprovalofapharmacistrecommendationtochangeadrugorderthathasadoseordurationtooexcessivetobesafe.
3.9 Drug Therapy Compliance3.9aAlteredcompliance Alteringapatient’sbehaviortobecomecompliantwithadrugtherapythatheorshehadpreviouslybeen
overusingorunderusing(e.g.,patient’sreceiptofrefilliswithinanappropriateinterval,suchas±20%ofthedayssupplydispensed).
3.9bAlteredadministration/technique Alteringapatient’sbehaviortobecomecompliantwithadrugtherapythathadpreviouslybeenadministeredwithinappropriatetechnique.
3.10Patientrefusal Patientrefusalto(a)participateinaCMR,(b)receivePatientEducation/Monitoring,(c)permitaphysicianconsultationoncost-efficacyissues,or(d)altercompliance-relatedbehavior.
3.11Prescriberrefusal Prescriberrefusalofapharmacistrecommendationtochangeadrugorderassociatedwithacost-efficacyissueoradrugtherapyproblem.
3.12Other Patientorphysicianinterventionthatresultsinsignificanthealthcarecostorqualityimprovementthatdoesnotcorrespondwithotheravailablebillingcodes.
4. ECA Levelsa
ForeachMTMclaim,thepharmacistmustselectthemostreasonableandforeseeableECAfrom1ofthe8availablelevelsbelow.
4.1Level1–Improvedquality of care
Completedpatienteducation/monitoringwhethertherapeuticsuccessorfailure,allCMRs,andallotherinterventionsthatdonotresultinanyreasonableandforeseeablecostavoidance.
4.2Level2–Reduceddrug productcost
Cost-efficacymanagementincombinationwithprescriberconsultationsthatresultinchangesinprescribed therapy.
4.3Level3–Avoidedphysician visit
Drugtherapyproblemidentifiedandresolvedbythepharmacistforwhichitisreasonableandforeseeablethatthepatientwouldhavevisitedaphysicianifnotaddressedbythepharmacist.
4.4Level4–Avoidednewprescriptionorder
Drugtherapyproblemidentifiedandresolvedbythepharmacistforwhichitisreasonableandforeseeablethatthepatientwouldhaveobtainedanewprescriptionorderifnotaddressedbythepharmacist.
4.5Level5–Avoidedemergencyroomvisit DrugtherapyproblemidentifiedandresolvedbythepharmacistforwhichitisreasonableandforeseeablethatthepatientwouldhaveneededtovisittheERifnotaddressedbythepharmacist.
4.6Level6–Avoidedhospitaladmission Drugtherapyproblemidentifiedandresolvedbythepharmacistforwhichitisreasonableandforeseeablethatthepatientwouldhavebeenadmittedtothehospitalifnotaddressedbythepharmacist.
4.7Level7–Avoidedlife-threateningevent Drugtherapyproblemidentifiedandresolvedbythepharmacistforwhichitisreasonableandforeseeablethatthepatientwouldhavefacedalife-threateningsituationifnotaddressedbythepharmacist.
4.8Prescriberorpatientrefusalofrecommendation
Prescriberrefusesdrugtherapyproblemrecommendationorpatientrefusescomprehensivemedicationreview,education/monitoring,medicationchange,orcompliancerecommendation.
a For each MTM claim, the pharmacist must document an ECA level, a severity rating assigned to the MTM service among 8 ECA levels. “Reasonable and foreseeable” is the self-reported test for avoidance of an outcome associated with a problem identified and resolved by the pharmacist.CMR = comprehensive medication review; ECA = estimated cost avoidance; ER = emergency room; MTM = medication therapy management; OTC = over-the-counter.
TABLE 1 Documentation of Interventions and Description of Levels of Estimated Cost Avoidance (ECA)a (continued from previous page)

www.amcp.org Vol. 15, No. 1 January/February 2009 JMCP Journal of Managed Care Pharmacy 23
thestudytimeframewereexcludedfromthisanalysis.Over82,000claimsfor25,143uniquebeneficiariesfromthe50
drugplansponsorswereoriginallyeligibleforanalysis.Beforeanal-ysis,1,874claimswithmissingdrugorincompletepatient(ageandgender) informationwere excluded. In addition, claims from thesamepharmacywiththesamedruganddateofserviceforthesamebeneficiary(n=3,303)alsowereexcludedbecauseitwasthoughtthat thesemost likely representedduplicate claims.Theseexclu-sionsleftafinalanalyticalcohortof76,148claimsfrom50groupsadministeredbytheMTMadministrativeservicescompany.Theseclaims representMTM interventionsperformedby1,158uniquepharmacistsat1,054uniquepharmaciesfor23,798patients.
Analytic StrategyAnalyseswereperformedonthesampleof76,148MTMclaims.DistributionsoftheReasons,Actions,Results,andECAforphar-macist-generatedMTMinterventionswerecalculated,alongwithmeasures of central tendency and dispersion (mean, median,andSD)forpharmacyreimbursementperclaimandECAdollaramount.Descriptorsoftheuniquepatientscomprisingthestudycohortalsoweregenerated.TrendsoccurringinMTMinterven-tions over time were explored by comparing claims in years2000,2002,2004,and2006.Theseyearsrepresenttimeperiodsatthebeginning,end,and2midpointsinthestudytimeframe.DifferencesweretestedforsignificanceusingPearsonchi-squaretestsforcategoricalvariablesandAnalysisofVariance(ANOVA)forcontinuousvariables.AllanalyseswereconductedusingSASforWindows,Version9.1(SASInstitute,Cary,NC).
0%10%20%30%40%50%60%70%80%90%
100%
IntermediateChronicAcute
2006200420022000
FIGURE 1 MTM Claims Over 7 Years by Drug Therapy Type
Acute is defined as one-time use medications such as penicillin antibiotics, mac-rolide antibiotics, and one-time narcotic analgesics. Chronic is defined as medica-tions prescribed for chronic conditions such as lipid-lowering agents, angiotensin converting enzyme (ACE) inhibitors, and beta-blockers. Examples of intermediate/other category include medications for seasonal allergy.MTM = medication therapy management.
Analysis of Pharmacist-Provided Medication Therapy Management (MTM) Services in Community Pharmacies Over 7 Years
■■ ResultsDataanalysesforaselectedsubsampleofMTMclaimsfrom2000through2006showed76,148sampledpharmacistinterventions.The average age of a patient receivingMTM services over the7-yearstudyperiodwas44years,and39%weremale(Table2).Themean ([SD]median)MTM interventions over the 7 yearswere3.2([3.5]2.0)perpatient.Halfof theMTMinterventions(49.9%)were related tomedication therapy classified as acute,while 37.9%were related to therapy classified as chronic, and12.2% of the interventions involved “intermediate” or “other”medications.Themostcommondrugcategorieswereantimicro-bial (e.g., penicillins,macrolides), cardiovascular (e.g., statin orother lipid-lowering),andcentralnervoussystem(e.g.,narcoticanalgesic)agents.ThemostcommonReasonforMTMinterven-tionwasnew/changedtherapy(85.6%);themostcommonActionwas patient education/monitoring (86.7%); and themost com-monResultwastherapeuticsuccess(70.2%;self-determinedby thepharmacist).ThemostcommonECAlevelselectedwasLevel1—ImprovedQualityofCare(78.8%).Interventionsresultedinamean([SD]median)$8.44([$5.19]$7.00)inreimbursementperinterventiontothepharmacy,withanECAof$93.78([$1,022]$5.00)perclaim.
ThecharacteristicsofthepatientswhoreceivedMTMserviceschangedfrom2000to2006,includinganincreaseintheaverageagefrom30.4yearsto57.6years(P <0.001)andadecreaseinthepercentage ofmales, from39.6% to 35.4% (P <0.001;Table 3).However,nosignificantdifferencesinthemeannumberofMTMinterventions receivedperpatientper year from2000 to2006(from2.0 to1.8,P =0.104)wereobserved.Theclassificationofmedication therapyassociatedwith theMTMserviceschangedfrom2000 to 2006,with a decrease in interventions for acutemedicationsfrom86.0%to35.6%(P <0.001)andacorrespond-ingincreaseininterventionsforchronicmedicationsfrom10.2%to 43.7% (P <0.001; Figure 1). Changes were also observed indrugcategoriesovertime,withdecreasesinantimicrobials(from35.5% to 8.7%, P <0.001) and increases in cardiovascular andcentral nervous system agents (from 8.2% to 21.6%, P <0.001and 5.7% to 22.7%,P <0.001, respectively; Table 3). Themostcommon agents associated with MTM services in 2000 werepenicillins(11.1%)versusstatinsandotherlipidloweringagents(12.5%)in2006.
CorrespondingshiftsintheReasons,Actions,andResultsforMTMservicesovertimealsowereobserved.Notablechangesinthe Reason for pharmacist intervention included a decrease innew/changeddrugtherapy(from87.1%to40.0%,P <0.001)andan increase in cost-efficacymanagement (from9.6% to 18.2%,P <0.001) from 2000 to 2006. The observed increase in cost-efficacymanagementclaimswasdrivenbypharmacist-initiatedtherapeutic substitution from a brand to a similarly effective,within-class generic product (e.g., escitalopram [Lexapro] tocitalopram).

24 Journal of Managed Care Pharmacy JMCP January/February 2009 Vol. 15, No. 1 www.amcp.org
withsystolicheartfailurereceivingaprescriptionforpropranololorotherbeta-blockernotshowntodecreasemortality(SuboptimalDrugSelection);patientsskippingmaintenanceantipsychoticor
Specific subcategories related to drug therapy problemsdetectedoverthe7yearswerealsoexplored.Specificexamplesofpharmacist-identifieddrugtherapyproblemsincludedpatients
TABLE 2 Seven-Year Summary of MTM Encounter Data
Results
Patient Characteristics n = 23,798Mean[SD]ageinyears 44.2[26.5]
%male 38.9%
Mean([SD]median)claimsperpatientover7-yearstudytimeperiod
3.2([3.5]2.0)
Characteristics of MTM Claims n = 76,148Therapy Type: Interventiona - % (n)Acute 49.9%(38,029)
Chronic 37.9%(28,829)
Intermediate/Other 12.2%(9,290)
Most Common Drug Categories - % (n)Antimicrobial 24.1%(18,383)
Cardiovascularsystem 14.4%(10,994)
Centralnervoussystem 10.6%(8,083)
Most Common Drug Sub-Categories - % (n)Penicillinantibiotics 7.3%(5,543)
Narcoticanalgesics 6.4%(4,858)
Macrolideantibiotics 5.1%(3,849)
Statinsandotherlipidloweringagents 3.7%(2,808)
Reasons for MTM Intervention - % (n)
1.1Complexdrugtherapy 1.9%(1,430)
1.2Cost-efficacymanagement 4.8%(3,656)
1.3Neworchangeddrugtherapy 85.6%(65,199)
1.4OTCtherapy 1.1%(849)
1.5DrugTherapyIndication
1.5a.Needstherapy 0.6% (468)
1.5b.Unnecessarytherapy 0.8% (625)
1.6DrugTherapyEfficacy
1.6a.Suboptimaldrugselection 0.7% (530)
1.6b.Insufficientdoseorduration 0.4% (331)
1.7DrugTherapySafety
1.7a.Adversedrugreaction 0.7%(511)
1.7b.Druginteraction 0.5% (365)
1.7c.Excessivedoseorduration 0.5%(353)
1.8Drugtherapycompliance
1.8a.Overuse 0.2%(124)
1.8b.Underuse 1.6%(1,185)
1.8c.Administrationtechnique 0.4% (293)
1.9Other 0.3%(229)
Action or MTM Intervention - % (n)
2.1CMR 1.7%(1,316)
2.2Prescriberconsultation 8.7% (6,617)
2.3Patientconsultation 2.6%(1,964)
2.4Patienteducationandmonitoring 86.7%(66,048)
2.5Patientcomplianceconsultation 0.1% (114)
2.6Other 0.1%(89)
Result of MTM Intervention - % (n)
3.1CMRwithdrugtherapyproblem(s) 0.9%(661)
3.2CMRwithoutdrugtherapyproblem(s) 0.9%(655)
3.3Initiationofacost-effectivedrug 4.2%(3,180)
3.4Therapeuticsuccess 70.2%(53,474)
3.5Therapeuticfailure 5.3%(4,024)
3.6DrugTherapyIndication
3.6aInitiatednewtherapy 0.6%(430)
3.6bDiscontinuedtherapy 0.6%(466)
3.7DrugTherapyEfficacy
3.7aChangeddrug 0.6%(462)
3.7bIncreaseddose/duration 0.4%(303)
3.8DrugTherapySafety
3.8aAlteredregimen/changeddrug 0.9%(651)
3.8bDecreaseddose/duration 0.4%(323)
3.9DrugTherapyCompliance
3.9aAlteredcompliance 1.6% (1,233)
3.9bAlteredadministration/technique 0.4% (282)
3.10Patientrefusal 11.7% (8,906)
3.11Prescriberrefusal 1.0% (778)
3.12Other 0.4% (320)
Estimated Cost Avoidance Levelb -% (n)
4.1Improvedqualityofcare 78.8%(60,032)
4.2Reduceddrugproductcost 4.7% (3,602)
4.3Avoidedphysicianvisit 2.4% (1,830)
4.4Avoidednewprescriptionorder 0.6% (485)
4.5Avoidedemergencyroomvisit 0.4%(285)
4.6Avoidedhospitaladmission 0.3%(195)
4.7Avoidedlife-threateningevent 0.1% (92)
4.8Prescriberorpatientrefusalofrecommendation
12.6% (9,627)
Mean [SD] MTM Claim Reimbursement and Estimated Cost
Mean[SD]medianpharmacyreimbursement $8.44[$5.19]$7.00
Mean[SD]medianECA $93.78[$1,022.23]$5.00aAcute is defined as one-time use medications; examples include penicillin antibiotics, macrolide antibiotics, and one-time narcotic analgesics. Chronic is defined as medi-cations prescribed for chronic conditions; examples include lipid lowering agents, ACE inhibitors, and beta-blockers. Examples of intermediate/other include medications such as seasonal allergy treatments.bSelf-assessed by the pharmacist when recording the intervention.ACE = angiotensin-converting enzyme; CMR = comprehensive medication review; DTP = drug therapy problems (e.g.,drug interactions, adverse drug reactions, insufficient dose/duration); MTM = medication therapy management; OTC = over-the-counter; Rx = prescription.
Results
Characteristics of MTM Claims n = 76,148
Analysis of Pharmacist-Provided Medication Therapy Management (MTM) Services in Community Pharmacies Over 7 Years

www.amcp.org Vol. 15, No. 1 January/February 2009 JMCP Journal of Managed Care Pharmacy 25
Analysis of Pharmacist-Provided Medication Therapy Management (MTM) Services in Community Pharmacies Over 7 Years
TABLE 3 Changes in Characteristics of Patients and MTM Claims Over 7 Years
Year 2000 Year 2002 Year 2004 Year 2006
P Value (Overall
Differences)a
Characteristics of Patients (n) (2,070) (5,427) (4,216) (1,995)Mean[SD]age 30.4[19.0] 31.619.6] 41.8[26.1] 57.6[24.8] <0.001a
%male 39.6% 41.5% 40.4% 35.4% <0.001
Average#[SD]claimsperpatient 2.0[1.8] 2.3[2.1] 2.8[3.2] 1.8[2.0] 0.104a
Characteristics of MTM claims (n = 4,065) (n = 12,338) (n = 11,452) (n = 3,525)Therapy Type Initiating Interventionb - % (n)Acute 86.0%(3,495) 69.4%(8,559) 39.2% (4,486) 35.6%(1,255) <0.001
Chronic 10.2% (414) 22.8%(2,819) 50.6%(5,793) 43.7%(1,540) <0.001
Intermediate/other 3.8%(156) 7.8%(960) 10.2%(1,173) 20.7%(730) <0.001
Most Common Drug Categories - % (n)Antimicrobial 35.5%(1,444) 33.9% (4,186) 15.8%(1,815) 8.7%(305) <0.001
Cardiovascularsystem 8.2%(332) 6.3%(773) 16.7% (1,907) 21.6%(760) <0.001
Centralnervoussystem 5.7%(233) 7.7%(945) 14.5% (1,663) 22.7%(802) <0.001
Most Common Drug Sub-Categories - % (n)Penicillinantibiotics 11.1% (452) 11.1% (1,375) 4.8%(544) 2.0%(70) <0.001
Narcoticanalgesics 5.3%(217) 5.5%(682) 8.2%(941) 3.3%(116) <0.001
Macrolideantibiotics 8.2%(332) 7.8%(964) 2.8%(321) 1.5%(52) <0.001
Statinsandotherlipid-loweringagents 2.3%(95) 1.7%(215) 3.6%(408) 12.5%(441) <0.001
Primary Reason for MTM Intervention - % (n)1.1Complexdrugtherapyc 0.0% (0) 0.0%(0) 1.2%(139) 6.6%(231) <0.001
1.2Cost-efficacymanagement 9.6%(390) 3.6%(446) 1.2%(134) 18.2% (640) <0.001
1.3Neworchangeddrugtherapy 87.1% (3,541) 94.0%(11,602) 88.1%(10,089) 40.0%(1,409) <0.001
1.4OTCtherapy 0.0%(0) 0.3%(32) 0.6%(72) 9.2%(323) <0.001
1.5Drugtherapyindication
1.5a.Needstherapy 0.5%(21) 0.2%(30) 0.9% (101) 2.4%(79) <0.001
1.5b.Unnecessarytherapy 0.1%(4) 0.0%(5) 1.6%(177) 2.6%(92) <0.001
1.6Drugtherapyefficacy
1.6a.Suboptimaldrugselection 0.2%(9) 0.1%(16) 0.6%(65) 4.3%(142) <0.001
1.6b.Insufficientdoseorduration 0.4%(18) 0.2%(22) 0.6%(69) 0.7%(23) <0.001
1.7Drugtherapysafety
1.7a.Adversedrugreaction 0.5%(22) 0.4%(48) 0.9%(98) 0.9%(31) <0.001
1.7b.Druginteraction 0.3%(12) 0.2%(18) 0.6%(70) 0.5%(17) <0.001
1.7c.Excessivedoseorduration 0.3%(12) 0.2%(23) 0.9%(100) 0.5%(18) <0.001
1.8Drugtherapycompliance
1.8a.Overuse 0.1%(2) 0.1%(12) 0.2%(19) 0.1%(5) 0.226
1.8b.Underuse 0.5%(19) 0.5%(57) 1.6% (182) 11.8%(416) <0.001
1.8c.Administrationtechnique 0.2%(7) 0.1%(16) 0.4% (42) 0.9%(30) <0.001
1.9Other 0.2%(8) 0.1%(11) 0.8%(95) 2.0%(69) <0.001
Action or MTM Intervention - % (n)2.1CMRc 0.0%(0) 0.0%(0) 1.2%(139) 3.3%(117) <0.001
2.2Prescriberconsultation 12.1%(491) 4.4%(539) 7.0%(801) 27.8%(980) <0.001
2.3Patientconsultation 0.8%(33) 1.3%(165) 2.3%(262) 16.5%(582) <0.001
2.4Patienteducationormonitoring 87.1%(3,541) 94.3%(11,634) 88.7%(10,161) 49.1%(1,732) <0.001
2.5Patientcomplianceconsultationc 0.0%(0) 0.0%(0) 0.0%(0) 3.2%(114) <0.001
2.6Otherc 0.0%(0) 0.0%(0) 0.8%(89) 0.0%(0) 0.063
Result of MTM Intervention - % (n)3.1CMRwithDTP(s)c 0.0%(0) 0.0%(0) 0.7%(75) 0.8%(30) <0.001
3.2CMRwithoutDTP(s)c 0.0%(0) 0.0%(0) 0.6%(64) 2.4%(87) <0.001
3.3Initiationofcost-effectivedrug 9.4%(382) 2.8%(350) 1.0%(114) 13.2% (467) <0.001

26 Journal of Managed Care Pharmacy JMCP January/February 2009 Vol. 15, No. 1 www.amcp.org
Analysis of Pharmacist-Provided Medication Therapy Management (MTM) Services in Community Pharmacies Over 7 Years
oral diabeticmedications (Compliance-Underuse); andpatientsreceivingcontinuedhistamine-2blockerorproton-pumpinhibi-tor therapy after resolutionof an acute gastrointestinal episode(Unnecessary Therapy). (SeeAppendixworksheet for completelistof10 specific subcategoriesofdrug therapyproblems fromwhichtheMTMpharmacistcouldchoose).Subcategoriesshow-ing the greatest relative increases from 2000 to 2006 (Figure2) included: Suboptimal Drug Selection (from 0.2% to 4.3%,P <0.001),UnnecessaryTherapy(from0.1%to2.6%,P <0.001);
andCompliance-Underuse(from0.5%to11.8%,P <0.001).Notablechangesinthe“Action”ofMTMinterventionsprovided
from 2000 to 2006 included a shift from patient education/monitoring (87.1% to 49.1%, P <0.001) to more prescriberconsultations(12.1%to27.8%,P <0.001).Changesinthe“Result”associatedwiththeMTMinterventionincludedashiftfromtheoutcomeoftherapeuticsuccess(75.2%to46.4%,P <0.001)toanalteration inmedicationcompliance (0.5%to12.3%,P <0.001).In addition, it should be noted that, although11.7%of claims
3.4Therapeuticsuccess 75.2%(3,055) 70.3%(8,677) 77.6%(8,892) 46.4%(1,634) <0.001
3.5Therapeuticfailure 8.1%(331) 5.5%(673) 5.5%(626) 1.8% (63) <0.001
3.6Drugtherapyindication
3.6aInitiatednewtherapy 0.5%(21) 0.3%(31) 0.8%(88) 2.0% (69) <0.001
3.6bDiscontinuedtherapy 0.1%(4) 0.0% (3) 1.2%(137) 2.3%(80) <0.001
3.7Drugtherapyefficacy
3.7aChangeddrug 0.2% (9) 0.1%(14) 0.5%(54) 3.1%(110) <0.001
3.7bIncreaseddose/duration 0.4%(17) 0.2%(22) 0.5%(59) 0.6% (20) <0.001
3.8Drugtherapysafety
3.8aAlteredregimen/changeddrug 0.8% (34) 0.4%(55) 1.1%(128) 1.1%(40) <0.001
3.8bDecreaseddose/duration 0.3%(10) 0.2%(19) 0.7%(83) 0.6% (21) <0.001
3.9Drugtherapycompliance
3.9aAlteredcompliance 0.5%(19) 0.5%(64) 1.7%(190) 12.3% (434) <0.001
3.9bAlteredadministration-technique 0.2%(7) 0.1%(11) 0.3%(39) 0.6% (23) <0.001
3.10Patientrefusal 3.9% (159) 19.2%(2,372) 5.9%(675) 3.8%(133) <0.001
3.11Prescriberrefusal 0.3%(11) 0.3% (38) 1.2%(133) 4.6%(162) <0.001
3.12Other 0.1% (6) 0.1%(9) 0.8%(95) 4.3%(152) <0.001
ECA Level - % (n)4.1Improvedqualityofcare 85.1%(3,461) 76.0%(9,375) 86.2% (9,871) 66.1%(2,331) <0.001
4.2Reduceddrugproductcost 9.6%(391) 2.9%(361) 2.1%(245) 15.0% (528) <0.001
4.3Avoidedphysicianvisit 2.0%(80) 0.9%(113) 2.6%(299) 7.6% (267) <0.001
4.4AvoidednewRxorder 0.7% (27) 0.4%(48) 1.0%(113) 0.4% (15) 0.045
4.5AvoidedERVisit 0.2%(7) 0.1%(18) 0.5%(52) 0.7% (24) 0.061
4.6Avoidedhospitaladmission 0.0%(1) 0.1%(13) 0.4%(43) 1.7%(61) <0.001
4.7Avoidedlife-threateningevent 0.0%(0) 0.1%(9) 0.2%(19) 0.1%(4) 0.068
4.8Prescriberorpatientrefusal 2.4%(98) 19.5%(2,401) 7.1%(810) 8.4%(295) <0.001
MTM claim reimbursement and cost avoidance Mean[SD]pharmacyreimbursement $7.65[$3.03] $5.97[$3.34] $9.25[$4.51] $12.28[$6.65] <0.001a
Mean[SD]ECA $24.18[$139.33] $37.47[$566.98] $114.39[$1,197.65] $429.39[$2,420.77] <0.001a
a All P values derived from Pearson chi-square except ANOVA where marked by this superscript. b Acute is defined as one-time use medications; examples include penicillin antibiotics, macrolide antibiotics, and one-time narcotic analgesics. Chronic is defined as medi-cations prescribed for chronic conditions; examples include lipid lowering agents, ACE inhibitors, and beta-blockers. Examples of intermediate/other include medications such as seasonal allergy treatments.c Category not available during all years of study.ACE = angiotensin-converting enzyme; ANOVA = Analysis of Variance; CMR = comprehensive medication review; DTP = drug therapy problems (e.g.,drug interactions, adverse drug reactions, insufficient dose/duration); ECA = estimated cost avoidance; ER = emergency room; MTM = medication therapy management; OTC = over-the-counter; Rx = prescription fill.
Year 2000 Year 2002 Year 2004 Year 2006
P Value (Overall
Differences)a
TABLE 3 Changes in Characteristics of Patients and MTM Claims Over 7 Years (continued from previous page)

www.amcp.org Vol. 15, No. 1 January/February 2009 JMCP Journal of Managed Care Pharmacy 27
increasesinthepercentageoftotalclaimsthatwereassignedECALevel 4.6, avoidanceof ahospital admission, occurred inboth2004and2006relativetopreviousyears.
■■ DiscussionThisMTMadministrativeservicescompanyhasoneofthelarg-estdatabasesofMTMserviceclaimsandincludesanationwidesampleofclaimssubmittedovermorethan7years.ThepresentstudyrepresentsthefirstanalysisoftheMTMclaimsinthisdata-base.TheMTMadministrativeservicescompanyhasadoptedacostavoidancemodelasameanstodemonstratethevaluethatpharmacistsaddto theU.S.healthcaresystem,andthisstudyincludesthefirstreportofpharmacistself-assessmentoftheECAassociatedwithMTMinterventions.Examinationofclaimsfrom50MTM programs over a 7-year period found that the typesofpharmacist-providedMTMserviceshavechangedovertime,associatedwithincreasesinmeanMTMreimbursementtophar-maciesandECA.
Overthepastseveralyears,MTMinterventionshaveevolvedfromtheprovisionofpatienteducationinvolvingacutemedicationstowardconsultation-typeservicesforchronicmedications.Theseshifts suggest that theprovisionofMTM serviceswill becomeincreasinglyvitalasthepopulationages.Specifictrendsrelatedto drug therapy problems included an increase in servicesrelated to suboptimal drug selection, unnecessary therapy,
documentedoverthe7-yearstudyperiodwerepatientrefusals,the patient refusal rate steadily declined from a high of 19.2%in 2002 to 3.8% in 2006. This trend can be attributed to 2possiblefactors—theclaimsdatebacktotheearly2000’s,whenMTM serviceswere not aswidely recognized and a change inthe ability of both pharmacists and the MTM administrativeservicescompanytoshowthevalueofMTMservicestopatients.Somewhat surprisingly, prescriber refusal increased during asimilar period, from less than 1% in 2000 to 4.6% in 2006.Theincreaseinprescriberrefusalislikelyrelatedtothemarkedincreaseininterventionsinvolvingprescriberconsultationsthatoccurredduring this timeperiod.Notablechanges in theECAlevel (Outcome of Service) from 2000 to 2006 included fewerclaims submitted with improved quality of care (from 85.1%to 66.1%, P<0.001) and an increase in claims submitted withECA related to reduction in drug costs (from 9.6% to 15.0%,P<0.001).
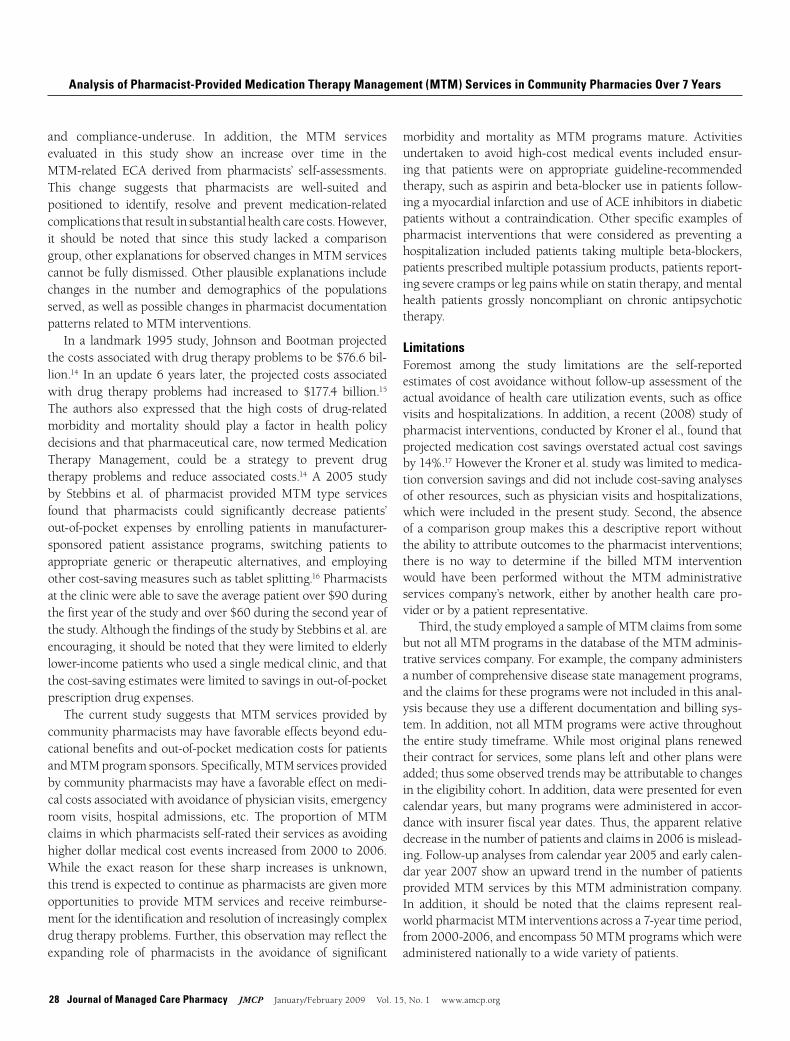
Finally, examination of changes in MTM reimbursementover time revealed a greater than 60% increase in the mean(SD)pharmacypayment from$7.65 ($3.03) in2000 to$12.28($6.65) in2006.TheECAmean (SD)dollar amountper claimincreasedfrom$24.18($139)to$429($2,421)from2000to2006(P<0.001). It shouldbenoted thata relatively smallnumberofhigh-impactclaimsledtosignificantchangesintheECAinthelatterportionof theevaluatedtimeperiod.Specifically,notable
Suboptimal Therapy Compliance-Underuse Unnecessary Therapy
0%
2%
4%
6%
8%
10%
12%
2006200520042003200220012000
Year of Intervention
Perc
enta
ge o
f Tot
al M
TM C
laim
s
FIGURE 2 Change in the Reasons for MTM Intervention Over 7 years for 3 Drug Therapy Subcategories With the Greatest Relative Increase
These are categories of drug therapy problems. An example of suboptimal therapy includes a patient with heart failure receiving a prescription for a beta-blocker not shown to decrease mortality; compliance-underuse includes a patient skipping a maintenance medication dose; and unnecessary therapy is continued proton-pump inhibitor therapy after resolution of an acute gastrointestinal episode. MTM=medication therapy management.
Analysis of Pharmacist-Provided Medication Therapy Management (MTM) Services in Community Pharmacies Over 7 Years
28 Journal of Managed Care Pharmacy JMCP January/February 2009 Vol. 15, No. 1 www.amcp.org
morbidity and mortality as MTM programs mature. Activitiesundertaken to avoid high-cost medical events included ensur-ing that patients were on appropriate guideline-recommendedtherapy,suchasaspirinandbeta-blockeruseinpatientsfollow-ingamyocardialinfarctionanduseofACEinhibitorsindiabeticpatientswithoutacontraindication.Other specificexamplesofpharmacist interventions thatwere considered as preventing ahospitalization included patients takingmultiple beta-blockers,patientsprescribedmultiplepotassiumproducts,patientsreport-ingseverecrampsorlegpainswhileonstatintherapy,andmentalhealth patients grossly noncompliant on chronic antipsychotictherapy.
LimitationsForemost among the study limitations are the self-reportedestimatesofcostavoidancewithoutfollow-upassessmentoftheactualavoidanceofhealthcareutilizationevents,suchasofficevisitsandhospitalizations.Inaddition,arecent(2008)studyofpharmacistinterventions,conductedbyKronerelal.,foundthatprojectedmedicationcostsavingsoverstatedactualcostsavingsby14%.17HowevertheKroneretal.studywaslimitedtomedica-tionconversionsavingsanddidnotincludecost-savinganalysesofotherresources,suchasphysicianvisitsandhospitalizations,whichwere includedinthepresentstudy.Second, theabsenceofacomparisongroupmakes thisadescriptivereportwithouttheabilitytoattributeoutcomestothepharmacistinterventions;there is no way to determine if the billed MTM interventionwould have been performed without the MTM administrativeservicescompany’snetwork,eitherbyanotherhealthcarepro-viderorbyapatientrepresentative.
Third,thestudyemployedasampleofMTMclaimsfromsomebutnotallMTMprogramsinthedatabaseoftheMTMadminis-trativeservicescompany.Forexample,thecompanyadministersanumberofcomprehensivediseasestatemanagementprograms,andtheclaimsfortheseprogramswerenotincludedinthisanal-ysisbecausetheyuseadifferentdocumentationandbillingsys-tem.Inaddition,notallMTMprogramswereactivethroughouttheentirestudytimeframe.Whilemostoriginalplansrenewedtheircontractforservices,someplansleftandotherplanswereadded;thussomeobservedtrendsmaybeattributabletochangesintheeligibilitycohort.Inaddition,datawerepresentedforevencalendaryears,butmanyprogramswereadministeredinaccor-dancewithinsurerfiscalyeardates.Thus,theapparentrelativedecreaseinthenumberofpatientsandclaimsin2006ismislead-ing.Follow-upanalysesfromcalendaryear2005andearlycalen-daryear2007showanupwardtrendinthenumberofpatientsprovidedMTMservicesbythisMTMadministrationcompany.In addition, it should be noted that the claims represent real-worldpharmacistMTMinterventionsacrossa7-yeartimeperiod,from2000-2006,andencompass50MTMprogramswhichwereadministerednationallytoawidevarietyofpatients.
and compliance-underuse. In addition, the MTM servicesevaluated in this study show an increase over time in the MTM-related ECA derived from pharmacists’ self-assessments.This change suggests that pharmacists are well-suited andpositioned to identify, resolve and prevent medication-relatedcomplicationsthatresultinsubstantialhealthcarecosts.However,it should be noted that since this study lacked a comparisongroup,otherexplanationsforobservedchangesinMTMservicescannotbefullydismissed.Otherplausibleexplanationsincludechanges in the number and demographics of the populationsserved,aswellaspossiblechangesinpharmacistdocumentationpatternsrelatedtoMTMinterventions.
In a landmark1995 study, JohnsonandBootmanprojectedthecostsassociatedwithdrugtherapyproblemstobe$76.6bil-lion.14 Inanupdate6years later, theprojectedcostsassociatedwith drug therapy problems had increased to $177.4 billion.15 The authors also expressed that the high costs of drug-relatedmorbidity and mortality should play a factor in health policydecisionsandthatpharmaceuticalcare,nowtermedMedicationTherapy Management, could be a strategy to prevent drugtherapy problems and reduce associated costs.14 A 2005 studyby Stebbins et al. of pharmacist providedMTM type servicesfound that pharmacists could significantly decrease patients’out-of-pocket expenses by enrolling patients in manufacturer-sponsored patient assistance programs, switching patients toappropriate generic or therapeutic alternatives, and employingothercost-savingmeasuressuchastabletsplitting.16Pharmacistsattheclinicwereabletosavetheaveragepatientover$90duringthefirstyearofthestudyandover$60duringthesecondyearofthestudy.AlthoughthefindingsofthestudybyStebbinsetal.areencouraging,itshouldbenotedthattheywerelimitedtoelderlylower-incomepatientswhousedasinglemedicalclinic,andthatthecost-savingestimateswerelimitedtosavingsinout-of-pocketprescriptiondrugexpenses.
The current study suggests thatMTM services provided bycommunitypharmacistsmayhavefavorableeffectsbeyondedu-cationalbenefitsandout-of-pocketmedicationcostsforpatientsandMTMprogramsponsors.Specifically,MTMservicesprovidedbycommunitypharmacistsmayhaveafavorableeffectonmedi-calcostsassociatedwithavoidanceofphysicianvisits,emergencyroom visits, hospital admissions, etc. The proportion ofMTMclaimsinwhichpharmacistsself-ratedtheirservicesasavoidinghigherdollarmedicalcosteventsincreasedfrom2000to2006.While the exact reason for these sharp increases is unknown,thistrendisexpectedtocontinueaspharmacistsaregivenmoreopportunities toprovideMTMservices and receive reimburse-mentfortheidentificationandresolutionofincreasinglycomplexdrugtherapyproblems.Further,thisobservationmayreflecttheexpanding role of pharmacists in the avoidance of significant
Analysis of Pharmacist-Provided Medication Therapy Management (MTM) Services in Community Pharmacies Over 7 Years

www.amcp.org Vol. 15, No. 1 January/February 2009 JMCP Journal of Managed Care Pharmacy 29
■■ ConclusionsMTM services appear to be evolving from patient educa-tion involving acute medications to more complex prescriber
MITCHELL J. BARNETT, PharmD, MS, is Assistant Professor; SHANNON VONMUENSTER, PharmD, is Fellow and Clinical Instructor; HEIDI WEHRING, PharmD, at the time of this study was Assistant Professor; and PAUL J. PERRY, PhD, is Professor and Chair at Touro University, College of Pharmacy, Clinical Division, Vallejo, California. JESSICA FRANK, PharmD, is Director of Clinical Services; BRAND NEWLAND, PharmD, is Vice President; PATTY KUMBERA, BSPharm, is a co-founder and Chief Operating Officer; and TOM HALTERMAN, BSPharm, is a co-founder and Chief Executive Officer at Outcomes Pharmaceutical Health Care, Des Moines, Iowa.
AUTHOR CORRESPONDENCE: Mitchell J. Barnett, PharmD, MS, Touro University-California, College of Pharmacy, 1310 Johnson Ave, Vallejo, CA 94592. Tel.: 319.338.1635; Fax: 319.887.4932; E-mail: [email protected]
Authors
Analysis of Pharmacist-Provided Medication Therapy Management (MTM) Services in Community Pharmacies Over 7 Years
$0
$10
$20
$30
$40
$50
$60
$70
$80
$90
$100
Mean ECAMean Pharmacy Reimbursement
7-year total2006200520042003200220012000
$7.65
$24.18
$5.59
$20.00
$5.96
$37.47
$6.63
$20.00
$9.26 $11.86
$100.00 $429.39$114.39
$12.86$8.44
$93.78
FIGURE 3 Mean Pharmacy Payment for MTM Services and Mean ECA
ECA = estimated cost avoidance; MTM = medication therapy management.
$0
$10
$20
$30
$40
$50
$60
$70
$80
$90
$100
Mean ECAMean Pharmacy Reimbursement
7-year total2006200520042003200220012000
$7.65
$24.18
$5.59
$20.00
$5.96
$37.47
$6.63
$20.00
$9.26 $11.86
$100.00 $429.39$114.39
$12.86$8.44
$93.78
consultation-type services for older patients receiving chronicmedications.Further, thesechangesareassociatedwithgreater reimbursementamountsandgreaterestimatedcostsavings.Whilethe causal factors underlying these changes remain to be fullyexplained, thechangesappear tobedirectly linked to require-ments outlined in Medicare Part D legislation. OpportunitiesbeyondMedicarePartDarelikelytoexpandaswell,particularlyforemployersandothergovernment-sponsoredprograms.
DISCLOSURES
There was no external funding for this research. Four of the authors areemployees of theMTM administrative services company described in thisarticle. The authors acknowledge Danielle M. Richardson, BS, PharmDCandidate,forherassistanceinthepreparationofthismanuscript.
Concept and design, data collection, data interpretation, and revisionof themanuscriptwere primarily thework of Barnett.Newland and Perryassisted with concept and design and with data interpretation, Frank andNewlandassistedwithdatacollection,andFrankandVonMuensterassistedwith revision of themanuscript. The work of writing themanuscript wassharedequallybyBarnett,Wehring,Kumbera,andHalterman.

30 Journal of Managed Care Pharmacy JMCP January/February 2009 Vol. 15, No. 1 www.amcp.org
9.BlumlBM,McKenneyJM,CzirakyMJ.Pharmaceuticalcareser-vicesandresultsinprojectImPACT:hyperlipidemia. J Am Pharm Assoc. 2000;40(2):157-65.
10.CranorCW,BuntingBA,ChristensenDB.TheAshevilleProject:long-termclinicalandeconomicoutcomesofacommunitypharmacydiabetescare program. J Am Pharm Assoc.2003;43:173-84.
11.TheLewinGroup.MedicationTherapyManagementservices:acriticalreview.J Am Pharm Assoc.2005;45:580-87.
12.BrewerJ,KumberaP.EstablishingaWeb-basedprogramforreimburse-mentformedicationtherapymanagementservices.Am J Health-Syst Pharm. 2006;63:1806-09.
13.FarrisKB,KumberaP,HaltermanT,Fang,G.Outcomes-basedpharma-cistreimbursement:reimbursingpharmacistsforcognitiveservices,part1.J Manag Care Pharm. 2002;8(5):383-93.Availableat:www.amcp.org/data/jmcp/Contemporary%20Subjects-383-393.pdf.
14.JohnsonJA,BootmanJL.Drug-relatedmorbidityandmortality:acost-of-illnessmodel.Arch Intern Med.1995;155:1949-56.
15.ErnstFR,GrizzleAG.Drug-relatedmorbidityandmortality:updatingthecost-of-illnessmodel. J Am Pharm Assoc.2001;41:192-99.
16.StebbinsMR,KaufmanDJ,Lipton,HL.ThePRICEclinicforlow-incomeelderly:Amanagedcaremodelforimplementingpharmacist-directedser-vices. J Manag Care Pharm.2005:11(4):333-41.Availableat:www.amcp.org/data/jmcp/contemporary_333_341.pdf.
17.KronerBA,BillupsSJ,GarrisonKM,LymanAE,DelateT.Actualversusprojectedcostavoidanceforclinicalpharmacyspecialist-initiatedmedica-tionconversionsinaprimarycaresettinginanintegratedhealthsystem.J Manag Care Pharm. 2008;14(2):155-63.Availableat:www.amcp.org/data/jmcp/JMCPMaga_March%2008_155-163.pdf.
REFERENCES
1.PublicLaw108-173.TheMedicarePrescriptionDrug,Improvement,andModernizationActof2003,HR1.December8,2003.Availableat:www.ustreas.gov/offices/public-affairs/hsa/pdf/pl108-173.pdf.AccessedNovember27,2008.
2.CentersforMedicareandMedicaidServices.MedicarePartDmedicationtherapymanagement(MTM)programs–2008factsheet.Availableat:www.cms.hhs.gov/PrescriptionDrugCovContra/Downloads/MTMFactSheet.pdf. AccessedNovember2,2008.
3.FederalRegister.DepartmentofHealthandHumanServices.CentersforMedicareandMedicaidServices2005;70(18):4193-742.Availableat: www.edocket.access.gpo.gov/2005/pdf/05-1321.pdf.AccessedDecember3,2008.
4.CameronKA.Commentonmedicationmanagementmodelsandotherpharmacistinterventions:implicationsforpolicyandpractice.Home Health Care Serv Q.2005;24:73-85.
5.AmericanPharmacistsAssociation,NationalAssociationofChainDrugStoresFoundation.Medicationtherapymanagementincommunityphar-macypractice:CoreelementsofanMTMservice(Version1.0).J Am Pharm Assoc.2005;45:573-79.
6.Soundmedicationtherapymanagementprograms,version2.0withvalidationstudy.J Manag Care Pharm.2008;14(1,S-b):S2-S42.Availableat:www.amcp.org/data/jmcp/JMCPSuppB_Jan08.pdf
7.BlumlBM.Definitionofmedicationtherapymanagement:developmentofprofessionwideconsensus.J Am Pharm Assoc. 2005;45:566-72.
8.TouchetteDR,BurnsAL,BoughMA,Blackburn,JC.SurveyofmedicationtherapymanagementprogramsunderMedicarePartD.J Am Pharm Assoc. 2006;46:683-91.
Analysis of Pharmacist-Provided Medication Therapy Management (MTM) Services in Community Pharmacies Over 7 Years

www.amcp.org Vol. 15, No. 1 January/February 2009 JMCP Journal of Managed Care Pharmacy 31
APPENDIx MTM Encounter Worksheet
Analysis of Pharmacist-Provided Medication Therapy Management (MTM) Services in Community Pharmacies Over 7 Years