analysis of pet studies pet basics course 2006 turku pet centre 2006-04-24 vesa oikonen
TRANSCRIPT
ANALYSIS OF PET STUDIES
PET Basics Course 2006
Turku PET Centre2006-04-24
Vesa Oikonenhttp://users.utu.fi/vesoik/
Analysis of PET studies
1. Instructions in quality system2. Retrieving data for analysis3. Steps of analysis4. Quantification in PET analysis5. Models6. Analysis tools in intranet and WWW7. Imaging, modelling and IT in
intranet
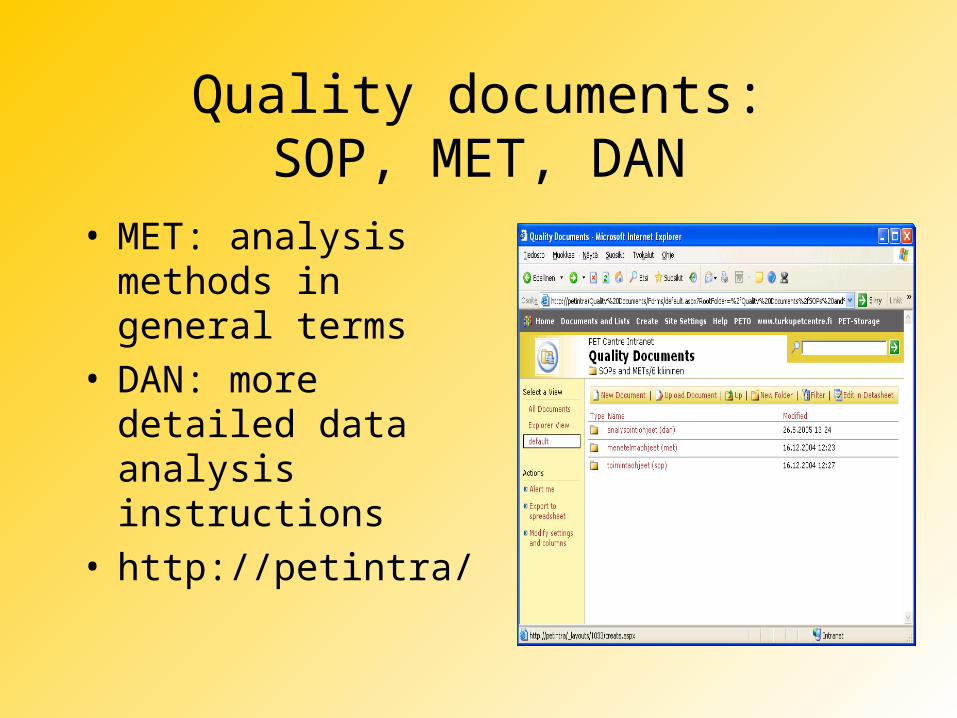
Quality documents:SOP, MET, DAN
• MET: analysis methods in general terms
• DAN: more detailed data analysis instructions
• http://petintra/
Quality data analysis
• Check when starting new study project:– the current analysis method– most recent software releases– never follow old ”recipes”!
• Even SOP and MET can be outdated!
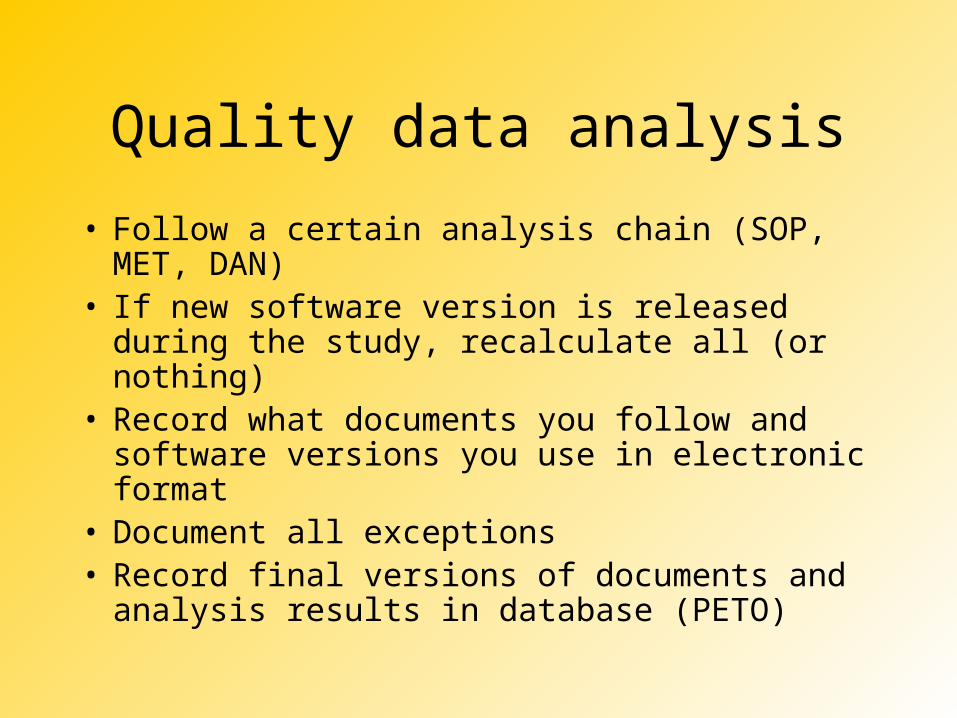
Quality data analysis
• Follow a certain analysis chain (SOP, MET, DAN)
• If new software version is released during the study, recalculate all (or nothing)
• Record what documents you follow and software versions you use in electronic format
• Document all exceptions• Record final versions of documents and
analysis results in database (PETO)
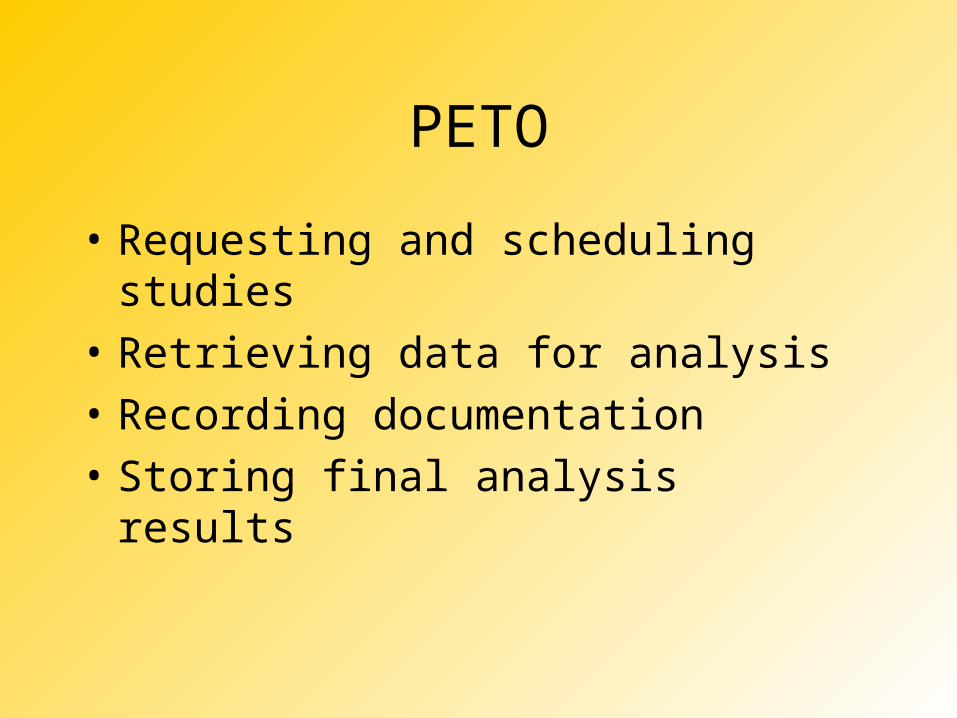
PETO
• Requesting and scheduling studies• Retrieving data for analysis• Recording documentation• Storing final analysis results
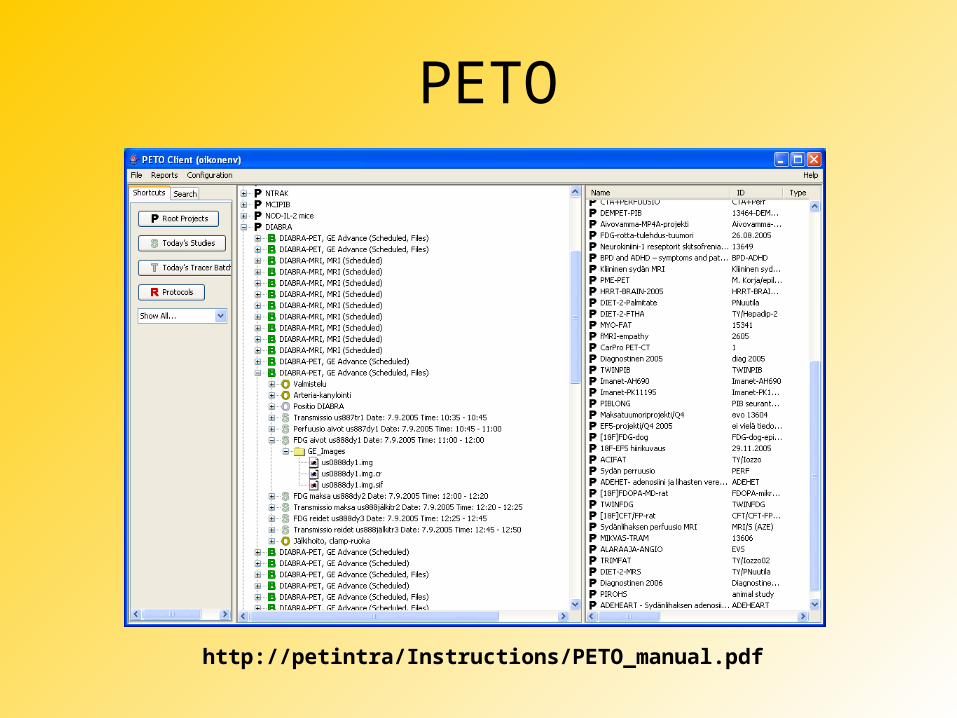
PETO
http://petintra/Instructions/PETO_manual.pdf
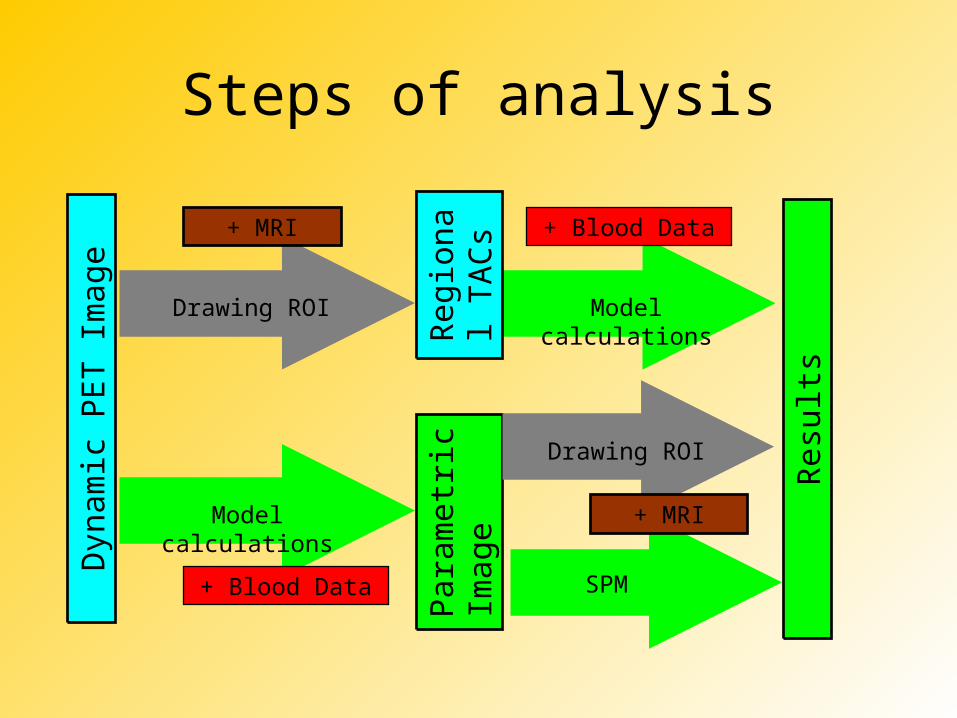
Steps of analysis
Resu
lts
Para
metr
icIm
ag
e
+ Blood Data
Model calculations
Model calculations
Drawing ROI
SPM
Dyn
am
ic P
ET Im
ag
e
Reg
ion
al
TA
Cs
+ MRI
+ MRI
+ Blood Data
Drawing ROI
Collection of data and the specific method of analysis
depends on the studied question
• Sometimes the visual inspection of single image (static imaging) is sufficient, e.g. in tumour detection
• Detailed analysis requires dynamic imaging, often blood sampling, and elaborate modelling
• The more advanced statistical methods require parametric images
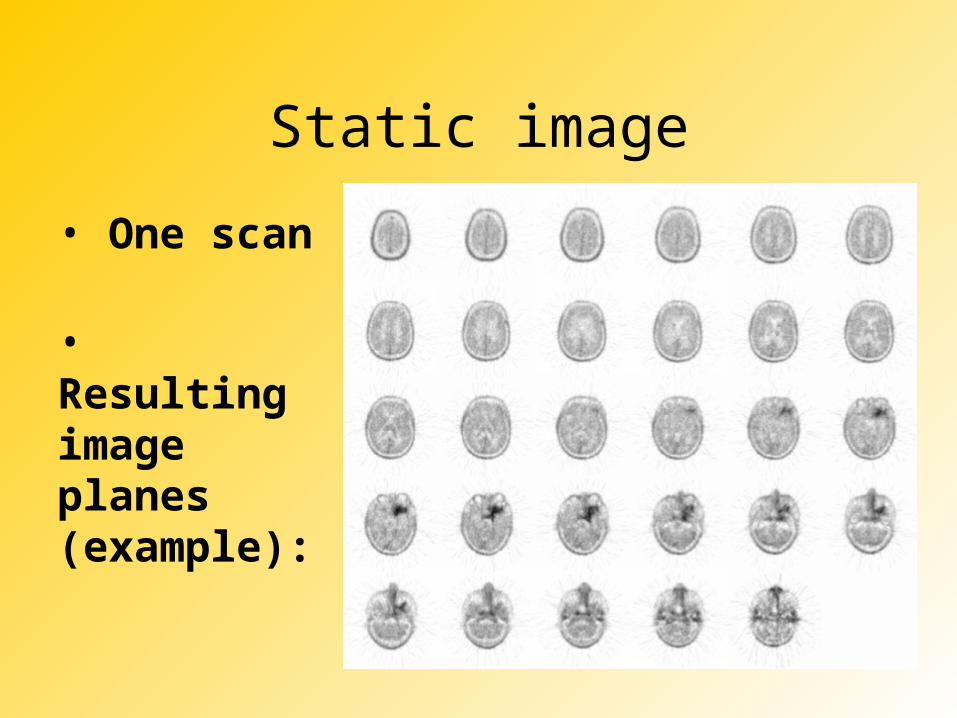
Static image
• One scan
• Resulting image planes (example):
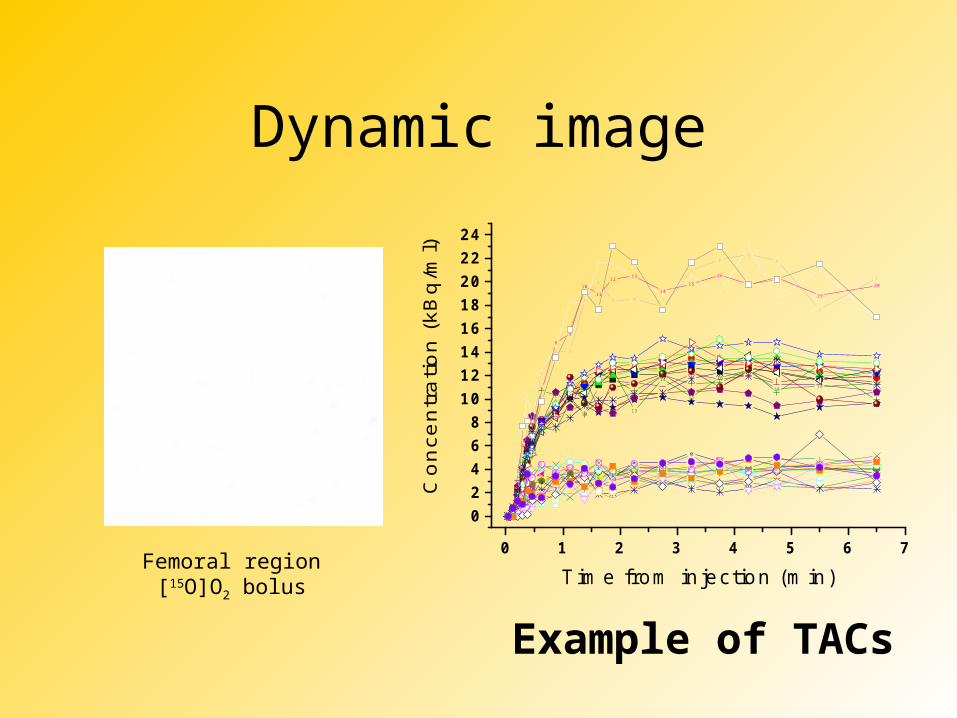
Dynamic image
0 1 2 3 4 5 6 7
02468
1012141618202224
12
3
4
56
7
8
9
10
11
12 13
1415
16
1718
19
20
A
B
C
D
E
F
G
H
I J
K L
M
N
O
P
Q
R
S
T
a
b
c
d
e f
g
h i
j
k
l m
n
o
pq
r
s
t
12
3
4
5
6
78
9
10
11
12
13
14
15
1617
18 19 20
A BC D
E
FG
H
I JK
LM N
O
PQ
R ST
a b
cd e
f
gh
i
j
k
l
m n
o
p qr s
t
Con
cent
ratio
n (k
Bq/
ml)
Time from injection (min)Femoral region[15O]O2 bolus
Example of TACs
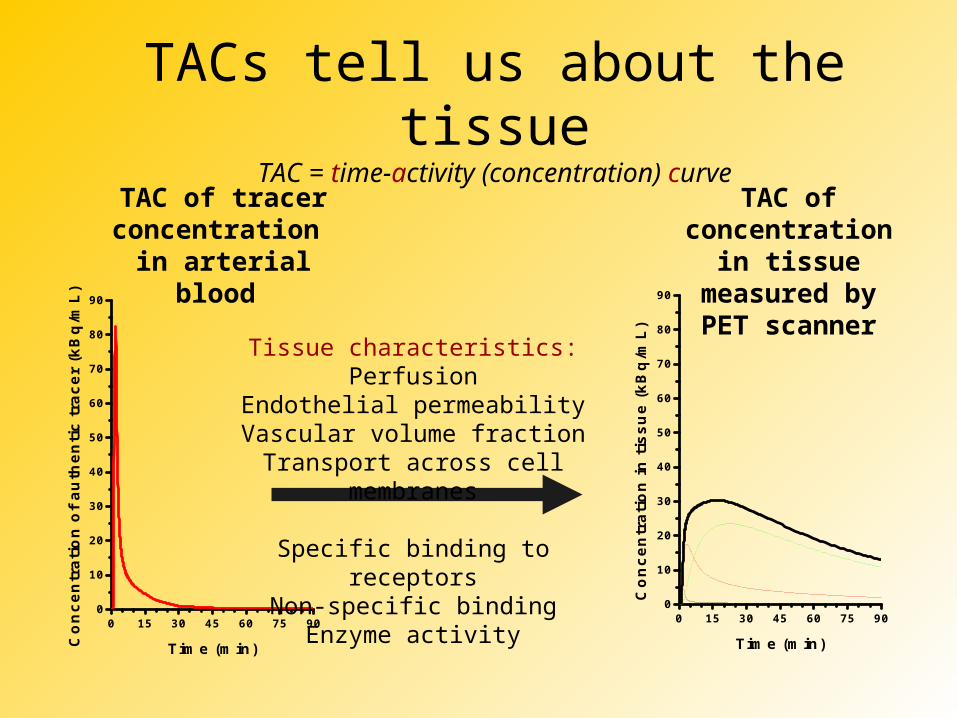
TACs tell us about the tissueTAC = time-activity (concentration) curve
0 15 30 45 60 75 900
10
20
30
40
50
60
70
80
90
Co
nce
ntr
atio
n o
f au
then
tic
trac
er (
kBq
/mL
)
Time (min)
0 15 30 45 60 75 900
10
20
30
40
50
60
70
80
90
Co
nce
ntr
atio
n in
tis
sue
(kB
q/m
L)
Time (min)
TAC of tracer concentration
in arterial blood
TAC of concentration
in tissue measured byPET scanner
Tissue characteristics:Perfusion
Endothelial permeabilityVascular volume fraction
Transport across cell membranes
Specific binding to receptorsNon-specific binding
Enzyme activity
Parametric image• Dynamic information is converted to
functional information with dedicated software– Not a series of scans (smaller file size)– image voxel value = the value of the
studied physiological parameter (perfusion, glucose consumption, receptor density)
• More sophisticated analyses possible– requires careful evaluation of alternative
models before choosing the right model
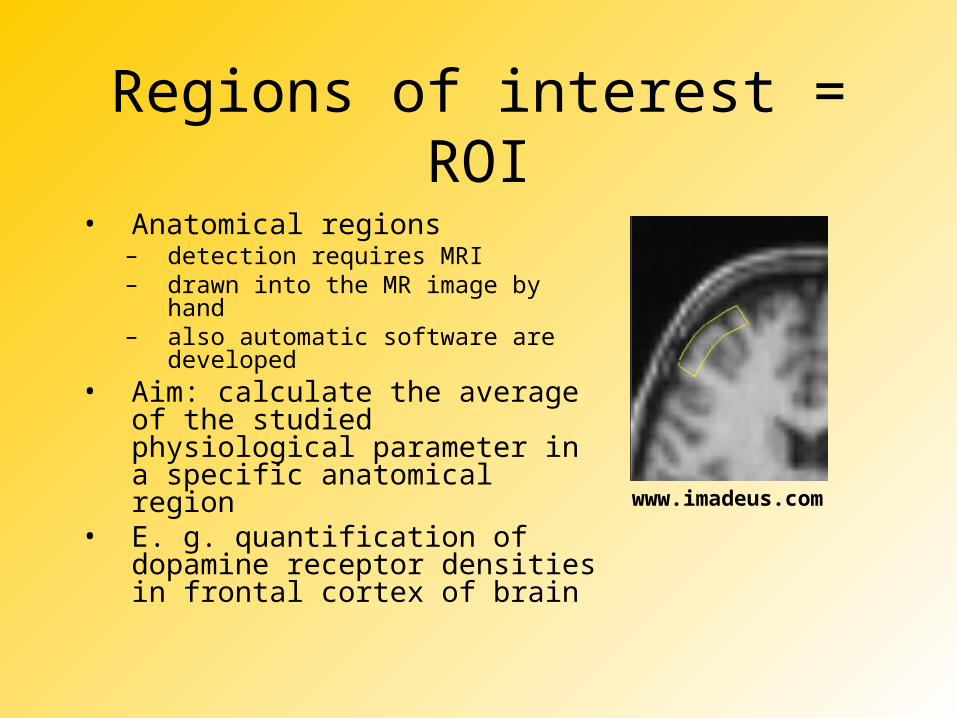
Regions of interest = ROI
• Anatomical regions – detection requires MRI– drawn into the MR image by
hand– also automatic software are
developed• Aim: calculate the average
of the studied physiological parameter in a specific anatomical region
• E. g. quantification of dopamine receptor densities in frontal cortex of brain
www.imadeus.com
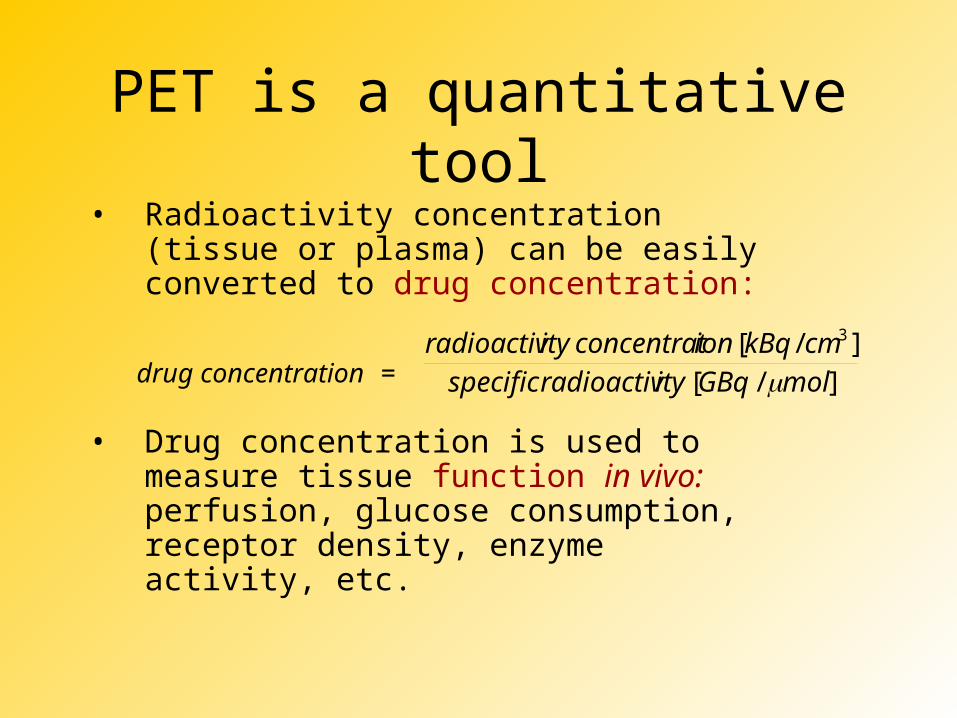
PET is a quantitative tool• Radioactivity concentration (tissue or
plasma) can be easily converted to drug concentration:
drug concentration =
• Drug concentration is used to measure tissue function in vivo: perfusion, glucose consumption, receptor density, enzyme activity, etc.
]/[]/[ 3
molGBqityradioactivspecificcmkBqionconcentratityradioactiv
Calibration
• Tissue and reference radioactivity must be comparable
• PET, well counter for plasma samples, and dose calibratorare all cross-calibrated
• Calibration is done by PET physicist
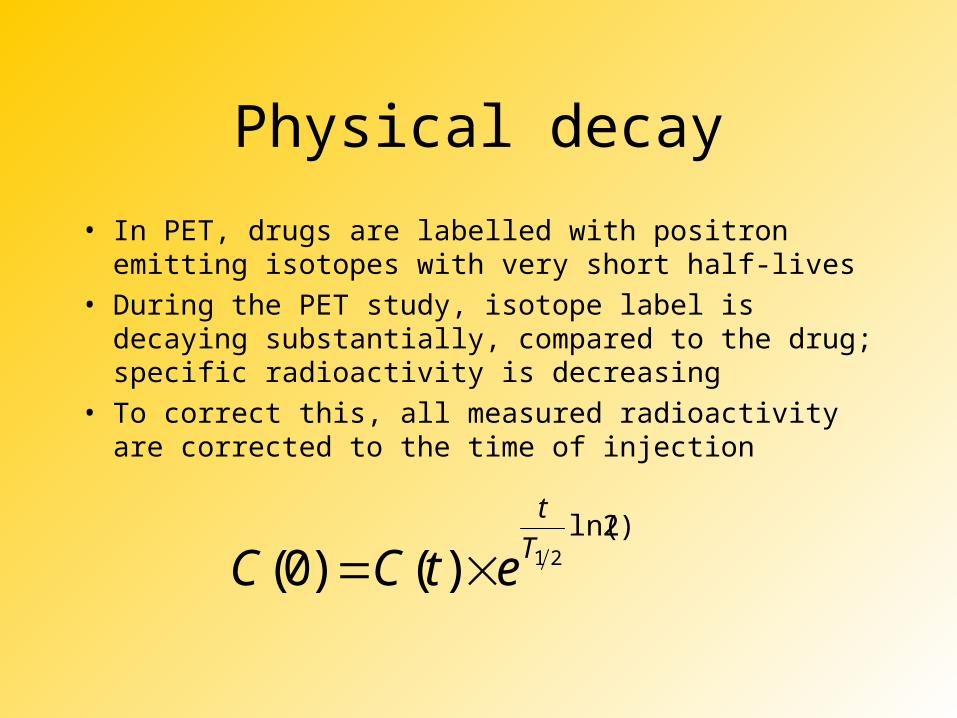
Physical decay
• In PET, drugs are labelled with positron emitting isotopes with very short half-lives
• During the PET study, isotope label is decaying substantially, compared to the drug; specific radioactivity is decreasing
• To correct this, all measured radioactivity are corrected to the time of injection
)2ln(21)()0(
T
t
etCC
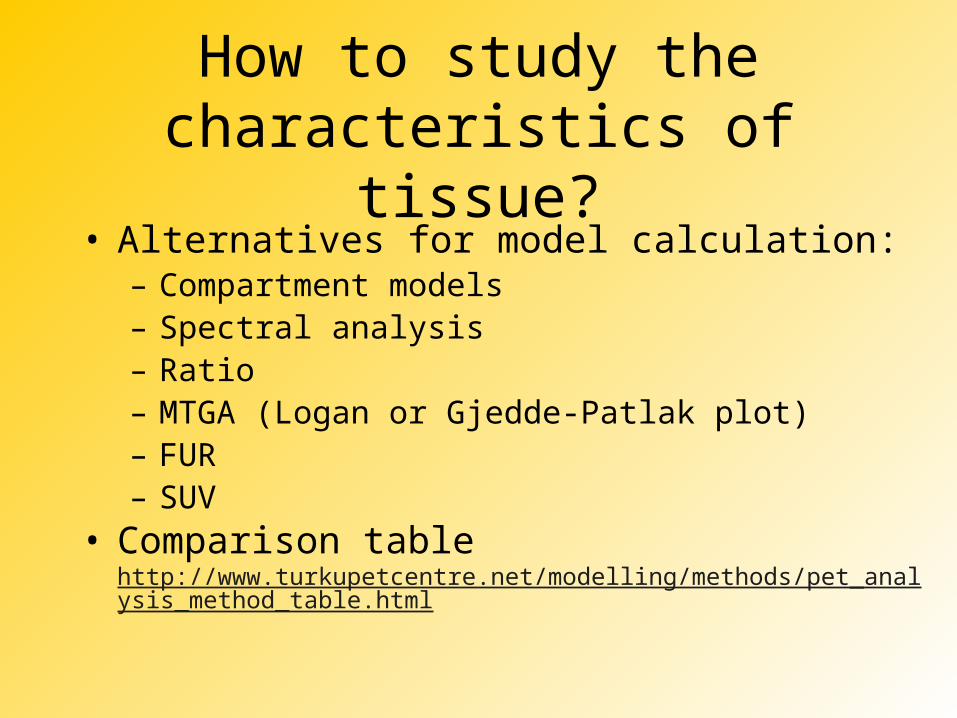
How to study the characteristics of tissue?
• Alternatives for model calculation:– Compartment models– Spectral analysis– Ratio– MTGA (Logan or Gjedde-Patlak plot)– FUR– SUV
• Comparison table http://www.turkupetcentre.net/modelling/methods/pet_analysis_method_table.html
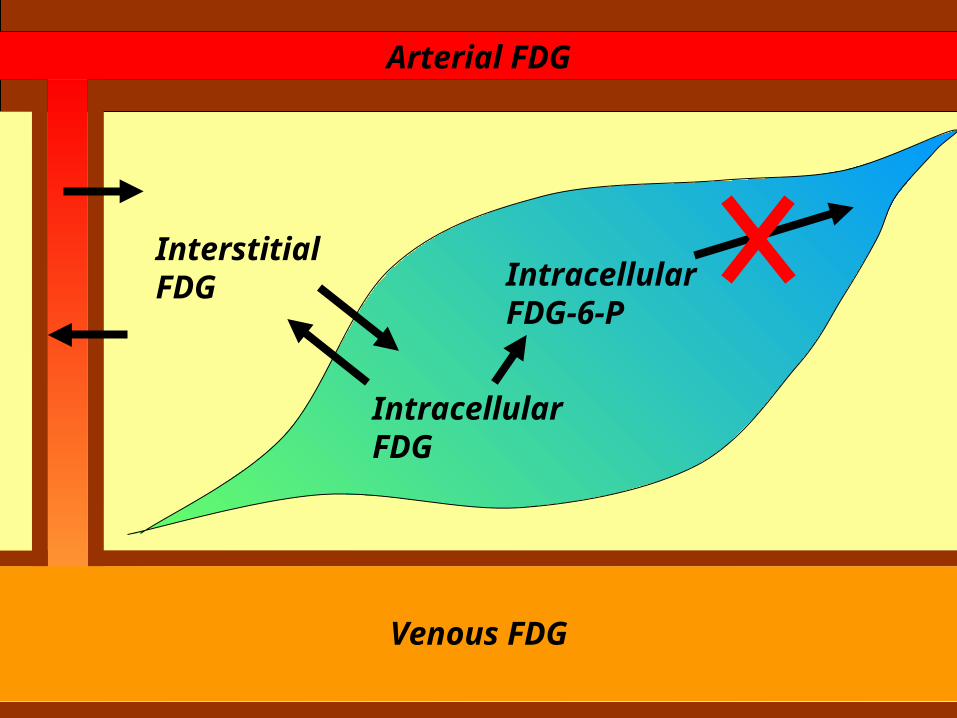
Arterial FDG
Venous FDG
Interstitial FDG
Intracellular FDG
Intracellular FDG-6-P
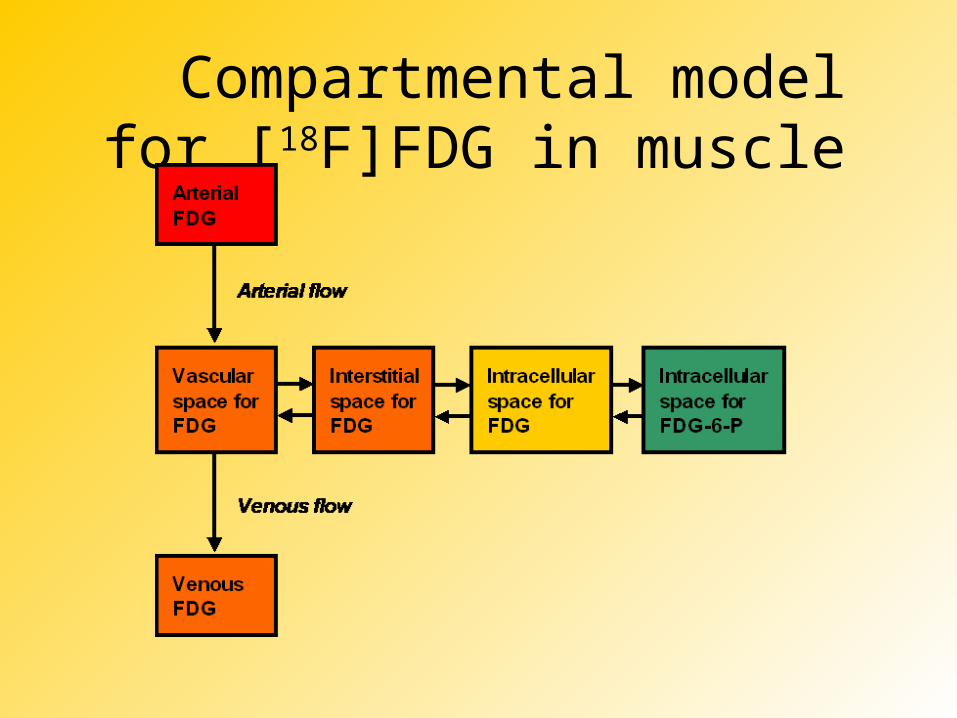
Compartmental model for [18F]FDG in muscle
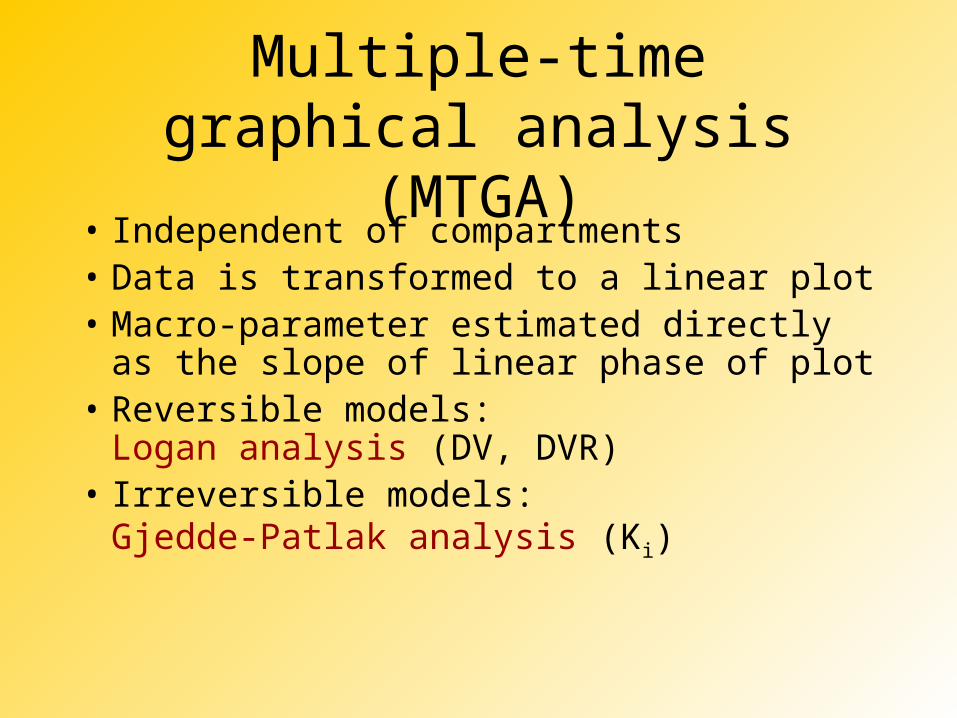
Multiple-time graphical analysis (MTGA)
• Independent of compartments• Data is transformed to a linear plot• Macro-parameter estimated directly
as the slope of linear phase of plot• Reversible models:
Logan analysis (DV, DVR)• Irreversible models:
Gjedde-Patlak analysis (Ki)
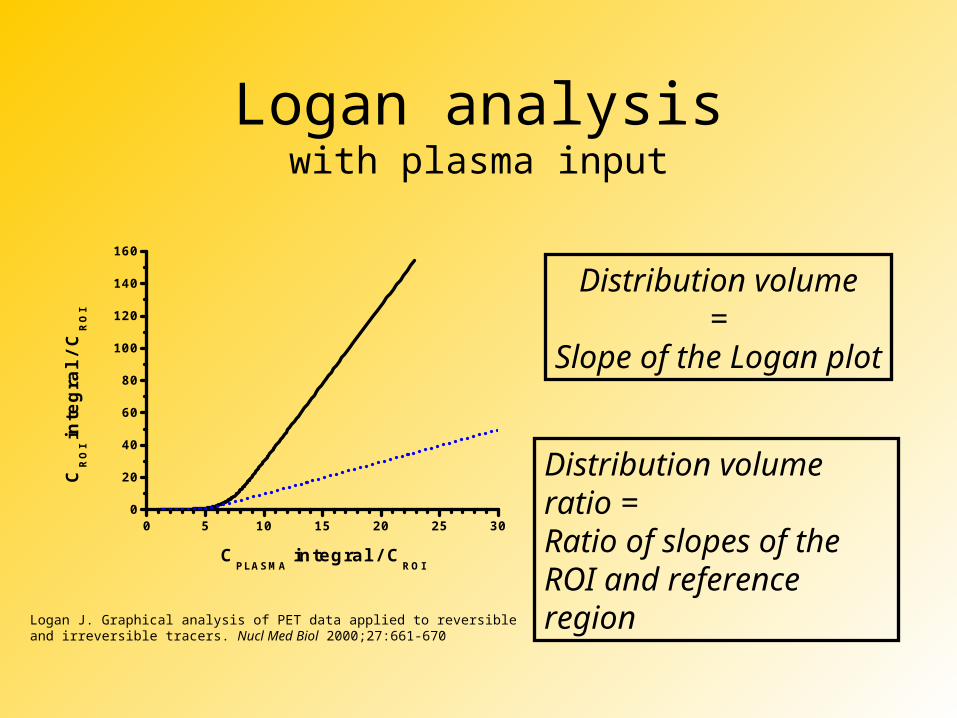
Logan analysiswith plasma input
0 5 10 15 20 25 300
20
40
60
80
100
120
140
160
CR
OI i
nte
gra
l / C
RO
I
CPLASMA
integral / CROI
Distribution volume=
Slope of the Logan plot
Distribution volumeratio =Ratio of slopes of theROI and referenceregionLogan J. Graphical analysis of PET data applied to reversible
and irreversible tracers. Nucl Med Biol 2000;27:661-670
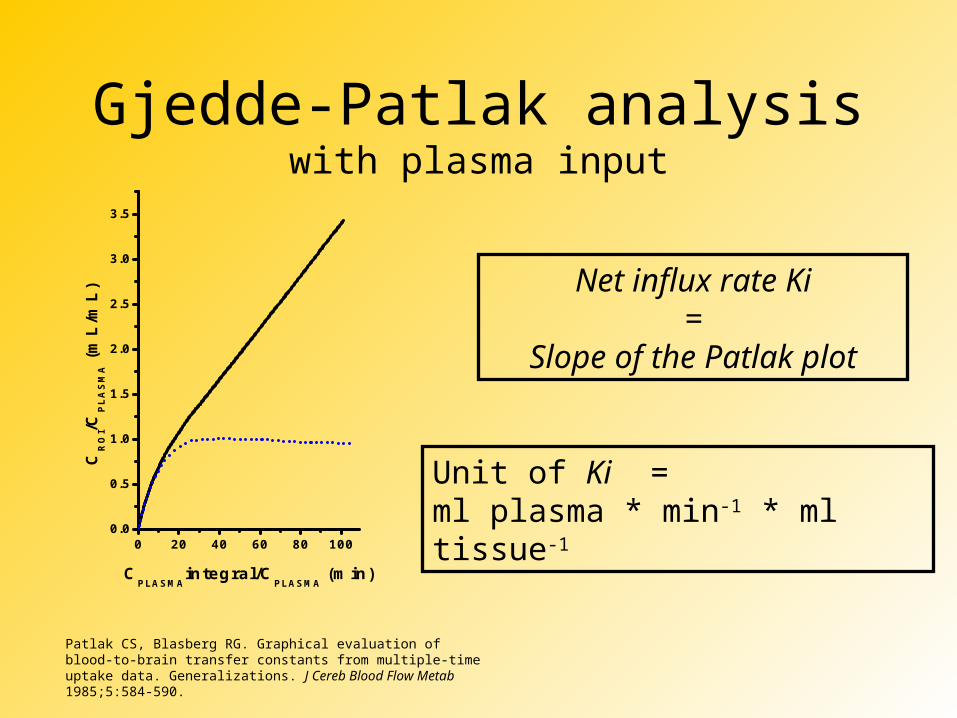
Gjedde-Patlak analysiswith plasma input
0 20 40 60 80 1000.0
0.5
1.0
1.5
2.0
2.5
3.0
3.5
CR
OI/C
PL
AS
MA (
mL
/mL
)
CPLASMA
integral/CPLASMA
(min)
Net influx rate Ki=
Slope of the Patlak plot
Unit of Ki =ml plasma * min-1 * ml tissue-1
Patlak CS, Blasberg RG. Graphical evaluation of blood-to-brain transfer constants from multiple-time uptake data. Generalizations. J Cereb Blood Flow Metab 1985;5:584-590.
Standardized uptake value SUV
• Simple, semi-quantitative measure (g/ml) • Regional radioactivity concentration
(kBq/ml) normalized by injected dose (GBq) and subject weight (kg)
• Average SUV in entire body = body density• Blood sampling not needed• Example: measuring amino acid
methionine uptake in tumour studies
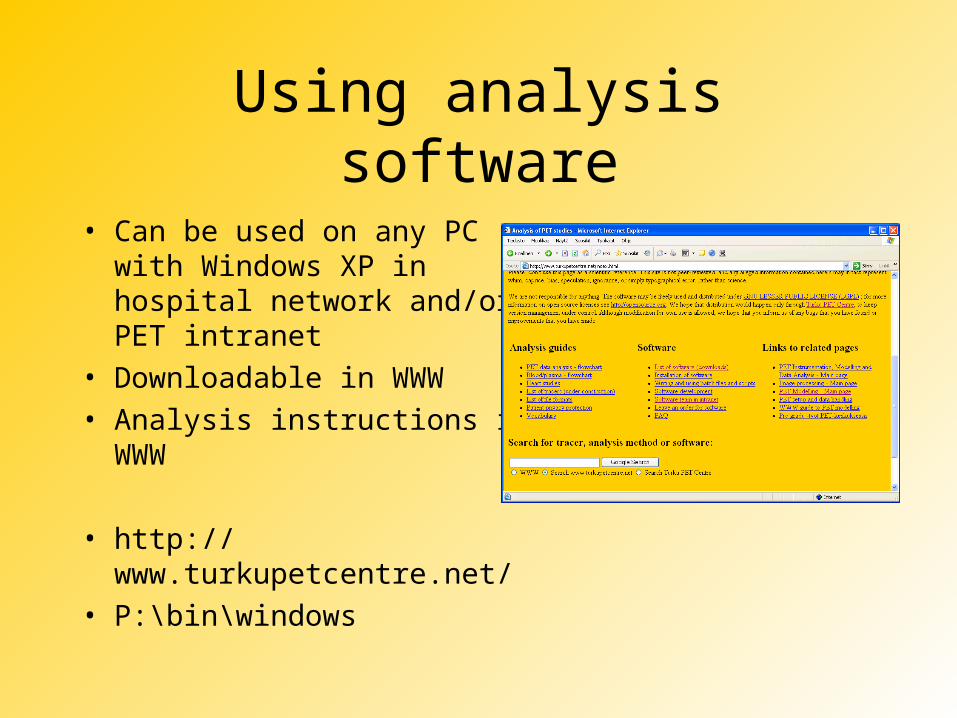
Using analysis software
• Can be used on any PCwith Windows XP inhospital network and/orPET intranet
• Downloadable in WWW• Analysis instructions in
WWW
• http://www.turkupetcentre.net/• P:\bin\windows
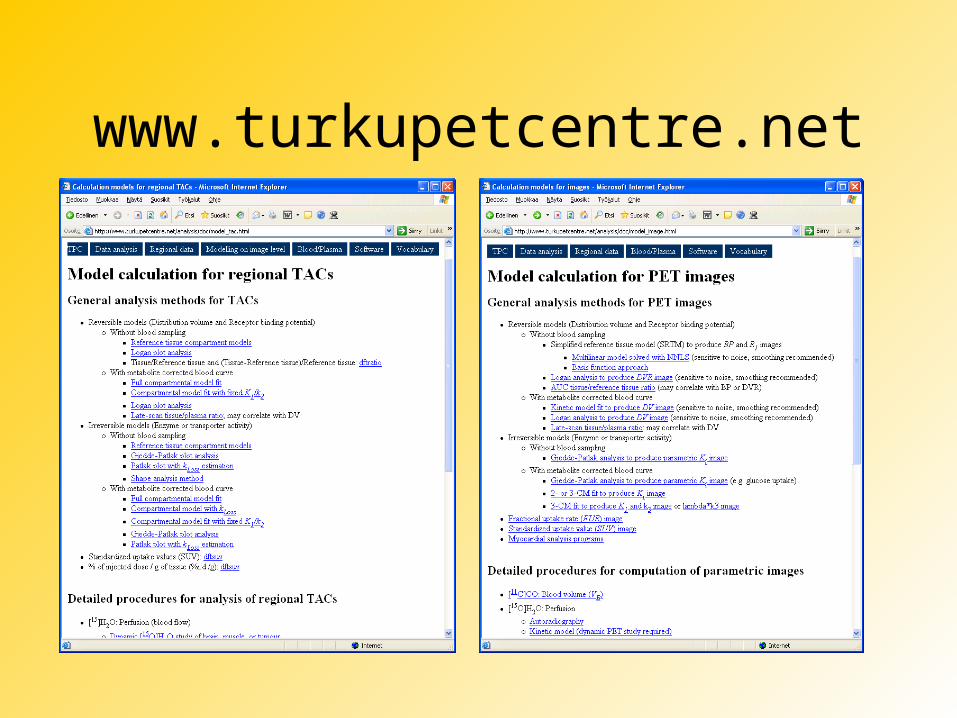
www.turkupetcentre.net
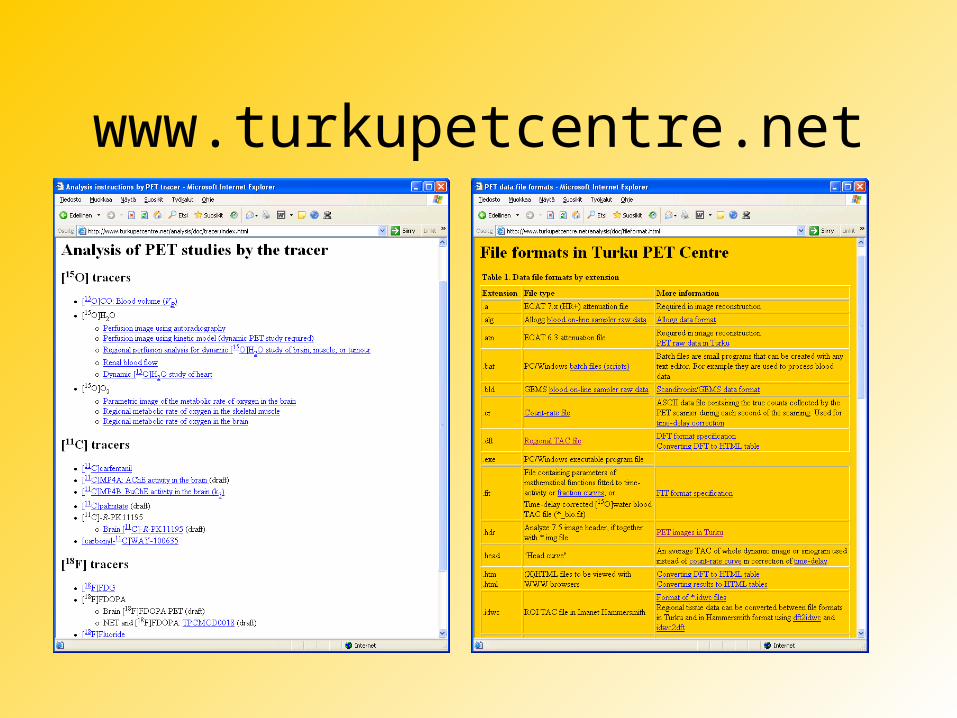
www.turkupetcentre.net
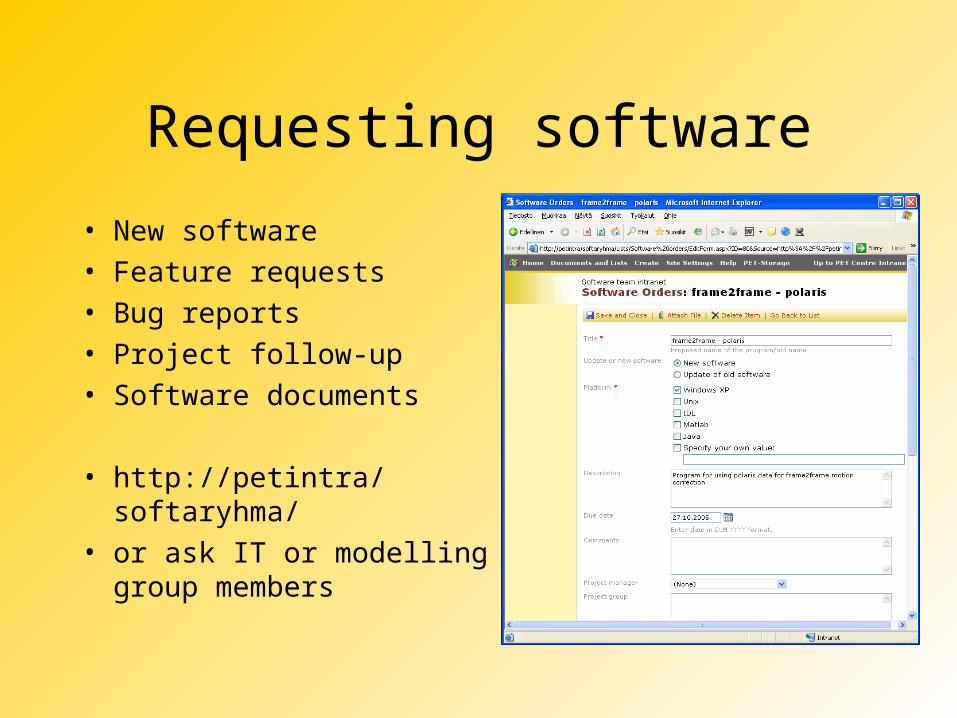
Requesting software
• New software• Feature requests• Bug reports• Project follow-up• Software documents
• http://petintra/softaryhma/
• or ask IT or modelling group members
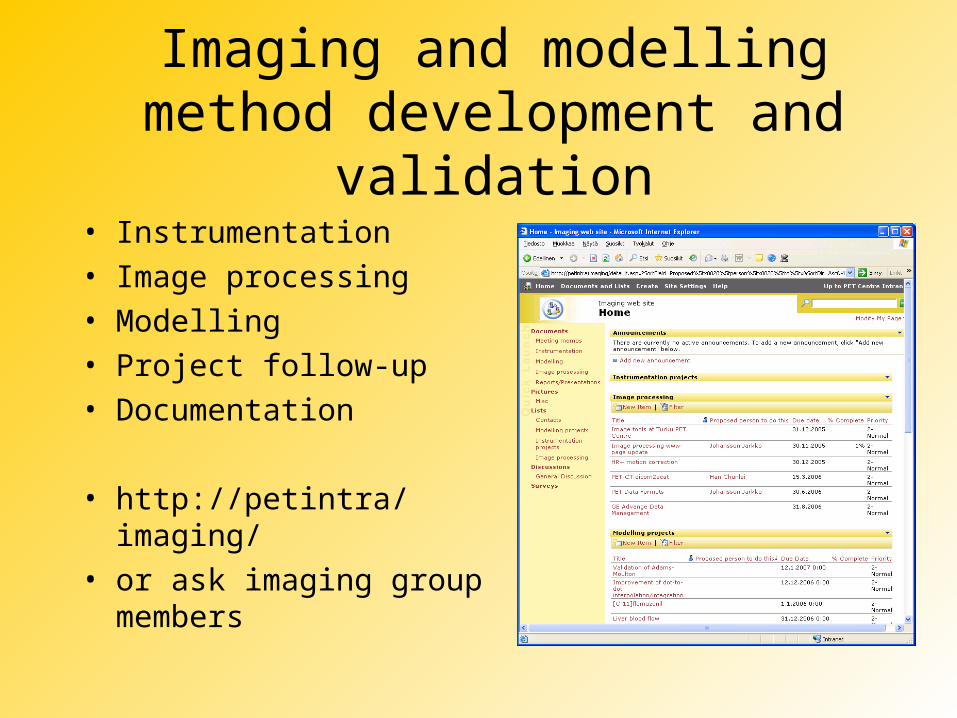
Imaging and modellingmethod development and
validation• Instrumentation• Image processing• Modelling• Project follow-up• Documentation
• http://petintra/imaging/• or ask imaging group
members