analysis of black-white differences in traffic stops and ... · analysis of black-white differences...
TRANSCRIPT

Analysis of Black-White Differences in Traffic Stops and Searches
in Concord, NC, 2002-2013
March 23, 2015
Frank R. Baumgartner, Derek Epp, and Kelsey Shoub1
University of North Carolina at Chapel Hill
Department of Political Science
http://www.unc.edu/~fbaum/traffic.htm
Contact: [email protected]
1 Baumgartner is the Richard J. Richardson Distinguished Professor of Political Science at UNC-
Chapel Hill. Epp and Shoub are graduate students in political science. We thank UNC
undergraduates Katherine B. Elliott, Amirah Jiwa, Morgan Herman, and Reena Gupta for
assistance on the logistics of this project. We also acknowledge the assistance of the NC
Department of Justice and State Bureau of Investigation for making available the official
statistics on which this analysis relies, and for answering technical questions about the
organization of this complex database.
Baumgartner, Epp, Shoub http://www.unc.edu/~fbaum/traffic.htm
2
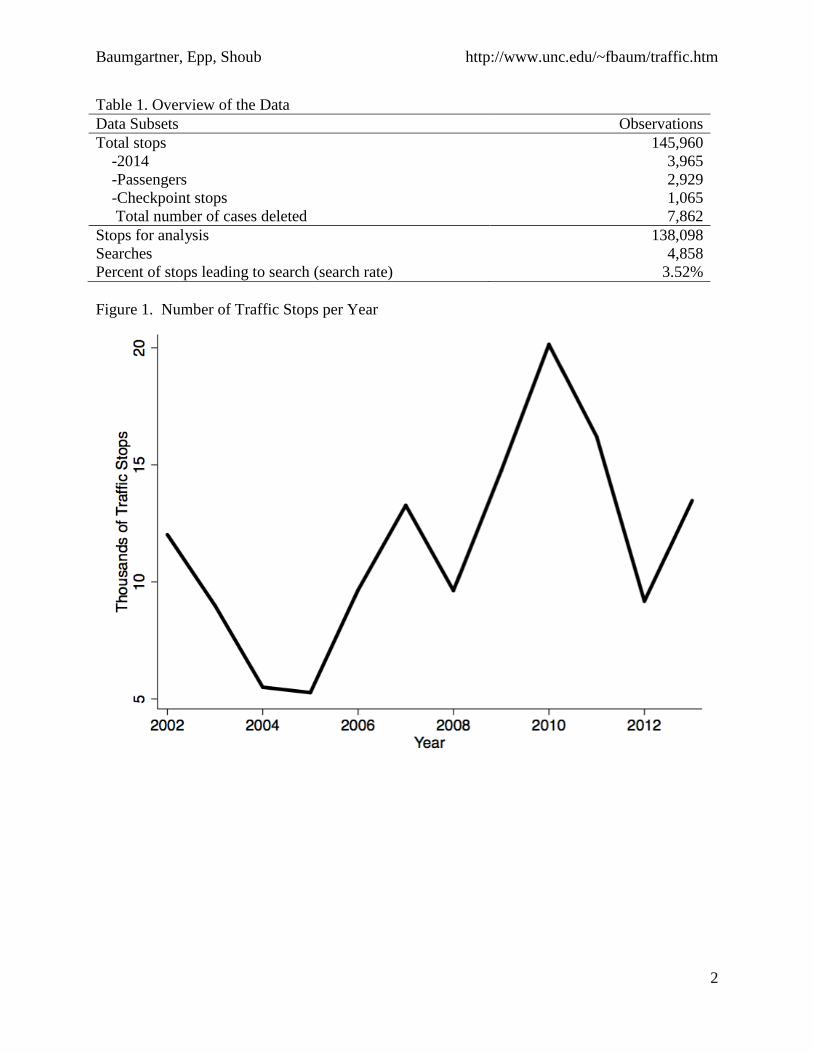
Table 1. Overview of the Data
Data Subsets Observations
Total stops 145,960
-2014 3,965
-Passengers 2,929
-Checkpoint stops 1,065
Total number of cases deleted 7,862
Stops for analysis 138,098
Searches 4,858
Percent of stops leading to search (search rate) 3.52%
Figure 1. Number of Traffic Stops per Year

Baumgartner, Epp, Shoub http://www.unc.edu/~fbaum/traffic.htm
3
Figure 2. Racial Composition of Traffic Stops by Year
Table 2. Racial Composition of Traffic Stops by Purpose, Drivers
Note: Includes only drivers. Excludes 1,065 checkpoint stops. Excludes 2,929 passengers.
Percent
Purpose Number White Black
Total Stops 138,098 71.81 26.37
Speed Limit 43,549 75.94 22.18
Stop Light/Sign 12,336 72.77 24.30
Driving Impaired 2,809 78.07 19.72
Safe Movement 15,540 71.81 26.17
Vehicle Equipment 22,400 67.26 31.16
Vehicle Regulatory 21,374 67.84 30.74
Seat Belt 6,167 73.73 25.02
Investigation 7,720 69.42 29.02
Other Vehicle 6,203 69.24 29.05

Baumgartner, Epp, Shoub http://www.unc.edu/~fbaum/traffic.htm
4
Table 3. Percent Searched by Race and Purpose of Stop
Ratio
Purpose Number % Total % White % Black Black:White
Total Stops 138,098 - 71.81 26.37 -
Total Searches 4,858 3.52 3.28 4.14 1.26
Speed Limit 43,549 1.39 1.18 2.13 1.81
Stop Light/Sign 12,336 1.81 1.57 2.57 1.64
Driving Impaired 2,809 32.15 34.52 21.66 0.63
Safe Movement 15,540 3.29 3.21 3.44 1.07
Vehicle Equipment 22,400 3.64 3.55 3.85 1.08
Vehicle Regulatory 21,374 2.69 2.49 3.11 1.25
Seat Belt 6,167 2.46 1.89 4.08 2.16
Investigation 7,720 10.51 9.05 14.15 1.56
Other Vehicle 6,203 4.24 3.31 6.22 1.88
Note: See the appendix for this same table broken down for Men and Women.
Figure 3. Difference in Likelihood of Being Searched, by Race and Type of Stop
-50 0 50 100 150 200 250Percent Difference
Seat Belt
Other Vehicle
Speed Limit
Stop Light/Sign
Investigation
Vehicle Regulatory
Vehicle Equipment
Safe Movement
Driving Impaired
The figure shows the percentage difference in the likelihood of Blacks being searchedas compared to Whites by purpose of stop.

Baumgartner, Epp, Shoub http://www.unc.edu/~fbaum/traffic.htm
5
Figure 4. Racial Differences in the Likelihood of Search
Figure 5. Racial Differences in the Liklihood of Search by Gender
Baumgartner, Epp, Shoub http://www.unc.edu/~fbaum/traffic.htm
6
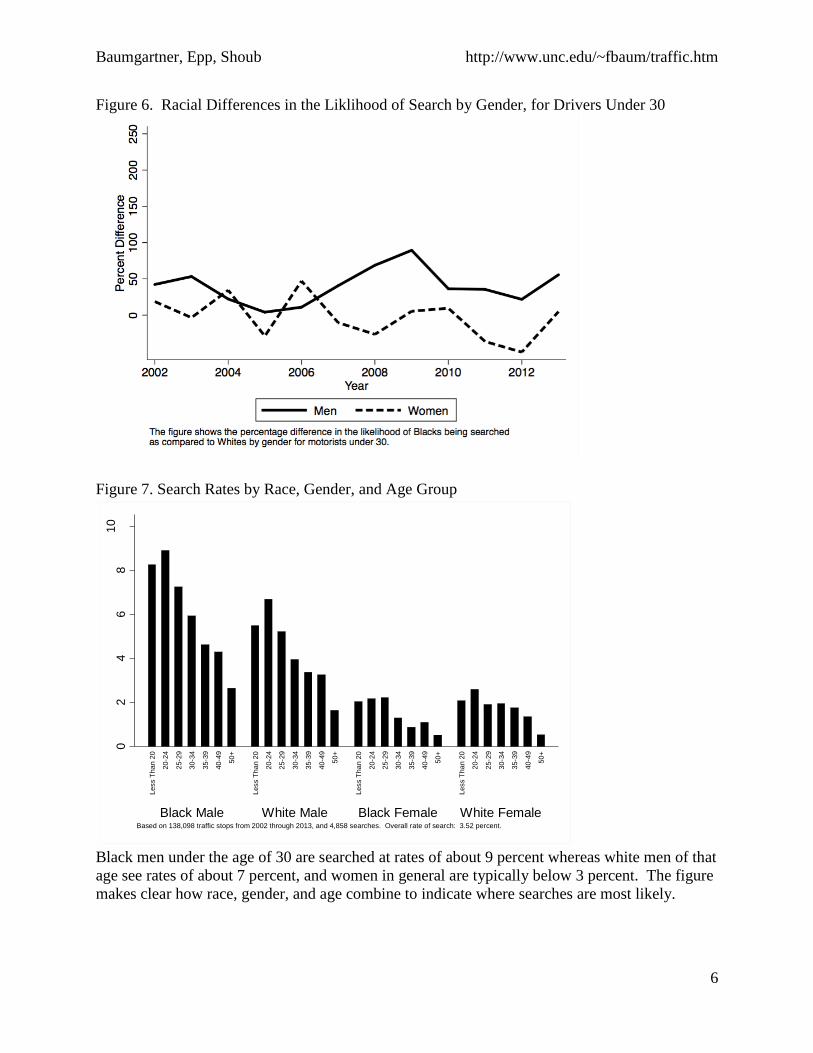
Figure 6. Racial Differences in the Liklihood of Search by Gender, for Drivers Under 30
Figure 7. Search Rates by Race, Gender, and Age Group
Black men under the age of 30 are searched at rates of about 9 percent whereas white men of that
age see rates of about 7 percent, and women in general are typically below 3 percent. The figure
makes clear how race, gender, and age combine to indicate where searches are most likely.
02
46
81
0
Black Male White Male Black Female White Female
Le
ss T
ha
n 2
0
20
-24
25
-29
30
-34
35
-39
40
-49
50
+
Le
ss T
ha
n 2
0
20
-24
25
-29
30
-34
35
-39
40
-49
50
+
Le
ss T
ha
n 2
0
20
-24
25
-29
30
-34
35
-39
40
-49
50
+
Le
ss T
ha
n 2
0
20
-24
25
-29
30
-34
35
-39
40
-49
50
+
Based on 138,098 traffic stops from 2002 through 2013, and 4,858 searches. Overall rate of search: 3.52 percent.

Baumgartner, Epp, Shoub http://www.unc.edu/~fbaum/traffic.htm
7
The patterns in Figure 7 are highly consistent over time. Figures 8 and 9 show the number of
stops, then searches, by the four race/gender groups.
Figure 8. Number of Stops, by Race and Gender
Figure 9. Percent of Stops Resulting in a Search, by Race and Gender
Baumgartner, Epp, Shoub http://www.unc.edu/~fbaum/traffic.htm
8
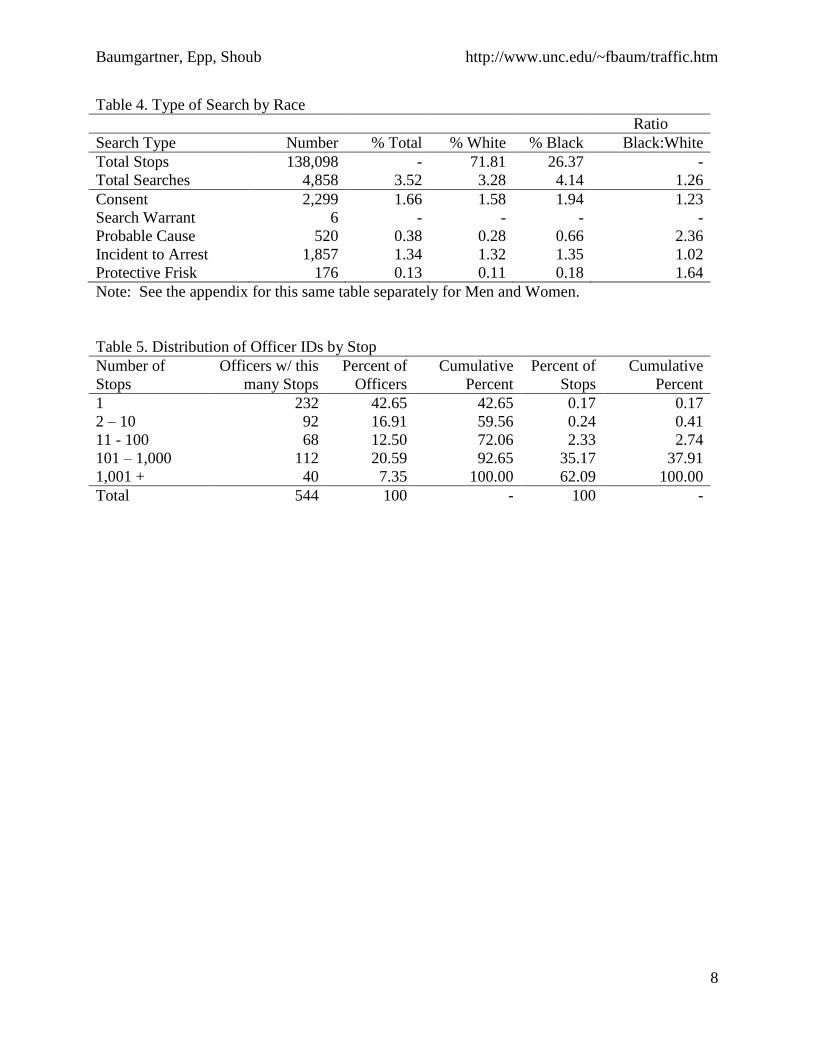
Table 4. Type of Search by Race
Ratio
Search Type Number % Total % White % Black Black:White
Total Stops 138,098 - 71.81 26.37 -
Total Searches 4,858 3.52 3.28 4.14 1.26
Consent 2,299 1.66 1.58 1.94 1.23
Search Warrant 6 - - - -
Probable Cause 520 0.38 0.28 0.66 2.36
Incident to Arrest 1,857 1.34 1.32 1.35 1.02
Protective Frisk 176 0.13 0.11 0.18 1.64
Note: See the appendix for this same table separately for Men and Women.
Table 5. Distribution of Officer IDs by Stop
Number of
Stops
Officers w/ this
many Stops
Percent of
Officers
Cumulative
Percent
Percent of
Stops
Cumulative
Percent
1 232 42.65 42.65 0.17 0.17
2 – 10 92 16.91 59.56 0.24 0.41
11 - 100 68 12.50 72.06 2.33 2.74
101 – 1,000 112 20.59 92.65 35.17 37.91
1,001 + 40 7.35 100.00 62.09 100.00
Total 544 100 - 100 -
Baumgartner, Epp, Shoub http://www.unc.edu/~fbaum/traffic.htm
9
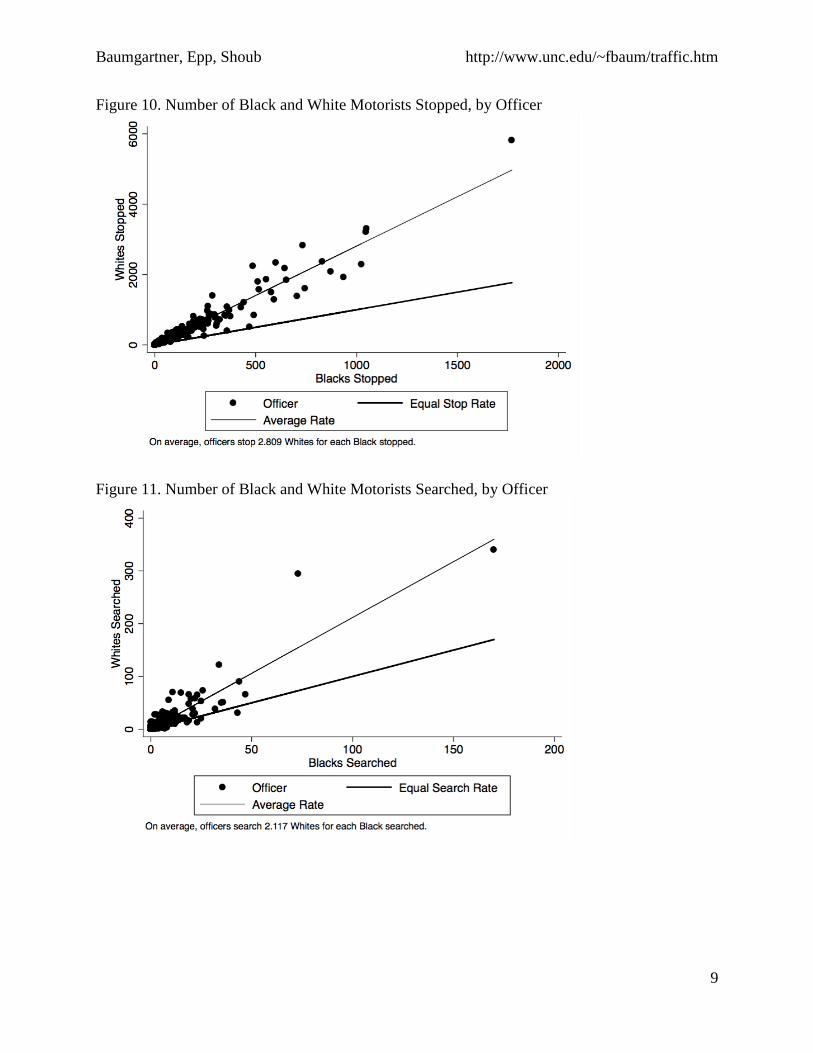
Figure 10. Number of Black and White Motorists Stopped, by Officer
Figure 11. Number of Black and White Motorists Searched, by Officer

Baumgartner, Epp, Shoub http://www.unc.edu/~fbaum/traffic.htm
10
Figure 12. Percent of White and Black Drivers Searched, by Officer

Baumgartner, Epp, Shoub http://www.unc.edu/~fbaum/traffic.htm
11
Table 6. Predicting the Occurrence of a Search, Male Drivers
Variable Model 1 Model 2 Model 3 Model 4 Model 5
Demographics
Race 1.62*(0.06) 1.57*(0.06) 1.56*(0.06) 1.58*(0.06) 1.53*(0.06)
Hispanic 1.78*(0.08) 1.58*(0.07) 1.19*(0.06) 1.20*(0.06) 1.22*(0.06)
Age - 0.97*(0.00) 0.97*(0.00) 0.97*(0.00) 0.97*(0.00)
Stop Purpose
Speed Limit - - - - -
Stop Light - - 1.13 (0.10) 1.11 (0.10) 1.06 (0.10)
Impaired - - 27.52*(1.82) 27.24*(1.80) 20.05*(1.40)
Movement - - 1.96*(0.13) 1.94*(0.13) 1.68*(0.12)
Equipment - - 2.02*(0.12) 1.99*(0.12) 1.60*(0.10)
Regulatory - - 1.69*(0.11) 1.67*(0.11) 1.62*(0.11)
Seat Belt - - 1.29*(0.13) 1.28*(0.13) 1.47*(0.15)
Investigation - - 5.54*(0.35) 5.38*(0.34) 4.69*(0.30)
Other - - 2.34*(0.20) 2.32*(0.20) 2.11*(0.18)
Officer Type
Black Disparityϯ - - - 1.25*(0.12) 1.24*(0.12)
White Disparityϯ - - - 2.73*(0.25) 2.69*(0.25)
Time
Hour of Day - - - - Included
Day of Week - - - - Included
Constant 0.04*(0.00) 0.12*(0.01) 0.06*(0.00) 0.06*(0.00) 0.09*(0.01)
N 82,040 82,040 82,040 82,040 80,121
Pseudo R2 0.008 0.025 0.118 0.122 0.132
Note: Entries are odds-ratios, with standard errors in parenthesis.
Note: The number of observations is smaller for Model 5 because the “hour of stop” variable is
missing in some cases.
* p < 0.05
ϯ See Figure 12 for an explanation of the identification of high disparity officers.

Baumgartner, Epp, Shoub http://www.unc.edu/~fbaum/traffic.htm
12
Table 7. Predicting the Occurrence of a Search, Female Drivers
Variable Model 1 Model 2 Model 3 Model 4 Model 5
Demographics
Race 0.79*(0.06) 0.79*(0.06) 0.73*(0.06) 0.73*(0.06) 0.72*(0.06)
Hispanic 0.32*(0.07) 0.29*(0.07) 0.19*(0.04) 0.19*(0.04) 0.20*(0.04)
Age - 0.97*(0.00) 0.97*(0.00) 0.97*(0.00) 0.97*(0.00)
Stop Purpose
Speed Limit - - - - -
Stop Light - - 2.28*(0.41) 2.24*(0.40) 2.14*(0.39)
Impaired - - 55.33*(7.83) 55.36*(7.85) 32.67*(5.02)
Movement - - 3.71*(0.56) 3.70*(0.56) 3.05*(0.47)
Equipment - - 3.86*(0.53) 3.85*(0.53) 2.77*(0.40)
Regulatory - - 2.90*(0.41) 2.91*(0.42) 2.69*(0.39)
Seat Belt - - 2.76*(0.67) 2.72*(0.67) 3.14*(0.77)
Investigation - - 19.22*(2.56) 18.58*(2.48) 13.81*(1.92)
Other - - 4.64*(0.89) 4.67*(0.89) 3.79*(0.74)
Officer Type
Black Disparityϯ - - - 1.01 (0.23) 0.96 (0.22)
White Disparityϯ - - - 2.94*(0.53) 2.65*(0.49)
Time
Hour of Day - - - - Included
Day of Week - - - - Included
Constant 0.02*(0.00) 0.06*(0.00) 0.01*(0.00) 0.01*(0.00) 0.02*(0.00)
N 53,542 53,542 53,542 53,542 52,437
Pseudo R2 0.005 0.020 0.138 0.141 0.157
Note: Entries are odds-ratios, with standard errors in parenthesis.
Note: The number of observations is smaller for Model 5 because the “hour of stop” variable is
missing in some cases.
* p < 0.05
ϯ See Figure 12 for an explanation of the identification of high disparity officers.
Baumgartner, Epp, Shoub http://www.unc.edu/~fbaum/traffic.htm
13
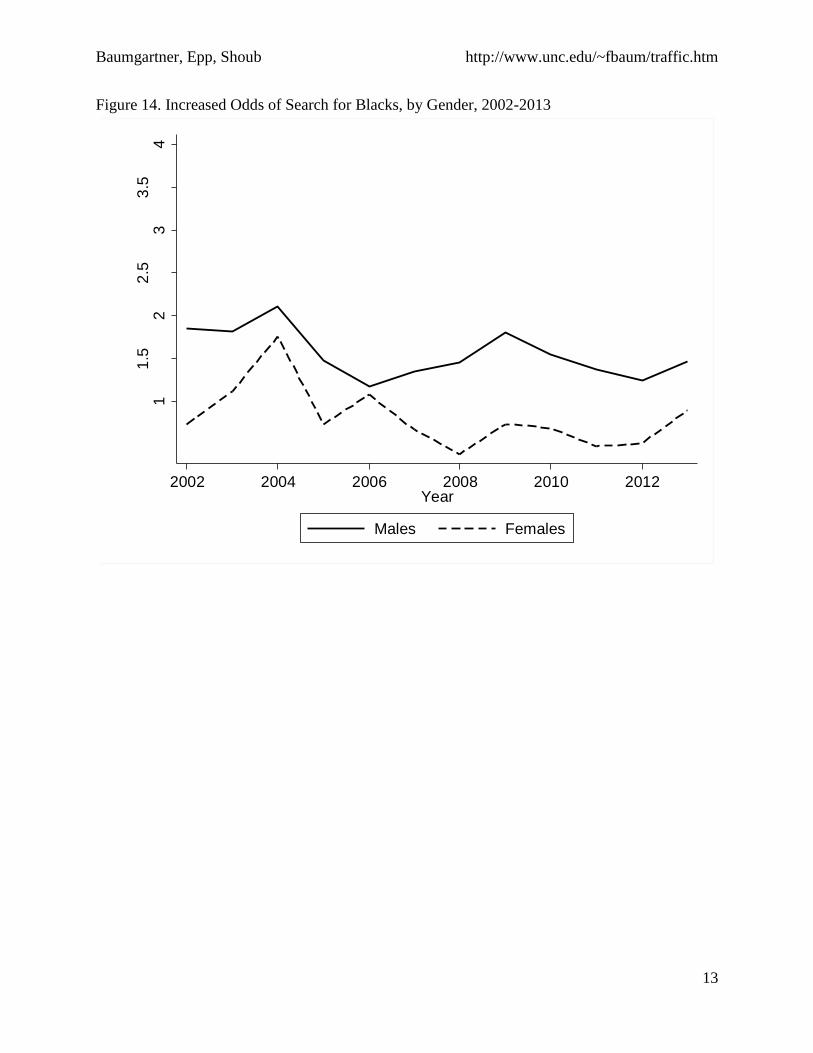
Figure 14. Increased Odds of Search for Blacks, by Gender, 2002-2013
11
.52
2.5
33
.54
Diffe
ren
ce in
Odd
s o
f B
ein
g S
earc
hed
for
Bla
cks a
s C
om
pare
d to
White
s
2002 2004 2006 2008 2010 2012Year
Males Females
Baumgartner, Epp, Shoub http://www.unc.edu/~fbaum/traffic.htm
14
Appendix
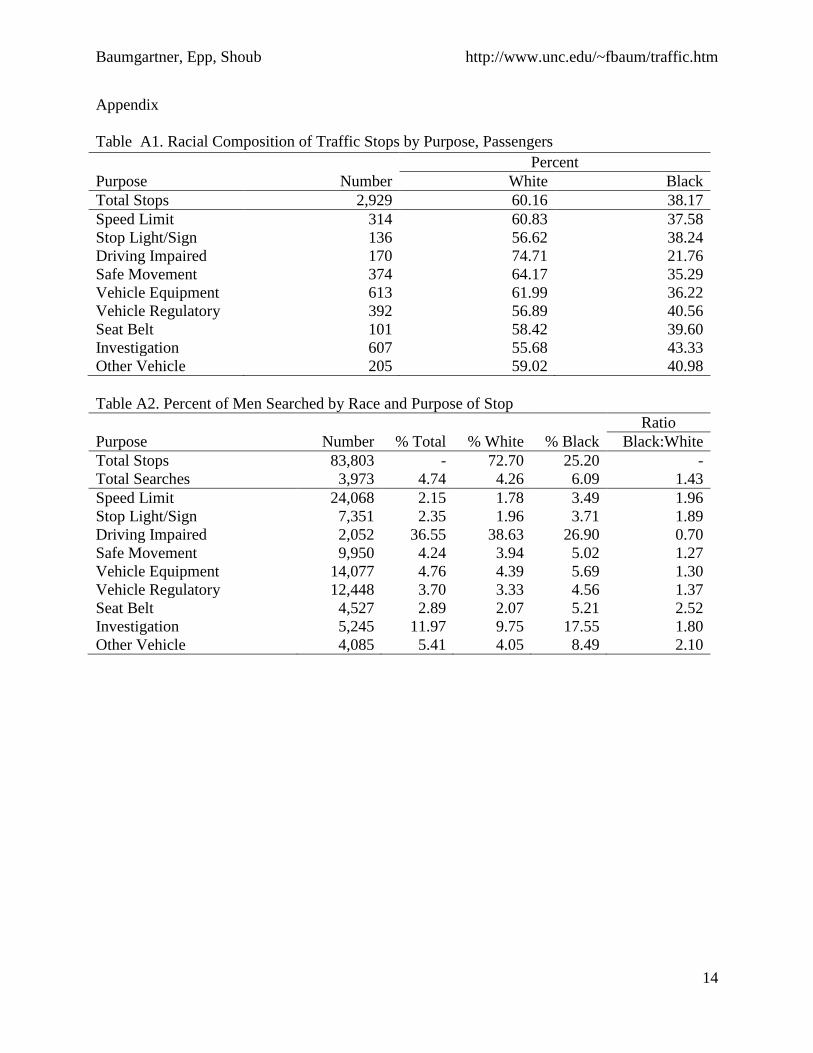
Table A1. Racial Composition of Traffic Stops by Purpose, Passengers
Table A2. Percent of Men Searched by Race and Purpose of Stop
Ratio
Purpose Number % Total % White % Black Black:White
Total Stops 83,803 - 72.70 25.20 -
Total Searches 3,973 4.74 4.26 6.09 1.43
Speed Limit 24,068 2.15 1.78 3.49 1.96
Stop Light/Sign 7,351 2.35 1.96 3.71 1.89
Driving Impaired 2,052 36.55 38.63 26.90 0.70
Safe Movement 9,950 4.24 3.94 5.02 1.27
Vehicle Equipment 14,077 4.76 4.39 5.69 1.30
Vehicle Regulatory 12,448 3.70 3.33 4.56 1.37
Seat Belt 4,527 2.89 2.07 5.21 2.52
Investigation 5,245 11.97 9.75 17.55 1.80
Other Vehicle 4,085 5.41 4.05 8.49 2.10
Percent
Purpose Number White Black
Total Stops 2,929 60.16 38.17
Speed Limit 314 60.83 37.58
Stop Light/Sign 136 56.62 38.24
Driving Impaired 170 74.71 21.76
Safe Movement 374 64.17 35.29
Vehicle Equipment 613 61.99 36.22
Vehicle Regulatory 392 56.89 40.56
Seat Belt 101 58.42 39.60
Investigation 607 55.68 43.33
Other Vehicle 205 59.02 40.98

Baumgartner, Epp, Shoub http://www.unc.edu/~fbaum/traffic.htm
15
Table A3. Percent of Women Searched by Race and Purpose of Stop
Ratio
Purpose Number % Total % White % Black Black:White
Total Stops 54,294 - 70.44 28.17 -
Total Searches 885 1.63 1.72 1.45 0.84
Speed Limit 19,481 0.45 0.42 0.60 1.43
Stop Light/Sign 4,984 1.00 0.98 1.08 1.10
Driving Impaired 757 20.21 23.30 8.75 0.38
Safe Movement 5,590 1.59 1.82 1.15 0.63
Vehicle Equipment 8,323 1.74 2.04 1.25 0.61
Vehicle Regulatory 8,926 1.28 1.26 1.32 1.05
Seat Belt 1,640 1.28 1.41 0.97 0.69
Investigation 2,475 7.39 7.53 7.29 0.97
Other Vehicle 2,118 1.98 1.82 2.27 1.25
Table A4. Type of Search by Race: Men
Ratio
Search Type Number % Total % White % Black Black:White
Total Stops 83,803 - 72.70 25.20 -
Total Searches 3,973 4.74 4.26 6.09 1.43
Consent 1,847 2.20 2.00 2.86 1.43
Search Warrant 5 - - - -
Probable Cause 421 0.50 0.36 0.95 2.64
Incident to Arrest 1,532 1.83 1.74 1.97 1.13
Protective Frisk 168 0.20 0.16 0.29 1.81

Baumgartner, Epp, Shoub http://www.unc.edu/~fbaum/traffic.htm
16
Table A5. Type of Search by Race: Women
Ratio
Search Type Number % Total % White % Black Black:White
Total Stops 54,294 - 70.44 28.17 -
Total Searches 885 1.63 1.72 1.45 0.84
Consent 452 0.83 0.91 0.67 0.74
Search Warrant 1 - - - -
Probable Cause 99 0.18 0.15 0.27 1.80
Incident to Arrest 325 0.60 0.64 0.50 0.78
Protective Frisk 8 0.01 0.02 0.01 0.50
Figure A6. Stops by Day of the Week

Baumgartner, Epp, Shoub http://www.unc.edu/~fbaum/traffic.htm
17
Figure A7. Searches by Day of the Week
Figure A8. Stops by Hour of the Day

Baumgartner, Epp, Shoub http://www.unc.edu/~fbaum/traffic.htm
18
Figure A9. Searches by Hour of the Day
Figure A10. Correlation Between Percent Difference in Likelihood of Black Men being Searched
as Compared to Whites and Odds-Ratios from Logistic Regression
Baumgartner, Epp, Shoub http://www.unc.edu/~fbaum/traffic.htm
19
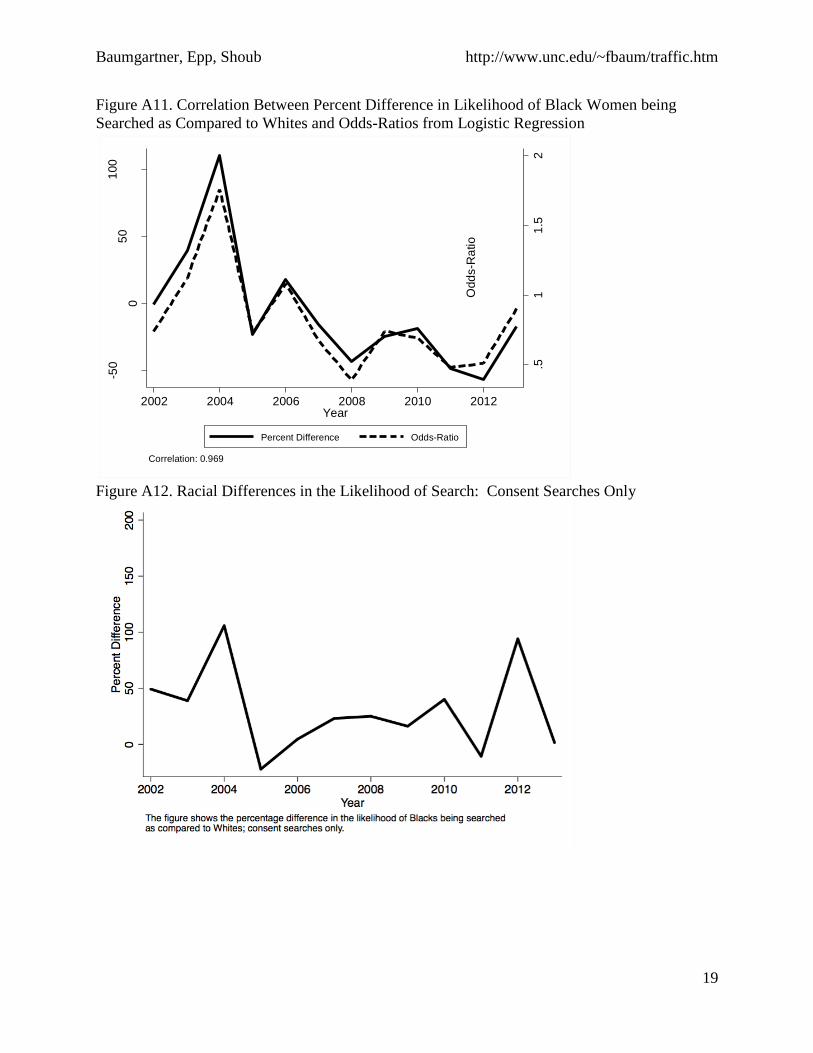
Figure A11. Correlation Between Percent Difference in Likelihood of Black Women being
Searched as Compared to Whites and Odds-Ratios from Logistic Regression
Figure A12. Racial Differences in the Likelihood of Search: Consent Searches Only
.51
1.5
2
Odd
s-R
atio
-50
05
01
00
Pe
rcen
t D
iffe
rence
2002 2004 2006 2008 2010 2012Year
Percent Difference Odds-Ratio
Correlation: 0.969

Baumgartner, Epp, Shoub http://www.unc.edu/~fbaum/traffic.htm
20
Table A6. Likelihood of Finding Contraband Given a Search, by Race
Contraband Number % Total % White % Black
Yes 1,148 23.63 22.43 26.59
No 3,710 76.37 77.57 73.41
Total 4,858 100.00 100.00 100.00
Table A7. Differential Outcomes by Whether or not a Search Occurs
Race Search
Occur
N No
Action
Verbal
Warning
Written
Warning
Citation
Issued Arrest Total
White No 95,914 2.68 42.41 1.91 52.00 1.00 100.0
Black No 34,906 3.18 48.38 1.60 45.82 1.01 100.0
Total No 133,239 2.80 43.95 1.82 50.43 1.01 100.0
White Yes
3,254 1.44 14.66 0.46 31.68 51.75 100.0
Black Yes 1,508 0.99 15.85 0.46 36.87 45.82 100.0
Total Yes 4,858 1.30 14.99 0.45 33.12 50.14 100.0