analog transmission - kennesaw state universityksuweb.kennesaw.edu/~vclincy/3510chapter5.pdf ·...
TRANSCRIPT
Analog Transmission
In Chapter 3, we discussed the advantages and disadvantages of digital and analog transmission. We saw that while digital transmission is very desirable, a low-pass channel is needed. We also saw that analog transmission is the only choice if we have a bandpass channel. Digital transmission was discussed in Chapter 4; we discuss analog transmission in this chapter.
Converting digital data to a bandpass analog signal is traditionally called digital-to-analog conversion. Converting a low-pass analog signal to a bandpass analog signal is traditionally called analog-to-analog conversion. In this chapter, we discuss these two types of conversions.
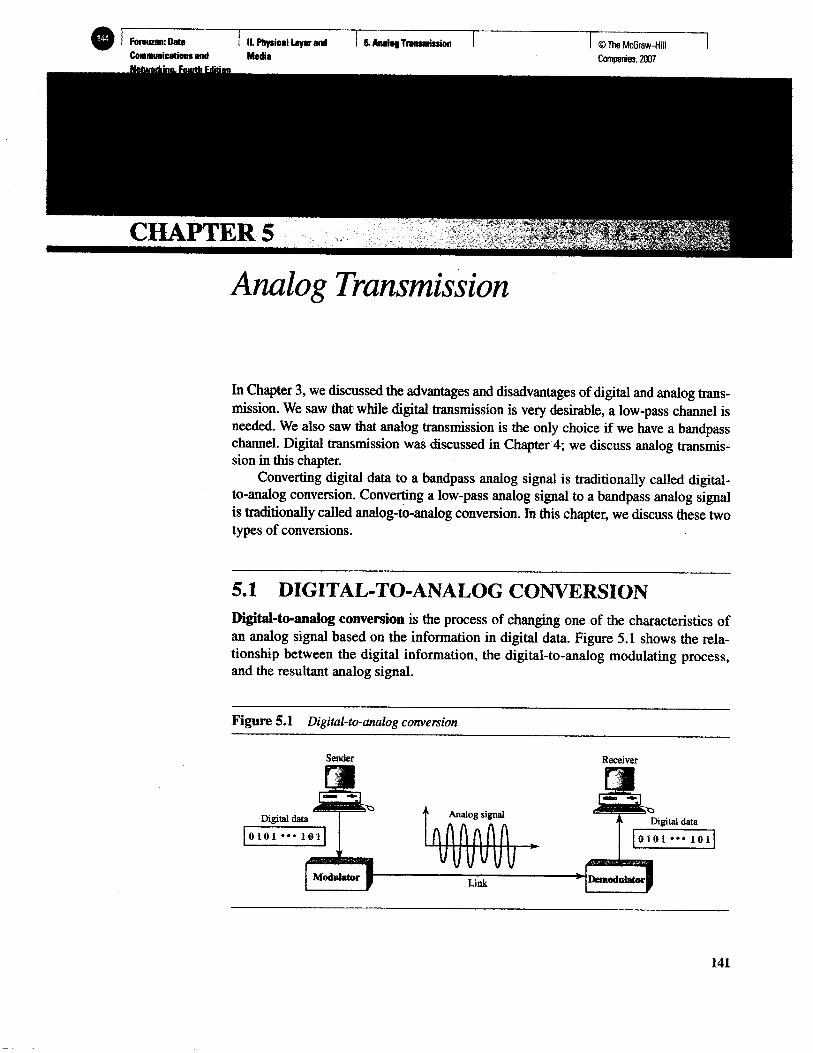
5.1 DIGITAL-TO-ANALOG CONVERSION Digital-to-analog conversion is the process of changing one of the characteristics of an analog signal based on the information in digital data. Figure 5.1 shows the relationship between the digital information, the digital-to-analog modulating process, and the resultant analog signal.
Figure 5.1 Digital-to-analog conversion
141

Analog Transmission
In Chapter 3, we discussed the advantages and disadvantages of digital and analog transmission. We saw that while digital transmission is very desirable, a low-pass channel is needed. We also saw that analog transmission is the only choice if we have a bandpass channel. Digital transmission was discussed in Chapter 4; we discuss analog transmission in this chapter.
Converting digital data to a bandpass analog signal is traditionally called digital-to-analog conversion. Converting a low-pass analog signal to a bandpass analog signal is traditionally called analog-to-analog conversion. In this chapter, we discuss these two types of conversions.
5.1 DIGITAL-TO-ANALOG CONVERSION Digital-to-analog conversion is the process of changing one of the characteristics of an analog signal based on the information in digital data. Figure S.l shows the relationship between the digital information, the digital-to-analog modulating process, and the resultant analog signal.
Figure 5.1 Digital-to-analog conversion
Sender Receiver a a 01
141

Forouzan: Data I II. Physical Layer and I 5. Analog Transmission T I © The McGraw-Hill I
Communications and Media Companies, 2007
Networking, Fourth Edition
142 CHAPTER 5 ANALOG TRANSMISSION
As discussed in Chapter 3, a sine wave is defined by three characteristics: amplitude, frequency, and phase. When we vary any one of these characteristics, we create a different version of that wave. So, by changing one characteristic of a simple electric signal, we can use it to represent digital data. Any of the three characteristics can be altered in this way, giving us at least three mechanisms for modulating digital data into an analog signal: amplitude shift keying (ASK), frequency shift keying (FSK), and phase shift keying (PSK). In addition, there is a fourth (and better) mechanism that combines changing both the amplitude and phase, called quadrature amplitude modulation (QAM). Q A M is the most efficient of these options and is the mechanism commonly used today (see Figure 5.2).
Figure 5.2 Types of digital-to-analog conversion
Digital-to-analog conversion
Amplitude shift keying (ASK)
Frequency shift keying (FSK)
Phase shift keying (PSK)
Quadrature amplitude modulation (QAM)
Aspects of Digital-to-Analog Conversion Before we discuss specific methods of digital-to-analog modulation, two basic issues must be reviewed: bit and baud rates and the carrier signal.
Data Element Versus Signal Element
In Chapter 4, we discussed the concept of the data element versus the signal element. We defined a data element as the smallest piece of information to be exchanged, the bit. We also defined a signal element as the smallest unit of a signal that is constant. Although we continue to use the same terms in this chapter, we will see that the nature of the signal element is a little bit different in analog transmission.
Data Rate Versus Signal Rate
We can define the data rate (bit rate) and the signal rate (baud rate) as we did for digital transmission. The relationship between them is
S=Nx 1 baud r
where TV is the data rate (bps) and r is the number of data elements carried in one signal element. The value of r in analog transmission is r = log 2 L, where L is the type of signal element, not the level. The same nomenclature is used to simplify the comparisons.
Forouzan: Data I II. Physical Layer and I 5. Analog Transmission I I © The McGraw-Hill
Communications and Media Companies, 2007
Networking, Fourth Edition
SECTION 5.1 DIGITAL-TO-ANALOG CONVERSION 143
Bit rate is the number of bits per second. Baud rate is the number of signal elements per second. In the analog transmission of digital data,
the baud rate is less than or equal to the bit rate.
The same analogy we used in Chapter 4 for bit rate and baud rate applies here. In transportation, a baud is analogous to a vehicle, and a bit is analogous to a passenger. We need to maximize the number of people per car to reduce the traffic.
Example 5.1 An analog signal carries 4 bits per signal element. If 1000 signal elements are sent per second, find the bit rate.
Solution In this case, r = 4, S = 1000, and 7V is unknown. We can find the value of TV from
S = Nx- or N = Sxr= 1000 x 4 = 4000bps r
Example 5.2 An analog signal has a bit rate of 8000 bps and a baud rate of 1000 baud. How many data elements are carried by each signal element? How many signal elements do we need?
Solution In this example, S - 1000, N = 8000, and r and L are unknown. We find first the value of r and then the value of L.
S = Nx± —• r = ^ = ^ ° 0 =8bits/baud r S 1000
>=log 2L L = 2 r = 2 8 = 256
Bandwidth
The required bandwidth for analog transmission of digital data is proportional to the signal rate except for FSK, in which the difference between the carrier signals needs to be added. We discuss the bandwidth for each technique.
Carrier Signal
In analog transmission, the sending device produces a high-frequency signal that acts as a base for the information signal. This base signal is called the carrier signal or carrier frequency. The receiving device is tuned to the frequency of the carrier signal that it expects from the sender. Digital information then changes the carrier signal by modifying one or more of its characteristics (amplitude, frequency, or phase). This kind of modification is called modulation (shift keying).
Amplitude Shift Keying In amplitude shift keying, the amplitude of the carrier signal is varied to create signal elements. Both frequency and phase remain constant while the amplitude changes.
Forouzan: Data I II. Physical Layer and I 5. Analog Transmission I I © The McGraw-Hill
Communications and Media Companies, 2007
Networking, Fourth Edition
144 CHAPTER 5 ANALOG TRANSMISSION
Binary ASK (BASK)
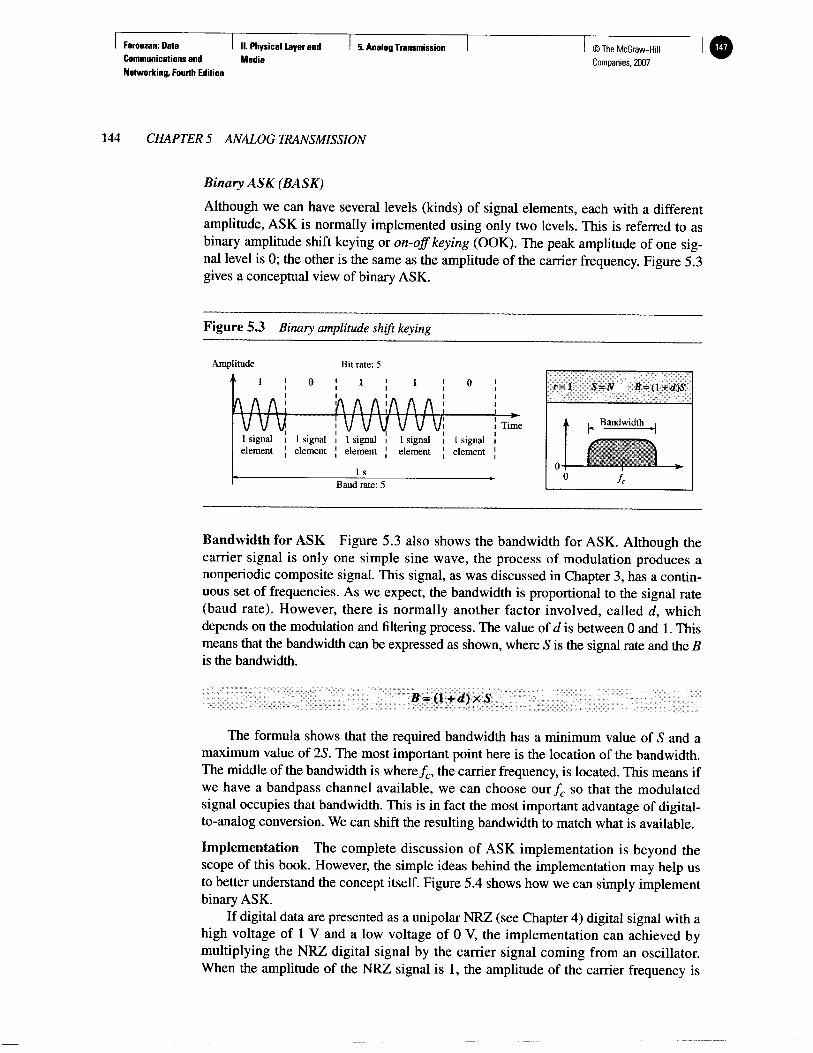
Although we can have several levels (kinds) of signal elements, each with a different amplitude, A S K is normally implemented using only two levels. This is referred to as binary amplitude shift keying or on-off keying (OOK). The peak amplitude of one signal level is 0; the other is the same as the amplitude of the carrier frequency. Figure 5.3 gives a conceptual view of binary ASK.
Figure 5.3 Binary amplitude shift keying
Amplitude Bit rate: 5
1
MA : » i t
! 1 ! 1 0 1
Vvl j iVvv VVv i Time
1 signal i 1 signal i 1 signal i 1 signal 1 signal i element | element ] element ] element element !
1 s Baud rate: 5
r=l S = N B = (\+d)S
Bandwidth
Bandwidth for A S K Figure 5.3 also shows the bandwidth for A S K . Although the carrier signal is only one simple sine wave, the process of modulation produces a nonperiodic composite signal. This signal, as was discussed in Chapter 3, has a continuous set of frequencies. As we expect, the bandwidth is proportional to the signal rate (baud rate). However, there is normally another factor involved, called d, which depends on the modulation and filtering process. The value of d is between 0 and 1. This means that the bandwidth can be expressed as shown, where S is the signal rate and the B is the bandwidth.
B = (l+d)xS
The formula shows that the required bandwidth has a minimum value of 5 and a maximum value of 25. The most important point here is the location of the bandwidth. The middle of the bandwidth is where fc, the carrier frequency, is located. This means if we have a bandpass channel available, we can choose our fc so that the modulated signal occupies that bandwidth. This is in fact the most important advantage of digital-to-analog conversion. We can shift the resulting bandwidth to match what is available.
Implementation The complete discussion of A S K implementation is beyond the scope of this book. However, the simple ideas behind the implementation may help us to better understand the concept itself. Figure 5.4 shows how we can simply implement binary ASK.
If digital data are presented as a unipolar NRZ (see Chapter 4) digital signal with a high voltage of 1 V and a low voltage of 0 V, the implementation can achieved by multiplying the N R Z digital signal by the carrier signal coming from an oscillator. When the amplitude of the NRZ signal is 1, the amplitude of the carrier frequency is

Forouzan: Data I II. Physical Layer and I 5. Analog Transmission I I © The McGraw-Hill
Communications and Media Companies, 2007
Networking, Fourth Edition
SECTION 5.1 DIGITAL-TO-ANALOG CONVERSION US
Figure 5,4 Implementation of binary ASK
i i i i i
held; when the amplitude of the NRZ signal is 0, the amplitude of the carrier frequency is zero.
Example 5.3 We have an available bandwidth of 100 kHz which spans from 200 to 300 kHz. What are the carrier frequency and the bit rate if we modulated our data by using ASK with d=l?
Solution The middle of the bandwidth is located at 250 kHz. This means that our carrier frequency can be at/c = 250 kHz. We can use the formula for bandwidth to find the bit rate (with d = 1 and r = 1).
B = (l+d)xS=2 xNx - = 2xA/=100kHz —•* A/=• 50kbps
Example 5.4 In data communications, we normally use full-duplex links with communication in both directions. We need to divide the bandwidth into two with two carrier frequencies, as shown in Figure 5.5. The figure shows the positions of two carrier frequencies and the bandwidths.The available bandwidth for each direction is now 50 kHz, which leaves us with a data rate of 25 kbps in each direction.
Figure 5.5 Bandwidth of full-duplex ASK used in Example 5.4
^ g = 50kHz ^ fl = 50kHz ^
200 (225) (275) 300
Multilevel ASK
The above discussion uses only two amplitude levels. We can have multilevel A S K in which there are more than two levels. We can use 4, 8,16, or more different amplitudes for the signal and modulate the data using 2, 3, 4, or more bits at a time. In these cases,
Forouzan: Data I II. Physical Layer and I 5. Analog Transmission I I © The McGraw-Hill
Communications and Media Companies. 2007
Networking, Fourth Edition
146 CHAPTER 5 ANALOG TRANSMISSION
r = 2, r = 3, r = 4, and so on. Although this is not implemented with pure ASK, it is implemented with Q A M (as we will see later).
Frequency Shift Keying In frequency shift keying, the frequency of the carrier signal is varied to represent data. The frequency of the modulated signal is constant for the duration of one signal element, but changes for the next signal element if the data element changes. Both peak amplitude and phase remain constant for all signal elements.
Binary FSK (BFSK)
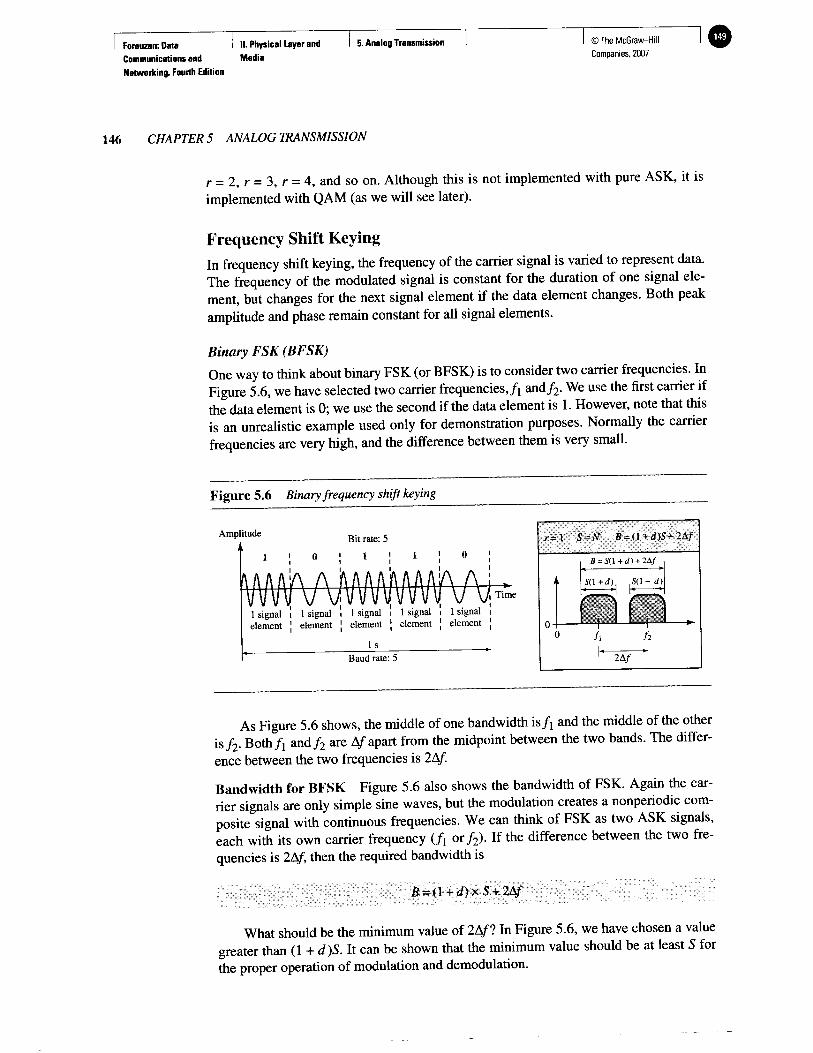
One way to think about binary FSK (or BFSK) is to consider two carrier frequencies. In Figure 5.6, we have selected two carrier frequencies,/! and^. We use the first carrier if the data element is 0; we use the second if the data element is 1. However, note that this is an unrealistic example used only for demonstration purposes. Normally the carrier frequencies are very high, and the difference between them is very small.
Figure 5.6 Binary frequency shift keying
Amplitude
1 1 0
Bit rate: 5
1 1 1 ' 0
1 signal i 1 signal i I signal i 1 signal i 1 signal element ! element ! element ! element ! element
Time
1 s Baud rate: 5
r = t S = N B = (l+d)S+2Af
B = S(l+d) + 2Af
S(l+d), 5(1 + d)
Q 2A/
h
-A
As Figure 5.6 shows, the middle of one bandwidth is/1 and the middle of the other is/2. Both/1 and/2 3 1 6 A/apart from the midpoint between the two bands. The difference between the two frequencies is 2A/
Bandwidth for B F S K Figure 5.6 also shows the bandwidth of FSK. Again the carrier signals are only simple sine waves, but the modulation creates a nonperiodic composite signal with continuous frequencies. We can think of FSK as two A S K signals, each with its own carrier frequency ( / 1 or / 2 ) . If the difference between the two frequencies is 2A/, then the required bandwidth is
B = (l +d)xS + 2Af
What should be the minimum value of 2Af? In Figure 5.6, we have chosen a value greater than (1 + d)S. It can be shown that the minimum value should be at least S for the proper operation of modulation and demodulation.
Forouzan: Data I II. Physical Layer and I 5. Analog Transmission I I © The McGraw-Hill
Communications and Media Companies, 2007
Networking. Fourth Edition
SECTION 5.1 DIGITAL-TO-ANALOG CONVERSION 147
Example 5.5
We have an available bandwidth of 100 kHz which spans from 200 to 300 kHz. What should be the carrier frequency and the bit rate if we modulated our data by using FSK with d=ll
Solution This problem is similar to Example 5.3, but we are modulating by using FSK. The midpoint of the band is at 250 kHz. We choose 2Af to be 50 kHz; this means
B = (l +d)xS +2A/ = 100 —** 25=50kHz S = 25kbaud A/=25kbps
Compared to Example 5.3, we can see the bit rate for ASK is 50 kbps while the bit rate for FSK is 25 kbps.
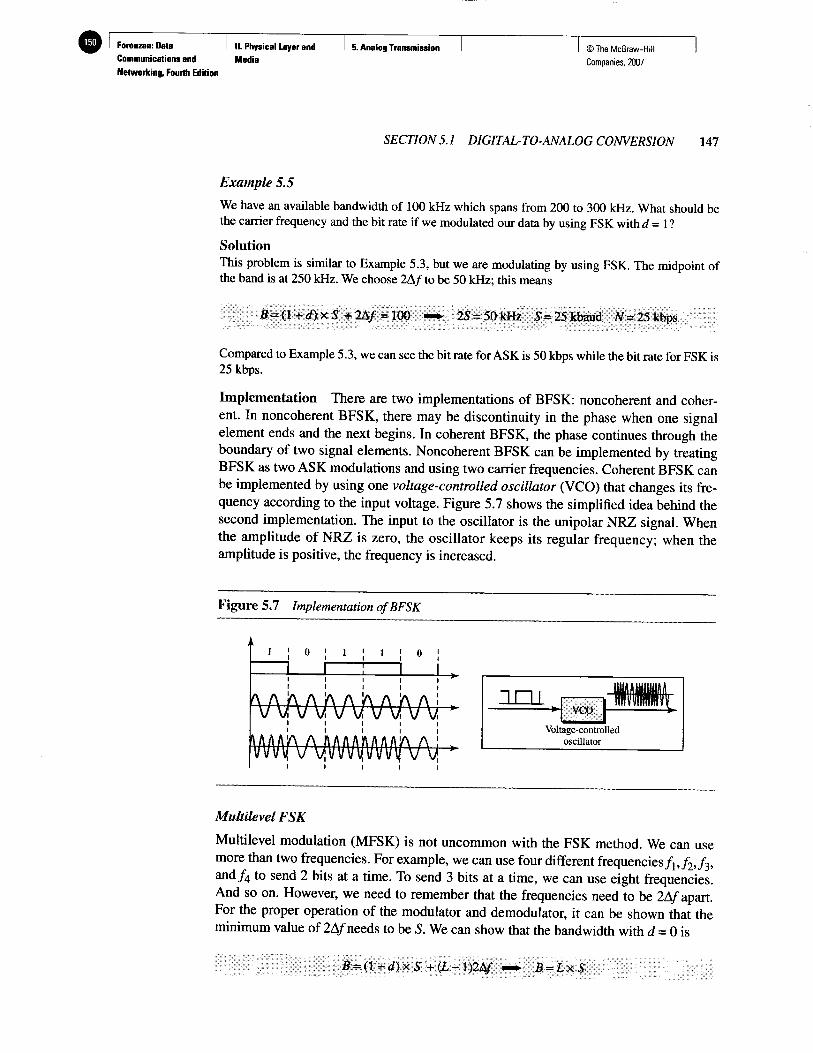
Implementation There are two implementations of BFSK: noncoherent and coherent. In noncoherent BFSK, there may be discontinuity in the phase when one signal element ends and the next begins. In coherent BFSK, the phase continues through the boundary of two signal elements. Noncoherent BFSK can be implemented by treating BFSK as two A S K modulations and using two carrier frequencies. Coherent BFSK can be implemented by using one voltage-controlled oscillator (VCO) that changes its frequency according to the input voltage. Figure 5.7 shows the simplified idea behind the second implementation. The input to the oscillator is the unipolar NRZ signal. When the amplitude of N R Z is zero, the oscillator keeps its regular frequency; when the amplitude is positive, the frequency is increased.
Figure 5.7 Implementation of BFSK
i i i i i
Multilevel FSK
Multilevel modulation (MFSK) is not uncommon with the FSK method. We can use more than two frequencies. For example, we can use four different frequencies/i,/ 2,/ 3, and / 4 to send 2 bits at a time. To send 3 bits at a time, we can use eight frequencies. And so on. However, we need to remember that the frequencies need to be 2A/apart. For the proper operation of the modulator and demodulator, it can be shown that the minimum value of 2A/needs to be S. We can show that the bandwidth with d = 0 is
B = (l+d)xS +(L-1)2A/ —•> B = LxS
Forouzan: Data I II. Physical Layer and I 5. Analog Transmission I I © The McGraw-Hill I
Communications and Media Companies, 2007
Networking, Fourth Edition
148 CHAPTER 5 ANALOG TRANSMISSION
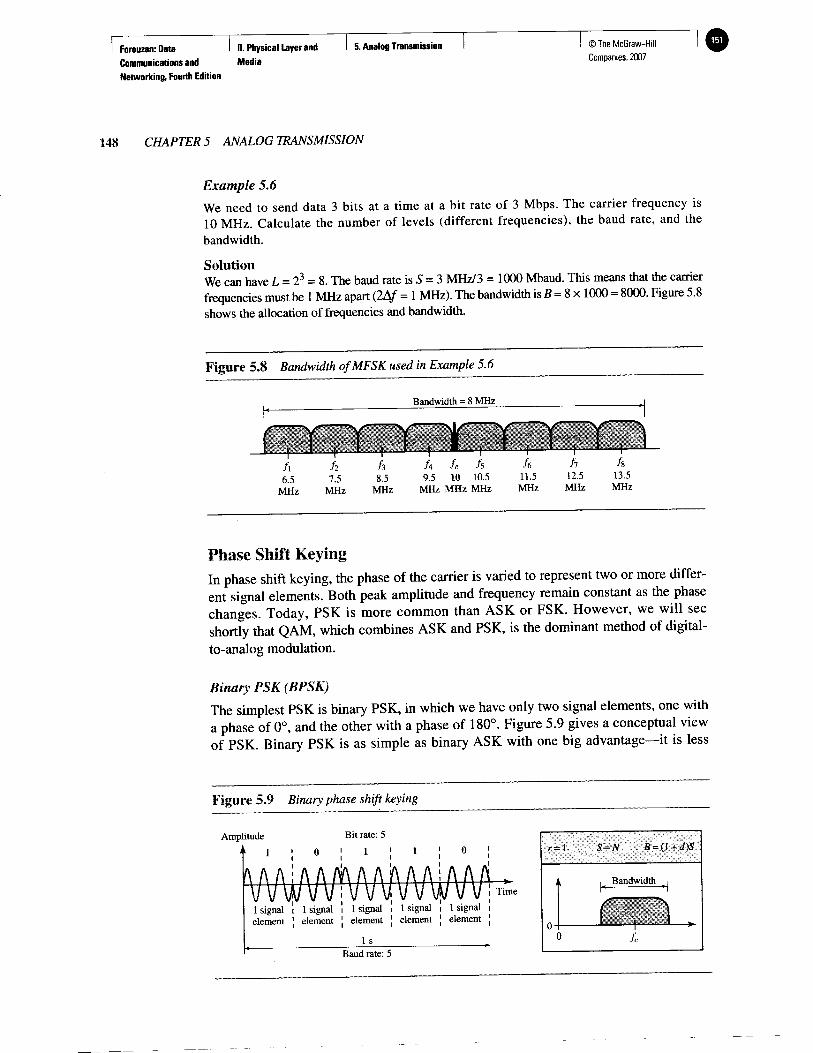
Example 5.6 We need to send data 3 bits at a time at a bit rate of 3 Mbps. The carrier frequency is 10 MHz. Calculate the number of levels (different frequencies), the baud rate, and the bandwidth.
Solution We can have L = 2 3 = 8. The baud rate is 5 = 3 MHz/3 = 1000 Mbaud. This means that the carrier frequencies must be 1 MHz apart (2A/ = 1 MHz). The bandwidth is B = 8 x 1000 = 8000. Figure 5.8 shows the allocation of frequencies and bandwidth.
Figure 5.8 Bandwidth of MFSK used in Example 5.6
Bandwidth = 8 MHz
f ~Y",'Y, T , T H f T Y ~ Y ~ l / i h h ft, fc h h fi h 6.5 7.5 8.5 9.5 10 10.5 11.5 12.5 13.5
M H z M H z M H z M H z M H z MHz MHz MHz M H z
Phase Shift Keying In phase shift keying, the phase of the carrier is varied to represent two or more different signal elements. Both peak amplitude and frequency remain constant as the phase changes. Today, PSK is more common than A S K or FSK. However, we wil l see shortly that Q A M , which combines A S K and PSK, is the dominant method of digital-to-analog modulation.
Binary PSK (BPSK)
The simplest PSK is binary PSK, in which we have only two signal elements, one with a phase of 0°, and the other with a phase of 180°. Figure 5.9 gives a conceptual view of PSK. Binary PSK is as simple as binary A S K with one big advantage—it is less
Figure 5.9 Binary phase shift keying
Amplitude Bit rate: 5
1
1 signal i 1 signal i 1 signal element ] element [ element
1 s
1 signal i 1 signal i element ! element !
r=\ = N B-(\+d)S
Bandwidth
Baud rate: 5

Forouzan: Data I II. Physical Layer and I 5. Analog Transmission I I © The McGraw-Hill
Communications and Media Companies, 2007
Networking, Fourth Edition
SECTION 5.1 DIGITAL-TO-ANALOG CONVERSION 149
susceptible to noise. In ASK, the criterion for bit detection is the amplitude of the signal; in PSK, it is the phase. Noise can change the amplitude easier than it can change the phase. In other words, PSK is less susceptible to noise than ASK. PSK is superior to FSK because we do not need two carrier signals.
Bandwidth Figure 5.9 also shows the bandwidth for BPSK. The bandwidth is the same as that for binary ASK, but less than that for BFSK. No bandwidth is wasted for separating two carrier signals.
Implementation The implementation of BPSK is as simple as that for ASK. The reason is that the signal element with phase 180° can be seen as the complement of the signal element with phase 0°. This gives us a clue on how to implement BPSK. We use the same idea we used for A S K but with a polar NRZ signal instead of a unipolar NRZ signal, as shown in Figure 5.10. The polar NRZ signal is multiplied by the carrier frequency; the 1 bit (positive voltage) is represented by a phase starting at 0°; the 0 bit (negative voltage) is represented by a phase starting at 180°.
Figure 5.10 Implementation of BASK
0 1 1
1 1 Carrier signal 1 1
fW\AAAAAAAAAi\AAi i i i i
Modulated signal 1
m/ww\iWwW i i i i i
Multiplier
Oscillator
Quadrature PSK (QPSK)
The simplicity of BPSK enticed designers to use 2 bits at a time in each signal element, thereby decreasing the baud rate and eventually the required bandwidth. The scheme is called quadrature PSK or QPSK because it uses two separate BPSK modulations; one is in-phase, the other quadrature (out-of-phase). The incoming bits are first passed through a serial-to-parallel conversion that sends one bit to one modulator and the next bit to the other modulator. If the duration of each bit in the incoming signal is T, the duration of each bit sent to the corresponding BPSK signal is IT. This means that the bit to each BPSK signal has one-half the frequency of the original signal. Figure 5.11 shows the idea.
The two composite signals created by each multiplier are sine waves with the same frequency, but different phases. When they are added, the result is another sine wave, with one of four possible phases: 45°, -45° , 135°, and -135°. There are four kinds of signal elements in the output signal (L = 4), so we can send 2 bits per signal element (r = 2).

Forouzan: Data I II. Physical Layer and I 5. Analog Transmission H I © The McGraw-Hill I
Communications and Media Companies, 2007
Networking, Fourth Edition
150 CHAPTER 5 ANALOG TRANSMISSION
Figure 5.11 QPSK and its implementation
0 0 10 0 1 11
0 1 0 1
-135 I -45 ! 135 ! 45
Example 5.7
Find the bandwidth for a signal transmitting at 12 Mbps for QPSK. The value of d = 0.
Solution For QPSK, 2 bits is carried by one signal element. This means that r = 2. So the signal rate (baud rate) is S = N x (1/r) = 6 Mbaud. With a value of d = 0, we have B = S = 6 MHz.
Constellation Diagram
A constellation diagram can help us define the amplitude and phase of a signal element, particularly when we are using two carriers (one in-phase and one quadrature). The diagram is useful when we are dealing with multilevel ASK, PSK, or Q A M (see next section). In a constellation diagram, a signal element type is represented as a dot. The bit or combination of bits it can carry is often written next to it.
The diagram has two axes. The horizontal X axis is related to the in-phase carrier; the vertical Y axis is related to the quadrature carrier. For each point on the diagram, four pieces of information can be deduced. The projection of the point on the X axis defines the peak amplitude of the in-phase component; the projection of the point on the Y axis defines the peak amplitude of the quadrature component. The length of the line (vector) that connects the point to the origin is the peak amplitude of the signal element (combination of the X and Y components); the angle the fine makes with the X axis is the phase of the signal element. A l l the information we need, can easily be found on a constellation diagram. Figure 5.12 shows a constellation diagram.
Forouzan: Data I II. Physical Layer and I 5. Analog Transmission I I ©The McGraw-Hill
Communications and Media Companies, 2007
Networking, Fourth Edition
SECTION 5.1 DIGITAL-TO-ANALOG CONVERSION 151
Figure 5.12 Concept of a constellation diagram
Y (Quadrature carrier)
Amplitude of / component
X (In-phase carrier)
Example 5.8
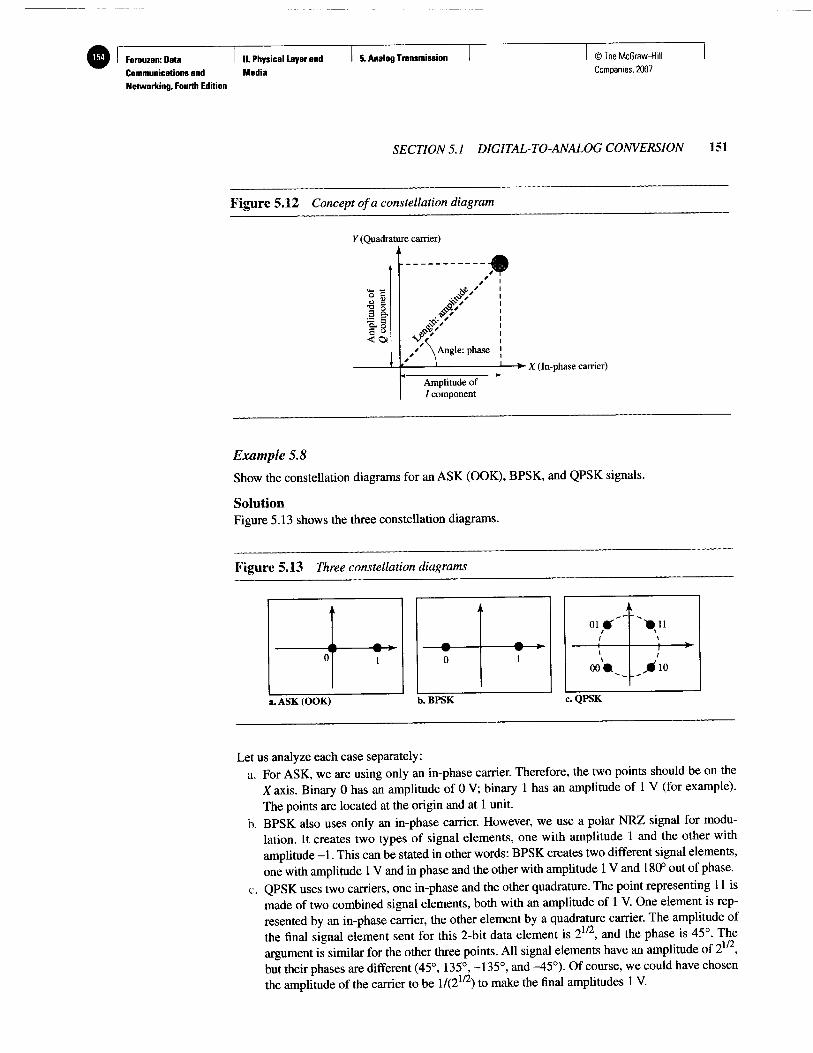
Show the constellation diagrams for an ASK (OOK), BPSK, and QPSK signals.
Solution Figure 5.13 shows the three constellation diagrams.
Figure 5.13 Three constellation diagrams
t 0 1
ai •1 w 0
w 1
oi « r "
00 _ > ' i o
a. A S K (OOK) b . B P S K c. Q P S K
Let us analyze each case separately: a. For ASK, we are using only an in-phase carrier. Therefore, the two points should be on the
X axis. Binary 0 has an amplitude of 0 V; binary 1 has an amplitude of 1 V (for example). The points are located at the origin and at 1 unit.
b. BPSK also uses only an in-phase carrier. However, we use a polar NRZ signal for modulation. It creates two types of signal elements, one with amplitude 1 and the other with amplitude -1. This can be stated in other words: BPSK creates two different signal elements, one with amplitude 1V and in phase and the other with amplitude 1V and 180° out of phase.
c. QPSK uses two carriers, one in-phase and the other quadrature. The point representing 11 is made of two combined signal elements, both with an amplitude of 1 V. One element is represented by an in-phase carrier, the other element by a quadrature carrier. The amplitude of the final signal element sent for this 2-bit data element is 2 1 / 2 , and the phase is 45°. The argument is similar for the other three points. All signal elements have an amplitude of 2 , but their phases are different (45°, 135°, -135°, and -45°). Of course, we could have chosen the amplitude of the carrier to be 1/(21/2) to make the final amplitudes 1 V.

Forouzan: Data I II. Physical Layer and I 5. Analog Transmission I I © The McGraw-Hill
Communications and Media Companies, 2007
Networking, Fourth Edition
152 CHAPTERS ANALOG TRANSMISSION
Quadrature Amplitude Modulation PSK is limited by the ability of the equipment to distinguish small differences in phase. This factor limits its potential bit rate. So far, we have been altering only one of the three characteristics of a sine wave at a time; but what if we alter two? Why not combine A S K and PSK? The idea of using two carriers, one in-phase and the other quadrature, with different amplitude levels for each carrier is the concept behind quadrature amplitude modulation (QAM).
Quadrature amplitude modulation is a combination of ASK and PSK.
The possible variations of Q A M are numerous. Figure 5.14 shows some of these schemes. Figure 5.14a shows the simplest 4 -QAM scheme (four different signal element types) using a unipolar NRZ signal to modulate each carrier. This is the same mechanism we used for A S K (OOK). Part b shows another 4 -QAM using polar NRZ, but this is exactly the same as QPSK. Part c shows another QAM-4 in which we used a signal with two positive levels to modulate each of the two carriers. Finally, Figure 5.14d shows a 16-QAM constellation of a signal with eight levels, four positive and four negative.
Figure 5.14 Constellation diagrams for some QAMs
m
a. 4 - Q A M b. 4 - Q A M c 4 - Q A M d. 16-QAM
Bandwidth for QAM
The minimum bandwidth required for Q A M transmission is the same as that required for A S K and PSK transmission. Q A M has the same advantages as PSK over ASK.
5.2 ANALOG-TO-ANALOG CONVERSION Analog-to-analog conversion, or analog modulation, is the representation of analog information by an analog signal. One may ask why we need to modulate an analog signal; it is already analog. Modulation is needed if the medium is bandpass in nature or if only a bandpass channel is available to us. An example is radio. The government assigns a narrow bandwidth to each radio station. The analog signal produced by each station is a low-pass signal, all in the same range. To be able to listen to different stations, the low-pass signals need to be shifted, each to a different range.

Forouzan: Data
Communications and
Networking, Fourth Edition
II. Physical Layer and
Media
5. Analog Transmission © The McGraw-Hill
Companies, 2007
SECTION 5.2 ANALOG-TO-ANALOG CONVERSION 153
Analog-to-analog conversion can be accomplished in three ways: amplitude modulation (AM), frequency modulation (FM), and phase modulation (PM). F M and P M are usually categorized together. See Figure 5.15.
Figure 5.15 Types of analog-to-analog modulation
Amplitude modulation
Analog-to-analog conversion
Frequency modulation Phase modulation
Amplitude Modulation In A M transmission, the carrier signal is modulated so that its amplitude varies with the changing amplitudes of the modulating signal. The frequency and phase of the carrier remain the same; only the amplitude changes to follow variations in the information. Figure 5.16 shows how this concept works. The modulating signal is the envelope of the carrier.
Figure 5.16 Amplitude modulation
Modulating signal
Carrier frequency
vwwwwv Modulated signal
Multiplier
Oscillator
r — — H
As Figure 5.16 shows, A M is normally implemented by using a simple multiplier because the amplitude of the carrier signal needs to be changed according to the amplitude of the modulating signal.
AM Bandwidth
Figure 5.16 also shows the bandwidth of an A M signal. The modulation creates a bandwidth that is twice the bandwidth of the modulating signal and covers a range centered on the carrier frequency. However, the signal components above and below the carrier

Forouzan: Data I II. Physical Layer and I 5. Analog Transmission I I © The McGraw-Hill
Communications and Media Companies, 2007
Networking, Fourth Edition
154 CHAPTER 5 ANALOG TRANSMISSION
frequency carry exactly the same information. For this reason, some implementations discard one-half of the signals and cut the bandwidth in half.
The total bandwidth required for AM can be determined from the bandwidth of the audio signal: fiAM = IB.
Standard Bandwidth Allocation for AM Radio
The bandwidth of an audio signal (speech and music) is usually 5 kHz. Therefore, an A M radio station needs a bandwidth of 10 kHz. In fact, the Federal Communications Commission (FCC) allows 10 kHz for each A M station.
A M stations are allowed carrier frequencies anywhere between 530 and 1700 kHz (1.7 MHz). However, each station's carrier frequency must be separated from those on either side of it by at least 10 kHz (one A M bandwidth) to avoid interference. If one station uses a carrier frequency of 1100 kHz, the next station's carrier frequency cannot be lower than 1110 kHz (see Figure 5.17).
Figure 5.17 AM band allocation
± fc ± fc fc
± 530 kHz 10 kHz
1700 kHz
Frequency Modulation In F M transmission, the frequency of the carrier signal is modulated to follow the changing voltage level (amplitude) of the modulating signal. The peak amplitude and phase of the carrier signal remain constant, but as the amplitude of the information signal changes, the frequency of the carrier changes correspondingly. Figure 5.18 shows the relationships of the modulating signal, the carrier signal, and the resultant F M signal.
As Figure 5.18 shows, F M is normally implemented by using a voltage-controlled oscillator as with FSK. The frequency of the oscillator changes according to the input voltage which is the amplitude of the modulating signal.
FM Bandwidth
Figure 5.18 also shows the bandwidth of an F M signal. The actual bandwidth is difficult to determine exactly, but it can be shown empirically that it is several times that of the analog signal or 2(1 + p)S where p is a factor depends on modulation technique with a common value of 4.
The total bandwidth required for FM can be determined from the bandwidth of the audio signal: B F M = 2(1 + $)B.

Forouzan: Data I II. Physical Layer and I 5. Analog Transmission I I © The McGraw-Hill
Communications and Media Companies. 2007
Networking. Fourth Edition
SECTION 5.2 ANALOG-TO-ANALOG CONVERSION 155
Figure 5.18 Frequency modulation
Amplitude
Modulating signal (audio)
Standard Bandwidth Allocation for FM Radio
The bandwidth of an audio signal (speech and music) broadcast in stereo is almost 15 kHz. The FCC allows 200 kHz (0.2 MHz) for each station. This mean p = 4 with some extra guard band. F M stations are allowed carrier frequencies anywhere between 88 and 108 MHz. Stations must be separated by at least 200 kHz to keep their band-widths from overlapping. To create even more privacy, the FCC requires that in a given area, only alternate bandwidth allocations may be used. The others remain unused to prevent any possibility of two stations interfering with each other. Given 88 to 108 MHz as a range, there are 100 potential F M band widths in an area, of which 50 can operate at any one time. Figure 5.19 illustrates this concept.
Figure 5.19 FM band allocation
No station
MHz 200 kHz
fc ± No station
108 MHz
Phase Modulation In P M transmission, the phase of the carrier signal is modulated to follow the changing voltage level (amplitude) of the modulating signal. The peak amplitude and frequency of the carrier signal remain constant, but as the amplitude of the information signal changes, the phase of the carrier changes correspondingly. It can proved mathematically (see Appendix C) that P M is the same as F M with one difference. In F M , the instantaneous change in the carrier frequency is proportional to the amplitude of the
Forouzan: Data I II. Physical Layer and I 5. Analog Transmission I I © The McGraw-Hill I
Communications and Media Companies, 2007
Networking, Fourth Edition
156 CHAPTER 5 ANALOG TRANSMISSION
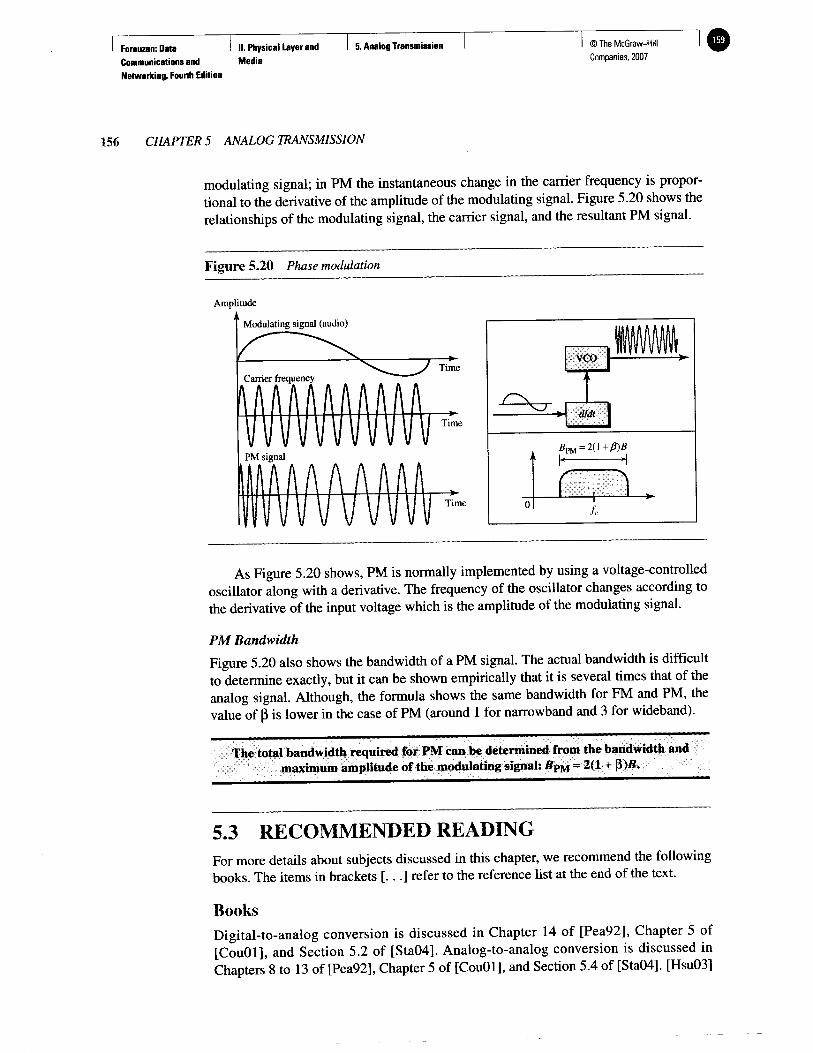
modulating signal; in P M the instantaneous change in the carrier frequency is proportional to the derivative of the amplitude of the modulating signal. Figure 5.20 shows the relationships of the modulating signal, the carrier signal, and the resultant P M signal.
Figure 5.20 Phase modulation
Amplitude
As Figure 5.20 shows, P M is normally implemented by using a voltage-controlled oscillator along with a derivative. The frequency of the oscillator changes according to the derivative of the input voltage which is the amplitude of the modulating signal.
PM Bandwidth
Figure 5.20 also shows the bandwidth of a P M signal. The actual bandwidth is difficult to determine exactly, but it can be shown empirically that it is several times that of the analog signal. Although, the formula shows the same bandwidth for F M and P M , the value of (3 is lower in the case of P M (around 1 for narrowband and 3 for wideband).
The total bandwidth required for PM can be determined from the bandwidth and maximum amplitude of the modulating signal: BPM = 2(1 + $)B.
5.3 RECOMMENDED READING For more details about subjects discussed in this chapter, we recommend the following books. The items in brackets [. ..] refer to the reference list at the end of the text.
Books Digital-to-analog conversion is discussed in Chapter 14 of [Pea92], Chapter 5 of [CouOl], and Section 5.2 of [Sta04]. Analog-to-analog conversion is discussed in Chapters 8 to 13 of [Pea92], Chapter 5 of [CouOl], and Section 5.4 of [Sta04]. [Hsu03]
Forouzan: Data I II. Physical Layer and I 5. Analog Transmission I I © The McGraw-Hill
Communications and Media Companies. 2007
Networking, Fourth Edition
SECTION 5.5 SUMMARY 157
gives a good mathematical approach to all materials discussed in this chapter. More advanced materials can be found in [Ber96].
5.4 KEY TERMS amplitude modulation (AM) amplitude shift keying (ASK) analog-to-analog conversion carrier signal constellation diagram digital-to-analog conversion
frequency modulation (FM) frequency shift keying (FSK) phase modulation (PM) phase shift keying (PSK) quadrature amplitude modulation
(QAM)
5.5 SUMMARY • Digital-to-analog conversion is the process of changing one of the characteristics
of an analog signal based on the information in the digital data. LJ Digital-to-analog conversion can be accomplished in several ways: amplitude shift
keying (ASK), frequency shift keying (FSK), and phase shift keying (PSK). Quadrature amplitude modulation (QAM) combines A S K and PSK.
U In amplitude shift keying, the amplitude of the carrier signal is varied to create signal elements. Both frequency and phase remain constant while the amplitude changes.
• In frequency shift keying, the frequency of the carrier signal is varied to represent data. The frequency of the modulated signal is constant for the duration of one signal element, but changes for the next signal element if the data element changes. Both peak amplitude and phase remain constant for all signal elements.
LI In phase shift keying, the phase of the carrier is varied to represent two or more different signal elements. Both peak amplitude and frequency remain constant as the phase changes.
• A constellation diagram shows us the amplitude and phase of a signal element, particularly when we are using two carriers (one in-phase and one quadrature).
• Quadrature amplitude modulation (QAM) is a combination of A S K and PSK. Q A M uses two carriers, one in-phase and the other quadrature, with different amplitude levels for each carrier.
• Analog-to-analog conversion is the representation of analog information by an analog signal. Conversion is needed if the medium is bandpass in nature or if only a bandpass bandwidth is available to us.
• Analog-to-analog conversion can be accomplished in three ways: amplitude modulation (AM), frequency modulation (FM), and phase modulation (PM).
• In A M transmission, the carrier signal is modulated so that its amplitude varies with the changing amplitudes of the modulating signal. The frequency and phase of the carrier remain the same; only the amplitude changes to follow variations in the information.
• In F M transmission, the frequency of the carrier signal is modulated to follow the changing voltage level (amplitude) of the modulating signal. The peak amplitude

Forouzan: Data
Communications and
Networking, Fourth Edition
II. Physical Layer and
Media
5. Analog Transmission ©The McGraw-Hill
Companies. 2007
158 CHAPTER 5 ANALOG TRANSMISSION
and phase of the carrier signal remain constant, but as the amplitude of the information signal changes, the frequency of the carrier changes correspondingly.
• In P M transmission, the phase of the carrier signal is modulated to follow the changing voltage level (amplitude) of the modulating signal. The peak amplitude and frequency of the carrier signal remain constant, but as the amplitude of the information signal changes, the phase of the carrier changes correspondingly.
Review Questions 1. Define analog transmission. 2. Define carrier signal and its role in analog transmission. 3. Define digital-to-analog conversion. 4. Which characteristics of an analog signal are changed to represent the digital signal
in each of the following digital-to-analog conversion?
5. Which of the four digital-to-analog conversion techniques (ASK, FSK, PSK or QAM) is the most susceptible to noise? Defend your answer.
6. Define constellation diagram and its role in analog transmission. 7. What are the two components of a signal when the signal is represented on a con
stellation diagram? Which component is shown on the horizontal axis? Which is shown on the vertical axis?
8. Define analog-to-analog conversion? 9. Which characteristics of an analog signal are changed to represent the lowpass analog
signal in each of the following analog-to-analog conversions?
10. Which of the three analog-to-analog conversion techniques (AM, F M , or PM) is the most susceptible to noise? Defend your answer.
Exercises 11. Calculate the baud rate for the given bit rate and type of modulation.
a. 2000 bps, FSK b . 4000 bps, A S K c. 6000 bps, QPSK d . 36,000 bps, 64-QAM
5.6 PRACTICE SET
a. A S K b . FSK c . PSK d . Q A M
a. A M b . F M c . P M
Forouzan: Data I II. Physical Layer and I 5. Analog Transmission I I ©The McGraw-Hill
Communications and Media Companies, 2007
Networking, Fourth Edition
SECTION 5.6 PRACTICE SET 159
12. Calculate the bit rate for the given baud rate and type of modulation. a. 1000 baud, FSK b . 1000 baud, A S K c . 1000 baud, BPSK d . 1000 baud, 16-QAM
13. What is the number of bits per baud for the following techniques? a. A S K with four different amplitudes b . FSK with 8 different frequencies c . PSK with four different phases d . Q A M with a constellation of 128 points.
14. Draw the constellation diagram for the following: a. ASK, with peak amplitude values of 1 and 3 b. BPSK, with a peak amplitude value of 2 c . QPSK, with a peak amplitude value of 3 d . 8-QAM with two different peak amplitude values, 1 and 3, and four different
phases. 15. Draw the constellation diagram for the following cases. Find the peak amplitude
value for each case and define the type of modulation (ASK, FSK, PSK, or QAM). The numbers in parentheses define the values of I and Q respectively. a. Two points at (2, 0) and (3, 0). b . Two points at (3,0) and (-3,0). c . Four points at (2, 2), (-2, 2), (-2, -2), and (2, -2). d . Two points at (0 , 2) and (0, -2).
16. How many bits per baud can we send in each of the following cases if the signal constellation has one of the following number of points? a. 2 b . 4 c. 16 d . 1024
17. What is the required bandwidth for the following cases if we need to send 4000 bps? Letd = 1. a. A S K b . FSK with 2Af = 4 KHz c . QPSK d . 16-QAM
18. The telephone line has 4 KHz bandwidth. What is the maximum number of bits we can send using each of the following techniques? Let d = 0. a. A S K b. QPSK c . 16-QAM d . 64-QAM
Forouzan: Data I II. Physical Layer and I 5. Analog Transmission I I ©The McGraw-Hill
Communications and Media Companies, 2007
Networking, Fourth Edition
160 CHAPTER 5 ANALOG TRANSMISSION
19. A corporation has a medium with a 1-MHz bandwidth (lowpass). The corporation needs to create 10 separate independent channels each capable of sending at least 10 Mbps. The company has decided to use Q A M technology. What is the minimum number of bits per baud for each channel? What is the number of points in the constellation diagram for each channel? Let d = 0.
20. A cable company uses one of the cable TV channels (with a bandwidth of 6 MHz) to provide digital communication for each resident. What is the available data rate for each resident if the company uses a 64-QAM technique?
21. Find the bandwidth for the following situations if we need to modulate a 5-KHz voice. a. A M b. FM(setp = 5) c. P M (set p = 1)
22. Find the total number of channels in the corresponding band allocated by FCC. a. A M b. F M

Forouzan: Data
Communications and
II. Physical Layer and
Media
6. Bandwidth Utilization:
Multiplexing and
© The McGraw-Hill
Companies, 2007
CHAPTER 6
Bandwidth Utilization: Multiplexing and Spreading
In real life, we haveVlinks with limited bandwidths. The wise use of these bandwidths has been, and will be\one of the main challenges of electronic communications. However, the meaning of wise may depend on the application. Sometimes we need to combine several low-bandwidth channels to make use of one chann^with a larger bandwidth. Sometimes we need to expand the bandwidth of a channel to achieve goals such as privacy and antijamming. Iirtius chapter, we explore these two broad categories of bandwidth utilization: multiplexing and spreading. In multiplexing, our goal is efficiency; we combine several channels into one/ln spreading, our goals are privacy and antijamming; we expand the bandwidtha channel to insert redundancy, which is necessary to achieve these goals.
Bandwidth utilization is the wig£ use of available bandwidth to achieve specific goals. Efficiency can be achieved by multiplexing;
privacy and antijamming can b\d by spreading.
6.1 MULTIPLEXING Whenever thfe bandwidth of a medium linking two devices is greater than the bandwidth need's of the devices, the link can be shared. Multiplexing is the set of techniques that allows the simultaneous transmission of multiple signals across a single data link. As data and telecommunications use increases, so does traffic. We can accommodate this increase by continuing to add individual links each time a new channel is needed; or we can install higher-bandwidth links and use each to carry multiple signals. As described in Chapter 7, today's technology includes high-bandwidth media such as optical fiber and terrestrial and satellite microwaves. Each has a bandwidth far in excess of that needed for the average transmission signal. If the bandwidth of a link is greater than the bandwidth needs of the devices connected to it, the bandwidth is wasted. An efficient system maximizes the utilization of all resources; bandwidth is one of the most precious resources we have in data communications.
161