anaerobic digestion of vegetables processing wastes …agronomy.emu.ee/vol132/13_2_3_b5.pdf · 294...
TRANSCRIPT

294
Agronomy Research 13(2), 294–302, 2015
Anaerobic digestion of vegetables processing wastes with
catalyst metaferm
V. Dubrovskis* and I. Plume
Latvia University of Agriculture, Faculty of Engineering, Institute of Agriculture
Energetics, 5, Cakstesblvd, LV3001 Jelgava, Latvia *Correspondence: [email protected]
Abstract. There are 54 active biogas plants in Latvia today. It is necessary to investigate the
suitability of various biomasses for energy production. Maize is the dominating crop for biogas
production in Latvia. The cultivation of more varied crops with good economical characteristics
and a low environmental impact is thus desirable. One of the ways for improving biogas yield in
Latvian conditions is using biological catalysts. This paper explores the results of the anaerobic
digestion of vegetables’ processing wastes using the new biological catalyst Metaferm. The
digestion process was investigated in view of biogas production in sixteen 0.7 l digesters
operated in batch mode at the temperature of 38 ± 1.0 °C. The average methane yield per unit of
dry organic matter added (DOM) from the digestion of onions was 0.433 l gDOM–1; with 1 ml of
Metaferm: 0.396 l gDOM–1, and with 2 ml of Metaferm: 0.394 l gDOM
–1. The average methane yield
from the digestion of carrots was 0.325 l gDOM–1; with 1 ml of Metaferm: 0.498 l gDOM
–1, and with
2 ml of Metaferm: 0.426 l gDOM–1. The average additional methane yield per unit of dry organic
matter from the digestion of 50%:50% mixed onions and carrots was 0.382 l gDOM–1 with 2 ml
of Metaferm. The average additional methane yield per unit of dry organic matter from the
digestion of cabbage leftovers was 0.325 l gDOM–1; with 1 ml of Metaferm: 0.375 l gDOM
–1, and
with 2 ml of Metaferm: 0.415 l gDOM–1. The average additional methane yield per unit of dry
organic matter from the digestion of potato cuttings was 0.570 l gDOM–1; with 1 ml of
Metaferm: 0.551 l gDOM–1, and with 2 ml of Metaferm:0.667 l gDOM
–1. The average additional
methane yield per unit of dry organic matter from the digestion of 50%:50% mixed cabbages
and potatoes was 0.613 l gDOM–1 with 2 ml of Metaferm. All investigated vegetable wastes can
be successfully cultivated for energy production under agro-ecological conditions in Latvia.
Adding the catalyst Metaferm increased methane yield, except for onions.
Key words: anaerobic digestion, onion, carrot, cabbage, potato, biogas, methane, biological
catalyst.
INTRODUCTION
Energy production from renewable sources plays an important role in European
energy policies. The share of renewable energy is expected to rise further to 21% by
2020 and 24% by 2030 (COM (2014) 15 final). According to calculations provided
during the implementation of the Biomass Action Plan, 8% of Europe’s energy needs
covered by biomass can reduce greenhouse gas emissions equivalent to 209 million
tonnes of CO2 per year and create up to 300,000 new jobs in the agricultural and forestry
sectors.

295
According to Directive 2009/28/EC, Annex I, Part A, the goal for Latvia is to
increase the share of energy produced from renewable energy sources (RES) in gross
final energy consumption from 32.6% in 2005 to 40% (1918 toe) in 2020 (Ministry of
Economic, 2010).
One of the most promising renewable energy sources is biogas. Biogas production
must be developed, as methane collection also helps to implement the Kyoto Protocol
provisions. The Latvian Action Plan envisages the total electricity generation capacity
of 92 MW for biogas plants in 2020. The number of working biogas cogeneration plants
will increase up to 54 in Latvia in 2014 (Ministry of Economics, 2015). There is around
369,000 ha of available land suitable for growing energy crops and the production of
biogas in Latvia (Dubrovskis, et al., 2011). However, many biogas plants are built in
areas, e.g., in the subregion Zemgale, with little or no free additional land for growing
biomass (mainly maize) for biogas plants. High cereals yields and increasing grain prices
on the market can cause the further decreasing of maize areas, potentially limiting this
traditional source for biogas production. Therefore, it is necessary to find new biomass
sources to stabilise or increase biomethane production in biogas plants in Latvia.
An additional way for increasing biogas production is improving the anaerobic
fermentation process itself. Currently, within some European countries, a variety of
specific additives are being rapidly developed and their use is undergoing innovation
(Feng, at al., 2010; Lemmer, at al., 2011; Irvan, 2012; Facchina, at al., 2013) with the
aim of increasing biogas yield.
One available biomass source is vegetable and fruit waste from the food industry
and/or households. Vegetable and fruit wastes have high initial moisture content in the
range of 60–93%, and the wastes are easy degradable under anaerobic conditions.
The anaerobic processing of quickly degradable vegetable or fruit wastes can help
avoid carbon dioxide emissions and runoff from biomass, facilitating biogas and
fertilizer production in an environmentally friendly way. Research should be conducted
on food industry waste processing to evaluate local or regional biogas potential. The aim
of the research is to evaluate biogas and methane production from different vegetable
residues, clarify whether the addition of biocatalyst Metaferm (made in Latvia) in
substrates causes any positive effects, establish effective doses for optimised
fermentation and determine the highest doses capable of inhibiting the anaerobic
digestion process.
MATERIALS AND METHODS
In order to achieve greater statistical confidence, heated camera (Memmert
incubator) and a number of small bioreactors were used. Small bioreactors were filled
with substrate and placed in a heat chamber, and gas from each bioreactor was directed
into a separate storage bag located outside the camera. Widely applied methods were
used for obtaining results (Kaltschmitt, 2010).
The amount of dry matter was determined by investigating the initial biomass
sample weight and dry weight with Shimazu scales at 105 °C and by investigating ash
content with the help of a Nabertherm furnace, with which the samples were burnt at
550 °C. All mixtures were prepared, carefully mixed and all sealed bioreactors were put
in heated camera within same time period before starting anaerobic digestion. The
composition of the gas collected into the storage bags was measured with the gas
296
analyser GA 2000. With the help of this instrument, oxygen, carbon dioxide, methane
and hydrogen sulphide were registered in the gas. Substrate pH value was measured
before and after finishing the anaerobic fermentation process using a pH meter (PP–50)
with accessories. Scales (Kern KFB 16KO2) were used for weighing the substrate before
anaerobic processing and for weighing the digestate after finishing the fermentation
process. Dry matter content and ash content were measured in the digestate originating
from each of the bioreactors to determine dry organic matter (DOM) content.
Bioreactors with the volume of 0.7 l were filled with biomass samples of 20 ± 0.05 g
and with 500.0 ± 0.2 g inoculum (fermented cattle manure from a 120 l bioreactor
working in continuous mode). For calculation purposes control bioreactors were filled
only with inoculum. All data were recorded in the journal of experiments and in a
computer. All bioreactors were placed into an incubator with the operating temperature
of 38 ± 0.5 °C, and every bioreactor had a flexible pipe connected to a gas storage bag
positioned outside the heated camera. Every gas bag has a port normally closed with a
tap for gas measurement. The quantity and composition of gases were measured every
day. Bioreactors were also gently shaken to mix the floating layer regularly. The
fermentation process was started with a single filling in batch mode until the biogas
emission ceased. The final digestate was weighed; dry matter and ashes were
investigated to evaluate organic dry matter content. The total biogas and methane
production values were calculated using the normal biogas volumes and quality
parameters obtained from the gas collected to the gas storage bags from each bioreactor.
For statistical accuracy all final data values were calculated as averages on the basis of
two identical substrates positioned in the heat camera.
In the first study, raw onion and carrot processing residues were studied. In the
second study, cabbage leaves and potato processing wastes were used as raw material
in the bioreactors. The methods of the experiments were the same for both projects.
RESULTS AND DISCUSSION
The results of analysing raw material samples in view of the anaerobic digestion of
onion and carrot wastes in the first study are shown in Table 1.
The results of the digestate analysis after the anaerobic digestion process are shown
in Table 2.
The production of biogas and methane from onion and carrot wastes and in control
reactors is presented in Table 3.
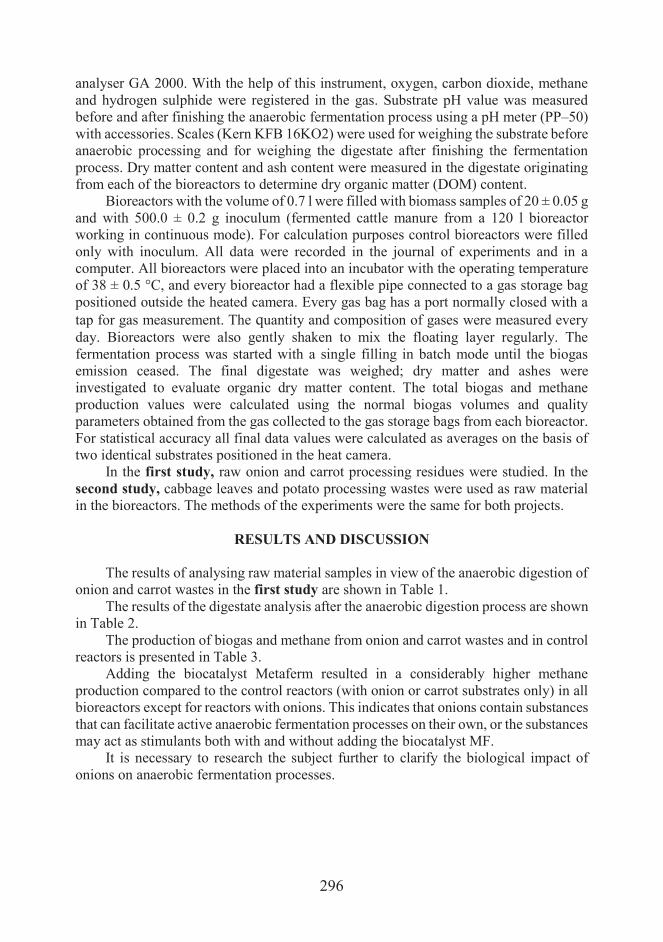
Adding the biocatalyst Metaferm resulted in a considerably higher methane
production compared to the control reactors (with onion or carrot substrates only) in all
bioreactors except for reactors with onions. This indicates that onions contain substances
that can facilitate active anaerobic fermentation processes on their own, or the substances
may act as stimulants both with and without adding the biocatalyst MF. It is necessary to research the subject further to clarify the biological impact of
onions on anaerobic fermentation processes.

297
Table 1. Results of analysing raw material samples before anaerobic digestion
Bioreactor/Raw material pH
substr
TS
%
TS
g
ASH
%
DOM
%
DOM
g
Weight
g
R1, R16 IN 7.86 4.22 21.1 20.71 79.29 16.73 500
R2, R320 g ON 12.63 2.53 6.8 93.2 2.35 20
500g IN + 20 g ON 7.84 4.54 23.63 19.22 80.78 19.09 520
R4, R520gON 12.63 2.53 6.8 93.2 2.35 20
500gIN+20gON+1 ml MF 7.86 4.54 23.65 19.22 80.78 19.1 521
R6, R720gON 12.63 2.53 6.8 93.2 2.35 20
500gIN+20g ON+2ml MF 7.88 4.53 23.65 19.22 80.78 19.1 522
R8, R920g CR 10.64 2.128 9.74 90.26 1.92 20
500gIN+20g CR 7.82 4.47 23.24 19.69 80.31 18.66 520
R10, R1120g CR 10.64 2.128 9.74 90.26 1.92 20
500gIN+20g CR+1ml MF 7.85 4.47 23.28 19.69 80.31 18.7 521
R12, R1320 g CR 10.64 2.128 9.74 90.26 1.92 20
500gIN+20g CR+2ml MF 7.89 4.46 23.29 19.69 80.31 18.7 522
R14, R15 12.63 1.26 6.8 93.2 1.175 10*
10gON+10g CR+500gIN
+2ml MF
7.91 10.64 1.064 9.74 90.26 0.96 10**
4.44 23.41 19.49 80.51 18.85 522
Abbreviations: IN – inoculum; ON – onions; CR – carrots; MF – biocatalyst Metaferm; TS – total
solids; ASH – ashes; DOM – dry organic matter; *carrots – 10g; **onions – 10g.
Table 2. Results of digestate analysis for onion and carrot substrates
Bioreactor/Raw material pH TS
%
TS
g
ASH
%
DOM % DOM % Weight
g
R1 IN 7.21 4.48 22.19 14.57 85.43 18.96 495.4
R16 IN 7.20 4.44 21.71 24.55 75.45 16.38 488.9
R2 ON+IN 7.21 4.38 22.36 19.11 80.89 18.08 510.4
R3 ON+IN 7.21 4.64 23.74 21.87 78.13 18.55 511.6
R4 ON+IN +1ml MF 7.18 4.20 21.45 32.84 67.11 14.40 510.8
R5 ON+IN +1ml MF 7.20 3.97 20.29 28.36 71.64 14.54 511.2
R6 ON+IN +2ml MF 7.21 4.23 21.59 23.48 76.52 15.44 510.4
R7 ON+IN +2ml MF 7.14 4.06 20.72 26.20 73.80 15.29 515.4
R8 CR+IN 7.15 4.37 22.37 20.17 79.83 17.86 511.8
R9 CR+IN 7.23 4.24 21.73 27.87 72.13 15.67 512.6
R10 CR+IN+1ml MF 7.25 4.74 22.23 22.84 77.16 27.15 512.2
R11 CR+IN+1ml MF 7.16 4.31 22.09 23.21 76.79 16.96 512.6
R12 CR+IN+2ml MF 7.24 4.51 23.11 22.89 77.11 17.82 512.4
R13 CR+IN+2ml MF 7.21 4.57 23.36 22.96 77.04 17.99 511.2
R14 ON+CR+IN+2ml MF 7.25 4.61 23.66 22.61 77.39 18.31 513.4
R15 ON+CR+IN+2ml MF 7.22 4.67 23.98 23.30 76.70 18.39 513.6

298
Table 3. Production of biogas and methane from onion and carrot wastes in bioreactors
Bioreactor/Raw material Biogas
l
Biogas
l gDOM–1
Methane
aver.%
Methane
l
Methane
l gDOM–1
R1 IN 0.3 0.018 13.00 0.039 0.0023
R16 IN 0.3 0.018 14.00 0.042 0.0025
R2 ON+IN 2.3 0.978 43.87 1.009 0.429
R3 ON+IN 2.3 0.978 44.82 1.031 0.438
R4 ON+IN +1ml MF 2.1 0.894 45.47 0.959 0.408
R5 ON+IN +1ml MF 1.9 0.808 47.47 0.902 0.384
R6 ON+IN +2ml MF 2.1 0.894 43.81 0.920 0.391
R7 ON+IN +2ml MF 1.9 0.808 49.05 0.932 0.396
R8 CR+IN 1.5 0.781 47.13 0.707 0.368
R9 CR+IN 1.2 0.625 44.92 0.539 0.281
R10 CR+IN+1ml MF 2.0 1.041 47.75 0.955 0.497
R11 CR+IN+1ml MF 2.0 1.041 47.9 0.958 0.499
R12 CR+IN+2ml MF 1.7 0.885 42.00 0.714 0.372
R13 CR+IN+2ml MF 1.9 0.989 48.52 0.922 0.480
R14ON+CR+IN+2ml MF 1.5 0.703 44.13 0.662 0.310
R15 ON+CR+IN+2ml MF 1.6 0.749 60.50 0.968 0.453
Note: The average biogas and methane values obtained from reactors 1 and 16 have been already
subtracted from the biogas and methane values for bioreactors 2–15 with fresh biomass.
Abbreviation: l gDOM–1 – litres per 1 g of added dry organic matter (fresh organic matter added
into inoculum)
Specific biogas and methane production volumes calculated for added onion and
carrot biomass are shown in Fig. 1.
Figure 1. Specific production of biogas and methane from onion and carrot wastes with and
without adding the biocatalyst MF.
0
0.2
0.4
0.6
0.8
1
1.2
Biogas l gDOM-1 Methane l gDOM
-1
299
A good biogas yield was obtained owing to the characteristics of the raw materials
but also owing to the fact that the liquid fraction (also inoculum) still had a lot of
utilizable substances for the bacteria (e.g., acetic acid) that was no reflected in the dry
organic matter analysis.
Substrates with onion wastes provide relatively high methane yields, 0.433 l g DOM-1
(litres per 1 g added dry organic matter) on average. Onion substrates with 1 ml or 2 ml
of the biocatalyst Metaferm had a 0.396 l gDOM–1 and 0.394 l gDOM
–1 specific methane
production respectively. This may be explained by the bioreactors containing substances
which inhibit the biocatalyst Metaferm. It is necessary to identify the precise reasons for
such inhibition in further research.
Adding 1 ml of the biocatalyst Metaferm to substrates with carrots resulted in a
very high average specific methane production of 0.498 l gDOM–1 or more than the average
methane yield of 0.325 l gDOM–1 obtained from control bioreactors without the
biocatalyst. Adding 2 ml of Metaferm to substrates with carrot wastes resulted in an
average methane yield of 0.426 l gDOM–1. Adding 2 ml of the biocatalyst Metaferm to a
carrot–onion 50%:50% mixture resulted in a bigger methane yield increase compared to
that of the control bioreactors containing carrots, but smaller than that of control
bioreactors with onions. This result also confirms the incompatibility or inhibitive
interaction between onions and Metaferm in an anaerobic digestion process.
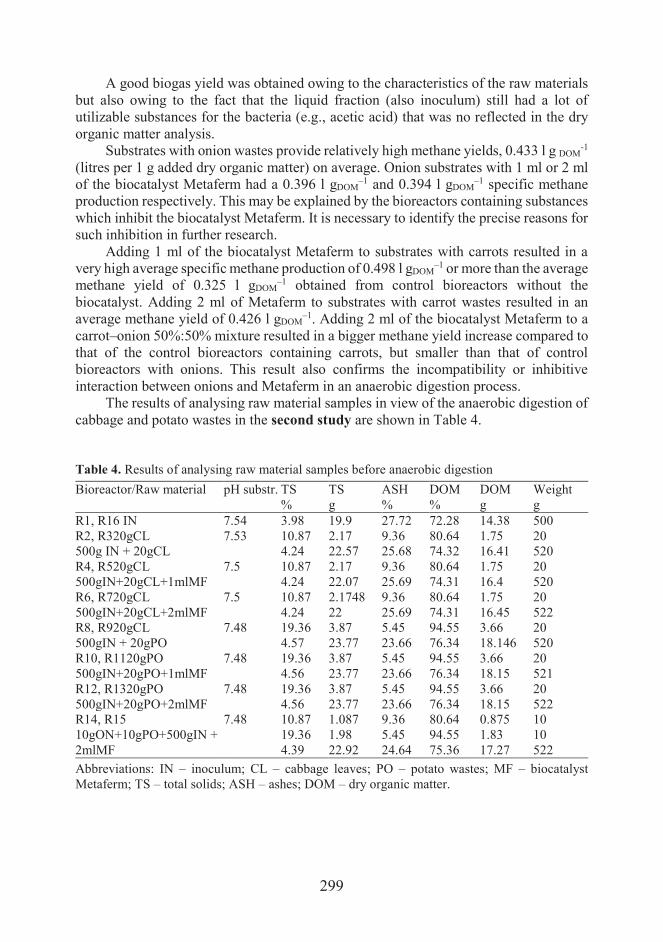
The results of analysing raw material samples in view of the anaerobic digestion of
cabbage and potato wastes in the second study are shown in Table 4.
Table 4. Results of analysing raw material samples before anaerobic digestion
Bioreactor/Raw material pH substr. TS
%
TS
g
ASH
%
DOM
%
DOM
g
Weight
g
R1, R16 IN 7.54 3.98 19.9 27.72 72.28 14.38 500
R2, R320gCL 7.53 10.87 2.17 9.36 80.64 1.75 20
500g IN + 20gCL 4.24 22.57 25.68 74.32 16.41 520
R4, R520gCL 7.5 10.87 2.17 9.36 80.64 1.75 20
500gIN+20gCL+1mlMF 4.24 22.07 25.69 74.31 16.4 520
R6, R720gCL 7.5 10.87 2.1748 9.36 80.64 1.75 20
500gIN+20gCL+2mlMF 4.24 22 25.69 74.31 16.45 522
R8, R920gCL 7.48 19.36 3.87 5.45 94.55 3.66 20
500gIN + 20gPO 4.57 23.77 23.66 76.34 18.146 520
R10, R1120gPO 7.48 19.36 3.87 5.45 94.55 3.66 20
500gIN+20gPO+1mlMF 4.56 23.77 23.66 76.34 18.15 521
R12, R1320gPO 7.48 19.36 3.87 5.45 94.55 3.66 20
500gIN+20gPO+2mlMF 4.56 23.77 23.66 76.34 18.15 522
R14, R15 7.48 10.87 1.087 9.36 80.64 0.875 10
10gON+10gPO+500gIN +
2mlMF
19.36 1.98 5.45 94.55 1.83 10
4.39 22.92 24.64 75.36 17.27 522
Abbreviations: IN – inoculum; CL – cabbage leaves; PO – potato wastes; MF – biocatalyst
Metaferm; TS – total solids; ASH – ashes; DOM – dry organic matter.

300
Results of the digestate analysis are shown in Table 5.
Table5. Results of the digestate analysis of substrates with cabbage and potato wastes
Bioreactor/Raw material pH TS
%
TS
g
ASH % DOM % DOM % Weight g
R1 IN 7.25 3.58 17.78 22.72 77.28 13.74 496.6
R16 IN 7.27 3.5 17.26 20.64 79.36 13.7 293.2
R2 CL+IN 7.27 3.69 18.94 22.14 77.86 14.75 513.4
R3 CL+IN 7.25 3.58 18.29 20.16 79.84 14.6 510.8
R4 CL+IN +1ml MF 7.33 3.25 16.71 20.34 79.66 13.31 514.2
R5 CL+IN +1ml MF 7.35 3.27 16.83 22.92 77.08 12.98 514.8
R6 CL+IN +2ml MF 7.14 3.34 17.23 21.69 78.31 13.49 515.8
R7 CL+IN +2ml MF 7.19 3.63 18.53 21.34 78.66 14.58 510.5
R8 PO+IN 7.27 3.25 16.54 21.66 78.34 12.96 509
R9 PO+IN 7.31 3.38 17.16 22.18 77.82 13.36 507.8
R10 PO+IN+1 ml MF 7.21 3.29 16.92 20.13 79.87 13.51 514.2
R11 PO+IN+1 ml MF 7.16 3.49 17.88 23.68 76.32 13.64 512.2
R12 PO+IN+2 ml MF 7.25 3.38 17.35 24.53 75.47 13.09 513.2
R13 PO+IN+2 ml MF 7.21 3.23 16.53 22.95 77.05 12.74 512
R14 CL+PO+IN+2 ml MF 7.17 3.29 16.86 24.61 75.39 12.71 512.6
R15 CL+PO+IN+2 ml MF 7.25 3.22 16.54 26.56 73.44 12.15 513.8
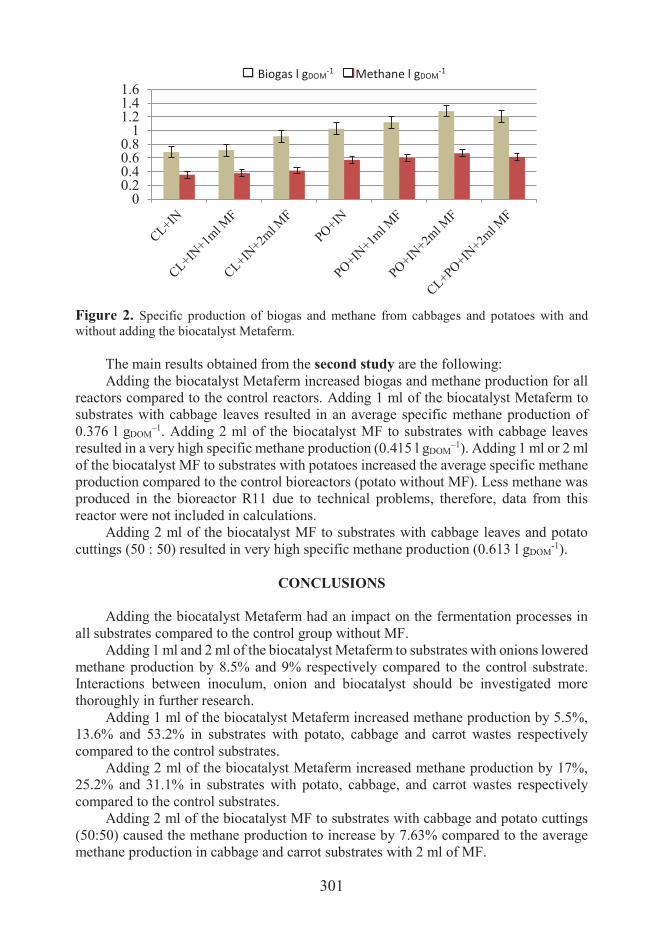
The production of biogas and methane from cabbage and potato wastes is presented
in Table 6 and Fig. 2.
Table 6. Production of biogas and methane from cabbage and potato wastes in bioreactors
Bioreactor/Raw material Biogas
l
Biogas
l gDOM–1
Methane
aver.%
Methane
l
Methane
l gDOM–1
R1 IN 0.3 0.039
R16 IN 0.4 0.02
R2 CL+IN* 1.2 0.685 50 0.597 0.341
R3 CL+IN 1.1 0.628 51 0.561 0.32
R4 CL+IN +1ml MF 1.3 0.742 51.92 0.675 0.385
R5 CL+IN +1ml MF 1.2 0.685 53.42 0.641 0.366
R6 CL+IN +2ml MF 1.5 0.857 49.4 0.741 0.423
R7 CL+IN +2ml MF 1.7 0.971 41.82 0.711 0.406
R8 PO+IN 4.1 1.12 52.71 2.161 0.59
R9 PO+IN 3.4 0.928 59.14 2.011 0.549
R10 PO+IN+1ml MF 4.1 1.12 53.68 2.201 0.601
R11 PO+IN+1ml MF 3.3 0.902 55.48 1.831 0.5*
R12 PO+IN+2ml MF 4.7 1.284 53.21 2.501 0.683
R13 PO+IN+2ml MF 4.7 1.284 50.66 2.381 0.651
R14 CL/PO+IN+2ml MF 3.1 1.034 49.39 1.531 0.565
R15 CL/PO+IN+2ml MF 3.7 1.367 48.41 1.791 0.662
*Reactor R11 had technical problems during fermentation; therefore, the data collected from it
were replaced by data obtained from the reactor R10 (with the same substrate composition) in
calculations.
301
Figure 2. Specific production of biogas and methane from cabbages and potatoes with and
without adding the biocatalyst Metaferm.
The main results obtained from the second study are the following:
Adding the biocatalyst Metaferm increased biogas and methane production for all
reactors compared to the control reactors. Adding 1 ml of the biocatalyst Metaferm to
substrates with cabbage leaves resulted in an average specific methane production of
0.376 l gDOM–1. Adding 2 ml of the biocatalyst MF to substrates with cabbage leaves
resulted in a very high specific methane production (0.415 l gDOM–1). Adding 1 ml or 2 ml
of the biocatalyst MF to substrates with potatoes increased the average specific methane
production compared to the control bioreactors (potato without MF). Less methane was
produced in the bioreactor R11 due to technical problems, therefore, data from this
reactor were not included in calculations.
Adding 2 ml of the biocatalyst MF to substrates with cabbage leaves and potato
cuttings (50 : 50) resulted in very high specific methane production (0.613 l gDOM-1).
CONCLUSIONS
Adding the biocatalyst Metaferm had an impact on the fermentation processes in
all substrates compared to the control group without MF.
Adding 1 ml and 2 ml of the biocatalyst Metaferm to substrates with onions lowered
methane production by 8.5% and 9% respectively compared to the control substrate.
Interactions between inoculum, onion and biocatalyst should be investigated more
thoroughly in further research.
Adding 1 ml of the biocatalyst Metaferm increased methane production by 5.5%,
13.6% and 53.2% in substrates with potato, cabbage and carrot wastes respectively
compared to the control substrates.
Adding 2 ml of the biocatalyst Metaferm increased methane production by 17%,
25.2% and 31.1% in substrates with potato, cabbage, and carrot wastes respectively
compared to the control substrates.
Adding 2 ml of the biocatalyst MF to substrates with cabbage and potato cuttings
(50:50) caused the methane production to increase by 7.63% compared to the average
methane production in cabbage and carrot substrates with 2 ml of MF.
00.20.40.60.8
11.21.41.6
Biogas l gDOM-1 Methane l gDOM
-1
302
Adding 2 ml of the biocatalyst Metaferm to a carrot–onion mixture (50%:50%)
caused the methane yield to increase by 17.5% compared to the control bioreactors
containing carrots, but the yield was 11.8% smaller than that of control bioreactors with
onions. This result also confirms the inhibitive interaction between onions and Metaferm
and/or inoculum in anaerobic digestion processes.
Adding 2 ml of the biocatalyst Metaferm to a cabbage–potato mixture (50%:50%)
caused the methane yield to increase by 33% compared to the average value of control
bioreactors containing cabbage and potato mixtures without MF. This result also
confirms the positive effect of the biocatalyst Metaferm on cabbage or potato substrates
undergoing anaerobic digestion processes.
REFERENCES
Ministry of Economics, 2010, Information Report: Republic of Latvia National Renewable
Energy Action Plan for implementing Directive 2009/28/EC of the European Parliament
and of the Council of 23 April 2009 on the promotion of the use of energy from renewable
sources and amending and subsequently repealing Directives 2001/77/EC and 2003/30/EC
by2020, p.103. online:
http://www.ebbeu.org/legis/ActionPlanDirective2009_28/national_renewable_energy_acti
on_plan_latvia_en.pdf
Communication from the commission to the European Parliament, the Council, the European
Economic and Social Committee and the Committee of the Regions, A policy framework
for climate and energy in the period from 2020 to 2030, COM(2014) 15 final, Brussels,
22.1.2014, pp.18, online:
http://eurlex.europa.eu/legalcontent/EN/TXT/PDF/?uri=CELEX:52014DC0015&from=EN
Ministry of Economics, 2015, Register of subsidized electricity producers (in Latvian), online:
https://www.em.gov.lv/files/energetika/SEN_reg_15012015.xls
Feng, XM., Karlsson, A., Svensson, BH., Bertilsson, S. 2010. Impact of trace element addition
on biogas production from food industrial waste––linking process to microbial
communities. FEMS Microbiol Ecol. 2010, Oct; 74(1), 226–40.
Lemmer, A, Vintiloiu, A., Preisler, D., Bauerle, L., Oechsner, H. 2011, Importance of mineral
substances for anaerobic microorganisms and causes of concentrations differences in biogas
digesters. Proceedings of International Congress Biogas in Progress 2 Hohenheim,
Stuttgart, 2011, vol.1, pp. 216–222.
Dubrovskis, V., Plume, I., Kotelenecs, V., Zabarovskis, E. 2011. Biogas production and biogas
potential from agricultural biomass and organic residues in Latvia. Proceedings of
International Congress Biogas in Progress 2, Hohenheim, Stuttgart 2011, vol.2, pp. 80–83.
Irvan, I. 2012.Chemical Engineering Department, University of Sumatera Utara. Effect of Ni and
Co as Trace Metals on Digestion Performance and Biogas Produced from The Fermentation
of Palm Oil Mill Effluent. Internat. J. Waste Resources, Vol. 2(2), 2012,
16–19, p 4.
Facchina, V., Cavinatob, C., Pavanba, P., Bolzonella, D. 2013. Batch and Continuous Mesophilic
Anaerobic Digestion of Food Waste: Effect of Trace Elements Supplementation. Chemical
Engineering Transactions, vol 32, p.6.
Kaltschmitt, M. 2010. Methodenhandbuch Leipzig, p.93.