anaerobic digestion of rendering waste in an upflow anaerobic sludge blanket digester
TRANSCRIPT
Bioresource Technology 41 (1992) 181-185
Short Communication
Anaerobic Digestion of Rendering Waste in an Upflow Anaerobic Sludge Blanket Digester
Abstract
Rendering wastewater was anaerobically digested in an upflow anaerobic sludge blanket (UASB) digester in 11 trials spanning 11 months. The UASB digester influent was 2% blood/98% condensate for six of the trials (phase one) and 56% wash-up water/44% cooker condensate for the other five trials (phase two). The influent chemical oxygen demand (COD) for both phases was 5300 mg/l. The only parameter varied within phases was hydraulic retention time (HRT) which was varied from 5"2 to 15"6 days," however, changing HRT caused loading rate to change because the influent strength was held constant. COD removal efficiencies for phase one ranged from 28 to 72% and for phase two, from 72 to 87%. The biogas production from all trials contained over 75% methane and had traces of hydrogen sulfide. The production of methane was 0"2-0"25 l/gCOD,~onver, m in phase one and 0"28-0"34 I/gCOD, on verted in phase two.
Key words: Rendering wastewater, anaerobic digestion, upflow anaerobic sludge blanket digester.
INTRODUCTION
Livestock slaughtering and meat processing operations produce large quantities of highly peri- shable by-products that are not directly utilizable as human or animal food. These by-products are the raw materials for rendering; the finished pro- ducts are meat meals and fat (tallow) (Burnham, 1978).
The volume and strength of wastewater from rendering is directly proportional to the amount of raw material processed (Wilkowske et al., 1979; Loehr, 1984). The wastewater is generally
hot and contains blood, fat, and bits of animal tissue.
Pretreating food processing wastewater will often yield a positive net benefit to the processor. The costs associated with pretreatment facilities, less the value of saleable by-products, are fre- quently less than sewer surcharge fees for untreated waste (McVaugh, 1979; Hansen et al., 1984).
Biomass retention systems, such as upflow anaerobic sludge blanket (UASB) digesters are more efficient than complete mix digesters for most wastewaters low in suspended material (Lettinga et al., 1980; Frostel, 1981; Lettinga & Vinken, 1981 ).
METHODS
UASB system description Three laboratory-scale digesters were constructed of plexiglass pipe, 54 cm long and 14 cm in diameter, similar to designs used in previous sludge blanket work (West, 1988). The bottom 3.2 cm of the digesters were tapered to an inside diameter of 1.9 cm. The effective volume of each digester was 7-8 1. Five sludge sampling ports, having a diameter of 0.95 cm, were spaced along the length of the digesters to permit sampling of the sludge blanket. The first four ports were spaced 5.1 cm apart (on center) starting 2-5 cm from the base; port five was 8"6 cm up from the fourth port.
The digesters were fed twice daily with the influent volumes given in Table 1. The influent was fed slowly enough that, by appearance, the sludge bed was not disturbed.
Digester contents were continuously recircu- lated (200 ml/min) by peristaltic pumps between loadings except for 5 min each hour to allow for
181 Bioresource Technology 0960-8524/92/S05.00 © 1992 Elsevier Science Publishers Ltd, England. Printed in Great Britain
182 Conly L. Hansen, Gregery T. West
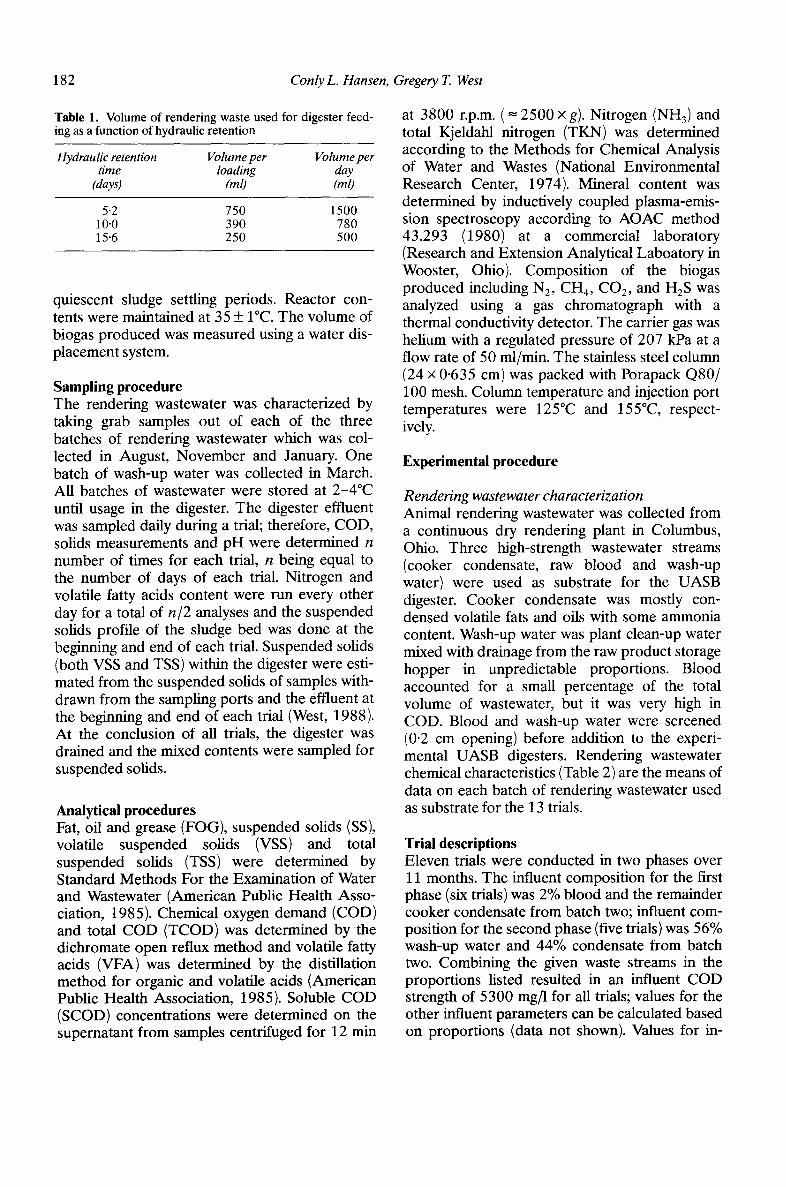
Table 1. Volume of rendering waste used for digester feed- ing as a function of hydraulic retention
Hydraulic retention Volume per Volume per time loading day
(days) (ml) (ml)
5.2 750 1500 10.0 390 780 15.6 250 500
quiescent sludge settling periods. Reactor con- tents were maintained at 35 + I°C. The volume of biogas produced was measured using a water dis- placement system.
Sampling procedure The rendering wastewater was characterized by taking grab samples out of each of the three batches of rendering wastewater which was col- lected in August, November and January. One batch of wash-up water was collected in March. All batches of wastewater were stored at 2-4°C until usage in the digester. The digester effluent was sampled daily during a trial; therefore, COD, solids measurements and pH were determined n number of times for each trial, n being equal to the number of days of each trial. Nitrogen and volatile fatty acids content were run every other day for a total of n/2 analyses and the suspended solids profile of the sludge bed was done at the beginning and end of each trial. Suspended solids (both VSS and TSS) within the digester were esti- mated from the suspended solids of samples with- drawn from the sampling ports and the effluent at the beginning and end of each trial (West, 1988). At the conclusion of all trials, the digester was drained and the mixed contents were sampled for suspended solids.
Analytical procedures Fat, oil and grease (FOG), suspended solids (SS), volatile suspended solids (VSS) and total suspended solids (TSS) were determined by Standard Methods For the Examination of Water and Wastewater (American Public Health Asso- ciation, 1985). Chemical oxygen demand (COD) and total COD (TCOD) was determined by the dichromate open reflux method and volatile fatty acids (VFA) was determined by the distillation method for organic and volatile acids (American Public Health Association, 1985). Soluble COD (SCOD) concentrations were determined on the supernatant from samples centrifuged for 12 min
at 3800 r.p.m. (= 2500 x g). Nitrogen (NH3) and total Kjeldahl nitrogen (TKN) was determined according to the Methods for Chemical Analysis of Water and Wastes (National Environmental Research Center, 1974). Mineral content was determined by inductively coupled plasma-emis- sion spectroscopy according to AOAC method 43.293 (1980) at a commercial laboratory (Research and Extension Analytical Laboatory in Wooster, Ohio). Composition of the biogas produced including N2, CH4, CO2, and H2S was analyzed using a gas chromatograph with a thermal conductivity detector. The carrier gas was helium with a regulated pressure of 207 kPa at a flow rate of 50 ml/min. The stainless steel column (24 x 0"635 cm) was packed with Porapack Q80/ 100 mesh. Column temperature and injection port temperatures were 125°C and 155°C, respect- ively.
Experimental procedure
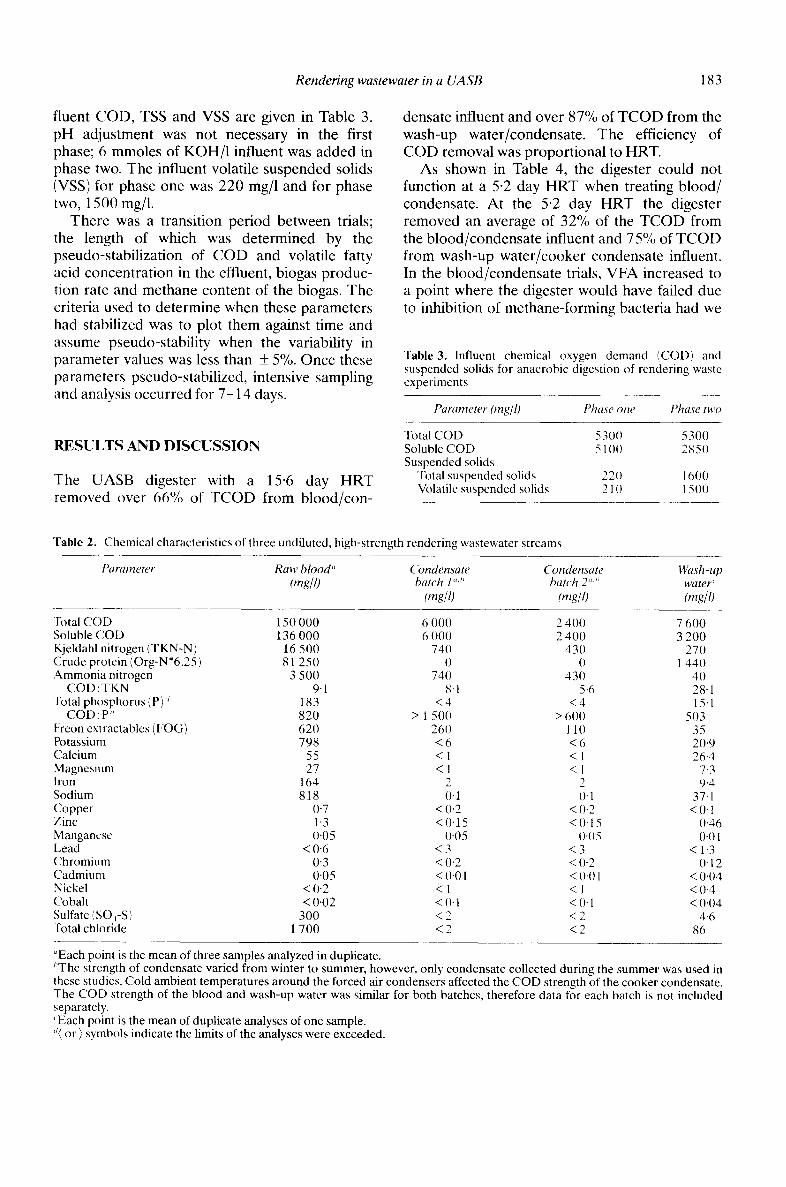
Rendering wastewater characterization Animal rendering wastewater was collected from a continuous dry rendering plant in Columbus, Ohio. Three high-strength wastewater streams (cooker condensate, raw blood and wash-up water) were used as substrate for the UASB digester. Cooker condensate was mostly con- densed volatile fats and oils with some ammonia content. Wash-up water was plant clean-up water mixed with drainage from the raw product storage hopper in unpredictable proportions. Blood accounted for a small percentage of the total volume of wastewater, but it was very high in COD. Blood and wash-up water were screened (0.2 cm opening) before addition to the experi- mental UASB digesters. Rendering wastewater chemical characteristics (Table 2) are the means of data on each batch of rendering wastewater used as substrate for the 13 trials.
Trial descriptions Eleven trials were conducted in two phases over 11 months. The influent composition for the first phase (six trials) was 2% blood and the remainder cooker condensate from batch two; influent com- position for the second phase (five trials) was 56% wash-up water and 44% condensate from batch two. Combining the given waste streams in the proportions listed resulted in an influent COD strength of 5300 mg/1 for all trials; values for the other influent parameters can be calculated based on proportions (data not shown). Values for in-
R e n d er i ng was tewater in a U A S B 183
fluent COD, TSS and VSS are given in Table 3. pH adjustment was not necessary in the first phase; 6 mmoles of KOH/I influent was added in phase two. The influent volatile suspended solids (VSS) for phase one was 220 mg/l and for phase two, 1500 mg/l.
There was a transition period between trials; the length of which was determined by the pseudo-stabilization of COD and volatile fatty acid concentration in the effluent, biogas produc- tion rate and methane content of the biogas. The criteria used to determine when these parameters had stabilized was to plot them against time and assume pseudo-stability when the variability in parameter values was less than _+ 5%. Once these parameters pseudo-stabilized, intensive sampling and analysis occurred for 7 -14 days.
densate influent and over 87% of TCOD from the wash-up water/condensate. The efficiency of COD removal was proportional to HRT.
As shown in Table 4, the digester could not function at a 5-2 day HRT when treating blood/ condensate. At the 5.2 day HRT the digester removed an average of 32% of the TCOD from the blood/condensate influent and 75% of TCOD from wash-up water/cooker condensate influent. In the blood/condensate trials, VFA increased to a point where the digester would have failed due to inhibition of methane-forming bacteria had we
Table 3. lnfluent chemical oxygen demand (COD) and suspended solids for anaerobic digestion of rendering waste experiments
Parameter (mg/l) Phase one Phase two
Total COD 5300 5300 R E S U L T S A N D D I S C U S S I O N Soluble COD 51/)t) 2850
Suspended solids
The UASB digester with a 15.6 day HRT Total suspendedsolids 220 1600 removed over 66% of TCOD from blood/con- Volatile suspended solids 211) 1500
"fable 2. Chemical characteristics of three undiluted, high-strength rendering wastewater streams
Parameter Raw blood" Condensate Condensate Wash-up (rng/l) batch I "" h bat~'h 2 "- t, water'
(mg/ l) (mg/ l) (mg/ l)
Total COD 150 000 6 00l) 2 400 7 600 Soluble COD 136 000 6 000 2 400 3 200 Kjeldahl nitrogen (TKN-N) 16 500 740 430 270 Crude protein (Org-N*6.25) 81 250 0 0 1 440 Ammonia nitrogen 3 500 740 430 40
C O D : T K N 9-1 8"1 5"6 28"1 Total phosphorus (P) '~ 183 < 4 < 4 15" 1
COD: p,l 820 > 1 500 > 600 503 [-'reon extractables (FOG) 620 260 110 35 Potassium 798 < 6 < 6 20"9 Calcium 55 < 1 < 1 26.4 Magnesium 27 < 1 < 1 7'3 Iron 164 2 2 9.4 Sodium 818 0" 1 0-1 37" 1 Copper 0"7 < 1)'2 < 1)-2 < 0.1 Zinc 1"3 < 0"15 < 0" 15 0"46 Manganese 0"05 0'05 0-05 /)'t) 1 Lead < 0'6 < 3 < 3 < 1 "3 Chromium 0"3 < 1).2 < 0.2 0-12 Cadmium 0"05 < (l.01 < 1)-01 < 0.04 Nickel < 0.2 < I < 1 < 1)-4 Cobalt < 0.02 < 0.l < 0-1 < 0-1)4 Sulfate (SO~-S) 300 < 2 < 2 4.6 Total chloride 1 700 < 2 < 2 86
"Each point is the mean of three samples analyzed in duplicate. ~'The strength of condensate varied from winter to summer, however, only condensate collected during the summer was used in these studies. Cold ambient temperatures around the forced air condensers affected the COD strength of the cooker condensate. The COD strength of the blood and wash-up water was similar for both batches, therefore data for each batch is not included separately. ' Each point is the mean of duplicate analyses of one sample. ,/( or ) symbols indicate the limits of the analyses were exceeded.
184 Conly L. Hansen, Gregery T. West
not stopped the trials by increasing the HRT until the digester pseudo-stabilized and eventually starting new trials with higher HRT. Efficiency of TCOD removal was directly correlated with VFA in the digester. High VFA causes high effluent COD concentration not only because of bacterial inhibition, but also because the VFA itself con- tributes to the COD. High VFA was indicative that the organic acids formed by the acidifiers in
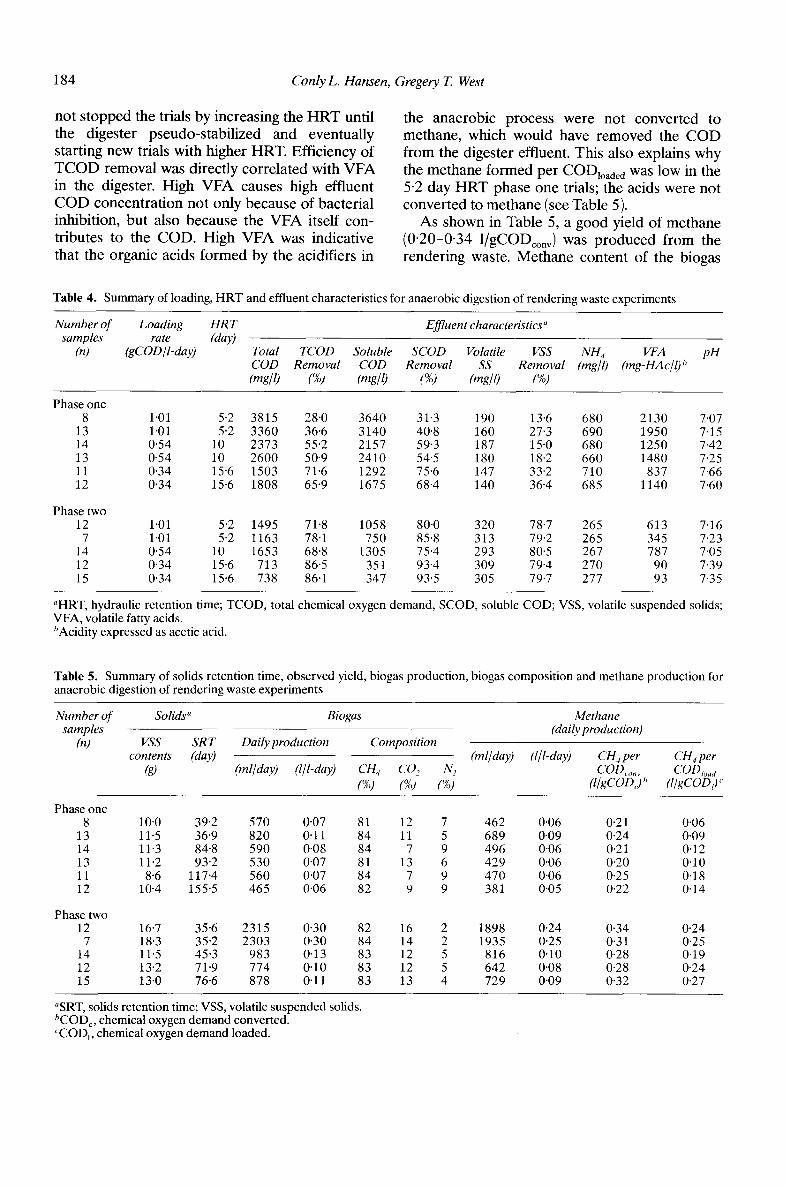
the anaerobic process were not converted to methane, which would have removed the COD from the digester effluent. This also explains why the methane formed per COD~oaded was low in the 5-2 day HRT phase one trials; the acids were not converted to methane (see Table 5).
As shown in Table 5, a good yield of methane (0"20-0"34 1/gCODconv ) was produced from the rendering waste. Methane content of the biogas
Table 4. Summary of loading, HRT and effluent characteristics for anaerobic digestion of rendering waste experiments
Number of Loading HR T samples rate (day)
(n) (gCOD/l-day)
Effluent characteristics ~
Total TCOD Soluble SCOD Volatile VSS N H 4 VFA COD Removal COD Removal SS Removal (mg/l) (mg-HAc/l) b (mg/l) (%) (muff) (%) (mg/O (%)
pH
Phase one 8 1"01 5"2 3815 28"0 3640
13 1"01 5'2 3360 36"6 3140 14 0"54 10 2373 55"2 2157 13 0"54 10 2600 50"9 2410 11 0"34 15"6 1503 71"6 1292 12 0"34 15'6 1808 65"9 1675
Phasetwo 12 1"01 5"2 1495 71.8 1058
7 1-01 5"2 1163 78"1 750 14 0.54 10 1653 68"8 1305 12 0'34 15.6 713 86"5 351 15 0.34 15.6 738 86.1 347
31.3 190 13.6 680 2130 7.07 40"8 160 27.3 690 1950 7.15 59.3 187 15.0 680 1250 7"42 54-5 180 18.2 660 1480 7.25 75-6 147 33.2 710 837 7.66 68-4 140 36.4 685 1140 7.60
80.0 320 78.7 265 613 7.16 85.8 313 79.2 265 345 7.23 75.4 293 80.5 267 787 7.05 93-4 309 79.4 270 90 7"39 93.5 305 79.7 277 93 7.35
aHRT, hydraulic retention time; TCOD, VFA, volatile fatty acids. bAcidity expressed as acetic acid.
total chemical oxygen demand, SCOD, soluble COD; VSS, volatile suspended solids;
Table 5. Summary of solids retention time, observed yield, biogas production, biogas composition and methane production for anaerobic digestion of rendering waste experiments
Number of Solids ~ Biogas Methane samples (daily production)
(n) VSS SR T Daily production Composition contents (day) (ml/ day) (Ill-day) CH 4 per 6"144 per
(g) (ml/day) (Ill-day) Ctt 4 COt N2 COD, ..... CODto~a (%) (%) (%) (l/gCOD) h (l/gCOD)"
Phase one 8 10.0 39"2 570 0"07 81 12 7 462 0"06 0.21 0.06
13 11.5 36'9 820 0.11 84 11 5 689 0"09 0.24 0"09 14 11"3 84"8 590 0.08 84 7 9 496 0"06 0.21 0-12 13 11"2 93"2 530 0'07 81 13 6 429 0"06 0.20 0.10 11 8"6 117.4 560 0"07 84 7 9 470 0"06 0.25 0.18 12 10-4 155.5 465 0-06 82 9 9 381 0.05 0.22 0.14
Phasetwo 12 16.7 35"6 2315 0"30 82 16 2 1898 0.24 0.34 0.24
7 18-3 35"2 2303 0.30 84 14 2 1935 0.25 0.31 0.25 14 11-5 45"3 983 0.13 83 12 5 816 0.10 0-28 0.19 12 13.2 71-9 774 0"10 83 12 5 642 0"08 0.28 0.24 15 13.0 76.6 878 0.11 83 13 4 729 0"09 0.32 0-27
aSRT, solids retention time; VSS, volatile suspended bCODc, chemical oxygen demand converted. CCOD~, chemical oxygen demand loaded.
solids.
Rendering wastewater in a UASB 185
was always greater than 81%. Methane produc- tion increased with VSS content in the digester. Trace amounts of hydrogen sulfide were detec ted in the biogas for all trials (data not shown). Con- version efficiencies of C O D to methane for phase two were higher than during phase one, and were close to the theoretical max imum of 0"35 l/g COD~on,,. Part of the C O D in these digesters was conver ted to new cell material which would lower the methane product ion values.
In all phase one experiments, pH stayed above 7 without the addit ion of buffer chemicals. The high VFA, which was near 2000 mg/1 (expressed as acetic acid), would usually result in a lower pH than 7. The high concentra t ion of ammonia was probably what kept the pH up. A m m o n i a con- centrat ion in phase one stayed high for all trials and when VFA went down with longer HRT, pH went up.
C O N C L U S I O N S
The combinat ion of raw b lood /cooke r con- densate was not successfully t reated in a UASB digester at an H R T of 5-2 days. At a 10 day HRT, which also reduced the loading rate to 0"54 g/l- day, the digester was able to remove about 50% of TCOD. At 15.6 day HRT, over 66% of T C O D was removed.
Based on C O D removals, the combinat ion of wash-up water and condensa te is treatable in a UASB digester with H R T as low as 5-2 days.
The composi t ion of biogas p roduced f rom rendering wastewater in all trials contained greater than 80% methane and has potential for utilization within a render ing plant as an energy source.
REFERENCES
American Public Health Association (1985). Standard Methods for the Examination of Water and Wastewater, 16th edn., Washington, DC.
Burnham, F. (1978). Rendering, the Invisible Industry. Aero Publishers, Inc., Fall brook, CA.
Frostel, B. (1981). Anaerobic treatment in a sludge bed system compared with a filter system. J. WPCF, 53, 216-22.
Hansen, C. L., White, R. K. & Okos, M. R. (1984). Optimiza- tion of water management and associated energy in a meat packing plant. Trans. ASAE, 27,305-10.
Lettinga, G. & Vinken, J. N. ( 1981 ). Feasibility of the upflow anaerobic sludge blanket (UASB) process for the treat- ment of low-strength wastes. In Proceedings 35th Ind. Waste Conf., Ann Arbor Science, pp. 625-34.
Lettinga, G., van Velsen, A. E M., Hobma, S. W., de Zeeuw, W. & Klapwijk, A. (1980). Use of the upflow sludge blanket reactor concept, especially for anaerobic treat- ment. Biotech. Bioeng., 22,699-734.
Loehr, R. C. (1984). Pollution (~mtrol for Agriculture. Academic Press, New York.
McVaugh, J. (1979). Wastewater treatment in the meat pack- ing and rendering industries. In Food Processing Waste Management, eds. H. Green & A. Kramer. AVI Publishing Co., Westport, CN, pp. 299-321.
National Environmental Research Center (1974). Methods for ~Twmical Analysis of Water and Wastes, Available through the Office of Technology Transfer, Washington, DC.
West, G. E (1988). Cogeneration of' Methane and Microbial Protein From the Anaerobic 7reatment of Rendering Waste. Dissertation, Dept. Agric. Eng., The Ohio State University.
Wilkowske, R. H., Carawan, R. E., Chambers, J. V. & Zall, A. M. (1979). Meat Processing Water and Wastewater Management. Extension Special Report No. AM-18C, N.C. Agricultural Extension Service.
Conly L. Hansen Department of Nutrition and Food Sciences, Utah State University, Logan, Utah 84322-8700, USA
ACKNOWLEDGMENTS
This research was suppor ted by the Utah Agricul- tural Exper iment Station, Utah State University, Logan, Utah 85433-4810. Approved as journal paper no. 3978. We also express appreciat ion to Dr Rober t M. Sykes, The Ohio State University, for his valued input to the project.
& Gregery T. West Kraft, Inc., 801 Waukegan Road, Glenview, Illinois 60025, USA
(Received 2 April 1990; revised version received 16 September 1991 ; accepted 18 September 1991 )