anaerobic digestion of biological sludge from the pulp …357263/fulltext01.pdf ·...
TRANSCRIPT

1
Anaerobic digestion of
biological sludge from the
pulp and paper industry Robin Karlsson Linköping 2010 Department of Thematic Studies, Water and Environment Linköping University Supervisors: Examiner: Jörgen Ejlertsson and Xu-Bin Truong Prof. Bo Svensson Scandinavian Biogas Fuels Department of Thematic Studies, 581 83 Linköping Water and Environment Linköping University
581 83 Linköping

2

3
Acknowledgements I could not have accomplished this thesis without a handful of helpful and positive people. I would like to thank: My examiner Bo Svensson, for giving me feedback and guidance throughout the whole period. My supervisor Jörgen Ejlertsson. The meetings, telephone calls and discussions we have had were irreplaceable. I really appreciate your commitment, patience and capability of focusing on the issue here and now. The person who has helped me the most in the laboratory, Xu-Bin Truong. Your unceasing helpfulness and energy made it easy for me in the laboratory. Days, evenings, lunch breaks or vacation – you always took your time to help me out and also gave the responsibility for me to feel that I was a part of an important and rewarding project. The R&D personnel at Scandinavian Biogas Fuels in Linköping. Your help in the laboratory is very appreciated by me and the lunch hours and other social moments were invaluable for my motivation and mood. Thank you for treating me like an employed and making me feel like at home, at work! Without Eva Enqvist at the Department of Mathematics, Linköping University, I could not have performed the statistical tests that I wanted. You certainly gave me all the help I could have asked for and did not hesitate to spare me your time. Scandinavian Biogas Fuels and the Department of Thematic Studies, Water and Environment, for letting me perform my master´s thesis in your premises. The two Swedish pulp and paper mills, for providing the biological sludge used in this study. Ann-Louise Borg, my opponent for giving me accreditive criticism on the report and encouragement during the final weeks of writing. Sina Eftekhari, you helped me organizing my report at a critical stage and contributed to some extra pace and flow in the writing process. Patricia, my girlfriend and Princess. Your love, care and energy makes my life simple and wonderful and have helped me a lot during this master’s thesis! I would also like to thank my closest family and friends for asking about the thesis, how the work proceeded and giving me positive energy. Written on a sunny Monday in August, 2009 Robin Karlsson
4
Abstract The need for - and use of non-fossile fuels such as biogas have increased due to global warming, oil depletion and stricter environmental regulations. Organic wastes can be anaerobically digested in order to produce biogas, which can be utilized to generate heat or electricity. So far, little attention has been directed towards anaerobic digestion of organic wastes from the forest industry. Due to high sludge management costs and more rigorous environmental legislation, the demand for new and/or improved disposal methodologies has increased. Substrate treatment methods such as enzyme addition and ultrasound are of interest in order to make anaerobic digestion of organic wastes, e.g. biological sludge, economically feasible. The aim of this study is to evaluate if biological sludge from the pulp and paper industry can be used for methane production in anaerobic digestion and to investigate the effects of ultrasound pre-treatment and enzyme treatment. The aim of the study was accomplished by performing four batch experiments, during 67-110 days, and a six months laboratory-scale semi-continuous digestion experiment. Substrates were provided by a chemical and a mechanical paper mill, whereas Kemzymes® from Kemira and ultrasound equipment from Ultra Sonus were used for sludge treatment. The short term average accumulation of methane per added g VS rate increased both when ultrasound pre-treatment and enzyme treatment was applied in batch experiments. The enzyme treatment was considered to have a greater potential in larger scale and was consequently used in the semi-continuous digestion experiment. Positive effects of the treatment were however difficult to prove. Adapting the enzyme treatment to be more specific for the degradation of the sludge is recommended. It is possible that there are inhibitory interactions between ultrasound pre-treatment and enzyme treatment. 75% ultrasound pre-treatment is an alternative to complete pre-treatment and renders equivalent average accumulation of methane per added g VS. Storage of ultrasound pre-treated biological sludge at 4°C for six and 13 days does not affect the average accumulation of methane per added g VS. Enzyme treatment of biological sludge enhanced the average accumulation of methane per added g VS from indigenous material in the inoculum. It is likely that anaerobic digestion of biological sludge from the pulp and paper industry can render a stable biogas production. High viscosity and agitation problems were predominant in the semi-continuous digestion experiment and can be difficult to control in larger scale. The results from the semi-continuous digestion experiment are similar with those obtained from the batch experiments. The methane production rates in this study are lower (biological sludge from chemical pulp process) or higher (mechanical ditto) in comparison to those presented data by Puhakka et al. (1992). Different types of biological sludge were used and might explain the prevailing differences.

5
Sammanfattning Behovet - och användandet av icke-fossila bränslen såsom biogas har ökat på grund av den globala uppvärmningen, utarmningen av olja och strängare miljökrav. Organiskt avfall kan brytas ned anaerobt för att producera biogas, som kan utnyttjas för att generera värme eller elektricitet. Hittills har lite uppmärksamhet riktats mot rötning av organiskt avfall från skogsindustrin. På grund av höga kostnader för hantering av slam och strängare miljölagstiftning har efterfrågan på nya och / eller förbättrade metoder för omhändertagande av slam ökat. Behandling av slam med enzym och ultraljud är av intresse för att göra rötning av organiskt avfall, t.ex. biologiskt slam, ekonomiskt försvarbart. Syftet med denna studie är att utvärdera om biologiskt slam från massa-och pappersindustrin kan användas för metanproduktion och att undersöka effekterna av enzymbehandling och förbehandling med ultraljud. För att uppfylla syftet med studien genomfördes fyra batchexperiment, under 67-110 dagar och ett semi-kontinuerligt sex månaders utrötningsexperiment. Som substrat användes biologiskt slam från en kemisk och ett mekaniskt pappersbruk. Kemzymes ® från Kemira och ultraljudsutrustning från Ultra Sonus användes för behandling av slam. På kort sikt ökade den genomsnittliga ackumulerade bildningen av metan per tillsatt g VS både när förbehandling med ultraljud och enzymbehandling tillämpades i batchexperiment. Enzymbehandlingen ansågs ha en större potential i större skala och användes till ett semi-kontinuerligt utrötningsexperiment. Positiva effekter av behandlingen var dock svårt att bevisa. Att anpassa enzymbehandlingen för att bli mer specifik för nedbrytning av slammet rekommenderas. Det är möjligt att det finns hämmande samspelseffekter mellan förbehandling med ultraljud och enzymbehandling. 75% ultraljudförbehandlat slam är ett alternativ till komplett förbehandling och uppvisar motsvarande bildning av metan per tillsatt g VS. Att förvara biologiskt slam, som har förbehandlats med ultraljud vid 4 ° C under sex och 13 dagar påverkar inte den genomsnittliga ackumuleringen av metan per tillsatt g VS. Enzymbehandling av biologiskt slam och ympmaterial har större effekt på ympmaterialet än på det biologiska slammet. Det är troligt att rötning av biologiskt slam från massa- och pappersindustrin kan ge en stabil produktion av biogas. Hög viskositet och problem med omrörning förekom i den semi-kontinuerliga utrötningen och kan vara svårt att kontrollera i större skala. Resultaten från den semi-kontinuerliga utrötningen är likvärdiga med de som erhållits från batchexperimenten. Metanproduktionen i denna studie är lägre (biologiskt slam från kemisk massa process) eller högre (mekanisk dito) i jämförelse med de resultat som Puhakka et al. (1992) presenterade. Olika typer av biologiskt slam har använts och kan förklara skillnaderna mellan studiernas resultat.

6
Table of content
ABBREVIATIONS...................................................................................................... 8
1 PROBLEM DESCRIPTION, AIM, HYPOTHESIS AND QUESTION FORMULATIONS OF THE STUDY ........................................................................... 9
1.1 Introduction and problem description.................................................................................................. 9
1.2 Aim........................................................................................................................................................... 9
1.3 Hypotheses............................................................................................................................................. 10
1.4 Delimitations ......................................................................................................................................... 10
2 THEORETICAL BACKGROUND .................................................................. 11
2.1 Global warming, renewable energy and vehicle fuels........................................................................ 11
2.2 Anaerobic digestion and biogas production ....................................................................................... 11 2.2.1 Microbiology...................................................................................................................................... 12 2.2.2 Process parameters, factors and reactor optimization ........................................................................ 13
2.3 The pulp and paper industry ............................................................................................................... 14 2.3.1 Pulp and paper production ................................................................................................................. 14 2.3.2 Waste treatment ................................................................................................................................. 14
2.4 Mesophilic anaerobic digestion of sludge and sludge treatment methods in the pulp and paper
industry ................................................................................................................................................................ 16 2.4.1 Ultrasonic pre-treatment .................................................................................................................... 17 2.4.2 Hydrolytic enzyme treatment............................................................................................................. 17
3 MATERIALS AND METHODS ...................................................................... 18
3.1 Experimental overview......................................................................................................................... 18
3.2 Experimental design ............................................................................................................................. 18
3.3 Calculations of process parameters in batch experiments and semi-continuous digestion
experiment ........................................................................................................................................................... 18
3.4 Batch experiments ................................................................................................................................ 19 3.4.1 Inoculum ............................................................................................................................................ 19 3.4.2 Substrate............................................................................................................................................. 20 3.4.3 Treatment of substrates ...................................................................................................................... 20 3.4.4 Preparation of experimental bottles and controls ............................................................................... 22 3.4.5 Experiment 1: Effects of ultrasonic pre-treatment and enzyme treatment of substrate...................... 24 3.4.6 Experiment 2: Effects of partial ultrasonic pre-treated substrate ....................................................... 25 3.4.7 Experiment 3: Time - and cooling effects of ultrasonically pre-treated substrate.............................. 26 3.4.8 Experiment 4: Effects of enzyme treatment of inoculum................................................................... 26 3.4.9 Analytical equipment and methodology ............................................................................................ 26
3.5 Semi-continuous digestion experiment................................................................................................ 28 3.5.1 Inoculum ............................................................................................................................................ 28 3.5.2 Substrate............................................................................................................................................. 28 3.5.3 Reactor configuration, start-up and substrate feed............................................................................. 29

7
3.5.4 Hydrolytic enzymes treatment of substrates ...................................................................................... 31 3.5.5 Analytical equipment and methodology ............................................................................................ 31
4 RESULTS AND DISCUSSION ...................................................................... 32
4.1 Batch experiments ................................................................................................................................ 32 4.1.1 Experiment 1: Effects of ultrasonic pre-treatment and enzyme treatment of substrate...................... 32 4.1.2 Experiment 2: Effects of partial ultrasonic pre-treated substrate ....................................................... 40 4.1.3 Experiment 3: Time - and cooling effects of ultrasonically pre-treated substrate.............................. 43 4.1.4 Experiment 4: Effects of enzyme treatment of inoculum................................................................... 44
4.2 Semi-continuous digestion experiment................................................................................................ 46 4.2.1 pH of the digested sludge................................................................................................................... 46 4.2.2 Hydraulic retention time (HRT) and organic loading rate (OLR)...................................................... 46 4.2.3 Stirring, foaming, scum layer formation and stratification tendencies............................................... 46 4.2.4 Viscosity ............................................................................................................................................ 46 4.2.5 Volatile solids-reduction .................................................................................................................... 47 4.2.6 Methane production ........................................................................................................................... 49 4.2.7 General discussion of the results in the semi-continuous digestion experiment ................................ 53
4.3 General discussion of all results........................................................................................................... 53
5 CONCLUSIONS ............................................................................................ 57
6 RECOMMENDATIONS FOR FURTHER WORK........................................... 58
7 REFERENCES .............................................................................................. 59
APPENDIXES .......................................................................................................... 64
Appendix A: Calculation of average accumulation of methane per added g VS, r, in batch experiments . 64
Appendix B: Calculation of ultrasonic pre-treatment effects in batch experiments ..................................... 66
Appendix C: Calculations of the methane yield of proteins and carbohydrates ........................................... 68
Appendix D: Construction of decay curve in the semi-continuous digestion experiment ............................ 70

8
Abbreviations The list below summarizes and explains the abbreviations frequently used in this work. AD Anaerobic digestion. Microbial disintegration of organic matter during oxygen-
free conditions. CSTR Completely stirred tank reactors. Common reactor used in anaerobic digestion
equipped with a mechanical agitator. HRT Hydraulic retention time. The number of days needed to replace the working
volume of a reactor. OLR Organic loading rate. The amount of organic material an anaerobic digestion
process receives per litre reactor fluid per day. TS Total solids. The portion of dry matter remaining after a wastewater sample has
been evaporated at 105°C for 20 hours. VS Volatile solids. The proportion of the total solids, which can be volatilized at
550°C. WWTP Wastewater treatment plant. A plant where mechanical, chemical and biological
purification of municipal or industrial effluents are performed.

9
1 Problem description, aim, hypothesis and question formulations of the study
1.1 Introduction and problem description
The need for - and use of non-fossile fuels such as solar energy, hydrogen, ethanol and biogas have increased due to global warming, depletion of oil and stricter environmental legislation (Lauber 2005, Houghton 2004). The potential for further development and use is still large, since non-fossile fuels only constituted 3% of the total vehicle fuels usage in 2005 (EIA 2005). Organic wastes can be utilized in order to generate bio fuels, heat or electricity. Biogas production through anaerobic digestion (AD) of organic wastes is considered to be one of the most environmental friendly alternatives in sludge handling and bio fuel production. (Mata-Alvarez et al) Municipal sewage sludge, animal wastes, household wastes, industrial wastes and industrial wastewaters are common resources for the process. So far, little attention has been directed towards anaerobic digestion of organic wastes from the pulp and paper industry. (Elliott and Mahmood 2007) Due to high sludge management costs (up to 60% of total wastewater treatment cost) and more rigorous legislation, the demand for new and/or improved disposal methodologies has increased (Monte et al. 2009). Land filling, incineration and composting are traditional waste handling methods used for the sludge generated. However, because of the large amount of wastes generated, the high content of volatile solids (VS) and carbohydrates in forest industry sludge, they should be good targets for applying anaerobic digestion techniques. Pre-treatment methods and further research are nevertheless needed to make it economically feasible. (Elliott and Mahmood 2007, Stoica et al. 2009, Rintala and Puhakka 1994, Monte et al. 2009) Biological sludge is a residual product comprising organic solids and inorganic non-biodegradable biomass, which is formed in the biological treatment step in of wastewater treatment (Andreoli et al. 2007). Several studies have shown that ultrasound pre-treatment and enzyme treatment of different types of biological sludge can improve biogas production (Hogan et al. 2004, Nickel and Neis 2007, Mao and Show 2006 & 2007, Grönroos et al. 2005). In unpublished studies carried at Scandinavian Biogas Fuels, it has been found that ultrasound pre-treatment and enzyme treatment of biological sludge from the pulp and paper industry can enhance the biogas production (Ejlertsson J, pers. comm. A). Positive interactions between ultrasound treatment and amendment of hydrolytic enzymes have been shown under aerobic conditions (Yu et al. 2008), why it is of interest to investigate whether this may be the case under anaerobic conditions as well. This master’s thesis was performed in order to further evaluate the effects of ultrasonic pre-treatment and enzyme treatment methods of AD of biological sludge from the pulp and paper industry and relates to a project between Scandinavian Biogas Fuels, Pöyry and the Department of Thematic Studies, Water and Environment at Linköping University.
1.2 Aim
The aim of this master’s thesis is to test the hypothesis by answering the questions presented below.

10
1.3 Hypotheses
Hypothesis A: Ultrasonic pre-treatment and/or enzyme treatment of biological sludge from the pulp and paper industry generates higher methane production in comparison to untreated biological sludge in batch and semi-continuous digestion experiments. Hypothesis B: Anaerobic digestion of biological sludge from the pulp and paper industry can be performed economically sustainable in order to produce biogas. The hypothesis will be rejected or confirmed by the answers to the following questions: 1. How is the methane production affected by ultrasonic pre-treatment and enzyme treatment of biological sludge?
2. Are there interactions between the ultrasonic pre-treatment and enzyme treatment methods in batch experiments?
3. Can a part of the biological sludge be pre-treated with ultrasound with similar average accumulation of methane per added g VS as if 100% pre-treatment had been done?
4. Will the average accumulation of methane per added g VS from sonicated sludge change with time during storage at 4oC?
5. Does enzyme treatment of biological sludge enhance the average accumulation of methane per added g VS from indigenous material in the inoculum?
6. Can anaerobic digestion of biological sludge from the pulp- and paper industry be done under stable biogas production?
7. What are the characteristics of the biological sludge in regards to viscosity, foaming and stratification tendency in semi-continuous digestion?
8. Are the results from the batch and the semi-continuous digestion experiments similar?
1.4 Delimitations
The master’s thesis comprises a semester period of 30 ECTS credits. The start-up, daily maintenance and analytical methodologies of the semi-continuous reactors described in section 3.5 were primarily performed by laboratory personnel at Scandinavian Biogas Fuels. The choice of experimental periods in the semi-continuous digestion experiment, the sample sizes and the extent of the statistical analyses of the batch experiments were chosen with regard to the aforementioned limited extent of the master’s thesis.

11
2 Theoretical background
2.1 Global warming, renewable energy and vehicle fuels
The greenhouse effect is responsible for keeping a balanced temperature on earth. About two thirds of the incoming solar energy is absorbed by the earth and its surrounding atmosphere. A net energy level of zero is kept by thermal radiation from the earth by emission from the earth surface, clouds and green house gases such as carbon dioxide. If there’s an increase in the formation of carbon dioxide, less energy is emitted than absorbed and global warming occurs. Carbon dioxide and other greenhouse gases hamper solar heat energy from leaving the atmosphere and this enhanced greenhouse effect induces higher temperatures and changed climate. It has been stated that the temperature increase the last hundred years is not induced by natural variations and that the warming during the last 50 years most likely is induced by an increase of greenhouse gases. By decreasing or sequestering carbon dioxide, the enhanced greenhouse effect can be mitigated. One way of doing this is to replace the use of fossil energy with renewable and carbon dioxide neutral energy resources. (Houghton 2004) The need for renewable energy has also increased due to oil depletion and stricter environmental regulations such as the Kyoto Protocol (Lauber 2005, Houghton 2004). Whereas solar energy is the most abundant renewable energy source, solid, liquid and gaseous bio fuels are other important renewable energy sources. Biogas, for instance, can be generated by utilizing the continuous organic waste production and renewable biomass such as energy crops. (Mittal 1997, Weiland 2000) Methanol, ethanol and hydrogen are other bio fuels possible to produce by processing renewable resources such as biomass and organic wastes (Pankhurst 1983). In the year 2005 approximately 97% of all energy consumed by vehicles were petroleum-based, a non renewable energy resource (EIA 2005). According to Romm (2005), gasoline-electric vehicles are the most promising alternative fuel vehicle in the global efforts to replace traditional fossil fuel systems. Hydrogen is another alternative vehicle fuel, but due to infrastructural problems fuel cell cars run on hydrogen are estimated to represent at the most 5% of the market in 2030 (Romm 2005). In a public investigation performed by the Swedish government, biogas was identified as the most environmental friendly vehicle fuel with better results than ethanol, methanol and rapeseed methyl ester (RME; Statens offentliga utredningar 1996). Materials containing lignocellulose from forest management is one of the largest sources of hexose and pentose and can be used in bio fuels production. Development in this field would reduce CO2 emissions, provide a more stable energy supply for the transport sector and also separate the sources for food and bio fuel production. (McKendry 2002)
2.2 Anaerobic digestion and biogas production
The society produces large amounts of wastes causing negative effects on environment and health (Ahring 2003). Since the energy crisis in the 1970´s, the anaerobic digestion process (AD) has been used in order to decrease the use of fossil energy. AD is a biological process converting organic matter into the main products methane (CH4) and carbon dioxide (CO2), usually referred to as biogas. A few percentages of nitrogen (N2) and ppm levels of ammonia (NH3) and hydrogen sulfide (H2S) are also formed. The organic matter used come from sewage sludge, animal wastes, household wastes, industrial wastes and industrial wastewater. Biogas produced from manure, a commonly used source of organic matter, generates roughly 60-70% CH4 and 30-40% CO2 (dry gas; Angelidaki et al. 2003).

12
AD offers two main advantages: reduction of organic matter and biogas production (Angelidaki et al. 2003), where the reduction of organic matter often is measured in terms of abatement of chemical oxygen demand (COD) and biological oxygen demand (BOD; Mittal 1997). According to Mata-Alvarez and colleagues (2000) AD is the most cost-effective of the biological waste treatment methods, since it has a high energy recovery rate and relatively modest environmental effect. In 1998 roughly 36,000 anaerobic digesters were in use in Europe and future European biogas production could reach 15million m3 methane/day (Mata-Alvarez et al. 2000). The biogas can be used to generate heat or electricity through combustion or fuel by processing the gas (Angelidaki et al. 2003). Biogas can be produced in different kinds of bioreactors such as upflow anaerobic sludge blanket (UASB) reactors (Schmidt and Ahring 1996, Lettinga et al. 1979), continuously stirred reactors (CSTR), plug-flow digesters, anaerobic filters, two-stage and two-phase digesters (Nallathambi and Gunaseelan 1997). The most popular high-rate reactor utilized for treatment of miscellaneous wastewaters is the UASB reactor (Schmidt and Ahring 1996). The CSTR:s usually employ substrate with total solids (TS) of approximately 3-8%. CSTR:s can be continuously or semi-continuously climatically-heated, where in the latter case substrate addition and sludge removal is performed on a daily basis. (Nallathambi Gunaseelan 1997) In Sweden, if the digested sludge from a biogas plant is to be used as bio-fertilizer, the substrate must be hygienized at 70°C for 60 minutes according to the EEC regulation 1774/2002 (Bagge et al. 2005). A heat-exchanger is often used between ingoing substrate and outgoing digested sludge. The formed biogas is humid and therefore needs to be cooled prior to usage. If the biogas is intended as vehicle fuel or to be used in other types of gas engines, a H2S concentration below 700ppm is required. This is often achieved by adding a ferrous solution to the reactor or by biological oxidation. Addition of air stimulates spontaneous formation of solid sulphur or sulphurous acid in the reactor headspace. Another alternative is to use a scrubber which washes out acids. (Angelidaki et al. 2003) Several upgrading processes are used in order to raise the methane content of the biogas. Carbon dioxide concentration reduction by water scrubbing and a subsequent adsorption of the gas water content by the Pressure Swing Adsorption. (Nilsson et al. 2001) Lp Cooab is another upgrading technique for removal of CO2 and H2S (www.lackebywater.se). Cryogenic technology can be applied in order to reduce methane losses and remove CO2 and siloxanes (www.scandinaviangts.com). The formed methane is compressed and stored at high pressure, at about 3500psi. (Mittal 1997) AD give rise to sludge with an N-content similar to that in manure. However, N is more bio available in the digested sludge, making sludge a favoured fertiliser. Digested sludge also tends to improve solubility and availability of nutrients in soils and the humic materials in the digested sludge enhance the aeration, moisture holding- and water-infiltration capacity of soil. (Mittal 1997)
2.2.1 Microbiology
The AD process is initialized by hydrolyzing microorganism metabolizing proteins, lipids and carbohydrates. Extracellular hydrolases of these micro-organisms performs depolymerisation of the polymers, making them bioavailable to the bacteria. (Burgess and Pletschke 2008) Thus, mono and oligomers of less than 1kD, e.g. amino acids, monsaccharides, volatile fatty acids (VFA), long chained fatty acids and glycerol, are able to enter the cell and the metabolic pathways. Fermenting micro-organisms primarily digest the intermediates into H2 and acetate and partially into VFA (for example propionate and butyrate) and alcohols, as shown in Figure 2.1. Propionate is further converted into acetate, CO2 and H2 by acetogenic bacteria,

13
whereas acetate and H2 is formed from butyrate. Lastly two groups of methanogenic Archae complete the digestion process by producing CH4 and CO2 from acetate and H2. The formation and degradation of hydrogen and acetate need to be performed simultaneously in order to allow the methanogenic bacteria to produce the final products CH4 and CO2. The hydrolyzing and fermenting bacteria depend on the methanogens and there is also a similar syntrophic relationship between acetogens, which are responsible for acetate conversion from hydrogen, and methanogens. (Ahring 2003) It has been stated that the initial substrate hydrolysis, performed by hydrolyzing micro-organisms, is the rate-limiting step of a balanced AD process (Mahmood and Elliott 2006; Tiehm et al. 1997; Burgess and Pletschke 2008).
Figure 2.1. The process of anaerobic digestion (modified from Schnürer 1995 and Zinder 1984).
2.2.2 Process parameters, factors and reactor optimization
Important factors are temperature, pH, toxicity, substrate composition and accumulation of intermediate products. Bacterial growth rates often increase with increasing temperature to a threshold value. Temperature also influences viscosity, surface tension and mass transfer properties. Unstable temperature renders less effective biogas production. (Angelidaki et al.

14
2003) The rate of AD and CH4 yields have been shown to be high in the range of 20-60°C (Ahring 2003) and AD can therefore be performed under mesophilic (25-40°C) or thermophilic (40°C- ) temperature intervals. Regarding the pH, values in the range 6-8.5 are applicable. NH3, CO2 and organic acids such as VFA influence the pH, where accumulation of the latter indicates process instability. H2S, NH3 and long chain fatty acids belongs to the most common toxic substances in AD processes. (Angelidaki et al. 2003) The total solids, (TS), is the portion of dry matter (after water has evaporated) of a substrate. The TS may vary significantly among substrates, for example TS of sewage sludge is normally a few percents, whereas straw can have a TS value of almost 90%. If the TS of a substrate are subjected to 550°C for 2 hours, the residual matter is ash. Using the weight of the ash content, the volatile solids (VS) of the substrate can be determined according to formula 3.2 in section 3.3. VS vary less than TS, generally ranging from 70 to 95%. (Svensk standard 1981; Nilsson et al. 2001). Agitation is an important process parameter, which facilitates contact between the micro-organisms and the substrate and promotes homogeneous temperature. Stirring of the reactor fluid also decreases the tendency to form sludge and scum layers. (Mittal 1997) By determining the organic loading rate (OLR) in an AD process, the amount of organic material which can be utilized by the micro-organisms can be controlled. About 50% of the added VS can be converted into methane. However, the value varies for different substrates. The utilization rate of the VS, the VS reduction rate, is an important parameter in determining the gas production rate. The calculation of the methane production (volume CH4 per added amount of VS) is another frequently used calculation of the gas production. (Mittal 1997) The hydraulic retention time (HRT) is the number of days needed to replace the working volume of a reactor. A HRT of 20 days or more is typical for CSTR:s (Song et al. 2004). In general, short HRT is beneficial for high methane production and utilization of digester volume. An increase in OLR normally implies a shorter HRT, but if HRT is too short wash out of substrate and microorganisms (especially the slow-growing methanogens) might occur. (Chynoweth and Isaacson 1987)
2.3 The pulp and paper industry
2.3.1 Pulp and paper production
Wood is raw material for pulp and paper production and consists of cellulose fibers, other carbohydrates and lignin. In order to make pulp, the fibres are dissolved and further treated. This can be achieved by the following treatment procedures:
� Mechanical: the wood is disrupted by a rotating grindstone and the exposed wood fibers are suspended in water
� Chemical: chemicals in combination with high temperature and pressure are used � Chemitermomechanical (CTMP): technique which unites the two aforementioned, starting with chemicals and subsequently using mechanical force
Paper is manufactured by blending the pulp with large amounts of water, mineral fillers and in some cases adding dyes, coating materials and preservatives. (Thompson et al. 2001)
2.3.2 Waste treatment
The different steps in the paper making process all generates significant amounts of wastes, e.g. rejects, green liquor sludge, dregs, lime mud, wastewater treatment sludge, chemical flocculation sludge, deinking sludge (Thompson et al. 2001), scrubber sludge, ash and other

15
wood processing residuals. Costs of sludge management in wastewater treatment plants can compose of up to 60% of the total operating costs. (Monte et al. 2009) The European pulp and paper industry is annually responsible for producing eleven million tonnes of waste, where the making of paper from recycled deinked paper constitutes 70%. The wastes need different handling and due to increased reuse of paper, more stringent legislation and increased taxes, the formerly by far most common method to dispose solid waste, landfill, is not a long term solution. (Monte et al. 2009) In Swedish mills the two predominant waste handling methodologies are:
• Mechanical dewatering followed by composting (landfill and/or soil amendment) • Mechanical dewatering and incineration (landfill)
Composting is rarely combined with energy recovery and produces larger amounts of solid residues than incineration, whereas the drawbacks of the latter are low net calorific value, ash fusion, scaling and generation of NOX and SO2. (Stoica et al. 2009) The general waste regulation, 259/93/EEC, a landfill directive (Directive landfill 1999/31/EC) and a directive (Directive on packaging and packaging waste 94/62/EC), which focuses on paper and board industry waste handling, are examples of waste management responsibility. The EU landfill directive agitates preventive and reducing actions in order to decrease the environmental effects of land filling by implementing more tightly technical regulations (Directive landfill 1999/31/EC). The other EU directive stated an aim of 60% recycled paper and board by the end of 2008 (Directive on packaging and packaging waste 94/62/EC). The focus on waste management and novel - or improved disposal methodologies - has therefore become more stressed (Monte et al. 2009). Industrial wastewaters can be treated in terms of physical, chemical or biological methods, and the latter can be performed during aerobic or anaerobic conditions (Burgess and Pletschke 2007). The pulp and paper industry is the third largest water consumer of all industries in the world, and the chemical/mechanical mills are associated with the highest wastewater productions. As much as 60m3 wastewater/tonne of produced paper can be generated when making paper. The raw wastewater is potentially very polluting, affecting survival and reproduction functions of fish if not treated. (Thompson et al. 2001) Generally three treatment steps are applied for the treatment of wastewater from the pulp and paper industry. Initially a primary clarifying by sedimentation or flotation is performed, followed by a biological treatment (aerobic or anaerobic degradation of organic material), and in some cases a tertiary treatment step, before the effluent leaves the plant. A tertiary step can involve the use of ultra filtration, ozonation, adsorption and/or coagulation. (Thompson et al. 2001) Low levels of trace metals, nitrogen and phosphorus are general characteristics of paper wastewater (Lerner et al. 2007, Rintala and Puhakka 1994), which make biological treatment dependent on the addition of nutrients (Stoica et al. 2009). When using anaerobic bio-treatment the recirculation of the digestate may be applied to meet the demand on nutrients (Elliott and Mahmood 2006). The sludge being produced in the wastewater treatment from mills can be divided into primary sludge and biological sludge (secondary sludge; Thompson et al. 2001, Monte et al. 2009). Biological sludge is formed in the biological treatment step and consists of organic solids and inorganic non-biodegradable biomass (Andreoli et al. 2007). Waste activated sludge (WAS) is a biological sludge formed in activated sludge processes in traditional WWTP and in the biological treatment of effluents in the pulp and paper industry (Dewil et al. 2006, Thompson et al. 2001). WAS constituents include anaerobically biodegradable compounds such as amino acids, purines, pyrimides and sugars. WAS also comprises bacteria

16
from the activated sludge process, which also is possible to disintegrate during anaerobic conditions. (Rintala and Puhakka 1994) According to Elliott and Mahmood (2007), roughly 50 kg dry wastewater sludge is produced for every tonne of pulp or paper being manufactured. Sludge from the pulp and paper industry generally consists of 22-52% protein, 20–58% lignin, 0–23% carbohydrate, 2–10% lipid and 2-8% cellulose. Lignin is degraded slowly or negligible rates in anaerobic digestion and the substance can hamper digestion of polysaccharides within lignocellulosic material (Lin et al. 2009, Hobson and Wheatley 1993, Rittmann and McCarty 2001). Chemical treatment is known to render more lignin in the effluent in comparison to the mechanical technique (Thompson et al. 2001, Rintala and Puhakka 1994). Xiao and Clarkson (1997) showed that acid pre-treatment (30% acetic acid and 2% nitric acid) of newspaper could significantly remove lignin. The pre-treatment rendered almost 300% methane yield increase during anaerobic digestion. However, recovery of residual lignin products will presumably compose economical and technical hindrances of the application. General sludge treatment techniques used today in wastewater treatment plant (WWTP; not specifically for paper and pulp industry ) include land filling, land spreading, composting, reuse as building material (Monte et al. 2009), incineration, carbonization, vitrification, gasification, pyrolysis, super critical water oxidation, wet air oxidation, alkali digestion, aerobic digestion and AD. (Mahmood and Elliott 2006)
2.4 Mesophilic anaerobic digestion of sludge and sludge treatment methods in the pulp and paper industry
Due to the relatively high proportions of organic matter biological sludge is suitable for AD (Elliott and Mahmood 2007, Stoica et al. 2009, Rintala and Puhakka 1994, Monte et al. 2009). The biodegradability of pulp and paper mill sludge was investigated by Rintala and Puhakka (1994) revealing that 40-50% of the added sludge mixture was anaerobically degradable. However, the fact that relatively long HRT of 20-30 days are needed has led to that the use of AD in the pulp and paper industry so far is modest and only a few studies are reported. Thus, according to Elliott and Mahmood (2007) there are no full-scale anaerobic digesters in the pulp and paper industry digesting biological sludge or other solid residues. The same authors presented an economic analysis of anaerobic digestion of sludge at a pulp and paper mill showing a payback time of nine years. In a digestibility study of WAS from a kraft pulp mill on a pilot-scale the median VS reduction was 40% and a median methane production of 123 ml/ g added VS was achieved (Puhakka et al. 1992). AD of pulp and paper sludge could be economically feasible, if sludge pre-treatment methods would be applied. Sludge from the pulp and paper industry have high contents of volatile solids, which can make them more eligible to pre-treatment as compared to municipal sludge. Pre-treatment of sludge would lead to an increase of the rate of organic matter hydrolysis and subsequently the biogas production rate. Prevailing treatment strategies of sludge from the pulp and paper industry with positive results on AD include ozonation, alkaline hydrolysis, acidification, enzyme addition, bioaugmentation, pulsating electrical fields, microwaves, thermal disintegration, ultrasound and other mechanical disintegration methods. (Elliott and Mahmood 2007) In a recent study, alkali pre-treatment with 8g NaOH/100g TS sludge resulted in ca 180% higher methane yield (320ml CH4/g added VS) in comparison to untreated sludge (Lin et al. 2009). However, further research in this field is needed, according to the authors.

17
2.4.1 Ultrasonic pre-treatment
Ultrasound applied to sludge result in a disintegration of the organic matter making it more bio available and further decreases the risk of foaming and odour release (Elliott and Mahmood 2007). The disintegration can be achieved by utilizing a vibrating probe, which induces cavitation. Cavitation occurs when high frequency sound is applied to a fluid by the formation of air bubbles. As the bubbles alternatively expand and compress, they finally implode, which results in locally high temperature (approximately 4700°C) and high pressure (about 500bar) (Dewil et al. 2006). Cavitation is a form of shear force, which breaks down cellular matter such as cell walls and cell aggregates in sludge (Khanal et al. 2007). The outcome of an ultrasonic pre-treatment depends on the solids concentration of the sludge, the reactor configuration, treatment duration, ultrasound frequency, intensity and energy input (Khanal et al. 2007). Low ultrasound frequency, high intensity and long treatment period generally imply higher levels of solved solids accessible to AD. The most efficient frequency has been claimed to be 20 kHz. (Dewil et al. 2006, Khanal et al. 2007, Tiehm et al. 2001) In the literature there are many studies discussing ultrasound pre-treatment of municipal wastewaters, but little information regarding industrial wastewaters such as biological sludge from the pulp and paper industry. During a five month period, anaerobic digestion of ultrasonically pre-treated WAS from a WWTP in Orange County in the USA improved the biogas production by 50% (Hogan et al. 2004). Nickel and Neis (2007) reported increased degradation rate of the VS by more than 30% and biogas production by 10% by applying ultrasonic pre-treatment of WAS. They used 31 kHz at an intensity of 10 W/ml and a sonication time of 90 seconds. Mao and Show (2007) showed that the rate of the initial and rate-limiting step of a balanced AD process, the hydrolysis, could be increased by 75% by sonication at 0.52W/ml. Grönroos et al. (2005) performed a batch experiment, where most of the assays displayed an increase in average accumulation of methane per added g VS of 10-20%. The sludge was treated for up to 30 minutes at 300W/l.
2.4.2 Hydrolytic enzyme treatment
As presented in section 2.2.1, hydrolyzing enzymes perform the initial and often rate-limiting step a balanced AD process. According to Romanoa et al. 2009, addition of exoenzymes can meloriate AD. Extracellular enzymes are bound to the cell surface, ectoenzymes, free in the liquid surrounding microorganisms or bound to extracellular polymeric substances (EPS), thus, exoenzymes. Hydrolases such as lipases, proteases and glucosidases are examples of exoenzymes. Substrate, incubation time, system configuration, temperature and pH influence the performance of enzyme treatment. (Roman et al. 2008) Higgins and Swartzbaugh (1986) reported improved biogas – and methane yields of 12% and 15%, respectively, when applying cellulase and glucosidase pre-treatment on sewage sludge in an AD experiment. Davidsson (2007) also demonstrated that methane yields can be increased (20-60%) by enzyme addition to sludge in both batch - and continuous digestion experiments. In another study, where cellulase and pronase E was added to primary sewage sludge, solids reduction improved (80% compared to 20% for untreated) as well as the total suspended solids decreased by 80% in comparison to the control (Roman et al. 2006). Cadore et al. (2002) found that a cation exchange resin and ultrasound pre-treatment of WAS disintegrated activated sludge flocs and EPS, which enabled hydrolysis of amylose (starch) five times faster compared to untreated sludge. Interactions between ultrasound and hydrolytic enzymes have been shown in aerobic sludge treatment, where sonication promoted enzyme activities (Yu et al. 2008).

18
3 Materials and methods
3.1 Experimental overview
The two hypothesis of this master’s thesis are to be tested by the answers to the questions presented in section 1.3. The questions are be answered by the results and analysis of the four batch experiments and the semi-continuous digestion experiment performed in this study. The first question will be straightened out by the results from the batch experiment with ultrasonic pre-treatment and enzyme treated biological sludge described in section 3.4.5 and the semi-continuous digestion experiment presented in section 3.5. The aforementioned batch experiment will also treat question number two. The methodology of the batch experiments used to answer question number 3, 4 and 5 can be found in section 3.4.6, 3.4.7 and 3.4.8 respectively. By carrying out the semi-continuous digestion experiment (section 3.5), question 6-7 were answered. By using the results from the four batch experiments and the semi-continuous digestion experiment in section 3.4 and 3.5, the last question is being discussed. The laboratory work of this master’s thesis was performed in the laboratories of Scandinavian Biogas Fuels and the Department of Thematic Studies, Water and Environment at Linköping University.
3.2 Experimental design
Batch experiments were performed simultaneously with the start-up of the semi-continuous digestion experiment. The semi-continuous digestion experiment was carried out subsequently to the ending and interpretation of the first batch experiment. The preparation of the batch experiment bottles (section 3.4.4) were performed in randomized order. Batch experiments 1, 3 and 4 were performed in triplicate. The second batch experiment was performed in quadruplicate, whereas batch experiments 1, 3 and 4 were carried out in triplicates.
3.3 Calculations of process parameters in batch experiments and semi-continuous digestion experiment
In order to compare different substrates and calculate OLR, TS and VS were calculated according to Svensk standard (1981) as:
sm
cmm
TSafter
−=
105
[ ]% Formula 3.1
where mafter105 is the weight of the substrate after 20h heat treatment in an oven at 105°C, mc is the weight of the crucible used and ms is the wet weight of the substrate.
cafter
cafter
mm
mmVS
−−
=105
550 [ ]% Formula 3.2
where mafter550 is the weight of the resulting ash content of the substrate after 2h heat treatment in an oven at 550°C.

19
The OLR in the semi-continuous reactors were calculated according to formula 3.3.
reactor
substrate
v
VSTSmOLR
**= [g VS/l/day] Formula 3.3
where msubstrate is the weight of the daily substrate feed and vreactor is the working volume of the reactor. The VS reduction, VSred, in the semi-continuous digestion experiment was calculated as:
substratesubstratesubstrate
reactorreactordig
redVSTSm
VSTSmVS
**
**1−= [%] Formula 3.4
where mdig is the weight of the daily withdrawn digested sludge, TSreactor is the TS value of the digested sludge in the reactor and VSreactor is the VS value of the digested sludge in the reactor. The volume of the formed biogas during one day in the digestion experiment, vb, was calculated according to:
nkvb *= Formula 3.5
where k is the volume of one registered unit strike of the gas meter (described in section 3.5.3) and n is the number of strikes registered during one day by the gas meter. The calculation of the methane production at 0°C, vCH4/VS, in the semi-continuous digestion experiment is presented below:
310
273**
*vCH4/VS c
OLRv
v
reactor
b= [ml CH4/g added VS] Formula 3.6
where OLR is the organic loading rate of the preceding day and c is the methane content in the formed biogas. The ratio of 273/310 corrects the volume to a temperature of 0°C (273K) instead of temperature of (37°C) 310K present in the climate room, where the reactors were incubated. The corresponding calculation procedure of the average accumulation of methane per added g VS per added amount of VS, vCH4/VS, acc in the batch experiments is presented in Appendix A.
3.4 Batch experiments
In order to determine the average accumulation of methane per added g VS, henceforth denoted r, for ultrasonic pre-treatment and enzyme-treated biological sludge from a Swedish chemical paper mill, four batch experiments were carried out.
3.4.1 Inoculum
The inoculum used for all of four batch experiments was supplied from two CSTR:s run by Scandinavian Biogas Fuels AB. The digested sludge used as inoculum in the first batch

20
experiment utilized fibres, cow manure and glycerol as substrate. The inoculum of batch experiment 2-4 consisted of digested sludge from a reactor fed with fibres and cow manure.
3.4.2 Substrate
The substrate in all of the batch experiments is dewatered biological sludge provided by the wastewater treatment plant of a mechanical paper mill in Sweden. Due to seasonal changes and different operation conditions the TS of untreated substrate varied according to Table 3.1. In the same table values for VS and OLR in the different batch experiments are presented. For calculations of TS, VS and OLR see section 3.3. Table 3.1. Total solids (TS), volatile solids (VS) and organic loading rate (OLR) for untreated substrate in the four batch experiments. Batch nr TS
[%]
VS
[%]
OLR
[g VS/ml]
1 1.1 67.2 5.9 2 6.4 80.3 10.8 3 1.1-1.3* 66.7-67.9* 5.8-6.0* 4 4.2 100.0 8.6
* see section 3.4.7 for further details.
3.4.3 Treatment of substrates
Ultrasound
The ultrasound equipment was supplied by Ultra Sonus AB (Uppsala, Sweden) and consisted of an ultrasound probe, a N-I pos CY06/1000 C. Pro pump (Netzsch, Germany) and a sludge vessel. An oscilloscope was used to determine the applied current (I), voltage (U) and angular displacement (∆t). The ultrasound probe was equipped with a water-based cooling system and overheating risks were further decreased by running the probe at time intervals. The equipment arrangement is displayed in Figure 3.1. The substrate of interest was poured into the vessel and circulated through the ultrasound probe by the pump. The substrate in the vessel was manually stirred with a spoon in order to receive a homogeneous blend before samples were taken from the bottom.

21
Figure 3.1. Ultrasound pre-treatment arrangement: 1) ultrasound probe, 2) cooling-water system (the tubes attached to the bottom of the probe), 3) pump system for the sludge, 4) sludge vessel. The treatment times (t), effects (P) and ultrasonic treatment effects (W) for each treatment interval in batch experiments 1, 2 and 3 are presented in sections 3.4.5, 3.4.6 and 3.4.7, respectively, and the estimations and calculations of them are in compliance with Appendix B. Hydrolytic enzymes
Hydrolytic enzyme solutions Kemzyme 1® and Kemzyme 2® (Kemira www.kemira.com) were used in association with the supporting Kemadd® solution according to recommended dosage (except for batch experiment 1). The Kemadd® solution was supplied after the addition of the saline solution (section 3.4.4). The content of the experimental bottles was subsequently blended before the enzyme stock solutions of Kemzyme 1® and Kemzyme 2® were diluted to 10%. This was carried out just before the addition to the experimental bottles (to ensure enzyme stability) prior to the inoculation of batch experiments 1 and 4. 0.19g Kemzyme 1® and Kemzyme 2® (10% solution) per g added TS sludge and 1.25g of Kemadd® per 100g sludge (irrespective of TS value) were added to each experimental bottle in batch experiments 1 and 4. In batch experiment 4, the same amount of enzyme solutions were added to the enzyme treated control bottles (C2E) as to the enzyme treated experimental bottles, E. TS and VS of Kemadd®, Kemzyme 1® and Kemzyme 2® are presented in Table 3.2.
22
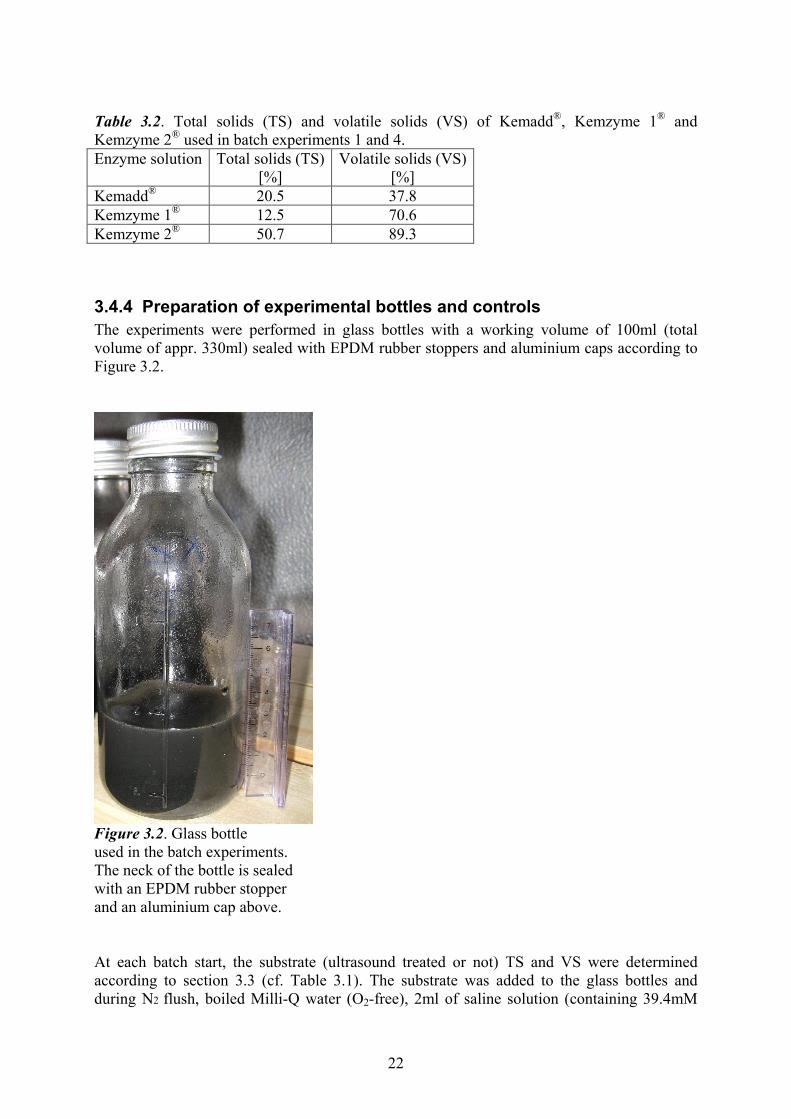
Table 3.2. Total solids (TS) and volatile solids (VS) of Kemadd®, Kemzyme 1® and Kemzyme 2® used in batch experiments 1 and 4. Enzyme solution Total solids (TS)
[%] Volatile solids (VS)
[%] Kemadd® 20.5 37.8 Kemzyme 1® 12.5 70.6 Kemzyme 2® 50.7 89.3
3.4.4 Preparation of experimental bottles and controls
The experiments were performed in glass bottles with a working volume of 100ml (total volume of appr. 330ml) sealed with EPDM rubber stoppers and aluminium caps according to Figure 3.2.
Figure 3.2. Glass bottle used in the batch experiments. The neck of the bottle is sealed with an EPDM rubber stopper and an aluminium cap above. At each batch start, the substrate (ultrasound treated or not) TS and VS were determined according to section 3.3 (cf. Table 3.1). The substrate was added to the glass bottles and during N2 flush, boiled Milli-Q water (O2-free), 2ml of saline solution (containing 39.4mM

23
MgCl2, 449mM NH4Cl, 411mM NaCl and 59.9mM CaCl2), enzymes (except in batch experiments 2 and 3) and subsequently 20g of inoculum were added to each bottle. After sealing the bottles the gas phase was exchanged using a vacuum pump and a reflush of N2/CO2 (80/20%) in order to further decrease the oxygen levels in the anaerobic milieu. This was performed in at least 12 cycles and subsequently 0,3ml 100mM Na2S was supplied to each bottle. Figure 3.3 demonstrates the gas phase exchange set up.
Figure 3.3. Exchange of gas phase in the preparation of bottles in batch experiments. Needles are connected through tubes to a vacuum pump (not in picture), which performs the evacuation. The bottles were subsequently reflushed with a blend of N2/CO2. Three sets of control bottles were used in each batch experiment. A positive control, C1, consisted of approximately 0.5g Whatman filter paper No 3 Qualitative (Whatman Ltd, England) 20g inoculum and 78g boiled Milli-Q water. The filter paper is made of 99.94% cellulose and has a theoretical methane potential of 418ml/g added VS (as presented in Appendix C), which the accumulation of methane achieved in the batch experiments were compared to. The second control, C2, contained inoculum without substrate to enable account for biogas produced from the indigenous material in the inoculum. Since this contribution is not of interest when calculating the methane potential of a substrate it is subtracted from the total biogas production, according to Appendix A. The last control, C3 constituted 15ml of pure CH4 and 100ml of boiled Milli-Q water and practiced as a control of the measuring and analytical procedure described in section 3.4.9. The methane contents retrieved from the gas chromatograph runs of C3 were compared to the theoretical value of 15ml. After preparation the control - and experimental bottles were incubated in a climate room (Weiss Technik, Germany) at 37°C.

24
3.4.5 Experiment 1: Effects of ultrasonic pre-treatment and enzyme treatment of substrate
15 sets of experimental bottles and three sets of control bottles, each set carried out in triplicate, were prepared according to section 3.4.4. 78g of substrate was used in each experimental bottle. No boiled Milli-Q water was added. The experimental period was 96 days and seven samples were taken during this period. 12 of the experimental bottles sets were utilized in a designed complete 2-factorial test with three different treatment levels: High (3), Medium (2) and Low (1) for both treatments according to section 3.4.3. The pump flow in the ultrasonic equipment was approximately 4.2 l/min. The ultrasonic pre-treatment energy input (W), effect (P), total treatment time (t) and average frequency (f) applied are tabled in Table 3.3. Calculation methodologies for P and W are presented in Appendix B. Table 3.3. The ultrasonic pre-treatment energy input (W), effect (P), total treatment time (t) and average frequency (f) used for ultrasound pre-treatment in batch experiment 1.
Ultrasonic pre-
treatment level
Energy
input, W
[Wh/l]
Effect,
P
[kW]
Total treatment
time, t
[s]
Average
frequency, fave
[kHz]
Low (1) 7 1,2 120 19,8 Medium (2) 28 1,3 420 19,7 High (3) 51 1,2 720 19,6
Enzyme level High (3) was set according to section 3.4.3 and the dosage for the other two treatment levels are presented in Table 3.4. Table 3.4. Enzyme doses (per experimental bottle) used for each treatment level in batch experiment 1. Treatment
level
Amount of Kemadd®
per 100g sludge
[g]
Amount of Kemzyme 1®
per added g TS
[g]
Amount of Kemzyme
2®
per added g TS
[g]
Low (1) 1.25 0.05 0.05 Medium (2)
1.25 0.10 0.10
High (3) 1.25 0.19 0.19 Besides the 12 sets of experimental bottles used in the 2-factorial design, three extra sets were included. The first set was ultrasonically pre-treated substrate at level 3 without enzyme (U3E0), whereas the other consisted of only enzyme treated substrate at level 3 (U0E3), and the last triplicate bottles contained untreated sludge, (U0E0). The pre-treatment levels of all 12 sets of experimental bottles used are displayed in Table 3.5.
25
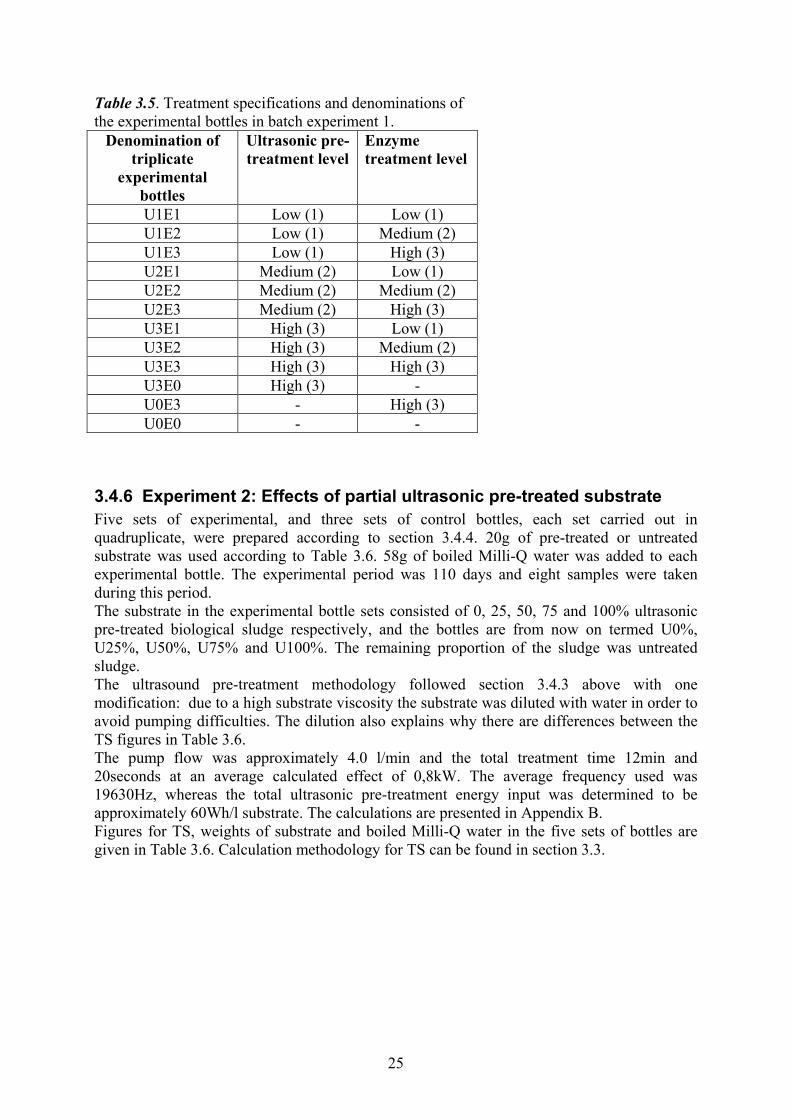
Table 3.5. Treatment specifications and denominations of the experimental bottles in batch experiment 1. Denomination of
triplicate
experimental
bottles
Ultrasonic pre-
treatment level
Enzyme
treatment level
U1E1 Low (1) Low (1) U1E2 Low (1) Medium (2) U1E3 Low (1) High (3) U2E1 Medium (2) Low (1) U2E2 Medium (2) Medium (2) U2E3 Medium (2) High (3) U3E1 High (3) Low (1) U3E2 High (3) Medium (2) U3E3 High (3) High (3) U3E0 High (3) - U0E3 - High (3) U0E0 - -
3.4.6 Experiment 2: Effects of partial ultrasonic pre-treated substrate
Five sets of experimental, and three sets of control bottles, each set carried out in quadruplicate, were prepared according to section 3.4.4. 20g of pre-treated or untreated substrate was used according to Table 3.6. 58g of boiled Milli-Q water was added to each experimental bottle. The experimental period was 110 days and eight samples were taken during this period. The substrate in the experimental bottle sets consisted of 0, 25, 50, 75 and 100% ultrasonic pre-treated biological sludge respectively, and the bottles are from now on termed U0%, U25%, U50%, U75% and U100%. The remaining proportion of the sludge was untreated sludge. The ultrasound pre-treatment methodology followed section 3.4.3 above with one modification: due to a high substrate viscosity the substrate was diluted with water in order to avoid pumping difficulties. The dilution also explains why there are differences between the TS figures in Table 3.6. The pump flow was approximately 4.0 l/min and the total treatment time 12min and 20seconds at an average calculated effect of 0,8kW. The average frequency used was 19630Hz, whereas the total ultrasonic pre-treatment energy input was determined to be approximately 60Wh/l substrate. The calculations are presented in Appendix B. Figures for TS, weights of substrate and boiled Milli-Q water in the five sets of bottles are given in Table 3.6. Calculation methodology for TS can be found in section 3.3.

26
Table 3.6. Specifications for the preparation of batch experiment 2. Set of
quadruplicate
experimental
bottles
TS
[%]
Amount of non
pre-treated
substrate
[g]
Amount of
ultrasonic
pre-treated
substrate
[g]
U0% 6.4 20 0 U25% 5.8 15 5 U50% 5.2 10 10 U75% 4.7 5 15 U100% 4.0 0 20
3.4.7 Experiment 3: Time - and cooling effects of ultrasonically pre-treated substrate
Three sets of experimental bottles and three sets of control bottles, each set carried out in triplicate, were prepared according to section 3.4.4. The experimental period was 96 days and seven samples were taken during this period. 78g of substrate and no addition of boiled Milli-Q water were used in each experimental bottle. The first set of experimental bottles, U0 were prepared in connection to the ultrasonic pre-treatment of the substrate, whereas the second, U6, and third, U13, were prepared six and 13 days post ultrasonic pre-treatment respectively. The pump flow in the ultrasonic equipment was approximately 4.2 l/min. The ultrasonic pre-treatment energy input (W) was approximately 51Wh/l, the effect (P) 1,2kW, the total treatment time 12 min and the average frequency (f) 19,6kHz. Calculation methodologies for P and W are presented in Appendix B.
3.4.8 Experiment 4: Effects of enzyme treatment of inoculum
Two sets of triplicate experimental bottles and three sets of triplicate control bottles were prepared according to section 3.4.4. Each experimental bottle embodied 20g of substrate. The experimental period was 67 days and seven samples were taken during this period. The first set of experimental bottles, E, contained, 78g boiled Milli-Q water and enzyme treated substrate. The second experimental set, C2E (enzyme treated C2), held 78g boiled Milli-Q water and was treated with enzymes according to section 3.4.3.
3.4.9 Analytical equipment and methodology
Overpressure of the formed biogas in the experimental bottles was measured with a lubricated (edible oil) 5 ml glass syringe and a needle at 37°C. For quantitative measurements of the CH4 content in the biogas a 1ml sample was taken from each experimental bottle using a 1 ml plastic syringe and a needle at 37°C and injected into a 30ml glass dilution bottle. Prior to measurement of overpressure and CH4 content, the bottles were manually shaken. 0.3ml of gas from each vial was analyzed in triplicate on a gas chromatograph (GC), a GC-FID HP 5880A (Hewlett Packard, USA), with a Poraplot T column. The injection temperature was 150ºC, the detection temperature 150ºC and the oven temperature 80ºC. The carrier gas used was N2 (30 ml/min) for the GC, whereas the FID used air (250 ml/min) and H2 (30 ml/min). In order to calculate r, an average of the areas for each control – and experimental

27
bottle was used, where the most deviating sample analysis was excluded. For calculations of r, the reader is referred to Appendix A. Methane standard glass bottles (123ml) containing 0.07, 0.63 and 1.71% CH4, respectively, were used for calibration of the gas chromatograph. The bottles were initially flushed with N2 and subsequently pure CH4 and N2 was added according to Table 3.7. The standards were made new every 14 days during the analytical period. Each methane standard bottle was analyzed in quintuplicate on the GC, where the most deviating value was excluded from further calculations of the r (see Appendix A). Table 3.7. Preparation of methane standard bottles. Methane concentration
[%]
Volume of CH4 [ml]
Volume of N2
[ml]
Volume of gas from
previous bottle
[ml]
1.71 2.5 20 - 0.63 1 35 - 0.07 - 5 15
MiniTab® 15 and Microsoft Office Excel 2003 were utilized for analysis of r in the batch experiments. The data from sample days 1-35 of the experimental run was examined using a complete 2-factorial model and standard deviation plots. The tools used in Minitab® 15 for analysis of r in batch experiment 1 include:
• F-tests • Confidence intervals of all factor levels for (UL and E individually) according to Tukey
• Interaction plots
The F-tests were utilized in order to see if: I. r of the ultrasound pre-treatment levels differed from each other or not II. r of the enzyme treatment levels differed from each other or not III. there are interactions between the ultrasonic pre-treatment and enzyme treatment The null hypothesis of an F-test, H0, that all treatment levels give equal results, is rejected if the test statistic, F, is greater than the tabled value, c. The significance level, α, of the performed F-tests was set to 0.01 and the degrees of freedom of F were F(2, 18) in I. and II. The choice of α and the degrees of freedom of F led to 6.01 as the value of c in I. and II. (Matematiska instutionen. 2007). In III., the degrees of freedom of F were F(4, 18), when α was 0.01, which resulted in c=4.58. In the F-tests it can only be stated if there are differences between the treatments in general but not between which individual treatments. However, by constructing confidence intervals according to Tukey this can be investigated. The individual effects of the ultrasonic pre-treatment and enzyme treatment of r were examined by creating confidence intervals according to Tukey with a simultaneous confidence level, αsim, of 0.05. If an interval includes 0, then the two compared pre-treatment levels can not be statistically separated from each other. The sets of extra experimental bottles with treatment combination U3E0, U0E3 and U0E0 could not be included in the 2-factorial analysis, because level 0 was not chosen in the 3-level experimental design. These bottles were analyzed by using the standard deviation (σ) plots in Microsoft Office Excel 2003.

28
Besides F-tests, interaction plots were used to evaluate if there are interactions between the ultrasound pre-treatment and the enzyme treatment. If the plotted treatment levels are non-parallel then it can be interpreted that interactions are prevailing. In batch experiment 2, r for sample day 1-50 were studied with the following tools in Minitab® 15:
• F-tests • Confidence intervals according to Tukey
The F-tests in batch experiment 2 were utilized in order to decide if the expectation-values, µ, of the treatments are separable from each other or not. α, of the performed F-tests was set to 0.01 and the degrees of freedom of F were F(4, 19). The choice of α and the degrees of freedom of F implied c to be 4.50. (Matematiska instutionen. 2007). As with batch experiment 1, confidence intervals according to Tukey were also utilized in order to determine if there are differences between each of the individual treatments in batch experiment 2. The individual confidence level was 98.35%, which corresponded to αsim=0.10. Tabled values in the F-tests in batch experiment 1 and 2 were taken from “Formel - och tabellsamling i matematisk statistik” (Matematiska institutionen, LiTH 2007). Standard deviation plots in Microsoft Office Excel 2003 were used to statistically evaluate r batch experiments 3 and 4.
3.5 Semi-continuous digestion experiment
A lab.-scale digestion experiment was carried out in order to evaluate if stable biogas production could be obtained from AD of untreated and enzyme treated biological sludge from two Swedish pulp and paper mills. Results from the experiment were also used to determine reactor performance, characteristics of the digested sludge and if the methane production correspond with the methane production in the batch experiments. The digestion period studied was 160 days.
3.5.1 Inoculum
The inoculum in each reactor consisted of 450g cow manure and 3550ml digested sludge supplied by the WWTP in Linköping. The cow manure had a TS of 15.1% and a VS value of 89.2%. The corresponding values for the digested sludge were 2.0% and 67.8%, respectively.
3.5.2 Substrate
The substrate in the digestion experiment was dewatered biological sludge provided by the wastewater treatment plants of a chemical and mechanical paper mill in Sweden once a week. Substrate originating from the mechanical paper mill is hereafter referred to as S1 and the substrate from the chemical paper mill will be denoted as S2. Due to seasonal changes, process upsets and different operation conditions, the TS of the substrate varied from 1.5% to 7.4% for S1 and 2.7-6.0% for S2. The VS values of S1 and S2 were 77.7-93.3% and 79.8-86.4% respectively. S1 was supplemented by an addition of micronutrients from day 41. Due to stirring problems, the substrate was homogenized with a MR 4050 HC handmixer (Braun, Germany) from day 127 and onward.

29
3.5.3 Reactor configuration, start-up and substrate feed
The experiment was performed in four semi-continuous glass CSTR:s with working volumes of 4 L (total volume 5 L) in a climate room at 37°C. The reactors were sealed with rubber stoppers compromising an entrance for a top mounted propeller placed at a height of one third of each reactor and a gas outlet connected to a gas meter. The agitator was set to intermittently stir three times per day for 15 minutes at 300rpm. Each reactor had an entrance used as substrate inlet and digested sludge outlet. The gas meters were exchanged and calibrated roughly every 14 days to minimize measurement errors. The experimental set-up is presented in Figure 3.4.
Figure 3.4. Reactor configuration. 1: 5 l glass reactor, 2: rubber stopper, 3: agitator entrance, 4: top mounted agitator, 5: gas outlet, 6: gas meter, 7: digested sludge outlet/substrate feed inlet.

30
Figure 3.5. Withdrawal of digested sludge. A pump (1) with a three-way valve (2) was used to collect digested sludge through a tube (3), into a glass bottle (4). The reactors were fed with substrate semi-continuously once a day. At each feeding, about 200ml of digested sludge was initially withdrawn from the reactor using a three-way valve pump (see Figure 3.5) and blended with approximately 200g of substrate, in order to facilitate homogenous blending of substrate and digested sludge in the reactor. Another 200ml of digested sludge was taken out from each reactor, weekends excluded. The digested sludge/substrate mix was thereafter added to the digester. The amount of the ingoing substrate and water depended on the TS of the substrate and the desired OLR as presented in formula 3.3 (section 3.3). Once a week the working volume of the reactors were adjusted to 4 L using the pump. The reactor set-up comprises two pairs of reactors, where each pair consists of one experimental (D1 & D4) – and one control reactor D2 & D3). Reactors D1 and D2 were fed with substrate S1, whereas substrate S2 was given to D3 and D4.

31
3.5.4 Hydrolytic enzymes treatment of substrates
Kemira’s hydrolytic enzyme solutions Kemzyme 1® and Kemzyme 2® were used in association with the supporting Kemadd® solution from day 118 and onward. The Kemadd® solution was added to the substrate and the mixture was subsequently stirred. The enzyme stock solutions of Kemzyme 1® and Kemzyme 2® were diluted with Milli-Q water to a 10% solution prior to addition to the substrate. The specific enzyme additions in reactor D2 and D4 for the semi-continuous digestion experiment are presented in Table 3.8. Table 3.8. Additions of Kemadd, Kenzyme 1 and Kenzyme 2 in reactor D2 and D4 in the semi-continuous digestion experiment. Day Addition of
10% Kemzyme 1®
[mg/g TS]
Addition of
10% Kemzyme 2®
[mg/g TS]
Addition of
Kemadd®
[µl/g substrate]
118 4 4 0.2 119 0.1 0.1 0.05 120-160 0.05 0.05 0.05
3.5.5 Analytical equipment and methodology
Analyses of reactor performances were performed during the total experimental period, which ranged from day 74 to day 160. For vCH4/VS, the results for two experimental periods were applied. The first period ranged from day 74-87 and period 2 days 147-160. The experimental periods were chosen in the beginning and the end of the total experimental period in order to evaluate the effects of the enzyme treatment (which started in the middle of the total experimental period). The biogas was collected in balloons during a three day period each week. A digital gas analyzer, GasData GFM Series (Coventry, UK), was used to determine the content of CH4, CO2, O2 and H2S in the produced biogas. Calculation methodologies for VSred, and vCH4/VS are presented in section 3.3. VSred was determined on a weekly basis. The pH of the digested sludge in the reactors was monitored twice a week using a Inolab pH level 1 (WTW, Germany) according to Svensk Standard (1998). The concentrations of acetic and propionic acid were measured once a week. Digested sludge samples of 400µl from each reactor were blended with 40µl of an internal standard and the mixture was centrifuged at 12000rpm for 10 minutes on each sample day. The centrifugated samples were subsequently injected on a GC-FID HP 5880A (Hewlett Packard, USA), with Poraplot T column. A HP 7672A Auto Sampler (Hewlett Packard, USA) was used for split injection at 150ºC. The split flow of the carrier gas helium (He2) was set to 30ml/min. Injection – and detection temperature of the FID was 150ºC and 250ºC respectively. The acetic- and propionic acid concentrations in the reactor fluids never exceeded 4mM and 0.6mM during the experimental period. Differences between vCH4/VS of each reactor pair were formed and plotted in order to determine if the reactor pair performances during the total experimental period were equivalent or not.

32
4 Results and discussion
4.1 Batch experiments
Treated or pre-treated sludge often increases the methane formation rate, while the final value of r, the methane potential, often is not significantly different from each other (Ejlertsson J, pers. comm. B). Therefore, studies of r in the beginning of batch experiments, i.e. up until day 20 roughly, will be applied.
4.1.1 Experiment 1: Effects of ultrasonic pre-treatment and enzyme treatment of substrate
The resulting r of each set of experimental bottles is presented in Table 4.1. On experimental day 4, the differences in r among the treatments are the greatest. At day 96, the differences are negligible, especially given that the standard deviations of r are roughly 5% in the end of the experimental period. Table 4.1. Presentation of the average accumulation of methane per added g VS, r, plus/minus the standard deviation of the experimental bottles and the extra control bottles U0E0, U0E3 and U3E0 in batch experiment 1.
Day
Average accumulation of methane per added g VS, r [ml CH4/g added VS]
Set of
experimental
bottles 0 1 4 8 18 35 62 96
U0E0 0 41 +/-11%
76 +/-6%
113 +/-6%
129+/-13%
138+/-11%
159+/-12%
173+/-10%
U0E3 0 42 +/-6%
105 +/-5%
125 +/-8%
149 +/-4%
161 +/-4%
177 +/-1%
185 +/-3%
U1E1 0 37 +/-8%
88 +/-15%
119 +/-8%
134 +/-9%
146 +/-8%
165 +/-8%
180 +/-10%
U1E2 0 41 +/-4%
94 +/-2%
122 +/-3%
137 +/-5%
147 +/-5%
168 +/-2%
182 +/-6%
U1E3 0 42 +/-3%
101 +/-6%
127 +/-6%
140 +/-7%
153 +/-9%
177 +/-4%
180 +/-7%
U2E1 0 42 +/-11%
100 +/-6%
126 +/-6%
141 +/-4%
146 +/-3%
168 +/-5%
177 +/-3%
U2E2 0 38 +/-14%
100 +/-7%
126 +/-7%
145 +/-4%
153 +/-5%
169 +/-8%
180 +/-7%
U2E3 0 44 +/-3%
100 +/-6%
126 +/-4%
141 +/-3%
152 +/-3%
169 +/-0%
177 +/-1%
U3E0 0 42 +/-8%
110 +/-6%
126 +/-3%
137 +/-6%
144 +/-9%
153 +/-6%
168 +/-8%
U3E1 0 45 +/-3%
114 +/-2%
136 +/-5%
140 +/-3%
151 +/-3%
173 +/-5%
186 +/-3%
U3E2 0 45 +/-17%
122 +/-2%
141 +/-6%
154 +/-4%
159 +/-6%
174 +/-3%
182 +/-4%
U3E3 0 40 +/-6%
121 +/-3%
140 +/-3%
153 +/-0%
160 +/-3%
176 +/-1%
181 +/-5%

33
The results and conclusions from the F-tests of the ultrasonic and enzyme effects on r, are presented in Table 4.2 and 4.4 respectively. Ultrasonic pre-treatment effects on average accumulation of methane per added g VS
Table 4.2 shows that the results of the three different ultrasonic pre-treatment levels are possible to differing from each other with 99% certainty on experimental days 4, 8 and 18. Due to the steadily decreasing values of F from day 4 to day 35 it is possible that differences in the inoculum quality between the sets of experimental bottles induced the low value of F on day 1 and that these differences, where negligible from day 4 and onward. The relatively high σ of day 1 (compared to other sample days) may also be an indicator of inhomogeneous inoculum within the batch experiment. Table 4.2. Results and conclusions from the F-tests of the ultrasonic effects on the average accumulation of methane per added g VS, r, in batch experiment 1. Day c F Result Interpretation
1 6.01 1.69 F<c, H0 can not be rejected
The results of the ultrasonic treatment levels are not possible to differ from each other (99% probability)
4 6.01 37.91 F>c, H0 can be rejected
The results of the ultrasonic treatment levels are possible to differ from each other (99% probability)
8 6.01 13.47 F>c, H0 can be rejected
The results of the ultrasonic treatment levels are possible to differ from each other (99% probability)
18 6.01 7.14 F>c, H0 can be rejected
The results of the ultrasonic treatment levels are possible to differ from each other (99% probability)
35 6.01 2.33 F<c, H0 can not be rejected
The results of the ultrasonic treatment levels are not possible to differ from each other (99% probability)
The results of the individual effects of the ultrasonic pre-treatment on r from the confidence intervals (according to Tukey) are presented in Table 4.3 where ultrasound level Low is indexed U1E0, Medium indexed U2E0 and High indexed U3E0. These results are certainly in compliance with the results from the F-tests presented in Table 4.2, where differences between the ultrasonic treatment levels on day 1 and 35 cannot be demonstrated. The confidence intervals also show that High is the statistically strongest ultrasonic pre-treatment level for both experimental day 4 and 8.

34
Table 4.3. Results of the ultrasonic pre-treatment effect on the average accumulation of methane , r, from the confidence interval (according to Tukey) analysis in batch experiment 1. U1E0, U2E0 and U3E0 indicate treatment level Low (7Wh/l), Medium (28Wh/l) and High (51Wh/l) respectively. The simultaneous confidence level, αsim was 0.05. Day Significant differences
1 -
4 rU3E0 is significantly greater than rU1E0 rU3E0 is significantly greater than rU2E0
8 rU3E0 is significantly greater than rU1E0 rU3E0 is significantly greater than rU2E0
18 rU3E0 is significantly greater than rU1E0
35 -
0
40
80
120
160
200
0 10 20 30 40 50 60 70 80 90 100
Days
ml CH4 / g added VS
U0E0 U3E0
Figure 4.1. Average accumulation of methane per added g VS of the non pre-treated, rU0E0, and ultrasound pre-treated sludge, rU3E0, performed in batch experiment 1. The bars represent +/-σ (the standard deviation) for each sample day. A graphical comparison of r of the non pre-treated sludge, rU0E0 and ultrasound pre-treated sludge (at High level (3)), rU3E0, is shown in Figure 4.1. The SD bars overlap on all sample days except for day 4 and 8 revealing a significant difference between the two sludge

35
treatments only for these sample days. This conclusion supports the results and interpretations of the F-tests and confidence intervals presented in Table 4.2 and 4.3, respectively. Consequently, it can be claimed that there are differences between all the three ultrasonic pre-treatment levels on experimental days 4 and 8. It can also be stated that there is difference between the highest ultrasound pre-treatment level and the non-ultrasound pre-treated sludge on days 4 and 8. Enzyme treatment effects on average accumulation of methane per added g VS
Table 4.4 shows that the results of the three different enzyme treatment levels are not possible to differ from each other with 99% certainty on any experimental day. Table 4.4. Results and conclusions from the F-tests of the enzyme effects on the average accumulation of methane per added g VS, r, in batch experiment 1. Day c F Result Interpretation
1 6.01 0.12 F<c, H0 can not be rejected
The results of the enzyme treatment levels are not possible to differ from each other (99% probability)
4 6.01 2.19 F<c, H0 can not be rejected
The results of the enzyme treatment levels are not possible to differ from each other (99% probability)
8 6.01 0.98 F<c, H0 can not be rejected
The results of the enzyme treatment levels are not possible to differ from each other (99% probability)
18 6.01 2.85 F<c, H0 can not be rejected
The results of the enzyme treatment levels are not possible to differ from each other (99% probability)
35 6.01 2.05 F<c, H0 can not be rejected
The results of the enzyme treatment levels are not possible to differ from each other (99% probability)
The analysis of the individual effects of the enzyme treatment on r from the confidence intervals (according to Tukey) stated that no treatment level gave significantly greater r than any other for the tested sample days 1, 4, 8, 18 and 35 (αsim=0.05). This confirms the F-test results above.

36
0
40
80
120
160
200
0 10 20 30 40 50 60 70 80 90 100
Days
ml CH4/g addedVS
U0E0 U0E3
Figure 4.2. Average accumulation of methane per added g VS of the non pre-treated, rU0E0, and enzyme treated sludge, rU0E3, performed in batch experiment 1. The bars represent +/-σ (the standard deviation) for each sample day. A graphical comparison of r of the non pre-treated sludge, rU0E0 and enzyme treated sludge (at High level (3)), rU0E3, is presented in Figure 4.2..The bars overlap on all sample days except for days 4 and 35 indicating differences to occur only for theses two days. Differences between the three enzyme treatment levels cannot be claimed for any of the sample days. On the other hand, there are differences between the enzyme pre-treated sludge and the untreated sludge on both experimental days 4 and 35 (Figure 4.2). These conclusions indicate that the enzyme levels were chosen too close to each other. The plot of r+/-σ for the enzyme treated (U0E3) and ultrasound pre-treated (U3E0) experimental bottles show that r for U0E3 is significantly greater than r for U3E0 on day 62 (Figure 4.3), suggesting that the enzyme treatment could be better than the ultrasound pre-treatment.

37
0
40
80
120
160
200
0 10 20 30 40 50 60 70 80 90 100
Days
ml CH4/g added VS
U0E3 U3E0
Figure 4.3. Average accumulation of methane per added g VS per added g VS, r, of the ultrasound pre-treated, rU3E0, and enzyme-treated sludge, rU0E3, performed in batch experiment 1. The bars represent +/-σ (the standard deviation) for each sample day.
Ultrasound and enzyme interaction analysis Table 4.5 shows that there were no interactions between the ultrasound pre-treatment and enzyme treatment for any of the sample days according to the F-tests (p< 0.01. Table 4.5. Results and conclusions from the F-tests of the interaction effects of the ultrasound pre-treatment and the enzyme treatment in batch experiment 1. Day c F Result Interpretation
1 4.58 2.37 F<c, H0 can not be rejected
There are no interactions between the ultrasonic and enzyme treatment methods (99% probability)
4 4.58 0.98 F<c, H0 can not be rejected
There are no interactions between the ultrasonic and enzyme treatment methods (99% probability)
8 4.58 0.39 F<c, H0 can not be rejected
There are no interactions between the ultrasonic and enzyme treatment methods (99% probability)
18 4.58 1.18 F<c, H0 can not be rejected
There are no interactions between the ultrasonic and enzyme treatment methods (99% probability)
35 4.58 0.2 F<c, H0 can not be rejected
There are no interactions between the ultrasonic and enzyme treatment methods (99% probability)
In the interaction plots in Figure 4.4, none of the graphs are parallel for all treatment levels on any of the studied sample days. Therefore, statistical interactions between the two pre-treatment methods exist. The nature of the interactions is however not in the way that they give rise to extra high values of r, but rather the other way or similar values. For example, in Figure 4.4, when increasing the enzyme level from 2 to 3 and keeping ultrasound level constant at 2, r decreases for all experimental days except day 35. Furthermore, similar

38
tendency can be seen at a constant ultrasound level of 3 and an increase of the enzyme level from 2 to 3. Henceforth, enzyme level 3 does not imply higher r than level 2. Furthermore, there is no difference when choosing ultrasound pre-treatment level 1 or 2 at an enzyme level of 3. Enzyme treatment level 3 only has effect when the ultrasound pre-treatment level is 1. The interaction plot of sample day 1 was excluded from the analysis because of the relatively large σ presented in Table 4.1.
Figure 4.4. Interaction plots of ultrasonic - and enzyme levels from experimental day 4, 8, 18 and 35 in batch experiment 1 respectively. Y-axis: Average accumulation of methane per added g VS (r) Ultrasonic treatment levels: 1; , 2; , 3; . Due to the contradictory results between the F-tests and the interaction plots it is not possible to say whether or not there are interactions between the two examined pre-treatment methods or not. However, when considering the standard deviation of the measurements (as presented in Table 4.1), results for at least day 35 can not be separated from each other, which makes it less likely to state that are interaction effects. If there are interactions, they do not contribute to higher values of r, but rather lower or equivalent levels. A possible explanation to the negative interaction may be an enzyme inhibition indirectly caused by the ultrasound pre-treatment possibly giving a release of inhibitory organic compounds or metals (Svensson B, pers. comm.). It is also possible that the ultrasound pre-treatment and the enzymes partly disintegrate the same kind of structures in the
39
substrate and since the ultrasound is applied prior to the enzyme addition, these structures have been broken down and the enzyme activity can not be completely employed. General discussion of the results in batch experiment 1
There are distinct differences in biogas production between the ultrasound pre-treatment levels at least on days 4 and 8, when also differences between non-treated and ultrasound pre-treated sludge occurred. Consequently, ultrasound pre-treatment increases the methane formation rate at the beginning of the experiments. However, the methane potentials did not increase, suggesting that the micro-organisms will digest the same organic matter to the same extent whether ultrasound has been applied or not. However, the initial kinetics was improved by the ultrasound treatment. No effects in relation to the enzyme treatment levels could be claimed. However, differences between non-treated and enzyme treated sludge occurred for days 4 and 35. Thus, also the enzyme treatment increases the methane formation rate at the beginning of the experiment, but to a lower extent than was found with the ultrasound pre-treatment. Similar to the ultrasound treatment, no effect on the methane potential of the substrate could be distinguished. From the results presented in Tables 4.2- 4.4 it can be concluded that an application of ultrasound pre-treatment increased with the level in the beginning of the experiments (≤ day 8), while the enzyme level range was to narrow to demonstrate any difference for the same period. Interactions between ultrasound pre-treatment and enzyme treatment could not be proven, which answers question number two. The results implicate that at an HRT of 20 days , ultrasound would be a better alternative for sludge pre-treatment than enzyme addition. This is based on the higher methane formation taking place with ultrasound pre-treated sludge on day 4 and 8 vs. the control, whereas the effect only occurred at day 4 for enzyme treatment. The effect on day 35 would not be of interest when applying 20 days HRT. These conclusions are, however, based on the methane production rate only with no regard given to the costs of the treatment methods. Assuming that the density of biological sludge is 1000kg/m3, 1m3 of biological sludge would comprise approximately 7.4kg VS sludge at a TS of 1.1% and VS at 76.2% (see formula 3.1, 3.2 and Table 3.1). The largest difference in r between the fully enzyme-treated substrate in U3E0 and the untreated in U0E0 is 34ml CH4/g added VS on day 4 (Table 4.1) being equivalent to 0.25m3 CH4/7.4kg added VS. The energy equivalent of 1m
3 CH4 is 9.96kWh (Ejlertsson J, pers. comm. B), which makes 0.25m3 equivalent to 2.5kWh. The energy input to the ultrasound pre-treatment of the substrate in U3E0 was 51Wh/l substrate (Table 3.3 or 51kWh/m3 substrate. Thus, 51kWh is used in order to produce 0.25m3 CH4 .is This is substantially more than the energy value of the formed CH4, 2.5kWh, why ultrasound pre-treatment of S1 is not defendable from an energy point of view. Ultrasound pre-treatment does however add values such as decreased viscosity, decreased sludge formation and more often than not increased sludge TS. The magnitude of these benefits is difficult to estimate. (Ejlertsson J, pers. comm. B), but can most likely not compensate the net energy increase due to the pre-treatment. Both the cost and the revenue for the enzyme treatment is approximately 120-140SEK/tonne TS added, which in theory makes it a break-even situation economically. The enzyme treatment also adds the same surplus values as the ultrasound pre-treatment does, which can make it feasible on a larger scale. Therefore, enzyme treatment of biological sludge was chosen to be further studied in a semi-continuous digestion experiment (section 4.2).

40
4.1.2 Experiment 2: Effects of partial ultrasonic pre-treated substrate
The resulting r:s of each set of experimental bottles are presented in Figure 4.6 and Table 4.6.
0
40
80
120
160
200
0 10 20 30 40 50 60 70 80 90 100 110
Days
ml CH4/g added VS
U0% U25% U50% U75% U100%
Figure 4.5 Average accumulation of methane per added g VS, r, in batch experiment 2. The percentage represents the part of ultrasound pre-treated sludge in each treatment. The largest percental differences between the experiments seem to occur on day 1 (Figure 4.5), with 100% treatment showing the highest accumulation rate. With this treatment the sludge seems to be metabolized into methane considerably faster than for the others However, according to the earlier reasoning of variation in inoculum quality affecting r on experimental day 1, made in connection to Table 4.2, this interpretation should be regarded with caution. Table 4.6. Presentation of the average methane accumulation, r, plus/minus the standard deviation, of the experimental bottles in batch experiment 2.
Day
Average accumulated CH4 production, r [ml CH4/g added VS]
Set of
experimental
bottles 0 1 4 8 19 35 50 75 110
U0% 0 17 +/-4%
67 +/-9%
104 +/-4%
141 +/-2%
160 +/-4%
171 +/-4%
188 +/-5%
189 +/-3%
U25% 0 18 +/-7%
70 +/-5%
107 +/-5%
141 +/-5%
167 +/-2%
175 +/-3%
191 +/-3%
190 +/-4%
U50% 0 22 +/-4%
78 +/-1%
115 +/-2%
143 +/-4%
173 +/-5%
177 +/-5%
192 +/-6%
191 +/-6%
U75% 0 25 +/-7%
84 +/-3%
121 +/-2%
145 +/-1%
173 +/-3%
176 +/-4%
193 +/-2%
195 +/-3%
U100% 0 32 +/-6%
88 +/-4%
121 +/-3%
154 +/-3%
176 +/-4%
181 +/-3%
197 +/-4%
199 +/-3%

41
The results of the performed F-tests for equal expectation-values are given in Table 4.7. From the tests it can be concluded that the treatments can be distinguished from each other up until day 8. However, F is only slightly smaller than c on day 19. Together with the continuously decreasing values of F for each examined experimental day, the results from the F-tests for equal expectation-values enhances the conclusion of smaller differences for increasing numbers of experimental days between the treatments made earlier from Figure 4.5. Table 4.7. Results and conclusions from the F-tests of the prevalence of equal expectation-values, µ, of the average accumulation of methane per added g VS, r, of the treatments in batch experiment 2. Day c F Result Conclusions
1 4.50 77.61 F>c, H0 can be rejected
The expectation-values of r in the treatments are not equal (99% probability)
4 4.50 22.48 F>c, H0 can be rejected
The expectation-values of r in the treatments are not equal (99% probability)
8 4.50 17.08 F>c, H0 can be rejected
The expectation-values of r in the treatments are not equal (99% probability)
19 4.50 4.40 F<c, H0 can not be rejected
The expectation-values of r in the treatments are equal (99% probability)
35 4.50 3.89 F<c, H0 can not be rejected
The expectation-values of r in the treatments are equal (99% probability)
In Table 4.8 the results of the confidence intervals according to Tukey are presented. U75% and U100% were found to be equal for all days except day 1, whereas U100% displayed no significant difference from U50% for day 8 and 35. U100% and U25% were significantly equal for day 19 only. U100% and U0% were not found to be equal for any of the analyzed experimental days. Day 19 and day 35 show less intervals, where differences between treatments could be claimed than for the prior days. In general, the results of the confidence intervals are coinciding with the results from the F-test, where differences between the treatments could be noticed from day 1 to day 8. With respect to earlier discussion of the possible effect of the inoculum on sample day 1, it can be stated that there are no significant differences between U100% and U75%. Since U100% is significantly greater than U50% on day 4 and 19 it is not reasonable to claim that the treatments render equal r. As for U25% and U0%, it is even more unlikely that they can be considered to produce the same amount of methane as U100%, since they are only significantly equal to U100% on one and no day respectively.

42
Table 4.8. Results from the performed confidence intervals according to Tukey. Significant difference indicate that the experimental bottles with greater fraction of ultrasound pre-treated sludge render significantly greater r in the comparison to bottles with lower. Simultaneous confidence level, αsim, was 0.10. Day Significant
differences between
No significant
differences between
1 All intervals except: U0% and U25% U50% and U75%
U0% and U25% U50% and U75%
4 All intervals except: U0% and U25% U50% and U75% U75% and U100%
U0% and U25% U50% and U75% U75% and U100%
8 All intervals except:
U0% and U25% U50% and U75% U50% and U100% U75% and U100%
U0% and U25% U50% and U75% U50% and U100% U75% and U100%
19 U0% and U100% U25% and U100% U50% and U100%
All intervals except: U0% and U100% U25% and U100% U50% and U100%
35 U0% and U50% U0% and U75% U0% and U100%
All intervals except: U0% and U50% U0% and U75% U0% and U100%
General discussion of the results in batch experiment 2
According to the conclusions made in section 4.1.1, ultrasound is not an alternative for this type of sludge. If ultrasonic pre-treatment of biological sludge from the pulp and paper industry could be economically feasible, a partial ultrasound pre-treatment of 75% of the sludge could be an alternative, which is an answer to question number three. This type of batch experiment set-up could be of more interest for other substrates with greater methane potential if it can be stated that complete ultrasonic pre-treatment is financially supportable for the substrate of concern.

43
4.1.3 Experiment 3: Time - and cooling effects of ultrasonically pre-treated substrate
The resulting r:s of each set of experimental bottles are presented Figure 4.6 and Table 4.9.
0
40
80
120
160
200
0 10 20 30 40 50 60 70 80 90 100
Days
ml CH4/g added VS
U0 U6 U13
Figure 4.6. Average accumulation of methane per added g VS, r, in batch experiment 3. U0, U6 and U13 are ultrasound pre-treated sludge stored at 4°C for 0, 6 and 13 days respectively. The bars represent +/-σ (the standard deviation) for each sample day. Table 4.9. Average accumulation of methane per added g VS, r, plus/minus the standard deviation, of the experimental bottles in batch experiment 3. U0, U6 and U13 are ultrasound pre-treated sludge stored at 277K for 0, 6 and 13 days respectively.
Day
Average accumulation of methane per added g VS, r [ml CH4/g added
VS]
Set of
experimental
bottles
0 2 4 5 8 9 16 18 35 62 96
U0 0 110 +/-6%
126 +/-3%
137 +/-6%
144 +/-9%
153 +/-6%
168 +/-13%
U6 0 75 +/-2%
108 +/-1%
129 +/-2%
159 +/-2%
148 +/-2%
173 +/-8%
173 +/-8%
U13 0 70 +/-3%
101 +/-4%
118 +/-5%
123 +/-4%
143 +/-7%
161 +/-8%
168 +/-8%
44
General discussion of the results in batch experiment 3
The standard deviation bars overlap on experimental days 4-5 and 8-9 (Figure 4.6), which is also concluded from the +/-σ of r for experimental days 35, 62 and 96 (Table 4.9) . Consequently it is plausible to claim that cool storage for six or 13 days does not have an impact on the methane potential of the biological sludge, which is the answer to question number 4.
4.1.4 Experiment 4: Effects of enzyme treatment of inoculum
In Figure 4.7 it can be seen that +/-σ of vCH4 for C2 and C2E does not overlap. The higher vCH4 in C2E could be caused by enzyme activity promoting hydrolysis on indigenous material in the inoculum. The enzyme solutions Kemzyme 1®, Kemzyme 2® and Kemadd® contains, except proteins (the enzymes), up to 50% sugar (Larsson P, pers. comm.). Therefore, it is possible that the increase in methane accumulation is due to a bacterial degradation of these sugars and the proteins (enzymes) instead of being a result of the assumed enzyme activity on the substrate. The methane potential of proteins in anaerobic digestion is approximately 500ml/g (for calculations, see Appendix C). The corresponding value for carbohydrates is 420ml/g. Assuming that the total solids of Kemzyme 1®, Kemzyme 2® and Kemadd® would comprise 50% proteins and 50% sugars, the amount of proteins in one experimental bottle, mprot, would be:
g
mTSmTSmTSm KAKAKKKKprot
06.00.5*0.5*0.2050.016*0.5*0.5070.016*0.5*0.125
*5.0**5.0**5.0* 2211
≈++
=++=
,where the indices K1, K2 and KA represent Kemzyme 1®, Kemzyme 2® and Kemadd® respectively. The amount of sugars in one experimental bottle, msug would consequently also be 0.06g. Therefore, the maximum theoretic of methane volume formed is:
mlvCH 52418*06.0503*06.0max,4 ≈+=
When subtracting the average accumulated methane volume, vCH4, of C2 from C2E (Figure 4.7), the resulting volume is larger than 52ml from day 4 and onwards. Thus, the difference in methane production between treatments C2E and C2 implies that enzyme activity, and not enzyme degradation, causes the excess methane production from at least day 4 and onward. As stated earlier in this section, the greater methane production in C2E could be caused by enzyme activity on the indigenous material. The difference between C2E and C2 in figure 4.8 is about the same as the difference when subtracting S from SE. This suggests that the improvement in methane production in SE can be caused by enzymatic degradation of indigenous material instead of substrate.

45
0
50
100
150
200
250
300
0 10 20 30 40 50 60
Days
ml
C2 C2E
Figure 4.7. Average accumulation of methane per added g VS, vCH4, of the control set bottles containing inoculum (C2) and the experimental set bottles comprising enzyme treated control (C2E) in batch experiment 4. The bars represent +/-σ (the standard deviation) for each sample day.
0
100
200
300
400
500
600
0 10 20 30 40 50 60
Days
ml
C2 C2E S SE
Figure 4.8. Average accumulation of methane per experimental bottle in batch experiment 4. C2: inoculum (control), C2E: enzyme treated inoculum, S: substrate and inoculum, SE: enzyme treated substrate and inoculum.

46
General discussion of the results in batch experiment 4
There is a difference in methane production between enzyme-treated inoculum and non-treated inoculum, which is suggested not to be caused by anaerobic digestion of the enzymes. Therefore, the enzyme addition enhances the average accumulation of methane per added g VS from the indigenous organic matter in the inoculum, which answers question number five.
4.2 Semi-continuous digestion experiment
4.2.1 pH of the digested sludge
The pH of the digested sludge in D1, D2, D3 and D4 were in the range of 6.9-7.2, 6.8-7.2, 7.2-7.7 and 7.2-7.6 respectively, during the experimental period. The values are in the range of the reported interval presented in section 2.2.2.
4.2.2 Hydraulic retention time (HRT) and organic loading rate (OLR)
The HRT during the experimental period of reactor pair D1/D2 ranged of 16-19 days and17-21 days for D3/D4. The OLR varied between 1.6 and 2.3g VS/l/day for reactor pair D1/D2 was and 1.3-2.2g VS/l/day D3/D4.
4.2.3 Stirring, foaming, scum layer formation and stratification tendencies
On day 17 stirring problems were observed in all four reactors and scum layers started to build up. Therefore, the stirring rate was increased to 400rpm on day 20. Due to further blending problems the rate was set to 500rpm on day 33 for reactors D3 and D4 and on day 95 for reactor D1 and D2. From day 90 each reactor was opened and manually shaken once a week with the purpose to enhance the mixing. When opened, scum layer and digested sludge attached to the reactor walls above the reactor fluid level was scraped back into the reactor fluid. This procedure exposed the anaerobic cultures to oxygen, which might have affected both the stability of the bacterial fauna and consequently the methane production. From day 127, the two substrates were homogenized in order to facilitate the mixing. The agitation difficulties involving stratification and scum layer remained throughout the experimental period, especially for reactors D3 and D4. According to Lettinga (1991) very toxic compounds may be formed if air enters a UASB reactor treating wastewater from forestry industry. Thus, it can not be excluded that such interactions may have occurred in the reactors of this study. This problem should be investigated and considered in large scale biogas production with this kind of substrates. Since both substrates demonstrated severe agitation problems in lab-scale, this issue should be given special attention when large scale plants are planned. This is further emphasised in the case of additions of e.g. enzymes in full scale applications.
4.2.4 Viscosity
Viscosity analysis of the digested sludge of the reactors was performed by Ljunga Lab (Ljungaverk, Sweden) on samples from day 109, before the start of the enzyme treatment. At a shear rate of 330s-1, the apparent viscosity of reactors D1, D2, D3 and D4 were 47mPas-1,
47
60mPas-1, 101mPas-1 and 113mPas-1 respectively. Battimelli et al. (2003) investigated the viscosity of anaerobically digested waste activated sludge and presented a value of approximately 15mPas-1. The viscosity of the digested sludge in this study can therefore be considered to be relatively high, which also relates to and confirms the agitation problems described earlier. Since the reactor pairs had been treated equally during the start-up period and the experimental period prior to the viscosity analysis, it was expected that there would be no or at least very little differences between the two reactor pairs. Reactor D2 demonstrated a viscosity value of about 28% more than D1, whereas the viscosity in D4 was 12% greater than for D3. The measured pH was equal of the pairs and, therefore not regarded to have influenced the viscosity. The difference in viscosity between the two substrates is due to the different properties of the sludge themselves, but could also as well be influenced by the amount of polymers and other chemicals added to the processes at the two mills. No viscosity analysis was performed after the enzyme treatment (day 118) during the time extent of the master’s thesis project.
4.2.5 Volatile solids-reduction
The VS-reduction for the reactors during the experimental period is presented in Figure 4.9 and 4.10. No effect of the enzyme treatment was seen. However, the VS-reduction levels of D1/D2 were greater than for D3/D4, which corresponds to the greater vCH4/VS of D1/D2 presented in section 4.2.4. The VS-reduction prior to enzyme treatment in the D1/D2 reactor pair seems to be more stable and fluctuate less than after the treatment started. It can not however be addressed to the enzyme treatment, since only D2 has been treated and both of the reactors display this behaviour. It is more likely that a variation in the quality of the substrate caused this instability. Lower VS-reduction can be an indicator of less biodegradable organic matter in the substrates, probably caused by process changes at the mill or in the wastewater treatment process of the mill.

48
0%
10%
20%
30%
40%
50%
60%
74 77 80 83 86 89 92 95 98 101
104
107
110
113
116
119
122
125
128
131
134
137
140
143
146
149
152
155
158
Days
D1 D2
Figure 4.9. The VS-reduction of the digested sludge in reactor D1 and D2 during the experimental period. White arrow indicates where enzyme treatment of reactor D2 started and the black arrow indicates where the substrate homogenization started.
0%
10%
20%
30%
40%
50%
60%
74 77 80 83 86 89 92 95 98 101
104
107
110
113
116
119
122
125
128
131
134
137
140
143
146
149
152
155
158
Days
D3 D4
Figure 4.10. The VS-reduction of the digested sludge in reactor D3 and D4 during the experimental period. White arrow indicates where enzyme treatment of reactor D2 started and the black arrow indicates where the substrate homogenization started.
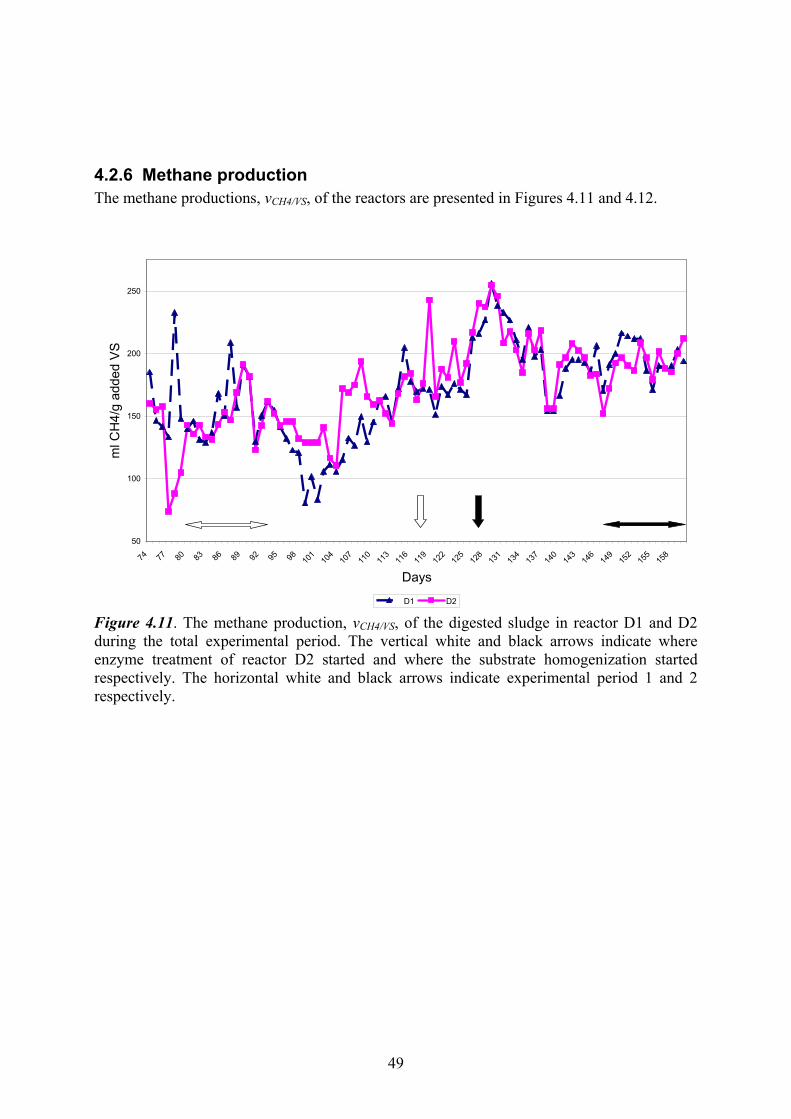
49
4.2.6 Methane production
The methane productions, vCH4/VS, of the reactors are presented in Figures 4.11 and 4.12.
50
100
150
200
250
74 77 80 83 86 89 92 95 98 101
104
107
110
113
116
119
122
125
128
131
134
137
140
143
146
149
152
155
158
Days
ml CH4/g added VS
D1 D2
Figure 4.11. The methane production, vCH4/VS, of the digested sludge in reactor D1 and D2 during the total experimental period. The vertical white and black arrows indicate where enzyme treatment of reactor D2 started and where the substrate homogenization started respectively. The horizontal white and black arrows indicate experimental period 1 and 2 respectively.

50
50
75
100
125
150
175
74 77 80 83 86 89 92 95 98 101
104
107
110
113
116
119
122
125
128
131
134
137
140
143
146
149
152
155
158
Days
ml CH4/g added VS
D3 D4
Figure 4.12. The methane production, vCH4/VS, of the digested sludge in reactor D3 and D4 during the experimental period The arrow indicates where enzyme treatment of reactor D4 started. The vertical white and black arrows indicate where enzyme treatment of reactor D2 started and where the substrate homogenization started respectively. The horizontal white and black arrows indicate experimental period 1 and 2 respectively. The concentration of CH4 in the biogas, cCH4, was estimated (underrating) to 50% instead of measured due to gas analyzer problems. Substrate S1 (utilized in reactor pair D1/D2) demonstrated greater vCH4/VS in comparison to S2 (utilized in reactor pair D3/D4) as can be seen in Figures 4.11-4.12 and Table 4.10. This has been concluded in earlier unpublished batch experiments performed at Scandinavian Biogas Fuels (Ejlertsson J, pers. comm., A). Since the substrate in reactors D1 and D2 originate from a mechanical mill, where the wastewaters contain more easily digestible substances and in comparison to chemical mills (Rintala and Puhakka 1994), the biological sludge is likely more amenable to AD. The greater viscosity of S2, with less effective agitation as a consequence, may also have caused the methane potential difference between the substrates. The fluctuations in methane production in Figure 4.11-4.12 can be explained by quality of the substrates. As mentioned in section 3.5.2, the TS varied throughout the experimental period due to seasonal changes, process upsets and different operation conditions at the sludge mill source. Other quality parameters such as viscosity and biodegradability also fluctuated as presented in section 4.2.4 and 4.2.5. The differences in r between the batch experiments, presented in Table 4.11 (section 4.3), indicate that the quality of the substrate varied a lot, in this case from 158-226ml CH4/g added VS for substrate S1. Increase or decrease of HRT and OLR caused by changes in TS, generate variation in the calculated methane production. The use of OLR of the previous day in order to calculate the methane production (formula 3. in section 3.3) renders fluctuating methane production, when utilizing a substrate (newly arrived once every week) with lower or higher TS value than the previous day. Gas meter problems such as block of ingoing gas and unit strike register problems are plausible explanation of the sudden lower values of D2 on day 77-79 in Figure 4.12 and 4.13. Sudden increases in methane production, such as for D1 on day 77 can be induced by

51
registration of false unit strikes due to sensitive gas meters, accidental touching of the gas meter or the relatively unstable reactor gantry. Since distinct peaks appear on the day after the start of the enzyme treatment for both D2 and D4, they are most likely caused by the enzyme activity. As stated in section 4.1.4, increased methane production during enzyme treatment of substrate can not be explained by bacterial digestion of the enzymes (protein) and sugars in the enzyme solutions. However, the effect of the enzyme treatment can not be claimed to persist after day 119. As can be seen in Figure 4.13 (as well as in Figure 4.11), the D1 displays greater values than D2 for both five and nine consecutive days (day 131-135 and 145-153 respectively) after the start of the enzyme treatment. Reactor pair D3/D4 show similar patterns (Figures 4.12 and 4.14, where vCH4/VS of D3 is greater than of D4 for six and fourteen consecutive days (day 155-160 and 127-140) after the enzyme treatment started. Table 4.10. Average methane production, vCH4/VS, for the reactors during day 80-93 (experimental period 1) and day 147-160 (experimental period 2). From day 119, the substrate of reactor D2 and D4 was enzyme treated. Reactor vCH4/VS during
experimental period 1
vCH4/VS during
experimental period 2
D1 156 196 D2 150 190 D3 104 116 D4 96 111 It is difficult to see long term effects of the enzyme treatment in Figures 4.11-4.14. The average vCH4/VS during experimental period 1 (prior to enzyme treatment), presented in Table 4.10, for reactor D1 was 4% greater than for D2. In experimental period 2, average vCH4/VS of D1 was 3% greater than for D2. The corresponding differences for reactor pair D3/D4 were 8% and 5%, respectively. The differences of the average vCH4/VS between the two experimental periods in each reactor pair is considered negligible, since they can be caused by measurement errors such as gas meter problems. However, a long term effect of the enzyme treatment, as discussed in connection with the ultrasound treatment, may lead a lower viscosity (Ejlertsson J, pers. comm., B). In that case, agitation might improve and the substrate will become more available to the enzymes and resulting in an increase of methane production. The greater vCH4/VS observed for experimental period 2 in all four reactors could have been induced by substrate of higher quality and by the substrate homogenization, which started on day 127.

52
-150
-100
-50
0
50
100
74 77 80 83 86 89 92 95 98 101
104
107
110
113
116
119
122
125
128
131
134
137
140
143
146
149
152
155
158
Days
ml CH4/g added VS
D2-D1
Figure 4.13. The methane production, vCH4/VS, in reactor D1 subtracted from the vCH4/VS in reactor D2 (e.g. D2-D1). The arrow indicates where enzyme treatment of reactor D2 started.
-50
-25
0
25
50
75
74 77 80 83 86 89 92 95 98 101
104
107
110
113
116
119
122
125
128
131
134
137
140
143
146
149
152
155
158
Days
ml CH4/g added VS
D4-D3
Figure 4.14. The methane production, vCH4/VS, in reactor D3 subtracted from the vCH4/VS in reactor D4 (e.g. D4-D3). The arrow indicates where enzyme treatment of reactor D4 started.

53
Approximately 95% of the reactor fluid is substituted after 3 HRT, according to the decay curve presented in Appendix D. Consequently, with 20 days HRT it takes 60 days to substitute 95% of the initial digester volume. Conclusions concerning reactor performance due to changes in reactor operations such as homogenization of substrate, higher enzyme doses etc., can not be drawn too early after being applied. The HRT for D1/D2 and D3/D4 was approximately 17 and 20 days respectively from the start of the enzyme treatment to the first day of experimental period 2. Since the enzyme treatment started on day 118 and the second experimental period began on day 147, the 30 day period only constitutes about 1.5HRT. At 1.5 HRT, only approximately 79% of the digested sludge has been substituted. Therefore, further analysis with more accurate results of reactor performances should be done 3 HRT or later after an operation change.
4.2.7 General discussion of the results in the semi-continuous digestion experiment
The enzyme treatment only seems to show a short term effect on the methane production regardless of substrate. A higher enzyme dose might induce a higher rate, but it seems, as concluded for batch experiment 4, that the composition of enzyme solutions are more amenable to indigenous material in the inoculum than to the substrate under study. Despite fluctuating substrate quality, a relatively stable biogas production was achieved, which answers question number six. The viscosities of the reactor fluids are relatively high in comparison to literature values. Foaming was not a process issue, but scum layer formation and stratification tendencies deteriorated agitation in all. These conclusions answer question number seven.
4.3 General discussion of all results
The methane production in D1 during the initial experimental period differed from the end of it. The average methane production of experimental periods 1 and 2 was 157ml CH4/g added VS and 196ml CH4/g added VS, respectively (Table 4.10). For batch experiments 1, 2, 3 (two samples) and 4, the corresponding rates were 179, 189, 158, 176 and 226, respectively (Table 4.11). The value for batch experiment 2 is greater than for experiments 1 and 3 possibly due to the longer experimental period of 110 days. The methane potential of 226ml CH4/g added VS achieved in batch experiment 4 during only 67 days is, however, more notable since the accumulated value is about 28% greater than the highest value from batch experiment 3 and achieved in 29 experimental days less. The batch experiment results suggest that the digestibility of S1 varies considerably assuming that the qualities of the inoculums in the batch experiments are comparable. It can also be stated that the results of untreated sludge in the semi-continuous digestion experiment are similar to those achieved in the batch experiments, which answers question number eight. Puhakka et al. (1992) reported a median methane production of 123 ml/g added VS, where WAS from a bleached kraft pulp mill was used as substrate. The kraft pulp mill is partly a chemical process and a comparison to the results in this study, where substrate S2 is used is of interest (reactor D3 and D4). 104-116ml CH4/ g VS added was achieved in this study (reactor D3 and D4), which is lower than the value reported in the pilot study performed by Puhakka et al. (1992). When comparing the result from the AD of biological sludge from a mechanical mill in this study, the methane production is greater than the results reported by Puhakka et al., i.e. 158-226 for the batch experiments and 157-196ml/g VS added for reactors D1 and D2.

54
The differences between the studies may be explained by the different types of sludge being used. The kraft pulp mill WAS used by Puhakka et al. is generated from a partly chemical process, whereas S2 is from a fully chemical process. Since effluents from chemical processes are known to inhibit methanogenic degradation of organic material and to be less amenable to biodegradation (Rintala and Puhakka 1994) a greater proportion of sludge with chemical process origin is likely to render lower methane production during AD. The greater methane production achieved when using S1 in comparison to the sludge used by Puhakka and colleagues could be explained by the fact that sludge from mechanical mills generally comprises more easily digestible substances in comparison to chemical mills (Thompson et al. 2001, Rintala and Puhakka 1994). One way to evaluate the bacterial activity of the inoculum is to compare the controls containing Whatman filter paper (C1) with each other (Table 4.11). The methane potential for the Whatman filter paper in batch experiment 4 is not higher than for the others In Appendix C, the theoretical methane potential for Whatman filter paper is calculated to be approximately 420ml/g added VS. The lower methane potential rates in the batch experiments (74-85% of theoretical value) could be explained by the sum of all experimental errors and the energy needed for bacterial growth and maintenance. The quality of the inoculum does not differ between the batch experiments and consequently it is possible that the digestibility of the biological sludge changes with time and/or operational conditions at the mill. If this premise is true it can be a contributive source to the differences in methane production between experimental period 1 and 2 in reactor D1 (and likely D3 as well). Table 4.11. Methane potential rates of untreated biological sludge from a Swedish mechanical paper mill and Whatman filter paper in the performed batch experiments. Batch
experiment
Number of
Experimental
days
Methane
potential
for
substrate
[ml CH4/g
added VS]
Methane
potential
for Whatman
filter paper
[ml CH4/g
added VS]
1 96 173 310 2 110 189 340 3 96 158 344 3 96 176 354 4 67 226 312
Since the substrate is fed only once in a batch experiment and semi-continuously with new substrate every week in the semi-continuous digestion experiment, the digestibility of the substrate likely differs between the batch experiments and the semi-continuous digestion experiment. Several other process parameters differ between the batch experiments and the semi-continuous digestion experiment. For instance, S1 was homogenized, and consequently most likely more easily digested, during the main part of the experimental period in the semi-continuous digestion experiment. Either the additions of nutrients or the homogenization conditions of the substrate are comparable. Further, the bacterial density per amount of TS in the substrate is greater in semi-continuous digestion than in batch experiments.

55
However, despite all differences, the methane productions in the batch experiments are in line with those obtained from the semi-continuous digestion experiment. The fact that differences between enzyme treated and untreated sludge in batch experiments was possible to show and much more difficult to prove in semi-continuous digestion demonstrates that the enzyme treatment conditions are not comparable. The choice of α in F-tests and confidence intervals affects the outcome of the tests significantly. The larger the α, the more likely it is to conclude that treatments are significantly separable from each other (reject H0). The disadvantage of larger α is that the risk of ratiocinating wrongly increases. In the F-test for interactions between ultrasound and enzymes c=2.29 if α =0.10. H0 would be rejected for day 1 in this case, but the results would be questionable due to the 10% risk of drawing the inaccurate conclusion. The quality of the inoculum might also have affected the results for day 1, as proposed in section 4.1.1, making a greater α difficult to motivate. Furthermore, the interaction plots still provide contradictory results as to the F-tests. With α=0.10, the enzyme treatment levels could be separable on day 18, but with the same drawback. The levels would still not be separable for the other experimental days, and the conclusion that the enzyme treatment doses are too close to each other would remain. A choice of αsim =0.20 instead of 0.10 does not affect the results and conclusions in batch experiment 2. The greater VS-reduction of S1 (in D1/D2) in comparison to S2 (in D3/D4) can indicate that pre- and treatment of S2 could have a larger impact in comparison to pre- and treatment of S1. The lignin content of S2 is most likely higher than for S1, as earlier stated. If a treatment strategy for lignin disintegration could be applied, such as acid pre-treatment (compare to Xiao and Clarkson 1997), the methane potential of S2 could increase. During the semi-continuous digestion experiment, the process of the two mills providing the substrate had process upsets, causing cancelled sludge delivery. Cool stored substrate from the previous week was used in reserve in those cases. In larger scale biogas production, this could bring on greater problems to the process, suggesting a storage tank which can hold substrate for at least a week or two. Hypothesis A can not be completely confirmed, since the enzyme treatment in the semi-continuous digestion experiment was not proven to increase the methane production. In batch experiment 4, it was concluded that the added enzymes induced methane production originating from the indigenous material of the inoculum. With enzymes better suited for substrate disintegration and possibly higher enzyme doses, enzyme treatment of biological sludge could be effective. Ultrasonic pre-treatment and enzyme treatment does however render greater methane production than untreated biological sludge in batch experiments, but the ultrasound pre-treatment was not considered to be economically feasible. These results compose the answer to question number one, i.e. how the methane production is affected by ultrasonic pre-treatment and enzyme treatment of biological sludge. The organic material in biological sludge is proven to be digestible by anaerobic micro-organism in both batch - and semi-continuous digestion experiments. The observed trends of relatively constant methane production, pH within the range of reported in the literature and low VFA concentrations, despite variations in substrate quality, indicate that a stable biogas production can be achieved. The methane amounts achieved in this study are in line with or larger than reported by Puhakka et al. (1992). Therefore hypothesis B is confirmed. However, agitation problems due to scum layer formation, stratification tendencies and relatively high viscosity were prevalent throughout the semi-continuous digestion experiment.

56

57
5 Conclusions • The short term methane production rate increased both when ultrasound pre-treatment and enzyme treatment was applied in batch experiments. The enzyme treatment has a greater potential for application in full scale biogas plants than ultrasound pre-treatment, due to differences in economical feasibility.
• Interaction plots of ultrasound pre-treatment and enzyme treatment show interaction tendencies, but was not statistically confirmed. The tendency reveals negative interaction effects, i.e. inhibition of the methane production.
• 75% ultrasound pre-treatment is an alternative to complete pre-treatment and renders equivalent methane production as to complete pre-treatment.
• A batch experiment performed in this study shows that 4˚C storage for six and 13 days of ultrasound pre-treated biological sludge does not affect the average accumulation of methane per added g VS.
• Enzyme treatment of biological sludge enhances the accumulated methane production from indigenous material in the inoculum.
• The viscosities of the reactor fluids are relatively high in comparison to the literature. The viscosity of the reactor fluids in the reactors with substrate from a chemical mill is higher than for the reactors with substrate from a mechanical mill. Scum layer formation and stratification tendencies deteriorated agitation in all of the reactors. High viscosity and agitation problems can be difficult to control in larger scale.
• The results from the semi-continuous digestion experiment are similar to those obtained from the batch experiments.
• The methane production rates in this study are lower (S2) or higher (S1) in comparison to those presented data by Puhakka et al. (1992). Different types of biological sludge were used and might explain the prevailing differences.
• Since the enzyme treatment in the semi-continuous digestion experiment could not be shown to increase the methane production, hypothesis A can not be confirmed. Ultrasonic pre-treatment and enzyme treatment does, however, give higher methane production rates than untreated biological sludge in batch experiments.
• The organic substances in biological sludge is proven to be digestible by anaerobic micro-organism in both batch - and semi-continuous digestion experiments The observed trends of relatively constant methane production, stable pH and low VFA concentrations indicate that a stable biogas production can be achieved, and thus hypothesis B can be confirmed.

58
6 Recommendations for further work Suggestions for future studies:
• Perform new viscosity analysis of the digested sludge in order to explore the effects of enzyme treatment, homogenization of substrate and additional stirring on the viscosity
• Conduct new analysis of methane production in the semi-continuous digestion experiment after three HRT without process changes such as enzyme dose, homogenization of substrate, agitation etc. (cf., discussion at the end of section 4.2.6)
• Investigate in co-operation with Kemira if the enzyme composition can better adapted to the biological sludge
• Investigate if higher enzyme doses in batch experiments or in the still on-going semi-continuous digestion experiment would affect the methane production and possibly the viscosity
• Study the effects of other pre-treatment methods such as alkali (compare with Lin et al. 2009 in section 2.4) and heat pre-treatment (excess heat from pulp and paper making process may be possible to utilize in large scale production)
• Analyse the lignin content of the substrates and the digested sludge and perform batch experiments with acid pre-treatment if the lignin contents are considered to be relatively high

59
7 References Literature
Ahring BK. 2003. Perspectives for anaerobic digestion. - In: Ahring BK. Biomethanation I, pp. 1-33. Berlin Heidelberg: Springer-Verlag. Andreoli CV, von Sperling M & Fernandes F. Sludge Treatment and Disposal. 2007. London: IWA Publishing. Angelidaki I, Ellegaard L & Ahring BK. 2003. Applications of the anaerobic digestion process. - In: Ahring BK. Biomethanation II, pp. 1-30. Berlin Heidelberg: Springer-Verlag. Bagge E, Sahlström L & Ahlbin A. 2005. The effect of hygienic treatment on the microbial flora of biowaste at biogas plants. Water Res 39:4879-4886. Battimelli A, Millet C, Delgenès JP & Moletta R. 2003. Anaerobic digestion of waste activated sludge combined with ozone post-treatment and recycling. Water Sci Technol 48:61-68. Burgess JE & Pletschke BI. 2008. Hydrolytic enzymes in sewage sludge treatment: A mini-review. Water SA 34:343-349. Cadoret A, Conrad A & Block J-C. 2002. Availability of low and high molecular weight substrates to extracellular enzymes in whole and dispersed activated sludge. Enzyme Microb Technol 31:179-186. Chynoweth DP & Isaacson R. 1987. Anaerobic Digestion of Biomass. New York: Elsevier Applied Science Publishers Ltd. Davidsson Å. 2007. Increase of Biogas Production at Wastewater Treatment Plants; Addition of Urban Organic Waste and Pre-treatment of Sludge. Doctoral dissertation. Lund University. Dewil R, Baeyens J & Goutvrindc R. 2006. Ultrasonic treatment of waste activated sludge. Environm Prog 25:121-128. EIA. 2005. Annual Energy Outlook 2005. US Department of Energy, Washington, DC DOE/EIA-0383. Elliott A & Mahmood T. 2007. Pretreatment technologies for advancing anaerobic digestion of pulp and paper biotreatment residues. Water Res 41:4273-4286. Grönroos A, Kyllönen H, Korpijärvi K, Pirkonen P, Paavola T, Jokela J & Rintala J. 2005. Ultrasound assisted method to increase soluble chemical oxygen demand (SCOD) of sewage sludge for digestion. Ultrason Sonochem 12:115-120. Higgins G & Swartzbaugh J. 1986. Enzyme addition to the anaerobic digestion of municipal wastewater primary sludge. USEPA Water Engineering Research Laboratory, Office of Research and Development. EPA/600/2-86/084.

60
Hobson PN & Wheatley AD. 1993. Anaerobic Digestion: Modern Theory and Practice Elsevier Science Publishers Ltd. Hogan F, Mormede S, Clark P, & Crane M. 2004. Ultrasound sludge treatment for enhanced anaerobic digestion. Water Sci Technol 50:25–32. Houghton JT. 2004. Global Warming: the Complete Briefing 3rd ed. Cambridge: Cambridge University Press. Khanal SK, Grewell D, Sung S, & Van Leeuwen, J. 2007. Ultrasound applications in wastewater sludge pretreatment: a review. Crit Rev Env Sci Tec 37:277-313. Lauber V. 2005. Switching to Renewable Power: A Framework for the 21st Century. London: Earthscan, 144pp. Lerner M, Stahl N & Galil N. 2007. Aerobic vs. Anaerobic biotreatment: paper mill wastewater. Environ Engineer Sci 24:277-285. Lettinga G, van Velsen AFM, de Zeeuw W & Hobma SW. 1979. Feasibility of the upflow anaerobic sludge blanket (UASB)-process. SAE Preprints 35-45. Lettinga G & Hulshoff Pol LW. 1991. UASB-process design for various types of wastewaters. Water Sci Technol 24:87-107. Lin Y,Wang D,Wu S & Wang C. 2009. Alkali pretreatment enhances biogas production in the anaerobic digestion of pulp and paper sludge. J Hazard Mater 170:366-373. Mahmood T & Elliott A. 2006. A review of secondary sludge reduction technologies for the pulp and paper industry. Water Res 40:2093-2112. Mao T & Show KY. 2006. Performance of high-rate sludge digesters fed with sonicated sludge. Water Sci Technol 54:27-33. Mao T & Show KY. 2007. Influence of ultrasonication on anaerobic bioconversion of sludge. Environ Res 79:436-41. Mata-Alvarez J, Macé S & Llabrés P. 2000. Anaerobic digestion of organic solid wastes. An overview of research achievements and perspectives. Bioresource Technol 74:3–16. Matematiska institutionen, LiTH. 2007. Formel- och tabellsamling i matematisk statistik. McKendry P. 2002. Energy production from biomass (part 1): overview of biomass. Bioresource Technol 83:37–46. Mittal KM 1997. Biogas Systems. New Delhi: New Age International (P) Ltd. Monte MC, Fuente E, Blanco A & Negro C. 2009. Waste management from pulp and paper production in the European Union. Waste Manage 29:293-308.

61
Montgomery DC 2005. Design and Analysis of Experiments 6th ed. New Jersey: John Wiley and Sons Inc. Nallathambi Gunaseelan V. 1997. Anaerobic digestion of biomass for methane production: a review. Biomass Energ 13:83-114. Nickel K & Neis U. 2007. Ultrasonic disintegration of biosolids for improved biodegradation. Ultrason Sonochem 14:450-455. Nilsson M, Linné M & Dahl A. 2001. Livscykelinventering för biogas som fordonsbränsle. Report SGC 117, Svenskt gastekniskt center. Pankhurst ES. 1983. The prospects for biogas - a European point of view. Biomass 3:1-42. Puhakka JA, Alavakeri M & Shieh WK. 1992. Anaerobic treatment of kraft pulp-mill waste activated-sludge: gas production and solids reduction. Bioresource Technology 39:61-68. Rintala JA & Puhakka JA. 1994. Anaerobic treatment in pulp- and paper-mill waste management. Bioresource Technol 47:1-18. Rittmann, B. E., & McCarty, P. L. 2001. Environmental Biotechnology: Principles and Applications. New York, NY: McGraw-Hill. Roman HJ, Burgess JE & Pletschke BI. 2006. Enzyme treatment to decrease solids and improve digestion of primary sewage sludge. Afr J Biotechnol. 5:963-967. Romanoa RT, Zhanga R, Teterb S & McGarvey JA. 2009. The effect of enzyme addition on anaerobic digestion of Jose Tall Wheat Grass. Bioresource Technol 100:4564–4571. Romm J. 2006. The car and fuel of the future. Energy Policy 34:2609–2614. Schmidt JE & Ahring BK. 1996. Granular sludge formation in upflow sludge blanket (UASB) reactors. Biotechnol Bioeng 49:229-246. Schnürer A. 1995. Syntrophic acetate oxidation in ammonium-enriched methanogenic systems-organisms and pathways. Doctoral dissertation. Swedish University of Agricultural Sciences. Shelton DR & Tiedje JM. 1984. General method for determining anaerobic biodegradation potential. Applied Environ Microb 47:850-857. Song YC, Kwon SJ & Woo JH. 2004. Mesophilic and thermophilic co-phase anaerobic digestion compare with single-stage mesophilic- and thermophilic digestion of sewage sludge. Water Res 38:1653-1662. Stoica A, Sandberg M & Holby O. 2009. Energy use and recovery strategies within wastewater treatment and sludge handling at pulp and paper mills. Bioresource Technol 100:3497-505.

62
Svensk standard 028113, ed 1, 1981. Vattenundersökningar – Bestämning av torrsubstans och glödgningsrest i vatten, slam och sediment. Svensk Standard 12176, ed 1, 1998. Karaktärisering av slam – bestämning av pH. Thompson G, Swain J, Kay M & Forster CF. 2001. The treatment of pulp and paper mill effluent: a review. Bioresource Technol 77:275-286. Tiehm A, Nickel K & Neis U. 1997. The use of ultrasound to accelerate the anaerobic digestion of sewage sludge. Water Sci Technol 36:121–128. Tiehm A, Nickel K, Zellhorn M, & Neis U. 2001. Ultrasonic waste activated sludge disintegration for improving anaerobic stabilization. Water Res 35:2003-2009. Weiland T. 2000. Anaerobic waste digestion in Germany – status and recent developments. Biodegradation 11:415-421. Xiao W & Clarkson WW. 1997. Acid solubilization of lignin and bioconversion of treated newsprint to methane. Biodegradation 8:61-66. Yu GH, He PJ, Shao LM & Zhu YS. 2008. Extracellular proteins, polysaccharides and enzymes impact on sludge aerobic digestion after ultrasonic pretreatment. Water Res 42:1925-1934. Zinder SH. 1984. Microbiology of anaerobic conversion of organic wastes to methane: recent developments. ASM News 50:294-298. Österman J & Nordling C. 2006. Physics handbook for science and engineering 4th ed. Lund: Studentlitteratur.
Internet resources http://www.lackebywater.se Consulted 2009-09-11 http://www.scandinaviangts.com Consulted 2009-09-11 Statens offentliga utredningar. Report SOU 1996:184. http://www.riksdagen.se/webbnav/?nid=3281&doktyp=sou&rm=1996&bet=184&dok_id=GKB3184 Consulted 2009-07-03 Personal Communication
Ejlertsson, J. R & D Manager Scandinavian Biogas Fuels. A: 2009-01-27, B: 2009-08-10. +46(0)18-125821. Svensson B. Prof. Department of Thematic Studies, Water and Environment Linköping University. 2009-05-28. +46(0)13-281000.

63
Larsson P. Sludge Development Manager Kemira Kemi AB. 2009-07-02. +46(0)42-171136.
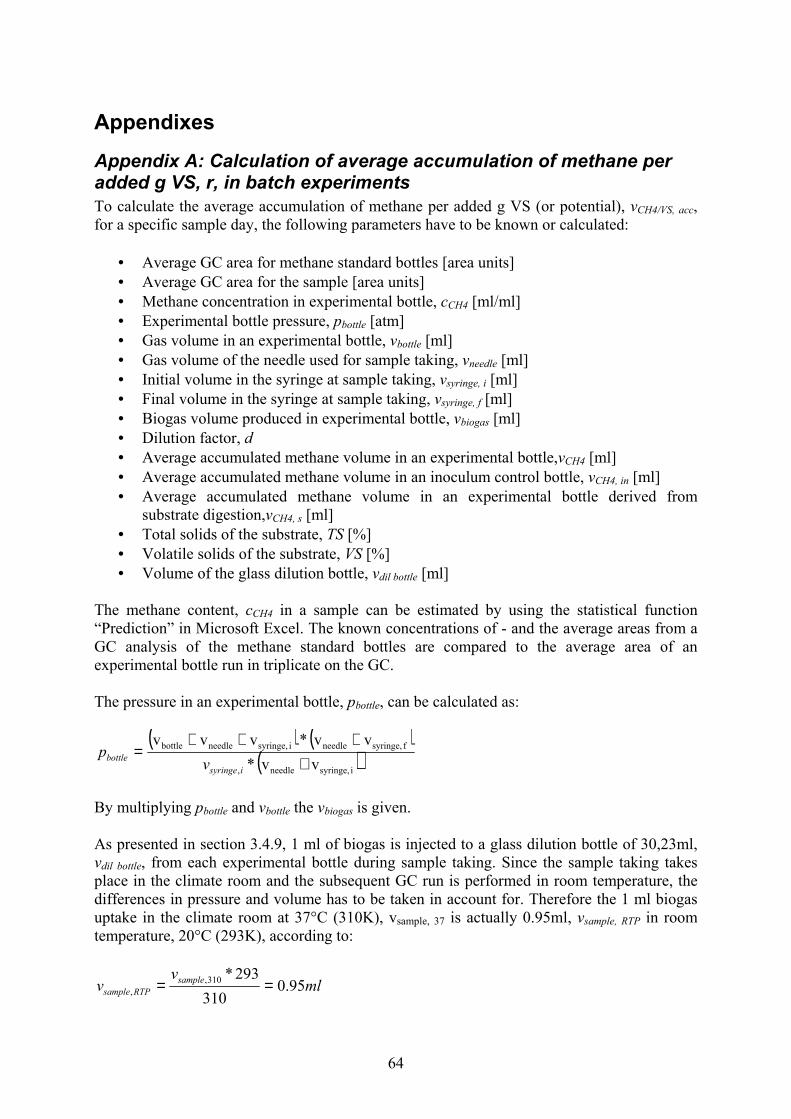
64
Appendixes
Appendix A: Calculation of average accumulation of methane per added g VS, r, in batch experiments To calculate the average accumulation of methane per added g VS (or potential), vCH4/VS, acc, for a specific sample day, the following parameters have to be known or calculated:
• Average GC area for methane standard bottles [area units] • Average GC area for the sample [area units] • Methane concentration in experimental bottle, cCH4 [ml/ml] • Experimental bottle pressure, pbottle [atm] • Gas volume in an experimental bottle, vbottle [ml] • Gas volume of the needle used for sample taking, vneedle [ml] • Initial volume in the syringe at sample taking, vsyringe, i [ml] • Final volume in the syringe at sample taking, vsyringe, f [ml] • Biogas volume produced in experimental bottle, vbiogas [ml] • Dilution factor, d • Average accumulated methane volume in an experimental bottle,vCH4 [ml] • Average accumulated methane volume in an inoculum control bottle, vCH4, in [ml] • Average accumulated methane volume in an experimental bottle derived from substrate digestion,vCH4, s [ml]
• Total solids of the substrate, TS [%] • Volatile solids of the substrate, VS [%] • Volume of the glass dilution bottle, vdil bottle [ml]
The methane content, cCH4 in a sample can be estimated by using the statistical function “Prediction” in Microsoft Excel. The known concentrations of - and the average areas from a GC analysis of the methane standard bottles are compared to the average area of an experimental bottle run in triplicate on the GC. The pressure in an experimental bottle, pbottle, can be calculated as:
( ) ( )( )i syringe,needle,
f syringe,needlei syringe,needlebottle
vv*
vv*vvv
++++
=isyringe
bottlev
p
By multiplying pbottle and vbottle the vbiogas is given. As presented in section 3.4.9, 1 ml of biogas is injected to a glass dilution bottle of 30,23ml, vdil bottle, from each experimental bottle during sample taking. Since the sample taking takes place in the climate room and the subsequent GC run is performed in room temperature, the differences in pressure and volume has to be taken in account for. Therefore the 1 ml biogas uptake in the climate room at 37°C (310K), vsample, 37 is actually 0.95ml, vsample, RTP in room temperature, 20°C (293K), according to:
mlv
vsample
RTPsample 95.0310
293*310,, ==
65
Because of the sample dilution prior to the GC analysis, a dilution factor, d, can be derived from the volume of the dilution glass bottle, vdil bottle and the vsample, RTP of 0.95ml. d is calculated as:
33,
, ≈+
=RTPsample
RTPsampledilbottle
v
vvd
If vbiogas is multiplied with cCH4 and the dilution factor, d, the methane volume of the experimental bottle, vCH4, is derived;
44 ** CHbiogasCH cdvv =
The theoretical methane volume induced by biomethanation of the substrate only, vCH4, s, can be calculated according to:
inCHCHsCH vvv ,44,4 −=
, where vCH4, in is the average methane volume of the control bottles containing inoculum only. From the calculated TS (section 3.3) and the weight of the substrate in the experimental bottle, the amount of TS in an experimental bottle,TSbottle, can be achieved through multiplication. By multiplying TSbottle with the calculated VS (section 3.3), the amount of VS in an experimental bottle, VSbottle, is given. Lastly, the desired volume of accumulated methane produced per amount of VS at 0°C, r, is calculated as:
310*
273*r 1
bottleVS
r−= [ml CH4/g added VS]
, where r-1 is the average accumulation of methane per added g VS from the previous sample day.

66
Appendix B: Calculation of ultrasonic pre-treatment effects in batch experiments The calculations below demonstrate how the energy input (W) was calculated for batch experiment 2. The methodology for the other batch experiment with ultrasonic pre-treatment is analogous. When calculating the ultrasonic pre-treatment effect, the treatment time (t) is initially estimated by an approximation of the effect (P), the desired energy input (W) of 30Wh/l and the volume of the treated substrate (V), according to:
hW
llWh
P
VWt 2.0
600
4*/30* ===
The accurate figures (theoretically) of P and W are calculated after the pre-treatment procedure is performed. When the estimated time is applied and the estimations of P and W are close to the calculated values the desired amount of ultrasound pre-treatment is achieved. In batch experiment 1 the values of treatment time (t), frequency (f), current (I), voltage (U) and angular displacement (∆t) for each treatment interval are presented in Table A.1. Table A.1. Treatment time (t), frequency (f), current (I), voltage (U) and angular displacement (∆t) of the five treatment periods in batch experiment 2. Treatment
period
Treatment
time, t
[s]
Frequency,
f
[Hz]
Current, I
[A]
Voltage, U
[V]
Angular
displacement, ∆t
[µs]
First 60 19770 1.4 900 3.2 Second 30 19770 1.4 900 5.2 Third 150 19610 1.4 800 5.6 Fourth 90 19610 1.2 620 2.4 Fifth 410 19610 1.2 620 0 The period time (T) can be calculated from f as:
fT
1=
By using T, ∆t, U and I, P for each treatment period can be determined according to:
∆=T
360*tcos** IUP
The effects in the five treatment periods of batch experiment 2 are as follows (the actual figures for U, I, ∆t and T are presented in Table A.1):
WIUP 1162T
360*tcos**
1
1111 ≈
∆=
WIUP 1006T
360*tcos**
2
2222 ≈
∆=
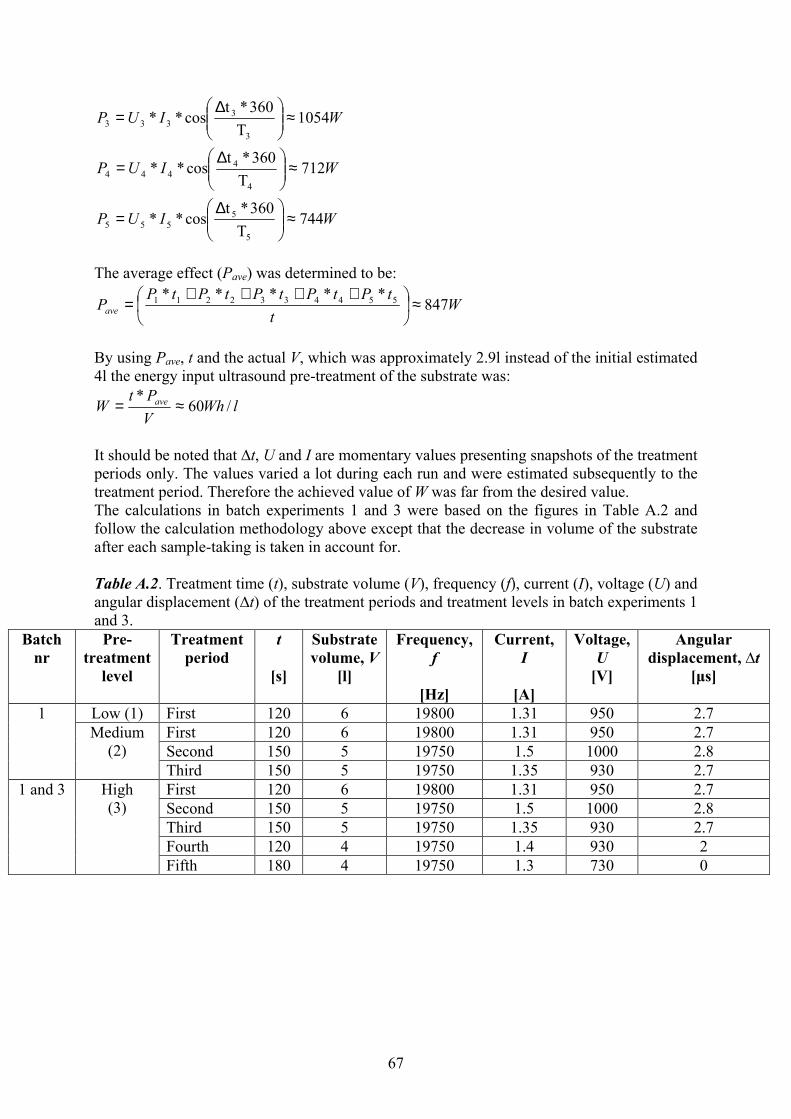
67
WIUP 1054T
360*tcos**
3
3333 ≈
∆=
WIUP 712T
360*tcos**
4
4444 ≈
∆=
WIUP 744T
360*tcos**
5
5555 ≈
∆=
The average effect (Pave) was determined to be:
Wt
tPtPtPtPtPPave 847
***** 5544332211 ≈
++++=
By using Pave, t and the actual V, which was approximately 2.9l instead of the initial estimated 4l the energy input ultrasound pre-treatment of the substrate was:
lWhV
PtW ave /60
*≈=
It should be noted that ∆t, U and I are momentary values presenting snapshots of the treatment periods only. The values varied a lot during each run and were estimated subsequently to the treatment period. Therefore the achieved value of W was far from the desired value. The calculations in batch experiments 1 and 3 were based on the figures in Table A.2 and follow the calculation methodology above except that the decrease in volume of the substrate after each sample-taking is taken in account for. Table A.2. Treatment time (t), substrate volume (V), frequency (f), current (I), voltage (U) and angular displacement (∆t) of the treatment periods and treatment levels in batch experiments 1 and 3.
Batch
nr
Pre-
treatment
level
Treatment
period
t
[s]
Substrate
volume, V
[l]
Frequency,
f
[Hz]
Current,
I
[A]
Voltage,
U
[V]
Angular
displacement, ∆t
[µs]
Low (1) First 120 6 19800 1.31 950 2.7 First 120 6 19800 1.31 950 2.7 Second 150 5 19750 1.5 1000 2.8
1 Medium (2)
Third 150 5 19750 1.35 930 2.7 First 120 6 19800 1.31 950 2.7 Second 150 5 19750 1.5 1000 2.8 Third 150 5 19750 1.35 930 2.7 Fourth 120 4 19750 1.4 930 2
1 and 3 High (3)
Fifth 180 4 19750 1.3 730 0

68
Appendix C: Calculations of the methane yield of proteins and carbohydrates
From Davidsson 2007, a model for calculating the anaerobic biodegradability of organic chemicals based on the Buswell equation is utilized:
3422 **8
3
482*
8
3
482*
8
3
24NHcCH
cbanCO
cbanOH
cbanNOHC cban +
−−++
++−⇒
+−−+
Assuming that proteins and carbohydrates have the chemical formulas C5H7O2N1 and C6H12O6 respectively, the methane yield in ml per added g of organic material can be calculated. When applying the Buswell equation for protein it renders:
342212752
5
8
20*8
21NOHC NHCHCOOH ++⇒+
The molecular weight of C5H7O2N1, M C5H7O2N1, is:
moleg /11.113001.14000.16*2008.1*7011.12*5MC5H7O2N1 ≈+++=
The amount of substance for protein, nC5H7O2N1 per g is consequently:
molesen 3
C5H7O2N1
C5H7O2N1C5H7O2N1 84.8
M
m −≈=
In the Buswell equation for protein, presented above, one mole C5H7O2N1 yields 2.5 moles CH4. Therefore, the amount of substance for CH4, nCH4, is 2.5*8.84e
-3≈2.21e-2 moles. The molecular weight of CH4, MCH4,is:
molg /04.16008.1*4011.12*1M CH4 ≈+=
Consequently, the amount of CH4, mCH4, is:
ge 35.021.2*04.16m 2CH4 ≈= −
The density of methane at 20°C (293K) and 0.1Mpa is 0.72g/l (Österman and Nordling 2006). The density at 0°C (273K), ρCH4, is therefore:
lgC /67.0293
273*72.0 ≈=4Ηρ
The volume CH4 formed from 1g of protein, vp, is accordingly:
mllm
vCH
CHp 529529.0
4
4 ⇔≈=ρ

69
In the biodegradability model, the CH4 volume is multiplied by 0.95, in order to compensate for gas dissolved in the reactor system (Shelton and Tiedje 1984). 0.95*529ml≈503ml CH4/g would be the theoretical methane yield for protein. For carbohydrates, polymers of glucose, the same calculation methodology can be utilized. The glucose (C6H12O6) molecules in carbohydrates will form water (H2O) when arranged as a polymer:
OHOHCOHC 251066126 +⇒
, where C6H10O5 is the carbohydrate. When applying the Buswell equation for carbohydrates it renders:
4225106 33 CHCOOHOHC +⇒+
The methane yield for carbohydrates will be calculated to be 418ml/g carbohydrate, when a molecular weight of 162.14g/mole, the presented calculation methodology of the methane yield for proteins and the molar relation of 1:3 between protein and CH4 are used. The theoretical methane potential for Whatman filter paper nr 3 Qualitative per g added volatile solids, used in section 4.3, can be calculated from the above presented methane yield per gram carbohydrate. The Whatman filter paper nr 3 Qualitative used in control bottles C1 has an ash content of 0.06% and the remaining 99.94% is cellulose, a carbohydrate. The VS of the filter paper was determined to 100%. If approximating Whatman filter paper nr 3 Qualitative to consist of 100% cellulose (carbohydrates), 1g of the filter paper is approximately 1g VS. Consequently, the methane potential is 418ml CH4/g added VS for Whatman filter paper nr 3 Qualitative.

70
Appendix D: Construction of decay curve in the semi-continuous digestion experiment
The volume of the reactor fluid on the first day, v0, was 4000ml. Assuming that the volume of digested sludge withdrawn from the reactor each day, vout, is 200ml and that the same volume of substrate and additional water, vin, was added, the HRT would be 20 days and the remaining proportion of the initial reactor fluid, p, would change with time as presented in Figure A.1. The remaining volume of the reactor fluid is therefore 3800ml. On day 1, p was consequently 3800/4000=95%. Calculation methodology of p for the succeeding days:
in
x
out vv
vv *
0
1−=
, where vx-1 is the volume of the remaining initial reactor fluid of day x-1. The volume of the remaining initial reactor fluid on day x, vx, is given by:
out
xx
v
vv 1−=
Lastly, p, is derived from vx and v0:
0v
vp x=
0%
10%
20%
30%
40%
50%
60%
70%
80%
90%
100%
0 2 4 6 8 10 12 14 16 18 20 22 24 26 28 30 32 34 36 38 40 42 44 46 48 50 52 54 56 58 60
Days
Remaining proportion of the initial reactor fluid
Figure A.1. Decay curve of the reactor fluid in the semi-continuous digestion experiment. Working reactor volume 4000ml, daily withdrawal of reactor fluid: 200ml, daily substrate and additional water feed: 200ml (HRT: 20 days).