anaerobic digestion - a banker's perspective (mike rowe - ifs)
TRANSCRIPT
Anaerobic Digestion – a Banker’s PerspectiveMike Rowe – Senior Partner Partner Exeter IFS

2
UK Economy: The Road to Hell?
David Tinsley
UK Economist
nabCapital, London
October 20th 2008
3
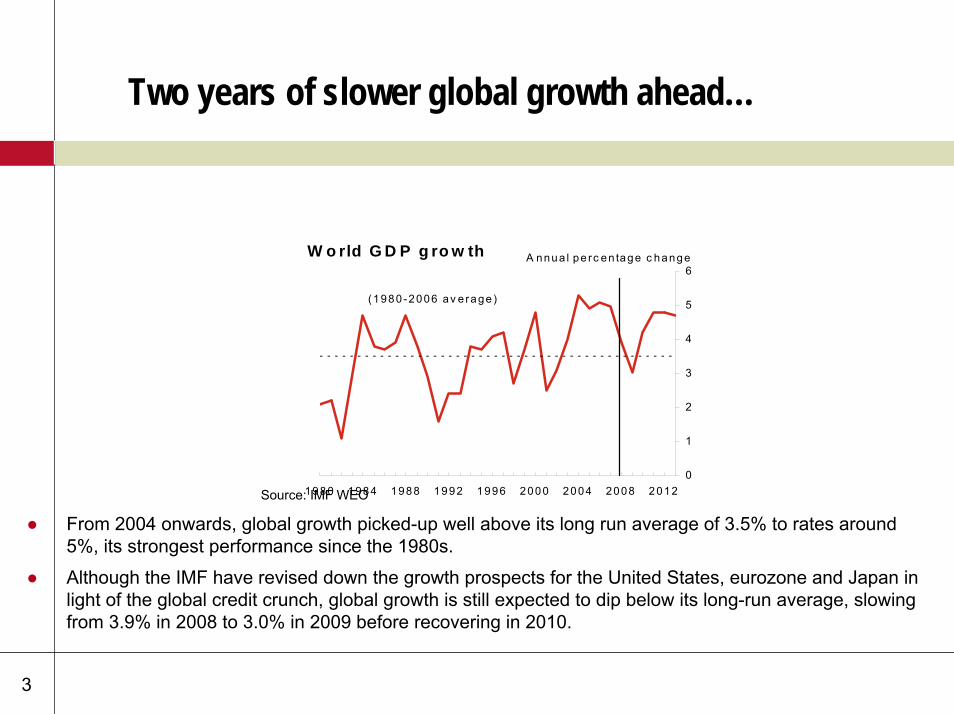
Two years of slower global growth ahead…
0
1
2
3
4
5
6
1980 1984 1988 1992 1996 2000 2004 2008 2 012
W o rld G D P g ro w th A nnua l pe rc en tage c hange
(1980 -2006 av e ra ge )
● From 2004 onwards, global growth picked-up well above its long run average of 3.5% to rates around 5%, its strongest performance since the 1980s.
● Although the IMF have revised down the growth prospects for the United States, eurozone and Japan in light of the global credit crunch, global growth is still expected to dip below its long-run average, slowing from 3.9% in 2008 to 3.0% in 2009 before recovering in 2010.
Source: IMF WEO
4
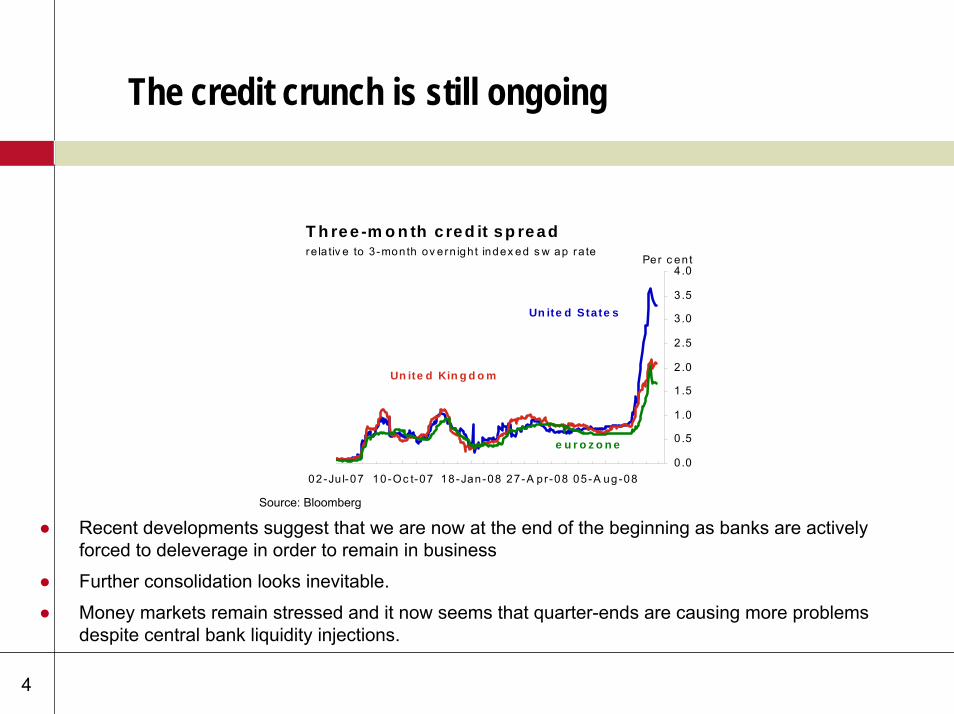
The credit crunch is still ongoing
Source: Bloomberg
● Recent developments suggest that we are now at the end of the beginning as banks are actively forced to deleverage in order to remain in business
● Further consolidation looks inevitable.
● Money markets remain stressed and it now seems that quarter-ends are causing more problems despite central bank liquidity injections.
0.0
0 .5
1 .0
1 .5
2 .0
2 .5
3 .0
3 .5
4 .0
02-Ju l-07 10-Oc t-07 18-Jan-08 27-A pr -08 05-A ug-08
T h re e -m o n th c re d it s p re a dPer c en t
Un ite d State s
Un ite d Kin g d o m
e u r o z o n e
re la tiv e to 3-month ov ern ight index ed s w ap ra te
5
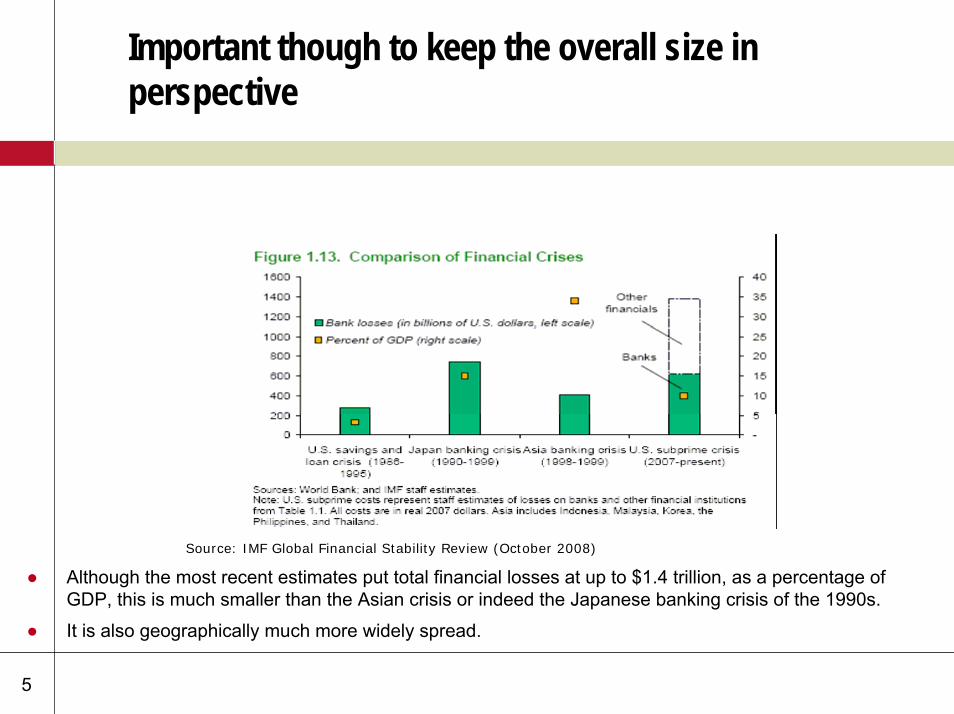
Important though to keep the overall size in perspective
Source: IMF Global Financial Stability Review (October 2008)
● Although the most recent estimates put total financial losses at up to $1.4 trillion, as a percentage of GDP, this is much smaller than the Asian crisis or indeed the Japanese banking crisis of the 1990s.
● It is also geographically much more widely spread.
6
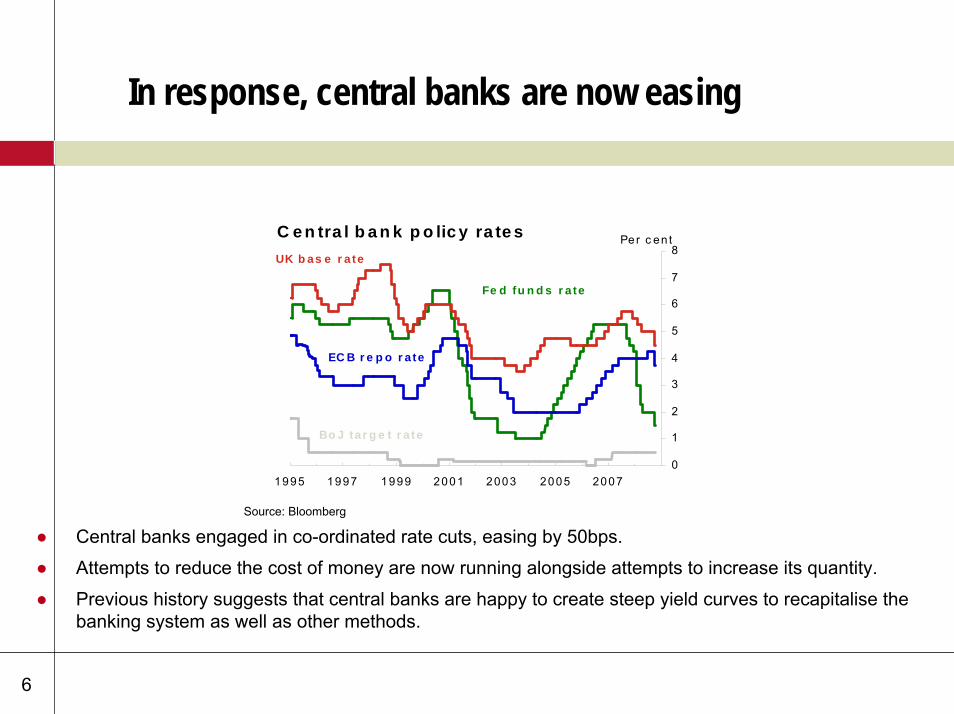
In response, central banks are now easing
0
1
2
3
4
5
6
7
8
1995 1997 1999 2001 2003 2005 2007
Per c en tC e n tra l b a n k p o lic y ra te s
EC B r e p o r a te
Fe d fu n d s r a te
UK b as e r a te
Bo J ta r g e t r a te
Source: Bloomberg
● Central banks engaged in co-ordinated rate cuts, easing by 50bps.
● Attempts to reduce the cost of money are now running alongside attempts to increase its quantity.
● Previous history suggests that central banks are happy to create steep yield curves to recapitalise the banking system as well as other methods.
7
Surviving the recession: the bad the ugly and thegood
8
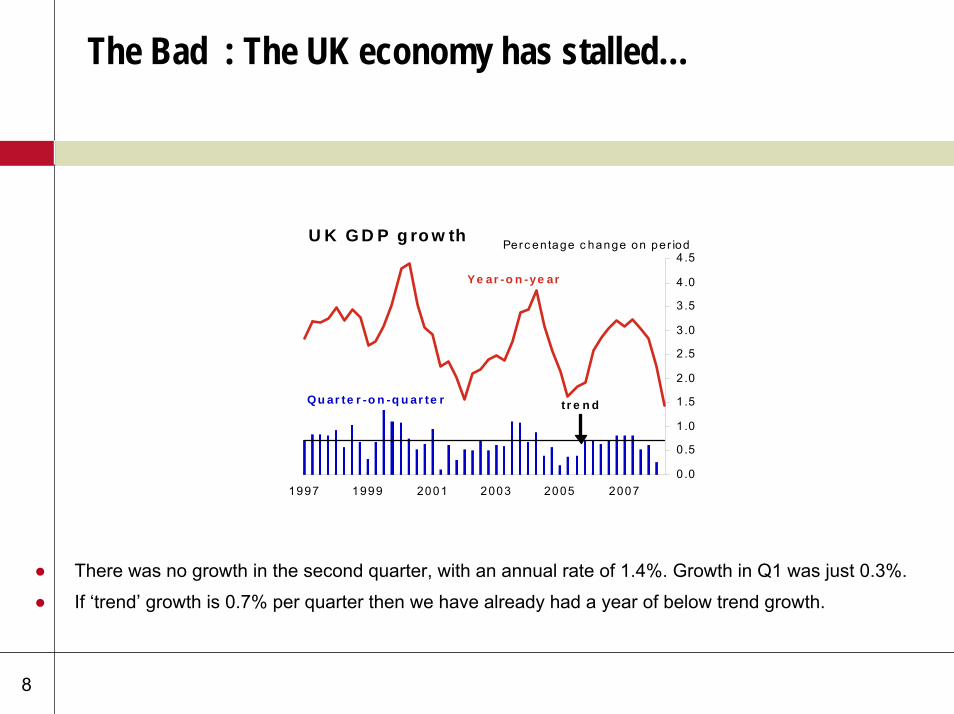
The Bad : The UK economy has stalled…
0.0
0 .5
1 .0
1 .5
2 .0
2 .5
3 .0
3 .5
4 .0
4 .5
1997 1999 2001 2003 2005 2007
U K G D P g ro w th Perc entage c hange on per iod
Ye ar -o n -ye ar
Qu ar te r -o n -q u ar te r t r e n d
● There was no growth in the second quarter, with an annual rate of 1.4%. Growth in Q1 was just 0.3%.
● If ‘trend’ growth is 0.7% per quarter then we have already had a year of below trend growth.
9
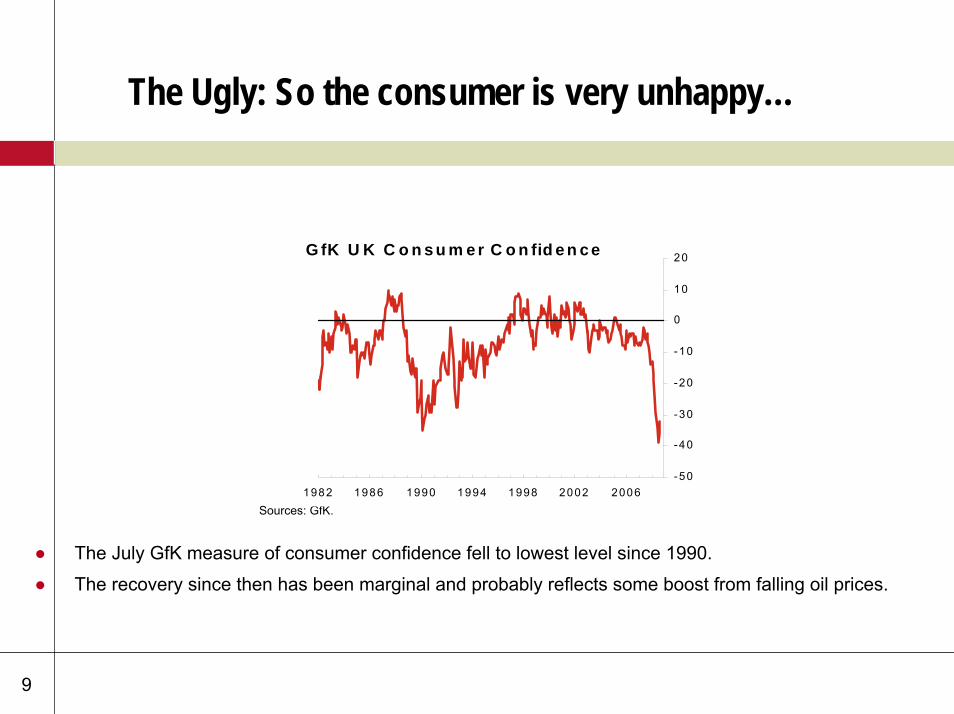
The Ugly: So the consumer is very unhappy…
Sources: GfK.
-50
-40
-30
-20
-10
0
10
20
1982 1986 1990 1994 1998 2002 2006
G fK U K C o n s u m e r C o n fid e n c e
● The July GfK measure of consumer confidence fell to lowest level since 1990.
● The recovery since then has been marginal and probably reflects some boost from falling oil prices.
10
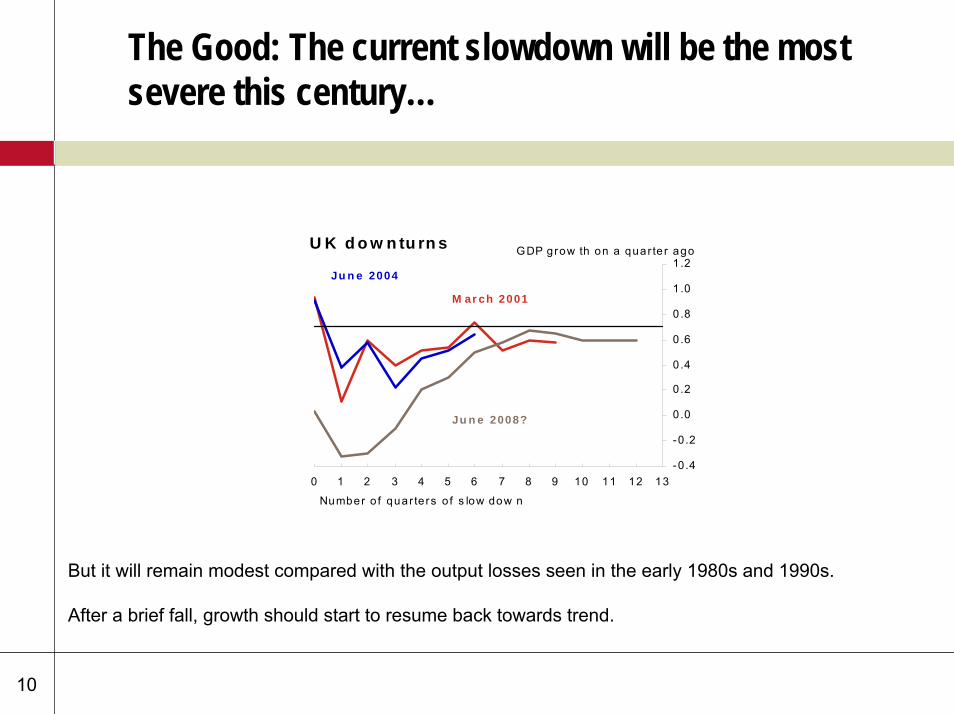
The Good: The current slowdown will be the most severe this century…
-0 .4
-0 .2
0 .0
0 .2
0 .4
0 .6
0 .8
1 .0
1 .2
0 1 2 3 4 5 6 7 8 9 10 11 12 13
M ar ch 2001
Ju n e 2004
Ju n e 2008?
Number o f quar ters o f s low dow n
U K d o w n tu rn s GDP grow th on a quar te r ago
But it will remain modest compared with the output losses seen in the early 1980s and 1990s.
After a brief fall, growth should start to resume back towards trend.

11
The Good: But inflation should ease rapidly in the coming months…
-1
0
1
2
3
4
5
6
1998 2000 2002 2004 2006 2008 2010
perc en tage c hange on a y ea r agoU K C P I In fla tio n
Forec as t
Sourc e : nabCap ita l
He ad lin e
'C o r e '
● CPI inflation hit 5.2% in September. But from here it should decline sharply.
● Weakening activity should see underlying inflation ease and allow rate cuts.
12
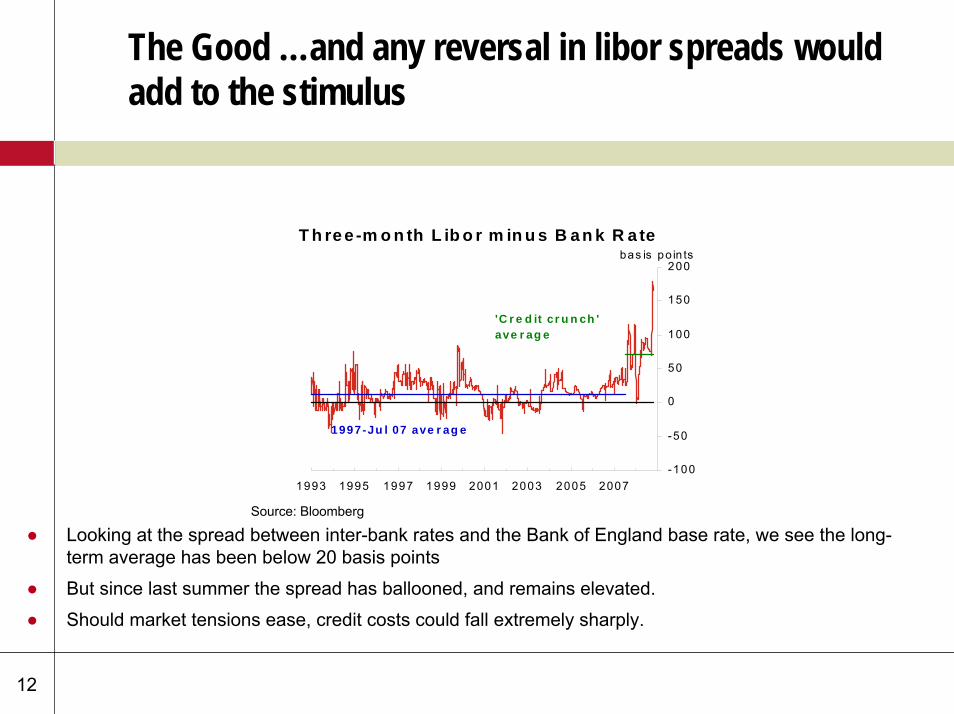
The Good …and any reversal in libor spreads would add to the stimulus
Source: Bloomberg
● Looking at the spread between inter-bank rates and the Bank of England base rate, we see the long-term average has been below 20 basis points
● But since last summer the spread has ballooned, and remains elevated.
● Should market tensions ease, credit costs could fall extremely sharply.
-100
-50
0
50
100
150
200
1993 1995 1997 1999 2001 2003 2005 2007
T h re e -m o n th L ib o r m in u s B a n k R a tebas is po in ts
1997-Ju l 07 ave r ag e
'C r e d it cr u n ch ' ave r ag e
13
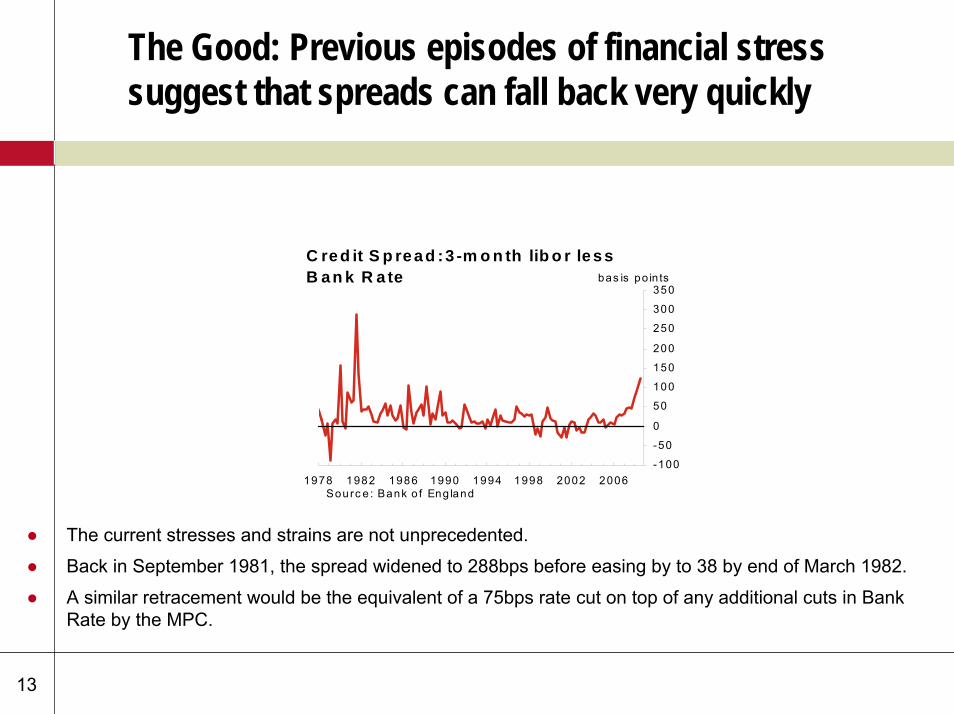
The Good: Previous episodes of financial stress suggest that spreads can fall back very quickly
-100
-50
0
50
100
150
200
250
300
350
1978 1982 1986 1990 1994 1998 2002 2006
C re d it S p re a d :3 -m o n th lib o r le s s B a n k R a te bas is po in ts
Sourc e : Bank o f Eng land
● The current stresses and strains are not unprecedented.
● Back in September 1981, the spread widened to 288bps before easing by to 38 by end of March 1982.
● A similar retracement would be the equivalent of a 75bps rate cut on top of any additional cuts in Bank Rate by the MPC.
14
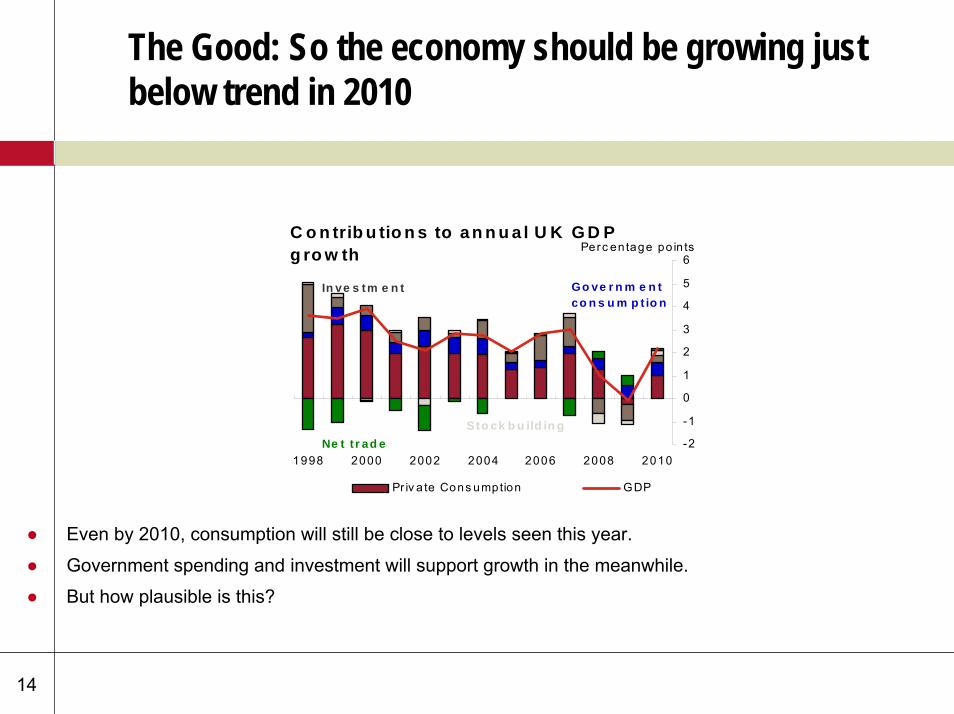
The Good: So the economy should be growing just below trend in 2010
-2
-1
0
1
2
3
4
5
6
1998 2000 2002 2004 2006 2008 2010
Pr iv a te Cons umption GDP
C o n trib u tio n s to a n n u a l U K G D P g ro w th Perc en tage po in ts
Ne t t r ad eSto ck b u ild in g
Go ve r n m e n tco n s u m p t io n
In ve s tm e n t
● Even by 2010, consumption will still be close to levels seen this year.
● Government spending and investment will support growth in the meanwhile.
● But how plausible is this?
15
The Good: UK labour market fundamentals are different
0
2 0 0
4 0 0
6 0 0
8 0 0
1 ,0 0 0
1 ,2 0 0
1 ,4 0 0
1 ,6 0 0
1 ,8 0 0
2 ,0 0 0
1 9 9 8 2 0 0 0 2 0 0 2 2 0 0 4 2 0 0 6 2 0 0 8
th o u s a n d sU K e m p lo y m e n t g ro w th s in c e 1 9 9 7
UK
n o n - UK
Source: Office for National Statistics
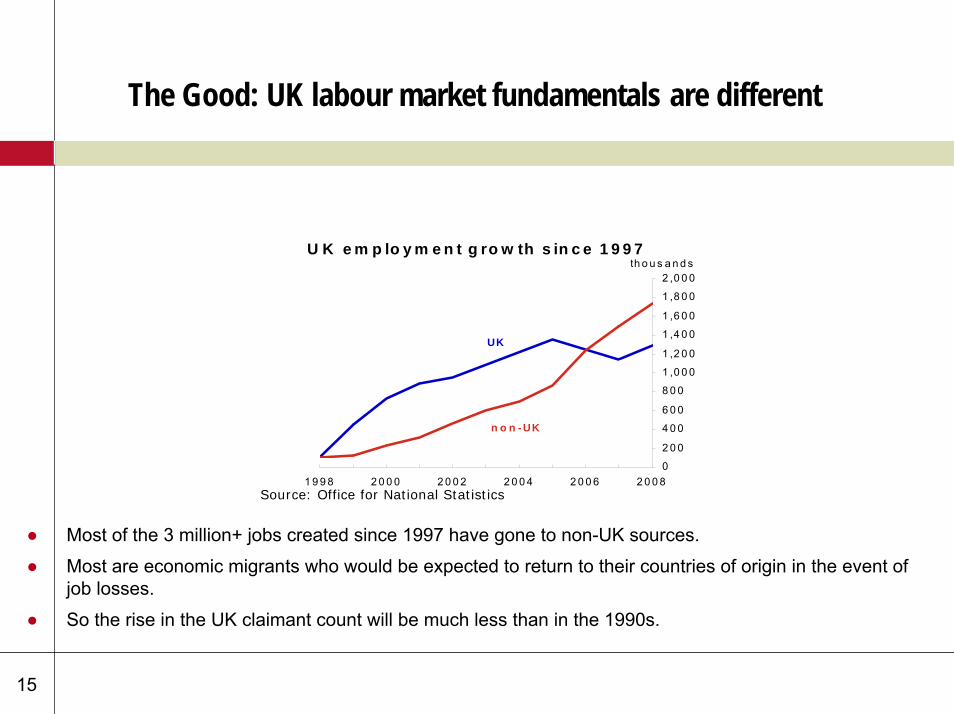
● Most of the 3 million+ jobs created since 1997 have gone to non-UK sources.
● Most are economic migrants who would be expected to return to their countries of origin in the event of job losses.
● So the rise in the UK claimant count will be much less than in the 1990s.
16
The Good: Eastern European workers have become the fastest growing sector
-200
-100
0
100
200
300
400
500
1998 2000 2002 2004 2006 2008
Un ited K ingdomInd ian Subc ontinen tA us tra lia and New Z ea landA f r ic aUSAEUA 8EU14
c hange on y ear ;thous ands
U K a n n u a l e m p lo y m e n t g ro w th
Source: Office for National Statistics
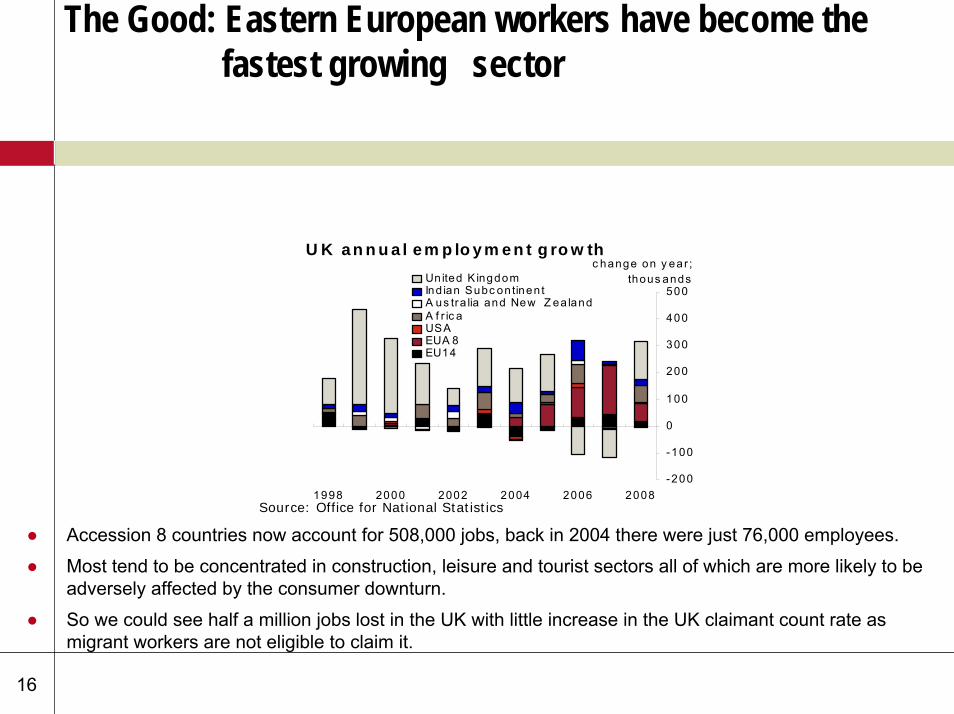
● Accession 8 countries now account for 508,000 jobs, back in 2004 there were just 76,000 employees.
● Most tend to be concentrated in construction, leisure and tourist sectors all of which are more likely to be adversely affected by the consumer downturn.
● So we could see half a million jobs lost in the UK with little increase in the UK claimant count rate as migrant workers are not eligible to claim it.
17
The Good: Government spending will support growth as the private sector stagnates
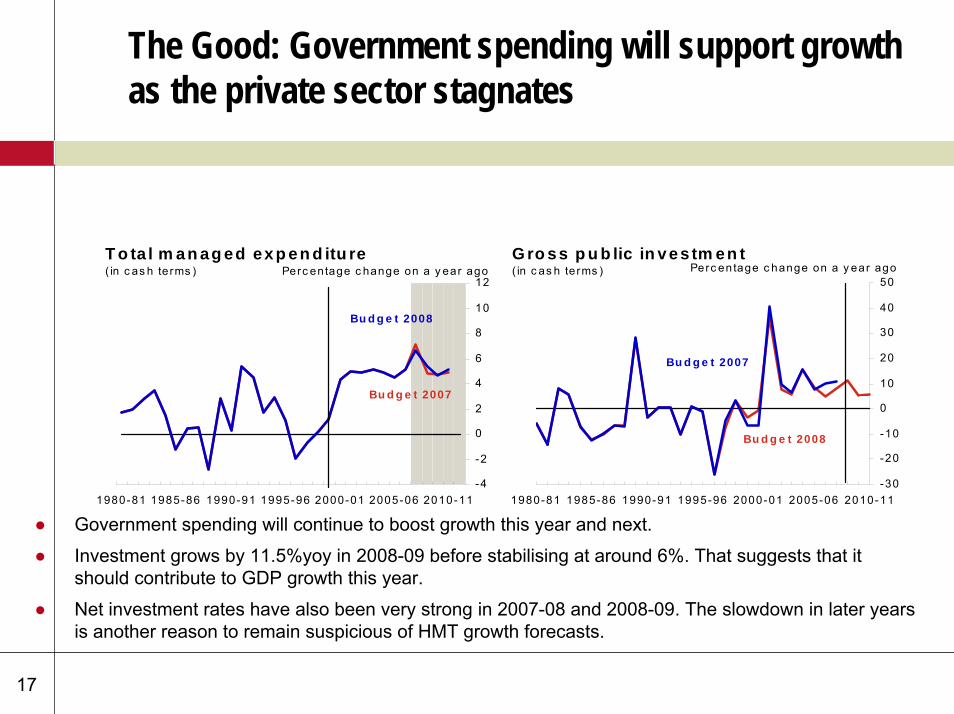
● Government spending will continue to boost growth this year and next.
● Investment grows by 11.5%yoy in 2008-09 before stabilising at around 6%. That suggests that it should contribute to GDP growth this year.
● Net investment rates have also been very strong in 2007-08 and 2008-09. The slowdown in later years is another reason to remain suspicious of HMT growth forecasts.
-4
-2
0
2
4
6
8
10
12
1980-81 1985-86 1990-91 1995-96 2000-01 2005-06 2010-11
Perc entage c hange on a y ear agoT o ta l m an ag ed exp en d itu re( in c as h terms )
Bu d g e t 2007
Bu d g e t 2008
-30
-20
-10
0
10
20
30
40
50
1980-81 1985-86 1990-91 1995-96 2000-01 2005-06 2010-11
Perc en tage c hange on a y ear agoG ro s s p u b lic in v e s tm en t( in c as h te rms )
Bu d g e t 2008
Bu d g e t 2007
Bu d g e t 2007
18
Though public finances are the biggest constraint on extra Government intervention
0
20
40
60
80
100
120
2004-05 2005-06 2006-07 2007-08 2008-09 2009-10
Capita l In jec tionsnabCap ita l f o rec as t2008 Budget Treas ury Forec as t
P u b lic s e c to r n e t b o rro w in g £ b illion
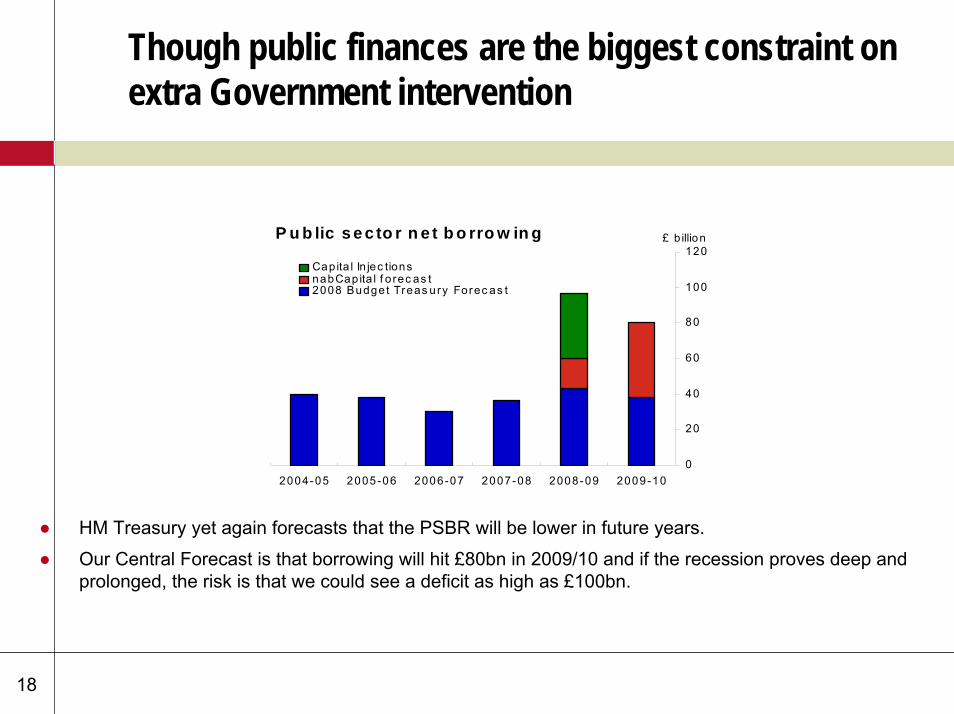
● HM Treasury yet again forecasts that the PSBR will be lower in future years.
● Our Central Forecast is that borrowing will hit £80bn in 2009/10 and if the recession proves deep and prolonged, the risk is that we could see a deficit as high as £100bn.

19
And further falls in the pound look likely
1 .3
1 .4
1 .5
1 .6
1 .7
1 .8
1 .9
2 .0
2 .1
2 .2
1999 2001 2003 2005 2007 2009
S te rlin g -d o lla r e x c h a n g e ra teUS D pe r £1
S p o t r a te
S e p te m b e rC o n s e n s u s
NA B fo r e cas ts
1 .20
1 .30
1 .40
1 .50
1 .60
1 .70
1 .80
1999 2001 2003 2005 2007 2009
S te rlin g -e u ro e x c h a n g e ra te€1 pe r £1
S p o t r a te
S e p te m b e rC o n s e n s u s
NA B fo r e cas ts
● We have long been bearish on sterling.
● The downgrading of UK and eurozone growth prospects have helped boost the US dollar and push down on commodities prices.
● We look for sterling to fall further against the dollar.
20
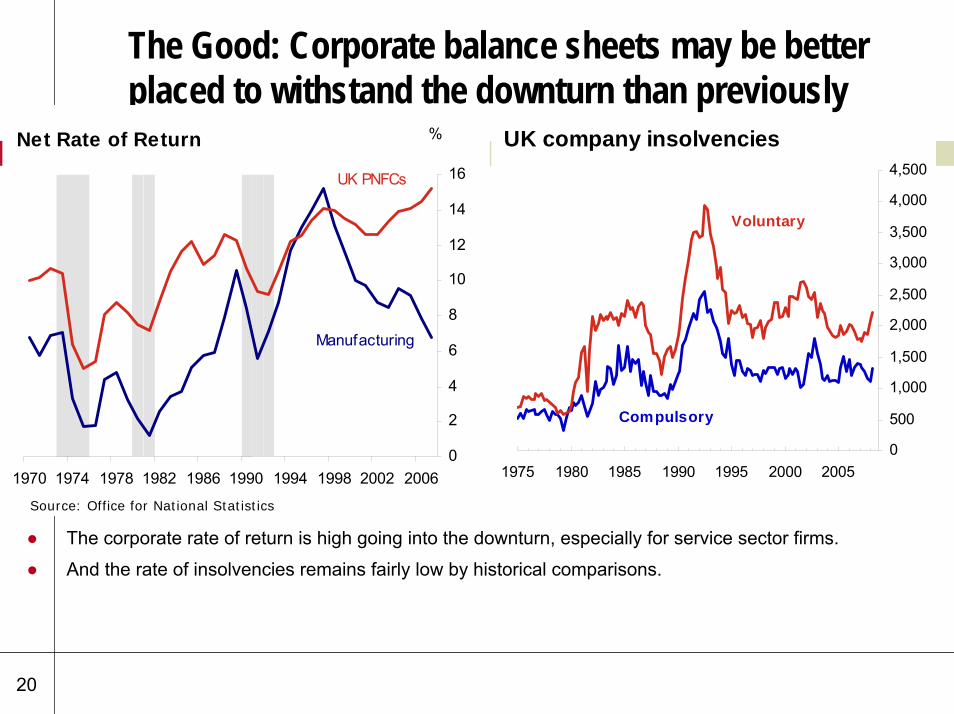
The Good: Corporate balance sheets may be better placed to withstand the downturn than previously
0
2
4
6
8
10
12
14
16
1970 1974 1978 1982 1986 1990 1994 1998 2002 2006
UK PNFCs
Manufacturing
Net Rate of Return %
0
500
1,000
1,500
2,000
2,500
3,000
3,500
4,000
4,500
1975 1980 1985 1990 1995 2000 2005
UK company insolvencies
Voluntary
Compulsory
Source: Office for National Statistics
● The corporate rate of return is high going into the downturn, especially for service sector firms.
● And the rate of insolvencies remains fairly low by historical comparisons.
21
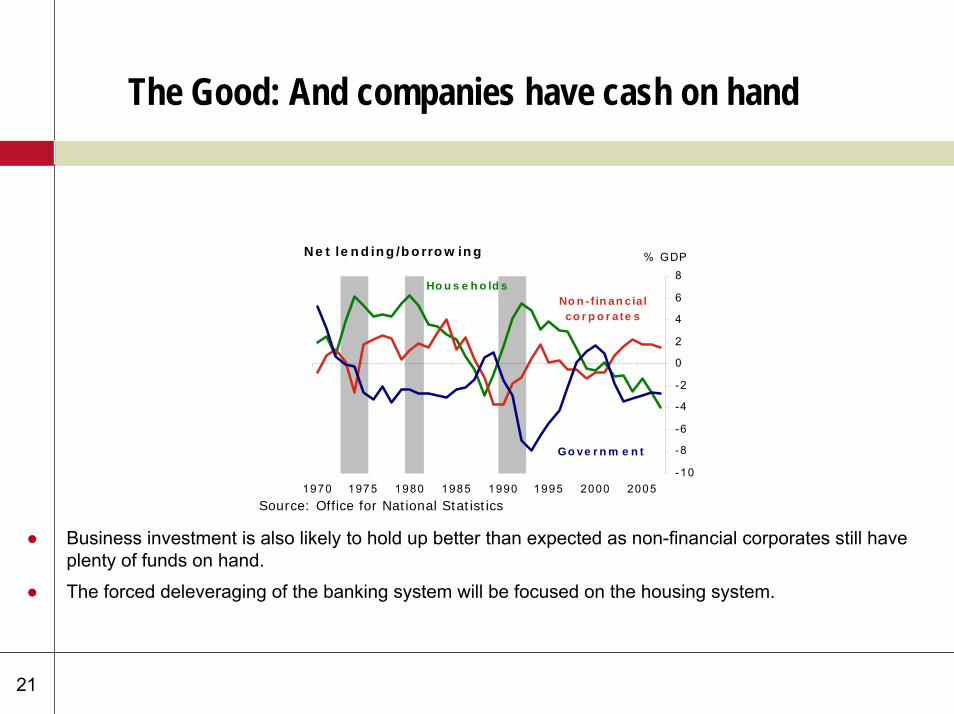
The Good: And companies have cash on hand
-10
-8
-6
-4
-2
0
2
4
6
8
1970 1975 1980 1985 1990 1995 2000 2005
Ne t le n d in g /b o rro w in g % GDP
No n - f in an cia l co r p o r ate s
Ho u s e h o ld s
Go ve r n m e n t
Source: Office for National Statistics
● Business investment is also likely to hold up better than expected as non-financial corporates still have plenty of funds on hand.
● The forced deleveraging of the banking system will be focused on the housing system.
22
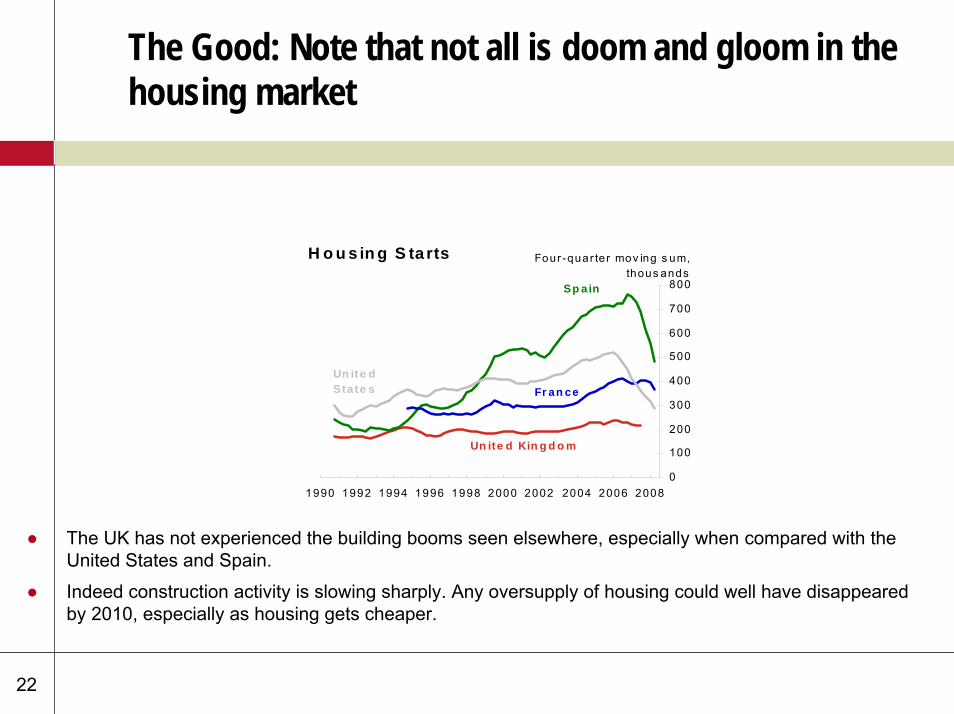
The Good: Note that not all is doom and gloom in the housing market
0
100
200
300
400
500
600
700
800
1990 1992 1994 1996 1998 2000 2002 2004 2006 2008
H o u s in g S ta rts Four -quar ter mov ing s um,thous ands
Fr an ce
Sp ain
Un ite d State s
Un ite d Kin g d o m
● The UK has not experienced the building booms seen elsewhere, especially when compared with the United States and Spain.
● Indeed construction activity is slowing sharply. Any oversupply of housing could well have disappeared by 2010, especially as housing gets cheaper.
23
Conclusions: Global
• Despite the global credit crunch, the global economy looks to be in reasonable shapewith growth this year and next just below historical averages..
• We are now at the ‘end of the beginning’ of the credit crunch. The financial sector will not return to its pre-2007 shape. There will be fewer banks and less credit product. Indeed, the entire sector is likely to contract.
• Governments are now actively pursuing a battery of responses to aid the banking system. The public sector will recapitalise the banking system. The ‘big’ idea for reducing interbank rates looks to be government guarantees. A battery of policy measures by the Fed alongside deep cuts in interest rates means the US economy seems to have avoided the worst-case scenarios. But we still expect a protracted recession.
• Main risk now is that emerging markets start to get infected by the credit crunch as capital flees back to the G7, removing the main hope of navigating through the turmoil in relative safety.
24
Conclusions: UK
• In the UK the household sector is under considerable stress and a sharp retrenchment looks likely. Consumer spending will fall sharply as household budgets fall and debt is repaid.
• The economy will enter a technical recession by the end of this year. However, it should prove less deep than previous episodes.
• We still see a very large adjustment in property prices as we have seen in every other recession. With inflation lower, the fall in nominal house prices will have to be even larger and a fall in nominal terms of 25% to 30% is possible.
• Easing inflation will provide scope for BoE rate cuts (to 3.5% by February). Money market spreads could ease back by the end of March 2009.
• But Government spending and investment will support some businesses, especially those in infrastructure.
• And corporate balance sheets are in good shape. Most will be able to wait out the recession. Some will benefit from falling asset prices.
• Net exports are also likely to provide a lift, especially if sterling falls back against the US dollar and any contagion of the credit crunch to emerging markets is contained.
• By 2010 growth will get back to trend.
25
Attracting Bank Support
26
Identify your market + potential viability
• No MARKET No BUSINESS
• ‘fag packet’ budget - does it work?
• Personal gut reaction – do you honestly think it will work
• 2 pages A4 should be enough to outline the proposed business
• Hold initial discussions with your professional advisors – including the bank!
27
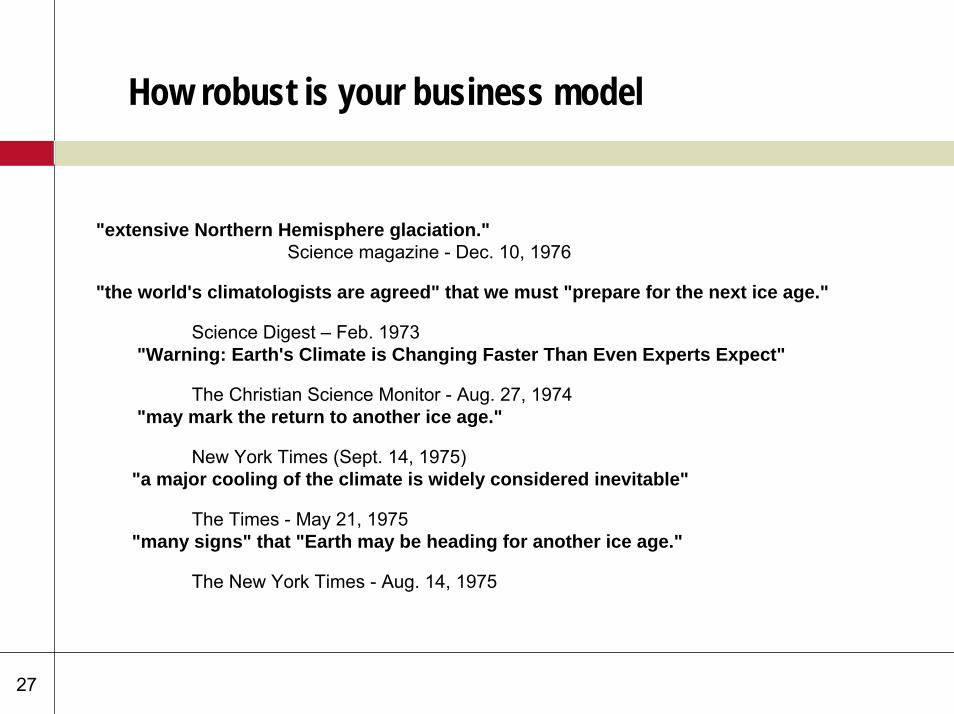
How robust is your business model
"extensive Northern Hemisphere glaciation."Science magazine - Dec. 10, 1976
"the world's climatologists are agreed" that we must "prepare for the next ice age."
Science Digest – Feb. 1973"Warning: Earth's Climate is Changing Faster Than Even Experts Expect"
The Christian Science Monitor - Aug. 27, 1974"may mark the return to another ice age."
New York Times (Sept. 14, 1975)"a major cooling of the climate is widely considered inevitable"
The Times - May 21, 1975 "many signs" that "Earth may be heading for another ice age."
The New York Times - Aug. 14, 1975

28
29
Supply and Demand
• How secure is your source + supply of ingredients
• Do you have a long term contract
• Length of contract will be in a factor in the term of bank support
• Where will the digestate go?
30
Detailed Businessplan
• Background – how have you got here?
• Management Experience
• Market
• Technology
• Costings - architect/QS supported for large build projects
• Capital contribution
• Viability
• Funding - structure between short term and long term debt
• Grant support
• ROC’s
31
Bank Analysis of Lending request
• Who are we lending to - Ltd Company? Partnership? Sole Trader?
• Primary Exit - cash generation
• Secondary Exit - security
32
Primary Exit
• Cash generation not purely profit is key
• The stronger the cash generation the less security the bank is likely to require
• Detailed budgets + cashflows required
• Conduct sensitivity analysis eg revenue down 10%, costs up 10%
• Calculate interest cover - minimum 150%
• Debt Service Cover – minimum 125%
33
Secondary Exit
• What security is available
• Freehold deeds?
• Personal guarantee’s will always be required if lending to a limited company
• Bank will usually need a professional valuation - maximum Loan to Value is usually 70%
34
Different Types of Funding
• Overdraft
• Term loan - consider interest rate hedging
• Asset Finance
• Invoice Discounting
• Project Finance
35
Clydesdale approach
• Creating Specialist Team for the Sector
• View the sector as having strong growth potential
• Connectivity
36
In Summary
• Identify and research your market
• Initial ‘fag packet’ assessment of viability
• Can you get security of supply?
• Discuss with your professional team at an early stage before incurring too many costs
• Go and discuss with Clydesdale!
• Once everyone ‘on board’ prepare detailed businessplan
37
Disclaimer
IMPORTANT NOTICE: So far as the law and the Financial Services Authority Rules allow, National Australia Bank Ltd ("the Bank") disclaims any warranty or representation as to the accuracy or reliability of the information and statements in this Document. The Bank will not be liable (whether in negligence or otherwise) for any loss or damage suffered from relying on this Document. This Document does not purport to contain all relevant information. Recipients should not rely on its contents but should make their own assessment and seek professional advice relevant to their circumstances. The Bank may have proprietary positions in the products described in this Document. This Document is for information purposes only, is not intended as an offer or solicitation, nor is it the intention of the Bank to create legal relations on the basis of the information contained in it. No part of this Document may be reproduced without the prior permission of the Bank. This Document is intended for Investment Professionals (as such term is defined in The Financial Services and Markets Act 2000 (Financial Promotion) Order 2001) and should not be passed to any other person who would be defined as a private customer by the rules of the Financial Services Authority ("FSA") in the UK, or to any person who may not have experience of such matters. Issued by National Australia Bank Limited A.B.N. 12 004 044 937, 88 Wood Street, London EC2V 7QQ. Registered in England BR1924. Head Office: 500 Bourke Street, Melbourne, Victoria. Incorporated with limited liability in the State of Victoria, Australia. Authorised and regulated by the Financial Services Authority in the UK.