anaerobic co-digestion of solid slaughterhouse wastes with agro-residues: synergistic and...
TRANSCRIPT
Chemical Engineering Journal 245 (2014) 89–98
Contents lists available at ScienceDirect
Chemical Engineering Journal
journal homepage: www.elsevier .com/locate /cej
Anaerobic co-digestion of solid slaughterhouse wastes withagro-residues: Synergistic and antagonistic interactions determinedin batch digestion assays
http://dx.doi.org/10.1016/j.cej.2014.02.0081385-8947/� 2014 Elsevier B.V. All rights reserved.
⇑ Corresponding author at: School of Engineering, University of Borås, SE 501 90Borås, Sweden. Tel.: +53 537 266 3398; fax: +53 537 267 2964.
E-mail addresses: [email protected], [email protected](J. Pagés-Díaz).
Jhosané Pagés-Díaz a,b,⇑, Ileana Pereda-Reyes a, Mohammad J. Taherzadeh b, Ilona Sárvári-Horváth b,Magnus Lundin b
a Centro de Estudio de Ingeniería de Procesos (CIPRO), Instituto Superior Politécnico José Antonio Echeverría (Cujae), 119 #11901 e/ Rotonda y Ciclovía, Marianao, Habana, Cubab Swedish Center of Resource Recovery, University of Borås, SE 501 90 Borås, Sweden
h i g h l i g h t s
� Batch co-digestion of slaughterhouse wastes with three other residues was investigated.� A four factor mixture design was used to find optimal mixture composition.� Certain mixture ratios performed better due to significant synergistic effects.� Equal amounts of SB:M:VC:MSW produced 31% more methane than expected.� It was possible to correlate biological behavior and statistical results.
a r t i c l e i n f o
Article history:Received 4 September 2013Received in revised form 22 January 2014Accepted 2 February 2014Available online 12 February 2014
Keywords:Anaerobic co-digestionAgro-industrial solid wastesMixture experimental designSlaughterhouse wastes
a b s t r a c t
Different mixture ratios of solid cattle slaughterhouse wastes (SB), manure (M), various crops (VC), andmunicipal solid wastes (MSW) were investigated for biogas production. The objective was to explore pos-sible significant synergistic effects obtained from the combination of these different substrates. The per-formance of the process was assessed in thermophilic anaerobic batch co-digestion assays, using a fourfactor mixture design and methane yield (YCH4) and specific methane production rate (rsCH4) as responsevariables.
The highest methane yield, 655 NmL CH4/g VS was obtained when equal parts (ww) of SB, M, VC, andMSW were combined, while the combination of SB, M, and MSW resulted in the highest specific methaneproduction rate (43 NmL CH4/g VS/d). A mixture design model was fitted to data in order to appraise syn-ergistic and antagonistic interactions. Mixing all four substrates resulted in a 31% increase of the expectedyield which was calculated from the methane potential of the individual fractions, clearly demonstratinga synergistic effect due to more balanced nutrient composition enhancing the anaerobic digestion pro-cess. However, no significant antagonistic effects were observed. In order to maximize both responsevariables simultaneously, a response surface method was employed to establish the optimal combinationof substrate mixtures. The statistical results and analysis of the biological process gave a coherent pictureof the results.
� 2014 Elsevier B.V. All rights reserved.
1. Introduction
Due to the growing demand of meat in the world, the amount oforganic solid wastes from meat producing industries is increasingevery day. Approximately, between 20% and 50% of the weight of
the animal is not suitable for human consumption [1] and accord-ing to the Food and Agriculture Organization of the United Nations(FAO), the bovine meat production reached 65 million tons duringthe year 2011 [2]. Organic solid wastes from meat producingindustries as well as from agricultural activities are consideredsuitable substrates for biogas production via anaerobic digestion(AD).
Because of their high content of fat and protein, slaughterhousewastes are attractive substrates for biogas production, holding highmethane yield potential. However, the process is sensitive and
90 J. Pagés-Díaz et al. / Chemical Engineering Journal 245 (2014) 89–98
prone to failure [3,4]. Degradation of long chain fatty acids (LCFA)has proved to be the limiting step in the hydrolysis process, andtheir accumulation results in toxicity problems for acetogenic bac-teria and methanogenic archaea [5,6]. Moreover, the residues oftenhave low alkalinity [7], and are inclined to form floating scum dur-ing the digestion process [8]. Co-digestion of slaughterhousewastes with other residues from agro-industrial activities has beenproposed as a solution to these problems. The co-digestion processfacilitates acquiring a better nutritional balance, and decreases theprobability of ammonia and lipids inhibiting the process. Further-more, the coexistence of different types of residues in the samegeographic area enables integrated management, offering consid-erable environmental benefits, e.g. energy savings, recycling ofnutrients within agriculture, and reduction of CO2 emissions [9].Another advantage is that, due to their different characteristics,co-digestion of these residues may enhance the performance ofthe anaerobic digestion process.
Several combinations of wastes are viable for co-digestion ofslaughterhouse wastes. Slaughterhouse wastes (mainly poultryand pig) have previously been co-digested with the organic frac-tion of municipal solid waste [8], fruit and vegetables wastes[10,11], pig manure [11], food wastes [12], and sewage sludge[13,14]. Synergistic effects occurring in the co-digestion process in-crease the gas yield from the substrates [15]. Pagés-Díaz et al. [16]studied co-digestion of solid cattle slaughterhouse wastes with dif-ferent agricultural residues, and reported up to 43% higher meth-ane yields than the expected methane yields of differentmixtures, which were attributed to synergistic effects because ofbetter nutritional balance for the microorganisms.
In most of these studies the co-digestion process involved twoor three components, and the mixture composition was randomlyselected. The composition of substrate determines the efficacy ofthe microbiological population [17], which in turn largely influ-ences the biogas yield, the long term process stability, and the deg-radation rate of the solids.
Mixture experimental design is a useful technique to evaluatethe interaction between the components of a blend, for maximiz-ing the response. The design permits not only a determination ofthe linear blending parameter of each substrate, but also the sec-ond and third order of synergistic or antagonistic effects amongthe substrates. The independent factors are proportions of differentcomponents of a blend, and the principal goal of the design is tomodel the blending surface in order to predict the response ofany mixture or combination of components [18].
Two recent studies were found applying an experimental designfor evaluating the mixture ratios for co-digestion processes [19][20]. Rao and Baral [19] investigated the co-digestion of sewagesludge with cow dung and garden wastes, or with cow dung andfruit juice wastewater, while Wang et al. [20] performedco-digestion of a mixture of animal manures (dairy, chicken andswine) with rice straw. In these studies at maximum of threecomponents were asses in the batch assays and no deeper explana-tion was undertaken to fully understand the synergistic effects inmixed substrates.
Biogas plants utilizing slaughterhouse waste are operating to-day below their full capacity [21]. Hence there is a need to improvethe performance of these digesters. However, more information isrequired about how complex substrates perform together withslaughterhouse waste during co-digestion to achieve this goal. Itis evidently necessary to assess the performance of theco-digestion process by an experimental evaluation, using a fourfactor mixture design to estimate a mathematical model and anexplanation of the results in terms of biological process. Hence,the strategy in the present study was to apply a four factor mixturedesign for the evaluation of all two and three factor synergistic andantagonistic interactions in the co-digestion process, and to discuss
the biological influence of different substrate compositions on theanaerobic co-digestion of solid cattle slaughterhouse wastes mixedwith three different residues from agricultural activities.
2. Materials and methods
2.1. Raw materials
Four different raw materials, solid cattle slaughterhouse wastes(SB), manure (M), various crops (VC), and the organic fraction ofmunicipal solid waste (MSW) were used for the anaerobic co-digestion experiments. SB (i.e.: cow rumen, blood, and gut fill com-ponents) was provided by a biogas plant in Kristianstad (Sweden).A mixture of 50% ww pig manure, 25% ww horse manure and25% ww cow manure (all obtained from a farm outside Borås, Swe-den) was prepared and subsequently used as a fraction of manure.The composition of the manure fraction was determined based onthe data from four different slaughterhouse enterprises in Cubataking into account the amount of different kinds manure gener-ated by the animals found at the farms nearby. The various cropsubstrates were prepared by mixing 70% ww of green fruit andvegetables residues with 30% ww of straw. Similarly, this composi-tion was determined by considering that it is always less amountof straw available, then green fruit and vegetable waste remainingafter the harvest in Cuba. Municipal solid waste was obtained froma large-scale biogas plant (Borås Energy & Environment AB, Borås,Sweden). Every individual fraction was cut and minced using anelectric blender (Blender HGB55E, Commercial Torrington, USA).These four substrate fractions were then used for the preparationof the different mixtures (Mi). After that the prepared mixtureswere stored at �18 �C until further investigation.
2.2. Experimental design
The experimental design of the present study comprised a four-factor simplex-centroid mixture design, consisting of pure frac-tions and mixtures of two, three, and four components at wetweight ratios (% ww) according to Table 1. The design experimentswere replicated three times. Response variables were methaneyield (YCH4) and specific methane production rate (rsCH4). This de-sign allows estimation of a cubic polynomial model, where first or-der coefficients measure the relative effect of pure substrates,while quadratic and cubic terms measure the synergistic or antag-onistic interactions between the fractions.
A linear mixing model without any synergistic or antagonisticinteractions may be expected to produce a methane yield propor-tional to the amount of VS (volatile solids) supplied by the individ-ual fractions. The experimental results were accordingly analyzedby fitting a model that expresses the responses as functions ofthe VS content of the components in the respective mixtures. Thefractions were thus characterized as the VS content in relation tothe resulting contribution% VS of total VS in the calculated mix-tures (Table 1).
2.3. Anaerobic batch digestion assays
The anaerobic batch experiment was performed in accordancewith a method described by Hansen et al. [22]. The assays werecarried out under thermophilic conditions (55 �C ± 1 �C) for70 days, using 2 L glass bottles as reactors. A large-scale biogasplant, operating at thermophilic conditions (Borås Energi & MiljöAB, Borås, Sweden), provided an inoculum holding a content of3.8% TS (total solids) and 2.1% VS. To remove large and undigestedparticles the inoculum was filtered through a 2 mm porosity sieve,after which it was allowed to stabilize stored in an incubator at
Table 1Mixture compositions, following simplex centroid design, and the experimental setups for the batch co-digestion assays.
Mixtures Substratea (g) Mixing ratios
SB M VC MSW
% of wwtotal % of VStotal % of wwtotal % of VStotal % of wwtotal % of VStotal % of wwtotal % of VStotal
M1 17 100 100 0 0 0 0 0 0M2 30 0 0 100 100 0 0 0 0M3 19 0 0 0 0 100 100 0 0M4 27 0 0 0 0 0 0 100 100M5 20 50 64 50 36 0 0 0 0M8 18 50 53 0 0 50 47 0 0M10 21 50 62 0 0 0 0 50 38M6 22 0 0 50 39 50 61 0 0M9 25 0 0 50 48 0 0 50 52M7 23 0 0 0 0 50 58 50 42M11 20 33.3 41 33.3 23 33.3 36 0 0M14 22 33.3 45 33.3 26 0 0 33.3 29M13 21 33.3 40 0 0 33.3 35 33.3 25M12 23 0 0 33.3 27 33.3 43 33.3 30M15 21 25 32 25 18 25 29 25 21
% of wwtotal: shows how much percentage each individual fraction counts up within the wet weight (ww) of the mixture, Mi.% of VStotal: shows how much percentage each individual fraction counts up within the volatile solid (VS) content of the mixture, Mi.
a Amounts of individual substrate mixture added in each batch.
J. Pagés-Díaz et al. / Chemical Engineering Journal 245 (2014) 89–98 91
55 �C for three days. Each bottle was fed with an appropriateamount of a substrate mixture (Mi) and 400 mL inoculum, keepinga VS ratio (VSsubstrate to VSinoculum) at 1:2 in all setups. In order toreproduce the real conditions in a full scale plant no micro andmacronutrients were added. Blank experiments, containing400 mL inoculum, disclosed any methane production of the inocu-lum itself. Furthermore, control assays were also performed withpure cellulose (Cellulose Fibrous Long, Sigma Aldrich, Germany)as substrate to ensure the quality of the inoculum. The bottles weresubsequently sealed with rubber septa and aluminum caps (Apo-dan Nordic, Copenhagen, Denmark). The reactors were flushedwith a gas mixture comprising 80% N2 and 20% CO2 for 3 min,ensuring anaerobic conditions. Each experimental setup was pre-pared in triplicate. The bottles were shaken once a day duringthe incubation period of 70 days.
Gas was regularly sampled from the headspaces of each bottle,using a 250 lL pressure-tight syringe (VICI, Precision SamplingInc., Baton Rouge, LA, USA), and the samples were immediatelyanalyzed by gas chromatography. To avoid build-up of high pres-sure in the reactors, excess gas was released after each analysisthrough a needle (Sterican
�Ø0.4 � 20 mm, B. Braun, Germany),
after which the gas analysis was repeated. Assuming ideal gas mix-tures and using the ideal gas law, the methane content in the headspace can be calculated using the data from the GC measurementsand without measuring the actual pressure in the bottles [22]. Theamount of CH4 produced between two subsequent sampling in thehead space of each flask was calculated as described previously byTeghammar et al. [23]. A gas with known composition was used asstandard in each measurement occasion.
As response variables, methane yield (YCH4) and specific meth-ane production rate (rsCH4) were used in order to evaluate the per-formance of the anaerobic co-digestion process. Both responseswere determined using the methods published previously byPagés-Díaz et al. [24]. Furthermore, the time (tGrenz) during whichmethane production of two consecutive points differed less than1% was also calculated [24].
2.4. Analytical methods
Total solids (TS) and volatile solids (VS) were analyzed in accor-dance with Sluiter et al. [25]. TS were determined after heating at105 �C to a constant weight, and VS by incinerating the dried
samples for 4 h in a muffle furnace at 575 �C. The pH of the solidmaterials was, in accordance with the VDI 4630 guidelines, ana-lyzed by LUFA Bd. III 8.1 [26]. Total Kjeldahl nitrogen (TKN) wasmeasured by the semi-micro-Kjeldahl method, following a Swed-ish standard method, SS-EN 25663/NMKL 6-3 [27]. Total proteincontent was calculated from the TKN content, using a conversionfactor of 6.25 (for meat) in accordance with Gunaseelan [28].Ammonium nitrogen NHþ4 —N
� �was determined with a Swedish
standard method, SIS 028131-1 [29], and the amount of organicnitrogen was estimated by calculating the difference betweenTKN and NHþ4 —N. Lipid quantity was measured by the methodNMKL 131 [30], and the remaining organic content was assumedto be carbohydrates.
The composition of the produced biogas was determined by gaschromatography. The gas chromatograph (Auto System PerkinElmer, USA) was equipped with a packed column (Perkin Elmer,6’ � 1.800 OD, 80/100, Mesh, USA) and a thermal conductivitydetector (Perkin Elmer, USA). An inject temperature of 150 �Cwas applied, and the carrier gas was nitrogen operated with a flowrate of 20 mL/min at 75 �C. Data were processed assuming the idealgas law in accordance with Hansen et al. [22]. All methane volumesare presented at normal conditions (0 �C, 101.325 kPa) according toISO 10780 [31].
2.5. Statistical analyses
The effect of quaternary mixture compositions of SB, M, VC, andMSW substrates on methane yields (YCH4) and on specific methaneproduction rates (rsCH4) was investigated by means of a simplexcentroid design. The combinations chosen were the pure blend,binary blends, tertiary blends and the overall centroid. The designhas 2q�1 points, where q = 4 represents the numbers of compo-nents in the system and xi represents the proportion of ith constit-uent in the mixture. The proportion of each component variedbetween 0 and 1 according to Eq. (1):
X4
i¼1
xi ¼ x1 þ x2 þ x3 þ x4 ¼ 1; 0 � xi � 1 ð1Þ
The experimental mixture ratios for a quaternary system arelisted in Table 1. The setup of the experimental design was basedon wet weight proportions. However, in order to be able to
92 J. Pagés-Díaz et al. / Chemical Engineering Journal 245 (2014) 89–98
interpret the high order terms as synergistic/antagonistic effectsthe model was analyzed with mixtures expressed in terms of vol-atile solid ratios within the mixtures (Table 1).
In order to predict the response variable Y as a function of thefour components, polynomial models were employed to link theresponse with the composition of the mixture. A special cubicmodel with 14 coefficients was used for the 4-component mixturedesign:
Y ¼X
1�i�4
bixi þX
1�i�j�4
bixixj þX
1�i<j<k�4
bixixjxk ð2Þ
The first sum represents the estimated linear mixing; the qua-dratic part with coefficients bij represents the synergistic or antag-onistic blending effects between components pairs, and the cubicpart denotes the three component interactions.
All three models (linear, quadratic, and cubic) were fitted foreach response variable by means of regression methods, and ana-lyzed with ANOVA. The significance of the regression models wasevaluated at 5% significance level (p-Values 6 0.05), and pooledstandard deviations were used to assess the size of experimentalerrors. The hypothesis that the selected model is adequate to de-scribe the experimental data (p-Values P 0.05) was verified bythe lack of fit test. MINITAB
�Release 14.12.0 software package
(Minitab Inc., State College, PA, USA) was used for the analyses ofthe results.
3. Results and discussion
3.1. Mixture characterization
The main characteristics of individual substrates and mixturesare summarized in Table 2. The investigated slaughterhouse andagro-industrial wastes mixtures are substrates with high organicmatter content showing similar characteristics as in previous re-ports [8,10,32,33].
SB showed the highest lipid and protein content (175 g/kgFM
and 130 g/kgFM, respectively) among the substrates examined inthe present investigation, making it an attractive substrate for bio-gas production. Nevertheless, as reported by other studies[8,10,12], the high amounts of lipids and proteins in slaughter-house waste may cause inhibition. Consequently, this waste isnot optimal to use alone as substrate for biogas production [17].High lipid content may result in slower methane production andlower hydrolysis rate [34]. The other individual substrates studied(M2, M3 and M4) had lower proportions of lipids and proteins, buthigher contents of carbohydrates (77–287 g/kgFM). Hence, co-digestion of these substrates with slaughterhouse wastes would,thanks to complementary characteristics, lead to a better, balancedcomposition.
The organic nitrogen content of SB was high (20 g N/kgFM) incomparison with the rest of the individual fractions (3–4 g N/kgFM).However, the TKN (0.16–0.89 g N/L) which corresponds to bothinorganic and organic nitrogen together, did not, in any of the reac-tors, reach the inhibitory level of 4 g/L reported for ammonia nitro-gen alone by Angelidaki and Ahring [35] who determined thisvalue under similar conditions as those used in the present study,i.e. 55 �C and pH around 8.
3.2. Model fitting and regression analysis
A quaternary mixture of different agro-residuals, such as SB, M,VC and MSW were (as described above) subjected to anaerobic co-digestion. Table 3 summarizes predicted as well as experimentalvalues obtained in terms of YCH4 and rsCH4. Linear, quadratic andspecial cubic models were used to obtain least square fits of both
response variables and Table 4 shows the results of the analysisof variance (ANOVA) and regression significance of the models, dis-playing the sum of squares attributable to both model and error.
The special cubic model proved to be the best suited for both re-sponse variables (Table 4). The p-Values for YCH4 as well as rsCH4
were higher than 0.05 (0.4197 and 0.9836, respectively) in the lackof fit test for this model. Estimated regression coefficients, stan-dard errors, and p-values for the special cubic model are listed inTable 5.
The significance of regression coefficients verified that coeffi-cients corresponding to M5, M10, M11, M12, and M13 had signif-icant effects on methane yield, while coefficients corresponding toM5, M10, M6, and M12 had significant effects on specific methaneproduction rate (Table 5). The fitted models for the response vari-ables can be expressed by Eqs. (3) and (4) below:
bY CH4 ¼ 608xSB þ 384xM þ 422xVC þ 534xMSW þ 379xSBxM
þ 296xSBxMSW þ 3380xSBxMxVC þ 2588xSBxVCxMSW
þ 2045xMxVCxMSW ð3Þ
brsCH4 ¼ 13xSB þ 30xM þ 37xVC þ 45xMSW þ 76xSBxM
þ 54xSBxMSW � 41xMxVC þ 471xMxVCxMSW ð4Þ
3.3. Analyses of response variables
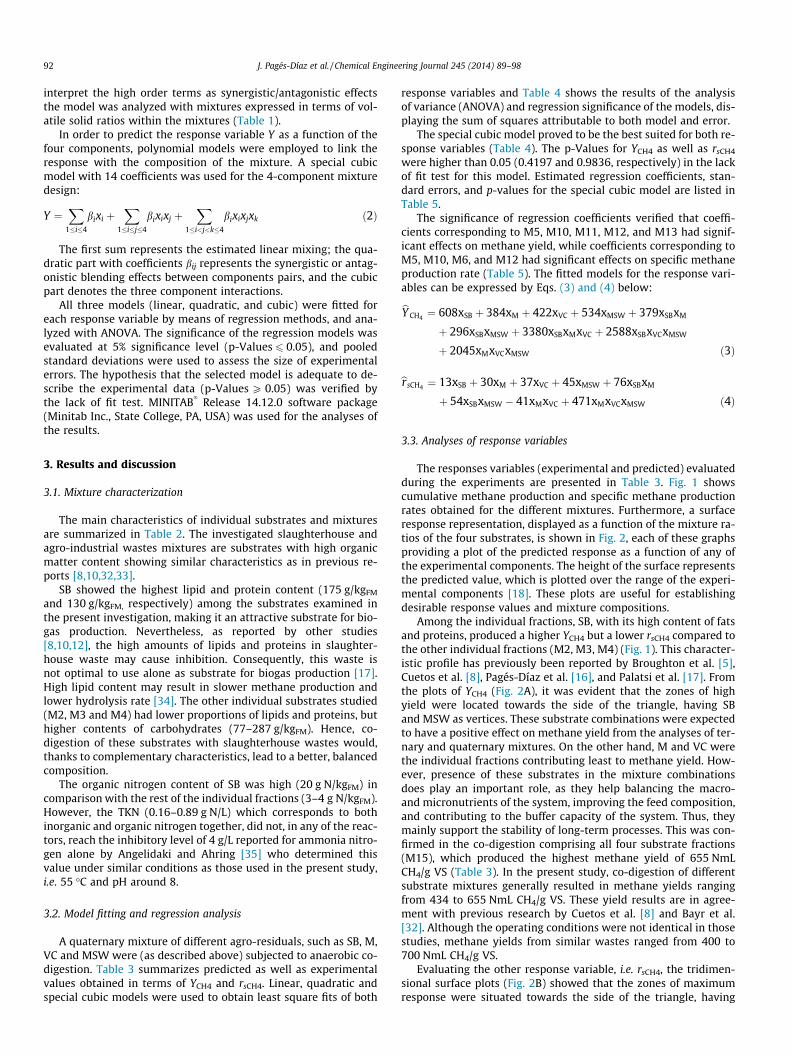
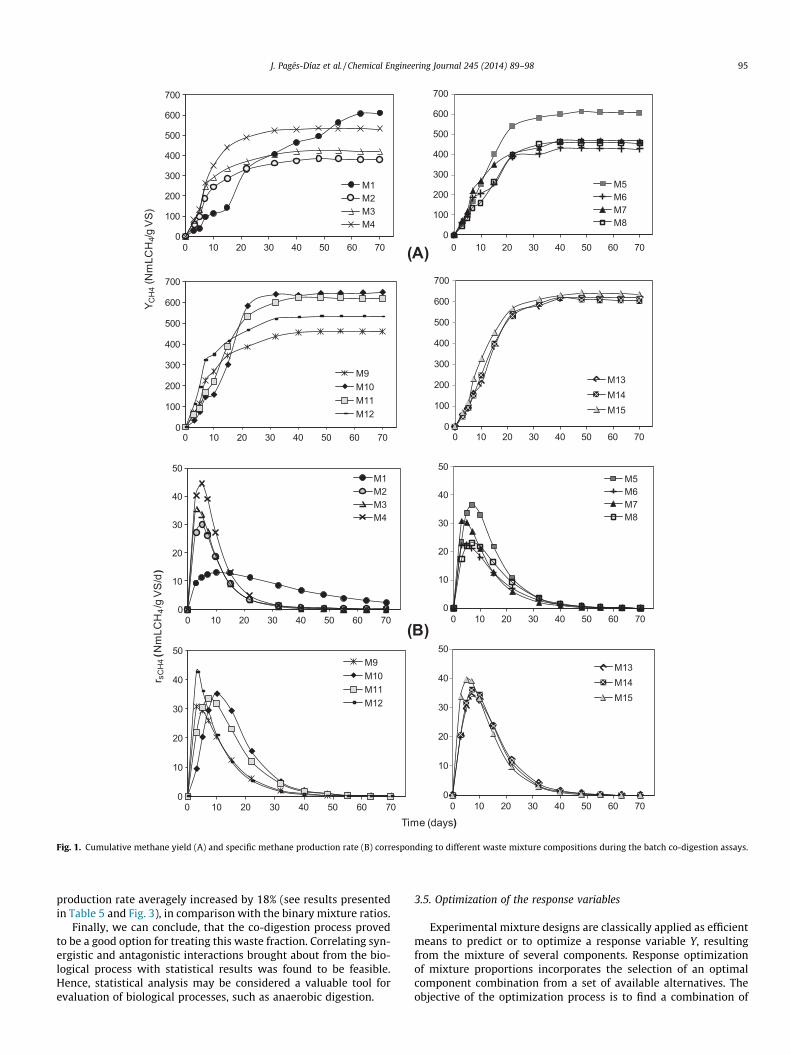
The responses variables (experimental and predicted) evaluatedduring the experiments are presented in Table 3. Fig. 1 showscumulative methane production and specific methane productionrates obtained for the different mixtures. Furthermore, a surfaceresponse representation, displayed as a function of the mixture ra-tios of the four substrates, is shown in Fig. 2, each of these graphsproviding a plot of the predicted response as a function of any ofthe experimental components. The height of the surface representsthe predicted value, which is plotted over the range of the experi-mental components [18]. These plots are useful for establishingdesirable response values and mixture compositions.
Among the individual fractions, SB, with its high content of fatsand proteins, produced a higher YCH4 but a lower rsCH4 compared tothe other individual fractions (M2, M3, M4) (Fig. 1). This character-istic profile has previously been reported by Broughton et al. [5],Cuetos et al. [8], Pagés-Díaz et al. [16], and Palatsi et al. [17]. Fromthe plots of YCH4 (Fig. 2A), it was evident that the zones of highyield were located towards the side of the triangle, having SBand MSW as vertices. These substrate combinations were expectedto have a positive effect on methane yield from the analyses of ter-nary and quaternary mixtures. On the other hand, M and VC werethe individual fractions contributing least to methane yield. How-ever, presence of these substrates in the mixture combinationsdoes play an important role, as they help balancing the macro-and micronutrients of the system, improving the feed composition,and contributing to the buffer capacity of the system. Thus, theymainly support the stability of long-term processes. This was con-firmed in the co-digestion comprising all four substrate fractions(M15), which produced the highest methane yield of 655 NmLCH4/g VS (Table 3). In the present study, co-digestion of differentsubstrate mixtures generally resulted in methane yields rangingfrom 434 to 655 NmL CH4/g VS. These yield results are in agree-ment with previous research by Cuetos et al. [8] and Bayr et al.[32]. Although the operating conditions were not identical in thosestudies, methane yields from similar wastes ranged from 400 to700 NmL CH4/g VS.
Evaluating the other response variable, i.e. rsCH4, the tridimen-sional surface plots (Fig. 2B) showed that the zones of maximumresponse were situated towards the side of the triangle, having
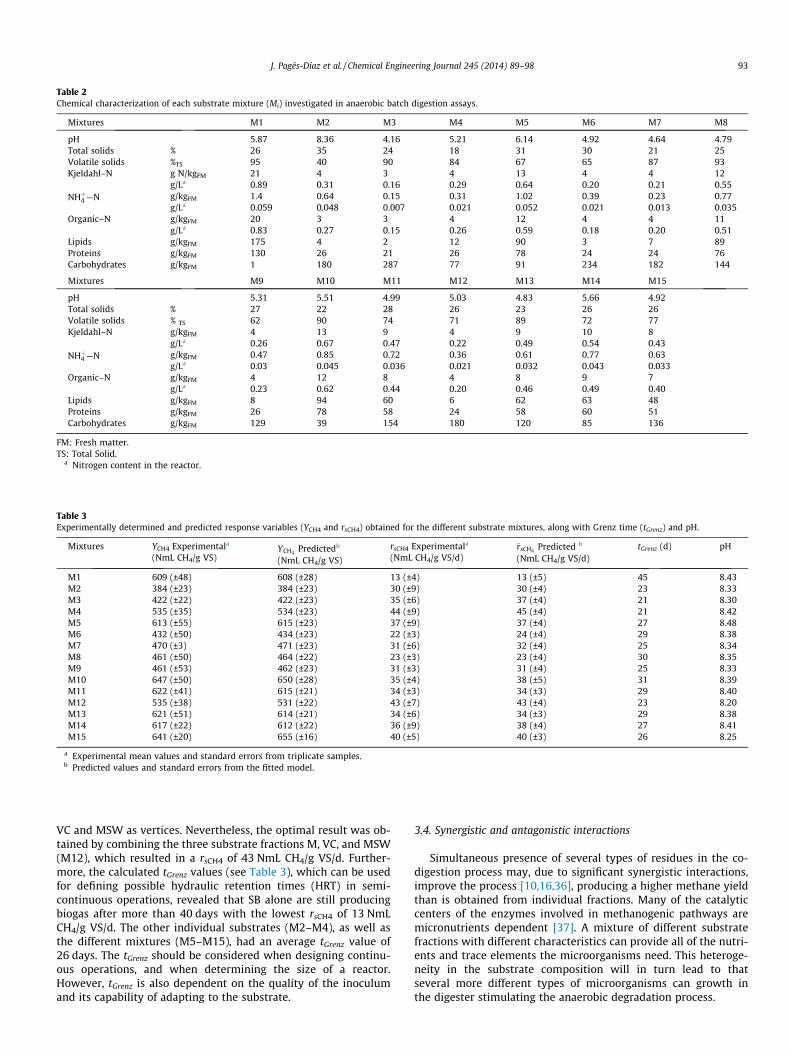
Table 2Chemical characterization of each substrate mixture (Mi) investigated in anaerobic batch digestion assays.
Mixtures M1 M2 M3 M4 M5 M6 M7 M8
pH 5.87 8.36 4.16 5.21 6.14 4.92 4.64 4.79Total solids % 26 35 24 18 31 30 21 25Volatile solids %TS 95 40 90 84 67 65 87 93Kjeldahl–N g N/kgFM 21 4 3 4 13 4 4 12
g/La 0.89 0.31 0.16 0.29 0.64 0.20 0.21 0.55NHþ4 —N g/kgFM 1.4 0.64 0.15 0.31 1.02 0.39 0.23 0.77
g/La 0.059 0.048 0.007 0.021 0.052 0.021 0.013 0.035Organic–N g/kgFM 20 3 3 4 12 4 4 11
g/La 0.83 0.27 0.15 0.26 0.59 0.18 0.20 0.51Lipids g/kgFM 175 4 2 12 90 3 7 89Proteins g/kgFM 130 26 21 26 78 24 24 76Carbohydrates g/kgFM 1 180 287 77 91 234 182 144
Mixtures M9 M10 M11 M12 M13 M14 M15
pH 5.31 5.51 4.99 5.03 4.83 5.66 4.92Total solids % 27 22 28 26 23 26 26Volatile solids % TS 62 90 74 71 89 72 77Kjeldahl–N g/kgFM 4 13 9 4 9 10 8
g/La 0.26 0.67 0.47 0.22 0.49 0.54 0.43NHþ4 —N g/kgFM 0.47 0.85 0.72 0.36 0.61 0.77 0.63
g/La 0.03 0.045 0.036 0.021 0.032 0.043 0.033Organic–N g/kgFM 4 12 8 4 8 9 7
g/La 0.23 0.62 0.44 0.20 0.46 0.49 0.40Lipids g/kgFM 8 94 60 6 62 63 48Proteins g/kgFM 26 78 58 24 58 60 51Carbohydrates g/kgFM 129 39 154 180 120 85 136
FM: Fresh matter.TS: Total Solid.
a Nitrogen content in the reactor.
Table 3Experimentally determined and predicted response variables (YCH4 and rsCH4) obtained for the different substrate mixtures, along with Grenz time (tGrenz) and pH.
Mixtures YCH4 Experimentala
(NmL CH4/g VS)YCH4 Predictedb
(NmL CH4/g VS)
rsCH4 Experimentala
(NmL CH4/g VS/d)r̂sCH4 Predicted b
(NmL CH4/g VS/d)tGrenz (d) pH
M1 609 (±48) 608 (±28) 13 (±4) 13 (±5) 45 8.43M2 384 (±23) 384 (±23) 30 (±9) 30 (±4) 23 8.33M3 422 (±22) 422 (±23) 35 (±6) 37 (±4) 21 8.30M4 535 (±35) 534 (±23) 44 (±9) 45 (±4) 21 8.42M5 613 (±55) 615 (±23) 37 (±9) 37 (±4) 27 8.48M6 432 (±50) 434 (±23) 22 (±3) 24 (±4) 29 8.38M7 470 (±3) 471 (±23) 31 (±6) 32 (±4) 25 8.34M8 461 (±50) 464 (±22) 23 (±3) 23 (±4) 30 8.35M9 461 (±53) 462 (±23) 31 (±3) 31 (±4) 25 8.33M10 647 (±50) 650 (±28) 35 (±4) 38 (±5) 31 8.39M11 622 (±41) 615 (±21) 34 (±3) 34 (±3) 29 8.40M12 535 (±38) 531 (±22) 43 (±7) 43 (±4) 23 8.20M13 621 (±51) 614 (±21) 34 (±6) 34 (±3) 29 8.38M14 617 (±22) 612 (±22) 36 (±9) 38 (±4) 27 8.41M15 641 (±20) 655 (±16) 40 (±5) 40 (±3) 26 8.25
a Experimental mean values and standard errors from triplicate samples.b Predicted values and standard errors from the fitted model.
J. Pagés-Díaz et al. / Chemical Engineering Journal 245 (2014) 89–98 93
VC and MSW as vertices. Nevertheless, the optimal result was ob-tained by combining the three substrate fractions M, VC, and MSW(M12), which resulted in a rsCH4 of 43 NmL CH4/g VS/d. Further-more, the calculated tGrenz values (see Table 3), which can be usedfor defining possible hydraulic retention times (HRT) in semi-continuous operations, revealed that SB alone are still producingbiogas after more than 40 days with the lowest rsCH4 of 13 NmLCH4/g VS/d. The other individual substrates (M2–M4), as well asthe different mixtures (M5–M15), had an average tGrenz value of26 days. The tGrenz should be considered when designing continu-ous operations, and when determining the size of a reactor.However, tGrenz is also dependent on the quality of the inoculumand its capability of adapting to the substrate.
3.4. Synergistic and antagonistic interactions
Simultaneous presence of several types of residues in the co-digestion process may, due to significant synergistic interactions,improve the process [10,16,36], producing a higher methane yieldthan is obtained from individual fractions. Many of the catalyticcenters of the enzymes involved in methanogenic pathways aremicronutrients dependent [37]. A mixture of different substratefractions with different characteristics can provide all of the nutri-ents and trace elements the microorganisms need. This heteroge-neity in the substrate composition will in turn lead to thatseveral more different types of microorganisms can growth inthe digester stimulating the anaerobic degradation process.
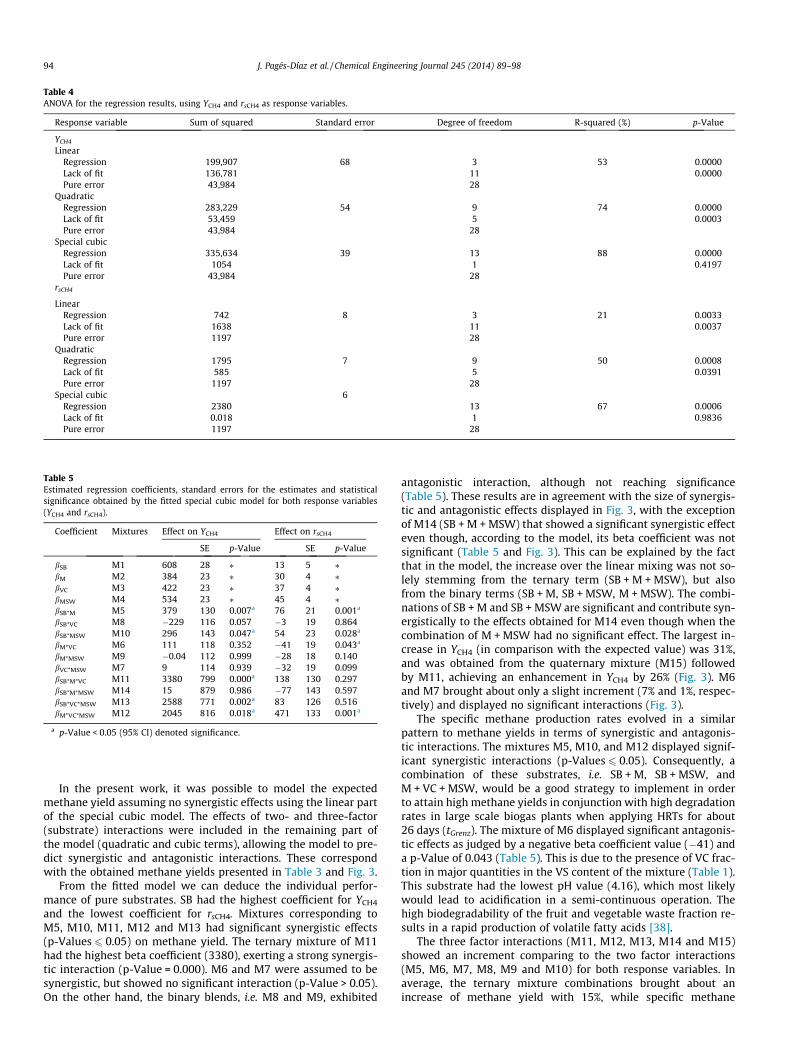
Table 4ANOVA for the regression results, using YCH4 and rsCH4 as response variables.
Response variable Sum of squared Standard error Degree of freedom R-squared (%) p-Value
YCH4
LinearRegression 199,907 68 3 53 0.0000Lack of fit 136,781 11 0.0000Pure error 43,984 28
QuadraticRegression 283,229 54 9 74 0.0000Lack of fit 53,459 5 0.0003Pure error 43,984 28
Special cubicRegression 335,634 39 13 88 0.0000Lack of fit 1054 1 0.4197Pure error 43,984 28
rsCH4
LinearRegression 742 8 3 21 0.0033Lack of fit 1638 11 0.0037Pure error 1197 28
QuadraticRegression 1795 7 9 50 0.0008Lack of fit 585 5 0.0391Pure error 1197 28
Special cubic 6Regression 2380 13 67 0.0006Lack of fit 0.018 1 0.9836Pure error 1197 28
Table 5Estimated regression coefficients, standard errors for the estimates and statisticalsignificance obtained by the fitted special cubic model for both response variables(YCH4 and rsCH4).
Coefficient Mixtures Effect on YCH4 Effect on rsCH4
SE p-Value SE p-Value
bSB M1 608 28 ⁄ 13 5 ⁄bM M2 384 23 ⁄ 30 4 ⁄bVC M3 422 23 ⁄ 37 4 ⁄bMSW M4 534 23 ⁄ 45 4 ⁄bSB*M M5 379 130 0.007a 76 21 0.001a
bSB*VC M8 �229 116 0.057 �3 19 0.864bSB*MSW M10 296 143 0.047a 54 23 0.028a
bM*VC M6 111 118 0.352 �41 19 0.043a
bM*MSW M9 �0.04 112 0.999 �28 18 0.140bVC*MSW M7 9 114 0.939 �32 19 0.099bSB*M*VC M11 3380 799 0.000a 138 130 0.297bSB*M*MSW M14 15 879 0.986 �77 143 0.597bSB*VC*MSW M13 2588 771 0.002a 83 126 0.516bM*VC*MSW M12 2045 816 0.018a 471 133 0.001a
a p-Value < 0.05 (95% CI) denoted significance.
94 J. Pagés-Díaz et al. / Chemical Engineering Journal 245 (2014) 89–98
In the present work, it was possible to model the expectedmethane yield assuming no synergistic effects using the linear partof the special cubic model. The effects of two- and three-factor(substrate) interactions were included in the remaining part ofthe model (quadratic and cubic terms), allowing the model to pre-dict synergistic and antagonistic interactions. These correspondwith the obtained methane yields presented in Table 3 and Fig. 3.
From the fitted model we can deduce the individual perfor-mance of pure substrates. SB had the highest coefficient for YCH4
and the lowest coefficient for rsCH4. Mixtures corresponding toM5, M10, M11, M12 and M13 had significant synergistic effects(p-Values 6 0.05) on methane yield. The ternary mixture of M11had the highest beta coefficient (3380), exerting a strong synergis-tic interaction (p-Value = 0.000). M6 and M7 were assumed to besynergistic, but showed no significant interaction (p-Value > 0.05).On the other hand, the binary blends, i.e. M8 and M9, exhibited
antagonistic interaction, although not reaching significance(Table 5). These results are in agreement with the size of synergis-tic and antagonistic effects displayed in Fig. 3, with the exceptionof M14 (SB + M + MSW) that showed a significant synergistic effecteven though, according to the model, its beta coefficient was notsignificant (Table 5 and Fig. 3). This can be explained by the factthat in the model, the increase over the linear mixing was not so-lely stemming from the ternary term (SB + M + MSW), but alsofrom the binary terms (SB + M, SB + MSW, M + MSW). The combi-nations of SB + M and SB + MSW are significant and contribute syn-ergistically to the effects obtained for M14 even though when thecombination of M + MSW had no significant effect. The largest in-crease in YCH4 (in comparison with the expected value) was 31%,and was obtained from the quaternary mixture (M15) followedby M11, achieving an enhancement in YCH4 by 26% (Fig. 3). M6and M7 brought about only a slight increment (7% and 1%, respec-tively) and displayed no significant interactions (Fig. 3).
The specific methane production rates evolved in a similarpattern to methane yields in terms of synergistic and antagonis-tic interactions. The mixtures M5, M10, and M12 displayed signif-icant synergistic interactions (p-Values 6 0.05). Consequently, acombination of these substrates, i.e. SB + M, SB + MSW, andM + VC + MSW, would be a good strategy to implement in orderto attain high methane yields in conjunction with high degradationrates in large scale biogas plants when applying HRTs for about26 days (tGrenz). The mixture of M6 displayed significant antagonis-tic effects as judged by a negative beta coefficient value (�41) anda p-Value of 0.043 (Table 5). This is due to the presence of VC frac-tion in major quantities in the VS content of the mixture (Table 1).This substrate had the lowest pH value (4.16), which most likelywould lead to acidification in a semi-continuous operation. Thehigh biodegradability of the fruit and vegetable waste fraction re-sults in a rapid production of volatile fatty acids [38].
The three factor interactions (M11, M12, M13, M14 and M15)showed an increment comparing to the two factor interactions(M5, M6, M7, M8, M9 and M10) for both response variables. Inaverage, the ternary mixture combinations brought about anincrease of methane yield with 15%, while specific methane
0
100
200
300
400
500
600
700
0 10 20 30 40 50 60 70
M5M6M7M8
0
100
200
300
400
500
600
700
0 10 20 30 40 50 60 70
M1M2M3M4
0
100
200
300
400
500
600
700
0 10 20 30 40 50 60 70
M9M10M11M12
0
100
200
300
400
500
600
700
0 10 20 30 40 50 60 70
M13M14M15
Y CH
4(N
mLC
H4/g
VS
)
0
10
20
30
40
50
0 10 20 30 40 50 60 70
M5M6M7M8
0
10
20
30
40
50
0 10 20 30 40 50 60 70
M1M2M3M4
0
10
20
30
40
50
0 10 20 30 40 50 60 70
M9M10M11M12
0
10
20
30
40
50
0 10 20 30 40 50 60 70
M13M14M15
r sC
H4(N
mLC
H4/g
VS
/d)
Time (days)
(A)
(B)
Fig. 1. Cumulative methane yield (A) and specific methane production rate (B) corresponding to different waste mixture compositions during the batch co-digestion assays.
J. Pagés-Díaz et al. / Chemical Engineering Journal 245 (2014) 89–98 95
production rate averagely increased by 18% (see results presentedin Table 5 and Fig. 3), in comparison with the binary mixture ratios.
Finally, we can conclude, that the co-digestion process provedto be a good option for treating this waste fraction. Correlating syn-ergistic and antagonistic interactions brought about from the bio-logical process with statistical results was found to be feasible.Hence, statistical analysis may be considered a valuable tool forevaluation of biological processes, such as anaerobic digestion.
3.5. Optimization of the response variables
Experimental mixture designs are classically applied as efficientmeans to predict or to optimize a response variable Y, resultingfrom the mixture of several components. Response optimizationof mixture proportions incorporates the selection of an optimalcomponent combination from a set of available alternatives. Theobjective of the optimization process is to find a combination of
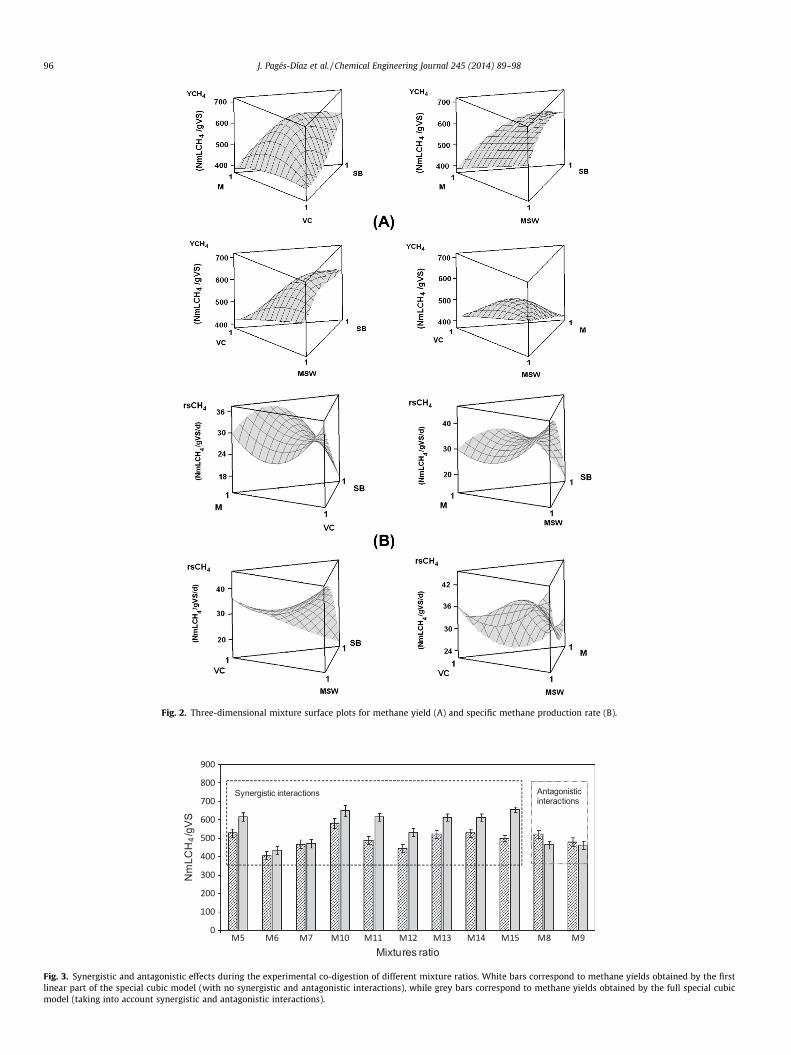
Fig. 2. Three-dimensional mixture surface plots for methane yield (A) and specific methane production rate (B).
Nm
LCH
4/g
VS
Mixtures ratio
Synergistic interactions Antagonistic interactions
Fig. 3. Synergistic and antagonistic effects during the experimental co-digestion of different mixture ratios. White bars correspond to methane yields obtained by the firstlinear part of the special cubic model (with no synergistic and antagonistic interactions), while grey bars correspond to methane yields obtained by the full special cubicmodel (taking into account synergistic and antagonistic interactions).
96 J. Pagés-Díaz et al. / Chemical Engineering Journal 245 (2014) 89–98
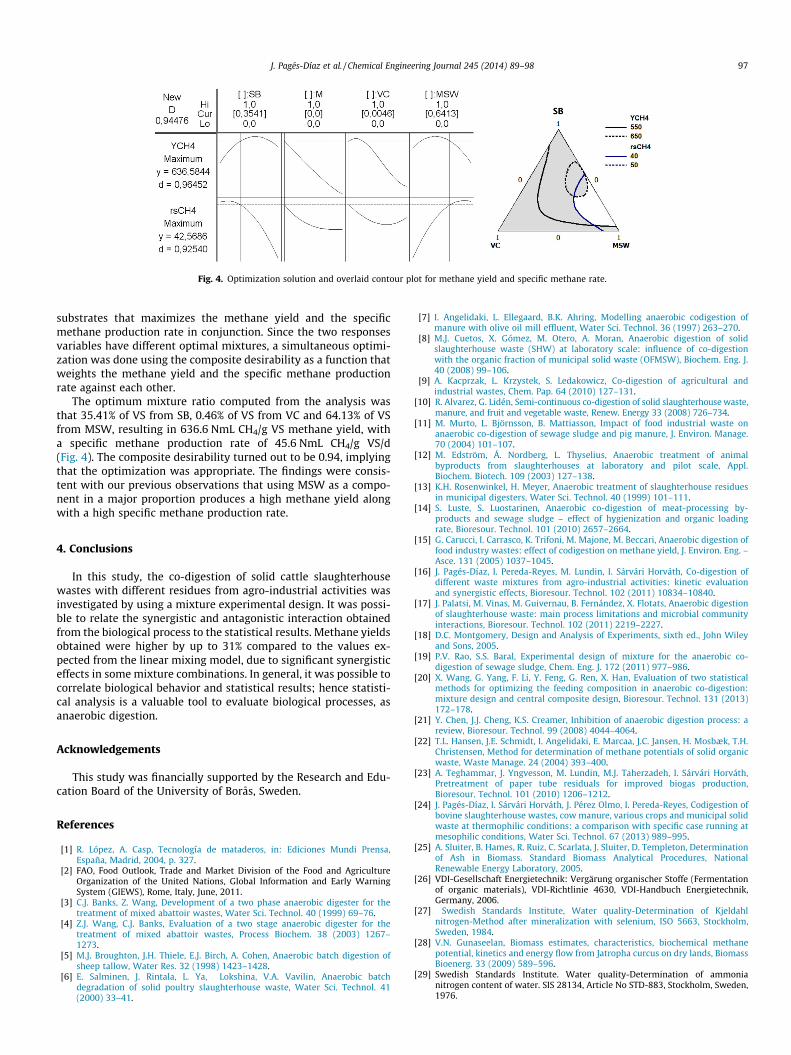
Fig. 4. Optimization solution and overlaid contour plot for methane yield and specific methane rate.
J. Pagés-Díaz et al. / Chemical Engineering Journal 245 (2014) 89–98 97
substrates that maximizes the methane yield and the specificmethane production rate in conjunction. Since the two responsesvariables have different optimal mixtures, a simultaneous optimi-zation was done using the composite desirability as a function thatweights the methane yield and the specific methane productionrate against each other.
The optimum mixture ratio computed from the analysis wasthat 35.41% of VS from SB, 0.46% of VS from VC and 64.13% of VSfrom MSW, resulting in 636.6 NmL CH4/g VS methane yield, witha specific methane production rate of 45.6 NmL CH4/g VS/d(Fig. 4). The composite desirability turned out to be 0.94, implyingthat the optimization was appropriate. The findings were consis-tent with our previous observations that using MSW as a compo-nent in a major proportion produces a high methane yield alongwith a high specific methane production rate.
4. Conclusions
In this study, the co-digestion of solid cattle slaughterhousewastes with different residues from agro-industrial activities wasinvestigated by using a mixture experimental design. It was possi-ble to relate the synergistic and antagonistic interaction obtainedfrom the biological process to the statistical results. Methane yieldsobtained were higher by up to 31% compared to the values ex-pected from the linear mixing model, due to significant synergisticeffects in some mixture combinations. In general, it was possible tocorrelate biological behavior and statistical results; hence statisti-cal analysis is a valuable tool to evaluate biological processes, asanaerobic digestion.
Acknowledgements
This study was financially supported by the Research and Edu-cation Board of the University of Borås, Sweden.
References
[1] R. López, A. Casp, Tecnología de mataderos, in: Ediciones Mundi Prensa,España, Madrid, 2004, p. 327.
[2] FAO, Food Outlook, Trade and Market Division of the Food and AgricultureOrganization of the United Nations, Global Information and Early WarningSystem (GIEWS), Rome, Italy, June, 2011.
[3] C.J. Banks, Z. Wang, Development of a two phase anaerobic digester for thetreatment of mixed abattoir wastes, Water Sci. Technol. 40 (1999) 69–76.
[4] Z.J. Wang, C.J. Banks, Evaluation of a two stage anaerobic digester for thetreatment of mixed abattoir wastes, Process Biochem. 38 (2003) 1267–1273.
[5] M.J. Broughton, J.H. Thiele, E.J. Birch, A. Cohen, Anaerobic batch digestion ofsheep tallow, Water Res. 32 (1998) 1423–1428.
[6] E. Salminen, J. Rintala, L. Ya, Lokshina, V.A. Vavilin, Anaerobic batchdegradation of solid poultry slaughterhouse waste, Water Sci. Technol. 41(2000) 33–41.
[7] I. Angelidaki, L. Ellegaard, B.K. Ahring, Modelling anaerobic codigestion ofmanure with olive oil mill effluent, Water Sci. Technol. 36 (1997) 263–270.
[8] M.J. Cuetos, X. Gómez, M. Otero, A. Moran, Anaerobic digestion of solidslaughterhouse waste (SHW) at laboratory scale: influence of co-digestionwith the organic fraction of municipal solid waste (OFMSW), Biochem. Eng. J.40 (2008) 99–106.
[9] A. Kacprzak, L. Krzystek, S. Ledakowicz, Co-digestion of agricultural andindustrial wastes, Chem. Pap. 64 (2010) 127–131.
[10] R. Alvarez, G. Lidén, Semi-continuous co-digestion of solid slaughterhouse waste,manure, and fruit and vegetable waste, Renew. Energy 33 (2008) 726–734.
[11] M. Murto, L. Björnsson, B. Mattiasson, Impact of food industrial waste onanaerobic co-digestion of sewage sludge and pig manure, J. Environ. Manage.70 (2004) 101–107.
[12] M. Edström, Å. Nordberg, L. Thyselius, Anaerobic treatment of animalbyproducts from slaughterhouses at laboratory and pilot scale, Appl.Biochem. Biotech. 109 (2003) 127–138.
[13] K.H. Rosenwinkel, H. Meyer, Anaerobic treatment of slaughterhouse residuesin municipal digesters, Water Sci. Technol. 40 (1999) 101–111.
[14] S. Luste, S. Luostarinen, Anaerobic co-digestion of meat-processing by-products and sewage sludge – effect of hygienization and organic loadingrate, Bioresour. Technol. 101 (2010) 2657–2664.
[15] G. Carucci, I. Carrasco, K. Trifoni, M. Majone, M. Beccari, Anaerobic digestion offood industry wastes: effect of codigestion on methane yield, J. Environ. Eng. –Asce. 131 (2005) 1037–1045.
[16] J. Pagés-Díaz, I. Pereda-Reyes, M. Lundin, I. Sárvári Horváth, Co-digestion ofdifferent waste mixtures from agro-industrial activities: kinetic evaluationand synergistic effects, Bioresour. Technol. 102 (2011) 10834–10840.
[17] J. Palatsi, M. Vinas, M. Guivernau, B. Fernández, X. Flotats, Anaerobic digestionof slaughterhouse waste: main process limitations and microbial communityinteractions, Bioresour. Technol. 102 (2011) 2219–2227.
[18] D.C. Montgomery, Design and Analysis of Experiments, sixth ed., John Wileyand Sons, 2005.
[19] P.V. Rao, S.S. Baral, Experimental design of mixture for the anaerobic co-digestion of sewage sludge, Chem. Eng. J. 172 (2011) 977–986.
[20] X. Wang, G. Yang, F. Li, Y. Feng, G. Ren, X. Han, Evaluation of two statisticalmethods for optimizing the feeding composition in anaerobic co-digestion:mixture design and central composite design, Bioresour. Technol. 131 (2013)172–178.
[21] Y. Chen, J.J. Cheng, K.S. Creamer, Inhibition of anaerobic digestion process: areview, Bioresour. Technol. 99 (2008) 4044–4064.
[22] T.L. Hansen, J.E. Schmidt, I. Angelidaki, E. Marcaa, J.C. Jansen, H. Mosbæk, T.H.Christensen, Method for determination of methane potentials of solid organicwaste, Waste Manage. 24 (2004) 393–400.
[23] A. Teghammar, J. Yngvesson, M. Lundin, M.J. Taherzadeh, I. Sárvári Horváth,Pretreatment of paper tube residuals for improved biogas production,Bioresour. Technol. 101 (2010) 1206–1212.
[24] J. Pagés-Díaz, I. Sárvári Horváth, J. Pérez Olmo, I. Pereda-Reyes, Codigestion ofbovine slaughterhouse wastes, cow manure, various crops and municipal solidwaste at thermophilic conditions: a comparison with specific case running atmesophilic conditions, Water Sci. Technol. 67 (2013) 989–995.
[25] A. Sluiter, B. Hames, R. Ruiz, C. Scarlata, J. Sluiter, D. Templeton, Determinationof Ash in Biomass. Standard Biomass Analytical Procedures, NationalRenewable Energy Laboratory, 2005.
[26] VDI-Gesellschaft Energietechnik: Vergärung organischer Stoffe (Fermentationof organic materials), VDI-Richtlinie 4630, VDI-Handbuch Energietechnik,Germany, 2006.
[27] Swedish Standards Institute, Water quality-Determination of Kjeldahlnitrogen-Method after mineralization with selenium, ISO 5663, Stockholm,Sweden, 1984.
[28] V.N. Gunaseelan, Biomass estimates, characteristics, biochemical methanepotential, kinetics and energy flow from Jatropha curcus on dry lands, BiomassBioenerg. 33 (2009) 589–596.
[29] Swedish Standards Institute. Water quality-Determination of ammonianitrogen content of water. SIS 28134, Article No STD-883, Stockholm, Sweden,1976.

98 J. Pagés-Díaz et al. / Chemical Engineering Journal 245 (2014) 89–98
[30] Nordic Committee on Food Analysis, Fat, determination according to SBR(Schmid-Bondzynski-Ratslaff) in meat and meat products, NMKL method No131, NMKL, Oslo, 1989.
[31] ISO, ISO 10780:1994, Stationary source emissions – Measurements of velocityand volume flow rate of gas streams in ducts, 1994.
[32] S. Bayr, M. Rantanen, P. Kaparaju, J. Rintala, Mesophilic and thermophilicanaerobic co-digestion of rendering plant and slaughterhouse wastes,Bioresour. Technol. 104 (2012) 28–36.
[33] A. Hejnfelt, I. Angelidaki, Anaerobic digestion of slaughterhouse by-products,Biomass Bioenerg. 33 (2009) 1046–1054.
[34] L. Neves, E. Goncalo, R. Oliveira, M.M. Alves, Influence of composition on thebiomethanation potential of restaurant waste at mesophilic temperatures,Waste Manage. 28 (2008) 965–972.
[35] I. Angelidaki, B.K. Ahring, Thermophilic anaerobic digestion of livestock waste:the effect of ammonia, Appl. Microbiol. Biotechnol. 38 (1993) 560–564.
[36] M. Macías-Corral, Z. Samani, A. Hanson, G. Smith, P. Funk, H. Yu, J. Longowort,Anaerobic digestion of municipal solid waste and agricultural waste and theeffect of co-digestion with dairy cow manure, Bioresour. Technol. 99 (2008)8288–8293.
[37] U. Deppenmeier, V. Muller, G. Gottschalk, Pathways of energy conservation inmethanogenic archea, Arch. Microbiol. 165 (1996) 149–163.
[38] J. Lin, J.N. Zuo, L.L. Gan, P. Li, F.L. Liu, K. Wang, L. Che, H. Gan, Effects of mixtureratio on anaerobic co-digestion with fruit and vegetable waste (FVW) and foodwaste (FW) of China, J. Environ. Sci. 23 (2011) 60572–60574.