anadolu hayat emeklİlİk a.Ş. company presentation august 2008
TRANSCRIPT
ANADOLU HAYAT EMEKLİLİK A.Ş.ANADOLU HAYAT EMEKLİLİK A.Ş.COMPANY PRESENTATIONCOMPANY PRESENTATION
August 2008August 2008
2
IndexIndex
Corporate ProfileCorporate Profile
Lines of Business - Life & Pensions Lines of Business - Life & Pensions
FinancialsFinancials
Stock DataStock Data

3
Corporate VisionCorporate Vision
To be the leading company in To be the leading company in Turkey in all aspects of Turkey in all aspects of
personal financial planning personal financial planning concerning the future of concerning the future of
Turkey and the Turkish peopleTurkey and the Turkish people
4
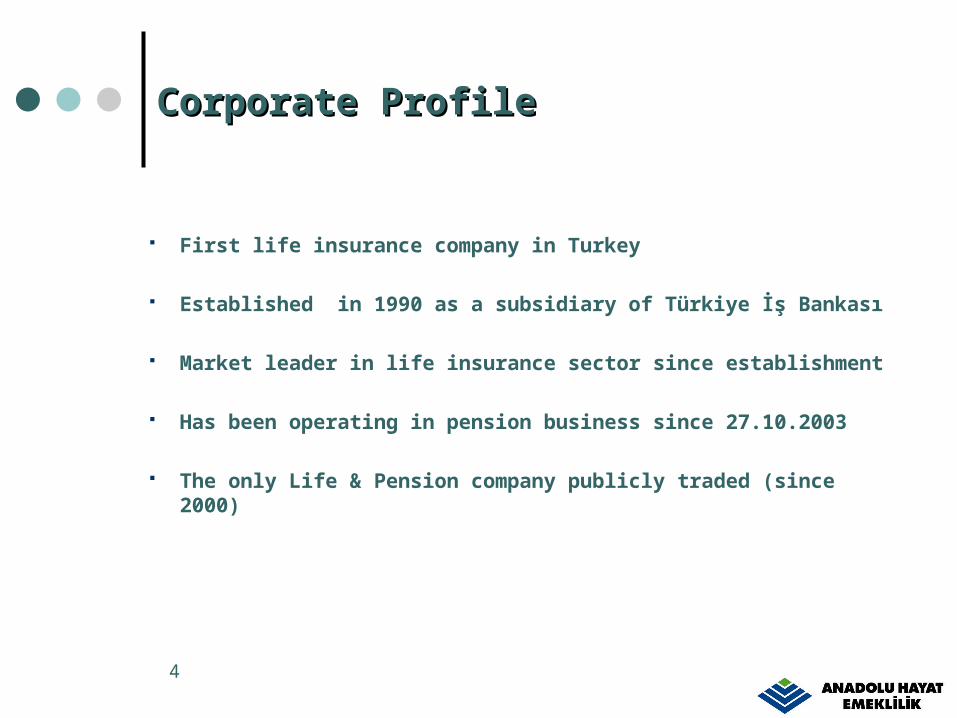
Corporate ProfileCorporate Profile
First life insurance company in Turkey
Established in 1990 as a subsidiary of Türkiye İş Bankası
Market leader in life insurance sector since establishment
Has been operating in pension business since 27.10.2003
The only Life & Pension company publicly traded (since 2000)
5
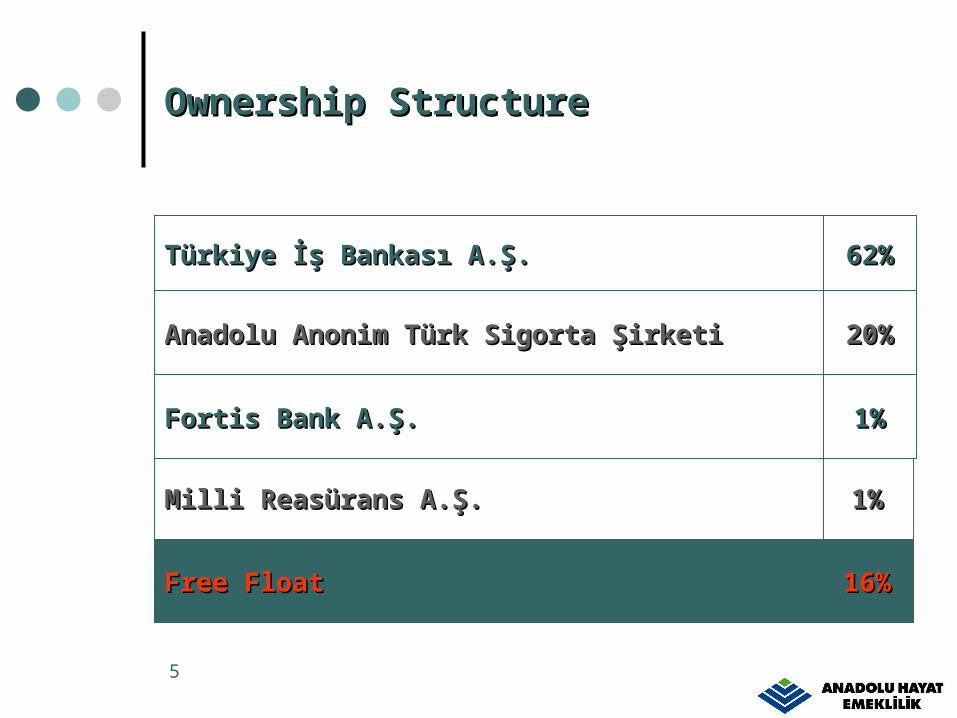
Ownership StructureOwnership Structure
16%16%Free FloatFree Float
1%1%Milli Reasürans A.Ş.Milli Reasürans A.Ş.
1%1%Fortis Bank A.Ş.Fortis Bank A.Ş.
20%20%Anadolu Anonim Türk Sigorta Şirketi Anadolu Anonim Türk Sigorta Şirketi
62%62%Türkiye İş Bankası A.Ş.Türkiye İş Bankası A.Ş.
6
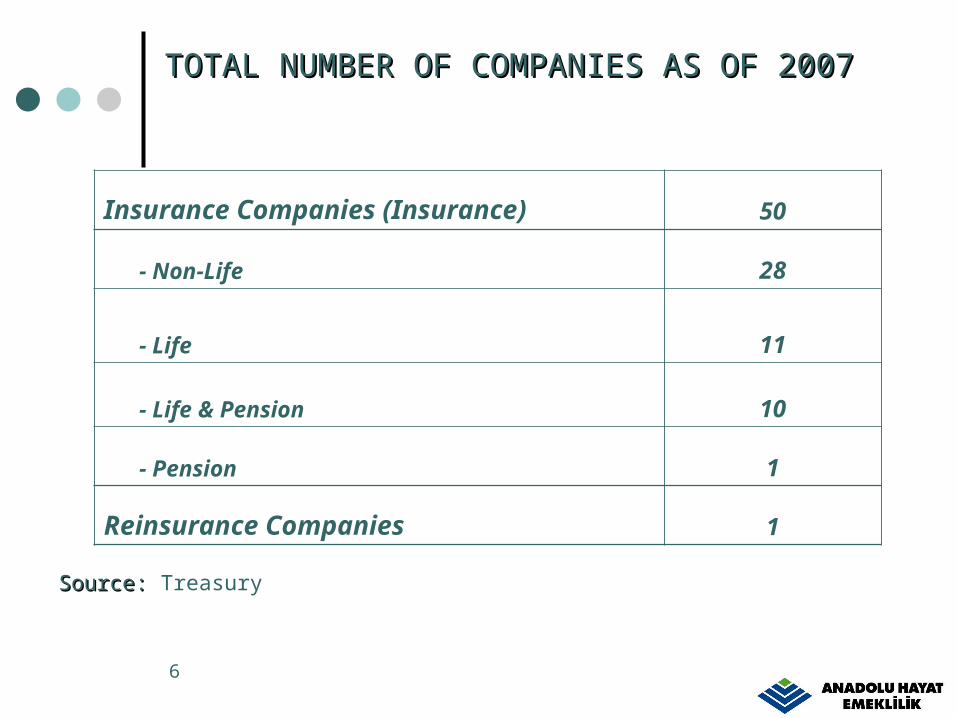
TOTAL NUMBER OF COMPANIES AS OF 2007TOTAL NUMBER OF COMPANIES AS OF 2007
Source: Source: Treasury
Insurance Companies (Insurance) 50
- Non-Life 28
- Life 11
- Life & Pension 10
- Pension 1
Reinsurance Companies 1
7
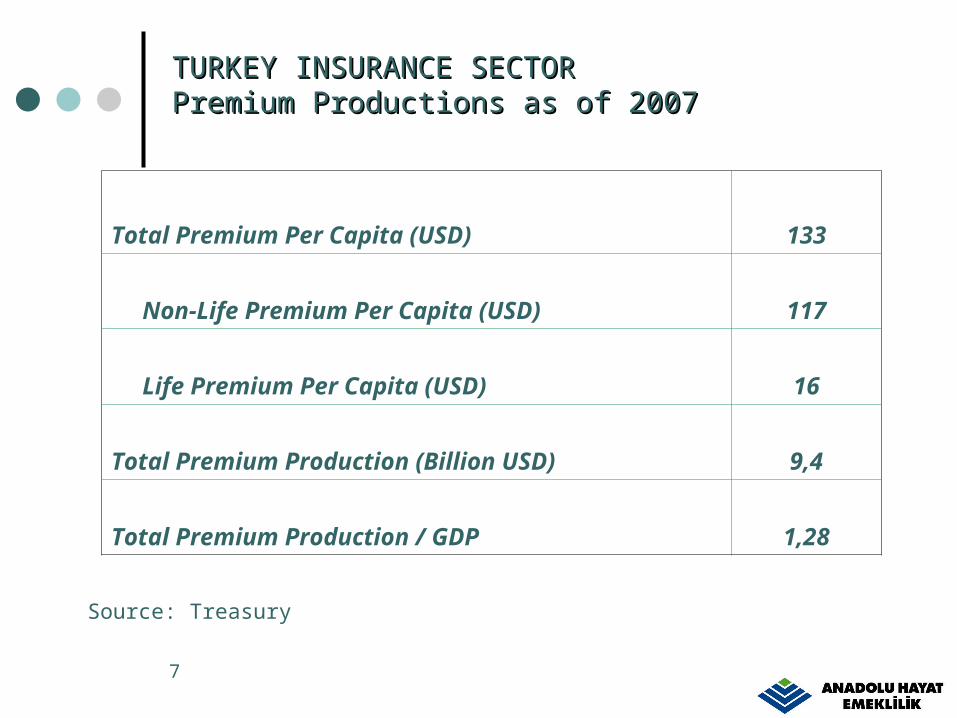
TURKEY INSURANCE SECTOR TURKEY INSURANCE SECTOR Premium Productions as of 2007Premium Productions as of 2007
Source: Treasury
Total Premium Per Capita (USD) 133
Non-Life Premium Per Capita (USD) 117
Life Premium Per Capita (USD) 16
Total Premium Production (Billion USD) 9,4
Total Premium Production / GDP 1,28
8
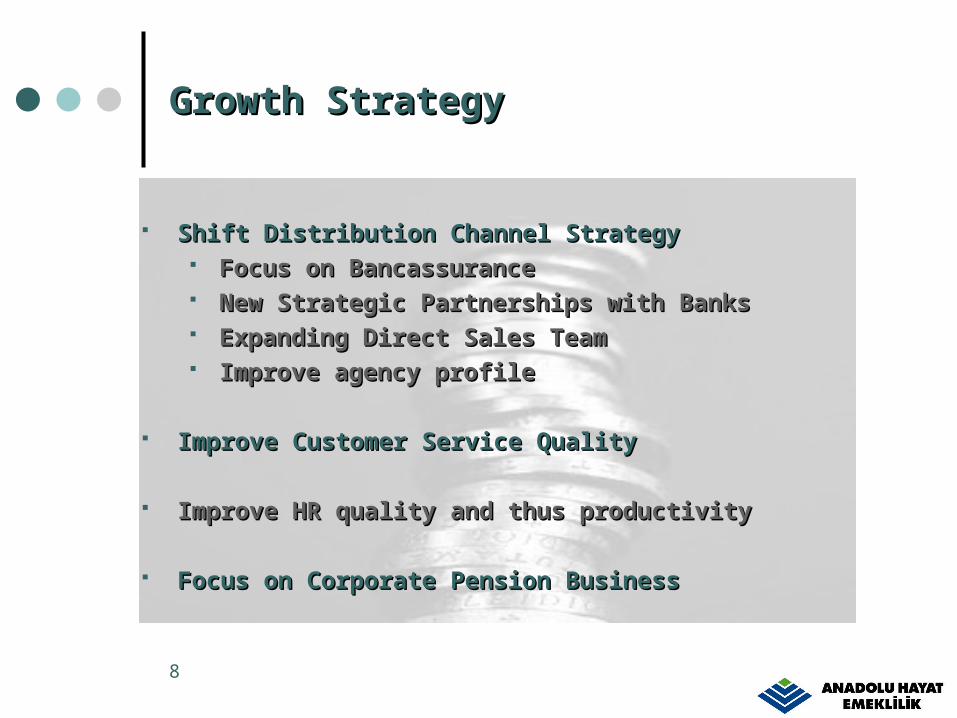
Growth StrategyGrowth Strategy
Shift Distribution Channel StrategyShift Distribution Channel Strategy Focus on BancassuranceFocus on Bancassurance New Strategic Partnerships with BanksNew Strategic Partnerships with Banks Expanding Direct Sales TeamExpanding Direct Sales Team Improve agency profileImprove agency profile
Improve Customer Service QualityImprove Customer Service Quality
Improve HR quality and thus productivityImprove HR quality and thus productivity
Focus on Corporate Pension BusinessFocus on Corporate Pension Business
9
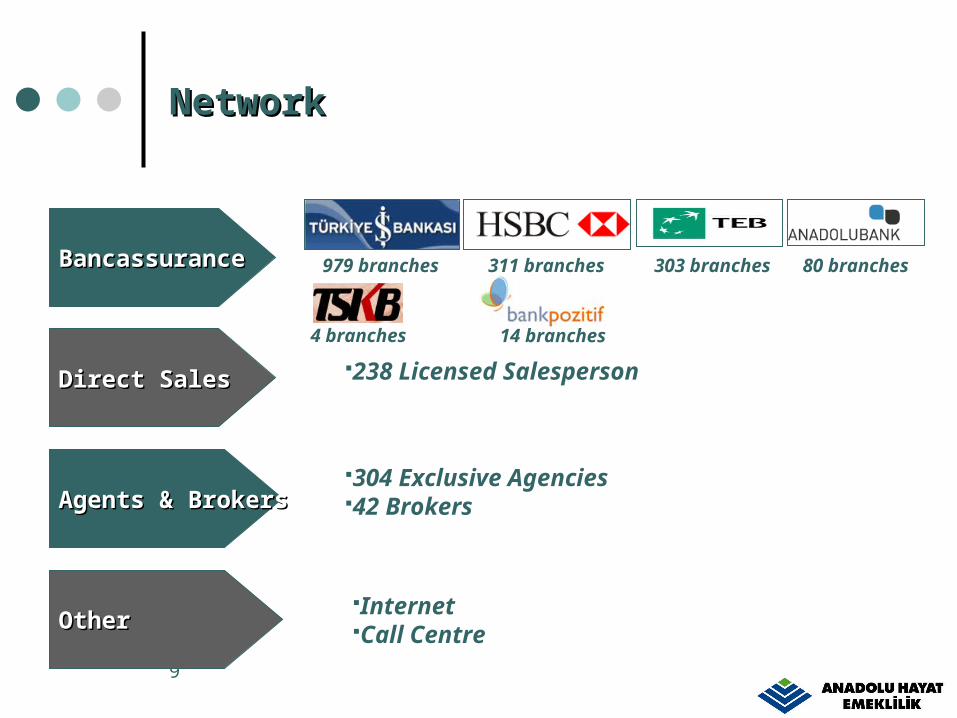
NetworkNetwork
BancassuranceBancassurance
Direct SalesDirect Sales
Agents & BrokersAgents & Brokers
OtherOther
238 Licensed Salesperson
304 Exclusive Agencies42 Brokers
InternetCall Centre
979 branches 311 branches 303 branches 80 branches
4 branches 14 branches

10
Corporate ProfileCorporate Profile
Lines of Business - Life & Pensions Lines of Business - Life & Pensions
FinancialsFinancials
Stock DataStock Data
11
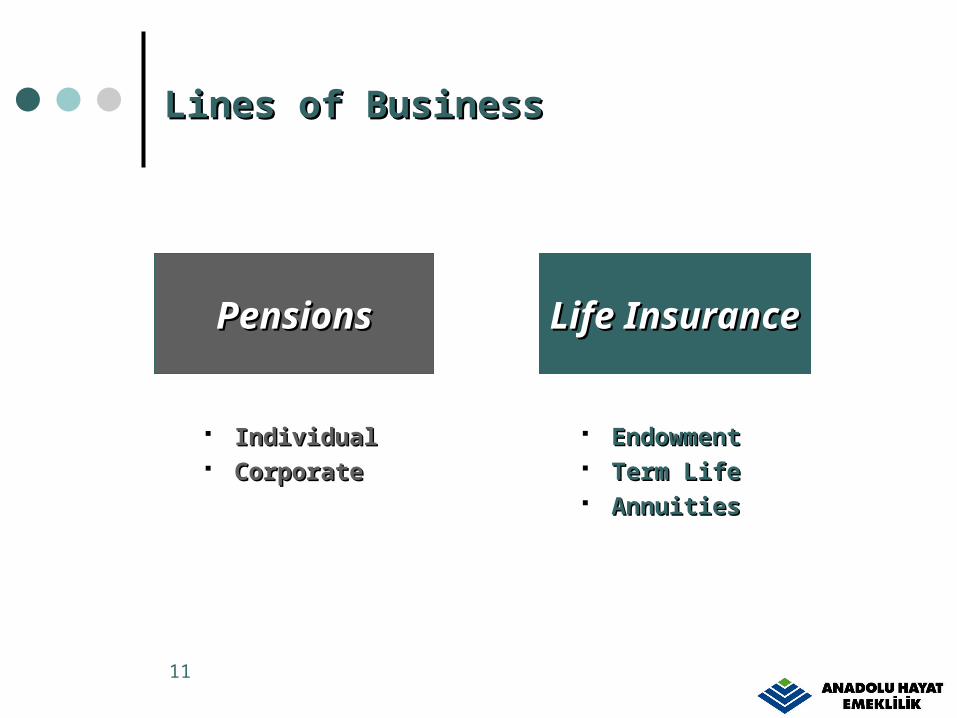
Lines of BusinessLines of Business
EndowmentEndowment Term LifeTerm Life AnnuitiesAnnuities
IndividualIndividual CorporateCorporate
Life InsuranceLife InsurancePensionsPensions
12
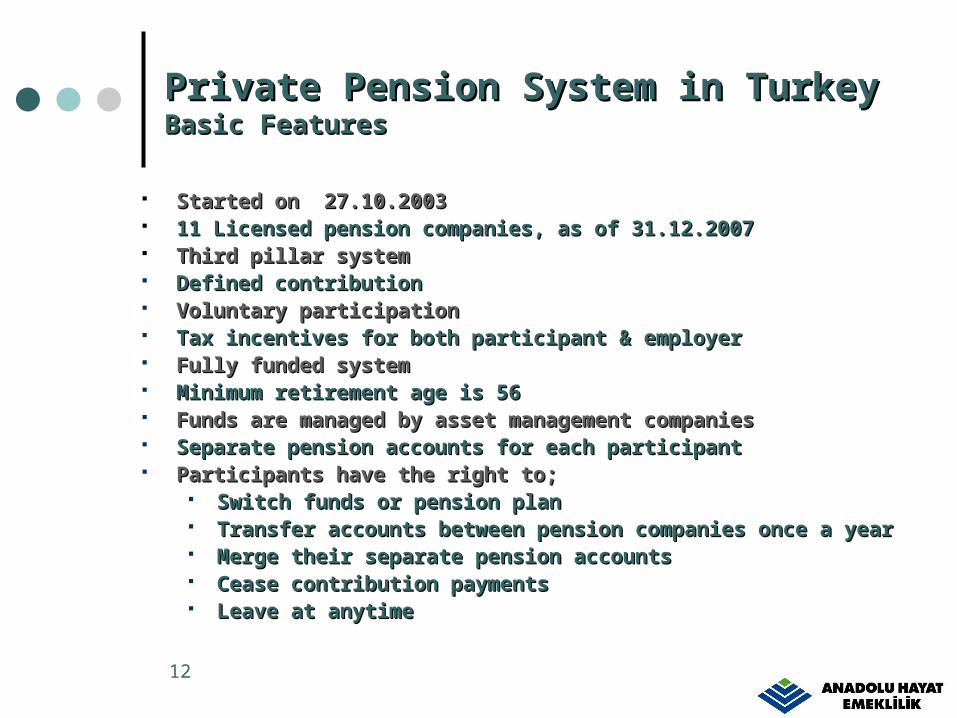
Started Started on on 27.10.2003 27.10.2003 1111 Licensed Licensed ppension ension ccompaniesompanies, as of 31.12.2007, as of 31.12.2007 Third Third ppillar illar ssystemystem Defined Defined ccontributionontribution Voluntary participationVoluntary participation Tax incentives for both participant & employerTax incentives for both participant & employer FFully funded ully funded system system Minimum retirement age is 56 Minimum retirement age is 56 Funds are managed by asset management companiesFunds are managed by asset management companies Separate pension accounts for each participantSeparate pension accounts for each participant Participants have the right to;Participants have the right to;
Switch funds or pension plan Switch funds or pension plan Transfer accounts between pension companies once a Transfer accounts between pension companies once a
yearyear Merge their separate pension accountsMerge their separate pension accounts Cease contribution paymentsCease contribution payments Leave at anytimeLeave at anytime
Private Pension System in Turkey Private Pension System in Turkey Basic FeaturesBasic Features
13
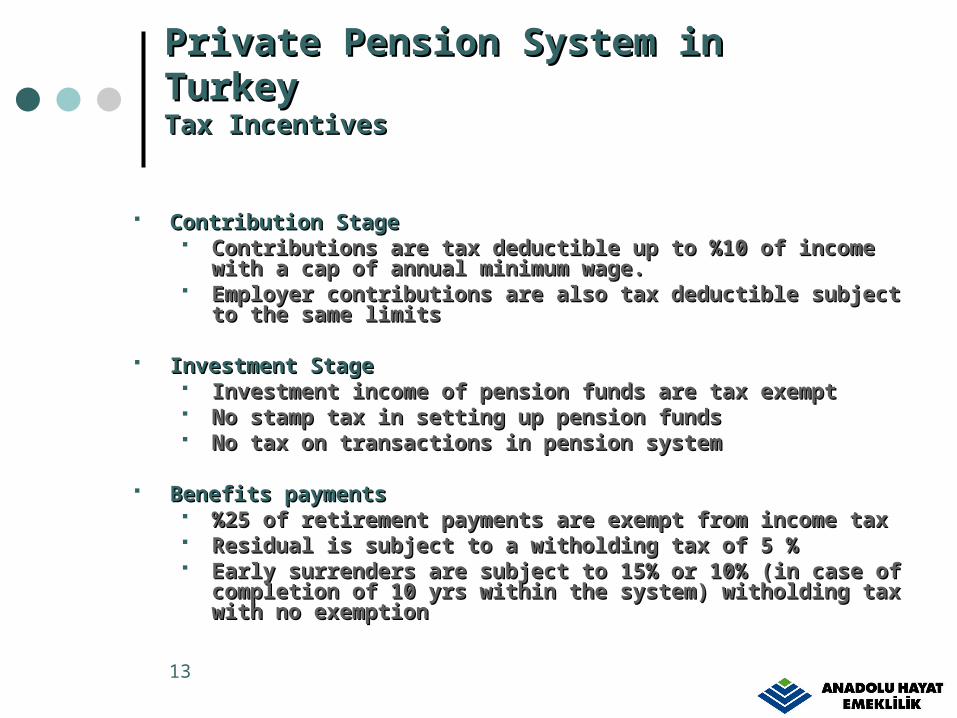
PPrivate Pension System in Turkey rivate Pension System in Turkey
Tax IncentivesTax Incentives
Contribution StageContribution Stage Contributions are tax deductible up to %10 of income Contributions are tax deductible up to %10 of income
with a cap of annual minimum wage.with a cap of annual minimum wage. Employer contributions are also tax deductible subject to Employer contributions are also tax deductible subject to
the same limitsthe same limits
Investment StageInvestment Stage Investment income of pension funds are tax exemptInvestment income of pension funds are tax exempt No stamp tax in setting up pension fundsNo stamp tax in setting up pension funds No tax on transactions in pension systemNo tax on transactions in pension system
Benefits paymentsBenefits payments %25 of retirement payments are exempt from income tax%25 of retirement payments are exempt from income tax Residual is subject to a witholding tax of 5 %Residual is subject to a witholding tax of 5 % Early surrenders are subject to 15% or 10%Early surrenders are subject to 15% or 10% (in case of (in case of
completion of 10 yrs within the system) witholding tax completion of 10 yrs within the system) witholding tax with no exemptionwith no exemption
14
TREASURY
PENSION MONITORING CENTRE
PARTICIPANT &SPONSOR
PENSION ACCOUNT
ADMINISTRATION*
ASSET MANAGEMENT **
FUND ADMINISTRATION
***
MONEY AND CAPITAL
MARKETS
CUSTODIAN BANK
CAPITAL MARKETS BOARD
Reporting of Reporting of Pension AccountPension Accountss
Reporting of Reporting of FundFundss
Reporting of Reporting of Pension AccountPension Accountss
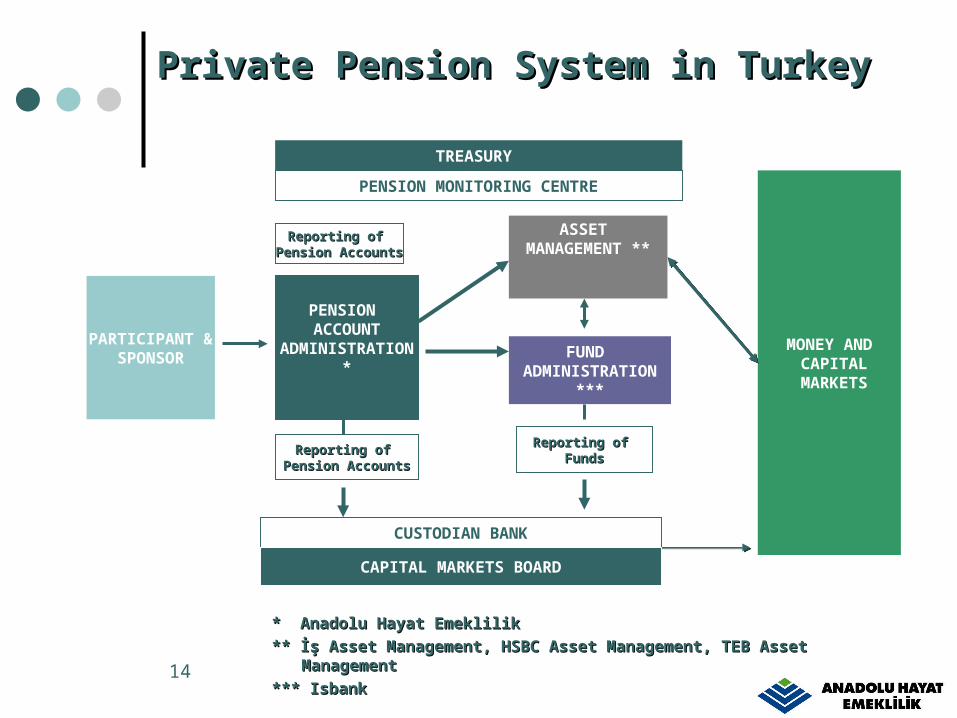
Private Pension System in TurkeyPrivate Pension System in Turkey
* Anadolu Hayat Emeklilik * Anadolu Hayat Emeklilik
** İş Asset Management, HSBC Asset Management, TEB Asset ** İş Asset Management, HSBC Asset Management, TEB Asset ManagementManagement
*** Isbank*** Isbank
15
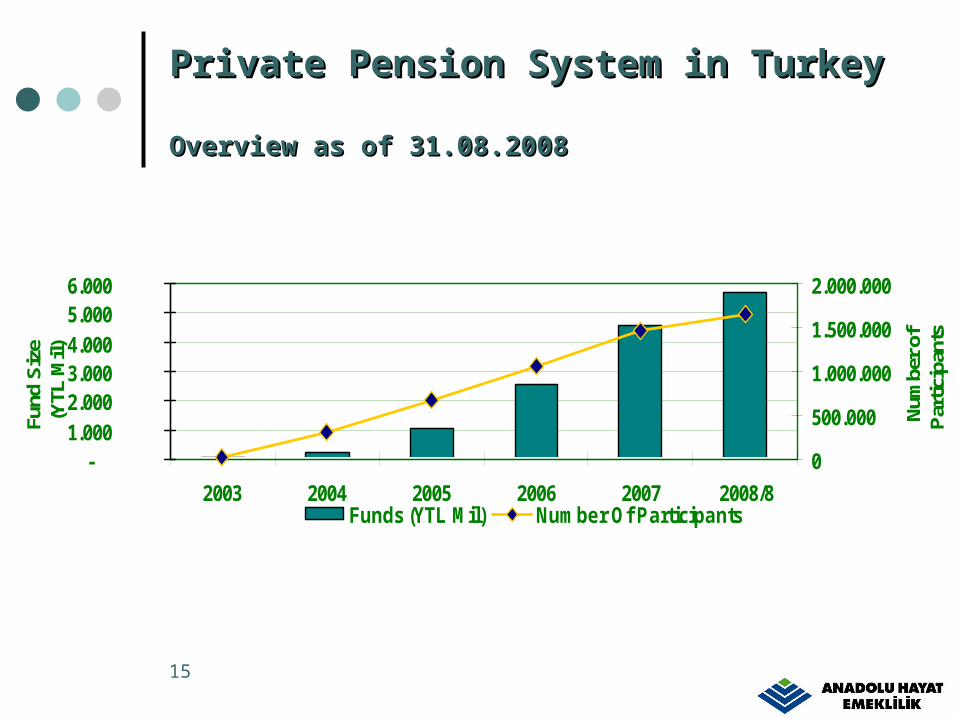
Private Pension System in Turkey Private Pension System in Turkey OverviewOverview as of 31.08.2008 as of 31.08.2008
- 1.000 2.000 3.000 4.000 5.000 6.000
2003 2004 2005 2006 2007 2008/8
Fund
Siz
e(Y
TL M
il)
0
500.000
1.000.000
1.500.000
2.000.000
Num
ber
of
Par
ticip
ants
Funds (YTL Mil) Number Of Participants
16
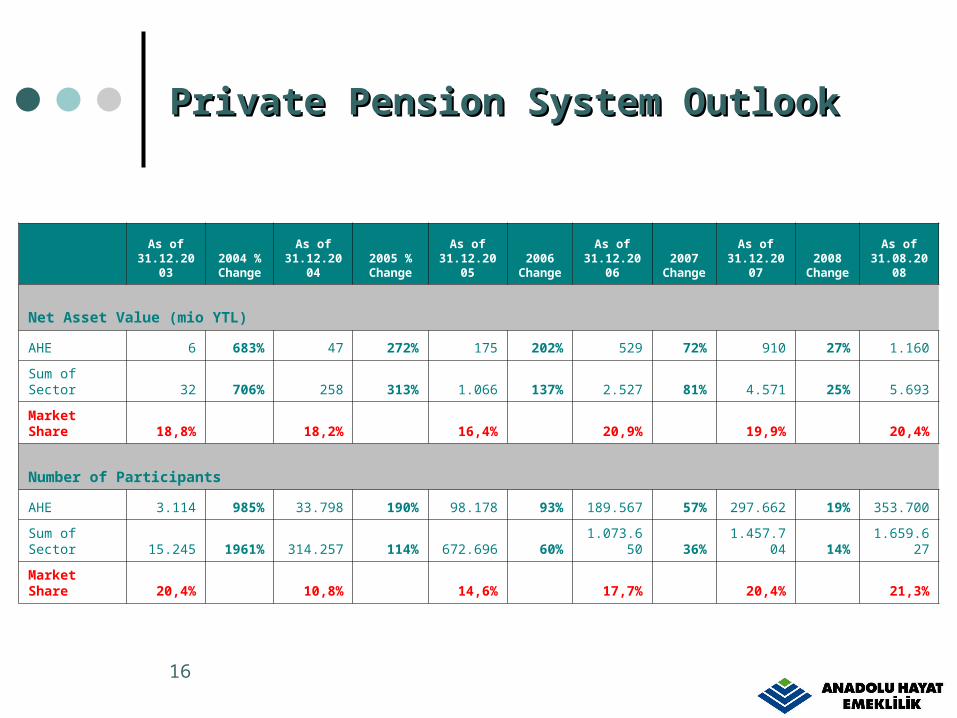
Private Pension System OutlookPrivate Pension System Outlook
As of 31.12.200
32004 % Change
As of 31.12.200
42005 % Change
As of 31.12.200
52006
ChangeAs of
31.12.20062007
Change
As of 31.12.200
72008
Change
As of 31.08.200
8
Net Asset Value (mio YTL)
AHE 6 683% 47 272% 175 202% 529 72% 910 27% 1.160
Sum of Sector 32 706% 258 313% 1.066 137% 2.527 81% 4.571 25% 5.693
Market Share 18,8% 18,2% 16,4% 20,9% 19,9% 20,4%
Number of Participants
AHE 3.114 985% 33.798 190% 98.178 93% 189.567 57% 297.662 19% 353.700
Sum of Sector 15.245 1961% 314.257 114% 672.696 60% 1.073.650 36% 1.457.704 14% 1.659.627
Market Share 20,4% 10,8% 14,6% 17,7% 20,4% 21,3%
17
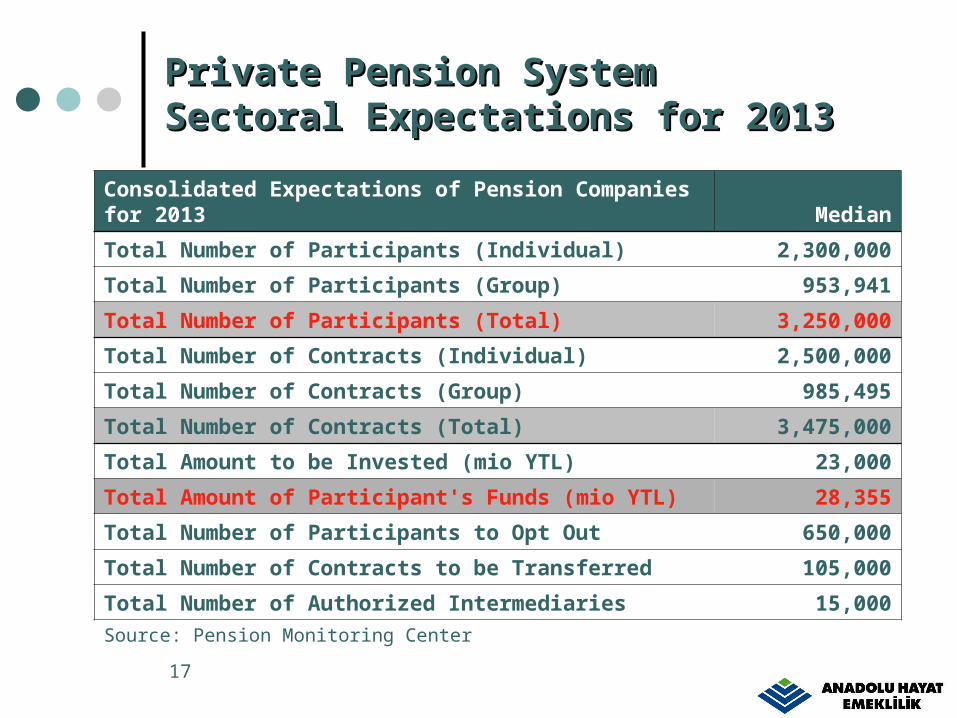
Private Pension SystemPrivate Pension SystemSectoral Expectations for 2013Sectoral Expectations for 2013
Consolidated Expectations of Pension Companies for 2013 Median
Total Number of Participants (Individual) 2,300,000
Total Number of Participants (Group) 953,941
Total Number of Participants (Total) 3,250,000
Total Number of Contracts (Individual) 2,500,000
Total Number of Contracts (Group) 985,495
Total Number of Contracts (Total) 3,475,000
Total Amount to be Invested (mio YTL) 23,000
Total Amount of Participant's Funds (mio YTL) 28,355
Total Number of Participants to Opt Out 650,000
Total Number of Contracts to be Transferred 105,000
Total Number of Authorized Intermediaries 15,000
Source: Pension Monitoring Center
18
KEY DRIVERS FOR GROWTH IN KEY DRIVERS FOR GROWTH IN PENSION BUSINESSPENSION BUSINESS
Economic Improvements in Turkey Structural reforms Extended maturities Purchasing power
Advantages of Pension System Tax incentives Transparent system Participating to the investment process
New Regulations Vesting Right of transfers to the pension system
19
KEY DRIVERS FOR OUR MARKET KEY DRIVERS FOR OUR MARKET LEADERSHIPLEADERSHIP
Distribution network
Diversified products
Fund performance
Charging structure
Service quality
20
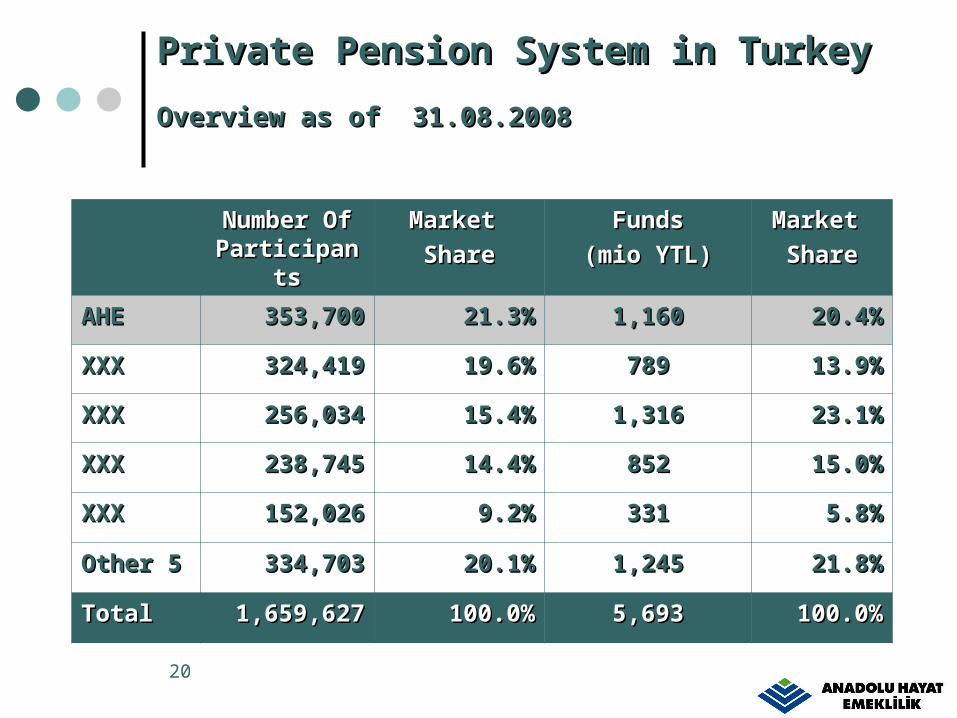
Private Pension System in Turkey Private Pension System in Turkey OverviewOverview as of 31.08.2008 as of 31.08.2008
Number Of Number Of ParticipantParticipant
ss
Market Market
ShareShareFundsFunds
(mio YTL)(mio YTL)Market Market
ShareShare
AHEAHE 353,700353,700 21.3%21.3% 1,1601,160 20.4%20.4%
XXXXXX 324,419324,419 19.6%19.6% 789789 13.9%13.9%
XXXXXX 256,034256,034 15.4%15.4% 1,3161,316 23.1%23.1%
XXXXXX 238,745238,745 14.4%14.4% 852852 15.0%15.0%
XXXXXX 152,026152,026 9.2%9.2% 331331 5.8%5.8%
Other 5Other 5 334,703334,703 20.1%20.1% 1,2451,245 21.8%21.8%
TotalTotal 1,659,6271,659,627 100.0%100.0% 5,6935,693 100.0%100.0%
21
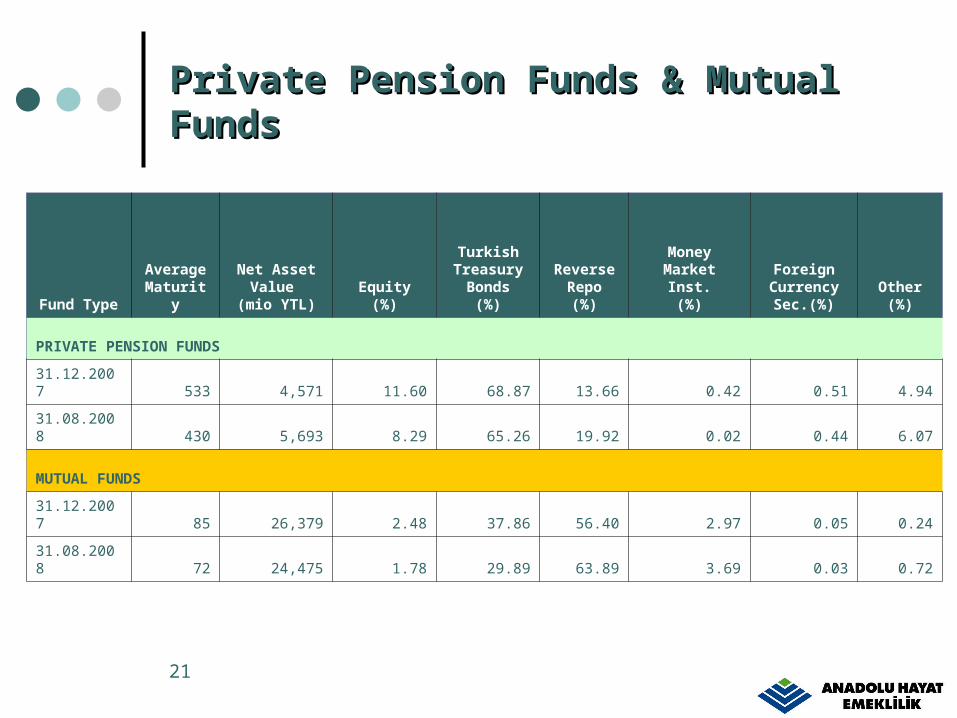
Private Pension Funds & Mutual Private Pension Funds & Mutual FundsFunds
Fund Type
Average Maturit
y
Net Asset Value
(mio YTL)Equity
(%)
Turkish Treasury
Bonds(%)
Reverse Repo (%)
Money Market Inst.
(%)
Foreign Currency Sec.(%)
Other (%)
PRIVATE PENSION FUNDS
31.12.2007 533 4,571 11.60 68.87 13.66 0.42 0.51 4.94
31.08.2008 430 5,693 8.29 65.26 19.92 0.02 0.44 6.07
MUTUAL FUNDS
31.12.2007 85 26,379 2.48 37.86 56.40 2.97 0.05 0.24
31.08.2008 72 24,475 1.78 29.89 63.89 3.69 0.03 0.72
22
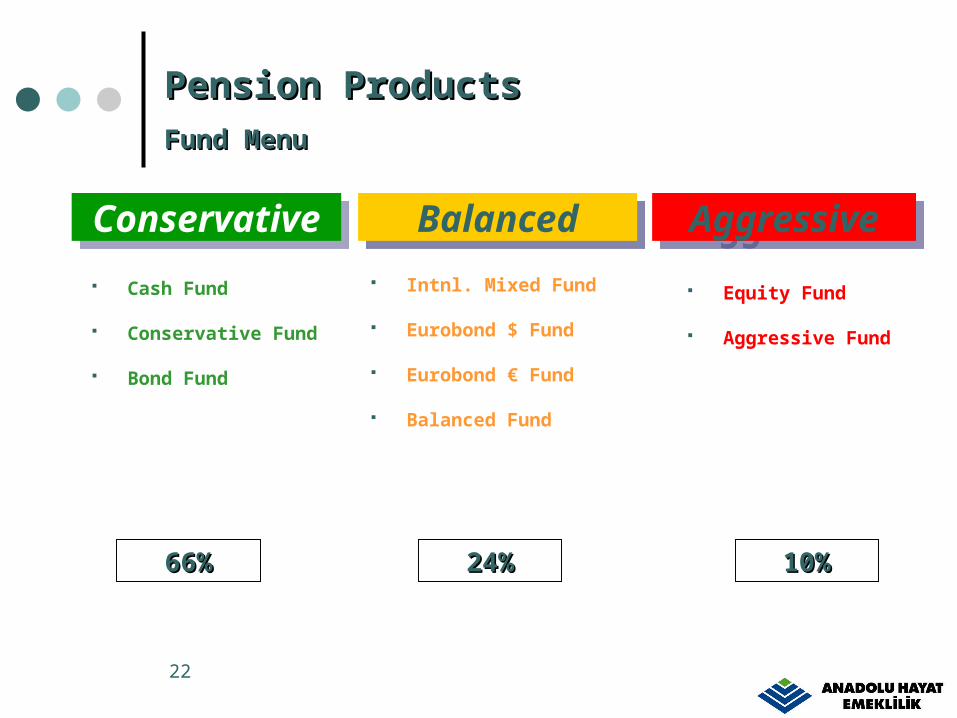
Pension Pension Products Products Fund MenuFund Menu
ConservativeConservative BalancedBalanced AggressiveAggressive Cash Fund
Conservative Fund
Bond Fund
Intnl. Mixed Fund
Eurobond $ Fund
Eurobond € Fund
Balanced Fund
Equity Fund
Aggressive Fund
66%66% 24%24% 10%10%
23
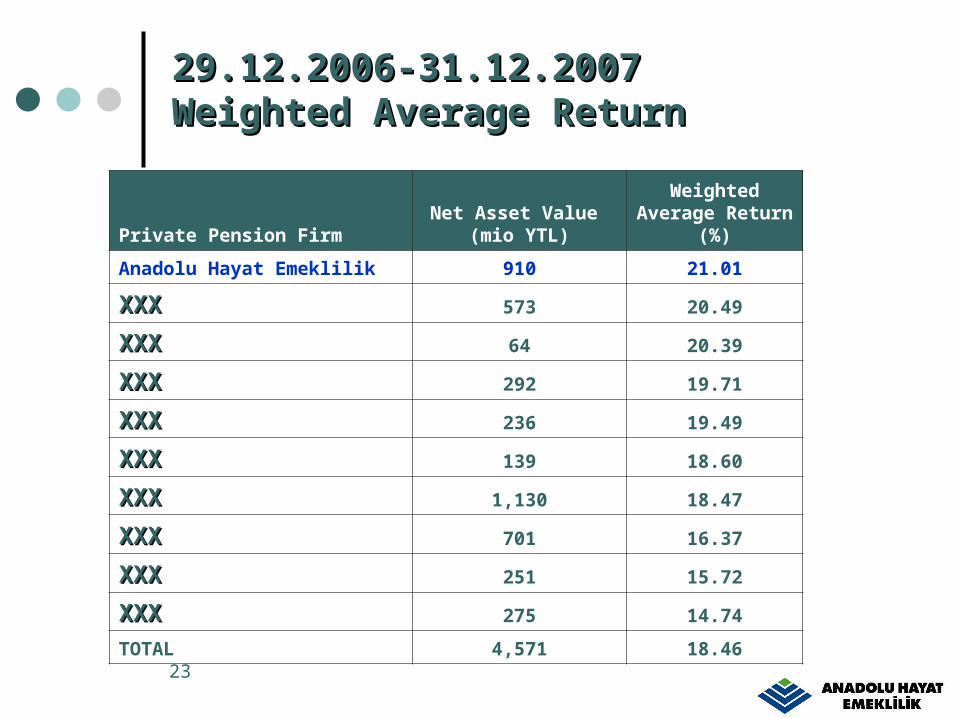
29.12.2006-31.12.2007 29.12.2006-31.12.2007 Weighted Average ReturnWeighted Average Return
Private Pension FirmNet Asset Value
(mio YTL)
Weighted Average Return
(%)
Anadolu Hayat Emeklilik 910 21.01
XXXXXX 573 20.49
XXXXXX 64 20.39
XXXXXX 292 19.71
XXXXXX 236 19.49
XXXXXX 139 18.60
XXXXXX 1,130 18.47
XXXXXX 701 16.37
XXXXXX 251 15.72
XXXXXX 275 14.74
TOTAL 4,571 18.46
24
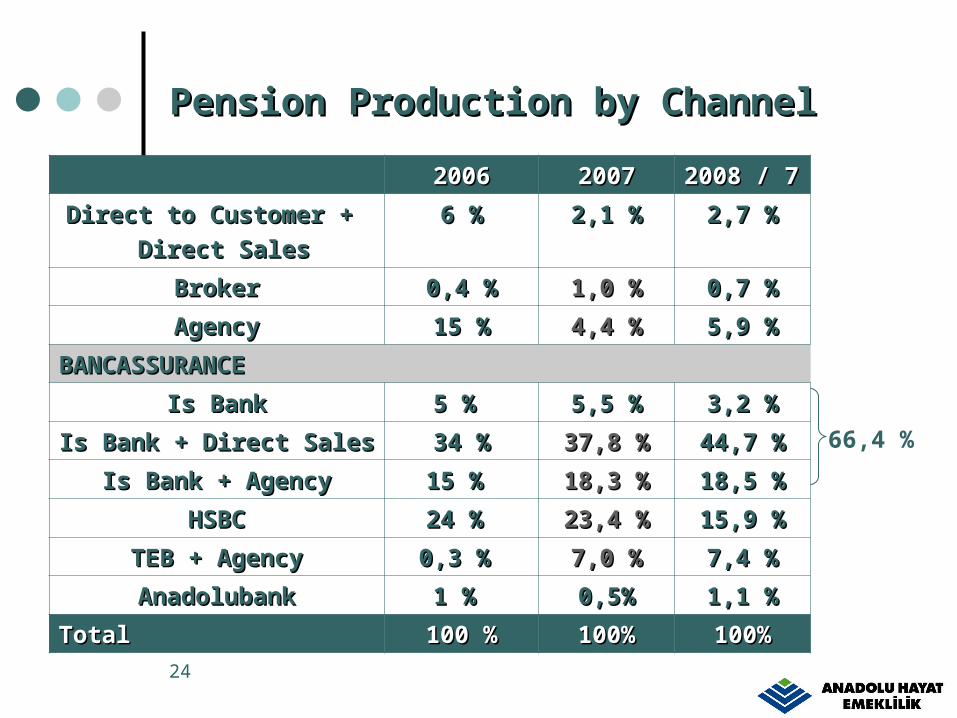
PensionPension Production Production bby y ChannelChannel
20062006 20072007 2008 / 72008 / 7
Direct to Customer + Direct to Customer +
Direct SalesDirect Sales6 %6 % 2,1 %2,1 % 2,7 %2,7 %
BrokerBroker 0,4 %0,4 % 1,0 %1,0 % 0,7 %0,7 %
AgencyAgency 15 %15 % 4,4 %4,4 % 5,9 %5,9 %
BANCASSURANCEBANCASSURANCE
Is BankIs Bank 5 %5 % 5,5 %5,5 % 3,2 %3,2 %
Is Bank + Direct SalesIs Bank + Direct Sales 34 %34 % 37,8 %37,8 % 44,7 %44,7 %
Is Bank + AgencyIs Bank + Agency 115 %5 % 18,3 %18,3 % 18,5 %18,5 %
HSBCHSBC 24 %24 % 23,4 %23,4 % 15,9 %15,9 %
TEB + AgencyTEB + Agency 0,3 %0,3 % 7,0 %7,0 % 7,4 %7,4 %
AnadolubankAnadolubank 1 %1 % 0,5%0,5% 1,1 %1,1 %
TotalTotal 100 %100 % 100%100% 100%100%
66,4 %
25
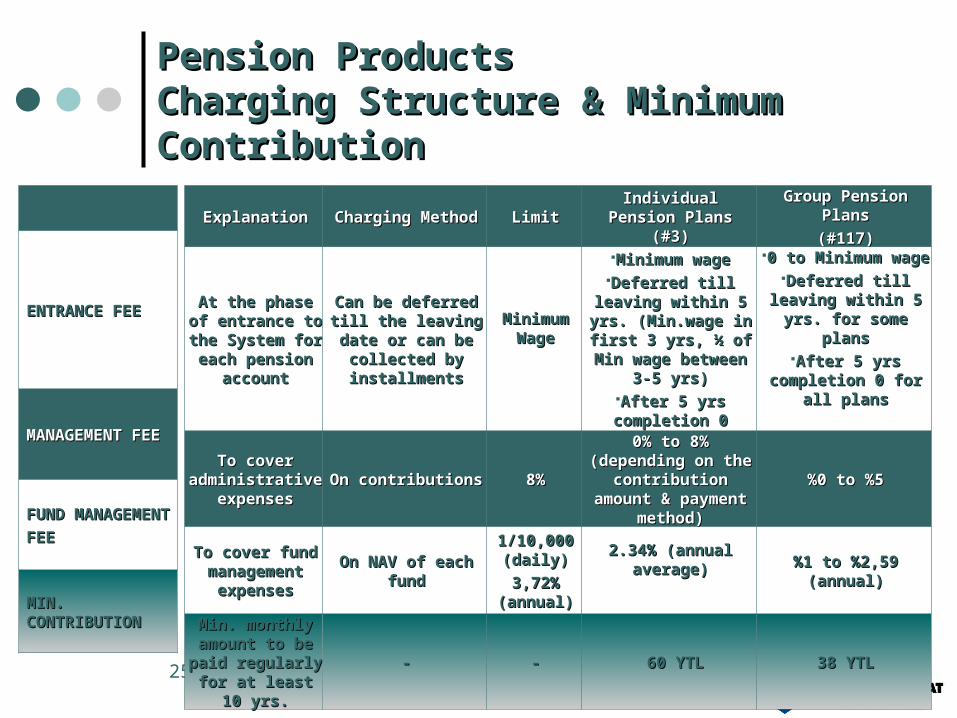
Pension Pension Products Products Charging Structure & Minimum Charging Structure & Minimum ContributionContribution
ENTRANCE FEEENTRANCE FEE
MANAGEMENT MANAGEMENT FEEFEE
FUND FUND MANAGEMENTMANAGEMENT
FEEFEE
MIN. MIN. CONTRIBUTIONCONTRIBUTION
ExplanationExplanation Charging MethodCharging Method LimitLimit Individual Pension Individual Pension PlansPlans (#3) (#3)
Group Pension Group Pension PlansPlans
(#117)(#117)
At the phase At the phase of entrance to of entrance to the System for the System for each pension each pension
accountaccount
Can be deferred Can be deferred till the leaving till the leaving date or can be date or can be collected by collected by installmentsinstallments
Minimum Minimum WageWage
Minimum wageMinimum wageDeferred till Deferred till
leaving within 5 leaving within 5 yrs. (yrs. (Min.wage Min.wage in in first 3 yrs, first 3 yrs, ½ of ½ of
Min wage between Min wage between 3-5 yrs)3-5 yrs)
After 5 yrs After 5 yrs completion 0completion 0
0 to Minimum 0 to Minimum wage wage
Deferred till Deferred till leaving within 5 leaving within 5
yrs. for some yrs. for some plansplans
After 5 yrs After 5 yrs completion 0 for completion 0 for
all plansall plans
To cover To cover administrative administrative
expensesexpensesOn contributionsOn contributions 8%8%
00%% to to 88% % ((depending on the depending on the
contribution contribution amount & amount &
payment methodpayment method))
%0 to %5%0 to %5
To cover fund To cover fund management management
expensesexpenses
On NAV of each On NAV of each fundfund
1/10,000 1/10,000 (daily)(daily)
3,72% 3,72% (annual)(annual)
2.34% (annual 2.34% (annual average)average) %1 to %2,59 %1 to %2,59
(annual)(annual)
Min.Min. monthly monthly amount to be amount to be paid regularly paid regularly for at least 10 for at least 10
yrs.yrs.
-- -- 6060 YTLYTL 3388 YYTLTL
2626
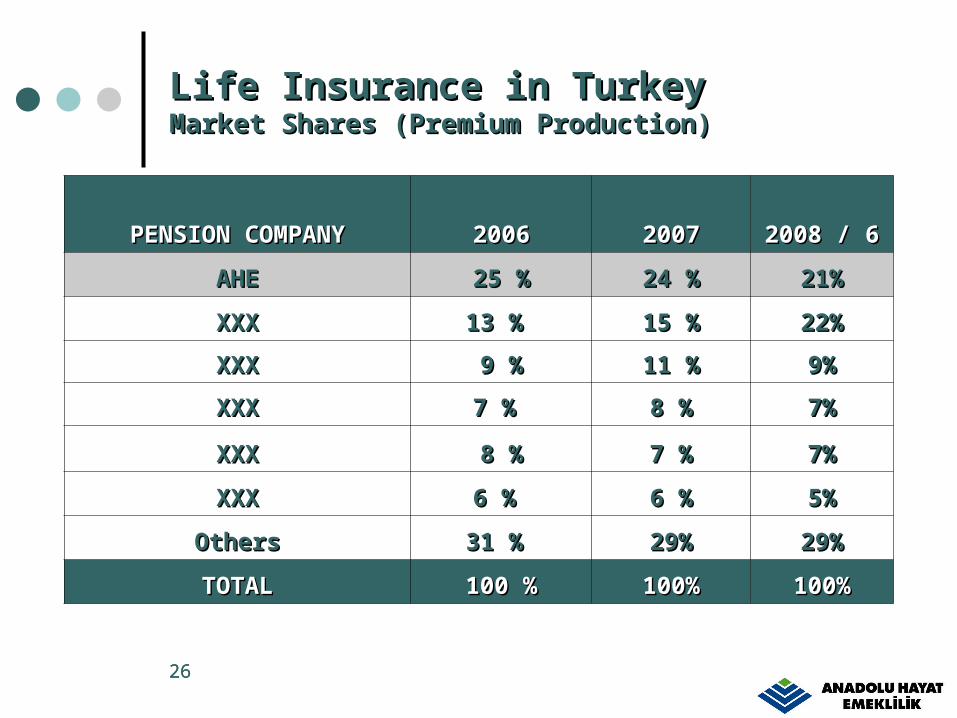
Life Insurance in Turkey Life Insurance in Turkey Market SMarket Shares (Premium Production)hares (Premium Production)
PENSION COMPANYPENSION COMPANY 20062006 20072007 2008 / 62008 / 6
AHEAHE 25 %25 % 24 %24 % 21%21%
XXXXXX 13 %13 % 15 %15 % 22%22%
XXXXXX 9 %9 % 11 %11 % 9%9%
XXXXXX 7 %7 % 8 %8 % 7%7%
XXXXXX 8 %8 % 7 %7 % 7%7%
XXXXXX 6 %6 % 6 %6 % 5%5%
OthersOthers 31 %31 % 29%29% 29%29%
TOTALTOTAL 100 %100 % 100%100% 100%100%
2727
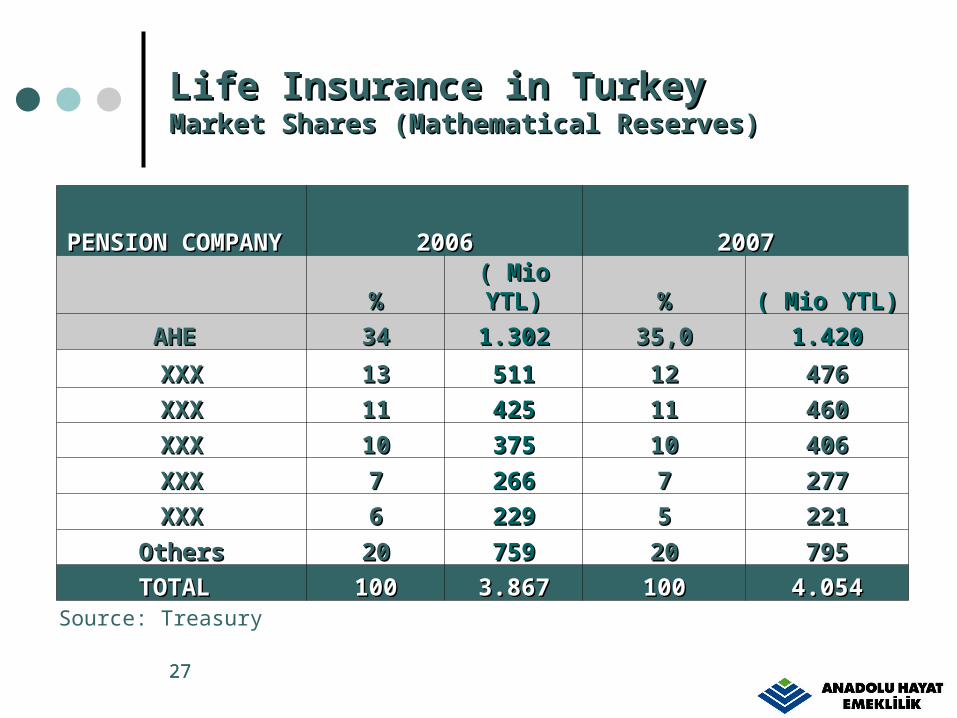
Life Insurance in Turkey Life Insurance in Turkey Market SMarket Shares (Mathematical Reserves)hares (Mathematical Reserves)
PENSION PENSION COMPANY COMPANY 20062006 20072007
%% ( Mio YTL)( Mio YTL) %% ( Mio YTL)( Mio YTL)
AHE AHE 3434 1.3021.302 35,035,0 1.4201.420
XXXXXX 1313 511511 1212 476476
XXXXXX 1111 425425 1111 460460
XXXXXX 1010 375375 1010 406406
XXXXXX 77 266266 77 277277
XXXXXX 66 229229 55 221221
OthersOthers 2020 759759 2020 795795
TOTAL TOTAL 100100 3.8673.867 100100 4.0544.054
Source: Treasury

28
Life ProductsLife Products / / Profit Sharing RatesProfit Sharing Rates
YEARYEARPROFIT PROFIT
SHARE(%)SHARE(%) USD(%)USD(%) CPI(%)CPI(%)
19981998 98 98 53 53 70 70
19991999 119 119 7733 69 69
20002000 43 43 24 24 39 39
20012001 76 76 111144 69 69
20022002 62 62 14 14 30 30
20032003 47 47 -15-15 18 18
20020044 2929 --44 99
20020055 2323 00 88
20020066 1616 55 1010
20072007 2020 -17-17 88
AVERAGEAVERAGE 5353 2525 3333
2929
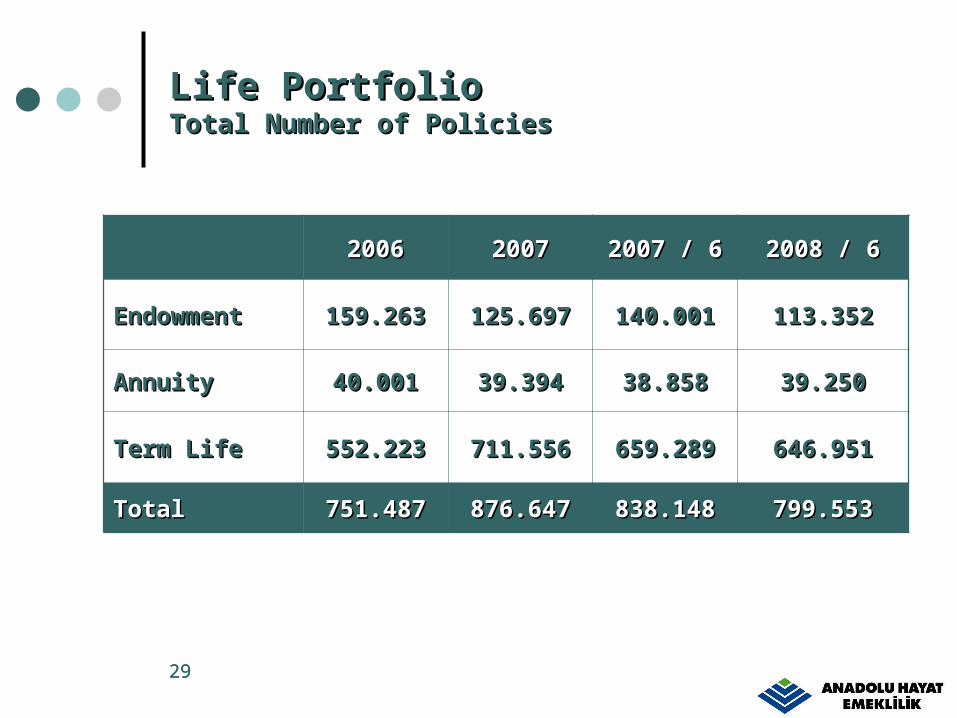
Life PortfolioLife PortfolioTotal Number of PoliciesTotal Number of Policies
20062006 20072007 2007 / 62007 / 6 2008 / 62008 / 6
EndowmentEndowment 159.263159.263 125.697125.697 140.001140.001 113.352113.352
AnnuityAnnuity 40.00140.001 39.39439.394 38.85838.858 39.25039.250
Term LifeTerm Life 552.223552.223 711.556711.556 659.289659.289 646.951646.951
TotalTotal 751.487751.487 876.647876.647 838.148838.148 799.553799.553
3030
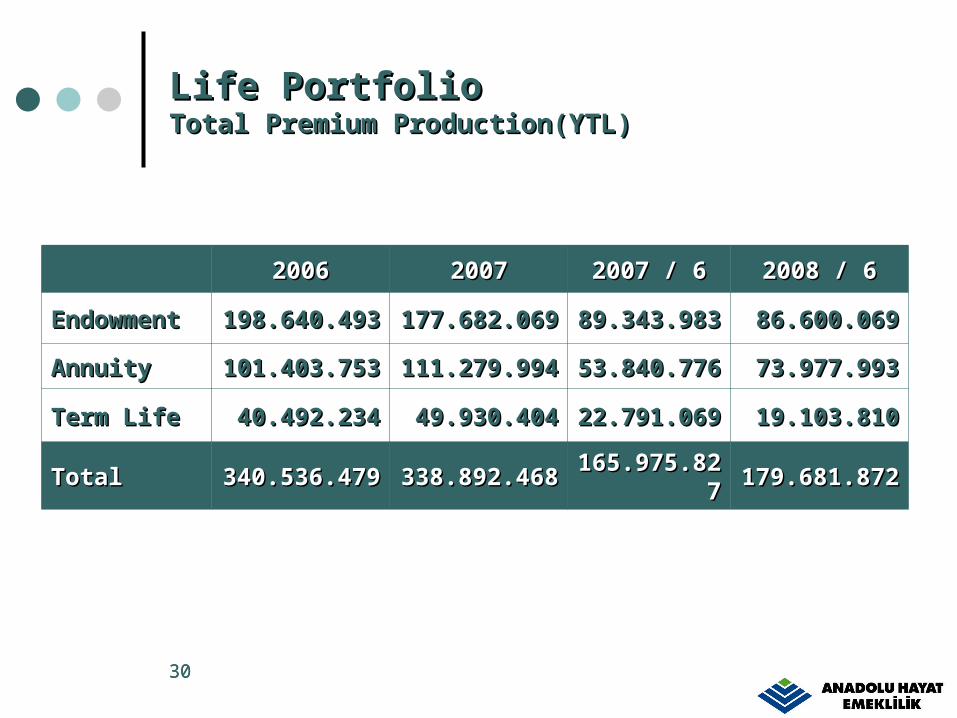
Life Portfolio Life Portfolio Total Premium Production(YTL)Total Premium Production(YTL)
20062006 20072007 2007 / 62007 / 6 2008 / 62008 / 6
EndowmenEndowmentt
119898..640640..494933
177.682.06177.682.0699
8989..343343..989833
86.600.06986.600.069
AnnuityAnnuity 101101..403403..757533
111.279.99111.279.9944
5353..840840..777766
73.977.99373.977.993
Term LifeTerm Life 4040..492492..234234 49.930.40449.930.404 2222..791791..060699
19.103.81019.103.810
TotalTotal 340.536.47340.536.4799
338.892.46338.892.4688
165.975.8165.975.82727
179.681.87179.681.8722
3131
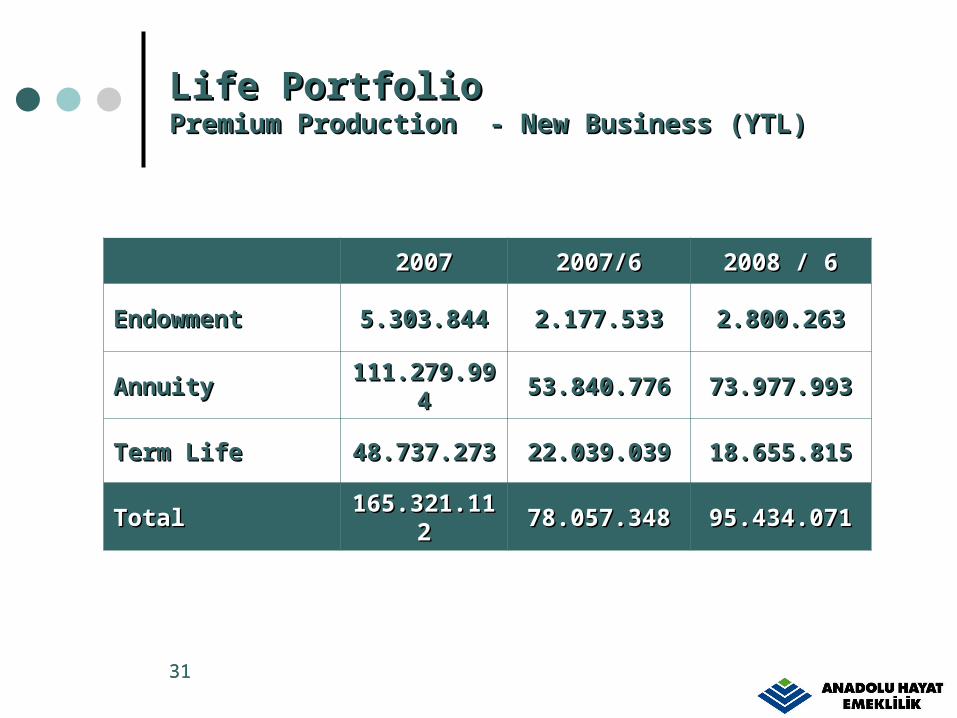
Life Portfolio Life Portfolio Premium Production - New Business (Premium Production - New Business (YTL)YTL)
20072007 2007/62007/6 2008 / 62008 / 6
EndowmentEndowment 5.303.8445.303.844 2.177.5332.177.533 2.800.2632.800.263
AnnuityAnnuity 111.279.9111.279.99494 53.840.77653.840.776 73.977.99373.977.993
Term LifeTerm Life 48.737.2748.737.2733
22.039.03922.039.039 18.655.81518.655.815
TotalTotal 165.321.1165.321.11212 78.057.34878.057.348 95.434.07195.434.071
3232
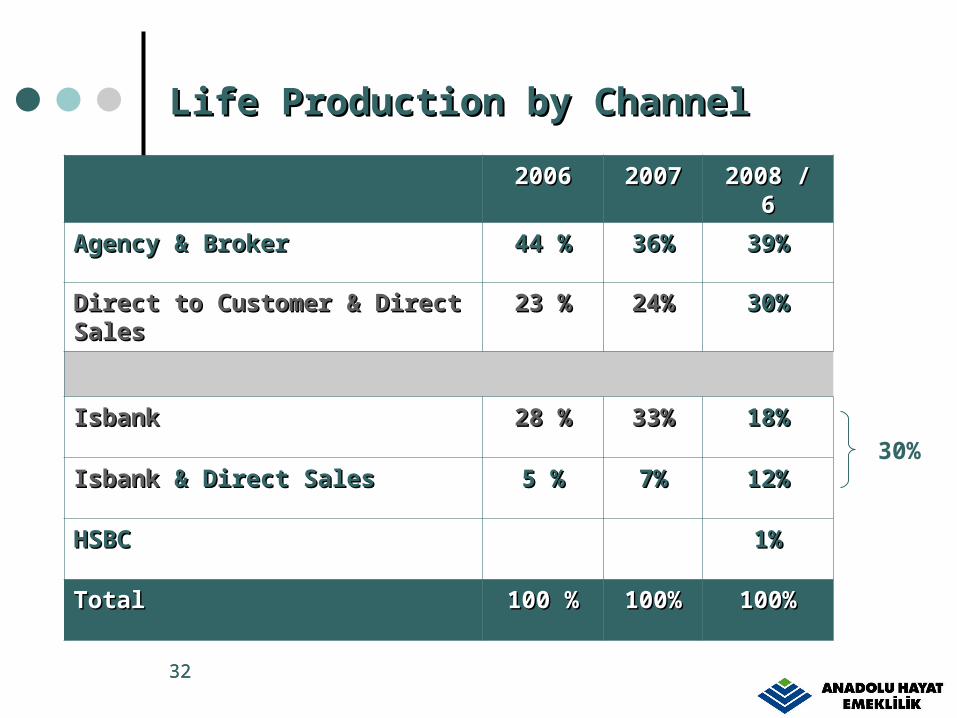
Life Life Production Production bby y ChannelChannel
20062006 20072007 2008 / 62008 / 6
Agency & BrokerAgency & Broker 44 %44 % 36%36% 39%39%
Direct to Customer & Direct Direct to Customer & Direct SalesSales
23 %23 % 24%24% 30%30%
IsbankIsbank 28 %28 % 33%33% 18%18%
IsbankIsbank & Direct Sales & Direct Sales 5 %5 % 7%7% 12%12%
HSBCHSBC 1%1%
TotalTotal 100 %100 % 100%100% 100%100%
30%
33
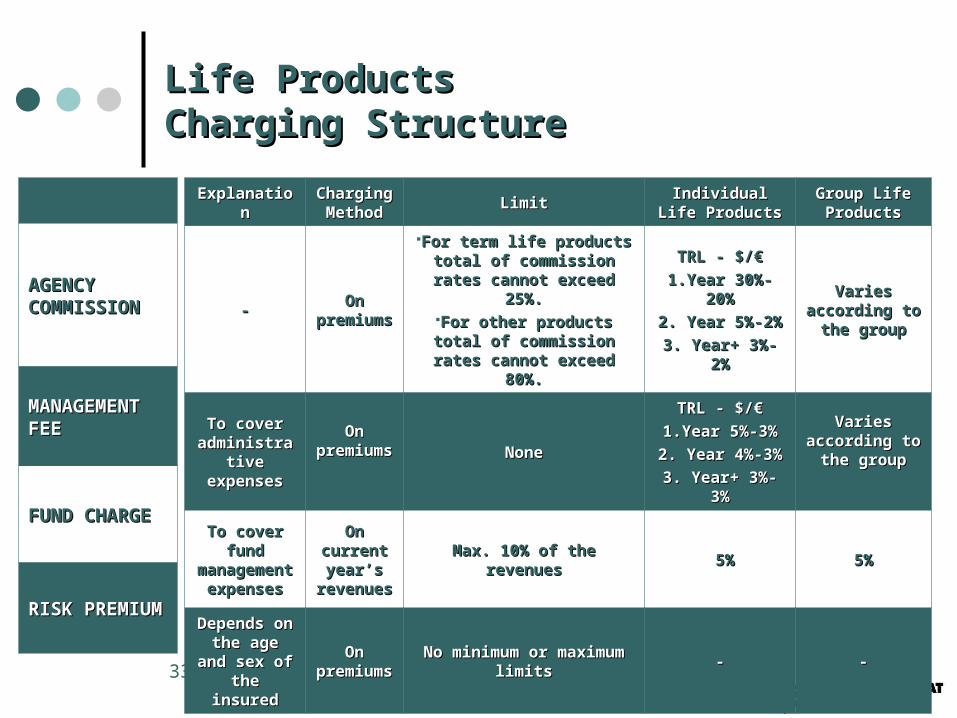
LLife Products ife Products Charging StructureCharging Structure
AGENCY AGENCY COMMISSIONCOMMISSION
MANAGEMENMANAGEMENT FEET FEE
FUND FUND CHARGECHARGE
RISK RISK PREMIUMPREMIUM
ExplanatioExplanationn
CharginCharging g
MethodMethodLimitLimit Individual Life Individual Life
ProductsProductsGroup Life Group Life ProductsProducts
--On On
premiupremiumsms
For term life products For term life products total of commission total of commission rates cannot exceed rates cannot exceed
25%.25%.For other products total For other products total
of commission rates of commission rates cannot exceed 80%.cannot exceed 80%.
TRL - $/€TRL - $/€
1.Year 1.Year 3030%%--2200%%
2. Year 5%2. Year 5%-2-2%%
3. 3. YYearear+ 3+ 3%%--2%2%
Varies Varies according to according to
the groupthe group
To cover To cover administraadministra
tive tive expensesexpenses
On On premiupremiu
msms NoneNone
TRL - $/€TRL - $/€
1.Year 1.Year 55%%-3-3%%
2. Year 2. Year 44%%-3-3%%
3. 3. YYearear+ 3+ 3%%--33%%
Varies Varies according to according to
the groupthe group
To cover To cover fund fund
manmanaagemegement nt
expensesexpenses
On On current current year’s year’s
revenuerevenuess
Max. 10% of the Max. 10% of the revenuesrevenues 5%5% 5%5%
Depends Depends on the age on the age and sex of and sex of
the the insuredinsured
On On premiupremiu
msms
No minimum or No minimum or maximum limitsmaximum limits -- --
34
Corporate ProfileCorporate Profile
Lines of Business - Life & Pensions Lines of Business - Life & Pensions
FinancialsFinancials
Stock DataStock Data
3535
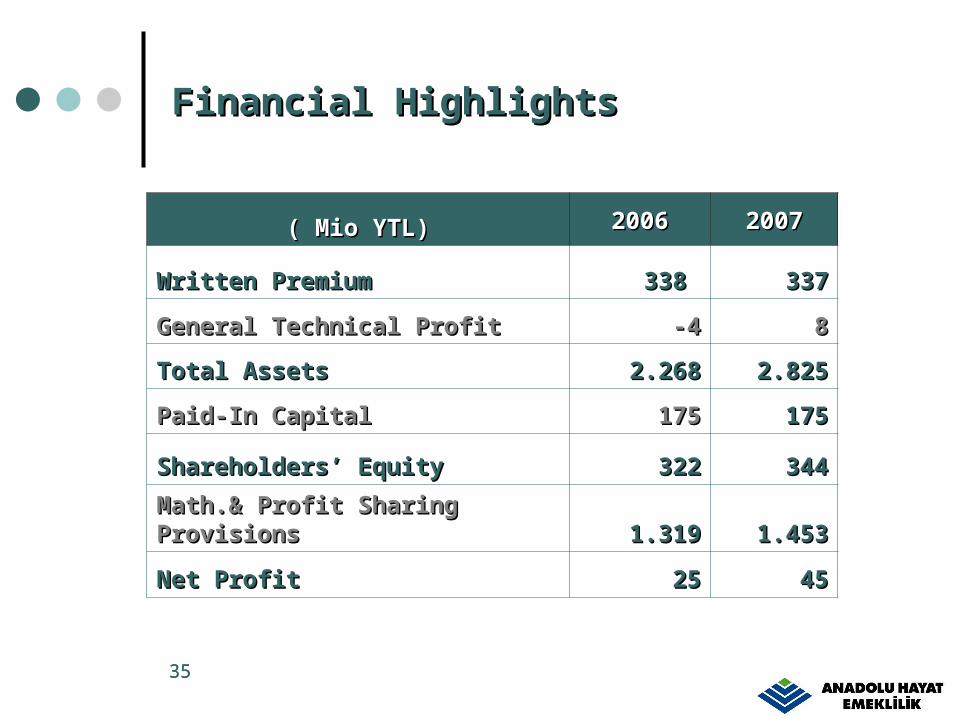
( Mio YTL)( Mio YTL) 20062006 20072007
Written Premium Written Premium 338 338 337337
General General Technical Profit Technical Profit -4-4 88
Total Assets Total Assets 2.2682.268 2.8252.825
Paid-In Capital Paid-In Capital 175175 175175
Shareholders’ Equity Shareholders’ Equity 322322 344344
MathMath.&.& Profit Sharing Profit Sharing ProvisionsProvisions 1.3191.319 1.4531.453
Net Net ProfitProfit 2525 4545
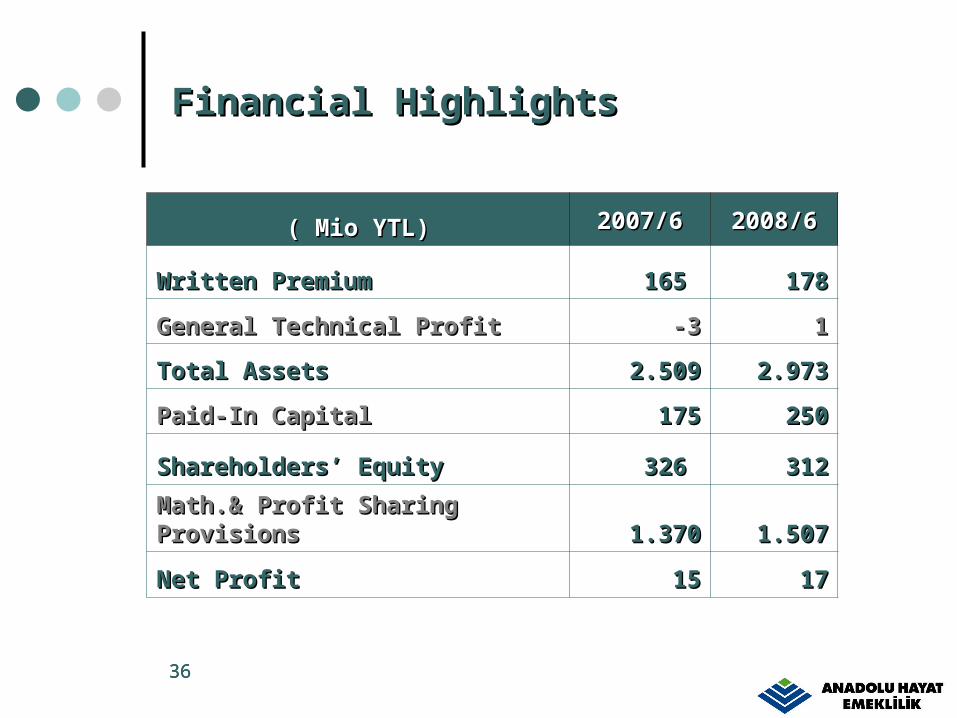
Financial HighlightsFinancial Highlights
363636
( Mio YTL)( Mio YTL) 2007/62007/6 2008/62008/6
Written Premium Written Premium 165 165 178178
General General Technical Profit Technical Profit -3-3 11
Total Assets Total Assets 2.5092.509 2.9732.973
Paid-In Capital Paid-In Capital 175175 250250
Shareholders’ Equity Shareholders’ Equity 326 326 312312
MathMath.&.& Profit Sharing Profit Sharing ProvisionsProvisions 1.3701.370 1.5071.507
Net Net ProfitProfit 1515 1717
Financial HighlightsFinancial Highlights
3737
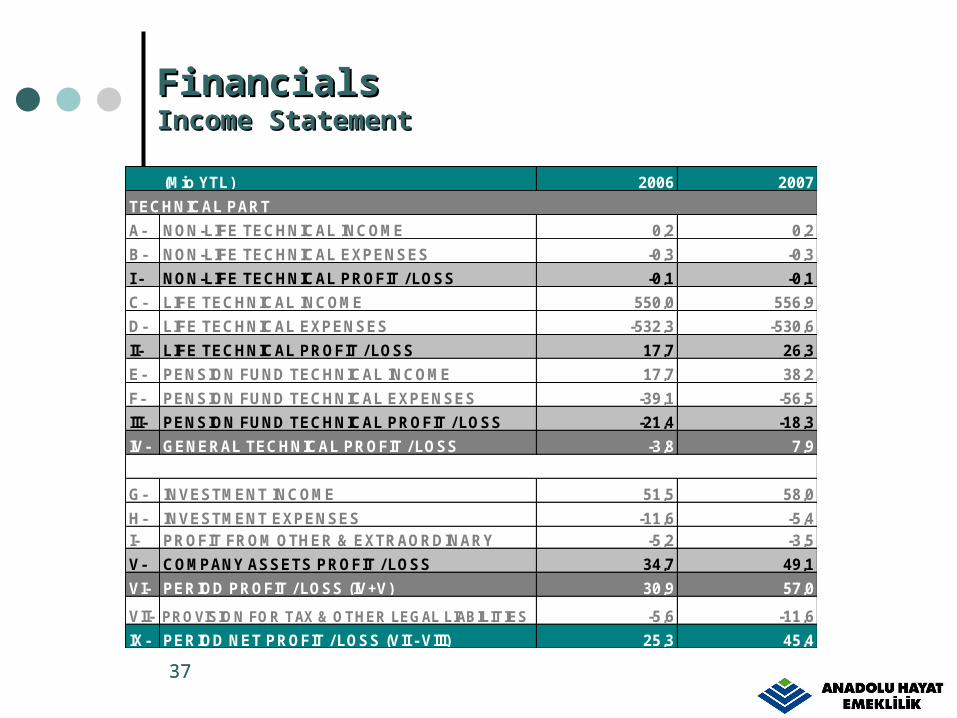
FinancialsFinancials Income StatementIncome Statement
2006 2007
A- 0,2 0,2
B- -0,3 -0,3
I - -0,1 -0,1
C- 550,0 556,9
D- -532,3 -530,6
II- 17,7 26,3
E- 17,7 38,2
F- -39,1 -56,5
III- -21,4 -18,3
IV- -3,8 7,9
G- 51,5 58,0
H- -11,6 -5,4I- -5,2 -3,5
V- 34,7 49,1
VI- 30,9 57,0
VII- -5,6 -11,6
IX- 25,3 45,4PERIOD NET PROFIT / LOSS (VII - VIII)
INVESTMENT INCOME
INVESTMENT EXPENSESPROFIT FROM OTHER & EXTRAORDINARY
PERIOD PROFIT / LOSS (IV+V)
PROVISION FOR TAX & OTHER LEGAL LIABILITIES
LIFE TECHNICAL EXPENSES
LIFE TECHNICAL PROFIT / LOSS
NON-LIFE TECHNICAL INCOME
LIFE TECHNICAL INCOME
(Mio YTL)
TECHNICAL PART
COMPANY ASSETS PROFIT / LOSS
PENSION FUND TECHNICAL INCOME
PENSION FUND TECHNICAL EXPENSES
PENSION FUND TECHNICAL PROFIT / LOSS
GENERAL TECHNICAL PROFIT / LOSS
NON-LIFE TECHNICAL PROFIT / LOSS
NON-LIFE TECHNICAL EXPENSES
383838
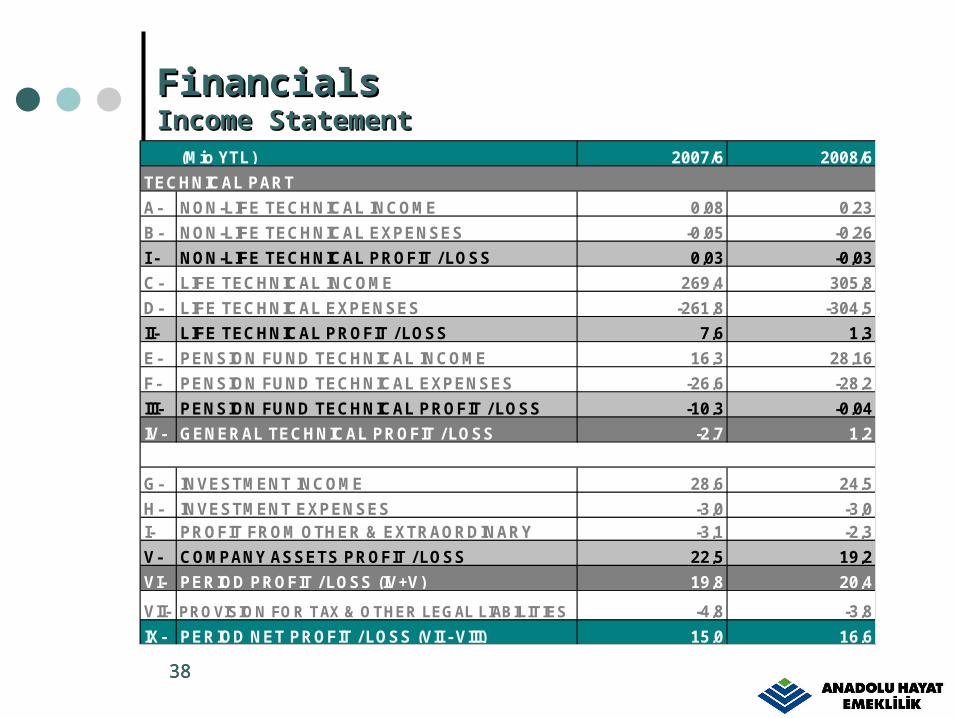
FinancialsFinancials Income StatementIncome Statement
2007/6 2008/6
A- 0,08 0,23
B- -0,05 -0,26
I - 0,03 -0,03
C- 269,4 305,8
D- -261,8 -304,5
II- 7,6 1,3
E- 16,3 28,16
F- -26,6 -28,2
III- -10,3 -0,04
IV- -2,7 1,2
G- 28,6 24,5
H- -3,0 -3,0I- -3,1 -2,3
V- 22,5 19,2
VI- 19,8 20,4
VII- -4,8 -3,8
IX- 15,0 16,6
NON-LIFE TECHNICAL INCOME
PROVISION FOR TAX & OTHER LEGAL LIABILITIES
(Mio YTL)
TECHNICAL PART
COMPANY ASSETS PROFIT / LOSS
PENSION FUND TECHNICAL INCOME
PENSION FUND TECHNICAL EXPENSES
PENSION FUND TECHNICAL PROFIT / LOSS
GENERAL TECHNICAL PROFIT / LOSS
NON-LIFE TECHNICAL PROFIT / LOSS
LIFE TECHNICAL INCOME
NON-LIFE TECHNICAL EXPENSES
LIFE TECHNICAL EXPENSES
LIFE TECHNICAL PROFIT / LOSS
PERIOD NET PROFIT / LOSS (VII - VIII)
INVESTMENT INCOME
INVESTMENT EXPENSESPROFIT FROM OTHER & EXTRAORDINARY
PERIOD PROFIT / LOSS (IV+V)
3939
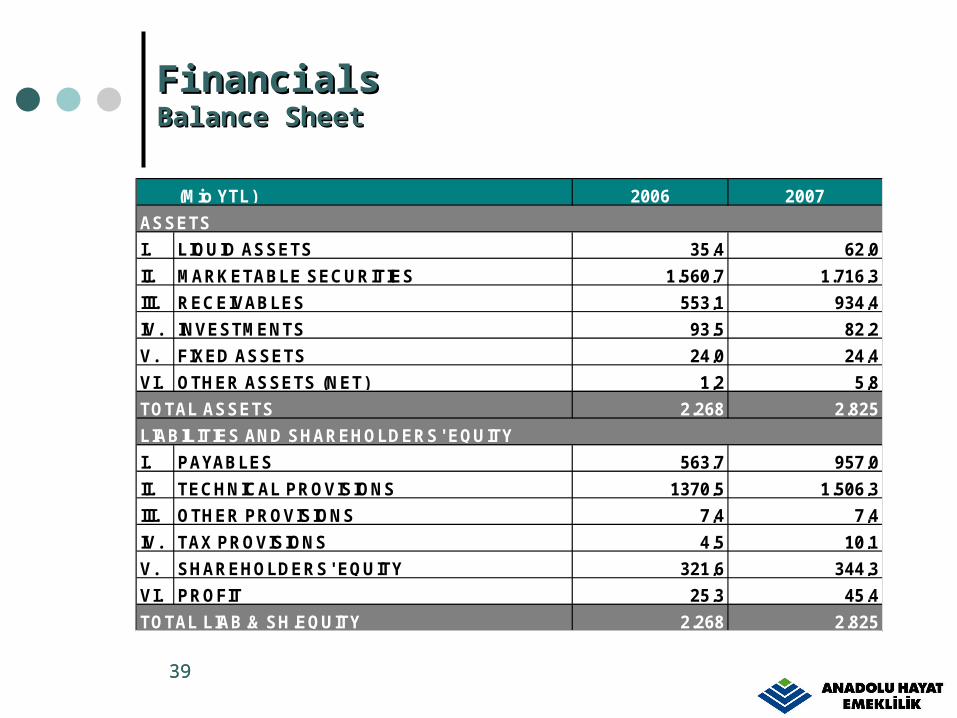
FinancialsFinancials Balance SheetBalance Sheet
2006 2007
I. 35,4 62,0
II. 1.560,7 1.716,3
III. 553,1 934,4
IV. 93,5 82,2
V. 24,0 24,4
VI. 1,2 5,8
2.268 2.825
I. 563,7 957,0
II. 1370,5 1.506,3
III. 7,4 7,4
IV. 4,5 10,1
V. 321,6 344,3
VI. 25,3 45,4
2.268 2.825
(Mio YTL)
ASSETS
TAX PROVISIONS
RECEIVABLES
INVESTMENTS
LIQUID ASSETS
LIABILITIES AND SHAREHOLDERS' EQUITY
PAYABLES
TECHNICAL PROVISIONS
OTHER PROVISIONS
SHAREHOLDERS' EQUITY
PROFIT
TOTAL LIAB.& SH.EQUITY
MARKETABLE SECURITIES
FIXED ASSETS
OTHER ASSETS (NET)
TOTAL ASSETS
404040
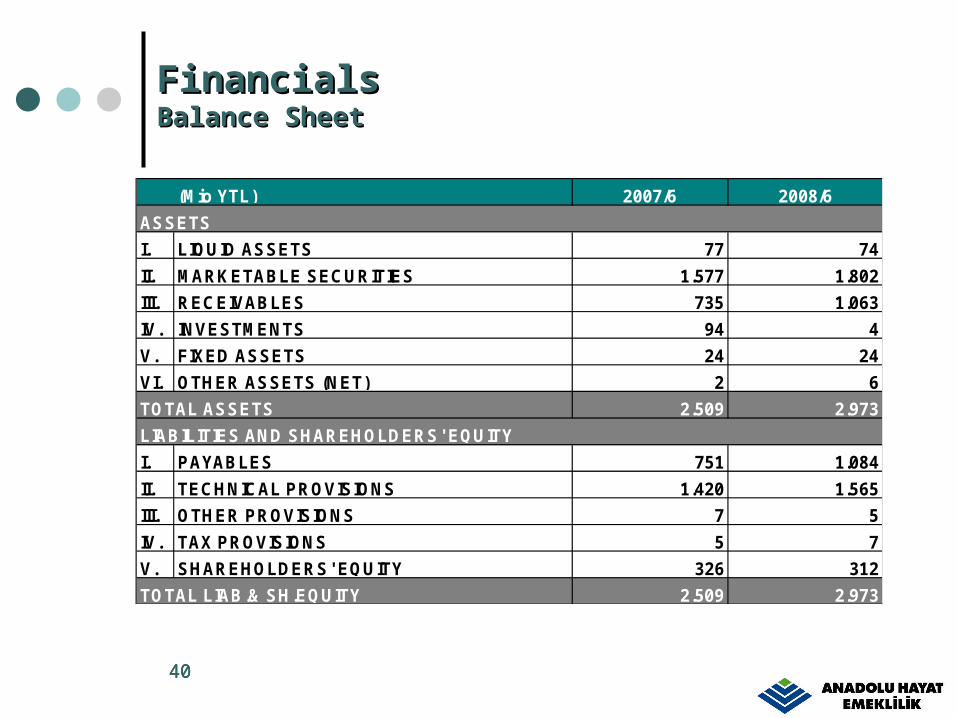
FinancialsFinancials Balance SheetBalance Sheet
2007/6 2008/6
I. 77 74
II. 1.577 1.802
III. 735 1.063
IV. 94 4
V. 24 24
VI. 2 6
2.509 2.973
I. 751 1.084
II. 1.420 1.565
III. 7 5
IV. 5 7
V. 326 312
2.509 2.973
(Mio YTL)
ASSETS
TAX PROVISIONS
RECEIVABLES
INVESTMENTS
LIQUID ASSETS
LIABILITIES AND SHAREHOLDERS' EQUITY
PAYABLES
TECHNICAL PROVISIONS
OTHER PROVISIONS
SHAREHOLDERS' EQUITY
TOTAL LIAB.& SH.EQUITY
MARKETABLE SECURITIES
FIXED ASSETS
OTHER ASSETS (NET)
TOTAL ASSETS

41
Corporate ProfileCorporate Profile
Lines of Business - Life & Pensions Lines of Business - Life & Pensions
FinancialsFinancials
Stock DataStock Data
42
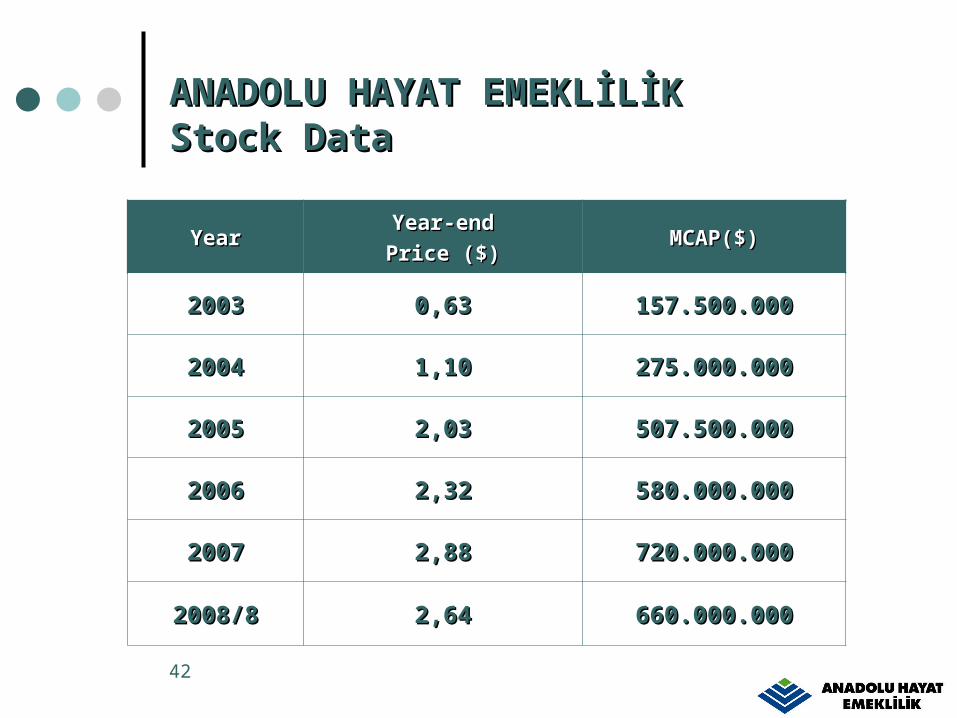
ANADOLU HAYAT EMEKLİLİKANADOLU HAYAT EMEKLİLİK Stock DataStock Data
YearYearYear-endYear-end
PricePrice ($) ($)MCAPMCAP($)($)
20032003 0,630,63 157.500.157.500.000000
20042004 1,101,10 275.000.000275.000.000
20020055 2,032,03 507.500.00507.500.0000
20062006 2,322,32 580.000.000580.000.000
20072007 2,882,88 720.000.000720.000.000
2008/82008/8 2,642,64 660.000.000660.000.000

43
THANK YOU…THANK YOU…