an overview of the 2008 stratosphere-troposphere analyses...
TRANSCRIPT
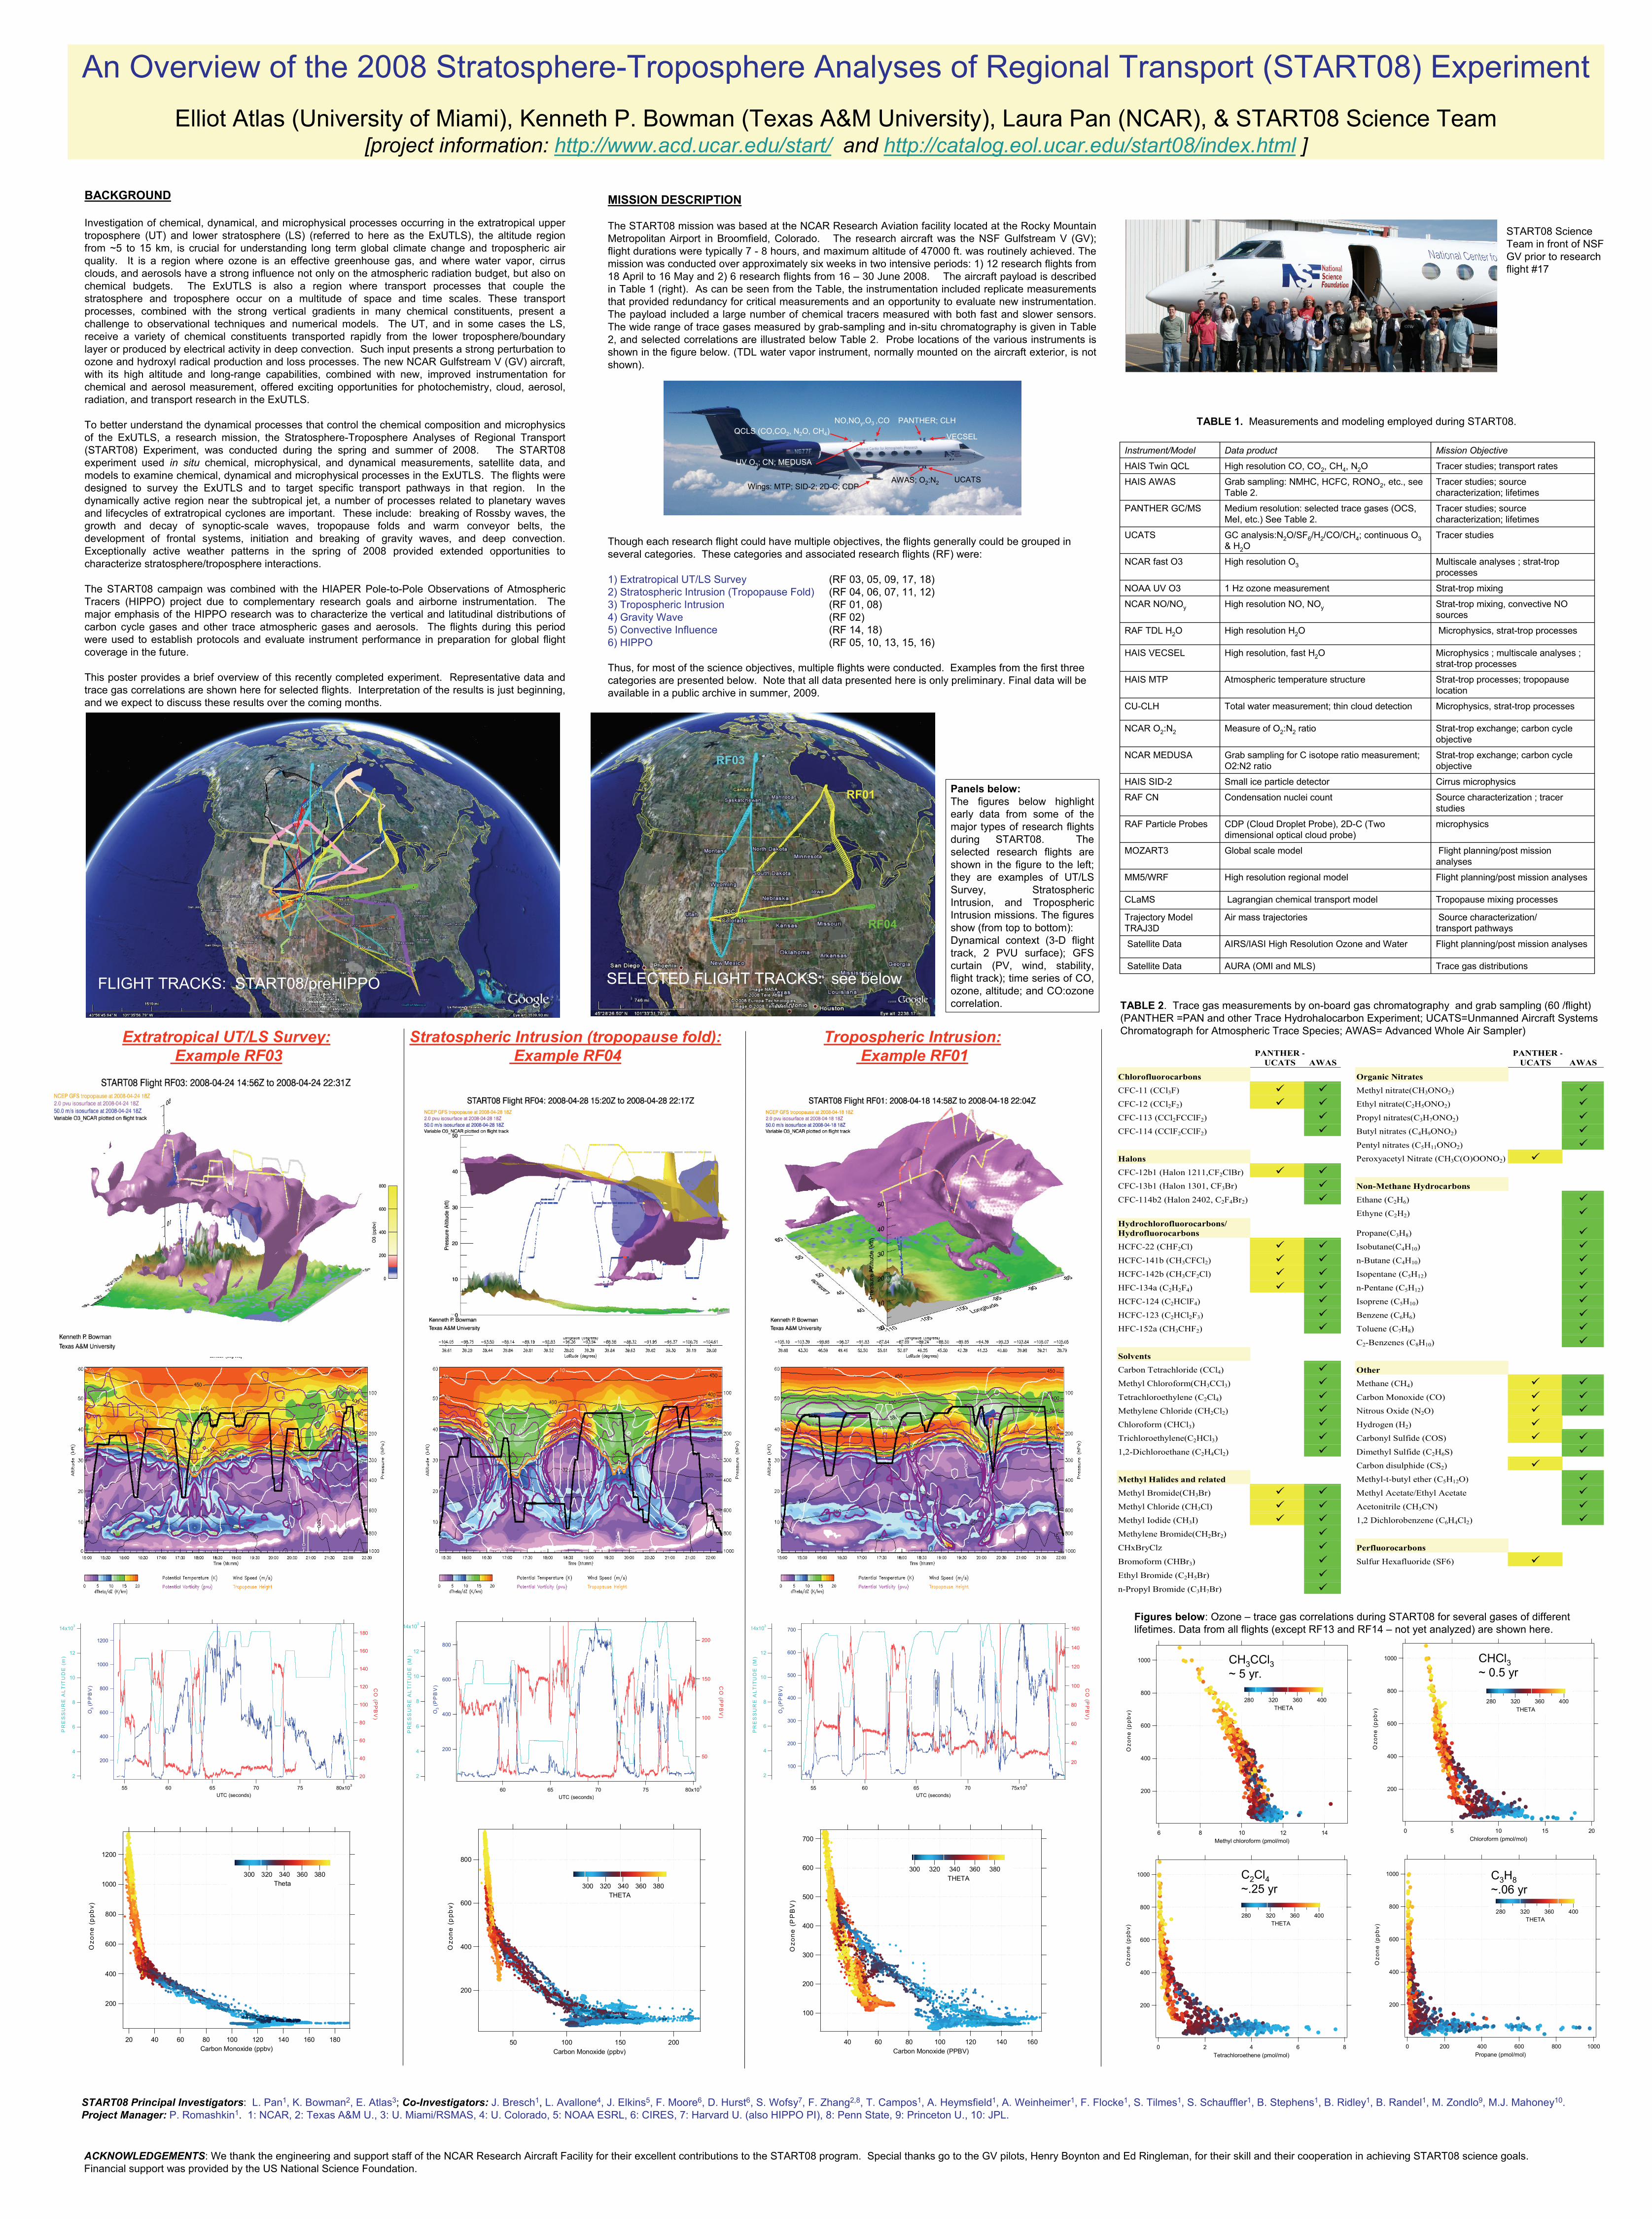
An Overview of the 2008 Stratosphere-Troposphere Analyses of Regional Transport (START08) Experiment
Elliot Atlas (University of Miami), Kenneth P. Bowman (Texas A&M University), Laura Pan (NCAR), & START08 Science Team[project information: http://www.acd.ucar.edu/start/ and http://catalog.eol.ucar.edu/start08/index.html ]
Trace gas distributionsAURA (OMI and MLS)Satellite Data
Flight planning/post mission analysesAIRS/IASI High Resolution Ozone and WaterSatellite Data
Source characterization/transport pathways
Air mass trajectoriesTrajectory ModelTRAJ3D
Tropopause mixing processesLagrangian chemical transport modelCLaMS
Flight planning/post mission analysesHigh resolution regional modelMM5/WRF
Flight planning/post mission analyses
Global scale modelMOZART3
microphysicsCDP (Cloud Droplet Probe), 2D-C (Two dimensional optical cloud probe)
RAF Particle Probes
Source characterization ; tracer studies
Condensation nuclei countRAF CN
Cirrus microphysicsSmall ice particle detectorHAIS SID-2
Strat-trop exchange; carbon cycle objective
Grab sampling for C isotope ratio measurement; O2:N2 ratio
NCAR MEDUSA
Strat-trop exchange; carbon cycle objective
Measure of O2:N2 ratioNCAR O2:N2
Microphysics, strat-trop processesTotal water measurement; thin cloud detectionCU-CLH
Strat-trop processes; tropopause location
Atmospheric temperature structureHAIS MTP
Microphysics ; multiscale analyses ; strat-trop processes
High resolution, fast H2OHAIS VECSEL
Microphysics, strat-trop processesHigh resolution H2ORAF TDL H2O
Strat-trop mixing, convective NO sources
High resolution NO, NOyNCAR NO/NOy
Strat-trop mixing1 Hz ozone measurementNOAA UV O3
Multiscale analyses ; strat-trop processes
High resolution O3NCAR fast O3
Tracer studiesGC analysis:N2O/SF6/H2/CO/CH4; continuous O3
& H2O UCATS
Tracer studies; source characterization; lifetimes
Medium resolution: selected trace gases (OCS, MeI, etc.) See Table 2.
PANTHER GC/MS
Tracer studies; source characterization; lifetimes
Grab sampling: NMHC, HCFC, RONO2, etc., see Table 2.
HAIS AWAS
Tracer studies; transport ratesHigh resolution CO, CO2, CH4, N2OHAIS Twin QCL
Mission ObjectiveData productInstrument/Model
BACKGROUND
Investigation of chemical, dynamical, and microphysical processes occurring in the extratropical upper troposphere (UT) and lower stratosphere (LS) (referred to here as the ExUTLS), the altitude region from ~5 to 15 km, is crucial for understanding long term global climate change and tropospheric air quality. It is a region where ozone is an effective greenhouse gas, and where water vapor, cirrus clouds, and aerosols have a strong influence not only on the atmospheric radiation budget, but also on chemical budgets. The ExUTLS is also a region where transport processes that couple the stratosphere and troposphere occur on a multitude of space and time scales. These transport processes, combined with the strong vertical gradients in many chemical constituents, present a challenge to observational techniques and numerical models. The UT, and in some cases the LS, receive a variety of chemical constituents transported rapidly from the lower troposphere/boundary layer or produced by electrical activity in deep convection. Such input presents a strong perturbation to ozone and hydroxyl radical production and loss processes. The new NCAR Gulfstream V (GV) aircraft, with its high altitude and long-range capabilities, combined with new, improved instrumentation for chemical and aerosol measurement, offered exciting opportunities for photochemistry, cloud, aerosol, radiation, and transport research in the ExUTLS.
To better understand the dynamical processes that control the chemical composition and microphysics of the ExUTLS, a research mission, the Stratosphere-Troposphere Analyses of Regional Transport (START08) Experiment, was conducted during the spring and summer of 2008. The START08 experiment used in situ chemical, microphysical, and dynamical measurements, satellite data, and models to examine chemical, dynamical and microphysical processes in the ExUTLS. The flights were designed to survey the ExUTLS and to target specific transport pathways in that region. In the dynamically active region near the subtropical jet, a number of processes related to planetary waves and lifecycles of extratropical cyclones are important. These include: breaking of Rossby waves, the growth and decay of synoptic-scale waves, tropopause folds and warm conveyor belts, the development of frontal systems, initiation and breaking of gravity waves, and deep convection. Exceptionally active weather patterns in the spring of 2008 provided extended opportunities to characterize stratosphere/troposphere interactions.
The START08 campaign was combined with the HIAPER Pole-to-Pole Observations of Atmospheric Tracers (HIPPO) project due to complementary research goals and airborne instrumentation. The major emphasis of the HIPPO research was to characterize the vertical and latitudinal distributions of carbon cycle gases and other trace atmospheric gases and aerosols. The flights during this period were used to establish protocols and evaluate instrument performance in preparation for global flight coverage in the future.
This poster provides a brief overview of this recently completed experiment. Representative data and trace gas correlations are shown here for selected flights. Interpretation of the results is just beginning, and we expect to discuss these results over the coming months.
MISSION DESCRIPTION
The START08 mission was based at the NCAR Research Aviation facility located at the Rocky Mountain Metropolitan Airport in Broomfield, Colorado. The research aircraft was the NSF Gulfstream V (GV); flight durations were typically 7 - 8 hours, and maximum altitude of 47000 ft. was routinely achieved. The mission was conducted over approximately six weeks in two intensive periods: 1) 12 research flights from 18 April to 16 May and 2) 6 research flights from 16 – 30 June 2008. The aircraft payload is described in Table 1 (right). As can be seen from the Table, the instrumentation included replicate measurements that provided redundancy for critical measurements and an opportunity to evaluate new instrumentation. The payload included a large number of chemical tracers measured with both fast and slower sensors. The wide range of trace gases measured by grab-sampling and in-situ chromatography is given in Table 2, and selected correlations are illustrated below Table 2. Probe locations of the various instruments is shown in the figure below. (TDL water vapor instrument, normally mounted on the aircraft exterior, is not shown).
Though each research flight could have multiple objectives, the flights generally could be grouped in several categories. These categories and associated research flights (RF) were:
1) Extratropical UT/LS Survey (RF 03, 05, 09, 17, 18) 2) Stratospheric Intrusion (Tropopause Fold) (RF 04, 06, 07, 11, 12)3) Tropospheric Intrusion (RF 01, 08)4) Gravity Wave (RF 02) 5) Convective Influence (RF 14, 18)6) HIPPO (RF 05, 10, 13, 15, 16)
Thus, for most of the science objectives, multiple flights were conducted. Examples from the first three categories are presented below. Note that all data presented here is only preliminary. Final data will be available in a public archive in summer, 2009.
TABLE 1. Measurements and modeling employed during START08.
START08 Science Team in front of NSF GV prior to research flight #17
PANTHER -
UCATS AWAS
PANTHER -
UCATS AWAS
Chlorofluorocarbons Organic Nitrates
CFC-11 (CCl3F) Methyl nitrate(CH3ONO2)
CFC-12 (CCl2F2) Ethyl nitrate(C2H5ONO2)
CFC-113 (CCl2FCClF2) Propyl nitrates(C3H7ONO2)
CFC-114 (CClF2CClF2) Butyl nitrates (C4H9ONO2)
Pentyl nitrates (C5H11ONO2)
Halons Peroxyacetyl Nitrate (CH3C(O)OONO2)
CFC-12b1 (Halon 1211,CF2ClBr)
CFC-13b1 (Halon 1301, CF3Br) Non-Methane Hydrocarbons
CFC-114b2 (Halon 2402, C2F4Br2) Ethane (C2H6)
Ethyne (C2H2) Hydrochlorofluorocarbons/ Hydrofluorocarbons
Propane(C3H8)
HCFC-22 (CHF2Cl) Isobutane(C4H10)
HCFC-141b (CH3CFCl2) n-Butane (C4H10)
HCFC-142b (CH3CF2Cl) Isopentane (C5H12)
HFC-134a (C2H2F4) n-Pentane (C5H12)
HCFC-124 (C2HClF4) Isoprene (C5H10)
HCFC-123 (C2HCl2F3) Benzene (C6H6)
HFC-152a (CH3CHF2) Toluene (C7H8)
C2-Benzenes (C8H10)
Solvents
Carbon Tetrachloride (CCl4) Other
Methyl Chloroform(CH3CCl3) Methane (CH4)
Tetrachloroethylene (C2Cl4) Carbon Monoxide (CO)
Methylene Chloride (CH2Cl2) Nitrous Oxide (N2O)
Chloroform (CHCl3) Hydrogen (H2)
Trichloroethylene(C2HCl3) Carbonyl Sulfide (COS)
1,2-Dichloroethane (C2H4Cl2) Dimethyl Sulfide (C2H6S)
Carbon disulphide (CS2)
Methyl Halides and related Methyl-t-butyl ether (C5H12O)
Methyl Bromide(CH3Br) Methyl Acetate/Ethyl Acetate
Methyl Chloride (CH3Cl) Acetonitrile (CH3CN)
Methyl Iodide (CH3I) 1,2 Dichlorobenzene (C6H4Cl2)
Methylene Bromide(CH2Br2)
CHxBryClz Perfluorocarbons
Bromoform (CHBr3) Sulfur Hexafluoride (SF6)
Ethyl Bromide (C2H5Br)
n-Propyl Bromide (C3H7Br)
TABLE 2. Trace gas measurements by on-board gas chromatography and grab sampling (60 /flight) (PANTHER =PAN and other Trace Hydrohalocarbon Experiment; UCATS=Unmanned Aircraft Systems Chromatograph for Atmospheric Trace Species; AWAS= Advanced Whole Air Sampler)
QCLS (CO,CO2, N2O, CH4)
UV O3; CN; MEDUSA
Wings: MTP; SID-2; 2D-C; CDP
NO,NOy,O3 ,CO PANTHER; CLH
VECSEL
AWAS; O2:N2 UCATS
Extratropical UT/LS Survey:Example RF03
Stratospheric Intrusion (tropopause fold):Example RF04
1200
1000
800
600
400
200
O3
(PP
BV
)
80x103
7570656055
UTC (seconds)
14x103
12
10
8
6
4
2
PR
ES
SU
RE
AL
TIT
UD
E (
m)
180
160
140
120
100
80
60
40
20
CO
(PP
BV
)
1200
1000
800
600
400
200
Oz
on
e (
pp
bv
)
18016014012010080604020Carbon Monoxide (ppbv)
380360340320300Theta
800
600
400
200
Oz
on
e (
pp
bv
)
20015010050Carbon Monoxide (ppbv)
380360340320300THETA
800
600
400
200
O3
(PP
BV
)
80x103
75706560
UTC (seconds)
200
150
100
50
CO
(PP
BV
)
14x103
12
10
8
6
4
2
PR
ES
SU
RE
AL
TIT
UD
E (
M)
700
600
500
400
300
200
100
O3
(PP
BV
)
75x103
70656055
UTC (seconds)
14x103
12
10
8
6
4
2
PR
ES
SU
RE
AL
TIT
UD
E (
M)
160
140
120
100
80
60
40
20
CO
(PP
BV
)
700
600
500
400
300
200
100
Oz
on
e (
PP
BV
)
160140120100806040Carbon Monoxide (PPBV)
380360340320300THETA
FLIGHT TRACKS: START08/preHIPPO
Tropospheric Intrusion:Example RF01
START08 Principal Investigators: L. Pan1, K. Bowman2, E. Atlas3; Co-Investigators: J. Bresch1, L. Avallone4, J. Elkins5, F. Moore6, D. Hurst6, S. Wofsy7, F. Zhang2,8, T. Campos1, A. Heymsfield1, A. Weinheimer1, F. Flocke1, S. Tilmes1, S. Schauffler1, B. Stephens1, B. Ridley1, B. Randel1, M. Zondlo9, M.J. Mahoney10. Project Manager: P. Romashkin1. 1: NCAR, 2: Texas A&M U., 3: U. Miami/RSMAS, 4: U. Colorado, 5: NOAA ESRL, 6: CIRES, 7: Harvard U. (also HIPPO PI), 8: Penn State, 9: Princeton U., 10: JPL.
ACKNOWLEDGEMENTS: We thank the engineering and support staff of the NCAR Research Aircraft Facility for their excellent contributions to the START08 program. Special thanks go to the GV pilots, Henry Boynton and Ed Ringleman, for their skill and their cooperation in achieving START08 science goals. Financial support was provided by the US National Science Foundation.
1000
800
600
400
200
Oz
on
e (
pp
bv
)
10008006004002000Propane (pmol/mol)
400360320280THETA
1000
800
600
400
200
Oz
on
e (
pp
bv
)
14121086Methyl chloroform (pmol/mol)
400360320280THETA
1000
800
600
400
200
Oz
on
e (
pp
bv
)
86420Tetrachloroethene (pmol/mol)
400360320280THETA
1000
800
600
400
200
Oz
on
e (
pp
bv
)
20151050Chloroform (pmol/mol)
400360320280
THETA
Figures below: Ozone – trace gas correlations during START08 for several gases of different lifetimes. Data from all flights (except RF13 and RF14 – not yet analyzed) are shown here.
CH3CCl3~ 5 yr.
CHCl3~ 0.5 yr
C2Cl4~.25 yr
C3H8~.06 yr
Panels below: The figures below highlight early data from some of the major types of research flights during START08. The selected research flights are shown in the figure to the left; they are examples of UT/LS Survey, Stratospheric Intrusion, and Tropospheric Intrusion missions. The figures show (from top to bottom): Dynamical context (3-D flight track, 2 PVU surface); GFS curtain (PV, wind, stability, flight track); time series of CO, ozone, altitude; and CO:ozonecorrelation.
SELECTED FLIGHT TRACKS: see below
RF01
RF03
RF04