an open source modeling framework for interdependent ... · interdependent...
TRANSCRIPT

X. Lu, K. Hinkelman, Y. Fu, J. Wang, W. Zuo, Q. Zhang, W. Saad 2019. “AnOpen Source Modeling Framework for Interdependent Energy-Transportation-Communication Infrastructure in Smart and Connected Communities.” IEEEAccess, 7, pp. 55458-55476. DOI: 10.1109/ACCESS.2019.2913630
An Open Source Modeling Framework for
Interdependent Energy-Transportation-
Communication Infrastructure in Smart and
Connected Communities
Xing Lu1, Kathryn Hinkelman1, Yangyang Fu1, Jing Wang1, Wangda Zuo1,2,Qianqian Zhang3, Walid Saad3
1 Department of Civil, Environmental and Architectural Engineering, University of Colorado, Boulder, CO80309 USA 2 National Renewable Energy Laboratory, Golden, CO 80401 USA 3 Wireless@VT, Electricaland Computer Engineering Department, Virginia Tech, Blacksburg, VA 24061 USA
Corresponding author: Wangda Zuo (e-mail: [email protected]).
Abstract
Infrastructure in future smart and connected communities is envisioned as an aggregate of public ser-vices, including energy, transportation, and communication systems, all intertwined with each other.The intrinsic interdependency among these systems may exert underlying influence on both design andoperation of the heterogeneous infrastructures. However, few prior studies have tapped into the interde-pendency among these systems in order to quantify their potential impacts during standard operation.In response to this, this paper proposes an open source, flexible, integrated modeling framework suitablefor designing coupled energy, transportation, and communication systems and for assessing the impactof their interdependencies. First, a novel multi-level, multi-layer, multi-agent approach is proposed toenable flexible modeling of the interconnected systems. Then, for the framework’s proof-of-concept, pre-liminary component and system-level models for different systems are designed and implemented usingModelica, an equation-based object-oriented modeling language. Finally, three case studies of gradu-ally increasing complexity are presented (energy, energy + transportation, energy + transportation +communication) to evaluate the interdependencies among the three systems. Quantitative analyses showthat the deviation of the average velocity on the road can be 10.5% and the deviation of the power drawfrom the grid can be 7% with or without considering the transportation and communication system atthe peak commute time, indicating the presence of notable interdependencies. The proposed modelingframework also has the potential to be further extended for various modeling purposes and use cases,such as dynamic modeling and optimization, resilience analysis, and integrated decision making in futureconnected communities.
Keywords: Communities; Interconnected systems; Modelica; Modeling; Multi-infrastructure systems; Ob-ject oriented methods; Open source software
1 Introduction
Urbanization has become a mega-trend in the world today [1]. The resulting large population in urbancommunities will exert tremendous pressure on existing infrastructure. To mitigate this issue, the concept
1

of smart and connected communities has recently been proposed in which new and green technologies areembraced collectively to deliver essential services, including power, mobility, and connection [2].
Air Conditioning
Household Appliances
Electric heating
CommercialBuildings
Centralized HVAC
Lighting system
Communication System
Residential Buildings
Autonomous electrical vehicle
Hydro
Thermal
Wind Park
Solar Panel
Energy Storage
Communication Flux
Transportation network
Energy Flow
Transportation System
Energy System
Communication Tower
Wireless Signal
Charging Station
Figure 1: A vision of different infrastructure systems in future connected communities.
Fig. 1 shows our vision of future smart and connected communities. These connected communities willinclude three key infrastructure systems: energy, transportation, and communication infrastructure. Theenergy system includes different heterogeneous components such as increasing renewable energy resources,buildings as virtual batteries, as well as massive adoption of electric vehicles (EVs). The transportationsystem is also expected to undergo an unprecedented evolution due to the shift toward full electrificationand autonomous vehicles [3–5]. The communication system will become an indispensable enabler to supportthe aforementioned infrastructure systems, link various system components, and coordinate the operationalsequences [6, 7].
Infrastructure interdependency involves a bidirectional relationship between systems in which the stateof each system is dependent on and intertwined with the other. For a simple example, communicationnetworks need power from the electric grid to function, while the electric grid needs the communicationnetworks to dispatch generation facilities according to the demands. With these codependent relationships,disturbances and capacity stresses on one system can affect the other, potentially creating a cascading effectthat compromises the systems’ operations.
Today, these interdependencies are most often felt in critical infrastructure systems (CIS) – which includeenergy, transportation, and communication systems, among many others. It is well proven that CIS areindeed highly intertwined and codependent [8–10]. In the future, increased electrification and connectiv-ity will further complicate these interconnections, as demonstrated in Fig. 1. To date, interdepenedencymodeling primarily focuses on averting potentially catastrophic failures and minimizing the risks of futurefailures. This is justly so; while these interdependencies today often go unnoticed in their typical operation,they effectively aggravate and compound system failures when subjected to various stresses (such as cyberattacks, congestion, and natural disasters). In the near future, it is likely that infrastructure vulnerabilitieswill become increasing present in day-to-day operations due to their deeply crosslinked nature.
2

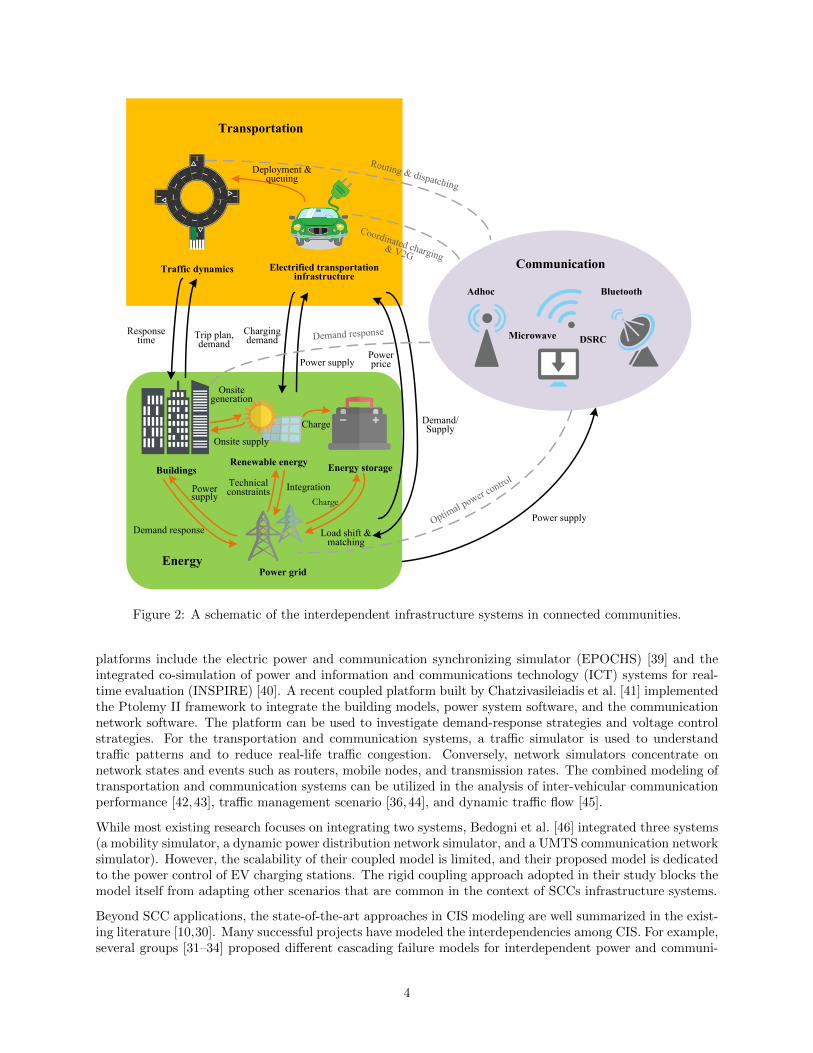
Due to the inherent complexities in future SCC infrastructure, we reorganize the sophisticated and elusiverelationships in Fig. 1 into Fig. 2, which illustrates the interaction among the different systems considered.The interdependencies exist both within and between systems and present themselves on several levels,which are commonly classified under four types: (1) physical, meaning the state of one system depends onthe material output(s) of the other, and vice versa; (2) cyber, meaning there is information exchange betweenthe systems; (3) geographic, meaning the infrastructure components are in close spatial proximity with eachother; and (4) logical, meaning there is a different mechanism (e.g. policy, legal, or regulatory regime) thatlogically ties the infrastructure systems. A physical interdependency example is in the electricity exchangebetween transportation and energy systems, where EVs take electricity from the grid while charging, butthey are can provide ancillary services with their large storage capacities and quick discharging abilities [11].Further, a logical interdepenency arises when the utility company increases the electricity price due to risingcharging demand, which in turn affects the drivers’ charging patterns and the traffic condition [12]. Onthe cyber level, the quality of the supporting communication services affects the transportation and energysystems (shown as the dashed lines). In the transportation system, communication services enable vehiclerouting, dispatching, coordinated charging, and the implementation of vehicle-to-grid interaction. Theseinterdependencies indicate a need to consider multiple infrastructure systems when operating future SCCs.To this end, modeling and simulation is an effective method where these complex, multilevel interactionsamong several infrastructure systems can be studied [13].
1.1 Prior Works
One cost-effective way to evaluate the integrated infrastructure systems in a connected community is throughcomputer-aided modeling. The existing community modeling approaches can be grouped into two types:discipline-specific modeling and integrated modeling. The discipline-specific modeling of community infras-tructures has been well-developed over the past decades and numerically dedicated to particular purposesof urban building energy modeling [14–17], urban mobility modeling [18–22], and communication networksimulation [23–25]. Urban building energy models are targeted at predicting the energy use in a community,which is a relatively nascent field [14]. For the urban mobility simulation, Multi-Agent Transport Simulation(MATSim), Simulation of Urban Mobility (SUMO), and Transportation Analysis and Simulation Systemare the three mainstream, open source simulators to conduct transportation analysis and dynamic trafficassignment [26]. In the context of communication network modeling in the interconnected infrastructuresystems, ns2/ns3 [23] and OMNeT++ [24] are widely used due to their open source nature. Althoughthe discipline-specific modeling can provide accurate and efficient results for the phenomenon of interest,its functionality deteriorates when it comes to the interdependent infrastructure systems due to significantsimplifications [27].
In contrast, integrated modeling approaches are more suited for the interdependent infrastructure systems.Several modeling techniques have been adopted, including agent-based modeling, input-output models, net-work based approaches, and system dynamics. Some recent works [28,29] considered mathematical modelingof interdependent infrastructure; however, these simplified numerical simulations have limited capabilitiesin modeling real-world SCCs. To achieve a higher fidelity, specialized software packages that use validatedmodel libraries and tailor-made solvers are coupled by a certain orchestration mechanism. Table 1 showsa non-exhaustive list of the references that model energy, transportation, and communication systems andtheir interdependencies. Details in terms of the platforms, simulators, use cases, and open source statusesare also included.
For SCC applications, most of the related works have focused on the integration of two systems and utilizedproprietary integrated modeling tools. Coupling the energy and transportation systems, Farid [37] proposeda modeling framework using graph theory and petri-net models to assess the effects of transportation-electrification. Su et al. [38] coupled the OpenDSS and DYNASMART to evaluate the potential impacts ofelectric vehicle charging at the feeder level. However, these studies do not simulate the detailed communi-cation processes and control management, in which the energy, transportation, and communication systemsare coupled. For the energy and communication systems, profound efforts have been made to couple con-tinuous power system simulators with discrete communication network simulators. The typical simulation
3
Traffic dynamics Electrified transportationinfrastructure
Transportation
Communication
BuildingsRenewable energy
Power grid
Energy storage
Energy
Demand response
Power supply
IntegrationTechnicalconstraints
Charge
Load shift & matching
Charge
Onsite generation
Onsite supply
Deployment & queuing
Adhoc
Microwave
Bluetooth
DSRCResponse
time Trip plan,demand
Charging demand
Power supply
Power supply
Demand/Supply
Power price
Figure 2: A schematic of the interdependent infrastructure systems in connected communities.
platforms include the electric power and communication synchronizing simulator (EPOCHS) [39] and theintegrated co-simulation of power and information and communications technology (ICT) systems for real-time evaluation (INSPIRE) [40]. A recent coupled platform built by Chatzivasileiadis et al. [41] implementedthe Ptolemy II framework to integrate the building models, power system software, and the communicationnetwork software. The platform can be used to investigate demand-response strategies and voltage controlstrategies. For the transportation and communication systems, a traffic simulator is used to understandtraffic patterns and to reduce real-life traffic congestion. Conversely, network simulators concentrate onnetwork states and events such as routers, mobile nodes, and transmission rates. The combined modeling oftransportation and communication systems can be utilized in the analysis of inter-vehicular communicationperformance [42,43], traffic management scenario [36,44], and dynamic traffic flow [45].
While most existing research focuses on integrating two systems, Bedogni et al. [46] integrated three systems(a mobility simulator, a dynamic power distribution network simulator, and a UMTS communication networksimulator). However, the scalability of their coupled model is limited, and their proposed model is dedicatedto the power control of EV charging stations. The rigid coupling approach adopted in their study blocks themodel itself from adapting other scenarios that are common in the context of SCCs infrastructure systems.
Beyond SCC applications, the state-of-the-art approaches in CIS modeling are well summarized in the exist-ing literature [10,30]. Many successful projects have modeled the interdependencies among CIS. For example,several groups [31–34] proposed different cascading failure models for interdependent power and communi-
4

Table 1: State-of-the-art of integrated models for energy, transportation, and communication infrastructure.
Energy & Transportation
Model nameSimulation tools
Use cases Open SourceEnergy Transportation
NA [36] In-house codes Power flow and travel cost optimization UnknownNA [37] In-house codes Transportation-energy nexus assessment UnknownNA [38] OpenDSS DYNASMART Impact of EVs at the distribution feeder level Unknown
NA [51] MATPowerClean Mobility
SimulatorPower system safety; transportation
performance assessmentFull
NA [52] DIgSILENT PowerFactory MATSim, EVSim Charging strategy assessment; V2G Partial
NA [53] EMTP-rv SUMOCharging strategy assessment; Complex
network planningPartial
Energy & Communication
Model nameSimulation tools
Use cases Open SourceEnergy Communication
EPOCHS [39] PSCAD, PSLF ns-2 Multi-agent protection and control systems Partial
INSPIRE [40] PowerFactory OPNETWide-area monitoring, protection, and
control (WAMPAC) in high voltage gridPartial
VirGIL [41]Energyplus, Dymola,
DigSILENT PowerFactoryOMNeT++ Demand response; Vol/var control Partial
Gridspice [54] GridLab-D, MATPOWER SimplifiedTransimission and distribution system;
Demand side management/Demand responsePartial
NA [55] PSCAD/EMTDC OPNET WAMPAC in high voltage grid PartialNA [56] Simulink, JADE OMNeT++ WAMPAC in middle voltage grid Partial
Transportation & Communication
Model nameSimulation tools
Use cases Open SourceTransportation Communication
Veins [42] SUMO OMNeT++Inter-vehicular communications
performance evaluationFull
VNS [43] DIVERT 2.0 ns-3Inter-vehicular communications
performance evaluationFull
HINT [44] SUMO ns-3 Traffic management scenario analysis FullVSimRTI [45] SUMO/VISSIM OMNeT++, ns-3 Dynamic traffic flow simulation PartialiTETRIS [57] SUMO OMNeT++ Largescale vehicular network simulation Full
NA [58,59] In-house codes Vehicle routing algorithm analysis Unknown
NA: Not applicable; Partial: Partial simulators are open source; Full: All thesimulators are open source; Unknown: The open source status is unknown.
5

cation networks. Similarly, Heracleous et al. [35] developed hybrid automata models for the interdependentpower, water, and communication infrastructures. While related, interdependency modeling for CIS maynot be extensible to study SCCs during typical operation. Interdependent CIS models are often built tounderstand how these complex, interdependent systems will respond to disruptions and changing conditions.As such, their simulation goal is not to produce an “exact” outcome, but to illustrate possible outcomes toinform urban planning and design. By contrast, the underlying dynamics and model fidelity are crucial inthe SCC modeling case, where the intention is to study use cases for typical operation.
The above literature review demonstrates that discipline-specific modeling for SCCs usually specializes inan isolated system and simplifies or even neglects the interdependencies among other systems. Meanwhile,integrated modeling does consider the interdependencies; however, the existing models are often limited bytheir proprietary nature and two-system focus. Furthermore, interdependency modeling in CIS applicationsis well developed but may not be fully extendable to studying SCC operational cases. Therefore, it isimportant to have an open source modeling framework that can cover different operational scenarios of theentire infrastructure. This is particularity important because the reactions to events in a single system mayspread across multiple systems due to the interdependencies present [47].
1.2 Contributions
In response to the aforementioned limitations of current modeling of infrastructure systems, the main contri-bution of this paper is to develop an open source, flexible, and extensible modeling framework for studyinginterdependent energy, transportation, and communication infrastructures during typical SCC operation.The open source model can be found at https://www.colorado.edu/lab/sbs/scc-library. We propose a novelmulti-level, multi-layer, multi-agent approach to enable flexible modeling of the three interconnected systemsof energy, transportation, and communication. The proposed framework is then implemented on Modelica-based modeling platforms [48–50], which provides important features like objected-oriented, acausal modelingand equation-based schemes. In addition, we develop various component and system-level models for energy,transportation, and communication systems. The objective of these models is to demonstrate the applicationof the proposed framework; therefore, the interdependency and system models are selected to adequatelytest the framework while minimizing complexities at the current stage. To the best of our knowledge, thisis one of the first attempts to couple all the three energy, transportation, and communication systems in aflexible and scalable way to evaluate and quantify the underlying interdependencies of their infrastructuresfor SCCs.
The rest of the paper is organized as follows. Section 2 presents the proposed smart community modelingframework based on the multi-level, multi-layer, multi-agent (3M) approach for coupling multiple infrastruc-ture systems. Section 3 introduces the Modelica implementation of the proposed modeling framework as wellas various component and system models in Modelica. Section 4 presents three case studies to demonstratethe application scenarios of the modeling framework and the measurable interrelations among the threesystems. Finally, concluding remarks are presented in Section 5.
2 Multi-layer, Multi-block, Multi-agent Approach
This study proposes a 3M approach for the flexible and extensible modeling of the coupled systems in acommunity level. This generalized modeling approach can be adapted to different scenarios and use casesin the design and operation of SCCs. The modular nature of the 3M approach allows various system combi-nations to be studied (two-system models, three-system model, and so forth). Furthermore, the generalized,adaptable framework can readily accept a variety of other component models along with their dependencyinterconnections to evaluate many dynamic systems. In this section, we use the three-coupled system toillustrate the modeling approach.
Fig. 3 illustrates the principle of the proposed 3M approach. The multi-layer represents a hierarchical
6

structure, which consists of a community layer, a block layer, and a system agent layer from the top level tothe bottom. At the community layer, the entire community will be divided into several functional blocks,such as residential blocks, commercial blocks, industrial blocks, or mixed-functional blocks. It could also bedivided according to domain-specific entities, such as distinct power distribution networks. The block layerhas three system agents for the energy, transportation, and communication systems. Different infrastructuresystems should be mapped accordingly in one block. Within each system agent (system agent level), therewill be individual subagents for infrastructure nodes. For instance, an energy system agent could havesubagents for renewable generation, batteries, and utility customers. Likewise, the transportation systemagent could have subagents for connected roads, charging stations, and vehicles. The communication systemagent could consist of different communication devices (control centers, backbone routers) according to thedifferent types of communication networks (e.g. cellular/LTE, WiFi, or PLC).
We next illustrate the interdependencies and data exchange between these agents and blocks in a bottom-upfashion. At the system agent layer, multiple agents could exchange data through certain interfaces. Asshown in Fig. 3, the interdependencies can be physical, cyber, or logical, and both internal and externaldependencies are present. In the energy domain, the different components will communicate with each otherto achieve stable and economic operations of the power grid. For example, in a demand response application,the electricity demand of each customer can be properly rescheduled via the communication network to reducethe peak demand between the power grid and its customers. While in the transportation domain, differentcomponents will also interact with each other to achieve a good traffic condition. For example, the queuingand power availability information in the charging stations and the routing information could be broadcastto the vehicles for optimal routing and charging arrangements. The aforementioned connections are the innerdata exchanges in each domain. To ensure a collective optimal operation of the energy and transportationdomains, the agents from the energy system will calculate the electricity price under different load profilesand trigger the necessary power controls of the charging stations. In response to this, the transportationagents will calculate the traffic condition, decide the routing and charging behavior of electric vehicles, anddetermine the charging load of each charging station node. In this system agent layer, we could select theneeded component model according to the use cases.
At the block layer, we encapsulate all the component models from the system agent layer and merge the differ-ent communication centers into one communication system agent, which would calculate the communicationlatency among the different components. The generalized data exchange between different system agentsare propagated from the data exchange in the system agent layer. The energy system agent will transferpower from the grid to charge the EVs (physical) and send the packets for the power system control throughthe communication system agent (cyber). The communication simulators within the communication systemagent will then return the control events (cyber) to the energy system agent. Likewise, the transportationsystem agent will send the packets for navigation purpose to the communication system agent (cyber), andit will receive the routing events from the communication system agent (cyber). Lastly, the energy systemand transportation system agents will exchange the control/price signal and the charging demand via thecommunication agent (logical). Note that the aforementioned generalized dependencies could be specializedby different use cases, which should be aligned with the system agent layer.
In the community layer, the different blocks are linked with each other through the corresponding ports. Thepower port links the energy system agents in different blocks to a power grid network, and the traffic portlinks the transportation system agents in different blocks to a road network. The communication systemagents will communicate in a larger network, and the information will be collected and scattered in a largescale communication center or in distributed hubs. In future SCCs, the roads and the power lines could alsobe a communicative component in this layer.
The proposed 3M approach allows the flexible and extensible modeling of multiple infrastructures. Themodeler could save efforts by using this standardized and generalized approach since the interfaces and thedata exchange ports from the upper layer are fixed. As such, only the component models in the lower layerrequire designing and refinement. The proposed modeling framework facilitates the model reuse and canbe used to investigate different use cases in the design and operation of SCCs. In the next section, we willintroduce our efforts to designing and modeling preliminary multi-infrastructure systems in order to test andvalidate the 3M approach.
7

City Layer
Community Block Layer
System Agent Layer
C
C
TE
Block C
Block BBlock A
Power Lines
CommunicativeRoads
Transmission
Block A Block C
Renewable energy generation Distribution Storage Consumption
Charging infrastructure
Road/Vehicles
Price / Control signal
Charging demand
Packets for control
Packets for navigation
Multi Block
Multi Layer
Control events
TRouting events
E
Charging demand Price/Control signal
C
TE
Block B
Multi Agent
Road NetworkGrid Network
Communication Network
Physical
Cyber
Logical
Power
Power
TE
Figure 3: A schematic of the 3M approach for modeling coupled systems.
3 Model Description and Implementation
Using the proposed 3M approach, we implement the coupled models in Modelica, an object-oriented modelinglanguage. Section 3.1 illustrates the implementation of system agent models of the energy, transportation,and communication systems. Sections 3.2 and 3.3 discuss the implementation of block layer and communitylayer models, respectively.
8

3.1 System Agent Model
3.1.1 Energy System
The energy system is composed of renewable generation equipment (e.g. photovoltaic (PV) panels and windturbines), energy storage devices, power draw from the grid, and distribution systems. The feeders of thedistribution system connect various types of loads, such as the load from buildings, EVs, communicationtowers, and general loads in the power grid. Fig. 4 shows the Modelica implementation of the energysystem. The following subsections describe the detailed description and implementation of different energycomponent models.
sup
disSys
batBan
Renewable energy generation
Distribution system
Energy storage
Diagram
IconLoad Input
From grid power
Weather data
Figure 4: Implementation of the energy system models in Modelica.
Renewable Energy GenerationIn this paper, we assume renewable energy generation consists of energy supplied from PV and wind turbines.The PV system is modeled with the PV SimpleOriented model in the Modelica Buildings Library. The totalaggregated electrical power PPV generated by the PV systems is represented by:
PPV =
NPV∑k=1
(Ak · fact,k · ηk ·Gk · ηDCAC,k) (1)
where NPV is the total number of PV arrays, A is the area of each PV array, fact is the fraction of theaperture area, η is the PV efficiency, G is the total solar irradiation, and ηDCAC is the efficiency of theconversion between direct current (DC) and alternating current (AC). In this model, G is the sum of directirradiation GDir and diffuse irradiation GDif:
G = GDir +GDif (2)
GDir = max(0, cos(θ) ·HDirNor) (3)
GDif = GSkyDif +GGroDif (4)
where θ is the solar incidence angle on the surface, and HDirNor is the direct normal radiation. GSkyDif
and GGroDif are the hemispherical diffuse solar irradiation on a tilted surface from the sky and the ground,respectively.
The WindTurbine model in the Buildings library is adopted for wind turbines. For a single turbine, themodel computes generated power Pt as a function of the wind speed. The aggregated active electrical power
9

generated by all the wind turbines Pwin is calculated as:
Pwin =
Nwin∑k=1
(Pt,k · scalek · ηDCAC win,k) (5)
where scale is used to scale the wind power generation based on the Pt; Nwin is the total number of windturbines; and ηDCAC win is the rate of conversion from DC to AC.
Energy StorageA new energy storage model is built based on the Electrical.AC.OnePhase.Sources.Battery model in theBuildings library, since the base model does not enforce that the state of charge is between zero and one.The new model provides a control sequence such that only a reasonable amount of power is exchanged. Thenew model and corresponding control sequence are shown in Fig. 5. The control logic here is that the powergenerated by the renewable system covers the demand load in the first place. When there is excessive power,the battery starts to charge. When the power demand exceeds a certain threshold, the battery starts todischarge. In other cases, the battery remains stand-by.
Icon
Diagram
From grid power
Control sequence
Battery
Charging mode controller
Figure 5: Diagram of Modelica models for energy storage and its control logic.
Power Distribution NetworkDifferent configurations of power distribution networks are built in the energy system agent model. Thesenetworks can be used to investigate the performance of power distribution systems. Fig. 6 shows the IEEE16-node test feeder configuration [60] and its implementation in Modelica.
Different types of loads (buildings, EVs, general, and communication components) are connected to thefeeders. The loads from buildings can be calculated using grey-box models such as RC models [61] orimported by data-driven models [62]. The aggregated EV charging power PEV is calculated as follows:
PEV =
Nchar∑k=1
Pchar,k (6)
where Nchar is the total number of the charging EVs in (12), and Pchar,k is the charging power of each EV.As a demonstration case, the current paper assumes Pchar is constant for all EVs [63]. The total load fromall of the communication towers Pcom is given by [64]:
Pcom =
Ncom∑k=1
(2Qc,k · Eelec,k +Qc,k · εelec,k · dαk ) (7)
where Ncom is the number of communication towers, Eelec is the equipment power for sending and receivingpackets, Qc is the packet throughput, d is the distance of the transmission, and α and εelec are transmissioncoefficients.
10

lin1
lin3
lin2
lin4
lin14
lin8
lin16 lin13
lin9
lin5
lin6lin7
lin15
lin11
lin10
lin12
4
6
5 11 12
8
9
10 14
13
15
(a)
(b)
Load input
EV load
Building load
Communication load
From grid power
Figure 6: The IEEE 16-node test feeder configuration: (a) System schematic and (b) Modelica Implementa-tion.
Power Draw from the GridWe use the Electrical.AC.OnePhase.Sources.Grid model in the Buildings library to create the physics-basedmodel for the utility supplied power [65]. The input for this model is a fixed voltage signal while the outputis the power supplied by the utility to the power distribution system. The convention is that the power ispositive if real power is consumed from the grid and negative if power flows back into the grid.
3.1.2 Transportation System
Traffic flow is intrinsically non-reproducible; it is therefore impossible to predict precise vehicle trajectories viamodels. However, it is recognized that the prediction of large-scale field quantities can be possible [66]. Thetraffic simulation models can be micro-, meso- and macroscopic with different granularities [67]. For example,macroscopic models describe the traffic as flows, velocities, and densities of vehicles, while microscopic modelssimulate individual vehicles down to basic physical and kinematic properties such as speed, locations, andfuel. In this research, we simulate transportation infrastructure from a macroscopic perspective. The roadand charging station models are detailed in this section.
Road ModelThe road model described here is able to model traffic outflow given the traffic inflow profile of a road, which
11

utilizes the empirical flow-velocity correlation from literature [68,69], as shown in (8):Uave = α1·Us1+(VaveCt
)β
β = α2 + α3 · (Vave
Ct)3
(8)
where Uave is the average road velocity; Vave is the average vehicle flow; Ct is the road capacity; α1, α2, α3,and β are regression parameters; and Us is the speed designed for the road. The traffic of the road can bemeasured by the traffic load Vave
Ct. Fig. 7 demonstrates the relationship between Uave and Vave
Ctof different
Us limits under a certain road type. We can then find that the velocity descends faster when traffic flowexceeds the road capacity (Vave
Ct> 1).
Figure 7: Empirical model of traffic flow-velocity correlation for a certain road [68].
Equation (9) represents the relationship between the velocity, density, and traffic flow:
Vave =Uave ·
∫(qout − qin)dt
L(9)
where qout and qin are respectively the traffic outflow and traffic inflow rates, and L is the length of the road.
Equation (10) represents the travel time on the road:
tw/oCom =L
Uave(10)
where tw/oCom is the travel time of the road without considering the communication system. Combining(8)-(10), the traffic condition on the road can be jointly obtained. In our Modelica implementation, the roadmodel consists of the traT im model and the varDel model (see Fig. 8). The pseudo-code of the traT immodel using the aforementioned principle is shown in Fig. 9. Based on the aforementioned principles, thetraT im model is built to calculate the travel time of the road section. The varDel model is a delay block tomimic the travel delay time due to traffic conditions. Different road properties could be selected from theroad type record datasets.
Charging EV Number ModelThe number of EVs in the community is calculated using a traffic flow balance:
N =
min∑k=1
qin,k −mout∑k=1
qout,k (11)
where N represents the change of the number of EVs parked in the block; min and mout denote the number ofinlets and outlets of the station, respectively; and qin and qout represent the traffic inflow and outflow rates,respectively. While we recognize the number of vehicles is an integer in reality, we assume N is continuousin this preliminary implementation. The pseudo-code of the model using the aforementioned principle isshown in Fig. 10.
12

Traffic inflow profile Traffic outflow profile
Travel time calculation Variable delay
Road type record
Diagram
Icon
Figure 8: Diagram of Modelica models for roads.
…
equation
num=qIn; //Traffic inflow
qAve=num/l*u; //Average traffic flow on the road
b=roaTyp.a2 + roaTyp.a3*(qAve/(roaTyp.q_nominal/3600))^3;//Beta
u=roaTyp.a1*roaTyp.uf/(1+ (qAve/(roaTyp.q_nominal/3600))^b);//Average velocity
t= if noEvent(u>0.1) then l/u else l/0.1;
delTim=t; //Travel time
Figure 9: Pseudo-code of traT im model in Modelica.
…
equation
qOut[:]=qOutSet[:]; //Prescribe traffic flow at the outlet
der(numEV)= (sum(qIn[:])-sum(qOut[:]))/3600;
//Charging EV number balance
Figure 10: Modelica pseudo-code for the number of charging EVs.
There are many ways we can estimate the EV charging in the block level. In this case study, we use asimplified probabilistic model. For one single EV, its probability of charging at the block at a given houris pi, which can be obtained by survey data. We assume the number of the charging EVs at certain timerepresents a Poisson distribution. Therefore, we expect:
Nchar = E(M) = pi ·N (12)
where Nchar is the total number of the charging vehicles, as discussed in (6), and N is number of parkedvehicles in the block per (11). For later applications, this simplified model can be replaced with more accurateand realistic models, such as Monte Carlo models [70].
3.1.3 Communication System
In this preliminary case study, a simplified packet loss model is used to describe the transmission process ina wireless communication network [71]. The empirical relationship between the packet loss rate γ and thenormalized throughput Qc is:
γ = κ ·√Qc − Cc (13)
where κ is a proportional coefficient and Cc is the threshold of the transmission. We assume that γ isdirectly proportional to Qc under certain bandwidth in the communication system. In this simplified model,we assume the transmission delay Del equals 0 that there are negligible impacts from the re-transmissionmechanism if a message is lost.
13

3.1.4 Component Validation
We validated the models using comparative testing and analytical verification. For example, comparativetesting is used to validate the road model, which compares the Modelica simulation results with the datamentioned in literature [72]; this includes the flow rate data from the inlet to the outlet marked at 15 minuteintervals for 6 hours. The detailed comparison can be seen in Fig. 11. From this, we can conclude that themodel fits well with the literature data and could represent the traffic condition for the integrated model.
Figure 11: Comparison of traffic outflow from model prediction and literature.
3.2 Block Layer Model
The block layer model reflects the interaction of the different system agents in a block, as mathematicallyillustrated in (14)-(18). The interdependent variables, shown in bold, exemplify how the outputs of onesystem agent are inputs of the others. They are calculated using the system agent models as shown inSection 3.1.
~SE1(LMP i,SigiE , V
i, Ii, ...) =f1(P i
EV,Picom, P
ibui, P
iPV, P
iwin, ...)
(14)
~SE2(P iEV,P
icom) = f2(N i
char,Qc, ...) (15)
~ST1(N i
char) = g1(qiin,, q
iout, ...) (16)
~ST2(qi
in,, qiout, U
i, tw/Com, ...) =
g2(Cit , Uis,LMP i,Sigi
E ,SigiT ,Del, ...)
(17)
~SC(Qc,Del, ...) =h(Sigi
E ,SigiT , q
iin,, q
iout, Cc, ...)
(18)
Operator ~S indicates the state variables in the energy, transportation, and communication systems, whichare denoted by subscripts E, T , and C, respectively. Index i designates the node. In the energy system, thestate output variables include node voltage V and line current I, as well as the locational marginal priceLMP and the energy-related control signals SigE . These control signals include the buildings, EVs, storage,
and renewable energy generations. As seen in (14), the functional inputs to ~SE1include interrelated energy
factors PEV and Pcom, as well as other load and renewable generation quantities – such as the building powerconsumption Pbui, PPV from (1), and Pwin from (5). Further, as shown in (15), the EV charging activepower and communication tower power are determined by the number of charging EVs Nchar in (6) and thecommunication throughput Qc in (7), as mentioned in Section 3.1.1.c.
As seen in (16), Nchar correlates to traffic inflow qin and traffic outflow qout, as exemplified previously in (11).In the transportation system shown in (17), traffic inflow qin and traffic outflow qout, along with averagevelocity Uave, road velocity U , travel time tw/Com, are determined by the transportation parameters such as
14

road capacity Ct, design road velocity Us; energy factors such as the locational marginal price LMP andelectrical control signals SigE ; as well as communication factors such as throughput Qc and time delay Del,as exemplified previously in (8)-(12). For reference, the empirical traffic flow model included in this paperapproximates U as the average road velocity Uave, as shown in (8). Further, when the communication systemis considered, the transportation-related control signals SigT affect the travel time tw/Com, which will beelaborated further in Section 3.3. In the communication system shown in (18), the throughput Qc and timedelay Del affect both the energy and transportation systems, while the transmission threshold Cc affectsthe communication state as prescribed in (13). The Modelica implementation of the block layer model isdepicted in Fig. 12. As aligned with the block layer in the proposed 3M approach, the transportation agentsends the charging demand signal to the energy system agent via the communication agent. Likewise, theenergy agent sends back the price/control signal via the communication agent.
Diagram
Icon
Packet transmission
port
Traffic outflow portTraffic inflow port
Charging probability
Traffic outflow
Building load
Weather data
Energy
Communication
Transportation
Price signal
Charging demand
Charging demand
Price signal
Transmission demand
Packet transmission
From grid power
Figure 12: Diagram of Modelica model for one block.
Since the energy system supplies power to the communication system, the communication agent sends thethroughput demand signal to the energy system agent so that the corresponding energy demand for thecommunication agent can be calculated. In this case study, the communication system in the block is alsoresponsible for transmitting the packets for traffic routing with the interconnected roads through the packettransmission port.
3.3 Community Layer Model
The community layer model connects different numbers of blocks. Aligned with the 3M approach, differentblocks are connected with the power lines and the communicative roads. The exemplified model shown inFig. 13 consists of two blocks. The interdependencies on this layer are reflected by these connections ofdifferent blocks. For example, in terms of the energy connection, the voltage between the terminals at BlockA and Block B is co-related by linking the terminal connectors with the power lines, which implicitly containsthe following mathematical formulation:
V pφ,Block A − V nφ,Block B = Ztot · Ipφ, (19)
where V , I, and Ztot denote the voltage, current, and total impedance, respectively, between the terminalsof Block A and Block B at phase φ. These correlate to (14). At the terminals, p and n represent the positiveand negative connectors, respectively.
The communicative roads will exchange routing data with the communication centers in the block. Therefore,the performance of the packet exchanges will have an impact on the traffic conditions on the linked roads.Generically, we represent this interrelation as SigT in (17) and (18) above. While there are many different
15

Block A
Block B
Power lines
Roa
ds
Grid network
Charging probability
Tra
nsm
issi
on
Weather input
Packet transmission
Traffic outflow
Building load
Figure 13: Diagram of Modelica model for a community with two connected blocks.
models to represent this correlating signal, here we adapt the packet loss rate γ to represent this signal. Inthe current implementation, we assume that the traffic delay time will be proportional to γ as follows:
tw/Com = (1 + γ)tw/oCom (20)
where tw/Com and tw/oCom are the travel times with and without consideration of communication, respec-tively.
4 Case Studies
In this section, three cases are presented in which complexity is gradually added to evaluate the interde-pendency of different systems and the necessity of integrated modeling. Section 4.1 introduces the basicinformation of the cases and the performance indicators used to evaluate the multidisciplinary infrastructuremodels. Section 4.2 presents the case that only considers the energy system, while the transportation andcommunication parameters are fixed. The case study in Section 4.3 considers both the energy and trans-portation system, which intends to investigate the logical interdependencies between the variable chargingdemand on the energy system and the traffic conditions. Lastly, the case study in Section 4.4 takes thethree systems into account, considering the cyber interdependencies linking the two physical systems. Theseexamples are intended to evaluate the intertwined operational performance of energy, transportation, andcommunication infrastructure in connected communities where large-scale renewable energy generation andfull-electrified transportation are adopted. It is noted that these preliminary models do not fully encapsulatethe interdependencies present among the infrastructure systems. In the current case, the charging price isconsidered to be constant and the charging station control is not taken into account. As mentioned before,the objective through these case studies it to evaluate the proposed modeling framework for simulatinginterconnected infrastructure systems for SCC operation.
16

Table 2: Detailed model settings in the three cases.
Residential Block 1 Residential Block 2 Commercial BlockWeather profile San Francisco, CA, USAPV area (m2) 20,000 30,000 50,000
Nominal wind turbine power (MW ) 1Battery capacity (kWh) 4,000 5,000 6,000Distribution system type IEEE 16 test feeder
Initial EV number 800 800 200
Building type600 Residential
houses700 Residential
houses5 Large offices, 5 stripmalls, 5 restaurants
Road Capacity (C,Us, α1, α2, α3)Road1,2: (350, 30, 1, 1.88, 4.85)Road3,4: (1100, 60, 1, 1.88, 7)Road5,6: (800,56, 1.4, 1.88, 6.97)
Communication system coefficients (γ,Cc)Road1,2: (0.03,80)Road3,4: (0.02,300)Road5,6: (0.035,350)
4.1 Case Description and Performance Measures
Fig. 14 shows the schematics of the three cases. The modeled community is composed of two residentialblocks and a commercial block. As the names imply, the residential blocks mainly consist of residentialbuildings, while the commercial block is composed of commercial buildings, such as offices, restaurants, andschools. Each block has its own renewable generation farm, energy storage (battery), EV charging stations,and communication towers. Six one-way roads of the same road type link different blocks. The designcapacity and design velocity vary between roads. The communication system in these cases is dedicated tothe traffic routing of the vehicles on the road. The communication tower in each block exchanges trafficinformation with the vehicles on the road. Thus, the performance of the communication system has a directeffect on the transportation system. Detailed model settings are shown in Table 2 for the three cases.
C T
E
Road
Tra
nsm
issi
on
E
Commercial Block C
Residential Block A
TE
Road
(a) (b) (c)
Residential Block B
Residential Block A
Residential Block B
Commercial Block C
Residential Block A
Residential Block B
Commercial Block C
Power Line
Power Line
Power Line
Figure 14: Schematics for the three cases: (a) Energy system, (b) Energy + Transportation systems, and(c) Energy + Transportation + Communication systems.
Several indicators are selected from prior works [37, 51, 73] to assess the infrastructure performance in con-nected communities. The performance of energy infrastructure includes power load cover factor (LCF ),peak-valley load ratio (PV LR), power system line safety, and power system voltage security. Power LCFevaluates the percentage of demand that can be supplied by the renewable energy generation. Power PV LR
17
is one of the load balancing performance indicators in the power infrastructure, represented by:
PV LR =Pmax − Pmin
Pmax(21)
where Pmax and Pmin are the peak and valley power from the grid, respectively.
Power voltage security indicator, SIB , denotes a bus voltage limit placed by the IEEE Standard 519 [73]:
SIB =1
NbK
Nb∑i
K∑κ
gi(κ), where
g(i) =
vdev,i(κ) − 1.05 if vdev,i(κ) > 1.05
0.95 − vdev,i(κ) if vdev,i(κ) < 0.95
0 otherwise
(22)
where vdev,i(κ) is the voltage deviation rate of a given line i and a given event κ over all events K given aset of Nb buses.
Power line safety indicator, SIL, represents a physical rating on the amount of transferred active power:
SIL =1
NlK
Nl∑i
K∑κ
fi(κ), where
f(i) =
{Pi(κ) − Pi
∗ if Pi(κ) > Pi∗
0 otherwise
(23)
where Pi∗ is the power limit of a given line i and a given event κ over all events K given a set of Nl lines.
The performance of transportation and communication systems can be quantified by road congestion andtransmission congestion, respectively. Road congestion can be gauged by the travel time and traffic flowon the road, while transmission congestion can be reflected by the packet loss or arrival rate. The detailedcalculation can be seen in Sections 3.1.2 and 3.1.3.
4.2 Case 1: Energy System
The implementation of Case 1 in Modelica is shown in Fig. 15. The building loads are hourly load profilescomputed using the DOE Commercial Reference Building Models [74] and Building America House Simu-lation Protocols [75]. The inputs for the transportation and communication systems are fixed for this case.The EV charging profile in one block is prescribed according to the travel demand analysis, and the traveltime between the blocks is neglected in the simulation.
The energy-system simulation results for January 1st in San Francisco are shown in Fig. 16. From the supplyside, the power generated from the PV peaks at noon. However, the wind power contributes little duringthe considered time period. From the demand side, the load from the EV charging has a higher demand inthe night than during the daytime due to the charging pattern of the residential blocks. The load from thebuilding blocks is quite stable compared to the EV charging load pattern. It is noted that the load from thecommunication towers is negligible compared to the load from EV charging and the buildings.
Regarding the power draw from the grid, the peak-valley ratio amounts to 48.79%. This relatively high valueis caused by the high EV charging demand at night, which peaks at 22:20, and renewable energy generationduring the daytime, which peaks at 12:10. However, the duck curve is flattened by the adoption of thebattery and the modest power load cover factor (6.92%). The overall results of the energy system indicatorsare listed in Table 3.
The SIB,resBlo1 and SIL,resBlo1 are indices for the power infrastructure performance in terms of the bus safetysecurity and power line safety, respectively. Fig. 17 shows the line voltage deviation rate of three feeders at
18

(a)
(b)
Parameter Inputs(Prescribed E, T, C)
Figure 15: Implementation of Case 1: The (a) block icon and (b) community layer diagram for the energysystem in Modelica.
Figure 16: Energy system supply and demand profiles for one day in the connected community.
Table 3: Results of the energy system indicators.
Energy system indicators
PV LR(%) LCF (%) SIB,resBlo1 SIL,resBlo1
48.79 6.95 0.00766 0.0097
19

Figure 17: Line voltage deviation rate of three feeders at the distribution system described in Fig. 6.
the distribution system described in Fig. 6. These results all demonstrate that the power infrastructure hasthe risk of being overloaded at certain discrete time steps. These results suggest that advanced control ofcoordinating EV charging and building demand response should be taken to avoid the risk.
4.3 Case 2: Energy + Transportation (E+T) System
The implementation of Case 2 in Modelica is shown in Fig. 18. The parameter inputs for the energy systemand the communication system settings are the same as Case 1. However, instead of specifying the EVcharging profile, the traffic dynamic is considered in this case based on the traffic outflow profile of theblock. The traffic outflow profile is determined from the data in the National Cooperative Highway ResearchProgram (NCHRP187) [76]. The quantitative results for the transportation system are illustrated in Fig.19, which shows the average traffic flow profile and the average velocity on different roads. The resultsdemonstrate traffic peaks on Road 3 and Road 6 that link the residential blocks and commercial blocks.
Meanwhile, the average traffic flow on Road 1, which links the two residential blocks, fluctuates less. Atpeak commute times (around 8:00 and 18:00), the average traffic flow has a peak value while the averagevelocity on the road has a minimum value, as can be expected. The comparison of the energy results in Case1 and Case 2 will be analyzed in Section 4.3.
4.4 Case 3: Energy + Transportation + Communication (E+T+C) System
The implementation of Case 3 in Modelica is shown in Fig. 20. In this case, the model inputs for the energysystem and transportation system are the same as Case 2. Instead of specifying the packet transmissionprofiles, the packet exchange processes between the road and the corresponding communication tower aremodeled as described in Section 3.1.2. As depicted in Fig. 20, the transmission happens between the roadand the block. The assumption is made that the traffic travel time would increase due to the data loss andincomplete transmission of the traffic information.
Fig. 21 shows the interdependencies between the transportation and communication systems. Because thecommunication throughput far exceeds the capacity threshold during commute times, the communicationpacket loss (shown in Fig. 21a) surges when the average traffic flow peaks at the highest commuting times(shown in Fig. 21b). The packet loss peaks in the morning at Road 3, which is from residential block tocommercial block, and in the evening at Road 6, which is from commercial block to residential block.
Comparing the simulations from all three cases produces some interesting results. Fig. 22 illustrates theimpact of the communication system on the transportation system by comparing the results in Case 2(E+T) and Case 3 (E+T+C). In low traffic hours, the results of both cases almost overlap due to the freeflow condition; as such, the communication system has little impact on the traffic condition. However, athigh traffic hours (around 8:00 and 18:00), the communication system deteriorates the traffic condition dueto poor packet arrival rates, as shown in Case 3. Compared to Case 2, the average velocities in Case 3 areapproximately 10.5% slower for the morning commute on Road 5 and 3.9% slower for the evening commute
20

(a)
(b)
E+T
Energy
Transportation
Charging probability
Traffic outflow
Building load
Packet transmission
Power from the grid
Weather data
Traffic inflow port Traffic outflow port
Transmission demand
Charging demand
roa1
roa2
roa3
roa4
roa6
roa5
Parameter Inputs(Prescribed E, C)
Commercial block(E+T)
Residential block 1(E+T)
Residential block 2(E+T)
Road 1
Road 2
Roa
d 3
Roa
d 4
Roa
d 6
Roa
d 5
Figure 18: Implementation of Case 2: The (a) block icon and (b) community layer diagram for the energyand transportation (E+T) system in Modelica.
21

Figure 19: Road condition results in the connected community: (a) Average traffic flow profiles and (b)Average velocity profiles on the roads.
Commercial block(Three coupled)
Parameter Inputs(Prescribed E)
Residential block 1(Three coupled)
Residential block 2(Three coupled)
Road 1
Road 2
Roa
d 3
Roa
d 4
Roa
d 6
Roa
d 5
roa1
roa2
roa3
roa4
roa6
roa5
Figure 20: Community layer diagram for the E+T+C system in Modelica.
22
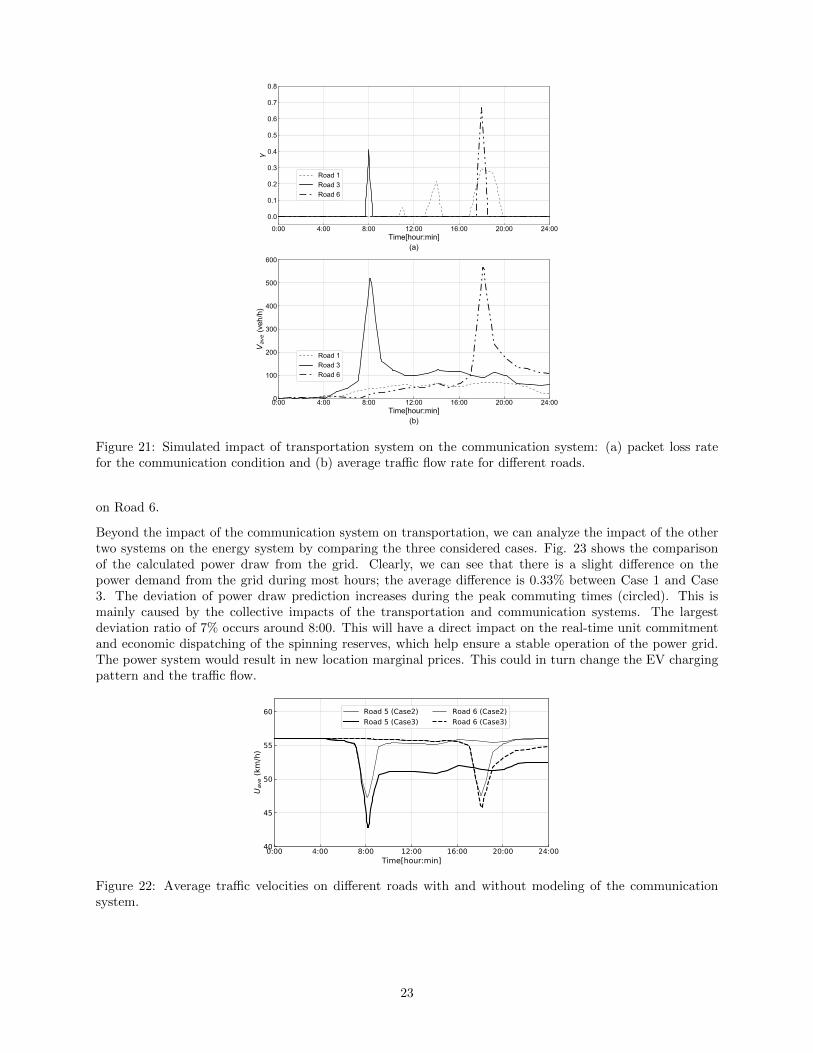
Figure 21: Simulated impact of transportation system on the communication system: (a) packet loss ratefor the communication condition and (b) average traffic flow rate for different roads.
on Road 6.
Beyond the impact of the communication system on transportation, we can analyze the impact of the othertwo systems on the energy system by comparing the three considered cases. Fig. 23 shows the comparisonof the calculated power draw from the grid. Clearly, we can see that there is a slight difference on thepower demand from the grid during most hours; the average difference is 0.33% between Case 1 and Case3. The deviation of power draw prediction increases during the peak commuting times (circled). This ismainly caused by the collective impacts of the transportation and communication systems. The largestdeviation ratio of 7% occurs around 8:00. This will have a direct impact on the real-time unit commitmentand economic dispatching of the spinning reserves, which help ensure a stable operation of the power grid.The power system would result in new location marginal prices. This could in turn change the EV chargingpattern and the traffic flow.
Figure 22: Average traffic velocities on different roads with and without modeling of the communicationsystem.
23

Figure 23: Comparison of power draw from the grid in three cases.
5 Conclusions
This paper proposes a new flexible and scalable multi-layer, multi-block, multi-agent (3M) approach formodeling several interconnected domains. The 3M approach is used to model the interaction of energy,transportation, and communication systems. New open source Modelica models are developed accordingly.The models are applied in three case studies to study the underlying interdependencies of the three systemsfor evaluating typical SCC operation. Simulation results show that the interaction among these three systemsshould not be neglected. In this study, the deviation of the average velocity on the road can be 10.5% withor without considering the communication system at the peak commute time. The deviation of the powerdraw from the grid can be 7% with or without considering the transportation and communication systems.
While these results demonstrate a successful implementation of the proposed 3M modeling framework tostudy interdependent infrastructure systems, further work is yet needed. The case studies included here arethe first steps towards modeling of the SCC; as such, they do not fully encapsulate the interedependenciespresent among these three systems. Our current focus was to provide the framework which can be laterextended. In the future, we plan to implement the proposed modeling framework to study applications inSCC operation, including dynamic modeling and optimization, resilience analysis, and integrated decisionmaking.
Acknowledgment
This research was supported by the National Science Foundation under Awards No. IIS-1802017 and IIS-1633363. BIGDATA: Collaborative Research: IA: Big Data Analytics for Optimized Planning of Smart,Sustainable, and Connected Communities. This work also emerged from the IBPSA Project 1, an inter-nationally collaborative project conducted under the umbrella of the International Building PerformanceSimulation Association (IBPSA). Project 1 aims to develop and demonstrate a BIM/GIS and ModelicaFramework for building and community energy system design and operation.
References
[1] S. Dhakal, “GHG emissions from urbanization and opportunities for urban carbon mitigation,” CurrentOpinion in Environ. Sustainability, vol. 2, no. 4, pp. 277-283, 2010.
[2] Y. Sun, H. Song, A. J. Jara, and R. Bie, “Internet of Things and Big Data Analytics for Smart andConnected Communities,” IEEE Access, vol. 4, pp. 766-773, 2016.
[3] T. Zeng, O. Semiari, W. Saad, and M. Bennis, “Joint Communication and Control for Wireless Au-tonomous Vehicular Platoon Systems,” available online: arXiv preprint arXiv:1804.05290, 2018.
24

[4] A. Ferdowsi, S. Ali, W. Saad, and N. B. Mandayam, “Cyber-Physical Security and Safety of AutonomousConnected Vehicles: Optimal Control Meets Multi-Armed Bandit Learning,” available online: arXivpreprint arXiv:1812.05298, 2018.
[5] M. Mozaffari, W. Saad, M. Bennis, and M. Debbah, “Unmanned Aerial Vehicle With Underlaid Device-to-Device Communications: Performance and Tradeoffs,” IEEE Transactions on Wireless Communica-tions, vol. 15, no. 6, pp. 3949-3963, 2016.
[6] Z. Dawy, W. Saad, A. Ghosh, J. G. Andrews, and E. Yaacoub, “Toward Massive Machine Type CellularCommunications,” IEEE Wireless Communications, vol. 24, no. 1, pp. 120-128, 2017.
[7] Z. Yang, M. Chen, W. Saad, M. Shikh-Bahaei, “Optimization of Rate Allocation and Power Controlfor Rate Splitting Multiple Access (RSMA),” available online: arXiv preprint arXiv:1902.10265, 2019.
[8] S. M. Rinalidi, J.P. Peerenboom, and T. Kelly, “Identifying, understanding and analyzing critical in-frastructure interdependencies,” IEEE Control System Magazine, vol. 21, no. 6, pp. 11-25, 2011.
[9] B. Robert, M. H. Senay, M.-E. P. Plamondon, J. P. Sabourin, “Characterization and ranking of linksconnecting life support networks. Public safety and emergency preparedness,” in Proc. of Public Safetyand Emergency Prepardness Canada, Ottawa, ON, 2003.
[10] M. Ouyang, “Review on modeling and simulation of interdependent critical infrastructure systems,”Reliability Engineering and System Safety, vol. 121, pp. 43-60, 2014.
[11] A. Ipakchi and F. Albuyeh, “Grid of the Future,” IEEE Power and Energy Magazine, vol. 7, no. 2, pp.52-62, 2009.
[12] M. H. Amini, and O. Karabasoglu, “Optimal Operation of Interdependent Power Systems and ElectrifiedTransportation Networks,” Energies, vol. 11, no. 1, pp. 196-211, 2018.
[13] S. M. Rinaldi, “Modeling and Simulating Critical Infrastructures and Their Interdependencies”, in Proc.of the 37th Hawaii International Conference on System Sciences, p. 1-8, IEEE, 2004.
[14] C. F. Reinhart, and C. C. Davila, “Urban building energy modeling - A review of a nascent field,”Building and Environment, vol. 97, pp. 196-202, 2016.
[15] C. C. Davila, C. F. Reinhart, and J. L. Bemis, “Modeling Boston: A workflow for the efficient generationand maintenance of urban building energy models from existing geospatial datasets,” Energy, vol. 117,pp. 237-250, 2016.
[16] Y. Chen, T. Hong, and M. A. Piette, “Automatic generation and simulation of urban building energymodels based on city datasets for city-scale building retrofit analysis,” Applied Energy, vol. 205, pp.323-335, 2017.
[17] P. Remmen, M. Lauster, M. Mans, M. Fuchs, T. Osterhage, and D. Muller, “TEASER: an open toolfor urban energy modelling of building stocks,” Journal of Building Performance Simulation, vol. 11,no. 1, pp. 84-98, 2018.
[18] Y. Chen, W. Li, Y. Guo, and Y. Wu, “Dynamic Graph Hybrid Automata: A Modeling Method for TrafficNetwork,” in Proc. of 18th International IEEE Conference on Intelligent Transportation Systems, pp.1396-1401. IEEE, 2015.
[19] M. Jakob, and Z. Moler, “Modular framework for simulation modelling of interaction-rich transportsystems,” in Proc. of 16th International IEEE Conference on Intelligent Transportation Systems (ITSC2013), pp. 2152-2159. IEEE, 2013.
[20] J.-I. Latorre-Biel, J. Faulin, E. Jimenez, and A. A. Juan, “Simulation Model of Traffic in Smart Cities forDecision-Making Support: Case Study in Tudela (Navarre, Spain),” in Proc. of International Conferenceon Smart Cities, pp. 144-153. Springer, Cham, 2017.
25

[21] G. Suciu, C. Butca, C. Dobre, and C. Popescu, “Smart City Mobility Simulation and MonitoringPlatform,” in Proc. of 21st International Conference on Control Systems and Computer Science (CSCS),pp. 685-689. IEEE, 2017.
[22] G. Wainer, “Developing a software toolkit for urban traffic modeling,” Software: Practice and Experi-ence, vol. 37, no. 13, pp. 1377-1404, 2007.
[23] T. R. Henderson, M. Lacage, G. F. Riley, C. Dowell, and J. Kopena, “Network Simulations with thens-3 Simulator,” SIGCOMM Demonstration, vol. 14, no. 14, pp. 527, 2008.
[24] A. Varga, and R. Hornig, “An overview of the OMNeT++ simulation environment,” in Proc. of 1stInternational Conference on Simulation Tools and Techniques for Communications, Networks and Sys-tems & Workshops. ICST (Institute for Computer Sciences, Social-Informatics and TelecommunicationsEngineering), pp. 60, 2008.
[25] Y. Cao, S. Yang, G. Min, X. Zhang, H. Song, O. Kaiwartya, and N. Aslam, “A cost-efficient communi-cation framework for battery-switch-based electric vehicle charging,” IEEE Communications Magazine,55(5), pp.162-169, 2017.
[26] B. Chen, and H. H. Cheng, “A Review of the Applications of Agent Technology in Traffic and Trans-portation Systems,” IEEE Transactions on Intelligent Transportation Systems, vol. 11, no. 2, pp. 485-497, 2010.
[27] P. Palensky, A. A. Van der Meer, C. D. Lopez, A. Joseph, and K. Pan, “Cosimulation of Intelligent PowerSystems: Fundamentals, Software Architecture, Numerics, and Coupling,” IEEE Industrial ElectronicsMagazine, vol. 11, no. 1, pp. 34-50, 2017.
[28] A. Ferdowsi, A. Sanjab, W. Saad, and N. B. Mandayam, “Game Theory for Secure Critical Inter-dependent Gas-Power-Water Infrastructure,” in Proc. of Resilience Week (RWS), pp. 184-190. IEEE,2017.
[29] A. Ferdowsi, W. Saad, and N. B. Mandayam, “Colonel Blotto Game for Secure State Estimation inInterdependent Critical Infrastructure,” available online: arXiv preprint arXiv:1709.09768, 2017.
[30] G. Satumtira and L. Duenas-Osorio, “Synthesis of Modeling and Simulation Methods on Critical In-frastructure Interdependencies Research,” in Proc. of Sustainable and Resilient Critical InfrastructureSystems, Berlin, Springer, pp. 1-51, 2010.
[31] S. V. Buldyrev, R. Parshani, G. Paul, H. E. Stanley, and S. Havlin, “Catastrophic cascade of failuresin interdependent networks,” Nature, vol. 464, no. 7291, pp. 1025, 2010.
[32] V. Rosato, L. Issacharoff, F. Tiriticco, S. Meloni, S. Porcellinis, and R. Setola, “Modelling interdependentinfrastructures using interacting dynamical models,” International Journal of Critical Infrastructures,vol. 4, no. 1, pp. 63-79, 2008.
[33] D. T. Nguyen, Y. Shen, and M. T. Thai, “Detecting critical nodes in interdependent power networksfor vulnerability assessment,” IEEE Transactions on Smart Grid, vol. 4, no. 1, pp.151-159, 2013.
[34] A. Bernstein, D. Bienstock, D. Hay, M. Uzunoglu, and G. Zussman, “Power grid vulnerability togeographically correlated failures- Analysis and control implications,” in Proc. of IEEE INFOCOM2014-IEEE Conference on Computer Communications, pp. 2634-2642. IEEE, 2014.
[35] C. Heracleous, P. Kolios, C. G. Panayiotou, G. Ellinas and M. M. Polycarpou, “Hybrid systems modelingfor critical infrastructures interdependency analysis,” Reliability Engineering & System Safety, vol. 165,pp.89-101, 2017.
[36] Z. Cao, S. Jiang, J. Zhang, and H. Guo, “A unified framework for vehicle rerouting and traffic lightcontrol to reduce traffic congestion,” IEEE transactions on intelligent transportation systems, 18(7),pp.1958-1973, 2017.
26

[37] A. M. Farid,“A Hybrid Dynamic System Model for Multimodal Transportation Electrification,” IEEETransactions on Control Systems Technology, vol. 25, no. 3, pp. 940-951, 2017.
[38] W. Su, J. Wang, K. Zhang, and M.-Y. Chow, “Framework for investigating the impact of PHEVcharging on power distribution system and transportation network,” in Proc. of IECON 2012-38thAnnual Conference on IEEE Industrial Electronics Society, pp. 4735-4740. IEEE, 2012.
[39] K. Hopkinson, X. Wang, R. Giovanini, J. Thorp, K. Birman, and D. Coury, “EPOCHS: a platform foragent-based electric power and communication simulation built from commercial off-the-shelf compo-nents,” IEEE Transactions on Power Systems, vol. 21, no. 2, pp. 548-558, 2006.
[40] H. Georg, S. C. Muller, C. Rehtanz, and C. Wietfeld, “Analyzing Cyber-Physical Energy Systems:The INSPIRE Cosimulation of Power and ICT Systems Using HLA,” IEEE Transactions on IndustrialInformatics, vol. 10, no. 4, pp. 2364-2373, 2014.
[41] S. Chatzivasileiadis, M. Bonvini, J. Matanza, R. Yin, T. S. Nouidui, E. C. Kara, R. Parmar, D. Loren-zetti, M. Wetter, and S. Kiliccote, “Cyber-Physical Modeling of Distributed Resources for DistributionSystem Operations,” in Proc. of the IEEE, vol. 104, no. 4, pp. 789-806, 2016.
[42] C. Sommer, R. German, and F. Dressler, “Bidirectionally Coupled Network and Road Traffic Simulationfor Improved IVC Analysis,” IEEE Transactions on Mobile Computing, vol. 10, no. 1, pp. 3-15, 2011.
[43] R. Fernandes, F. Vieira, and M. Ferreira, “VNS: An integrated framework for vehicular networks sim-ulation,” in Proc. of 2012 IEEE Vehicular Networking Conference (VNC), pp. 195-202. IEEE, 2012.
[44] S. Zemouri, S. Mehar, and S.-M. Senouci, “HINTS: A novel approach for realistic simulations of vehic-ular communications,” in Proc. of 2012 Global Information Infrastructure and Networking Symposium(GIIS), pp. 1-6. IEEE, 2012.
[45] B. Schunemann, “V2X simulation runtime infrastructure VSimRTI: An assessment tool to design smarttraffic management systems,” Computer Networks, vol. 55, no. 14, pp. 3189-3198, 2011.
[46] L. Bedogni, L. Bononi, A. Borghetti, R. Bottura, A. D’Elia, and T. S. Cinotti, “Integration of trafficand grid simulator for the analysis of e-mobility impact on power distribution networks,” in Proc. ofIEEE Eindhoven PowerTech, pp. 1-6. IEEE, 2015.
[47] P. Palensky, A. van der Meer, C. Lopez, A. Joseph, and K. Pan, “Applied cosimulation of Intelli-gent Power Systems: Implementing Hybrid Simulators for Complex Power Systems,” IEEE IndustrialElectronics Magazine, vol. 11, no. 2, pp. 6-21, 2017.
[48] M. Tiller, Introduction to Physical Modeling with Modelica. New York, NY, USA: Springer, 2001.
[49] S. Huang, W. Zuo, and M. D. Sohn, “Improved cooling tower control of legacy chiller plants by opti-mizing the condenser water set point,” Building and Environment, vol. 111, pp. 33-46, 2017.
[50] W. Tian, T. A. Sevilla, W. Zuo, and M. D. Sohn, “Coupling fast fluid dynamics and multizone air-flow models in Modelica Buildings library to simulate the dynamics of HVAC systems,” Building andEnvironment, vol. 122, pp. 269-286, 2017.
[51] R. Al Junaibi, and A. M. Farid, “A method for the technical feasibility assessment of electrical vehiclepenetration,” in Proc. of IEEE International Systems Conference (SysCon), pp. 606-611. IEEE, 2013.
[52] M. Stifter, and S. Ubermasser, “Dynamic simulation of power system interaction with large electricvehicle fleet activities,” in Proc. of IEEE Grenoble Conference, pp. 1-6. IEEE, 2013.
[53] F. Montori, A. Borghetti, and F. Napolitano, “A co-simulation platform for the analysis of the impactof electromobility scenarios on the urban distribution network,” in Proc. of IEEE 2nd InternationalForum on Research and Technologies for Society and Industry Leveraging a better tomorrow (RTSI),pp. 1-6. IEEE, 2016.
27

[54] K. Anderson, J. Du, A. Narayan, and A. El Gamal, “GridSpice: A Distributed Simulation Platform forthe Smart Grid,” IEEE Transactions on Industrial Informatics, vol. 10, no. 4, pp. 2354-2363, 2014.
[55] C. Shum, W. Lau, T. Mao, H. Chung, C. F. T. Norman, K. Tsang, and L. Lai, “HLA based co-simulationframework for multiagent-based smart grid applications,” in Proc. of IEEE PES Asia-Pacific Power andEnergy Engineering Conference (APPEEC), pp. 1-6. IEEE, 2014.
[56] A. N. Albagli, D. M. Falcao, and J. F. de Rezende, “Smart grid framework co-simulation using HLAarchitecture,” Electric Power Systems Research, vol. 130, pp. 22-33, 2016.
[57] M. Rondinone, J. Maneros, D. Krajzewicz, R. Bauza, P. Cataldi, F. Hrizi, J. Gozalvez, V. Kumar,M. Rockl, and L. Lin, “iTETRIS: A modular simulation platform for the large scale evaluation ofcooperative ITS applications,” Simulation Modelling Practice and Theory, vol. 34, pp. 99-125, 2013.
[58] Z. Cao, H. Guo, J. Zhang and U. Fastenrath, “Multiagent-based route guidance for increasing the chanceof arrival on time,” in Proc. of Thirtieth AAAI Conference on Artificial Intelligence, pp. 3814-3820, 2016.
[59] Z. Cao, H. Guo. and J. Zhang. “A Multiagent-Based Approach for Vehicle Routing by Considering BothArriving on Time and Total Travel Time,” ACM Transactions on Intelligent Systems and Technology(TIST), volume. 9, no.3, pp.25, 2018.
[60] S. Civanlar, J. Grainger, H. Yin, and S. Lee, “Distribution feeder reconfiguration for loss reduction,”IEEE Transactions on Power Delivery, vol. 3, no. 3, pp. 1217-1223, 1988.
[61] M. Wetter, “Multizone Building Model for Thermal Building Simulation in Modelica,” in Proc. ofModelica Conference 2006, pp. 517-526. The Modelica Association, 2006.
[62] X. Li, and J. Wen, “Building energy consumption on-line forecasting using physics based system iden-tification,” Energy and Buildings, vol. 82, pp. 1-12, 2014.
[63] K. Qian, C. Zhou, M. Allan, and Y. Yuan, “Modeling of Load Demand Due to EV Battery Chargingin Distribution Systems,” IEEE Transactions on Power Systems, vol. 26, no. 2, pp. 802-810, 2011.
[64] G. Chen, C. Li, M. Ye, and J. Wu, “An unequal cluster-based routing protocol in wireless sensornetworks,” Wireless Networks, vol. 15, no. 2, pp. 193-207, 2009.
[65] M. Wetter, M. Bonvini, T. S. Nouidui, and W. Zuo, “Modelica Buildings Library 2.0,” in Proc. ofThe 14th International Conference of the International Building Performance Simulation Association(Building Simulation 2015), pp. 387-394. IBPSA, 2015.
[66] B. Seibold, A Mathematical Introduction to Traffic Flow Theory, in Proc. of Institute for Pure andApplied Mathematics, UCLA, 2015.
[67] S. P. Hoogendoorn, and P. H. Bovy, “State-of-the-art of Vehicular Traffic Flow Modelling,” in Proc. ofthe Institution of Mechanical Engineers, Part I: Journal of Systems and Control Engineering, vol. 215,no. 4, pp. 283-303, 2001.
[68] W. Wei, “Practical speed-flow relationship model of highway traffic-flow,” Journal of Southeast Univer-sity (Natural Science Edition), vol. 4, pp. 025, 2003.
[69] M. Peng, N. Xiong, G. Xie, and L. Yang, “The Weighted Shortest Path Search in Mobile GIS Services,”Advances in Grid and Pervasive Computing, pp. 384-395, 2008.
[70] E. Sortomme, M. M. Hindi, S. J. MacPherson, and S. Venkata, “Coordinated Charging of Plug-InHybrid Electric Vehicles to Minimize Distribution System Losses,” IEEE transactions on smart grid,vol. 2, no. 1, pp. 198-205, 2011.
[71] Z. Liu, W. Hou, and Y. Li, “Research of packet loss model in wireless adhoc networks,” ComputerEngineering and Applications (in Chinese), vol. 45, no. 9, pp. 108-109, 2009, 2009.
28

[72] K. Ang, and K. Neo, “Real-life application of a simple continuum traffic flow model,” InternationalJournal of Mathematical Education in Science and Technology, vol. 36, no. 8, pp. 913-922, 2005.
[73] E. J. Palacios-Garcia, A. Moreno-Munoz, I. Santiago, I. M. Moreno-Garcia, and R. J. Real-Calvo,“Study of a smart energy community PV and storage requirements: A modeling approach towardsnet-zero energy,” in in Proc. ENERGY 6th Int. Conf. Smart Grids, Green Commun. IT Energy-AwareTechnol., 2016, pp. 37-41.
[74] M. Deru, K. Field, D. Studer, K. Benne, B. Griffith, P. Torcellini, B. Liu, M. Halverson, D. Winiarski,and M. Rosenberg, “US Department of Energy Commercial Reference Building Models of the NationalBuilding Stock,” National Renewable Energy Laboratory, Golden, CO, NREL/TP-5500-46861, Feb.2011.
[75] U.S. Department of Energy. Commercial and Residential Hourly Load Profiles for allTMY3 Locations in the United States. Accessed: Dec. 3, 2017. [Online]. Available:https://openei.org/datasets/files/961/pub/
[76] W. A. Martin, and N. A. McGuckin, “Travel Estimation Techniques for Urban Planning,” NationalAcademy Press, Washington, DC, NCHRP Report 365, 1998.
29

Xing Lu received the B.S. degree and M.Eng. degree in power engineering from Tongji University, Shanghai,China, in 2014 and 2016. He is now a Ph.D. student at the University of Colorado, Boulder, CO, USA. Hehas worked in the Sustainable Building Systems Laboratory (SBS Lab) at CU Boulder since 2017 with Dr.Wangda Zuo as his advisor. His research interests include the modeling and simulation of building systems,urban energy system, and large cyber-physical systems.
Kathryn Hinkelman received the B.S. degree in mechanical engineering from the University of Denver,Denver, CO, USA in 2013. In 2015, she received the M.S. degree in mechanical engineering from theUniversity of California at Berkeley, Berkeley, CA, USA. She is currently pursuing the Ph.D. degree inarchitectural engineering at the University of Colorado Boulder, Boulder, CO, USA. From 2014 to 2015, shewas a Graduate Student Researcher with the Berkeley Energy and Sustainable Technologies Laboratory atthe University of California at Berkeley. Since 2018, she has been a Teaching Assistant with the Departmentof Civil, Environmental and Architectural Engineering at the University of Colorado Boulder. She is aStudent Member with ASHRAE, ICC, and IBPSA. Her research interests include modeling of smart andconnected communities, healthy buildings, district energy systems, and sustainable energy systems for low-income populations.
Yangyang Fu (S’19) received the B.S. degree in civil engineering from PLA University of Science andTechnology, Nanjing, China, in 2012 and the M.S. degree in mechanical engineering from Tongji University,Shanghai, China, in 2016. He is currently pursuing the Ph.D. degree in architectural engineering at theUniversity of Colorado Boulder, Boulder, CO, USA. From 2013 to 2016, he was a Research Assistant withthe Institute of Heating, Ventilation and Air Conditioning Engineer, Tongji University, Shanghai, China.Since 2017, he has been a Research Assistant with the Department of Civil, Environmental and ArchitecturalEngineering at the University of Colorado Boulder. His research interests include equation-based modeling,simulation and optimization, data center demand response, and grid-interactive buildings.
Jing Wang received the B.Eng. degree in the built environment and equipment engineering from TongjiUniversity, Shanghai, China in 2013 and the M.S. degree in mechanical engineering from the TechnicalUniversity of Braunschweig, Braunschweig, Germany in 2017. Currently, she is pursuing the Ph.D. degreein architectural engineering at the University of Colorado Boulder, Boulder, CO, USA. In summer 2018,she took an internship at the Pacific Northwest National Laboratory where she worked on building reduced-order model development for control deployment and aggregated building load flexibility quantification. Sheis an ASHRAE Student Member. Her current research interests are resilient energy systems, building energysystem modeling and control, and building-to-grid integration.
Wangda Zuo received the B.S. degree and M.Eng. degree in automation from Chongqing University inChongqing, China in 2000 and 2003. He also earned a M.Sc. degree in computational engineering fromFriedrich-Alexander-University Erlangen-Nuremberg in Erlangen, Germany in 2005. He received the Ph.Ddegree in mechanical engineering from Purdue University in West Lafayette, IN, USA in 2010.
He is now an Associate Professor and Lewis-Worcester Faculty Fellow in the Department of Civil, En-vironmental and Architectural Engineering at the University of Colorado Boulder in Boulder, CO, USA.Meanwhile, he also has a joint appointment with the Commercial Buildings Group at the National Re-newable Energy Laboratory in Golden, CO, USA. He was the recipient of the ASCE ExCEEd Fellowship,IBPSA-USA Emerging Professional Award, Eliahu I. Jury Early Career Research Award, ASHRAE Distin-guished Service Award, Provost Research Award, and SEEDS Leadership Award. He currently serves asTreasurer and Affiliate Director (representing USA) of the International Building Performance SimulationAssociation (IBPSA); Chair and Voting Member of ASHRAE Technical Committee (TC) 7.4 Exergy Anal-ysis for Sustainable Buildings; and Vice Chair of ASHRAE (TC) 4.10 Indoor Environment Modeling. Healso served as the founding Chair of IBPSA-USA Research Committee and Voting Member of ASHRAE TC4.7 Energy Calculations. Prior to joining CU Boulder, he was an Assistant Professor at the University ofMiami and a Computational Research Scientist at Lawrence Berkeley National Laboratory.
Qianqian Zhang (S’16) received the B.S. degree in telecommunication engineering with management fromBeijing University of Posts and Telecommunications, Beijing, China, in 2015. She is currently pursuing thePh.D degree at the Bradley Department of Electrical and Computer Engineering, Virginia Tech, Blacks-
30

burg, VA, USA. Her research interests include wireless communication, unmanned aerial vehicle (UAV)communications, and machine learning.
Walid Saad (S’07, M’10, SM’15, F’19) received his Ph.D degree from the University of Oslo in 2010. Heis currently an Associate Professor at the Department of Electrical and Computer Engineering at VirginiaTech, where he leads the Network Science, Wireless, and Security laboratory. His research interests includewireless networks, machine learning, game theory, security, unmanned aerial vehicles, cyber-physical systems,and network science.
Dr. Saad is a Fellow of the IEEE and an IEEE Distinguished Lecturer. He is also the recipient of theNSF CAREER award in 2013, the AFOSR summer faculty fellowship in 2014, and the Young InvestigatorAward from the Office of Naval Research (ONR) in 2015. He was the author/co-author of seven conferencebest paper awards at WiOpt in 2009, ICIMP in 2010, IEEE WCNC in 2012, IEEE PIMRC in 2015, IEEESmartGridComm in 2015, EuCNC in 2017, and IEEE GLOBECOM in 2018. He is the recipient of the 2015Fred W. Ellersick Prize from the IEEE Communications Society, of the 2017 IEEE ComSoc Best YoungProfessional in Academia award, and of the 2018 IEEE ComSoc Radio Communications Committee EarlyAchievement Award. From 2015-2017, Dr. Saad was named the Stephen O. Lane Junior Faculty Fellow atVirginia Tech and, in 2017, he was named College of Engineering Faculty Fellow. He currently serves as aneditor for the IEEE Transactions on Wireless Communications, IEEE Transactions on Mobile Computing,IEEE Transactions on Cognitive Communications and Networking, and IEEE Transactions on InformationForensics and Security. He is an Editor-at-Large for the IEEE Transactions on Communications.
31