an investigation on fluorescence quenching of certain porphyrins...
TRANSCRIPT

ARTICLE IN PRESS
Journal of Luminescence 129 (2009) 854–860
Contents lists available at ScienceDirect
Journal of Luminescence
0022-23
doi:10.1
� Corr
E-m
journal homepage: www.elsevier.com/locate/jlumin
An investigation on fluorescence quenching of certain porphyrinsby colloidal CdS
M. Asha Jhonsi, A. Kathiravan, R. Renganathan �
School of Chemistry, Bharathidasan University, Tiruchirappalli 620 024, Tamil Nadu, India
a r t i c l e i n f o
Article history:
Received 15 April 2008
Received in revised form
5 March 2009
Accepted 12 March 2009Available online 2 April 2009
Keywords:
Porphyrins
Fluorescence quenching
Colloidal CdS
13/$ - see front matter & 2009 Elsevier B.V. A
016/j.jlumin.2009.03.013
esponding author. Tel.: +914312407053; fax
ail address: [email protected] (R. Renganat
a b s t r a c t
Certain porphyrin derivatives namely meso-tetraphenylporphyrin (TPP), meso-tetrakis(4-carboxyphe-
nyl)porphyrin (TCPP), meso-tetrakis(4-sulfonatophenyl)porphyrin (TSPP) were examined as sensitizers
for colloidal CdS. The interaction of these porphyrins and colloidal CdS were studied by absorption,
infrared, steady state and time resolved fluorescence spectroscopy and transient absorption techniques.
The apparent association constants (Kapp) resulting from adsorption of porphyrins on CdS surface were
calculated from both absorption and fluorescence studies and they agree well. Using all the
spectroscopic measurements we confirmed that the interaction between porphyrins and colloidal
CdS occurs through ground state complex formation and the quenching follows static mechanism.
& 2009 Elsevier B.V. All rights reserved.
1. Introduction
The photosensitization of large band gap semiconductors usingvisible light absorbing dyes has been the subject of activeinvestigation over the past 15 years [1–7]. The interactionbetween colloidal CdS with porphyrins is an interesting anduseful phenomenon to extend its absorptive range and hasapplications in the field of photocatalysis [8] non-linear opticalmaterials [9] in solar cells [10] and display devices [11]. There arevarious molecules [12–16] whose interaction with colloidal CdSyields surface modified nanoparticles that results in changingtheir absorbance properties as well as interactions with theenvironment [17]. Among the various molecules, porphyrins are ofgreat importance in the field of physical and chemical processeson colloid surfaces [18]. Extensive information accumulated overthe years on various porphyrin derivatives allow a choice for thedesign of efficient sensitizer with appropriate charge and groundand excited state redox properties [19]. There are some reportsavailable for the study of interaction between various dyes andquantum dots (QDs) which is related to the energy transfer fromQDs to the dye molecules [20–24].
Porphyrins also find use in biochemistry, catalysis andphotochemistry [25]. Xuezhong He and co workers made somecomparative studies of different interactions between isomericporphyrins and CdS nanoparticles [26]. Recently, we have reportedfluorescence quenching of meso-tetrakis(4-sulfonatophenyl)por-phyrin (TSPP) and meso-tetrakis(N-methylpyridyl)porphyrin by
ll rights reserved.
: +91431 2407045.
han).
colloidal TiO2 and colloidal CdS, respectively [27,28]. It was foundthat porphyrins adsorbed on colloidal semiconductor nanoparti-cles surface through their anchoring groups, and there is anelectron injection from excited state porphyrins into the conduc-tion band of colloidal nanoparticles. In this work we have reportedthe photoinduced interaction between certain porphyrins(structures shown in Scheme 1) and colloidal CdS. Importance ofmolecular structure on the interaction between porphyrins andcolloidal CdS has also been studied.
2. Experimental
2.1. Materials
All the porphyrins were purchased from Aldrich and usedwithout further purification. Cadmium chloride (CdCl2)was obtained from Fluka and N,N0-dimethylformamide (DMF)was distilled under diminished pressure prior to use and hydrogensulphide gas was generated in a Kipp’s apparatus from ferroussulphide and hydrochloric acid.
2.2. Instrumentation
2.2.1. Spectroscopic measurements
Absorption spectra were recorded using Cary 300 UV�visiblespectrophotometer. The samples were carefully purged by usingpure nitrogen gas for 10 min. Quartz cells (4�1�1 cm3) withhigh-vacuum Teflon stopcocks were used for purging.
Steady state fluorescence quenching measurements werecarried out with JASCO FP-6500 spectrofluorimeter. The excitation
ARTICLE IN PRESS
Scheme 1. Structure of Porphyrins.
Table 1
Absorption (lexi) and Emission (lemi) wavelengths of the porphyrins (TCPP, TSPP
and TPP) and apparent association constants of porphyrins with colloidal CdS
obtained from both absorption and fluorescence study.
S. No Sensitizer lexi (nm) lemi (nm) Kapp�102 M�1
Absorbance Fluorescence
1 TCPP 419 649 16.8 51.54
2 TSPP 418 652 9.75 31.05
3 TPP 416 650 1.82 12.48
M. Asha Jhonsi et al. / Journal of Luminescence 129 (2009) 854–860 855
and emission slit width (each 5 nm) and scan rate (500 nm/min)were kept constant for all the experiments. The excitation andemission wavelengths of porphyrins are shown in Table 1.
Fourier transform infrared (FT-IR) spectra were recorded byusing a JASCO-460 plus model spectrometer using KBr pellet withthe resolution of 4 cm�1.
Fluorescence lifetime measurements were carried out in apicosecond time correlated single photon counting (TCSPC)spectrometer. The excitation source is the tunable Ti–sapphirelaser (TSUNAMI, Spectra Physics, USA). The fluorescence decaywas analyzed by using the software provided by IBH (DAS-6).
The Nd-YAG laser source produces nanosecond pulses (8 ns) of355 nm light and energy of the laser pulse was around 150 mJ.Dichroic mirrors were used to separate the third harmonic fromthe second harmonic and the fundamental output of the Nd-YAGlaser. The monitoring source was a 150 W pulsed xenon lamp,which was focused on the sample at 901 to the incident laserbeam. The beam emerging through the sample was focused on toa Czerny-Turner monochromator using a pair of lenses. Thedetection was carried out using a Hamamatsu R-928 photomul-tiplier tube. The transient signals were captured with an Agilentinfiniium digital storage oscilloscope interfaced to a computer.
2.2.2. Cyclic voltammetric measurements
The oxidation potential of meso-tetraphenylporphyrin (TPP),TSPP and meso-tetrakis(4-carboxyphenyl)porphyrin (TCPP) weremeasured in DMF with tetrabutylammonium perchlorate (TBAP)(0.1 M) as electrolyte. The experimental setup consisted of aplatinum working electrode, a glassy carbon counter electrodeand a silver reference electrode. Reversible peak potentials weremeasured at different scan rates (0.05 V/s). All samples weredeaerated by bubbling with pure nitrogen gas for ca. 5 min atroom temperature.
2.3. Preparation of colloidal CdS
Although there are several methods known to generatenanosized cadmium sulphide, it is still desirous to have a verysimple one-step preparation method reported by Khanna et al.[29]. Typically, 0.02 M solution of CdCl2 in DMF was used for thepreparation, which was taken in a round bottom flask and
hydrogen sulphide gas was passed for a few seconds withcontinuous stirring at room temperature in air. No protectingagents were added for the preparation of colloidal CdS. Thereaction mixture was stirred at the same temperature for fewminutes to obtain fluorescent yellow solution. The resultingyellow colloid was excess in Cd2+ which was diluted to a requiredconcentration and was stored at 4 1C. The solutions were analyzedby UV-visible spectroscopy to identify the presence of nanopar-ticles.
The absorption studies showed the formation of nanosized CdShaving absorption in the range of 425–450 nm in DMF in a muchdiluted solution (typically o1�10�4 M). It is well understoodwith available literature that milder experimental conditionsfavour the formation of smaller particle size and the stability ofthese nanoparticles. The stability of the prepared colloidal CdSdepended on the reaction time. In the present study where thereaction time was kept o5 min resulted in absorption bands inthe visible region indicating better quality of CdS quantum dots.The absorption bands of these samples are stable for 24–48 h.Furthermore, these solutions have shown bright light emissionwhen illuminated with ultraviolet lamp in the region of 520 nm(Fig. 9). Upon prolonged exposure (more than a week in somecases) to normal environment it became cloudy which isconsistent with the observations made by Chen et al. [30].
The particle size of the prepared colloidal CdS has beendetermined from the relationship between band gap shift (DEg)and radius (R) of quantum size particles using Eq. (1)
DEg ¼p2h2
2R2½1=me � þ1=mh�� �
1:8e2
�Rþ Polarisation terms (1)
where h is Planck’s constant, R is the radius of the particle, me*and mh* are the effective masses of the e� (electron) and h+ (hole),respectively, in the semiconductor, e is the electronic charge, e isthe relative permittivity of the semiconductor.
A value of 0.153 me was used for the reduced effective mass ofthe exciton (1/m ¼ 1/me+1/mh) of CdS, the columbic and polariza-tion terms in the equation are neglected. The calculated size of theprepared colloidal CdS is 3.35 nm.
3. Results and discussion
3.1. Absorption characteristics of porphyrins with colloidal CdS
Fig. 1 shows the normalized absorption and emission spectra ofporphyrins (TCPP, TSPP and TPP) in DMF. Fig. 2 shows the steadystate absorption spectrum of TCPP in the absence and presence ofcolloidal CdS in different concentrations. The absorption spectrareveals that while increasing CdS concentration, the opticaldensity of the mixture regularly increases (Fig. 2, insert b) butthere is no new peak formation and no peak shift was observed. Itis due to the partial adsorption of TCPP on the surface of colloidalCdS to form a surface complex as shown in Eq. (2) (other twoporphyrins such as TSPP and TPP also gave the similar type of

ARTICLE IN PRESS
Fig. 1. Normalized absorption and emission spectra of porphyrins (1�10�5 M) in DMF (TSPP—black, TCPP—red and TPP—blue in colors). Inset shows the ‘‘Q’’ bands of
porphyrins in the wavelength region of 450–750 nm. (For interpretation of the references to colour in this figure legend, the reader is referred to the web version of this
article.)
Fig. 2. Absorption spectrum of TCPP (1�10�5 M) in the presence of colloidal CdS in the concentration range of 0–5�10�4 M in DMF. Insets are the (a) linear dependence of
1/A�A0 vs. reciprocal concentration of colloidal CdS and (b) increase in absorbance at 419 nm.
M. Asha Jhonsi et al. / Journal of Luminescence 129 (2009) 854–860856
observations, spectra are not shown here). Similar type ofadsorption behavior of charged molecules on the surface ofcolloidal TiO2 was reported by Hilgendorff et al. [31].
The equilibrium for the formation of complex betweenporphyrins and CdS is defined by Eq. (2), where Kapp is theapparent association constant,
Porphyrinþ CdS ÐKapp
Porphyrin . . .CdS (2)
Kapp ¼½Porphyrin . . .CdS�
½Porphyrin� � ½CdS�(3)
The Kapp values are calculated by the method reported by Benesiand Hildebrand method [32] using the following equation:
Aobs ¼ ð1� aÞC0�porphyrin1þ aC0�c1 (4)
where Aobs is the observed absorbance of the porphyrin solutioncontaining different concentrations of colloidal CdS at 419, 418and 416 nm; a is the degree of association between porphyrinsand CdS; eporphyrin and ec are the molar extinction coefficients atthe defined wavelengths for porphyrins and the formed complex,respectively. Eq. (4) can be expressed by Eq. (5), where the A0 andAc are the absorbances of porphyrins and the complex at 419, 418
and 416 nm, respectively, with the concentration of C0
Aobs ¼ ð1� aÞA0 þ aAc (5)
At relatively high CdS concentrations, a can be equated to(Kapp [CdS])/(1+Kapp[CdS]). In this case, Eq. (5) can be expressedas Eq. (6)
1
Aobs � A0¼
1
Ac � A0þ
1
KappðAc � A0Þ½CdS�(6)
Therefore, if the enhancement of absorbance at 419, 418 and416 nm was due to absorption of complex, one would expect alinear relationship between 1/(Aobs�A0) and the reciprocalconcentration of colloidal CdS (Fig. 2, insert a) with a slope equalto 1/Kapp(Ac�A0) and an intercept equal to 1/(Ac�A0).The calculated Kapp values from the straight line are shown inTable 1 and the values decreased in the following order:
TCPP4TSPP4TPP
TCPP and TSPP show more Kapp values due to the presence ofmore electronegative carboxylic and sulphonyl groups on theirperiphery, so they have higher electrostatic interaction withcolloidal CdS surface which is having excess Cd2+. TPP shows verylow Kapp value because of the absence of any charged anchoring
ARTICLE IN PRESS
M. Asha Jhonsi et al. / Journal of Luminescence 129 (2009) 854–860 857
group in its structure, hence anchoring groups has significanteffect on the adsorption process.
3.2. FT-IR characteristics
Absorption spectroscopic measurement is not enough toinvestigate the molecular structure of adsorbed porphyrins onthe CdS surface. So Fourier transform infrared technique was usedto gain further information about the nature of interactionbetween them.
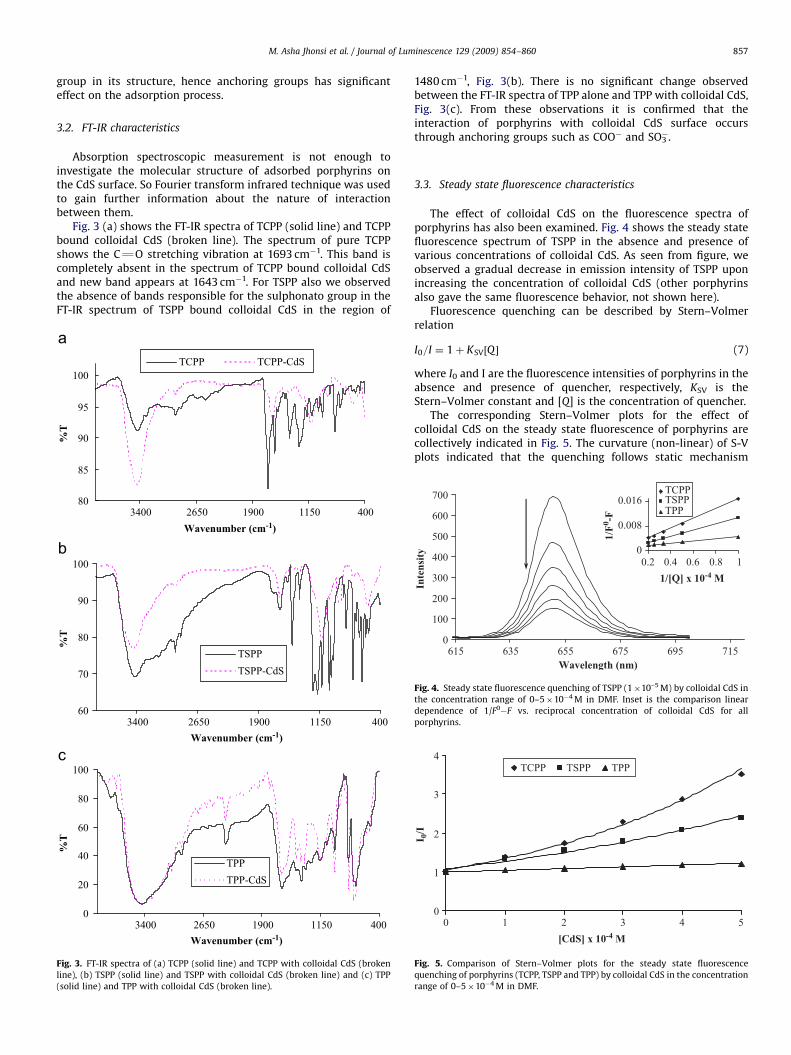
Fig. 3 (a) shows the FT-IR spectra of TCPP (solid line) and TCPPbound colloidal CdS (broken line). The spectrum of pure TCPPshows the CQO stretching vibration at 1693 cm�1. This band iscompletely absent in the spectrum of TCPP bound colloidal CdSand new band appears at 1643 cm�1. For TSPP also we observedthe absence of bands responsible for the sulphonato group in theFT-IR spectrum of TSPP bound colloidal CdS in the region of
Fig. 3. FT-IR spectra of (a) TCPP (solid line) and TCPP with colloidal CdS (broken
line), (b) TSPP (solid line) and TSPP with colloidal CdS (broken line) and (c) TPP
(solid line) and TPP with colloidal CdS (broken line).
1480 cm�1, Fig. 3(b). There is no significant change observedbetween the FT-IR spectra of TPP alone and TPP with colloidal CdS,Fig. 3(c). From these observations it is confirmed that theinteraction of porphyrins with colloidal CdS surface occursthrough anchoring groups such as COO� and SO3
�.
3.3. Steady state fluorescence characteristics
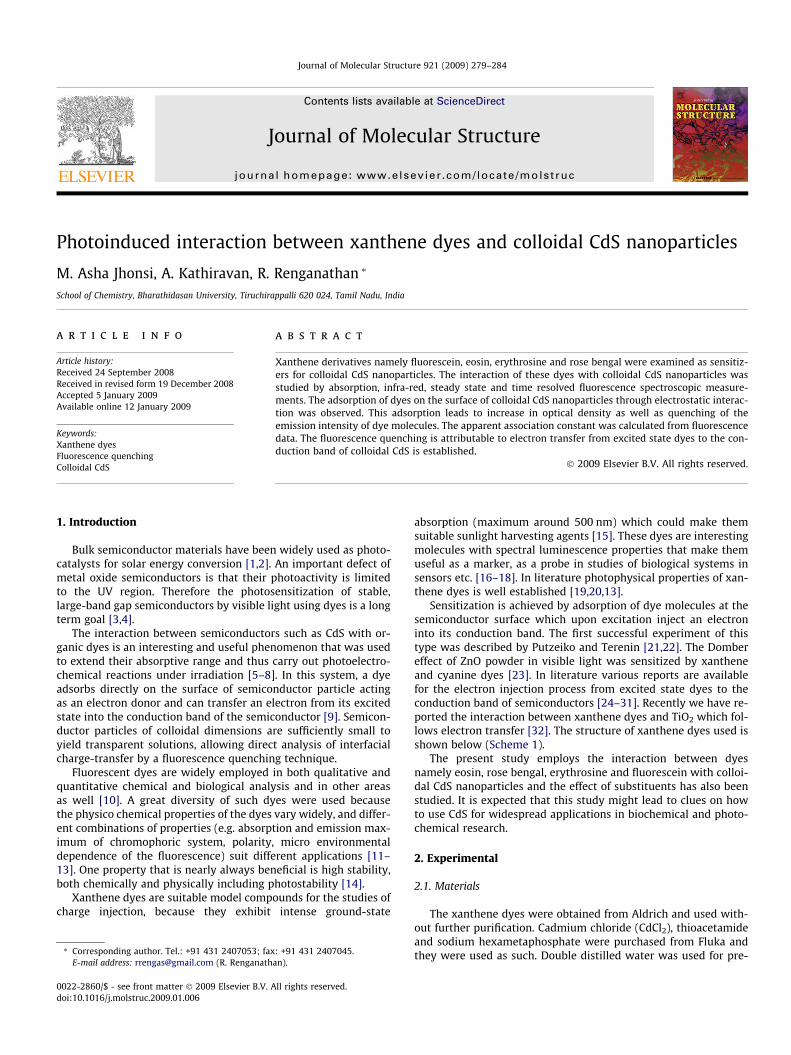
The effect of colloidal CdS on the fluorescence spectra ofporphyrins has also been examined. Fig. 4 shows the steady statefluorescence spectrum of TSPP in the absence and presence ofvarious concentrations of colloidal CdS. As seen from figure, weobserved a gradual decrease in emission intensity of TSPP uponincreasing the concentration of colloidal CdS (other porphyrinsalso gave the same fluorescence behavior, not shown here).
Fluorescence quenching can be described by Stern–Volmerrelation
I0=I ¼ 1þ KSV½Q � (7)
where I0 and I are the fluorescence intensities of porphyrins in theabsence and presence of quencher, respectively, KSV is theStern–Volmer constant and [Q] is the concentration of quencher.
The corresponding Stern–Volmer plots for the effect ofcolloidal CdS on the steady state fluorescence of porphyrins arecollectively indicated in Fig. 5. The curvature (non-linear) of S-Vplots indicated that the quenching follows static mechanism
Fig. 4. Steady state fluorescence quenching of TSPP (1�10–5 M) by colloidal CdS in
the concentration range of 0–5�10�4 M in DMF. Inset is the comparison linear
dependence of 1/F0�F vs. reciprocal concentration of colloidal CdS for all
porphyrins.
Fig. 5. Comparison of Stern–Volmer plots for the steady state fluorescence
quenching of porphyrins (TCPP, TSPP and TPP) by colloidal CdS in the concentration
range of 0–5�10�4 M in DMF.

ARTICLE IN PRESS
Fig. 7. Fluorescence lifetime of porphyrins with various concentrations of CdS
colloid (0–4�10–4 M) in DMF.
M. Asha Jhonsi et al. / Journal of Luminescence 129 (2009) 854–860858
through ground state complex formation and it may rule out thedynamic mechanism.
From the fluorescence quenching data also, we can calculatethe apparent association constant (Kapp) by using the followingEq. (8),
1
F0� F¼
1
F0� F 0þ
1
KappðF0� F 0Þ½CdS�
(8)
where Kapp is the apparent association constant, F0 is the initialfluorescence intensity of porphyrins, F0 is the fluorescenceintensity of CdS adsorbed porphyrins and F is the observedfluorescence intensity in their maximum. The plot of 1/F0
�F vs. 1/[CdS] for all the three porphyrins are collectively shown in theinsert of Fig. 4. There is a good linear relationship between 1/F0
�F
and the reciprocal concentration of colloidal CdS. From the slope,the Kapp has been assessed and the calculated values are shown inTable 1. The value of Kapp obtained from the data of fluorescencemeasurement matches well with that determined from theabsorption study. The good agreement between these values ofKapp highlighted the validity of assumption proposed for theassociation between porphyrins and colloidal CdS.
Fig. 8. Time-resolved transient absorption spectra recorded after 400 nm laser
pulse excitation of TCPP in absence and presence of colloidal CdS in DMF. Inset is
the time decay plot for TCPP (solid line) and TCPP–CdS (broken line).
3.4. Time resolved fluorescence characteristics
Fluorescence lifetime measurement is useful for understandingthe type of interaction in the colloidal semiconductor�dyesystems. For example, it has been shown earlier [33] that thesensitizer molecules adsorbed on TiO2 surface had a significantlyshorter excited singlet lifetime than in homogeneous solution andthis decrease in lifetime could be correlated with charge injectionprocess. In general, the measurement of fluorescence lifetime isthe most definitive method to distinguish static and dynamicquenching processes [34].
In the present work we have studied the effect of colloidal CdSon the fluorescence lifetime of porphyrins. Fig. 6 shows the timeresolved fluorescence decay of TCPP in the absence and presenceof colloidal CdS. The fluorescence of porphyrins exhibitmonoexponential decay not only in the dilute solutions but alsoin the presence of colloidal CdS. While increasing theconcentration of colloidal CdS there is no change in thefluorescence lifetime of the TCPP, it was almost constant (Fig. 7,the fluorescence decay for other two porphyrins TSPP and TPP areas same as TCPP, not shown here). This result resembles withthe steady state measurement which indicates that thefluorescence quenching of porphyrins belongs to the staticquenching mechanism.
Fig. 6. Fluorescence decay of TSPP (1�10�5 M, lexi ¼ 400 nm) by colloidal CdS in
the concentration range of 0–5�10�4 M in DMF.
3.5. Mechanism of quenching
The fluorescence quenching can be enlightened by differentmechanisms such as electron transfer or energy transfer from theporphyrins to the colloidal CdS and also the formation of acomplex (Eq. (2)) which has no fluorescence.
The band gap energy of CdS semiconductor (Eg ¼ 2.6 eV) [35] isgreater than the excited state energy of porphyrins (�1.90 eV) [36]and no fluorescence emission of the porphyrins is absorbed bycolloidal CdS (Fig. 8). Thus, the energy transfer from excited stateporphyrins to the colloidal CdS is ruled out. It can therefore beconcluded that the fluorescence quenching shown in Fig. 4 is notcaused by energy transfer (Fig. 9).
The other possible mechanism is electron transfer from theexcited state of porphyrins to the conduction band of colloidal CdSas shown in Eq. (9)
Porphyrin� þ CdS! Porphyrinþ þ CdSðe�Þ (9)
This inference can be further defined by the difference betweenexcited state oxidation potential of porphyrins and energy level ofthe conduction band potential of CdS. With the use of oxidationpotential of porphyrins and the excited state energy (excited stateenergy has been calculated from the emission wavelength of theporphyrins by reported method [36]), according to the equationEs*/s+ ¼ Es/s+�Es, one can obtain the oxidation potential of theexcited state porphyrins as shown in Table 2. Since these levels

ARTICLE IN PRESS
Fig. 9. Normalized absorption, emission spectra of colloidal CdS (solid and dotted
line respectively) and the emission spectra of porphyrins (solid lines) in DMF.
Table 2Photophysical properties of porphyrins like fluorescence lifetime (t), excited state
energy (Es), oxidation potential in ground (Es/s+) and excited state (Es*/s+).
S. No Porphyrins t (ns)a E(S) (eV)b Es/s+ (V)c Es*/s+ (V)d
1 TCPP 10.5 1.91 1.08 �0.83
2 TSPP 10.9 1.90 0.98 �0.92
3 TPP 10.6 1.90 1.02 �0.88
a Obtained from time-resolved measurementsb Singlet state energy of the porphyrins calculated from the fluorescence
maximum based on the reported method [36].c The oxidation potentials in DMF vs. NHE.d Calculated from the equation, Es*/s+ ¼ Es/s+�Es, where Es/s+ is the oxidation
potential of the ground state porphyrins and Es*/s+ is the oxidation potential of the
excited state porphyrins and Es is the excitation energy.
Scheme 2. Diagram illustrating the energetics of porphyrins and colloidal CdS.
M. Asha Jhonsi et al. / Journal of Luminescence 129 (2009) 854–860 859
are energetically higher (Scheme 2) than the energy level of theconduction band of CdS (�1.0 V vs. NHE) [37] and hence theelectron transfer path in Eq. (9) is not allowedthermodynamically. This inference is the major differencebetween our porphyrins�CdS system and the earlier reportedPorphyrins�TiO2 [27] system. Similar type of reports is availablein literature for example fluorescein ester derivatives with CdScolloids system by Zhang et al. [35].
From the absorption study of porphyrins with colloidalCdS we observed that there is an increase in absorption of
porphyrinyCdS complex in the region below 400 nm (Fig. 2) butno emission peak appeared in the fluorescence spectra. Theseresults indicate that the complex (porphyrinsyCdS) has nofluorescence and the observed fluorescence is only from theuncomplexed porphyrins. So in the present system the fluores-cence quenching of porphyrins (TCPP, TSPP and TPP) is mainly dueto the ground state complex formation (Eq. (2)) which has nofluorescence.
3.6. Transient absorption characteristics
It has been shown earlier [38] that laser flash photolysis couldbe a convenient technique to investigate the electron transferprocesses in colloidal semiconductor systems. If the observedfluorescence quenching of porphyrins results in an electroninjection into the conduction band of colloidal CdS (as shown inEq. (9)) one would expect to see the production of cation radical ofporphyrin. The results of the flash photolysis experiments carriedout with the excitation of porphyrin are described below.
In order to study the interaction between excited porphyrinsand colloidal CdS, we measured the transient absorption spectra.Nanosecond laser flash photolysis experiments were carried outusing 400 nm laser pulse as the excitation source. The transientabsorption spectra recorded 20ms after laser pulse excitation forTCPP in the absence and presence of colloidal CdS are shown inFig. 8. TCPP upon excitation with the laser pulse shows transientwhich exhibited a complete decay with a lifetime of 46.5ms(insert of Fig. 8) at 450 nm was attributed to the triplet TCPP. Thebleaching in the 420 nm region indicates the depletion ofporphyrin absorption.
The presence of colloidal CdS (5�10�4 M) did not produce anychanges such as peak shift and new species formation in thetransient absorption recorded in the microsecond time scale, sothere is no excited state electron transfer in the presence ofcolloidal CdS. There is only change in the lifetime of TCPP (9.85ms)in the presence of colloidal CdS. This further confirmed theargument made that the quenching does not follow electrontransfer from excited porphyrins to the conduction band ofcolloidal CdS.
3.7. Importance of molecular structure in energy conversion
implications
In recent years, many researchers have tried to design anddevelop suitable low cost organic dyes, which can be used in solarcells with higher efficiency. Molecular structure of the organicdyes is an important factor to get higher efficiency [39–41]. In ourprevious studies [42–44] we have observed that even a smallstructural change can increase the electron injection efficiency ofxanthene dyes to semiconductor nanoparticles. In the presentinvestigation we observed that TCPP shows more efficiencythan the others due to its structure containing more electro-negative carboxyl group as substituents for interaction with thecolloidal CdS.
4. Conclusion
The interaction of porphyrins with colloidal CdS has beenstudied by using various spectroscopic techniques. Adsorption ofporphyrins on the surface of colloidal CdS has been observed andconfirmed by FT-IR measurements. The apparent associationconstant (Kapp) was calculated from absorption changes as wellas fluorescence quenching data. The fluorescence quenching isdue to ground state complex formation which has no fluorescence

ARTICLE IN PRESS
M. Asha Jhonsi et al. / Journal of Luminescence 129 (2009) 854–860860
and the static nature of quenching mechanism was confirmedby ground and excited state absorption and fluorescencemeasurements.
Acknowledgments
R.R. and M.A. thank DST (Ref: SR/NM/NS-16/2007, dt.: 26-09-08) (Government of India) for the project and fellowshiprespectively. Authors also thank DST-FIST and UGC-SAP forspectrofluorimeter facility in the School of Chemistry, Bharathi-dasan University, Trichy and Dr. S. Anandan, (NIT, Trichy) forproviding CV facilities. We are thankful to Prof. P. Ramamoorthy,NCUFP, University of Madras, Chennai for lifetime measurements.
References
[1] C.A. Koval, J.N. Howaxd, Chem. Rev. 92 (1992) 411.[2] C. Wang, C. Liu, W. Wang, T. Shen, J. Photochem. Photobiol. A: Chem. 109
(1997) 159.[3] B. O’Regan, M. Gratzel, Nature 353 (1991) 737.[4] J.Z. Zhang, R.H. O’Neil, T.W. Roberti, J. Phys. Chem. 98 (1994) 3859.[5] A. Hagfeldt, M. Gratzel, Chem. Rev. 95 (1995) 49.[6] E.K. Putzeiko, A. Terenin, Z. Fiz. Khim. 23 (1949) 676.[7] J. Moser, M. Gratzel, J. Am. Chem. Soc. 106 (1984) 6557.[8] S. Shiojiri, T. Hirai, I. Komasawa, J. Chem. Soc. Chem. Commun. (1998) 1439.[9] K. Murakoshi, H. Hosokawa, M. Saitoh, Y. Wada, H. Mori, S. Yanagida, J. Chem.
Soc., Faraday Trans. 94 (1998) 579.[10] J. Britt, C. Ferekides, Appl. Phys. Lett. 62 (1993) 2851.[11] S. Schmitt-Rink, D.S. Chemla, D.A.B. Miller, Adv. Phys. 38 (1989) 89.[12] A. Datta, A. Saha, A.K. Sinha, S.N. Bhattacharyya, S. Chatterjee, J. Photochem.
Photobiol. B: Biol. 78 (2005) 69.[13] A. Datta, S. Chatterjee, A.K. Sinha, S.N. Bhattacharyya, A. Saha, J. Lumin. 121
(2006) 553.[14] L. Tan, L.Y. Liu, Q.J. Xie, Y. Zhang, S. Yao, Anal. Sci. 20 (2004) 441.[15] C. Chen, Xiaoyan Qi, B. Zhou, J. Photochem. Photobiol. A. Chem. 109 (1997)
155.[16] Z. Zhou, S. Qian, S. Yao, Z. Zhang, Radiat. Phys. Chem. 65 (2002) 241.
[17] C.B. Mou, D.M. Chen, X.Y. Wang, Chem. Phys. Lett. 179 (1991) 237.[18] K. Kalyanasundaram, N. Vlachopoulos, V. Krishnan, J. Phys. Chem. 91 (1987)
2342.[19] X.Z. He, Y.L. Zhou, M.H. Zhang, Dyes Pigments 39 (1998) 173.[20] E. Zenkevich, T. Blaudeck, M. Abdel-Mottaleb, F. Cichos, A. Shulga, C. von
Borczyskowski, Int. J. Photoenergy (2006) 1 Article ID 90242.[21] E. Zenkevich, F. Cichos, A. Shulga, E.P. Petrov, T. Blaudeck, C. von
Borczyskowski, J. Phys. Chem. B 109 (2005) 8679.[22] S. Kang, M. Yasuda, H. Miyasaka, H. Hayashi, M. Kawasaki, T. Umeyama,
Y. Matano, K. Yoshida, S. Isoda, H. Imahori, ChemSusChem 1 (2008) 254.[23] I. Potapova, R. Mruk, C. Hubner, R. Zentel, T. Basche, A. Mews, Angew. Chem.
117 (2005) 2490.[24] A.R. Clapp, I.L. Medintz, J.M. Mauro, B.R. Fisher, M.G. Bawendi, H. Mattoussi,
J. Am. Chem. Soc. 126 (2004) 301.[25] F.J. Vergeldt, R.B.M. Koehorst, A.V. Hoek, J. Phys. Chem. 99 (1995) 4397.[26] X. He, Y. Zhou, Y. Zhou, M. Zhang, T. Shen, J. Colloid Interface Sci. 225 (2000)
128.[27] A. Kathiravan, V. Anbazhagan, M.A. Jhonsi, R. Renganathan, Spectrochim. Acta
A 70 (2007) 615.[28] M. Asha Jhonsi, R. Renganathan, Z. Phys. Chem. 222 (2008) 1601.[29] P.K. Khanna, R. Gokhale, V.V.V.S. Subbarao, Mater. Lett. 57 (2003) 2489.[30] W. Chen, Z. Lin, Z. Wang, Y. Xu, L. Lin, J. Mater. Sci. Technol. 14 (1998) 389.[31] M. Hilgendorff, V. Sundstrom, J. Phys. Chem. B 102 (1998) 10505.[32] H.A. Benesi, J.H. Hildebrand, J. Am. Chem. Soc. 71 (1949) 2703.[33] P.V. Kamat, J.P. Chauvet, R.W. Fessenden, J. Phys. Chem. 90 (1986) 1389.[34] J.R. Lakowicz, Principles of Fluorescence Spectroscopy, Plenum press, New
York, 1983, 258.[35] H. Zhang, Y. Zhou, M. Zhang, T. Shen, Y. Li, D. Zhu, J. Colloid Interface Sci. 264
(2003) 290.[36] E.J. Shin, D. Kim, J. Photochem. Photobiol. A: Chem. 152 (2002) 25.[37] P.V. Kamat, J. Phys. Chem. 93 (1989) 859.[38] P.V. Kamat, J.P. Chauvet, R.W. Fessenden, J. Phys. Chem. 90 (1986) 1389.[39] K. Hara, H. Sugihara, L.P. Singh, A. Islam, R. Katoh, M. Yanagida, K. Sayama,
S. Murata, H. Arakawa, J. Photochem. Photobiol. A: Chem. 145 (2001)117.
[40] K. Hara, H. Horiuchi, R. Katoh, L.P. Singh, H. Sugihara, K. Sayama, S. Murata,M. Tachiya, H. Arakawa, J. Phys. Chem. B 106 (2002) 374.
[41] K. Hara, T. Sato, R. Katoh, A. Furube, Y. Ohga, A. Shinpo, S. Suga, K. Sayama,H. Sugihara, H. Arakawa, J. Phys. Chem. B 107 (2003) 597.
[42] A. Kathiravan, V. Anbazhagan, M.A. Jhonsi, R. Renganathan, Z. Phys. Chem.221 (2007) 941.
[43] M. Asha Jhonsi, A. Kathiravan, R. Renganathan, J. Mol. Struct. 921 (2009) 279.[44] A. Kathiravan, R. Renganathan, J. Colloid Interface Sci. 331 (2009) 401.
Journal of Molecular Structure 921 (2009) 279–284
Contents lists available at ScienceDirect
Journal of Molecular Structure
journal homepage: www.elsevier .com/ locate /molst ruc
Photoinduced interaction between xanthene dyes and colloidal CdS nanoparticles
M. Asha Jhonsi, A. Kathiravan, R. Renganathan *
School of Chemistry, Bharathidasan University, Tiruchirappalli 620 024, Tamil Nadu, India
a r t i c l e i n f o
Article history:Received 24 September 2008Received in revised form 19 December 2008Accepted 5 January 2009Available online 12 January 2009
Keywords:Xanthene dyesFluorescence quenchingColloidal CdS
0022-2860/$ - see front matter � 2009 Elsevier B.V. Adoi:10.1016/j.molstruc.2009.01.006
* Corresponding author. Tel.: +91 431 2407053; faxE-mail address: [email protected] (R. Renganath
a b s t r a c t
Xanthene derivatives namely fluorescein, eosin, erythrosine and rose bengal were examined as sensitiz-ers for colloidal CdS nanoparticles. The interaction of these dyes with colloidal CdS nanoparticles wasstudied by absorption, infra-red, steady state and time resolved fluorescence spectroscopic measure-ments. The adsorption of dyes on the surface of colloidal CdS nanoparticles through electrostatic interac-tion was observed. This adsorption leads to increase in optical density as well as quenching of theemission intensity of dye molecules. The apparent association constant was calculated from fluorescencedata. The fluorescence quenching is attributable to electron transfer from excited state dyes to the con-duction band of colloidal CdS is established.
� 2009 Elsevier B.V. All rights reserved.
1. Introduction
Bulk semiconductor materials have been widely used as photo-catalysts for solar energy conversion [1,2]. An important defect ofmetal oxide semiconductors is that their photoactivity is limitedto the UV region. Therefore the photosensitization of stable,large-band gap semiconductors by visible light using dyes is a longterm goal [3,4].
The interaction between semiconductors such as CdS with or-ganic dyes is an interesting and useful phenomenon that was usedto extend their absorptive range and thus carry out photoelectro-chemical reactions under irradiation [5–8]. In this system, a dyeadsorbs directly on the surface of semiconductor particle actingas an electron donor and can transfer an electron from its excitedstate into the conduction band of the semiconductor [9]. Semicon-ductor particles of colloidal dimensions are sufficiently small toyield transparent solutions, allowing direct analysis of interfacialcharge-transfer by a fluorescence quenching technique.
Fluorescent dyes are widely employed in both qualitative andquantitative chemical and biological analysis and in other areasas well [10]. A great diversity of such dyes were used becausethe physico chemical properties of the dyes vary widely, and differ-ent combinations of properties (e.g. absorption and emission max-imum of chromophoric system, polarity, micro environmentaldependence of the fluorescence) suit different applications [11–13]. One property that is nearly always beneficial is high stability,both chemically and physically including photostability [14].
Xanthene dyes are suitable model compounds for the studies ofcharge injection, because they exhibit intense ground-state
ll rights reserved.
: +91 431 2407045.an).
absorption (maximum around 500 nm) which could make themsuitable sunlight harvesting agents [15]. These dyes are interestingmolecules with spectral luminescence properties that make themuseful as a marker, as a probe in studies of biological systems insensors etc. [16–18]. In literature photophysical properties of xan-thene dyes is well established [19,20,13].
Sensitization is achieved by adsorption of dye molecules at thesemiconductor surface which upon excitation inject an electroninto its conduction band. The first successful experiment of thistype was described by Putzeiko and Terenin [21,22]. The Dombereffect of ZnO powder in visible light was sensitized by xantheneand cyanine dyes [23]. In literature various reports are availablefor the electron injection process from excited state dyes to theconduction band of semiconductors [24–31]. Recently we have re-ported the interaction between xanthene dyes and TiO2 which fol-lows electron transfer [32]. The structure of xanthene dyes used isshown below (Scheme 1).
The present study employs the interaction between dyesnamely eosin, rose bengal, erythrosine and fluorescein with colloi-dal CdS nanoparticles and the effect of substituents has also beenstudied. It is expected that this study might lead to clues on howto use CdS for widespread applications in biochemical and photo-chemical research.
2. Experimental
2.1. Materials
The xanthene dyes were obtained from Aldrich and used with-out further purification. Cadmium chloride (CdCl2), thioacetamideand sodium hexametaphosphate were purchased from Fluka andthey were used as such. Double distilled water was used for pre-
2000
2500(111)
O
COO_
O_
O
Y
YY
YX
X X
X
X = H & Y = H ; FluoresceinX = Br & Y = H ; EosinX = I & Y = H ; ErythrosineX = I & Y = Cl; Rose bengal
Scheme 1. Structure of xanthene dyes.
280 M. Asha Jhonsi et al. / Journal of Molecular Structure 921 (2009) 279–284
paring the solutions throughout. All measurements were per-formed at ambient temperature.
2.2. Instrumental methods
Absorption spectra were recorded using Cary 300 UV/visiblespectrophotometer. Samples were prepared by dissolving dyes indouble distilled water and administering the appropriate amountsof colloidal CdS nanoparticles. The samples were carefully purgedusing pure nitrogen gas for 10 min. Quartz cells (4 � 1 � 1 cm)with high vacuum Teflon stopcocks were used for purging.
The fluorescence quenching measurements were carried outwith JASCO FP-6500 spectrofluorometer. The excitation and theemission wavelengths for all dyes are shown in Table 1. The exci-tation and emission slit width (each 5 nm) and scan rate (500 nm/min) were kept constant for all the experiments. Fluorescence life-time measurements were carried out in a picosecond time corre-lated single photon counting (TCSPC) spectrometer.
FT-IR spectra were recorded by using a JASCO-460 plus modelspectrometer using KBr pellet with the resolution of 4 cm�1.
X-ray powder diffraction patterns were recorded on a BrukerAXS B8 Discover model using Cu-Ka radiation (k = 0.154 nm) anda graphite monochromator in the diffracted beam. TiO2 samplewas in the form of powder. A scan rate of 0.05� min�1 was appliedto record a pattern in the 2h range of 2h = 20–80�.
The oxidation potential of dyes was measured in water withpotassium chloride [KCl, 0.1 M] as electrolyte. Cyclic Voltammetrywas performed on Princeton EG and G-Parc Model Potentiostat.The experimental setup consisted of a platinum working electrode,a glassy carbon counter electrode and a silver reference electrode.Reversible peak potentials were measured at different scan rates(0.05 V/s). All samples were deaerated by bubbling with purenitrogen gas for ca. 5 min at room temperature.
2.3. Preparation of colloidal CdS nanoparticles
Water-soluble colloidal CdS were synthesized according to theliterature method [33]. Ten milliliters of 0.1 M CdCl2, 10 ml of0.1 M thioacetamide (TAA) and 10 ml of 0.1 M sodium hexameta-phosphate were mixed with constant stirring. The pH of the mix-ture was adjusted to 10.4 by 0.1 M NaOH, under N2 atmosphere.The mixture was kept at room temperature for 35 min for the
Table 1Absorption (kex) and emission (kem) wavelengths of the xanthene dyes and apparentassociation constant (Kapp) from fluorescence data for dyes with colloidal CdS.
S. No. Dyes kex (nm) kem (nm) Kapp � 103 M�1
1 Rose bengal 546 574 5.922 Eosin 511 537 4.793 Erythrosine B 526 554 3.424 Fluorescein 490 514 1.02
growth of colloidal CdS. The resulting yellow colloid was dilutedto a required concentration and it was stable for over 2 weeks inthe dark stored at 4 �C. The absorption and emission spectra of pre-pared colloidal CdS is shown in Fig. 7.
3. Results and discussion
3.1. Determination of particle size of colloidal CdS nanoparticles
The diameter of the prepared colloidal CdS has been determinedfrom the relationship between band gap shift (DEg) and radius (R)of quantum size particles using equation (1)
DEg ¼p2h2
2R2 1=m�e þ 1=m�h� �
� 1:8e2
eRþ Polarisation terms ð1Þ
where h is Planck’s constant, R is the radius of the particle,m�e and m�h are the effective masses of the e and h+, respectively,in the semiconductor, e is the electron charge, e is the relative per-mittivity of the semiconductor.
A value of 0.153 me was used for the reduced effective mass ofthe exciton (1/l = 1/me + 1/mh) of CdS, the columbic and polariza-tion terms in the equation are neglected. The particle size of theprepared colloidal CdS is �3.35 nm. Properties such as particle size,absorption and emission wavelengths of the prepared colloidal CdSare similar to the reported values [34,35].
3.2. XRD characterization of CdS nanoparticles
Fig. 1 shows the XRD pattern of CdS nanoparticles obtainedfrom colloidal CdS by rotary evaporation. The XRD patterns ofthe nanoparticles are considerably broadened due to very smallsize of the CdS. The XRD pattern exhibits prominent broad peaksat 2h values of 27�, 44� and 52� which are identified for cubicCdS phase, the 2h values are similar to the reported [34]. The aver-age size of the sample is in the range of 6.02 nm from full-widthand half-maximum (FWHM) of the most intense peak makinguse of the Scherrer’s equation (2),
d ¼ 0:9k=bcosh ð2Þ
where k is the wavelength of X-ray radiation, b is the FWHM in radi-ans of the XRD peak (2.585) and h is the angle of diffraction (27�).The particle size calculated from XRD method (6.02 nm) is largerthan the value obtained from UV method (�3.35 nm). This maybe due to aggregation of colloidal CdS upon aging.
3.3. Absorption characteristics
The absorption and emission wavelength of dyes is shown inTable 1. Fig. 2 shows the absorption spectrum of eosin in the pres-ence and absence of colloidal CdS. From the absorption study, we
0
500
1000
1500
10 20 30 40 50 60 70 802θ
Inte
nsit
y
(311)(220)
Fig. 1. X-ray diffraction (XRD) spectrum of CdS nanoparticles.

0
0.2
0.4
0.6
0.8
400 450 500 550 600Wavelength
Abs
orba
nce
Fig. 2. Absorption spectrum of Eosin (1 � 10�5 M) in the presence of colloidal CdSin the concentration range of 0–5 � 10�4 M in water. The arrow indicates theabsorbance increases with increasing concentration of colloidal CdS.
M. Asha Jhonsi et al. / Journal of Molecular Structure 921 (2009) 279–284 281
observed that while increasing the concentration of colloidal CdSto the eosin solution, the dye molecules gets adsorbed on the sur-face of CdS through electrostatic interaction. This leads to increasein optical density of eosin without neither peak shift and nor newpeak formation, so this type of absorption changes indicates theground state complex formation.
The other dyes (erythrosine, rose bengal and fluorescein) alsogave the same type of interaction behaviour in their absorptionband maxima (the spectra were not shown here). The possiblescattering due to colloidal nature of CdS has been omitted becauseof the fact that baseline correction was done for all the UV–visspectral measurements and also even after adding the highest con-centration of colloidal CdS the solution remains transparent. So weconfirmed that the optical density increase is only because of theinteraction between dyes and colloidal CdS not due to scattering.Similar type of interaction has been previously reported [36]. Theinteraction between dyes and CdS surface may be through carbox-ylic group and also the keto/enol group of the dyes. We have omit-ted the keto/enol interaction due to halogen atoms surrounded byketo group, so its interaction is very weak [37]. We consider onlythe adsorption of the carboxylic group on the CdS surface. This isfurther confirmed by the FT-IR characterization.
3.4. FT-IR characterization of dyes-colloidal CdS system
UV–visible measurement is not enough to investigate whichgroup interacts with the surface of semiconductor nanoparticles(dyes on colloidal CdS). So Fourier transform infrared (FT-IR) tech-nique was used to gain further information about the nature ofinteraction between them.
Fig. 3 shows the FT-IR spectra of rose bengal (solid line) and rosebengal bound CdS (broken line). The spectrum of rose bengal alone
60
70
80
90
100
4001150190026503400
Wavenumber [cm-1]
%T
Rose bengal Rose bengal-CdS
Fig. 3. FT-IR spectra of rose bengal (solid line) and rose bengal bound with colloidalCdS (broken line).
shows the C@O stretching vibration at 1620 cm�1. The stretchingfrequency is shifted to lower wave number from the normal fre-quency for carbonyl group (1700 cm�1) and is due to more electro-negative halogen substituents. This band is completely absent inthe spectrum of rose bengal bound with colloidal CdS and newband appears at 1130 cm�1. For other dyes also we observed thatthe absence of bands responsible for the carbonyl groups in the re-gion of 1650 cm�1 (the spectra were not shown here). From theseobservations we confirmed that the dye molecules adsorbed on thesurface of colloidal CdS through their carboxyl group via electro-static interaction.
In order to confirm which group of dyes is responsible for inter-action with the surface of colloidal CdS, we have done comparativeexperiments with the model compound of xanthene. In xantheneCdS system while increasing the concentration of colloidal CdSthere is no change in the absorption spectrum as shown in Fig. 4,indicating that the interaction between xanthene and the surfaceof colloidal CdS is very weak, simply xanthene can not be adsorbedon the surface of the CdS [Scheme 2]. Therefore we conclude that,dyes adsorbed on the surface of colloidal CdS through their anchor-ing group (–COO�).
3.5. Fluorescence quenching of dyes by colloidal CdS
Interaction between dyes and colloidal CdS has also been stud-ied by fluorescence quenching measurements. Fig. 5 shows the ef-fect of colloidal CdS on the fluorescence spectra of rose bengal. Thefluorescence spectra shows that increasing concentration of colloi-dal CdS leads to gradual decrease in the emission intensity of rosebengal, this shows the quenching occurs (other three dyes alsogave the same quenching behaviour, not shown here).
We can express the equilibrium between the adsorbed andunadsorbed dye molecules by using the equation (3), in this equa-tion Kapp is the apparent association constant which can be calcu-lated from the fluorescence data by the following equation (5) [38](shown in the inset of the Fig. 5) and the calculated values areshown in Table 1.
Dyeþ CdS �Kapp½Dye . . . CdS� ð3Þ
Kapp ¼½Dye . . . CdS�½Dye� � ½CdS� ð4Þ
1F0 � F
¼ 1F0 � F 0
þ 1KappðF0 � F 0Þ½CdS�
ð5Þ
where Kapp is the apparent association constant, F0 is the initial fluo-rescence intensity of dye molecules, F0 is the fluorescence intensityof CdS adsorbed dyes and F is the observed fluorescence intensity atits maximum.The Kapp decreases in the following order:
0
0.3
0.6
0.9
300 320 340 360 380 400
Wavelength
Abs
orba
nce
Fig. 4. Absorption spectrum of xanthene (1 � 10�5 M) in the presence of colloidalCdS (5 � 10�4 M) in water (note that no changes were observed on addition ofcolloidal CdS at different concentrations).

........CdS
OO_
O
Br
Br Br
Br
COO
OO_
O
Br
Br Br
Br
COO
+ CdS
a
b
CdSO + No interaction
Scheme 2. The mode of interaction between (a) eosin and (b) xanthene and the surface of colloidal CdS.
0
75
150
225
300
375
540 560 580 600 620 640 660
Wavelength
Inte
nsit
y
0
50
0.010.020.030.040.050.06
0.1 0.3 0.5 0.7
1/[CdS] x 10-4M
1/(F
0 -F)
Fig. 5. Fluorescence quenching of rose bengal (1 � 10�6 M, kex: 546 nm) withcolloidal CdS in the concentration range of 0–5 � 10�4 M in water. The insert is thelinear straight line dependence of 1/(F0-F) on the reciprocal concentration ofcolloidal CdS.
1
10
100
1000
10000
15 18 21 24 27 30
Time (ns)
Cou
nts
Fig. 6. Fluorescence decay curve of Fluorescein (1 � 10�6 M, kex: 490 nm) in theabsence and presence of colloidal CdS in the concentration range of 0–5 � 10�4 M.
Table 2Fluorescence lifetimea (in ns) of xanthene dyes at different concentrations of CdScolloids (0–5 � 10�4 M) in water.
[CdS] (�104 M) Fluorescein Eosin Erythrosine Rose bengal
0 3.65 1.25 1.02 1.801 3.46 1.18 1.18 1.692 3.70 1.19 1.05 1.733 3.60 1.20 1.14 1.814 3.55 1.24 1.08 1.645 3.51 1.18 1.03 1.62
a Lifetime given in nanoseconds obtained from time resolved measurements.
282 M. Asha Jhonsi et al. / Journal of Molecular Structure 921 (2009) 279–284
Rosebengal > Eosin > Erythrosine > Fluorescein
Among the dyes the highest apparent association constant va-lue is for rose bengal due to the presence of more electronegativecarboxyl group with four chlorine substituents in its structure, itincreases the interaction of this dye with colloidal CdS. Eosin andErythrosine, both the dyes show more or less equal associationconstant values because of the more similarity in their structures,the only difference is the halogenated substituents. In these twodyes eosin is more efficient than erythrosine due to the more elec-tronegative bromine substituents. Fluorescein shows less interac-tion with colloidal CdS is may be due to the absence ofelectronegative halogenated substituents.
3.6. Fluorescence lifetime measurements
The steady state measurement alone is not enough to confirmthe mechanism of fluorescence quenching whether it follows dy-namic or in static nature. In general, lifetime measurement is themost definitive method to distinguish the static and dynamicquenching process [39].
In the present work, we have studied the effect of colloidal CdSon the fluorescence lifetime of dyes. Fig. 6 shows the fluorescencedecay curve of fluorescein in the absence and presence of colloidalCdS (for other dyes the decay curves are not shown here). The dyes(fluorescein, eosin, erythrosine and rose bengal) exhibit singleexponential decay not only in the dilute solutions but also in thepresence of colloidal CdS. While increasing the concentration ofcolloidal CdS there is no change in the fluorescence lifetime ofdyes, they were almost constant (Table 2). This observation showsthe quenching follows static mechanism. It also supports theadsorption of dyes on the surface of CdS colloids and the formation
of ground state surface complex. In Fig. 6 though the decay tracesof fluorescein in the absence and presence of colloidal CdS wereactually plotted however the lifetime of fluorescein remained thesame in both conditions, hence the merging of the kinetic traceswere observed (the plot looks like a single decay curve).
3.7. Mechanism of quenching
The quenching of dyes may occur through two possible mecha-nisms such as energy or electron transfer. There is no overlap be-tween the emission spectra of dyes with the absorption spectrumof colloidal CdS (Fig. 7) and also the band-gap energy of CdS(Eg = 2.6 eV) is greater than the excited state energy of dyes (Es)in Table 3 [40]. Thus, energy transfer from excited dyes to colloidalCdS is not possible. It can therefore be concluded that the fluores-cence quenching shown in Fig. 5 is should not be caused by energytransfer.
The possible way of quenching is through electron transfer fromexcited state dye molecules to the conduction band of colloidal CdSas shown Scheme 3.

0
0.4
0.8
1.2
360 460 560 660 760Wavelength (nm)
Abs
orba
nce
-0.2
0.1
0.4
0.7
1
1.3
Inte
nsit
y
1a
2a
3a4a
2b
1b
Fig. 7. Absorption and emission spectra of colloidal CdS (1b and 2b) and theEmission spectra of dyes alone (1a-Eosin; 2a-Rose bengal; 3a-Erythrosine and 4a-Fluorescein; kex: 511, 546, 526 and 490 nm for Eosin, Rose bengal, Erythrosine andFluorescein, respectively).
Table 3Photophysical properties of xanthene dyes.
S. No. Dyes E(S) (eV)a Es/s+ (V)b Es�=sþ (V)c DGet (eV)d
1 Rose bengal 2.16 0.83 �1.33 �0.332 Eosin 2.31 1.10 �1.21 �0.213 Erythrosine B 2.24 0.95 �1.29 �0.174 Fluorescein 2.41 1.30 �1.11 �0.14
a Excited state energy of the dyes calculated from the fluorescence maximumbased on the reported method [40].
b The oxidation potentials are in water vs NHE.c Calculated from the equation, Es�=sþ = Es/s+ � Es, where Es/s+ is the oxidation
potential of the ground state dyes and Es�=sþ is the oxidation potential of the excitedstate dyes and Es is the excitation energy.
d Calculated from the Rehm–Weller equation.
[Dye..... CdS] [Dye*.....CdS]hν
[Dye*.....CdS] [Dye .....ecb CdS]
Dye + ecb CdS
_+
Dye + CdS [Dye.....CdS]
[Dye .....ecb CdS]_+ _
+
Scheme 3. Proposed electron transfer mechanism.
M. Asha Jhonsi et al. / Journal of Molecular Structure 921 (2009) 279–284 283
The feasibility of electron transfer from dyes to CdS can be ex-plained on the basis of energy level diagram based on the excitedstate oxidation potential of dyes (obtained from the oxidation po-tential of dyes and their singlet state energy according to the equa-tion Es
*/s+ = Es/s+ Es, in Table 3) and the conduction band potential of
CdS lies around 1.0 eV [41] as shown in Scheme 4. From the
1
2
0
-1
-2
CdS
CB
VB
(0.83 V)
(-1.0 V)
V vs NHE
(1.5 V)
Es/s+
Es*/s+
(1.10V)(0.95V)
(-1.33V)(-1.21 V)(-1.32 V)
νh(2.16 eV) (2.31 eV)(2.17 eV)
EosinErythrosineRose bengal
(-1.11 V)
(2.41 eV)
(1.30V)Fluorescein
Scheme 4. Schematic diagram describing the conduction and valence bandpotentials of CdS and the electron-donating energy levels of dyes.
scheme we observed that the electron transfer process is feasible.Similar type of electron transfer between dyes and semiconductorshas been previously reported [42–46].
4. Conclusion
The effect of colloidal CdS on the absorption and fluorescencespectra of dyes such as eosin, rose bengal, erythrosine and fluores-cein has been studied. The result in perturbation of the absorptionspectrum shows that the surface complex formation throughadsorption of dyes on the surface of colloidal CdS. Static natureof quenching has been confirmed by unaltered fluorescence life-time measurements. Based on the energetic calculations the mech-anism of electron transfer from excited state dyes to theconduction band of colloidal CdS was suggested.
Acknowledgments
R.R. and M.A. thank DST (Ref.: SR/NM/NS-16/2007, dt.: 26-09-08) (Government of India) for the Project and Fellowshiprespectively.
R.R. and A.K. thank CSIR, Government of India (Ref.: 01(2217)/08/EMR-II, dt.: 06/05/2008) for the project and fellowship, respec-tively. Authors also thank Dr. S. Anandan, (NIT, Trichy) and Dr. R.Ramaraj (MKU, Madurai) for providing their CV facilities.
We are thankful to Laser Spectra of Services, Bangalore for life-time measurements.
References
[1] P.V. Kamat, Chem. Rev. 93 (1993) 267.[2] C.A. Koval, J.N. Howaxd, Chem. Rev. 92 (1992) 411.[3] H. Gerischer, F. Willig, Top. Curr. Chem. 61 (1976) 31.[4] C. Wang, C. Liu, W. Wang, T. Shen, J. Photochem. Photobiol. A: Chem. 109
(1997) 159.[5] M.R. Hoffmann, S.T. Martin, W.Y. Choi, D.W. Bahnemann, Chem. Rev. 95 (1995)
69.[6] B. O’Regan, M. Graetzel, Nature 353 (1991) 37.[7] H. Xu, H. Li, K. Liu, Dyes Pigments 49 (2001) 9.[8] A. Hagfeldt, M. Graetzel, Chem. Rev. 95 (1995) 49.[9] Z.X. Zhou, S.P. Qian, S.D. Yao, Z.Y. Zhang, Dyes Pigments 51 (2001) 137.
[10] J. Gao, P. Wang, R.W. Giese, Anal. Chem. 74 (2002) 6397.[11] H.H. Wasserman, R.W. Murray, Singlet Oxygen, Academic Press, New York,
1979.[12] D.D. Hawn, N.R. Armstrong, J. Phys. Chem. 82 (1978) 1288.[13] P.V. Kamat, M.A. Fox, J. Phys. Chem. 88 (1984) 2297.[14] W. Reed, M.J. Politi, J.H. Fendler, J. Am. Chem. Soc. 103 (1981) 4591.[15] M. Hilgendorff, V. Sundstrom, J. Phys. Chem., B 102 (1998) 10505.[16] F.L. Arbeloa, P.R. Ojeda, I.L. Arbeloa, J. Lumin. 44 (1989) 105.[17] N.O.M. Petrossyan, A.N. Vodolazkaya, A. Doroshenko, J. Fluorescence 13 (2003)
235.[18] I.M. Villoslada, M. Jofre, V. Miranda, R. Gonzalez, B.L. Rivas, J. Phys. Chem. B 110
(2006) 11809.[19] G.R. Fleming, A.W.E. Knight, J.M. Morris, R.J.S. Morrison, G.W. Robinson, J. Am.
Chem. Soc. 99 (1977) 4306.[20] O.V. Aguilera, D.C. Neckers, Acc. Chem. Res. 22 (1989) 171.[21] E.K. Putzeiko, A. Terenin, Zh. Fiz. Khim. 23 (1949) 676.[22] A. Terenin, I. Akimov, J. Phys. Chem. 69 (1965) 730.[23] J. Moser, M. Graetzel, J. Am. Chem. Soc. 106 (1984) 6557.[24] C. Chen, X. Qi, B. Zhou, J. Photochem. Photobiol. A: Chem. 109 (1997) 155.[25] Z. Zhou, S. Qian, S. Yao, Z. Zhang, Radiat. Phys. Chem. 65 (2002) 241.[26] A. Kathiravan, V. Anbazhagan, M.A. Jhonsi, R. Renganathan, Spectrochim. Acta
A 70 (2007) 615.[27] H. Zhang, Y. Zhou, M. Zhang, T. Shen, Y. Li, D. Zhu, J. Colloid Interface Sci. 251
(2002) 443.[28] T. Hasobe, S. Hattori, P.V. Kamat, S. Fukuzumi, Tetrahedron 62 (2006) 1937.[29] J.M. Rehm, G.L. McLendon, Y. Nagasawa, K. Yoshihara, J. Moser, M. Gra1tzel, J.
Phys. Chem. 100 (1996) 9577.[30] Q. Wang, W.M. Campbell, E.E. Bonfantani, K.W. Jolley, D.L. Officer, P.J. Walsh, K.
Gordon, R. Humphry-Baker, M.K. Nazeeruddin, M. Gra1tzel, J. Phys. Chem. B109 (2005) 15397.
[31] H. Zhang, Y. Zhou, M. Zhang, T. Shen, Y. Li, D. Zhu, J. Phys. Chem. B 106 (2002)9597.
[32] A. Kathiravan, V. Anbazhagan, M.A. Jhonsi, R. Renganathan, Z. Phys. Chem. 221(2007) 941.
[33] X. Shen, X. Liou, Li-Ping Ye, H. Liang, Z. Wang, J. Colloid Interface Sci. 311(2007) 400.

284 M. Asha Jhonsi et al. / Journal of Molecular Structure 921 (2009) 279–284
[34] P.S. Chowdhury, P. Ghosh, A. Patra, J. Lumi. 124 (2007) 327.[35] A. Priyam, A. Chatterjee, S.K. Das, A. Saha, Chem. Commun. (2005) 4122.[36] H. Zhang, Y. Zhou, M. Zhang, T. Shen, Y. Li, D. Zhu, J. Colloid Interface Sci. 264
(2003) 290.[37] M. Hilgendorff, V. Sundstrolm, J. Phys. Chem. B 102 (1998) 10505–10514.[38] P.V. Kamat, J. Phys. Chem. 93 (1989) 859.[39] J.R. Lakowicz, Principles of Fluorescence Spectroscopy, Plenum Press, New
York, 1983. p. 258.
[40] E.J. Shin, D. Kim, J. Photochem. Photobiol. A: Chem. 152 (2002) 25.[41] K.R. Gopidas, M. Bohorquez, P.V. Kamat, J. Phys. Chem. 94 (1990) 6435.[42] P.V. Kamat, M.A. Fox, Chem. Phys. Lett. 102 (1983) 379.[43] M. Hilgendorff, V. Sundstrolm, J. Phys. Chem. B 102 (1998) 10505.[44] J. He, F. Chen, J. Zhao, H. Hidaka, Colloids Surf. A: Physicochem. Eng. Aspects
142 (1998) 49.[45] L. Zang, M.J. Rodgers, J. Phys. Chem. B 104 (2000) 468.[46] A. Kathiravan, R. Renganathan, J. Colloid Interf. Sci. 331 (2009) 401.
Sw
MS
a
ARRAA
KBCF
1
brpDttae
maalpapitstts[
0d
Colloids and Surfaces B: Biointerfaces 72 (2009) 167–172
Contents lists available at ScienceDirect
Colloids and Surfaces B: Biointerfaces
journa l homepage: www.e lsev ier .com/ locate /co lsur fb
pectroscopic studies on the interaction of colloidal capped CdS nanoparticlesith bovine serum albumin
. Asha Jhonsi, A. Kathiravan, R. Renganathan ∗
chool of Chemistry, Bharathidasan University, Tiruchirappalli 620 024, Tamil Nadu, India
r t i c l e i n f o
rticle history:eceived 13 December 2008eceived in revised form 27 March 2009ccepted 29 March 2009
a b s t r a c t
Colloidal uncapped and starch capped CdS (SCdS) nanoparticles were prepared and interaction withbovine serum albumin (BSA) have been studied by UV–visible, FT-IR, steady state, time resolved and syn-chronous fluorescence spectroscopic measurements. BSA molecules adsorbed on the surface of colloidal
2 −1
vailable online 5 April 2009eywords:SAapped CdS
CdS through the capping agent. The apparent association constant (Kapp = 2.54 × 10 M ) and degreeof association has been calculated (˛ = 1.12) from absorption studies. The binding constant from fluores-cence quenching method (6.6 × 10² M−1) matches well with that determined from the absorption spectralchanges. Static quenching mechanism and conformational changes on BSA molecules were confirmed bytime resolved and synchronous fluorescence measurements respectively. The effect of starch capped CdS
BSA h
luorescence quenching on the conformation offluorescence spectra.. Introduction
Nanoparticle probes compared with organic dyes acting asiosensors in chemical and biochemical fields have been researchedecently and their applications are becoming more extensive. Theserobes have been applied to the ultrasensitive detection of proteins,NA sequencing, clinical diagnostics, etc. [1]. Compared to conven-
ional dyes, confinement of electronic states of quantum dots makeshem quite attractive, showing some unique optical properties suchs high quantum yield, symmetrical emission spectra, broad-bandxcitation, photostability, and readily tunable spectra [2–6].
The interaction of proteins with inorganic surfaces involvingainly silica particles and to a lesser extent hematite [7], hydroxi-
patite [8] and titanium dioxide [9,10] were reported. Renganathannd co-workers have successfully studied the binding of TiO2 col-oid with serum albumin [11,12]. Major interactions involved inrotein adsorption can be classified as electrostatic, hydrophobicnd hydrogen-bonding, etc. [13]. One of the goals in the study ofrotein adsorption is the follow-up of the process dynamics through
n situ techniques that allow the analysis of the possible conforma-ional changes that may take place during adsorption [14,15]. Thistudy has been studied actively for decades because of its impor-
ance in the wide range of biomedical applications, such as artificialissue and organ [16], drug delivery system [17], biosensor [18],olid-phase immunoassay [19], immunomagnetic cell separation20] and immobilized enzyme or catalyst [21] and so on.∗ Corresponding author. Tel.: +91 431 2407053; fax: +91 431 2407045.E-mail address: [email protected] (R. Renganathan).
927-7765/$ – see front matter © 2009 Elsevier B.V. All rights reserved.oi:10.1016/j.colsurfb.2009.03.030
as been analyzed by means of UV–visible absorption and synchronous
© 2009 Elsevier B.V. All rights reserved.
Quenching measurement of albumin fluorescence is an impor-tant method to investigate the interactions of drugs with serumalbumins. It can reveal the accessibility of quenchers to albumin’sfluorophore groups, help to understand the binding mechanisms ofalbumins with drugs and provide clues to the essential of bindingphenomenon [22].
In this work, bovine serum albumin (BSA) is selected as our pro-tein model because of its medicinal importance, low cost, readyavailability, and unusual ligand-binding properties [23]. BSA hastwo tryptophan residues that possess intrinsic fluorescence, Trp-212 is located within a hydrophobic binding pocket of the proteinand Trp-134 is located on the surface of the molecule [24–26].
The two ions Cd2+ and S2− are component parts of quantumdots which are harmful to human body. By researching the inter-action of CdS nanoparticles with BSA, the effect of CdS to proteinin real cells can be simulated. The interaction of the CdS nanocrys-tals with its environment or capping agents plays a crucial role indetermining its luminescent properties. Organic and inorganic cap-ping agents such as polymers, amines, tri-n-octyl phosphine oxide(TOPO), thiols and silica are used during the wet-chemical syn-thesis for capping the surface of particles to prevent nonradiativerecombination at surface sites and also control of growth kineticsto prevent the aggregation via steric hindrance [27,28]. It is alsobelieved that the capping agent on the surface of particles plays animportant role on transfer of photogenerated electrons and holes
to capping agents [29].Among the direct techniques, fluorimetry is extensively usedand is considered to be superior to the indirect techniques (equilib-rium and dynamic dialysis, ultrafiltration, gel filtration) because, toa first approximation, they do not disturb the binding equilibrium

1 rfaces
uapoa
2
2
(pswfdwa
2
Agir
snv
wsm
pt(l
R4tc
2
t
2
ac0tis
2
c2st
68 M. Asha Jhonsi et al. / Colloids and Su
pon separation [30]. In the present work, synthesis of uncappednd starch capped CdS nanoparticles and the effect of these pre-ared capped CdS on intrinsic tryptophan fluorescence quenchingf BSA has been studied and to characterize the type of chemicalssociation taking place.
. Experimental
.1. Materials
Cadmium chloride (CdCl2), cadmium acetate dihydrateCd(OAc)2·2H2O), thioacetamide and sodiumhexametaphos-hate were purchased from Qualigens and they were used asuch. Starch, glacial acetic acid, 2-methoxy ethanol and acetoneere purchased from Loba Chemicals. Bovine serum albumin (96%
atty acid free, Product Number A8806, Sigma) was dissolved inouble distilled water to prepare stock solution (1 × 10⁻⁴ M) whichas then stored at 0–4 ◦C. All measurements were performed at
mbient temperature.
.2. Instrumentation
X-ray powder diffraction patterns were recorded on a BrukerXS B8 Discover model using Cu K� radiation (� = 0.154 nm) and araphite monochromator in the diffracted beam. CdS sample wasn the form of powder. A scan rate of 0.05◦ min−1 was applied toecord a pattern in the 2� range of 2� = 20–80◦.
Absorption spectra were recorded using Cary 300 UV–visiblepectrophotometer. The samples were carefully purged using pureitrogen gas for 10 min. Quartz cells (4 cm × 1 cm × 1 cm) with highacuum Teflon stopcocks were used for purging.
The fluorescence quenching measurements were carried outith JASCO FP-6500 spectrofluorometer. The excitation and emis-
ion slit width (each 5 nm) and scan rate (500 nm min−1) wereaintained constant for all the measurements.Fluorescence lifetime measurements were carried out in a
icosecond time correlated single photon counting (TCSPC) spec-rometer. The excitation source is the tunable Ti-sapphire laserTsunami, Spectra Physics, USA). The fluorescence decay was ana-yzed by using the software provided by IBH (DAS-6).
FT-IR spectra were obtained by using PerkinElmer SpectrumXI FT–IR spectrometer at room temperature in the range of000 − 400 cm−1. The samples were placed in a liquid cell betweenwo windows (CaF2). Mirror velocity is 0.3 cm s−1 and number ofo-added scans are 4 then total collection time is less than 2 min.
.3. Preparation procedures
The preparation of uncapped and starch capped CdS followed byhe modified methods were adopted from literature [29,31].
.3.1. Preparation of colloidal CdS nanoparticles10 ml of 0.1 M cadmium chloride, 10 ml of 0.1 M thioacetamide
nd 10 ml of 0.1 M sodium hexametaphosphate were mixed withonstant stirring. The pH of the mixture was adjusted to 10.4 by.1 M NaOH, under N2 atmosphere. The mixture was kept at roomemperature for 35 min for the growth of colloidal CdS. The result-ng yellow colloid was diluted to a required concentration and wastored at 4 ◦C.
.3.2. Preparation of starch capped CdS nanoparticles
0.1 gm of starch was dissolved in 5 ml of hot water to get alear solution. Then 0.1 mM (0.0266 g) Cd(OAc)2·2H2O dissolving in0 ml of glacial acetic acid was added into the starch solution andtirred for 5 min at room temperature. After this 0.1 mM (0.0075 g)hioacetamide in 20 ml 2-methoxy ethanol was added to the above
B: Biointerfaces 72 (2009) 167–172
mixture and stirred in an oil bath at 85–90 ◦C for 1 h. The resultinglemon yellow colored solid products were centrifuged, washed andfinally dispersed in water for optical study. In starch solution, thehydroxyl groups acted as stabilizer agent of the synthesized CdSnanoparticles.
2.4. Methods
A 3-ml solution, containing appropriate concentration of BSA(1 × 10⁻⁵ M), was titrated by successive additions of 3 �L stock solu-tion of colloidal uncapped and starch capped CdS nanoparticlesseparately (1 × 10⁻³ M). Titrations were manually done by usingmicro-pipette for the addition of colloidal CdS and starch cappedCdS. UV–visible spectra of all the solutions were recorded in therange of 200–800 nm.
Fluorescence spectra were then measured by using Quartz cells(4 cm × 1 cm × 1 cm, excitation and emission wavelength of BSA is278 and 345 nm, respectively) at ambient temperature.
In synchronous fluorescence spectra also the same concentra-tion of BSA and colloidal CdS and starch capped CdS were used andthe spectra were measured at two different �� values such as 15and 60 nm.
3. Results and discussion
3.1. Determination of particle size of colloidal CdS nanoparticles
The prepared colloidal CdS were analyzed by UV–visible andfluorescence spectroscopy to identify the presence of nanoparticles(Fig. 8). The absorption spectra showed the formation of nanosizedCdS having absorption in the range of 425–450 nm in water in amuch diluted solution (typically <1 × 10⁻⁴ M). (The fine emissionspectrum of CdS also shown in Fig. 8 indicates the uniform size ofthe CdS.)
It is well understood with available literature that milder exper-imental conditions favour the formation of smaller particle size andthe stability of these nanoparticles is around 7–8 days stored at 4 ◦C.
The diameter of the prepared colloidal CdS has been determinedfrom the relationship between band gap shift (�Eg) and radius (R)of quantum size particles using Eq. (1)
�Eg = �2h2
2R2[1/m∗
e + 1/m∗h] − 1.8 e2
εR+ polarisation terms (1)
where h is Planck’s constant, R is the radius of the particle, m∗e and
m∗h are the effective masses of the e− and h+ respectively in the
semiconductor, e is the electron charge, ε is the relative permittivityof the semiconductor.
A value of 0.153 me was used for reduced effective mass of theexciton (1/� = 1/me + 1/mh) of CdS, the columbic and polarizationterms in this equation are neglected. The particle size of the pre-pared colloidal CdS is 3.35 nm.
3.2. XRD characterization of CdS nanoparticles
For XRD measurement the resulting lemon yellow colored solidproducts were centrifuged, washed and dried in a vacuum ovenat 40 ◦C. Fig. 1 shows the XRD pattern of CdS and starch cappedCdS nanoparticles. The patterns are considerably broadened dueto very small size of the CdS. The XRD pattern exhibits prominentbroad peaks at 2� values of 27◦, 44◦ and 52◦ which are identified forcubic CdS phase, the 2� values are similar to the reported [32]. The
average size of the sample determined is in the range of 6.02 nmfrom full-width and half-maximum (FWHM) of the most intensepeak making by using Scherrer’s Eq. (2),d = 0.9�/ˇ cos � (2)

M. Asha Jhonsi et al. / Colloids and Surfaces B: Biointerfaces 72 (2009) 167–172 169
Fn
wr(lm
3
igectwiBcitBr
natomia
s
Fs1
ig. 1. X-Ray diffraction (XRD) spectrum of uncapped and starch capped CdSanoparticles.
here � is the wavelength of X-ray radiation ˇ is the FWHM inadians of the XRD peak (2.585) and � is the angle of diffraction27◦). The particle size calculated from XRD method (6.02 nm) isarger than the value obtained from UV method (∼3.35 nm). This
ay be due to aggregation of colloidal CdS upon aging.
.3. Absorption characteristics
To study the excited state reactions between BSA and CdS it ismportant to know the type of interaction between them in theround state. The absorption spectra of BSA in the absence and pres-nce of starch capped CdS is shown in Fig. 2. Absorption of BSA isharacterized by a strong band in the UV region at 278 nm. Addi-ion of starch capped CdS led to gradual increase in BSA absorptionith a blue shift (shorter wavelength) of 2 nm. These observations
ndicate that there is a structural change (microenvironment) inSA which has occurred upon interaction with the surface of starchapped CdS. The above results can be rationalized in terms of strongnteraction between starch capped CdS and BSA in the ground statehrough complex formation. Similar type of interaction betweenSA with capped CdTe quantum dots and TiO2 has been previouslyeported [6,11].
In the present system the possible scattering due to colloidalature of CdS (CdS also absorbs in the UV region but its range ofbsorbance was far away (more than 400 nm) from the studied BSAryptophan absorption as shown in Fig. 8) has been omitted becausef the fact that baseline correction was done for all UV spectraleasurements. So we confirmed that the increase in optical density
s only resulting from the interaction between BSA and capped CdSnd not due to scattering.
The equilibrium for the formation of complex between BSA andtarch capped CdS is defined by Eq. (3) where Kapp is the apparent
ig. 2. Absorption spectrum of BSA (1 × 10⁻⁶ M) in the absence and presence oftarch capped CdS (0–6 × 10⁻⁴ M). The insert is the straight line dependence of/Aobs − A0 on the reciprocal concentration of capped CdS.
Scheme 1. Interaction between BSA with starch capped and uncapped colloidal CdSnanoparticles.
association constant,
BSA + capped CdSKapp� BSA . . . capped CdS (3)
Kapp = [BSA . . . capped CdS][BSA] · [capped CdS]
(4)
The Kapp value was calculated by the method reported by Benesiand Hildebrand [33] using the following Eq. (5):
Aobs = (1 − ˛)C0εBSA1 + ˛C0εc1 (5)
where Aobs is the absorbance of the BSA solution containing differ-ent concentrations of starch capped CdS at 278 nm, ˛ is the degreeof association between BSA and capped CdS, εBSA and εc are themolar extinction coefficients at the defined wavelengths for BSAand the formed complex, respectively, C0 is the initial concentra-tion of BSA and ‘l’ is the optical path length, which has been takenas unity. Eq. (5) can be expressed by Eq. (6), where the A0 and Ac
are the absorbance of BSA and the complex at 278 nm, with theconcentration of C0:
Aobs = (1 − ˛)A0 + ˛Ac (6)
At relatively high concentrations of capped CdS, ˛ can be equated to(Kapp [capped CdS])/(1 + Kapp[capped CdS]). In this case, Eq. (6) canbe expressed as Eq. (7):
1Aobs − A0
= 1Ac − A0
+ 1Kapp(Ac − A0)[capped CdS]
(7)
Therefore, if the enhancement of absorbance at 278 nm was dueto absorption of complex, one would expect a linear relationshipbetween 1/(Aobs − A0) and the reciprocal concentration of cappedCdS with a slope equal to 1/Kapp(Ac − A0) and an intercept equalto 1/(Ac − A0) (shown in the inset of Fig. 2). The calculated valueof Kapp from the straight line of such plot is about 2.54 × 10² M−1
(R2 = 0.9998). Based on Kapp, the degree of association (˛) has alsobeen calculated and it was found to be 1.12.
In order to determine which group of the CdS is responsiblefor interaction with BSA molecules, we have done the comparativeexperiments with uncapped colloidal CdS. In uncapped CdS–BSAsystem while increasing the amount of CdS there is only a slightchange in optical density without any shift in wavelength in theabsorption spectrum of BSA (not shown here), indicating that theinteraction between uncapped CdS and BSA is very weak, simplyBSA cannot be adsorbed on the surface of uncapped CdS. There-fore we conclude that the BSA molecule strongly interacts withthe capping agent on the surface of the colloidal CdS nanoparticlesand is involved in the ground state complex formation as shown inScheme 1.
3.4. Fluorescence quenching studies
3.4.1. Steady-state measurementThe interaction of BSA with starch capped CdS was studied
by spectrofluorometer at room temperature. An aqueous solutionof BSA (1 × 10⁻⁶ M) was titrated with increasing concentration of

170 M. Asha Jhonsi et al. / Colloids and Surfaces B: Biointerfaces 72 (2009) 167–172
F�w
(Seaqioab
I
wasCcTi(qcmsbhTt[C
3
ssmd
ssosaf
Fig. 4. (a) Fluorescence decay of BSA (1 × 10⁻⁶ M) in the absence and presence of−4
ig. 3. Steady-state fluorescence quenching of BSA (1 × 10⁻⁶ M, �exi: 278 nm andemi: 345 nm) by starch capped CdS in the concentration range of 0–5 × 10⁻⁴ M inater. The insert is the Stern–Volmer plot between I0/I versus [Q].
0–5 × 10⁻⁴ M) starch capped CdS solution as shown in Fig. 3. TheCdS also has luminescent property but its excitation (415 nm) andmission (522 nm) wavelengths are much far away from the BSAbsorption and emission as mentioned above (Fig. 8), so we did notuantify the emission nature of CdS nanoparticles. While increas-ng the concentration of starch capped CdS the emission intensityf BSA was found to decrease progressively with the blue shift ofround 6 nm. The quenching of BSA fluorescence by capped CdS cane described by Stern–Volmer Eq. (8).
0/I = 1 + KSV[Q] (8)
here I0 and I are the fluorescence intensities of BSA in the absencend presence of capped CdS, respectively. KSV is Stern–Volmer con-tant and [Q] is the concentration of respective quencher, cappeddS. The ratios I0/I were calculated and plotted against quencheroncentration according to Eq. (8) (shown in the inset of Fig. 3).he quenching constant is calculated from the slope of the plots in the order of 0.1955 × 10⁴ M−1. The Stern–Volmer constantKSV) is related to quenching rate constant by kq = KSV/�. From theuenching constant we have calculated the value of quenching rateonstant by using the lifetime � of BSA (6 ns, from time resolvedeasurement) is 3.25 × 10¹¹ M−1 s−1. In general, maximum colli-
ional quenching constant (kq) of various kinds of quenchers toiopolymers is 2.0 × 10¹⁰ M−1 s−1 [34]. But for BSA–SCdS systemigher quenching rate constant (3.25 × 10¹¹ M−1 s−1) was obtained.his proves that the quenching is static in nature, it depends onhe formation of complex between starch capped CdS and BSAScheme 2]. Further the type of interaction between BSA and cappeddS was also confirmed by time resolved spectroscopy.
.4.2. Time resolved measurementFluorescence lifetime measurement is useful for under-
tanding the type of interaction between the colloidalemiconductor–sensitizer systems. In general, the measure-ent of fluorescence lifetime is the most definitive method to
istinguish static and dynamic quenching [35].In the present work we have studied the effect of uncapped and
tarch capped CdS on the fluorescence lifetime of BSA. Fig. 4(a)
hows the fluorescence decay of BSA in the absence and presencef starch capped CdS. Initially BSA in the absence of capped CdShowed that monoexponential decay with the life time of 6 ns,nd then first addition of capped CdS changed the decay curveorm mono to biexponential with two life times such as 5.27 andScheme 2. Mechanism of complex formation.
starch capped CdS in the concentration range of 0–5 × 10 M. (b) Fluorescencedecay of BSA (1 × 10⁻⁶ M) in the absence and presence of uncapped CdS in theconcentration range of 0–5 × 10⁻⁴ M.
2.02 ns, respectively. But further increasing the concentration ofstarch capped CdS the fluorescence lifetime of BSA remains unal-tered. So there is no change in the fluorescence lifetime of BSA in thepresence of highest concentration of capped CdS which indicatedthat the quenching follows static mechanism.
Fig. 4(b) shows the fluorescence decay of BSA in the absenceand presence of uncapped CdS nanoparticles which indicates thereis no change in fluorescence lifetime of BSA in the presence ofuncapped CdS representing the absence of interaction between thetwo. In Fig. 4(b) though the decay traces of BSA in both the absenceand presence of uncapped CdS were actually plotted however thelifetime of BSA remained the same in both conditions, hence themerging of kinetic traces were observed (the plot looks like a sin-gle decay curve). For static quenching, we can deduce the bindingconstant (K) resulted from the formation of ground state complexbetween fluorophore and the quencher. Hence the binding constant(K) was calculated by the method given in the following section.
3.5. Binding constant and binding sites
The intrinsic tryptophan fluorescence quenching of BSA bycapped CdS also follows complex formation, so we can deduce thebinding constant (K) which is calculated by using the followingmethod.
If it is assumed that there are similar and independent bindingsites in the BSA, the relationship between the fluorescence intensityand the quencher medium can be deduced from the following Eq.(11) [36]:
K
nQ + B�Qn . . . B (11)where B is the fluorophore, Q is the quencher, nQ + B is the pos-tulated complex between a fluorophore and n molecules of the

M. Asha Jhonsi et al. / Colloids and Surfaces B: Biointerfaces 72 (2009) 167–172 171
F
q
K
Itcb[
l
wwls0owThbwb
3
Bctfbta
Fc
Fig. 7. FT-IR spectrum of (a) uncapped CdS (pink), SCdS (red), BSA (blue) and BSAbound with SCdS (green) in the range of 400–4000 cm−1. (b) Free BSA (red) and SCdSbound with BSA (green) in the range of 1000–2200 cm−1. (For interpretation of thereferences to color in this figure legend, the reader is referred to the web version of
ig. 5. The plot of log [(F0 − F)/F] versus log[Q] for BSA with starch capped CdS.
uencher. The constant K is given by
= [Qn . . . B][Q ]n · [B]
(12)
f the overall amount of biomolecules (bound or unbound withhe quencher) is B0, then [B0] = [Qn. . .B] + [B], here [B] is theoncentration of unbound biomolecules, then the relationshipetween fluorescence intensity and the unbound biomolecule asB]/[B0] = F/F0 that is
og
[F0 − F
F
]= log K + n log[Q ] (13)
here K is the binding constant of BSA with starch capped CdS,hich can be determined from the plot of log [(F0 − F)/F] versus
og [Q] curve as shown in Fig. 5 and thus we obtained binding con-tant (K) 6.6 × 10² M−1 (R2 = 0.9944) and number of binding sites (n).8631 from intercept and slope of the plot respectively. The valuesf binding constant obtained from the fluorescence data matchesell with that determined from the absorption spectral changes.
he good agreement between these values of binding constantighlighted the validity of assumption proposed for the associationetween BSA and starch capped CdS. The number of binding siteshich is close to 1 indicates, there is only one type of interaction
etween BSA and starch capped CdS.
.6. Characteristics of synchronous fluorescence spectra
Influences of capped CdS on the conformational changes ofSA were assessed by synchronous fluorescence method. Syn-hronous fluorescence measurements provide information about
he molecular microenvironment in the vicinity of fluorophoreunctional groups. Synchronous fluorescence spectra were obtainedy simultaneous scanning of excitation and emission monochroma-ors. According to Miller [37], as the difference between excitationnd emission wavelength (��) is 15 nm, synchronous fluorescenceig. 6. Synchronous spectra of BSA (1 × 10⁻⁶ M) in the absence and presence of starchapped CdS (0–5 × 10⁻⁴ M) in the wavelength difference of �� = 60 nm.
the article.)
offers the characteristics of tyrosine residues (spectra not shownhere), while when �� is 60 nm, it provides the characteristic infor-mation of tryptophan residues. Synchronous fluorescence spectraof BSA upon addition of starch capped CdS gained at 60 nm is shownin Fig. 6.
The fluorescence intensity of both tryptophan and tyrosine weredecreased but the emission wavelength of tryptophan (340 nm) isblue shifted (2 nm) with increasing concentration of capped CdS.Comparing the emission wavelength of tyrosine, no significantchange was observed. It indicated that the interaction of capped CdSwith BSA does not affect the conformation of tyrosine micro-region.Firstly, combined with tyrosine capped CdS gradually interacts withtryptophan and brings changes to BSA and results in blue-shiftof fluorescence wavelength. It is likely due to that the hydropho-bic amino acid structure surrounding tryptophan residues in
BSA tends to collapse slightly and thus tryptophan residues areexposed more to the aqueous phase. Similar observation has beenreported [38].
172 M. Asha Jhonsi et al. / Colloids and Surfaces B: Biointerfaces 72 (2009) 167–172
Scheme 3. Mode of interaction between st
F(fi
3
suSrcsas
ct[fsCpa
4
iTtiwtcmm
[
[[
[[[[
[
[[[[[
[
[[[
[36] V. Anbazhagan, R. Renganathan, J. Lumin. 128 (2008) 1454.[37] J.N. Miller, Proc. Anal. Div. Chem. Soc. 16 (1979) 203.
ig. 8. Absorption and emission spectra of BSA (red and blue) and SCdS nanoparticlesgreen and pink) respectively. (For interpretation of the references to color in thisgure legend, the reader is referred to the web version of the article.)
.7. FT-IR characterization
In order to confirm the binding of BSA with SCdS, FT-IR mea-urements were performed. Fig. 7(a) shows the FT-IR spectra ofncapped CdS, starch capped CdS, free BSA and BSA bound withCdS. In the free BSA and uncapped CdS there is no peak in theegion of 1390 cm−1 but it was observed in SCdS which is for theapping agent starch. This peak is completely disappeared in thepectrum of BSA bound with SCdS, so the interaction between BSAnd SCdS through the capping agent (starch) has been proved ashown in Scheme 3.
Fig. 7(b) indicates that whether the conformation of BSA hashanged or not, Usually the amide I peak position for BSA occurs inhe region of 1600–1700 cm−1 and amide II band near 1548 cm−1
39,40]. Former one is the more sensitive to change of protein con-ormation than later. In this figure BSA in the absence of capped CdShows the amide I peak at 1638 cm−1 and in the presence of cappeddS the amide I peak was shifted to 1647 cm−1. From the shift ineak position we confirmed that the conformation of BSA has beenffected by the addition of starch capped CdS.
. Conclusions
Uncapped and starch capped CdS nanoparticles were preparedn aqueous medium and their interaction with BSA was studied.he results presented clearly indicated that capped CdS quencheshe fluorescence of BSA through complex formation. The quench-ng rate constant, binding constant, and number of binding sites
ere calculated according to the relevant fluorescence data. Fromhe synchronous fluorescence spectra, it is established that theonformational changes of BSA occurred. The static quenchingechanism was confirmed by fluorescence lifetime measure-ents.
[[[
arch capped CdS and BSA molecules.
Acknowledgements
R.R. and M.A thank DST (Ref: SR/S5/NM-16/2007 dt: 3.7.3008)(Government of India) for the project and fellowship, respectively.
We are thankful to Laser Spectra of Services, Bangalore for life-time measurements.
References
[1] L. Tan, L. Liu, Q.J. Xie, Y.Y. Zhang, S.Z. Yao, Anal. Sci. 20 (2004) 441.[2] M.B.M. Moronne Jr., P. Gin, S. Weiss, A.P. Alivisatos, Science 281 (1998) 2013.[3] W.C.W. Chan, S. Nie, Science 281 (1998) 2016.[4] F.X. Wu, J.W. Lewis, D.S. Kliger, J.Z. Zhang, J. Chem. Phys. 118 (2003) 12.[5] X.H. Zhong, Y.Y. Feng, W. Knoll, M.Y. Han, J. Am. Chem. Soc. 125 (2003) 13559.[6] M. Idowu, E. Lamprech, T. Nyokong, J. Photochem. Photobiol. A: Chem. 198
(2008) 7.[7] C. Haynes, W. Norde, J. Colloid Interf. Sci. 169 (1995) 313.[8] K. Kandori, T. Shimizu, A. Yasukawa, T. Ishikawa, Colloids Surf. B 5 (1995) 81.[9] V. Ball, A. Bentaleb, J. Hemmerle, J.C. Voegel, P. Schaaf, Langmuir 12 (1996) 1614.
[10] C.E. Giacomelli, M.J. Esplandiu, P.I. Ortiz, M.J. Avena, C.P. De Pauli, J. Colloid Interf.Sci. 218 (1999) 404.
[11] A. Kathiravan, R. Renganathan, Colloids Surf. A: Physicochem. Eng. Aspects 324(2008) 176.
12] A. Kathiravan, S. Anandan, R. Renganathan, Colloids Surf. A: Physicochem. Eng.Aspects 333 (2009) 91.
[13] W. Li, S. Li, Colloids Surf. A: Physicochem. Eng. Aspects 295 (2007) 159.[14] T.J. McMaster, M.J. Miles, P.R. Shewry, A.S. Tatham, Langmuir 16 (2000) 1463.[15] F.Y. Oliva, L.B. Avalle, O.R. Camara, C.P. De Pauli, J. Colloid Interf. Sci. 261 (2003)
299.[16] V.N. Vasilets, A.V. Kuznetsov, V.I. Sevastianov, J. Biomed. Mater. Res. A 69 (2004)
428.[17] N.O. Sahin, D.J. Burgess, II Farmaco 58 (2003) 1017.[18] H.R. Byon, H.C. Choi, J. Am. Chem. Soc. 128 (2006) 2188.[19] H. Zhang, M.E. Meyerhoff, Anal. Chem. 78 (2006) 609.20] J.E. Butler, Methods 22 (2000) 4.21] C.H. Jang, B.D. Stevens, P.R. Carlier, M.A. Calter, W.A. Ducker, J. Am. Chem. Soc.
124 (2002) 12114.22] S. Dilson, M.C. Celia, C.B. Jayme, L. Sonia, Toxicol. Lett. 147 (2004) 53.23] R.E. Olson, D.D. Christ, Ann. Rep. Med. Chem. 31 (1996) 327.24] M. Dockal, D.C. Carter, F. Ruker, J. Biol. Chem. 275 (2000) 3042.25] Y.J. Hu, Y. Liu, R.M. Zhao, J.X. Dong, S.S. Qu, J. Photochem. Photobiol. A: Chem.
179 (2006) 324.26] B. Zhou, Z.D. Qi, Q. Xiao, J.X. Dong, Y.Z. Zhang, Y. Liu, J. Biochem. Biophys. Meth-
ods 70 (2007) 743.27] J. Aldana, Y.A. Wang, X. Peng, J. Am. Chem. Soc. 123 (2001) 8844.28] S.F. Wuister, A. Meijerink, J. Lumin. 105 (2003) 35.29] S. Sadhu, P.S. Chowdhury, A. Patra, J. Lumin. 128 (2008) 1235.30] Y.P. Wang, Y. Wei, C. Dong, J. Photochem. Photobiol. A: Chem. 177 (2006) 6.31] X. Shen, X. Liou, H. Li-Ping Ye, Z. Liang, J. Wang, Colloid Interf. Sci. 311 (2007)
400.32] P. Rodriguez, N.M. Aguirre, E.S.M. Martinez, G.G. Cruz, S.A. Tomas, O.Z. Angel, J.
Crystal Growth 310 (2008) 160.33] H.A. Benesi, J.H. Hildebrand, J. Am. Chem. Soc. 71 (1949) 2703.34] J.R. Lakowicz, G. Weber, Biochemistry 12 (1973) 4161.35] J.R. Lakowicz, Principles of Fluorescence Spectroscopy, Plenum Press, New York,
1983, p. 258.
38] N. Zhou, Y.Z. Liang, P. Wang, J. Photochem. Photobiol. A: Chem. 185 (2007) 271.39] P. Athina, J.G. Rebecca, A.F. Richard, J. Agric. Food Chem. 53 (2005) 158.40] S. Molet, P. Gosset, P. Lassalle, W. Czarlewski, A.B. Tonnel, Clin. Exp. Allergy 27
(1997) 1167.

Journal of Colloid and Interface Science 344 (2010) 596–602
Contents lists available at ScienceDirect
Journal of Colloid and Interface Science
www.elsevier .com/locate / jc is
Investigations on the photoinduced interaction of water soluble thioglycolicacid (TGA) capped CdTe quantum dots with certain porphyrins
M. Asha Jhonsi, R. Renganathan *
School of Chemistry, Bharathidasan University, Tiruchirappalli 620 024, Tamil Nadu, India
a r t i c l e i n f o
Article history:Received 8 April 2009Accepted 8 January 2010Available online 18 January 2010
Keywords:CdTe QDsPorphyrinsFluorescence quenching
0021-9797/$ - see front matter � 2010 Elsevier Inc. Adoi:10.1016/j.jcis.2010.01.022
* Corresponding author. Fax: +91 431 2407045.E-mail address: [email protected] (R. Renganath
a b s t r a c t
The photoinduced interaction of TGA capped CdTe quantum dots (QDs) with porphyrins such as meso-tetrakis(4-sulfonatophenyl)porphyrin [TSPP], meso-tetrakis(4-carboxyphenyl)porphyrin [TCPP], meso-tetrakis (4-N-methylpyridyl)porphyrin [TMPyP] and meso-tetraphenylporphyrin [TPP] has been studiedby using absorption, steady state and time resolved fluorescence spectroscopy. The QD surface was neg-atively charged due to thiol capping agent containing carboxylic group. Positively charged TMPyP interactswith QDs through charge transfer mechanism, negatively charged porphyrins (TCPP and TSPP) interactedthrough energy transfer mechanism and the neutral one (TPP) does not have any interaction. TheStern–Volmer constant, quenching rate constant, association constants, rate of electron transfer andenergy transfer parameters were calculated from the fluorescence data. Effect of molecular structurehas also been studied.
� 2010 Elsevier Inc. All rights reserved.
1. Introduction
II–VI Semiconductor nanocrystals, also known as quantum dots(QDs) have become more attractive than traditional organic dyeswhich suffer from fast photobleaching. Compared with organicdyes the promising properties of QDs such as resistance to photo-bleaching, chemical stability, wide absorption, narrow and sym-metric emission in visible range and tunable spectral propertiesmake them extensively applied in fluorescence resonance energytransfer (FRET) assays [1–4]. Luminescent QDs have been widelyused as novel fluorescent probe in biosensor and bioimaging dueto their unique optical and electrical properties [5,6].
Among various semiconductor materials CdTe is one of the sub-stances providing very high luminescence quantum efficiency. Thequantum yield of CdTe QDs depends on the synthesis conditionsand post-treatments. Earlier studies suggested that ligands mightplay an important role in both the quality and optical propertiesof QDs [7–9].
CdTe QDs were synthesized from aqueous solution and werestabilized by using water soluble thioglycolic acid. In addition toserving as stabilizer, thio glycolic acid serves to: (i) passivate thesurface of QDs and thereby removing the surface traps which lowerthe photoluminescence efficiency of the quantum dots, (ii) preventthe non-radiative recombination of electron and hole and (iii)control growth kinetics thereby prevent aggregation via sterichindrance [10,11]. The capping agent is also a means by which
ll rights reserved.
an).
QDs interact with other molecules and their environment [12]through covalent attachments, electrostatic forces and hydrogenbonding [13].
Photodynamic therapy (PDT) is an emerging cancer treatmentthat takes advantage of the interaction between light and a photo-sensitizing agent to initiate apoptosis of cancer cells [14,15]. InPDT, the photosensitizing agent becomes activated by light butdoes not react directly with cells and tissues. Instead, it transfersits triplet state energy to nearby oxygen molecules to form reactivesinglet oxygen (1O2) species, which cause cytotoxic reactions in thecells [16].
During the past few decades, various types of molecules havebeen used as efficient sensitizers for PDT [17]. However, thereare many problems for the clinical application of existing photo-sensitizers [18] such as: (i) aggregation of photosensitizers inaqueous medium, (ii) decrease in quantum yield due to aggrega-tion and (iii) selective accumulation without damaging the healthytissues.
Semiconductor QDs overcome all the above problems. Due totheir large transition dipole moment, QDs are strong absorbers[19], making them ideal agents for PDT applications. More impor-tantly, the surface coating of QDs can be functionalized to makethem both water soluble and biocompatible [20–22], which facili-tates systemic delivery. It has been reported that photolysis ofCdSe QDs in the presence of ruthenium polypyridine complexes re-sulted in charge transfer rather than FRET [23].
The combination of QDs and photosensitizers enabled the use ofan excitation wavelength where the photosensitizer alone does notabsorb. Since the QDs exhibit a broad absorption spectrum its
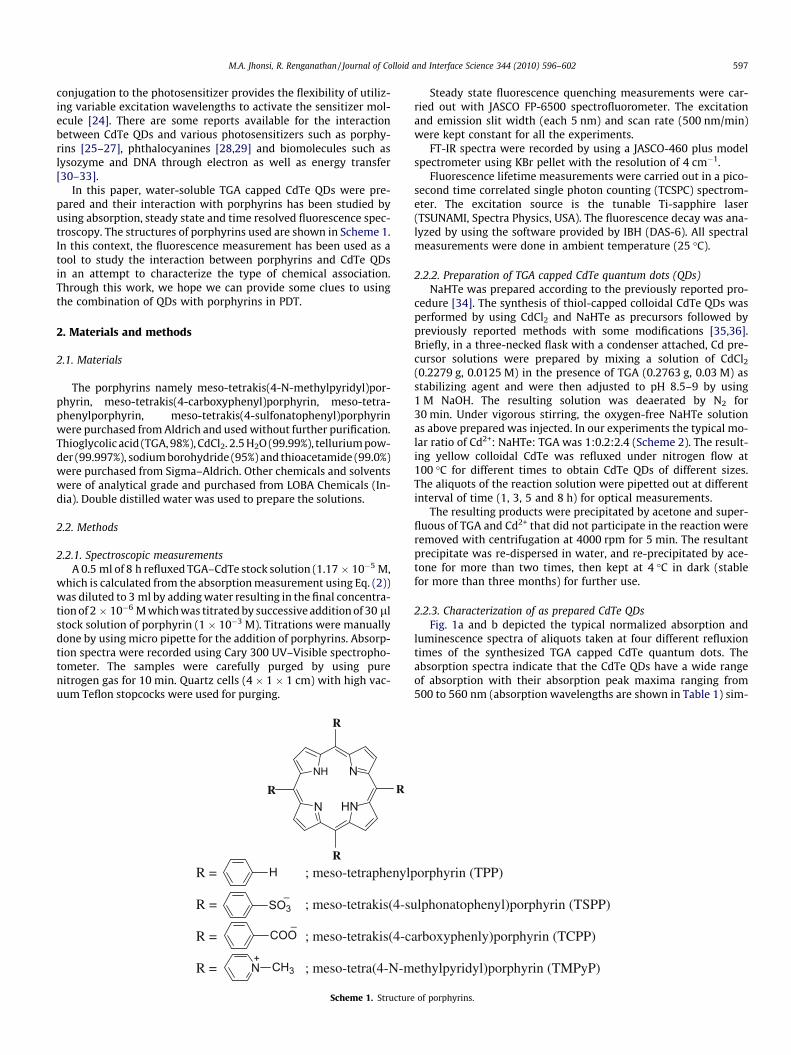
M.A. Jhonsi, R. Renganathan / Journal of Colloid and Interface Science 344 (2010) 596–602 597
conjugation to the photosensitizer provides the flexibility of utiliz-ing variable excitation wavelengths to activate the sensitizer mol-ecule [24]. There are some reports available for the interactionbetween CdTe QDs and various photosensitizers such as porphy-rins [25–27], phthalocyanines [28,29] and biomolecules such aslysozyme and DNA through electron as well as energy transfer[30–33].
In this paper, water-soluble TGA capped CdTe QDs were pre-pared and their interaction with porphyrins has been studied byusing absorption, steady state and time resolved fluorescence spec-troscopy. The structures of porphyrins used are shown in Scheme 1.In this context, the fluorescence measurement has been used as atool to study the interaction between porphyrins and CdTe QDsin an attempt to characterize the type of chemical association.Through this work, we hope we can provide some clues to usingthe combination of QDs with porphyrins in PDT.
2. Materials and methods
2.1. Materials
The porphyrins namely meso-tetrakis(4-N-methylpyridyl)por-phyrin, meso-tetrakis(4-carboxyphenyl)porphyrin, meso-tetra-phenylporphyrin, meso-tetrakis(4-sulfonatophenyl)porphyrinwere purchased from Aldrich and used without further purification.Thioglycolic acid (TGA, 98%), CdCl2. 2.5 H2O (99.99%), tellurium pow-der (99.997%), sodium borohydride (95%) and thioacetamide (99.0%)were purchased from Sigma–Aldrich. Other chemicals and solventswere of analytical grade and purchased from LOBA Chemicals (In-dia). Double distilled water was used to prepare the solutions.
2.2. Methods
2.2.1. Spectroscopic measurementsA 0.5 ml of 8 h refluxed TGA–CdTe stock solution (1.17 � 10�5 M,
which is calculated from the absorption measurement using Eq. (2))was diluted to 3 ml by adding water resulting in the final concentra-tion of 2 � 10�6 M which was titrated by successive addition of 30 llstock solution of porphyrin (1 � 10�3 M). Titrations were manuallydone by using micro pipette for the addition of porphyrins. Absorp-tion spectra were recorded using Cary 300 UV–Visible spectropho-tometer. The samples were carefully purged by using purenitrogen gas for 10 min. Quartz cells (4 � 1 � 1 cm) with high vac-uum Teflon stopcocks were used for purging.
N
NH N
HNR
R
R
R
R = ; meso-tetraphenylp
R = ; meso-tetrakis(4-su
R = ; meso-tetrakis(4-c
R = ; meso-tetra(4-N-m
SO3_
COO_
H
N CH3+
Scheme 1. Structure
Steady state fluorescence quenching measurements were car-ried out with JASCO FP-6500 spectrofluorometer. The excitationand emission slit width (each 5 nm) and scan rate (500 nm/min)were kept constant for all the experiments.
FT-IR spectra were recorded by using a JASCO-460 plus modelspectrometer using KBr pellet with the resolution of 4 cm�1.
Fluorescence lifetime measurements were carried out in a pico-second time correlated single photon counting (TCSPC) spectrom-eter. The excitation source is the tunable Ti-sapphire laser(TSUNAMI, Spectra Physics, USA). The fluorescence decay was ana-lyzed by using the software provided by IBH (DAS-6). All spectralmeasurements were done in ambient temperature (25 �C).
2.2.2. Preparation of TGA capped CdTe quantum dots (QDs)NaHTe was prepared according to the previously reported pro-
cedure [34]. The synthesis of thiol-capped colloidal CdTe QDs wasperformed by using CdCl2 and NaHTe as precursors followed bypreviously reported methods with some modifications [35,36].Briefly, in a three-necked flask with a condenser attached, Cd pre-cursor solutions were prepared by mixing a solution of CdCl2
(0.2279 g, 0.0125 M) in the presence of TGA (0.2763 g, 0.03 M) asstabilizing agent and were then adjusted to pH 8.5–9 by using1 M NaOH. The resulting solution was deaerated by N2 for30 min. Under vigorous stirring, the oxygen-free NaHTe solutionas above prepared was injected. In our experiments the typical mo-lar ratio of Cd2+: NaHTe: TGA was 1:0.2:2.4 (Scheme 2). The result-ing yellow colloidal CdTe was refluxed under nitrogen flow at100 �C for different times to obtain CdTe QDs of different sizes.The aliquots of the reaction solution were pipetted out at differentinterval of time (1, 3, 5 and 8 h) for optical measurements.
The resulting products were precipitated by acetone and super-fluous of TGA and Cd2+ that did not participate in the reaction wereremoved with centrifugation at 4000 rpm for 5 min. The resultantprecipitate was re-dispersed in water, and re-precipitated by ace-tone for more than two times, then kept at 4 �C in dark (stablefor more than three months) for further use.
2.2.3. Characterization of as prepared CdTe QDsFig. 1a and b depicted the typical normalized absorption and
luminescence spectra of aliquots taken at four different refluxiontimes of the synthesized TGA capped CdTe quantum dots. Theabsorption spectra indicate that the CdTe QDs have a wide rangeof absorption with their absorption peak maxima ranging from500 to 560 nm (absorption wavelengths are shown in Table 1) sim-
orphyrin (TPP)
lphonatophenyl)porphyrin (TSPP)
arboxyphenly)porphyrin (TCPP)
ethylpyridyl)porphyrin (TMPyP)
of porphyrins.

CdCl2 + Oxygen free NaHTe TGA, SO
OHS O
OH
S
OHO
S
O
HOSO
HO
S
OOH
pH (8.5-9)
Refluxion at 100 C°CdTe
Scheme 2. Synthesis of TGA–capped colloidal CdTe quantum dots.
80
100
TGA-CdTe TGA
0
0.1
0.2
0.3
0.4
440 490 540 590 640 690
Wavelength (nm)
Abs
orba
nce
Refluxion time
1h
3h
5h
8h
0
170
340
510
680
850
510 548 586 624 662 700
Wavelength (nm)
Inte
nsit
y
Refluxion time
8h
5h
3h
1h
a
b
Fig. 1. (a) Absorption spectra of TGA capped CdTe QDs in various refluxion times(1 h – red, 3 h – blue, 5 h – green and 8 h – Pink). (b) Emission spectra of TGAcapped CdTe QDs in various refluxion times (1 h – red, 3 h – blue, 5 h – green and8 h – pink). (For interpretation of the references to color in this figure legend, thereader is referred to the web version of this article.)
598 M.A. Jhonsi, R. Renganathan / Journal of Colloid and Interface Science 344 (2010) 596–602
ilar to those previously reported for thiol stabilized CdTe QDs[37,38]. A well resolved absorption maximum of the first electronictransition is observed and showed a narrow size distribution of theCdTe QDs. The sharp and narrow emission peaks ranging from 530to 590 nm (Table 1) indicated that they had desirable dispersibility,uniformity, and good fluorescence properties. The emission profileremained unchanged after weeks of storage in ambient conditions,suggested a protected surface. When the refluxion time increases ared shift in both absorption and emission wavelengths were ob-
Table 1Absorption (kexi) and emission (kemi) wavelengths of TGA–CdTe QDs and lifetime ofQDs in different refluxion time.
S. no. Refluxion time(h)
kexi
(nm)kemi
(nm)Lifetime (s)
s1 (ns) s2 (ns) s3 (ns)
1 1 510 536 2.89 14.30 0.222 3 531 563 2.89 15.05 0.523 5 543 576 2.92 14.38 0.224 8 551 588 2.02 13.92 0.23
served due to the elongation of the long axis, i.e., due to the de-crease of confinement in one dimension [39]. The red shift uponshell growth is the result of a decrease in the kinetic energy ofthe excited electrons and holes in the nanoparticles due to thespreading of their wave functions into the shell [40].
The particle sizes of CdTe QDs were determined according to Eq.(1) [41] and the values were around 2.4, 3.0, 3.2 and 3.8 nm, corre-sponding with the first absorption maximum of 510, 532, 543 and551 nm, respectively.
D ¼ ð9:8127� 10�7Þk3 � ð1:7147� 10�3Þk2 þ ð1:0064Þk� 194:84
ð1Þ
It is difficult to determine the concentration of prepared CdTeQDs by gravimetric method, so it was calculated from the UV spec-trum method by using Lambert–Beer’s law (Eq. (2)) [42]:
A ¼ eCl ð2Þ
In Eq. (2), A is the absorbance of first exitonic absorption peakfor CdTe. C is the concentration of CdTe QDs. l is the path lengthof the radiation beam used, and e is the molar extinction coefficientof CdTe QDs at the first exitonic absorption peak, which could beobtained from the formula e = 10043(D)2.12 [41]. D is the particlesize of the prepared QDs. Based on Eq. (2) concentration of the pre-pared CdTe QDs is 1.17 � 10�5 M.
2.2.4. FT-IR measurementFig. 2 shows the FT-IR spectra of TGA alone and TGA–capped
CdTe QDs. From the spectra we observed that TGA shows morepeaks in the region of 2000–400 cm�1, but those peaks are com-pletely absent in the spectrum of TGA–CdTe which indicate thatthe thiol moiety strongly interact with the surface of CdTe QDsthrough its carboxylic ligands, the carboxylic ligands donating itselectrons to the surface of QDs and make it negatively charged[43].
0
20
40
60
4007001000130016001900
Wave number (cm-1)
%T
Fig. 2. FT-IR spectrum of TGA (green dotted line) and TGA capped CdTe QDs (red-solid line). (For interpretation of the references to color in this figure legend, thereader is referred to the web version of this article.)

0
150
300
450
600
750
510 568 626 684 742 800
Wavelength (nm)
Inte
nsit
y
0
7
Fig. 4. Effect of increasing concentration of TSPP [0–7 � 10�5 M, green] on theemission spectrum of TGA–CdTe QDs [2 � 10�6 M, red] kexi: 500 nm. Rose curveindicates the emission spectrum TSPP (7 � 10�5 M), excited at 500 nm. (Forinterpretation of the references to color in this figure legend, the reader is referredto the web version of this article.)
0
164
328
492
656
820
510 568 626 684 742 800
Wavelength (nm)
Inte
nsit
y
0
7
Fig. 5. Effect of concentration of TMPyP (0–7 � 10�5 M, green) on the emissionspectrum of TGA–CdTe QDS (2 � 10�6 M, red) kexi: 500 nm. (For interpretation ofthe references to color in this figure legend, the reader is referred to the web versionof this article.)
M.A. Jhonsi, R. Renganathan / Journal of Colloid and Interface Science 344 (2010) 596–602 599
3. Results and discussion
3.1. Absorption characteristics of CdTe QDs with porphyrins
To study the interaction between QDs and porphyrins we havechosen the 8 h refluxed TGA capped CdTe QDs. The comparison ofabsorption and emission spectra of TCPP as well as QDs are shownin Fig. 3. In the ground state absorption studies while increasingthe concentration of porphyrins (0–7 � 10�5 M) there is no changein the absorption spectrum of QDs, the peak responsible for QDsand porphyrins were observed separately (figures are not shownhere), which indicated that there is no particular interaction (likeground state complex formation) between QDs and porphyrins,proving merely the surface adsorption of porphyrins on QDs.
3.2. Fluorescence characteristics of CdTe QDs with porphyrins
3.2.1. Steady state measurementsFig. 4 shows the effect of TSPP on the steady state fluorescence
spectrum of CdTe QDs excited at 500 nm. From the figure we ob-served a steady decrease in the fluorescence intensity of QDs (at588 nm) with increase in TSPP concentration. At the same timetwo new peaks were formed (at 647 and 704 nm) with regular in-crease in intensity. Further we have recorded the emission spec-trum of TSPP (in which the highest concentration which wereadded to the QDs solution) at the same excitation wavelength(500 nm) of QDs; we found only very weak fluorescence of TSPPin this excitation. From this result we confirmed that the formationof new peaks is entirely due to complex formation between QDsand porphyrins and not due to inner filter effect and reabsorption.For TCPP also the same observation has been observed (spectra isnot shown here). An isoemissive point was observed at 633 nmwhich indicated that there are two types of species present inthe same solution such as porphyrins adsorbed on the surface ofQDs and free porphyrin molecules. The results from Fig. 4 indicatedthat the quenching of QDs has occurred in the presence ofporphyrins.
The effect of TMPyP on the fluorescence spectrum of QDs isshown in Fig. 5 which indicates that there is a regular decreasein emission intensity of QDs with increase in concentration ofTMPyP, but here we didn’t observed any new peak or isoemissivepoint as like TSPP and TCPP. Finally the neutral TPP does not showany quenching of the fluorescence intensity of QDs (spectrum isnot shown here). From the above discussion we observed thatthe porphyrins having substituents in their structure shows signif-
0
0.2
0.4
0.6
0.8
1
300 400 500 600 700 800 900 1000
Wavelength (nm)
Abs
orba
nce
0
150
300
450
600
750
Inte
nsit
y
TCPP-Abs CdTe-Abs
CdTe-Emi TCPP-Emi
0
0.01
0.02
0.03
0.04
450 550 650 750
Wavelength (nm)
Abs
orba
nce
0
200
400
600
800
Inte
nsit
y
Fig. 3. Absorption and emission spectra of TCPP (7 � 10�5 M; red-solid line, red-broken line) and CdTe QDs (2 � 10�6 M; blue-solid line, blue-broken line) respec-tively. Inset is the expanded view of 450–750 nm range which shows the overlapbetween emission spectrum of QDs and absorption spectrum of TCPP (Q-bands).(For interpretation of the references to color in this figure legend, the reader isreferred to the web version of this article.)
icant effect on the interaction with QDs but the unsubstituted neu-tral porphyrin (TPP) does not show any such interaction. So theimportance of substituents in porphyrin structure has also beenanalyzed.
The quenching of QDs fluorescence by porphyrins can be de-scribed by Stern–Volmer Eq. (3).
I0=I ¼ 1þ KSV½Q � ð3Þ
where I0 and I are the fluorescence intensities of QDs in the absenceand presence of porphyrins, respectively. KSV is the Stern–Volmerconstant and [Q] is the concentration of respective quencher.According to Eq. (3), the Stern–Volmer constant (KSV) is obtainedfrom the slope of the plot. From KSV we have calculated the valueof quenching rate constant (kq = Ksv/s) by using the lifetime ofQDs (�2 ns, from time resolved measurement). The values of KSV
and kq were listed in Table 2. Upper limit of kq expected for a diffu-sion-controlled process is 1010 M�1 s�1 [44]. But for the presentQDs-porphyrins systems the high magnitude of kq were observed(1013 M�1 s�1, Table 2) which clearly revealed the involvement ofenergy transfer (static quenching).
The fluorescence quenching data were used in the determina-tion of binding constants between QDs and porphyrins accordingto Eq. (4),
logF0 � FF � F1
� �¼ log Kb þ n log ½Porphyrin� ð4Þ
where F0 and F are the fluorescence intensities of QDs in the ab-sence and presence of porphyrins, respectively; F1 is the fluores-cence intensity of QDs saturated with porphyrins. The plotbetween log[F0 � F/F � F1] and concentration of porphyrin resultedin a straight line as shown in Fig. 6 and from the slope we have cal-culated the binding constant (Kb) values which are shown in Table 2.The Kb decreases in the following order:
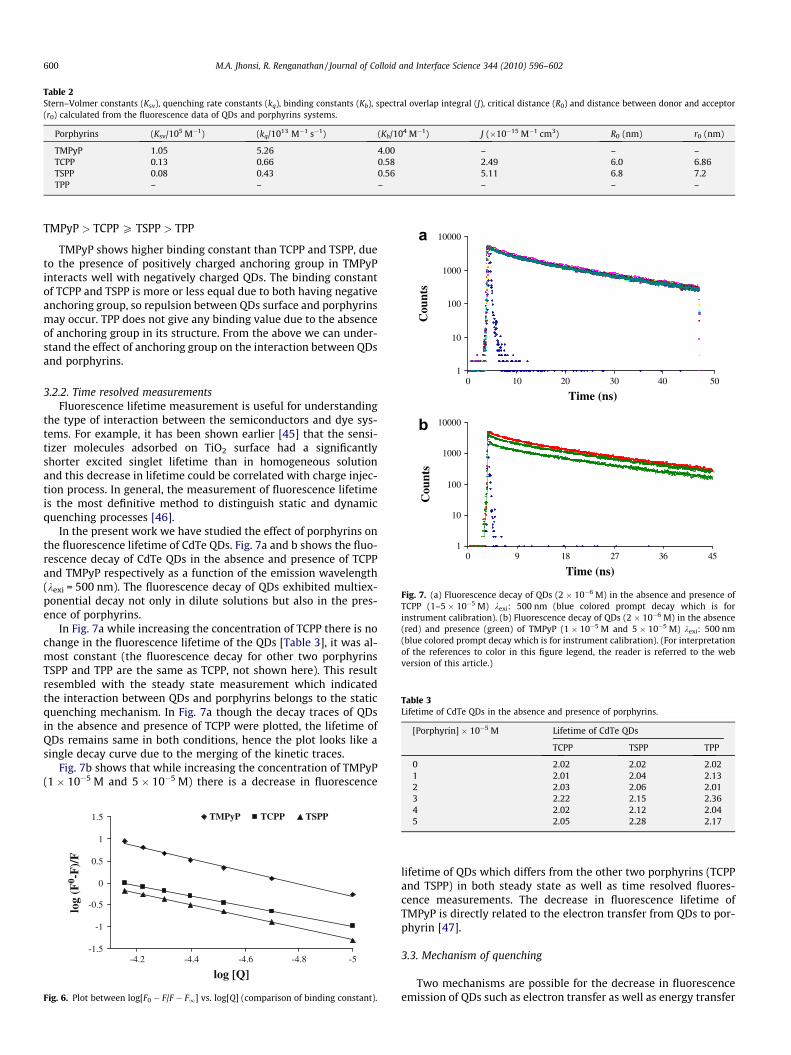
Table 2Stern–Volmer constants (Ksv), quenching rate constants (kq), binding constants (Kb), spectral overlap integral (J), critical distance (R0) and distance between donor and acceptor(r0) calculated from the fluorescence data of QDs and porphyrins systems.
Porphyrins (Ksv/105 M�1) (kq/1013 M�1 s�1) (Kb/104 M�1) J (�10�15 M�1 cm3) R0 (nm) r0 (nm)
TMPyP 1.05 5.26 4.00 – – –TCPP 0.13 0.66 0.58 2.49 6.0 6.86TSPP 0.08 0.43 0.56 5.11 6.8 7.2TPP – – – – – –
1
10
100
1000
10000
Time (ns)
Cou
nts
1
10
100
1000
10000
0 10 20 30 40 50
0 9 18 27 36 45
Time (ns)
Cou
nts
a
b
Fig. 7. (a) Fluorescence decay of QDs (2 � 10�6 M) in the absence and presence ofTCPP (1–5 � 10�5 M) kexi: 500 nm (blue colored prompt decay which is forinstrument calibration). (b) Fluorescence decay of QDs (2 � 10�6 M) in the absence(red) and presence (green) of TMPyP (1 � 10�5 M and 5 � 10�5 M) kexi: 500 nm(blue colored prompt decay which is for instrument calibration). (For interpretationof the references to color in this figure legend, the reader is referred to the webversion of this article.)
Table 3Lifetime of CdTe QDs in the absence and presence of porphyrins.
[Porphyrin] � 10�5 M Lifetime of CdTe QDs
TCPP TSPP TPP
0 2.02 2.02 2.021 2.01 2.04 2.132 2.03 2.06 2.01
600 M.A. Jhonsi, R. Renganathan / Journal of Colloid and Interface Science 344 (2010) 596–602
TMPyP > TCPP P TSPP > TPP
TMPyP shows higher binding constant than TCPP and TSPP, dueto the presence of positively charged anchoring group in TMPyPinteracts well with negatively charged QDs. The binding constantof TCPP and TSPP is more or less equal due to both having negativeanchoring group, so repulsion between QDs surface and porphyrinsmay occur. TPP does not give any binding value due to the absenceof anchoring group in its structure. From the above we can under-stand the effect of anchoring group on the interaction between QDsand porphyrins.
3.2.2. Time resolved measurementsFluorescence lifetime measurement is useful for understanding
the type of interaction between the semiconductors and dye sys-tems. For example, it has been shown earlier [45] that the sensi-tizer molecules adsorbed on TiO2 surface had a significantlyshorter excited singlet lifetime than in homogeneous solutionand this decrease in lifetime could be correlated with charge injec-tion process. In general, the measurement of fluorescence lifetimeis the most definitive method to distinguish static and dynamicquenching processes [46].
In the present work we have studied the effect of porphyrins onthe fluorescence lifetime of CdTe QDs. Fig. 7a and b shows the fluo-rescence decay of CdTe QDs in the absence and presence of TCPPand TMPyP respectively as a function of the emission wavelength(kexi = 500 nm). The fluorescence decay of QDs exhibited multiex-ponential decay not only in dilute solutions but also in the pres-ence of porphyrins.
In Fig. 7a while increasing the concentration of TCPP there is nochange in the fluorescence lifetime of the QDs [Table 3], it was al-most constant (the fluorescence decay for other two porphyrinsTSPP and TPP are the same as TCPP, not shown here). This resultresembled with the steady state measurement which indicatedthe interaction between QDs and porphyrins belongs to the staticquenching mechanism. In Fig. 7a though the decay traces of QDsin the absence and presence of TCPP were plotted, the lifetime ofQDs remains same in both conditions, hence the plot looks like asingle decay curve due to the merging of the kinetic traces.
Fig. 7b shows that while increasing the concentration of TMPyP(1 � 10�5 M and 5 � 10�5 M) there is a decrease in fluorescence
-1.5
-1
-0.5
0
0.5
1
1.5
-5-4.8-4.6-4.4-4.2
log [Q]
log
(F0 -
F)/
F
TMPyP TCPP TSPP
Fig. 6. Plot between log[F0 � F/F � F1] vs. log[Q] (comparison of binding constant).
3 2.22 2.15 2.364 2.02 2.12 2.045 2.05 2.28 2.17
lifetime of QDs which differs from the other two porphyrins (TCPPand TSPP) in both steady state as well as time resolved fluores-cence measurements. The decrease in fluorescence lifetime ofTMPyP is directly related to the electron transfer from QDs to por-phyrin [47].
3.3. Mechanism of quenching
Two mechanisms are possible for the decrease in fluorescenceemission of QDs such as electron transfer as well as energy transfer

M.A. Jhonsi, R. Renganathan / Journal of Colloid and Interface Science 344 (2010) 596–602 601
(shown in Scheme 3). In Fig. 4 there is a decrease of the donor(QDs) emission and an increase in the acceptor’s (porphyrin) fluo-rescence which indicates FRET has occurred. (For energy transferthere should be an overlap between the emission spectrum of do-nor and absorption spectrum of the acceptor). The inset of Fig. 3shows the overlap between emission spectrum of QDs and theabsorption spectrum of TCPP (‘Q’ bands) which indicates theremay be an initial energy transfer from QDs to the porphyrins (TCPPand TSPP) and the porphyrins gets excited and then emit. The life-time results of the above two porphyrins (almost constant) also fa-vors the energy transfer mechanism.
According to Forster’s non-radiative energy transfer theory [48],the energy transfer efficiency is related not only to the distance be-tween the acceptor and donor (r0), but also to the critical energytransfer distance (R0), that is:
E ¼ R6
R60 þ r6
0
ð5Þ
where R0 is the critical distance when the transfer efficiency is 50%.
R60 ¼ 8:8� 10�25 K2N�4UJ ð6Þ
where K2 is the spatial orientation factor of the dipole, N the refrac-tive index of the medium, U the fluorescence quantum yield of thedonor, J the overlap integral of the fluorescence emission spectrumof the donor and the absorption spectrum of the acceptor. The valueof J can be calculated by using the Eq. (8),
J ¼Z
FðkÞeðkÞk4 dkFðkÞ dk
ð7Þ
where F(k) is the fluorescence intensity of the donor, e(k) is molarabsorptivity of the acceptor. The parameter J can be evaluated byintegrating the spectral parameters in Eq. (7). Under these experi-mental conditions, we found R0 from Eq. (6) using K2 = 2/3,U = 0.032, N = 1.3467 (the values of K2, U and N were taken fromthe literature [49]). Obviously, the calculated value of R0 is in therange of maximal critical distance (R0 = 5–10 nm) [50]. This is inaccordance with the conditions of Forster’s non-radiative energytransfer theory [50], indicating the static quenching interaction be-tween CdTe QDs and porphyrins (TCPP and TSPP). Using Eq. (5) wefound r0. The values of J, R0 and r0 for TCPP and TSPP are listed inTable 2. From the table we observed that the value of distance be-tween donor and acceptor (r0) is less than 8 nm suggested thatnon-radiative energy transfer has occurred with high probabilityand also the obtained value of distance between donor and acceptoris higher than the critical distance (R0) which revealed the statictype of mechanism as reported earlier [51,52].
N
NH N
HN
R
R
R
R
+
SO3_
COO_
N CH3+
R=
R=
R=
Energy Transfe
Electron Trans
SO
OHS O
OH
S
OHO
S
O
HOSO
HO
S
OOH
CdTe
Scheme 3. Mode of interaction between p
Similar to TCPP and TSPP there is an overlap between emission ofQDs and absorption of TMPyP (Q-bands) hence FRET would be ex-pected as reported by Burda and co-workers [53]. However, on addi-tion of QDs to TMPyP in aqueous media there was no increase in theemission spectra of TMPyP but there was a decrease in the fluores-cence intensity of the QDs (Fig. 5). This indicated the absence of en-ergy transfer, so electron transfer may be possible for this TMPyP andQDs system which is proved by decrease in fluorescence lifetime ofQDs. Similar type of a spontaneous charge transfer from QDs to a pos-itively charged porphyrazine has been reported [54].
The observed decrease in the lifetime is indicative of the factthat the interaction of TMPyP with CdTe results in electron transferquenching (Fig. 7b). If we assume that the transferring of electronsfrom the QDs surface to TMPyP is the only process responsible forthe observed decrease in emission lifetime, then we can estimatethe rate constant for electron transfer from expression (8) [45,55].
ket ¼ 1=sads � 1=s ð8Þ
where s and sads are the unadsorbed and adsorbed fluorescence life-times of TMPyP-QDs. The calculated ket value is shown in Table 4.
3.4. Calculation of free energy changes (DGet) for the electron transferreactions
The cyclic voltammogram of CdTe QDs capped with TGA hasbeen reported in the literature [56]. Oxidation potential of CdTeQDs was observed at 0.63 V. The thermodynamic feasibility of elec-tron transfer reactions was calculated by employing the wellknown Rehm–Weller expression [57].
DGet ¼ EðOXÞ1=2 � EðredÞ
1=2 � Es þ C ð9Þ
where EðoxÞ1=2 is the oxidation potential of the donor (0.63 V), EðredÞ
1=2 isthe reduction potential of the acceptor (for TMPyP, �0.43 V [58])Es is the excited state energy of the sensitizer (for CdTe QDs2.01 eV which is calculated from the fluorescence state) and C isthe coulombic term. Since one of the species is neutral and thesolvent used is polar in nature, the coulombic term in the aboveexpression is neglected [59]. The DGet values thus calculated forthe electron transfer process between CdTe QDs and TMPyP is neg-ative (�0.95 eV). Hence, the electron transfer process studied isthermodynamically favorable [60].
4. Summary
The porphyrins studied were found to be adsorbed on the sur-face of CdTe QDs. Negatively charged porphyrins were involvedin the energy transfer mechanism and the related parameters were
TGA-CdTe QDs
hν
Energy /
Electron
r
fer= Porphyrin
orphyrins and TGA capped CdTe QDs.

Table 4The data of TMPyP from fluorescence lifetime measurements.
Samples s (ns) A1 (%) sads (ns) A2 (%) v2 ket � 109 s�1
TMPyP 2.02 100 – – 1.2 –TMPyP + CdTe QDsa 2.01 26.5 0.65 73.4 1.4 1.04TMPyP + CdTe QDsb 2.01 25.8 0.37 74.2 1.1 2.21
A1, A2 are the percentages of components with the defined fluorescence lifetime.ket is the rate of electron transfer.s and sads are the unadsorbed and adsorbed fluorescence lifetimes.
a The concentration of CdTe QDs is 1 � 10�5 M.b The concentration of CdTe QDs is 5 � 10�5 M.
602 M.A. Jhonsi, R. Renganathan / Journal of Colloid and Interface Science 344 (2010) 596–602
calculated, where as positively charged porphyrin involves elec-tron transfer from QDs to porphyrin which is proved by Rehm–Weller calculation and lifetime measurements. The neutral por-phyrin does not have any interaction with the QDs surface. TheStern–Volmer constant, quenching rate constant, association con-stant and rate of electron transfer have been calculated. Hencemaking the combination of porphyrin derivatives and QDs are po-tential candidates for applications as photosensitizers in photody-namic therapy.
Acknowledgments
R.R. and M.A. thank DST (Ref: SR/NM/NS-16/2007, dt.: 26–09–08) (Government of India) for the project and fellowshiprespectively.
Authors also thank DST-FIST and UGC-SAP for spectrofluorime-ter facility in the School of Chemistry, Bharathidasan University,Trichy and Prof. P. Ramamoorthy, NCUFP, University of Madras,Chennai for lifetime measurements.
References
[1] A.R. Clapp, I.L. Medintz, J.M. Mauro, B.R. Fisher, M.G. Bawendi, H. Mattoussi, J.Am. Chem. Soc. 126 (2004) 301.
[2] A.R. Clapp, I.L. Medintz, H.T. Uyeda, B.R. Fisher, E.R. Goldman, M.D. Bawendi, J.Am. Chem. Soc. 127 (2005) 18212.
[3] Y.P. Ho, H.H. Chen, K.W. Leong, T.H. Wang, J. Controlled Release 116 (2006) 83.[4] L. Shi, V. DePaoli, N. Rosenzweig, Z. Rosenzweig, J. Am. Chem. Soc. 128 (2006)
10378.[5] L. Dan, L. Gaiping, G. Weiwei, L. Peicai, W. Erkang, J. Wang, Biomaterials 29
(2008) 2776.[6] J. Liang, Y. Cheng, H. Han, J. Mol. Struct. 892 (2008) 116.[7] Q. Shang, H. Wang, H. Yu, G. Shan, R. Yan, Colloids Surf., A 294 (2007) 86.[8] A.L. Rogach, L. Katsikas, A. Kornowski, D. Su, A. Eychmuller, H. Weller, Ber.
Bungenges. Phys. Chem. 100 (1996) 1772.[9] Y. Zhang, H. Zhang, M. Ma, X. Guo, H. Wang, Appl. Surf. Sci. 255 (2009) 4747.
[10] (a) J. Aldana, Y.A. Wang, X. Peng, J. Am. Chem. Soc. 123 (2001) 8844;(b) H. Zhang, Z. Zhou, B. Yang, J. Phys. Chem. B 107 (2003) 8.
[11] M. Gao, S. Kirstein, H. Mo1hwald, J. Phys. Chem. B 102 (1998) 8360.[12] M. Idowu, E. Lamprecht, T. Nyokong, J. Photochem. Photobiol., A 198 (2008) 7.[13] A.C.S. Samia, S. Dayal, C. Burda, Photochem. Photobiol. 82 (2006) 617.[14] R.L. Morris, K. Azizuddin, M. Lam, J. Berlin, A. Nieminen, M.E. Kenney, A.C.S.
Samia, C. Burda, N.L. Oleinick, Cancer Res. 63 (2003) 5194.[15] T.J. Dougherty, C.J. Gomer, B.W. Henderson, G. Jori, D. Kessel, M. Korbelik, J.
Moan, Q. Peng, J. Natl. Cancer Inst. 90 (1998) 889.
[16] C.M. Allen, W.M. Sharman, J.E. Van Lier, Porphyrins Phthalocyanines 5 (2001)161.
[17] K. Sunada, Y. Kikuchi, K. Hashimoto, A. Fujishima, Environ. Sci. Technol. 32(1998) 726.
[18] S. Wang, R. Gao, F. Zhou, M. Selke, J. Mater. Chem. 14 (2004) 487.[19] P. Alivisatos, Pure Appl. Chem. 72 (2000) 3.[20] B. Dubertret, P. Skourides, D.J. Norris, V. Noireaux, A.H. Brivanlou, A. Libchaber,
Science 298 (2002) 1759.[21] W.C. Chan, S. Nie, Science 281 (1998) 2016.[22] M. Bruchez, M. Moronne, P. Gin, S. Weiss, A.P. Alivisatos, Science 281 (1998)
2013.[23] M. Sykora, M.A. Petruska, J. Alstrum-Acevedo, I. Bezel, T.J. Meyer, V.I. Klimov, J.
Am. Chem. Soc. 128 (2006) 9984.[24] A.C.S. Samia, X. Chen, C. Burda, J. Am. Chem. Soc. 125 (2003) 15736.[25] L. Shi, B. Hernandez, M. Selke, J. Am. Chem. Soc. 128 (2006) 6278.[26] Y. Liu, W. Chen, S. Wang, A.G. Joly, Appl. Phys. Lett. 92 (2008) 043901.[27] P. Juzenas, W. Chen, Y.P. Sun, M.A.N. Coelho, R. Generalov, N. Generalova, I.L.
Christensen, Adv. Drug Delivery Rev. 60 (2008) 1600.[28] S. Moeno, T. Nyokong, Polyhedron 27 (2008) 1953.[29] S. Moeno, M. Idowu, T. Nyokong, Inorg. Chim. Acta 361 (2008) 2950.[30] Y.L. Wu, F. He, X.W. He, W.Y. Li, Y.K. Zhang, Spectrochim. Acta, Part A 71 (2008)
1199.[31] Q. Xu, J.H. Wang, Z. Wang, Z.H. Yin, Q. Yang, Y.D. Zhao, Electrochem. Commun.
10 (2008) 1337.[32] J. Li, M. Li, X. Li, J. Tanga, J. Kanga, H. Zhanga, Y. Zhanga, Colloids Surf., B 67
(2008) 79.[33] S. Hohng, T. Ha, J. Am. Chem. Soc. 126 (2004) 1324.[34] Q. Wang, Y. Kuo, Y. Wang, G. Shin, C. Ruengruglikit, Q. Huang, J. Phys. Chem. B
110 (2006) 16860.[35] H. Peng, L. Zhang, C. Soeller, J.T. Sejdic, J. Lumin. 127 (2007) 721.[36] Y.S. Xia, C. Cao, C.Q. Zhu, J. Lumin. 128 (2008) 166.[37] D.V. Talapin, A.L. Rogach, E.V. Shevchenko, A. Kornowski, M. Haase, H. Weller, J.
Am. Chem. Soc. 124 (2002) 5782.[38] N. Gaponik, D.V. Talapin, A.L. Rogach, K. Hoppe, E.V. Shevchenko, A. Kornowski,
A. Eychmu1ller, H. Weller, J. Phys. Chem. 106 (2002) 7177.[39] J. Li, X. Hong, D. Li, K. Zhao, L. Wang, H. Wang, Z. Du, J. Li, Y. Bai, T. Li, Chem.
Commun. (2004) 1740.[40] X. Peng, M.C. Schlamp, A.V. Kadavanich, A.P. Alivisatos, J. Am. Chem. Soc. 119
(1997) 7019.[41] W.W. Yu, L. Qu, W. Guo, X. Peng, Chem. Mater. 15 (2003) 2854.[42] W. Guo, J.J. Li, Y.A. Wang, X. Peng, J. Am. Chem. Soc. 125 (2003) 3901.[43] H. Rong, Y. Xiaogang, T. Hongye, G. Feng, C. Daxiang, Front. Chem. China 3
(2008) 325.[44] X.Z. Feng, Z. Lin, L.J. Yang, C. Wang, C.L. Bai, Talanta 47 (1998) 1223.[45] P.V. Kamat, J.P. Chauvet, R.W. Fessenden, J. Phys. Chem. 90 (1986) 1389.[46] J.R. Lakowicz, Principles of Fluorescence Spectroscopy, Plenum Press, New
York, 1983. p. 258.[47] Z. Zhou, S. Qian, S. Yao, Z. Zhang, Radiat. Phys. Chem. 65 (2002) 241.[48] J.R. Lakowicz, Principles of Fluorescence Spectroscopy, Plenum Press, New
York, 1983.[49] L. Cyril, J.K. Earl, W.M. Sperry, Biochemists Handbook, E & F.N Spon, London,
1961.[50] G.Z. Chen, X.Z. Huang, J.G. Xu, Z.B. Wang, Z.Z. Zhang, Method of Fluorescent
Analysis, second ed., Science Press, Beijing, 1990 (Chapter 4).[51] W.Y. He, Y. Li, C.X. Xue, Z.D. Hu, X.G. Chen, F.L. Sheng, Bioorg. Med. Chem. 13
(2005) 1837.[52] Y.J. Hu, Y. Liu, L.X. Zhang, J. Mol. Struct. 750 (2005) 174.[53] S. Dayal, C. Burda, J. Chem. Soc. 129 (2007) 7977.[54] S. Moeno, T. Nyokong, J. Photochem. Photobiol., A 201 (2009) 228.[55] C. Chen, X. Qi, B. Zhou, J. Photochem. Photobiol., A 109 (1997) 155.[56] S.K. Poznyak, N.P. Osipovich, A. Shavel, D.V. Talapin, M. Gao, A. Eychmuller, N.
Gaponik, J. Phys. Chem. B 109 (2005) 1094.[57] D. Rehm, A. Weller, Isr. J. Chem. 8 (1970) 259.[58] K. Kalyanasundaram, M.N. Spallart, J. Phy. Chem. 86 (1982) 5163.[59] S. Parret, F.M. Savary, J.P. Fouassier, P. Ramamurthy, J. Photochem. Photobiol.,
A 83 (1994) 205.[60] S. Nath, H. Pal, D.K. Palit, A.V. Sapre, J.P. Mittal, J. Phys. Chem. A 102 (1998)
5822.