an investigation into the use of serum albumin in pressure sore prediction
TRANSCRIPT

An investigation into the use of serumalbumin in pressure sore prediction
Denis Anthony RMN RGN BA MSc PhD AMIEE
The Mary Seacole Research Centre, School of Nursing and Midwifery,
De Montfort University, Leicester
Tim Reynolds BSc MB ChB MD MRCPath
Professor of Chemical Pathology, Queen's Hospital, Burton on Trent
and Linda Russell SRN BSc
Tissue Viability Nurse, Queen's Hospital, Burton on Trent, England
Accepted for publication 21 January 2000
ANTHONYANTHONY DD., REYNOLDSREYNOLDS TT. && RUSSELLRUSSELL L. (2000)L. (2000) Journal of Advanced Nursing 32(2),
359±365
An investigation into the use of serum albumin, in pressure sore prediction
Objectives To ascertain the relevance of serum albumin and serum sodium as
predictors of pressure sores in addition to the Waterlow score. Design Obser-
vational study of patients at risk of developing decubitus ulcers. Setting Staf-
fordshire, in the midlands of the United Kingdom. Participants 773 elderly
hospital in-patients of a district general hospital. Measurements Waterlow
scores and serum albumin and sodium. Development of a pressure sore.
Results Logistic regression analysis of serum albumin, serum sodium and the
Waterlow score showed the Waterlow score and serum albumin were signi®cant
predictors of pressure sores. Conclusions Serum albumin may, in this patient
group (in-patients over 64 years of age), be a useful predictor of pressure sore
occurrence, though further work is needed to establish whether this is the case.
Risk assessment of pressure sores can possibly be improved by adding serum
albumin to one of the pre-existing tools such as the Waterlow score.
Keywords: pressure sore, serum albumin, risk assessment, Waterlow score,
tissue viability, decubitus ulcer, prediction
INTRODUCTION
Serum albumin is the single most common method to
assess nutrition (Thomas 1997) and has been the subject of
a number of studies evaluating its importance, in pressure
sore risk assessment. The role of nutrition in the preven-
tion and treatment of pressure sores is a contentious issue.
There have been many reviews of nutrition with speci®c
reference to serum albumin (McLaren 1992, Lewis &
Harding 1993, Pinchcofsky-Devin 1994, Lewis 1996,
Strauss & Margolis 1996, Thomas 1997). From these
reviews it is clear that there is a relationship between
serum albumin and pressure sores, but it is much less
obvious that serum albumin is a predictor of pressure sores.
It has been known since the 1930s that patients who
have low serum albumin are more likely to develop
breakdown of wounds (Thompson et al. 1938a, 1938b)
and that patients with pressure sores have low serum
albumin concentrations (Mulholland et al. 1943). Further-
more, low serum albumin is associated with mortality
(Strauss & Margolis 1996). Many subsequent cross-
sectional studies have shown that patients with pressure
Correspondence: Denis Anthony, The Mary Seacole Research Centre,
School of Nursing and Midwifery, Charles Frears Campus, De Montfort
University, 266 London Road, Leicester LE2 1RQ, England.
Ó 2000 Blackwell Science Ltd 359
Journal of Advanced Nursing, 2000, 32(2), 359±365 Methodological issues in nursing research

sores have lower serum albumin than patients with no
sores. For example, regression analyses, in long-stay
patients who received extra nutritional support, indicated
albumin, mobility, activity and food intake as predictors
for pressure sores (Ek et al. 1991). However, protein may
be lost from sores (Strauss & Margolis 1996) and certain
conditions such as cachexia may cause both pressure sores
and poor absorption of nutrients (including protein)
(Strauss & Margolis 1996, Thomas 1997). It is unclear
therefore whether low protein levels cause pressures
sores, or pressures sores cause low protein levels, or
whether both are caused by a third factor.
An index of malnutrition based on biochemical and
anthropometric values did show predictive value in a
prospective study, and the two groups of malnourished
and non-malnourished were similar in terms of comor-
bidity, implying a real effect of malnutrition and not
simply a proxy for morbidity (Thomas et al. 1995). How-
ever, no single biochemical marker has been found for
pressure sores (Strauss & Margolis 1996). Prospective
studies of serum albumin and other univariate predictors
such as body mass index (BMI) have shown con¯icting
results (Thomas 1997). For example, serum albumin has
been found to be a positive predictive factor, in pressure
sores (Allman et al. 1986), but other studies show no
predictive value (Guralnik et al. 1988, Berlowitz & Wil-
king 1989, Allman et al. 1995). One problem with serum
albumin is its long half life of 21 days (Lewis 1996), and
possibly for this reason (Thomas 1997) improving nutri-
tional intake is not necessarily associated with an increase
in serum albumin.
It has been shown in animal studies, that being subjec-
ted to more than 4 hours of pressure invariably causes
sores, but the severity of the sore was greater in malnour-
ished animals (Takeda et al. 1992). As malnutrition is
associated with worse sores in animals, one might expect
albumin to be correlated with grade of sore, and in cross-
sectional studies (Pinchcofsky-Devin & Kaminski 1986)
this has been shown, but in a prospective study no
correlation was seen (Myers et al. 1990). Thomas (1997)
reported that no study has shown that increasing nutrition
prevents sores, though it can help to heal existing sores.
THE STUDY
Method
The Hospital Information Support System (HISS) in a
Staffordshire trust (Queen's Hospital, Burton-on-Trent)
allowed routinely collected data to be analysed. These
data included serum albumin, serum sodium, the Water-
low score and whether the patient had a sore on admis-
sion, or acquired one during admission.
Every patient was assessed using the Waterlow score on
admission to hospital: this is a mandatory ®eld in the
Hospital Information Support System (HISS) and cannot
be bypassed. Waterlow scores used in this study were all
taken on admission. Grading of pressure sores used the
Torrance score (Torrance 1983). A full day education
programme with ward nurses on pressure sore prevention
addressing the Waterlow and Torrance scores had been
carried out before data collection.
Albumin data were taken from routine laboratory tests,
performed as an admission pro®le on all acute medical
and all admissions aged 65 or over as a baseline from
which to monitor changes. Analysis was on a Beckman
CX-7 (Beckman Instruments Ltd, High Wycombe, UK)
using Beckman albumin reagents. Data were stored on the
main HISS computer and downloaded to an Access
database, whence it was matched with the pressure sore
®les. Serum sodium was measured on a Beckman CX-7 by
indirect ion-selective electrode.
Analyses were completed using SPSS for Windows
(version 9á0) and included logistic regression and receiver
operating characteristic (ROC). In all inferential testing
signi®cance was de®ned as a probability of less than 0á05.
Forward stepwise logistic regression using the Wald
method used a variable entry P-value of 0á05 and a
removal P-value of 0á10. A full model was also computed.
ROC curves are created by measuring the sensitivity and
speci®city of an assessment tool at various thresholds.
There are several basic texts on ROC (Swets 1979, Zweig &
Campbell 1993, Altman & Bland 1994a, 1994b, Rose 1995,
Anthony 1999). The normalized area under the ROC curve
gives a quantitative measure of the classi®cation ability of
the tool. A value of 0á5 (or 50%) indicates random
classi®cation, and a value above this is better than
random, with a perfect classi®cation shown by a value
of 1á0 or 100%.
Sample
The ®rst admission of any patient admitted in the period
30 July 1996 to 6 September 1997 was used. Analysis for
the remainder of this paper concentrates on the 773
patients who did not have a sore on admission, were over
64 years of age, and were admitted for a hospital stay of at
least 7 days (median 12, interquartile range 8±18, maxi-
mum 111) and for whom complete data on serum albumin,
sodium, Waterlow scores and pressure sore status were
available. This group contained 113 hospital acquired
sores. The sample is a convenience sample in that it
consists of all the patients admitted in the period prior to
the analysis that were available on the HISS.
RESULTS
Serum albumin, serum sodium and Waterlow score were
all found to be approximately normally distributed so
parametric tests were indicated. Student's t-test for
D. Anthony et al.
360 Ó 2000 Blackwell Science Ltd, Journal of Advanced Nursing, 32(2), 359±365
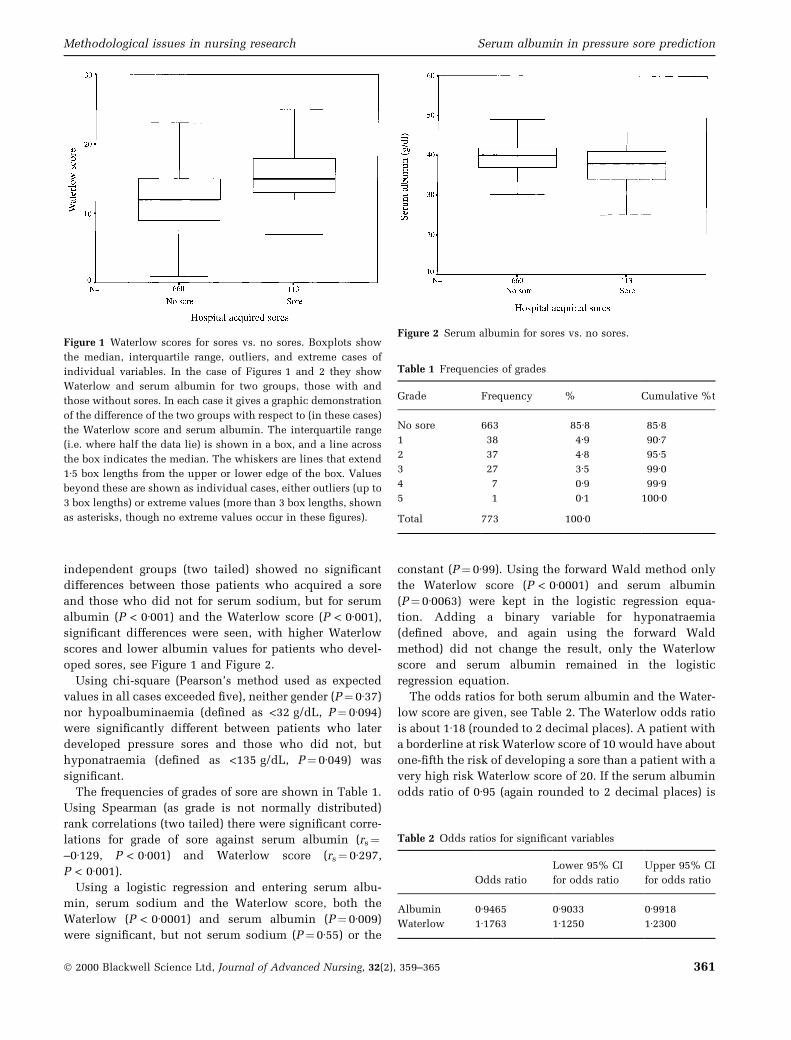
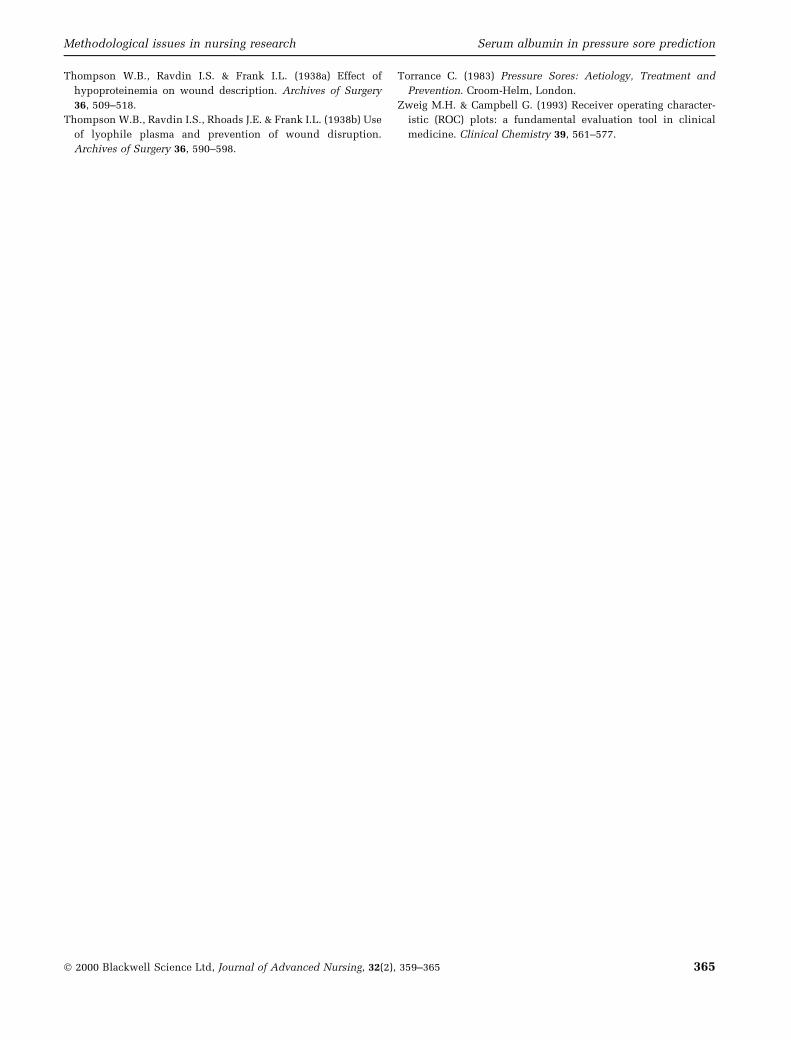
independent groups (two tailed) showed no signi®cant
differences between those patients who acquired a sore
and those who did not for serum sodium, but for serum
albumin (P < 0á001) and the Waterlow score (P < 0á001),
signi®cant differences were seen, with higher Waterlow
scores and lower albumin values for patients who devel-
oped sores, see Figure 1 and Figure 2.
Using chi-square (Pearson's method used as expected
values in all cases exceeded ®ve), neither gender (P� 0á37)
nor hypoalbuminaemia (de®ned as <32 g/dL, P� 0á094)
were signi®cantly different between patients who later
developed pressure sores and those who did not, but
hyponatraemia (de®ned as <135 g/dL, P� 0á049) was
signi®cant.
The frequencies of grades of sore are shown in Table 1.
Using Spearman (as grade is not normally distributed)
rank correlations (two tailed) there were signi®cant corre-
lations for grade of sore against serum albumin (rs�±0á129, P < 0á001) and Waterlow score (rs� 0á297,
P < 0á001).
Using a logistic regression and entering serum albu-
min, serum sodium and the Waterlow score, both the
Waterlow (P < 0á0001) and serum albumin (P� 0á009)
were signi®cant, but not serum sodium (P� 0á55) or the
constant (P� 0á99). Using the forward Wald method only
the Waterlow score (P < 0á0001) and serum albumin
(P� 0á0063) were kept in the logistic regression equa-
tion. Adding a binary variable for hyponatraemia
(de®ned above, and again using the forward Wald
method) did not change the result, only the Waterlow
score and serum albumin remained in the logistic
regression equation.
The odds ratios for both serum albumin and the Water-
low score are given, see Table 2. The Waterlow odds ratio
is about 1á18 (rounded to 2 decimal places). A patient with
a borderline at risk Waterlow score of 10 would have about
one-®fth the risk of developing a sore than a patient with a
very high risk Waterlow score of 20. If the serum albumin
odds ratio of 0á95 (again rounded to 2 decimal places) is
Figure 1 Waterlow scores for sores vs. no sores. Boxplots show
the median, interquartile range, outliers, and extreme cases of
individual variables. In the case of Figures 1 and 2 they show
Waterlow and serum albumin for two groups, those with and
those without sores. In each case it gives a graphic demonstration
of the difference of the two groups with respect to (in these cases)
the Waterlow score and serum albumin. The interquartile range
(i.e. where half the data lie) is shown in a box, and a line across
the box indicates the median. The whiskers are lines that extend
1á5 box lengths from the upper or lower edge of the box. Values
beyond these are shown as individual cases, either outliers (up to
3 box lengths) or extreme values (more than 3 box lengths, shown
as asterisks, though no extreme values occur in these ®gures).
Figure 2 Serum albumin for sores vs. no sores.
Table 1 Frequencies of grades
Grade Frequency % Cumulative %t
No sore 663 85á8 85á81 38 4á9 90á72 37 4á8 95á53 27 3á5 99á04 7 0á9 99á95 1 0á1 100á0
Total 773 100á0
Table 2 Odds ratios for signi®cant variables
Odds ratio
Lower 95% CI
for odds ratio
Upper 95% CI
for odds ratio
Albumin 0á9465 0á9033 0á9918
Waterlow 1á1763 1á1250 1á2300
Methodological issues in nursing research Serum albumin in pressure sore prediction
Ó 2000 Blackwell Science Ltd, Journal of Advanced Nursing, 32(2), 359±365 361

used, then decreasing serum albumin by 10 would
increase pressure sore risk by about two-thirds.
The probability function returned by the logistic
regression was used to classify the patients at a variety
of thresholds (each discrete value returned by the
function was a separate threshold) as was each value
of serum albumin and each Waterlow score. Sensitivity
and speci®cities were computed for each threshold of
each assessment method. ROC curves were created (see
Figure 3) and areas under the ROC curves calculated
(see Table 4).
DISCUSSION
Despite problems with serum albumin (e.g. the long half
life of serum albumin) and in this study low numbers of
hypoalbuminaemic patients (93á7% were in the normal
range), adding serum albumin to the Waterlow score
improved the predictive ability. The area under the ROC
curve is greater for the predictive equation obtained by
logistic regression than for either serum albumin or the
Waterlow score alone (see Figure 3 and Table 3) and the
ROC curves in each case were signi®cantly different from
0á5 (see Table 4).
From Figure 3 one may see that for a sensitivity of 0á8 the
logistic prediction based on both albumin and Waterlow
has a speci®city of about 0á65, while the Waterlow alone
has a speci®city of about 0á50 (the Waterlow score that
gives this speci®city is between 11 and 12). This would
mean, in this sample, that about 430 of the 660 patients
with no sores would correctly be identi®ed by the logistic
prediction, and only 330 of those assessed by Waterlow
alone, so the increase in speci®city would enable scarce
resources to be better targeted at the patients who will go
on to develop sores. Conversely for a given speci®city of
(say) 0á5, the logistic prediction has a sensitivity of about
0á86 compared with 0á80 for the Waterlow. In this sample,
for a speci®city of 0á5 about 90 of the 113 patients would
be correctly identi®ed by Waterlow, but 97 would be
Table 3 ROC areas
Score ROC area
Albumin 0á596
Waterlow 0á729
Waterlow and albumin
(logistic regression predicted value)
0á741
Figure 3 ROC curves for Waterlow score, albumin and regression equation using Waterlow score and albumin. )�Waterlow;
� logistic prediction; � serum albumin.
D. Anthony et al.
362 Ó 2000 Blackwell Science Ltd, Journal of Advanced Nursing, 32(2), 359±365

identi®ed by the logistic prediction. So nine more patients
could be given extra support.
However, the change in the ROC curves is small, and
the signi®cance of any improvement needs to be
addressed. SPSS version 9 gives 95% con®dence limits
for ROC curves (see Table 4, and) but does not allow
direct comparisons between the curves. It may be that
although the areas under the individual curves are
signi®cantly different from 0á5 (the value returned from
a random classi®cation) little or no difference exists
among the areas under the ROC curves for (say) Water-
low and Waterlow plus serum albumin. However, in the
logistic regression analysis adding serum albumin does
give a signi®cant improvement over the Waterlow score
alone.
To use albumin in clinical practice it may be necessary
to categorize the albumin into ranges. This has been done
here for both the Waterlow score and serum albumin in
Table 5 and Table 7, and the area under the ROC curves,
respectively, in Table 6 and Table 8. It is seen that the
areas under the ROC curves remain signi®cant.
The Waterlow score has a nutrition sub-score, which
is a very crude assessment of the patient based on the
nurse's observation of the body build, with no labor-
atory or anthropometric analysis. It would be useful to
assess the relevance of this sub-score and compare it
with serum albumin in a prospective study. Data are
currently being collected in Birmingham to address this
problem.
One might create a modi®ed risk indicator based on
Waterlow and serum albumin. Recent work on the
Waterlow score components in a similar sample
(Anthony Clark & Dallender 2000) suggest only about
three of the components of the Waterlow score are
useful (continence, skin assessment and appetite, the
last of which gives further evidence of the importance of
nutrition). It is possible that a reduced set of compo-
nents of the Waterlow score added to serum albumin
may give greater predictive power than the Waterlow
score alone.
Limitations
The study is restricted to elderly in-patients and is
therefore not necessarily generalizable to other groups.
In particular, elderly residents in nursing homes may
show very different nutrition pro®les. The sub-scores of
the Waterlow score were not available from the HISS, and
Table 4 Area under the ROC
curves Asymptotic 95% con®dence interval
Area SDSD Signi®cance Lower bound Upper bound
Logistic regression
Predicted value 0á741 0á024 P < 0á001 0á694 0á787
Waterlow score 0á729 0á038 P < 0á001 0á654 0á803
Serum albumin 0á596 0á030 0á001 0á538 0á654
Table 5 Sensitivity and speci®city of Waterlow scores at ®ve
levels
Threshold Sensitivity 1 Ð Speci®city
0 1á000 0á000
10 0á920 0á315
15 0á646 0á732
20 0á195 0á939
25 0á035 0á994
Table 6 Area under the ROC curve: Waterlow ranges
Asymptotic 95% con®dence interval
Area SDSD Signi®cance Lower bound Upper bound
0á723 0á025 P < 0á001 0á673 0á772
Table 8 Area under the ROC curve: albumin ranges
Asymptotic 95% con®dence interval
Area SDSD Signi®cance Lower bound Upper bound
0.577 0á030 0á009 0á517 0á636
Table 7 Sensitivity and speci®city of albumin ranges at ®ve
levels
Threshold Sensitivity Speci®city
0 1á000 0á000
20 0á593 0á311
25 0á257 0á878
30 0á044 0á965
35 0á018 0á986
Methodological issues in nursing research Serum albumin in pressure sore prediction
Ó 2000 Blackwell Science Ltd, Journal of Advanced Nursing, 32(2), 359±365 363

therefore only an analysis of total Waterlow score was
possible.
The sample used in this study may include patients
with low serum albumin due to liver disease, diabetes
mellitus, and those on diuretics. Because of the heterogen-
eity of the sample, one should interpret these results with
caution, and further studies of more focused groups are
indicated.
Appropriate interventions and high quality nursing care
could in¯uence the incidence of pressure sores which in
turn would show the risk assessment tool to be poorly
performing with respect to sensitivity and speci®city
(Edwards 1996). To determine true sensitivity and spe-
ci®city would mean withholding preventive intervention
and allowing pressure sores to develop in vulnerable
patients, which would be ethically unacceptable (Flana-
gan 1995).
CONCLUSIONS
Serum albumin has been shown to be predictive, in
pressure sores. Adding serum albumin to the Waterlow
score may improve the predictive value of the Waterlow
score in this group (elderly in-patients). However, this has
not been proven in this study, and requires further
evaluation.
There are resource implications of adding elements to
the existing Waterlow score. However, many patients are
already assessed for serum albumin, and the cost of the
laboratory test is low (approximately £0á60 at 1999 prices).
The addition of serum albumin in assessing this group of
patients is therefore not costly.
Acknowledgements
The data were provided by the Burton NHS Trust HISS.
One of the authors (DA) is a recipient of a Smith & Nephew
Foundation fellowship for this and other analyses.
Two of the authors (TR and LR) received a proportion
of their funding from the NHS Executive; the views
expressed in this publication are those of the authors and
not necessarily those of the NHS Executive.
References
Allman R.M., Laprade C.A. & Noel L.B. (1986) Pressure sores
among hospitalised patients. Annals of Internal Medicine 105,
337±342.
Allman R.M., Goode P.S. & Patrick M.M. (1995) Pressure ulcer
risk factors among hospitalised patients with severe limita-
tion. Journal of the American Medical Association 273,
865±870.
Altman D.G. & Bland J.M. (1994a) Diagnostic tests 1: sensitivity
and speci®city. British Medical Journal 308, 1552.
Altman D.G. & Bland J.M. (1994b) Diagnostic tests 3: receiver
operating characteristic plots. British Medical Journal 309,
118.
Anthony D.M. (1999) Understanding Advanced Statistics: A
Guide for Nurses and Health Care Researchers. Churchill
Livingstone, Edinburgh.
Anthony D.M., Clark M. & Dallender J. (2000) An optimisation of
the Waterlow score using regression and arti®cial neural
networks. Clinical Rehabilitation 14, 102±109.
Berlowitz D.R. & Wilking S.V. (1989) Risk factors for
pressure sores: a comparison of cross-sectional and cohort-
derived data. Journal of the American Geriatric Society 37,
1043±1050.
Edwards M. (1996) Pressure sore risk calculators: some method-
ological issues. Journal of Clinical Nursing 5, 307±312.
Ek A.C., Unosson M., Larsson J., von Schenck H. & Bjurulf P.
(1991) The development and healing of pressure sores related to
the nutritional state. Clinical Nutrition 10, 245±250.
Flanagan M. (1995) Who is at risk of a pressure sore? Professional
Nurse 10, 305±308.
Guralnik J.M., Harris T.B., White L.R. et al. (1988) Occurence and
predictors of pressure sores in the national health service and
nutrition examination survey follow-up. Journal of the Ameri-
can Geriatric Society 36, 807±812.
Lewis B.K. (1996) Protein levels and the aetiology of pressure
sores. Journal of Wound Care 5, 479±482.
Lewis B.K. & Harding K.G. (1993) Nutritional intake and wound
healing in elderly people. Journal of Wound Care 2, 227±229.
McLaren S.M.G. (1992) Nutrition and wound healing. Journal of
Wound Care 1, 45±55.
Mulholland J.H., Co Tui Wright A.M., Vinci V. & Sha®roff B.
(1943) Protein metabolism and bed-sores. Annals of Surgery
118, 1015±1023.
Myers S.A., Takiguchi S., Slavish S. & Rose C.L. (1990) Consistent
wound care and nutritional support in treatment. Decubitus
3, 16±21.
Pinchcofsky-Devin G. (1994) Nutrition and wound healing. Jour-
nal of Wound Care 3, 231±234.
Pinchcofsky-Devin G. & Kaminski M. (1986) Correlation of
pressure sores and nutritional status. Journal of the American
Geriatric Society 34, 435±440.
Rose D. (1995) Psychophysical Methods. In Research Methods in
Psychology (Breakwell G.M., Hammond S. & Fife-Schaw C.
eds), Sage, London.
Strauss A. & Margolis D. (1996) Malnutrition in patients with
pressure ulcers: morbidity, mortality, and clinically practical
assessments. Advances in Wound Care 9, 37±40.
Swets J.A. (1979) ROC analysis applied to the evaluation of
medical imaging techniques. Investigative Radiology 14, 109±
121.
Takeda T., Koyama T., Izawa Y., Makita T. & Nakamura N. (1992)
Effects of malnutrition on development of experimental pres-
sure sores. Journal of Dermatology 19, 602±609.
Thomas D.R. (1997) The role of nutrition in prevention and
healing of pressure ulcers. Clinics in Geriatric Medicine 13,
497±511.
Thomas D.R., Goode P.S. & Allman R.A. (1995) Malnutrition and
risk of pressure ulcers. Journal of the American Geriatric
Society 43, SA77.
D. Anthony et al.
364 Ó 2000 Blackwell Science Ltd, Journal of Advanced Nursing, 32(2), 359±365
Thompson W.B., Ravdin I.S. & Frank I.L. (1938a) Effect of
hypoproteinemia on wound description. Archives of Surgery
36, 509±518.
Thompson W.B., Ravdin I.S., Rhoads J.E. & Frank I.L. (1938b) Use
of lyophile plasma and prevention of wound disruption.
Archives of Surgery 36, 590±598.
Torrance C. (1983) Pressure Sores: Aetiology, Treatment and
Prevention. Croom-Helm, London.
Zweig M.H. & Campbell G. (1993) Receiver operating character-
istic (ROC) plots: a fundamental evaluation tool in clinical
medicine. Clinical Chemistry 39, 561±577.
Methodological issues in nursing research Serum albumin in pressure sore prediction
Ó 2000 Blackwell Science Ltd, Journal of Advanced Nursing, 32(2), 359±365 365