an ices/ pho report - public health ontario · health ontario (pho) or the ontario ministry of...
TRANSCRIPT

SEVEN MORE YEARS: The impact of smoking, alcohol, diet, physical activity and stress on health and life expectancy in Ontario
An ICES/ PHO Report
APRIL 2012

SEVEN MORE YEARS: THE IMPACT OF SMOKING, ALCOHOL, DIET, PHYSICAL ACTIVITY AND STRESS ON HEALTH AND LIFE EXPECTANCY IN ONTARIO
An ICES/PHO ReportAuthors:
Douglas G. Manuel
Richard Perez
Carol Bennett
Laura Rosella
Monica Taljaard
Melody Roberts
Ruth Sanderson
Meltem Tuna
Peter Tanuseputro
Heather Manson
PUBLICATION INFORMATION
© 2012 Institute for Clinical Evaluative Sciences and Public Health Ontario
All rights reserved. No part of this publication may be reproduced, stored in a retrieval system or transmitted in any format or by any means, electronic, mechanical, photocopying, recording or otherwise, without the proper written permission of the publisher.
The opinions, results and conclusions included in this report are those of the authors and are independent from the funding sources. No endorsement by the Institute for Clinical Evaluative Sciences (ICES), Public Health Ontario (PHO) or the Ontario Ministry of Health and Long-Term Care (MOHLTC) is intended or should be inferred.
Canadian Cataloging in Publication DataSeven more years: The impact of smoking, alcohol, diet, physical activity and stress on health and life expectancy in Ontario An ICES/PHO Report.
Includes bibliographical references.
ISBN: 978-1-926850-33-7 (Print)
ISBN: 978-1-926850-34-4 (PDF)
How to Cite This PublicationManuel DG, Perez R, Bennett C, Rosella L, Taljaard M, Roberts M, Sanderson R, Meltem T, Tanuseputro P, Manson H. Seven more years: The impact of smoking, alcohol, diet, physical activity and stress on health and life expectancy in Ontario. An ICES/PHO Report. Toronto: Institute for Clinical Evaluative Sciences and Public Health Ontario; 2012.
Institute for Clinical Evaluative Sciences (ICES) G1 06, 2075 Bayview Avenue Toronto, ON M4N 3M5 Telephone: 416-480-4055 www.ices.on.ca
Public Health Ontario 480 University Avenue, Suite 300 Toronto, ON M5G 1V2 Telephone: 647-260-7100 www.oahpp.ca
Seven more years: The impact of smoking, alcohol, diet, physical activity and stress on health and life expectancy in Ontario
II
Institute for Clinical Evaluative Sciences Public Health Ontario

CONTENTSPublication Information IIAuthors’ Affiliations 2Acknowledgments 3Partnerships and Other Studies 3About ICES and PHO 4Glossary 5List of Exhibits 6
Seven more years: The impact of smoking, alcohol, diet, physical activity and stress on health and life expectancy in Ontario
Institute for Clinical Evaluative Sciences Public Health Ontario
1
Background 7
About this Report 14
A. Behavioural Health Risks 15B. Measur ement of Life Expectancy and
Health-Adjusted Life Expectancy 16C. Questions Examined 16D. Specific Objectives 16
Methods 17
Limitations and Interpretive Cautions 19
Limitation 1: Only community-dwelling adults were included 20Limitation 2: Health risks were likely under-reported 20Interpretative Caution 1: Life expectancy and health-adjusted life expectancy 20Interpretative Caution 2: Selected behavioural health risks and the combined effect of multiple risks 20
Findings 21
Predictive Risk Model 22Life Expectancy and Health-Adjusted Life Expectancy for Ontarians with Different Levels of Risk Exposure 22Population Health Impact of Behavioural Risks 22Policy Scenarios 23
Discussion 33
Adding Life to Years as Well as Years to Life 34Understanding Individual versus Population Burden of Risks 34Comparing the Impact of Socioeconomic Position and Obesity 34
Conclusion 35
References 37

AUTHORS’ AFFILIATIONS
Douglas G. Manuel, MD, FRCPC, MSc Senior Scientist, Ottawa Hospital Research Institute / Adjunct Scientist, Institute for Clinical Evaluative Sciences / Chair in Applied Public Health Sciences, CIHR/PHAC / Associate Professor, University of Ottawa and University of Toronto / Co-lead, Population Health Improvement Research Network / Associate Scientist, C.T. Lamont Primary Health Care Research Centre and Bruyère Research Institute
Richard Perez, MSc Research Analyst, ICES@uOttawa, Ottawa Hospital Research Institute
Carol Bennett, MSc Research Coordinator, ICES@uOttawa, Ottawa Hospital Research Institute
Laura Rosella, PhD Scientist, Public Health Ontario / Assistant Professor, Dalla Lana School of Public Health, University of Toronto / Adjunct Scientist, Institute for Clinical Evaluative Sciences
Monica Taljaard, PhD Scientist, Clinical Epidemiology Program, Ottawa Hospital Research Institute / Professor, Department of Epidemiology and Community Medicine, University of Ottawa
Melody Roberts, MES Manager, Health Promotion Capacity Building, Public Health Ontario / Adjunct Professor, University of Waterloo
Ruth Sanderson, MSc Manager, Analytic Services, Surveillance and Epidemiology, Public Health Ontario
Meltem Tuna, PhD Research Analyst, ICES@uOttawa, Ottawa Hospital Research Institute
Peter Tanuseputro, MD, MHSc, CCFP Public Health and Preventive Medicine Resident, Ottawa Hospital Research Institute and Public Health Ontario
Heather Manson, MD, FRCPC, MHSc Director, Health Promotion, Chronic Disease and Injury Prevention, Public Health Ontario / Assistant Professor (Status Only), Dalla Lana School of Public Health, University of Toronto / Adjunct Professor, University of Waterloo
Seven more years: The impact of smoking, alcohol, diet, physical activity and stress on health and life expectancy in Ontario
2
Institute for Clinical Evaluative Sciences Public Health Ontario

ACKNOWLEDGMENTS
Scientific Advisory Committee
Bernard Choi (Public Health Agency of Canada)
Majid Ezzati (School of Public Health, Imperial College London)
Jeff Kwong (Institute for Clinical Evaluative Sciences, Public Health Ontario)
Jürgen Rehm (Centre for Addiction and Mental Health)
Practice, Policy and Research Advisory Committee
Tiffany Barker (Health System Strategy and Policy Division, Ministry of Health and Long-Term Care)
Bernard Choi (Public Health Agency of Canada)
Erica DiRuggiero (Institute of Population and Public Health, Canadian Institutes of Health Research)
Norman Giesbrecht (Centre for Addiction and Mental Health)
Anne-Marie Holt (Epidemiology and Evaluation Services, Haliburton, Kawartha, Pine Ridge District Health Unit)
Mary L’Abbé (Department of Nutritional Sciences, Faculty of Medicine, University of Toronto)
Scott Leatherdale (School of Public Health and Health Systems, University of Waterloo)
Mary-Jo Makarchuk (Institute of Nutrition, Metabolism and Diabetes, Canadian Institutes of Health Research)
Paulina Salamo (Public Health Division, Ministry of Health and Long-Term Care)
Monir Taha (Halton Region Health Department)
Statistics Canada
David Binder
Lenka Mach
PARTNERSHIPS AND OTHER STUDIES
This report was produced through a partnership between the Institute for Clinical Evaluative Sciences (including the ICES satellite site, ICES@uOttawa) and Public Health Ontario (PHO). It is the second report in a three-part series on Ontario’s burden of disease and ill health. The first, published in 2010, reported on the burden of infectious disease, and the final report will examine the burden of mental health and addiction.
Seven more years: The impact of smoking, alcohol, diet, physical activity and stress on health and life expectancy in Ontario
Institute for Clinical Evaluative Sciences Public Health Ontario
3

ABOUT ICES
The Institute for Clinical Evaluative Sciences (ICES) is an independent, non-profit organization that produces knowledge to enhance the effectiveness of health care for Ontarians. Internationally recognized for its innovative use of population-based health information, ICES evidence supports health policy development and guides changes to the organization and delivery of health care services.
Key to our work is our ability to link population based health information, at the patient level, in a way that ensures the privacy and confidentiality of personal health information. Linked databases reflecting 13 million of 33 million Canadians allow us to follow patient populations through diagnosis and treatment and to evaluate outcomes.
ICES brings together the best and the brightest talent across Ontario. Many of our scientists are not only internationally recognized leaders in their fields but are also practicing clinicians who understand the grassroots of health care delivery, making the knowledge produced at ICES clinically focused and useful in changing practice. Other team members have statistical training, epidemiological backgrounds, project management or communications expertise. The variety of skill sets and educational backgrounds ensures a multi-disciplinary approach to issues and creates a real-world mosaic of perspectives that is vital to shaping Ontario’s future health care system.
ICES receives core funding from the Ontario Ministry of Health and Long-Term Care. In addition, our faculty and staff compete for peer-reviewed grants from federal funding agencies, such as the Canadian Institutes of Health Research, and receive project-specific funds from provincial and national organizations. These combined sources enable ICES to have a large number of projects underway, covering a broad range of topics. The knowledge that arises from these efforts is always produced independent of our funding bodies, which is critical to our success as Ontario’s objective, credible source of evidence guiding health care.
ABOUT PHO
Public Health Ontario (PHO) is a Crown corporation dedicated to protecting and promoting the health of all Ontarians and reducing inequities in health. As a hub organization, PHO links public health practitioners, front-line health workers and researchers to the best scientific intelligence and knowledge from around the world.
Our mission is to support health care providers, the public health system and partner ministries in making informed decisions and taking informed action. PHO provides transparent and timely expert scientific advice, technical support and practical tools related to infection prevention and control; surveillance and epidemiology; health promotion, chronic disease and injury prevention; environmental and occupational health; health emergency preparedness; public health laboratory services; research; professional development; and knowledge services.
ABOUT THE OTTAWA HOSPITAL RESEARCH INSTITUTE
The Ottawa Hospital Research Institute (OHRI) is the research arm of The Ottawa Hospital and is an affiliated institute of the University of Ottawa, closely associated with the University’s Faculties of Medicine and Health Sciences. The OHRI includes more than 1,500 scientists, clinical investigators, graduate students, postdoctoral fellows and staff conducting research to improve the understanding, prevention, diagnosis and treatment of human disease.
Seven more years: The impact of smoking, alcohol, diet, physical activity and stress on health and life expectancy in Ontario
4
Institute for Clinical Evaluative Sciences Public Health Ontario

GLOSSARY
Body mass index (BMI) A weight-to-height ratio used as an indicator of obesity and underweight. BMI is calculated by dividing an individual’s body weight in kilograms by the square of height in metres (kg/m2). In this report, we define obesity as BMI ≥ 30 and normal weight as BMI of 18.5 to 25.
Burden The impact or size of a health problem in an area, measured by cost, mortality, morbidity or other indicators.1 This report examines the burden of unhealthy behaviour by calculating differences in life expectancy and health-adjusted life expectancy in Ontario based on individuals’ exposure to five behavioural risks for poor health.
Compression of morbidity A reduction in the proportion of life spent in ill health. Compression of morbidity can occur regardless of the age distribution of a population. For example, even in populations with an increasing proportion of older people (as in Ontario), compression of morbidity will result if health-related quality of life improves more rapidly than life expectancy.
Health behaviour Actions people do that may affect their health, positively or negatively. Health behaviours are among the determinants of health and are influenced by the social, cultural and physical environments in which people live and work.2 They are also shaped by individual choices and external constraints.2 This report examines five health behaviours—smoking, alcohol consumption, diet, physical activity and stress.
Health-adjusted life expectancy Health-adjusted life expectancy combines life expectancy with a measure of health-related quality of life to estimate the number of years people can be expected to live in good health.
Health-related quality of life A concept that includes a person’s level of functioning, activities of daily living and ability to participate in society. To measure health-related quality of life for this study, we used the Health Utilities Index, which combines a number of attributes to summarize health status as a single score. Additional measures of health-related quality of life are described in the Appendix.
Health Utilities Index (HUI) Developed by McMaster University’s Centre for Health Economics and Policy Analysis, the HUI is a summary measure of an individual’s health comprising six attributes: sensation (vision, hearing and speech), mobility, dexterity, emotion, cognition and pain. Each attribute has a number of levels. The six attributes are then combined into a single score which falls somewhere between -0.36 (state worse than death) and 1 (perfect health).
Life expectancy Life expectancy is a calculation of how long a person or population would be expected to live, on average, given unchanging risk of death from a specific point in time. This report estimates life expectancy for Ontarians in 2007.
Socioeconomic position People in poorer socioeconomic circumstances generally have poorer health. Deprivation measures identify those who experience material or social disadvantage compared to others in their community.3 In this report, we used the Deprivation Index for Health in Canada developed by the Institut national de santé publique du Québec (INSPQ).4 The index includes education, employment and income as measures of material deprivation; and single-parent families, living alone, or being divorced, widowed or separated as measures of social deprivation. The deprivation index was used to assign geographical areas into socioeconomic position groups (low, middle and high) based on material and social quintiles. High-deprivation neighbourhoods were those in the top two quintiles for both social and material deprivation. Low-deprivation neighbourhoods were those in the bottom two quintiles. Additional measures of socioeconomic position, including income and education, are examined in the Appendix.
Seven more years: The impact of smoking, alcohol, diet, physical activity and stress on health and life expectancy in Ontario
Institute for Clinical Evaluative Sciences Public Health Ontario
5

LIST OF EXHIBITS
Exhibit 1 Life expectancy for Canadian provinces (highest, lowest, British Columbia, Ontario), 1986–2006
Exhibit 2 Prevalence of selected risk factors (smoking, unhealthy alcohol consumption, poor diet, physical inactivity and high stress) among adults aged 20 and older in British Columbia and Ontario, 2001–2009
Exhibit 3 Definitions of behavioural health risks
Exhibit 4 Spectrum of risk factors leading to disease outcomes
Exhibit 5 Gain or loss in life expectancy for Ontarians aged 20 and older with healthy versus high level of unhealthy exposure for selected behaviours, relative to average Ontario life expectancy, 2007
Exhibit 6 Effect of behavioural risk exposure on predicted deaths in Ontario, 2007
Exhibit 7 Impact of eliminating five behavioural risks on life expectancy and health-adjusted life expectancy for Ontarians aged 20 and older, 2007
Exhibit 8 Differences in life expectancy by socioeconomic position (SEP) and body mass index (BMI) and reductions in these gaps after eliminating five behavioural risks in Ontario, 2007
Exhibit 9 If Ontarians aged 20 and older were each to improve their worst behavioural risk, which would they tackle?
Exhibit 10 Life expectancy gains with two policy scenarios: Ontarians aged 20 and older (1) optimizing their worst behavioural risk and (2) meeting British Columbia’s targets for smoking, diet and physical activity
Exhibit 11 Change required in order for Ontario to meet British Columbia’s healthy living targets
Seven more years: The impact of smoking, alcohol, diet, physical activity and stress on health and life expectancy in Ontario
6
Institute for Clinical Evaluative Sciences Public Health Ontario

BackgroundThe 2009 report, What Does It Take
to Make a Healthy Province?,5 raised
concern that Ontario was lagging
behind Canada’s healthiest provinces.
Since the mid-1990s, British Columbia has been the healthiest province with the highest life expectancy (Exhibit 1) and, compared to Ontario, the smallest proportion of residents who smoke, have poor fruit and vegetable consumption or are physically inactive (Exhibit 2). Despite improvements in the rates of some unhealthy behaviours in the past decade, Ontario continues to lag behind British Columbia in healthy living.
Seven more years: The impact of smoking, alcohol, diet, physical activity and stress on health and life expectancy in Ontario Background
7
Institute for Clinical Evaluative Sciences Public Health Ontario

Exhibit 1 Life expectancy for Canadian provinces (highest, lowest, British Columbia, Ontario), 1986–2006
British ColumbiaHighest province
Life expectancyat birth (years)
Year
70
75
80
85
20062001199619911986
Ontario Lowest province
Key messages
• BritishColumbiahashadthehighestlifeexpectancyinCanadasincetheearly1990s.
• ThisreportexaminesthebehaviouralrisksthatmightaccountforthegapinlifeexpectancybetweenOntarioandBritishColumbia.
8
Seven more years: The impact of smoking, alcohol, diet, physical activity and stress on health and life expectancy in Ontario Background
Institute for Clinical Evaluative Sciences Public Health Ontario

Exhibit 2aPrevalence of selected risk factors (smoking, unhealthy alcohol consumption, poor diet, physical inactivity and high stress) among adults aged 20 and older in British Columbia and Ontario, 2001–2009
200920072005200320010
10
20
30
40
50
60
70
Percent of population
British Columbia Ontario
CURRENT SMOKING (HEAVY AND LIGHT SMOKERS)
Key messages
• Despiteimprovementsinsomehealthbehavioursovertime,OntariocontinuestolagbehindBritishColumbiainkeyfactorsforhealthyliving.
• PoordietandphysicalinactivityaccountforthemostnotablegapsinhealthbehaviourbetweenOntarioandBritishColumbia.
Data source: Canadian Community Health Survey
Seven more years: The impact of smoking, alcohol, diet, physical activity and stress on health and life expectancy in Ontario Background
9
Institute for Clinical Evaluative Sciences Public Health Ontario

Exhibit 2bPrevalence of selected risk factors (smoking, unhealthy alcohol consumption, poor diet, physical inactivity and high stress) among adults aged 20 and older in British Columbia and Ontario, 2001–2009
0
10
20
30
40
50
60
70
20092007200520032001
Percent of population
British Columbia Ontario
BINGE DRINKING*
*Data missing for British Columbia, 2009Data source: Canadian Community Health Survey
10
Seven more years: The impact of smoking, alcohol, diet, physical activity and stress on health and life expectancy in Ontario Background
Institute for Clinical Evaluative Sciences Public Health Ontario

Exhibit 2cPrevalence of selected risk factors (smoking, unhealthy alcohol consumption, poor diet, physical inactivity and high stress) among adults aged 20 and older in British Columbia and Ontario, 2001–2009
Percent of population
British Columbia Ontario
0
10
20
30
40
50
60
70
20092007200520032001
POOR DIET (POOR AND VERY POOR DIET)
Data source: Canadian Community Health Survey
Seven more years: The impact of smoking, alcohol, diet, physical activity and stress on health and life expectancy in Ontario Background
11
Institute for Clinical Evaluative Sciences Public Health Ontario

Exhibit 2dPrevalence of selected risk factors (smoking, unhealthy alcohol consumption, poor diet, physical inactivity and high stress) among adults aged 20 and older in British Columbia and Ontario, 2001–2009
0
10
20
30
40
50
60
70
20092007200520032001
Percent of population
British Columbia Ontario
PHYSICAL INACTIVITY
Data source: Canadian Community Health Survey
12
Seven more years: The impact of smoking, alcohol, diet, physical activity and stress on health and life expectancy in Ontario Background
Institute for Clinical Evaluative Sciences Public Health Ontario

Exhibit 2ePrevalence of selected risk factors (smoking, unhealthy alcohol consumption, poor diet, physical inactivity and high stress) among adults aged 20 and older in British Columbia and Ontario, 2001–2009
0
10
20
30
40
50
60
70
20092007200520032001
Percent of population
British Columbia Ontario
HIGH STRESS
Data source: Canadian Community Health Survey
Seven more years: The impact of smoking, alcohol, diet, physical activity and stress on health and life expectancy in Ontario Background
13
Institute for Clinical Evaluative Sciences Public Health Ontario

About this reportThis report expands our understanding of the
benefits of healthy living by quantifying the impact
of behavioural risks on Ontarians’ life expectancy
and health-related quality of life. Key terms are
defined in the Glossary. More details on study
methods and results are found in the Appendix.
14
Seven more years: The impact of smoking, alcohol, diet, physical activity and stress on health and life expectancy in Ontario About this report
Institute for Clinical Evaluative Sciences Public Health Ontario

A. BEHAVIOURAL HEALTH RISKS
Five behavioural health risks are examined: smoking, unhealthy alcohol consumption, poor diet, physical inactivity and high stress. These risks are defined briefly in Exhibit 3 and in more detail in the Appendix.
The focus on behavioural risks—rather than intermediate risks such as obesity, or proximal risks such as blood pressure and cholesterol (Exhibit 4)—draws attention to these preventable causes of poor health in Ontario. We also chose to focus on behavioural risks to make it possible to calculate their contributions to overall health. If we had included a greater range of risks, we would undoubtedly have found a larger collective burden on the health of Ontarians, but it would have been difficult to untangle the contribution of each individual risk.
Exhibit 3 Definitions of behavioural health risks*
BEHAVIOUR CATEGORY DEFINITION
Smoking Heavy smoker Daily current smoker (≥1 pack/day)
Light smoker Daily current smoker (<1 pack/day)
Former smoker Former daily smoker
Non-smoker Former occasional smoker or never smoker
Alcohol Binge drinker Bingeing**: >24 (men) or >17 (women) drinks/week in previous month
Heavy drinker 10 to 24 (men) or 6 to 17 (women) drinks/week
Moderate drinker 5 to 9 (men) or 3 to 5 (women) drinks/week
Light drinker 0 to 4 (men) or 0 to 2 (women) drinks/week
Occasional drinker <1 drink/month
Current non-drinker No alcohol consumption in the last 12 months
Physical activity
Inactive 0 to <1.5 METs/day
Moderately active 1.5 to <3 METs/day
Active ≥3 METs/day
Diet Very poor diet Index score ≤1
Poor diet Index score of 2 to 3
Fair diet Index score of 4
Adequate diet Index score of 5
Stress High stress Self-perceived stress: ‘quite a bit’ or ‘extremely’
Low stress Self-perceived stress: ‘not at all’, ‘not very’ or ‘a bit’
* Highest risk levels are in boldface and lowest risk levels (reference group) are in italics.** Bingeing was defined as ≥5 drinks/day (men) or ≥4 drinks/day (women) on any day in the previous week or weekly bingeing behaviour
in the previous month.
MET = metabolic equivalent of task; a measure of calories burned by type, duration and frequency of physical activity.
Index score = the healthiness of diet based on consumption of fruit and vegetables. Index points are awarded for the average number of daily servings of fruits/vegetables consumed (1 point for 0 to <1 servings; 2 points for 1 to <2, 3 points for 2 to <3, 4 points for 3 to <4 and 5 points for 4 or more servings). The following factors can also cause loss of 1 index point each (up to 3 points) : >1 serving of potato, >1 serving of fruit juice or no weekly servings of carrots.
Seven more years: The impact of smoking, alcohol, diet, physical activity and stress on health and life expectancy in Ontario About this report
15
Institute for Clinical Evaluative Sciences Public Health Ontario

B. MEASUREMENT OF LIFE EXPECTANCY AND HEALTH-ADJUSTED LIFE EXPECTANCY
The main measures in the report are life expectancy and health-adjusted life expectancy.
Life expectancy is a calculation of how long a person or population would be expected to live, on average, given unchanging risk of death from a specific point in time. This report estimates life expectancy for Ontarians in 2007.
Health-adjusted life expectancy combines life expectancy with a measure of health-related quality of life—a concept that includes a person’s level of functioning, activities of daily living and ability to participate in society. To measure health-related quality of life, we used the Health Utilities Index (HUI), which combines a number of attributes to summarize health status as a single score.6
Reporting on these broad measures of health—as opposed to illness from specific diseases—focuses discussion on the collective or net effect of behavioural risks. The five unhealthy behaviours examined are well-established risks for more than 50 diseases.7-9 However, the relationship between behaviour and health is complex. Not all unhealthy behaviour carries the same risk for everyone, and healthy behaviour is not universally beneficial. Moderate alcohol intake (1 to 2 drinks per day) has a net health benefit, with a 15% reduced risk of death from all causes, but is also associated with an increased risk of breast and other cancer.10-12
C. QUESTIONS EXAMINED
The report examines two questions:
1/ What is the health of Ontarians who have various kinds of healthy versus unhealthy living?To answer this question, we examined how life expectancy and health-adjusted life expectancy vary by people’s level of exposure to the behavioural risks. For example, we calculated the life expectancy of Ontarians who smoke and compared their length of life to Ontarians who have never smoked. Ontarians who have never smoked may have more favourable health behaviour in other areas as well, such as physical activity and eating, and so we interpret the life expectancy estimates as the collective influence of all health risks of smokers or non-smokers, including risks not examined in this report.
2/ How much would Ontarians’ health improve if we collectively reduced our behavioural risks?The second question addresses the role of each behavioural risk on the health of Ontarians. The report estimates how life expectancy and health-adjusted life expectancy would increase in Ontario if no one was exposed to each behavioural risk. We also assess the collective impact of all risks combined.
D. SPECIFIC OBJECTIVES
1. To describe the overall trend in the proportion of Ontarians with one or more of five behavioural health risks: smoking, unhealthy alcohol consumption, poor diet, physical inactivity and high stress; and to compare Ontario to the healthiest province (British Columbia).
2. To calculate the contribution of these five behavioural health risks on Ontarians’ life expectancy and health-adjusted life expectancy in 2007, including Ontarians ranked by:
i. Neighbourhood (socioeconomic position);
ii. Weight (body mass index [BMI]).
3. To calculate the health gains that would be achieved in Ontario through different preventive scenarios, including:
i. Incremental improvements in the health behaviour of all Ontarians;
ii. Achieving British Columbia’s improvement targets for health behaviour.
16
Seven more years: The impact of smoking, alcohol, diet, physical activity and stress on health and life expectancy in Ontario About this report
Institute for Clinical Evaluative Sciences Public Health Ontario

MethodsThe study base was all community-dwelling
Ontarians aged 20 and older.
Seven more years: The impact of smoking, alcohol, diet, physical activity and stress on health and life expectancy in Ontario Methods
17
Institute for Clinical Evaluative Sciences Public Health Ontario

Our methodology included two main components:
1. We examined the relationship between the behavioural risks and mortality using the Ontario sample of three population health surveys—the Canadian Community Health Survey (CCHS) cycles 1.1, 2.1 and 3.1, conducted biannually by Statistics Canada between 2001 and 2005. These data were individually linked to death records from 2001 to 2010. As well, the survey data were used to examine the relationship between the behavioural risks and health-related quality of life. The output of this component was a multivariable model that was used to predict the risk of death based on exposure to unhealthy behaviours, and to assess the contribution of each behavioural risk and combinations of risks toward the risk of death.
2. We applied the risk model to the most current CCHS survey (2007) to estimate the one-year probability of death for each respondent. Using a period life table approach, we used the probability of death to estimate life expectancy and health-adjusted life expectancy for respondents based on their exposure to each of the five behavioural risks and to selected socioeconomic and personal factors, including age, sex, ethnicity, education and neighbourhood characteristics that reflect material and social infrastructure. A second calculation assessed the contribution of behavioural risks to risk of death, by estimating the probability of death for each respondent after recoding their risk exposure variable as “no exposure.” For example, we first estimated the risk of death for current smokers, and then re-estimated their risk of death assuming they had never smoked. The difference between the two calculations creates an estimate of the contribution of smoking to the risk of death.
The impact on health-related quality of life was calculated by comparing Health Utilities Index scores of people with a behavioural risk to the scores from the remaining Ontario population. The burden associated with a health risk was the difference in health-related quality of life between these two groups.
More details on study methods are available in the Appendix.
18
Seven more years: The impact of smoking, alcohol, diet, physical activity and stress on health and life expectancy in Ontario Methods
Institute for Clinical Evaluative Sciences Public Health Ontario

Limitations and interpretive cautionsIn general, the study approach will
underestimate the actual burden attributable
to the five behavioural risks in Ontario. We
note two main limitations to this study and
two cautions in interpreting the findings.
The Appendix provides further details of the
limitations and interpretative cautions and
how they affect the study findings.
Seven more years: The impact of smoking, alcohol, diet, physical activity and stress on health and life expectancy in Ontario Limitations and interpretive cautions
19
Institute for Clinical Evaluative Sciences Public Health Ontario

LIMITATION 1:
Only community-dwelling adults were includedOne of the most important study limitations is the omission of people living in long-term care (LTC) settings. Of the approximately 80,000 deaths each year in Ontario, 12% occur among people living in LTC institutions. Had the report included LTC residents, deaths attributable to the five risks would have increased by approximately 12%.
The study also excluded people younger than 20 years of age. This did not likely have a large impact on overall burden estimates because few young people die, and most report excellent health-related quality of life. However, alcohol burden for younger ages is a notable omission. Alcohol use is an important attribution of injury, suicide and other social burdens that occur disproportionately among young people. Each death in this age group represents a proportionally greater loss in life expectancy or health-adjusted life expectancy compared to people whose burden from alcohol begins at older ages.
LIMITATION 2: Health risks were likely under-reported The study used self-reported exposure to health risks, which generally results in an underestimation of risk burden. Survey respondents tend to over-report what they perceive as healthy behaviour and under-report unhealthy behaviour. For example, in Ontario the sum of self-reported alcohol consumption is about half the volume of alcohol
sold.10 Reporting accuracy affects all risks in this study. Burden estimates are mostly affected when people report that they are in the healthiest category (e.g., non-smoker or moderate drinker), when they are actually in an unhealthy category.
Similarly, respondents were asked brief questions about risks that may not capture the full spectrum of behaviour. For example, the study’s measure of physical activity considered only leisure-time physical activity; not included were active transportation (such as walking and bicycling to work), activity at work, or sedentary time (time spent sitting). Our measure of diet was based on fruit and vegetable consumption, without specifically ascertaining the intake of sodium, trans fats, calories or other aspects of healthy and unhealthy eating.
INTERPRETATIVE CAUTION 1:
Life expectancy and health-adjusted life expectancyThe study estimated life expectancy and health-adjusted life expectancy because these measures provide an intuitive perspective on Ontarians’ health. However, the results should not be interpreted as representing how long people can be expected to live as of 2007, given their different levels of healthy living. Rather, the life expectancy and health-adjusted life expectancy findings summarize the health experience of Ontarians living in 2007 based on their current healthy or unhealthy behaviours, the associated mortality risks and their self-reported health-related quality of life. For example, the life expectancy for physically active people was based
on observed deaths from 2001 to 2010 for Ontarians who were physically active in the year prior to their participation in one of the surveys. This calculated risk of death was then applied to a hypothetical person who was assumed to be physically active from the age of 20 onward.
INTERPRETATIVE CAUTION 2:
Selected behavioural health risks and the combined effect of multiple risks The study examined five behavioural risks. Additional behavioural risks that were not examined include sexual health risks, drug misuse and unintentional injuries from risk behaviour (e.g., unsafe driving). Also missing from our estimates was the burden attributable to second-hand exposure to health risks, such as deaths of passengers in motor vehicle collisions where the driver was drinking.
The estimate of deaths attributable to a behavioural risk is subtracted from total deaths to calculate how many fewer deaths would occur if Ontarians were never exposed to the risk. Because these behaviours rarely occur in isolation (i.e., someone who smokes may also have a low level of physical activity and/or a poor diet), the deaths from the individual behavioural causes should not be combined, except when reported as combined estimates.
20
Seven more years: The impact of smoking, alcohol, diet, physical activity and stress on health and life expectancy in Ontario Limitations and interpretive cautions
Institute for Clinical Evaluative Sciences Public Health Ontario

Findings
Seven more years: The impact of smoking, alcohol, diet, physical activity and stress on health and life expectancy in Ontario Findings
21
Institute for Clinical Evaluative Sciences Public Health Ontario

PREDICTIVE RISK MODEL
The risk of death from the five behavioural risk factors was calculated using responses from 78,597 people surveyed between 2001 and 2005 and followed until 2010. In total, there were 568,997 person-years of follow up and 6,399 deaths. The health behaviour and mortality risk model showed excellent discrimination and accuracy/calibration. Mortality in the highest-risk decile was approximately 253 times higher for men and 335 times higher for women than the lowest-risk decile (c-statistic: 0.87 for both models). Estimates of predictive and observed deaths were compared with good agreement overall (6,399 predictive versus 6,399 observed deaths) and across subgroups, including several not examined during algorithm development (e.g., subgroups by income, BMI or health region). The Appendix provides details of the development and validation of the predictive model.
LIFE EXPECTANCY AND HEALTH-ADJUSTED LIFE EXPECTANCY FOR ONTARIANS WITH DIFFERENT LEVELS OF RISK EXPOSURE
Exhibit 5 shows the life expectancy in 2007 for Ontarians with the unhealthiest risk exposure compared to those with healthy behaviour. Heavy smokers had a life expectancy approximately 11.5 years lower than non-smokers (71.1 versus 82.9 years for men; 75.0 versus 86.2 years for women). People with exposure to all five risks had a life expectancy more than 20 years lower than people with no health risks (68.5 versus 88.6 years for men; 71.5 versus 92.5 years for women). (See also Exhibit A-10 in the Appendix.)
We also predicted mortality, life expectancy, health-adjusted life expectancy and health-related quality of life for Ontarians at different levels of risk exposure. For all risks except alcohol, we found gradients in each of these measures—people with the highest risk exposure had the poorest health. (See Exhibit A-11 in the Appendix.)
POPULATION HEALTH IMPACT OF BEHAVIOURAL RISKS
The population health impact of each behavioural risk is a combination of the number of people exposed to a risk and the individual increase in mortality associated with that risk. These two components can result in some unexpected findings. For example, heavy smokers had a much greater increased risk of death than people who were physically inactive (2.8 versus 1.4 times higher for men; 2.9 versus 1.5 times higher for women). (See Exhibit A-14 in the Appendix.) However, many more Ontarians were inactive than were heavy smokers in 2007 (49.3% versus 8.4% for men; 56.6% versus 3.8% for women). (See Exhibit A-14 in the Appendix.) As a result, physical inactivity had a high impact on Ontarians’ health overall. The combined impact of all behavioural risks accounted for 59.9% of deaths in 2007 (Exhibit 6).
Exhibit 7 shows the population health impact of eliminating behavioural risks. Smoking, physical inactivity and inadequate diet had the greatest impact on life expectancy (2.5, 2.4 and 2.0 years, respectively). For each behavioural risk, reducing the unhealthy behaviour would add years to life (life expectancy) and even more life to years (health-adjusted life expectancy). Combined, the five risk factors represent a loss of 7.5 years of life expectancy and 9.8 years of health-adjusted life expectancy. (See also Exhibit A-15 in the Appendix.)
22
Seven more years: The impact of smoking, alcohol, diet, physical activity and stress on health and life expectancy in Ontario Findings
Institute for Clinical Evaluative Sciences Public Health Ontario

Life expectancy differs by socioeconomic position in Ontario—with an approximately 4.5-year gap between the least-deprived and most-deprived neighbourhoods. Exhibit 8 illustrates this equity gap and the contribution of behavioural risk exposure. The gap would be reduced by almost 50% (two years) if behavioural risks were the same across neighbourhoods. Of the five risks examined, smoking was the biggest contributor to the equity gap in both life expectancy and health-adjusted life expectancy. (See Exhibits A-16 and A-17 in the Appendix.)
A smaller difference (about one year) in life expectancy exists for BMI. The effect of risk factor exposure on the gap in life expectancy across BMI levels is also shown in Exhibit 8. Behavioural risks account for 68% of the life expectancy gap between obese Ontarians and people of normal weight. Eliminating all five risks would reduce this gap to 0.3 years. The gap in health-adjusted life expectancy would also be reduced to 0.3 years.
POLICY SCENARIOS
Two policy scenarios were examined. In the first scenario we asked, if Ontarians were to individually improve their highest risk behaviour, where would they focus their efforts and what collective health impact would result?
We ranked the five health behaviours by risk of death (Exhibit 9, Step 1). Smoking is by far the most hazardous health behaviour and, for the 22% of Ontarians who smoke, would be the most important behaviour to improve (Exhibit 9, Step 2). For most people, however, physical inactivity is their biggest health challenge; 37% need to become more active. Poor diet would have to be corrected by 29%. Twice as many women need to increase their exercise as need to tackle smoking (43.2% versus 18.4%). (See Exhibit A-18 in the Appendix.)
Nearly all Ontarians reported at least one of the five unhealthy behaviours. Only 1.4% had none. If each person optimized his or her single most important unhealthy behaviour (for example, if people who were physically inactive became active), life expectancy in Ontario would increase by 3.7 years (Exhibit 10).
In the second scenario we asked, what the potential impact would be for Ontarians if we were to achieve British Columbia’s targets for improved health behaviour? (We used British Columbia’s targets because Ontario does not have well-defined targets for the five health behaviours.) BC, Canada’s healthiest jurisdiction, has set the following targets: nine out of 10 residents will not smoke, seven out of 10 will eat at least five fruits and vegetables each day, and seven out of 10 will be physically active.
Collectively, by reaching these goals, Ontarians would gain 3.0 years of life expectancy (Exhibit 10). Ontarians are closer to achieving the target for smoking than for either physical activity or diet, where they lag considerably behind (Exhibit 11). For Ontario to achieve all three of the targets, 77% of us would need to change at least one behaviour.
Seven more years: The impact of smoking, alcohol, diet, physical activity and stress on health and life expectancy in Ontario Findings
23
Institute for Clinical Evaluative Sciences Public Health Ontario
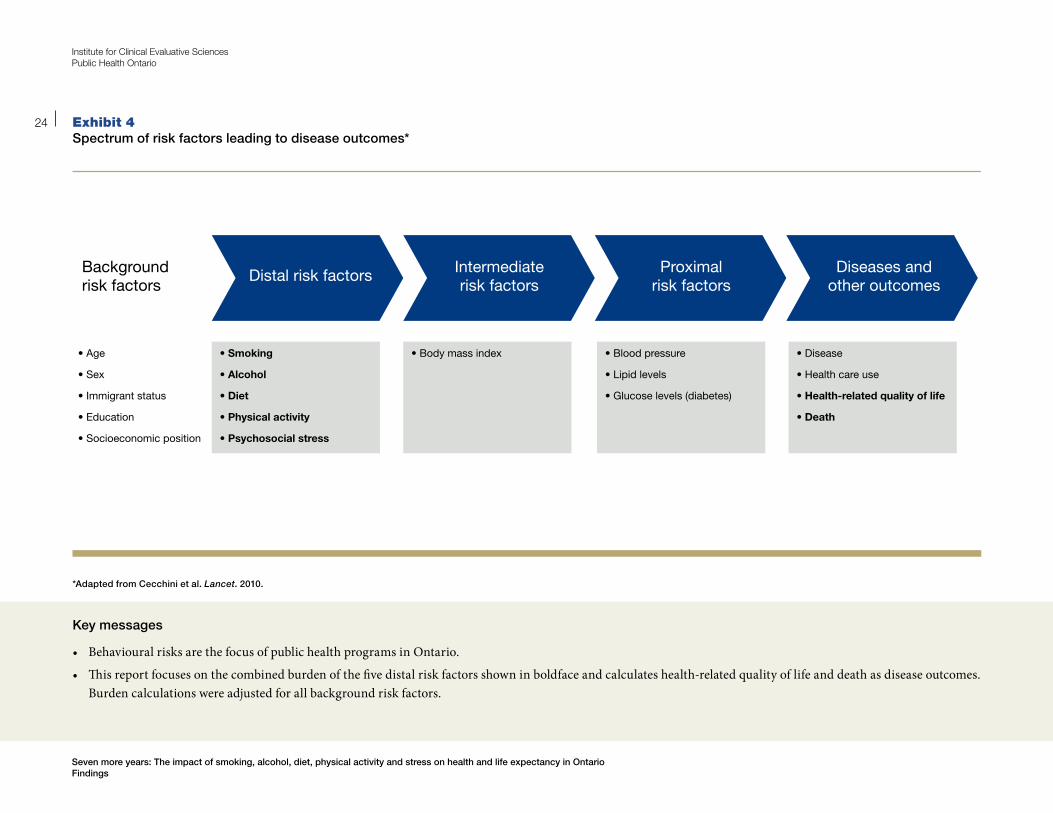
Exhibit 4Spectrum of risk factors leading to disease outcomes*
Distal risk factorsBackground risk factors
Intermediate risk factors
Proximal risk factors
Diseases and other outcomes
• Age
• Sex
• Immigrant status
• Education
• Socioeconomic position
• Smoking
• Alcohol
• Diet
• Physical activity
• Psychosocial stress
• Blood pressure
• Lipid levels
• Glucose levels (diabetes)
• Disease
• Health care use
• Health-related quality of life
• Death
• Body mass index
*Adapted from Cecchini et al. Lancet. 2010.
24
Seven more years: The impact of smoking, alcohol, diet, physical activity and stress on health and life expectancy in Ontario Findings
Institute for Clinical Evaluative Sciences Public Health Ontario
Key messages
• BehaviouralrisksarethefocusofpublichealthprogramsinOntario.
• Thisreportfocusesonthecombinedburdenofthefivedistalriskfactorsshowninboldfaceandcalculateshealth-relatedqualityoflifeanddeathasdiseaseoutcomes.Burden calculations were adjusted for all background risk factors.
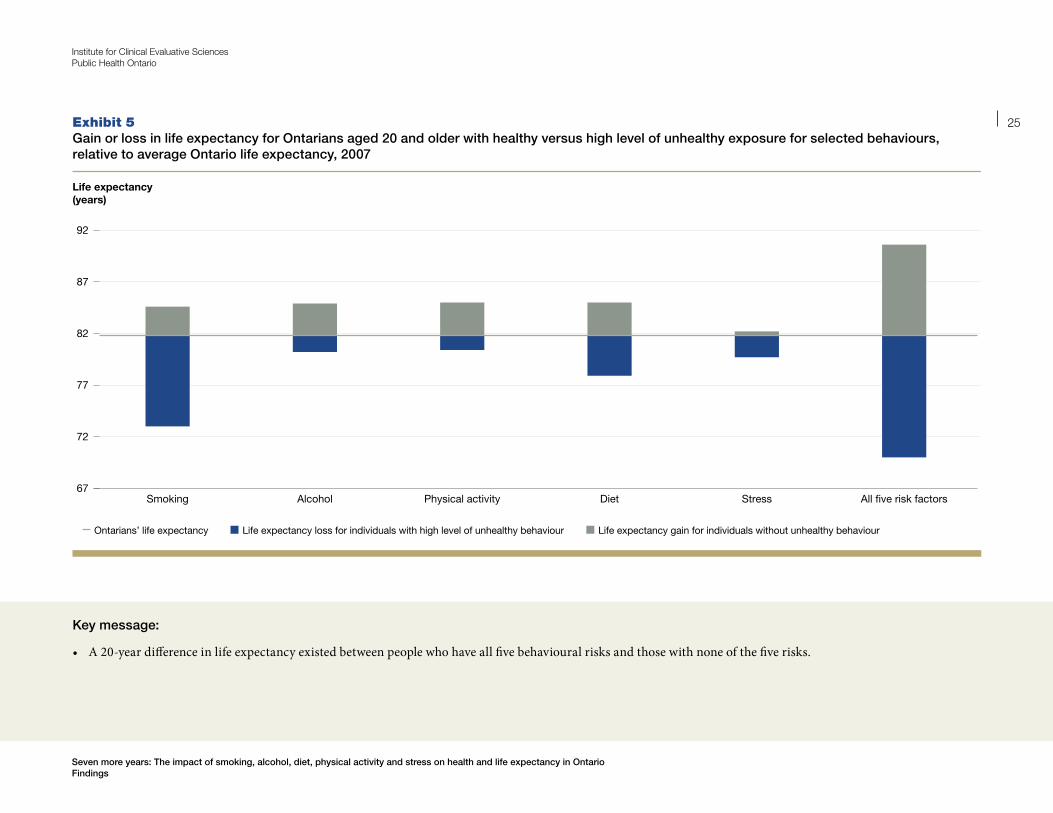
Exhibit 5Gain or loss in life expectancy for Ontarians aged 20 and older with healthy versus high level of unhealthy exposure for selected behaviours, relative to average Ontario life expectancy, 2007
Life expectancy gain for individuals without unhealthy behaviour
Life expectancy (years)
All �ve risk factorsStressDietPhysical activityAlcoholSmoking
Life expectancy loss for individuals with high level of unhealthy behaviourOntarians’ life expectancy
67
72
77
82
87
92
Key message:
• A20-yeardifferenceinlifeexpectancyexistedbetweenpeoplewhohaveallfivebehaviouralrisksandthosewithnoneofthefiverisks.
Seven more years: The impact of smoking, alcohol, diet, physical activity and stress on health and life expectancy in Ontario Findings
25
Institute for Clinical Evaluative Sciences Public Health Ontario

Exhibit 6 Effect of behavioural risk exposure on predicted deaths in Ontario, 2007
BEHAVIOURAL RISK INCREASED RISK OF DEATH* PERCENT REDUCTION IN DEATHS IF RISK FACTOR WERE ELIMINATED (Total Deaths)
Men Women Men (37,500)
Women (30,700)
Overall (68,200)
Smoking 1.9 2.0 26.1 21.4 23.7
Unhealthy alcohol consumption 1.2 1.2 12.3 13.3 12.8
Physical inactivity 1.3 1.4 19.3 26.6 23.0
Inadequate diet 1.3 1.3 21.3 18.7 20.0
High stress 1.3 1.2 3.1 2.3 2.7
All risk factors 59.7 60.0 59.9
*Weighted hazard—average across risk exposure categories relative to the healthiest (reference) category (see Exhibit 3).
26
Seven more years: The impact of smoking, alcohol, diet, physical activity and stress on health and life expectancy in Ontario Findings
Institute for Clinical Evaluative Sciences Public Health Ontario
Key messages
• Thecombinedimpactofallfivebehaviouralrisksaccountedfor60%ofdeathsinOntarioin2007.
• Smoking,physicalinactivityandinadequatedietwerethethreeleadingbehaviouralcausesofdeathinOntario.

Exhibit 7 Impact of eliminating five behavioural risks on life expectancy and health-adjusted life expectancy for Ontarians aged 20 and older, 2007
Health-adjusted life expectancy gainLife expectancy gain
Years
0
2
4
6
8
10
12
All �ve risk factorsStressDietPhysical activityAlcoholSmoking
*Considers all risk exposure categories compared to healthiest (reference) category (Exhibit 3)
Key messages
• Smoking,physicalinactivityandinadequatedieteachaccountedforabouttwoyearsoflifeexpectancylost.
• Combined,thefiveriskfactorsreducedlifeexpectancyby7.5years.
• Reducingoreliminatingbehaviouralrisksresultedinevengreatergainsinhealth-adjustedlifeexpectancy(upto9.8years)—addinglifetoyearsaswellasyearstolife.
Seven more years: The impact of smoking, alcohol, diet, physical activity and stress on health and life expectancy in Ontario Findings
27
Institute for Clinical Evaluative Sciences Public Health Ontario

Exhibit 8Differences in life expectancy by socioeconomic position (SEP) and body mass index (BMI) and reductions in these gaps after eliminating five behavioural risks in Ontario, 2007
Life expectancy (years)
High SEP overall
High SEP with low behavioural risks
Low SEP with low behavioural risks
Low SEP overall
Normal BMI overall
Obese overall
Normal BMI with low behavioural risks
Obese with low behavioural risks
Life expectancy gain for individuals without unhealthy behaviourLife expectancy loss for individuals with high level of unhealthy behaviourOntarians’ life expectancy
67
72
77
82
87
92
Key messages
• Healthbehaviourrisksaccountedforabouthalfoftheequitygap—thedifferenceinlifeexpectancyforpeoplewithhighversuslowsocioeconomicposition.
• Therewaslittledifferenceinlifeexpectancybetweenindividualswhowereobeseandthosewithanormalbodymassindex.Healthbehaviourrisksaccountedformore than 60% of that difference.
28
Seven more years: The impact of smoking, alcohol, diet, physical activity and stress on health and life expectancy in Ontario Findings
Institute for Clinical Evaluative Sciences Public Health Ontario

Exhibit 9If Ontarians aged 20 and older were each to improve their worst behavioural risk, which would they tackle?
1.3
1.8
2.3
2.8Heavy smoker
Light smoker
Very poor dietInactiveBinge drinker, poor dietHeavy drinker, light drinker, high stress, fair dietModerately active
Risk of death*
Start at the top of the list and work your way down. If you are not a heavy smoker, continue moving down the list to find your highest risk behaviour.
STEP 1: FIND YOUR MOST IMPORTANT RISK. (See Exhibit 3 for risk definitions.)
*Risk of death relative to lowest risk level
Life Expectancy CalculatorIndividuals can calculate their own life expectancy with a new Life Expectancy Calculator (http://www.rrasp-phirn.ca/risktools) based on smoking, alcohol, food, exercise and stress level. This tool is also accessible from the ICES and PHO websites.
Seven more years: The impact of smoking, alcohol, diet, physical activity and stress on health and life expectancy in Ontario Findings
29
Institute for Clinical Evaluative Sciences Public Health Ontario

Exhibit 9 (CONTINUED)If Ontarians aged 20 and older were each to improve their worst behavioural risk, which would they tackle?
STEP 2: HOW MANY ONTARIANS SHARE YOUR MOST IMPORTANT RISK?
Percent of population
No behavioural risksStressAlcoholSmokingDietPhysical activity0
20
40
60
80
100
30
Seven more years: The impact of smoking, alcohol, diet, physical activity and stress on health and life expectancy in Ontario Findings
Institute for Clinical Evaluative Sciences Public Health Ontario
Key messages
• PhysicalinactivityisthemostimportantbehaviouralriskinOntario,followedbyinadequatedietandcurrentsmoking.
• VeryfewOntarianshavehealthybehaviourforallfiveriskfactors.

Exhibit 10Life expectancy gains with two policy scenarios: Ontarians aged 20 and older (1) optimizing their worst behavioural risk and (2) meeting British Columbia’s (BC’s) targets for smoking, diet and physical activity
Years
Meet all 3 BC targetsMeet BC activity targetMeet BC diet targetMeet BC smoking targetOptimize highest risk0.0
1.0
2.0
3.0
4.0
Key messages
• IfeachOntarianoptimizedhisorhermostimportantunhealthybehaviour,lifeexpectancyinOntariowouldincreaseby3.7years.
• IfOntarioweretoachieveallthreeofBC’shealthylivingtargets,lifeexpectancywouldincreasebythreeyears.
Seven more years: The impact of smoking, alcohol, diet, physical activity and stress on health and life expectancy in Ontario Findings
31
Institute for Clinical Evaluative Sciences Public Health Ontario

Exhibit 11 Change required in order for Ontario to meet British Columbia’s (BC’s) healthy living targets
Percent of population
Physically activeAdequate dietNot smoking0
20
40
60
80
100
Current Ontario population meeting target BC target
Key messages
• OntariolagsconsiderablybehindtheBritishColumbia(BC)targetssetforphysicalactivityanddiet.
• Collectively,77%ofOntarianswouldneedtochangeatleastoneriskbehaviourforOntariotomeetallthreeofBC’stargets.
32
Seven more years: The impact of smoking, alcohol, diet, physical activity and stress on health and life expectancy in Ontario Findings
Institute for Clinical Evaluative Sciences Public Health Ontario

DiscussionThis study suggests that remarkable gains in life
expectancy and health-adjusted life expectancy could
be achieved in Ontario through healthier living. Overall,
Ontarians would gain 7.5 years of life expectancy if
everyone were in the healthiest category for all five
behavioural risks examined. Smoking, physical inactivity
and poor diet each contribute 2.0 to 2.5 years of lost
life expectancy. If everyone modified only their most
important health risk, life expectancy would increase by
up to 3.7 years.
Seven more years: The impact of smoking, alcohol, diet, physical activity and stress on health and life expectancy in Ontario Discussion
33
Institute for Clinical Evaluative Sciences Public Health Ontario

ADDING LIFE TO YEARS AS WELL AS YEARS TO LIFE
The potential gains in health-adjusted life expectancy (9.8 years) are even larger. This means that improving health behaviours would result in adding life to years as well as years to life.13 People with healthy behaviours have consistently better health-related quality of life compared to people with poor health behaviours.
If behavioural risks were reduced, Ontario could see a compression of morbidity, meaning people would spend fewer years in a state of poor health needing assistance for daily living. In turn, these improvements could be expected to reduce demands on both the formal health care system (doctors, hospitals, nursing homes, etc.) and informal family caregiving. That said, this study did not explicitly assess the impact of behavioural risks on health care needs.
UNDERSTANDING INDIVIDUAL VERSUS POPULATION BURDEN OF RISKS
Examining individual and population burdens provided different perspectives on the impact of behavioural risks. These differences explain what may seem like contradictory findings. For example, why is the gain in Ontario’s overall life expectancy from improved health behaviour 7.5 years, even though we found a 20-year difference in life expectancy between the healthiest and unhealthiest individuals?
The reason is related to the number of people with the unhealthy behaviour. Individuals with a very hazardous behaviour, such as current smoking, have a high risk that affects their health and reduces their life expectancy. Furthermore, smoking will have an important population health impact unless it becomes very uncommon. However, a less hazardous risk, such as physical inactivity or poor diet, can have an equally important population health burden if the behaviour is common. We found that physical inactivity resulted in a smaller reduction in individual life expectancy (4.6 years) compared to smoking (11.5 years). But we also found lack of exercise was the leading risk for 43% of women, more than twice the proportion of women who smoked. As a consequence, the population health burdens from smoking and from physical inactivity were about the same.
COMPARING THE IMPACT OF SOCIOECONOMIC POSITION AND OBESITY
This study reconfirms findings from previous studies demonstrating large differences in life expectancy and health-adjusted life expectancy across different socioeconomic groups.14 Furthermore, this study shows that life expectancy varied considerably across neighbourhoods—an effect observed after adjusting for individual or family income, education and health behaviours. At the same time, we found that half the differences in life expectancy and health-adjusted life expectancy across socioeconomic position could be attributed to higher levels of risk behaviour among people in low socioeconomic position. This
suggests that reducing behavioural health risks in low socioeconomic groups could play a large role in reducing health inequities.
The impact of BMI on life expectancy and health-adjusted life expectancy was much smaller than socioeconomic position, accounting for just one year of reduced life expectancy. Life expectancy differences for people with different BMI levels were also smaller than the differences associated with smoking (11.5 years), diet (7.2 years), and physical activity (4.6 years).
We purposely focused this study on behavioural risks and so did not estimate the potential gains in Ontarians’ health if obesity were reduced. Inactivity and excess calories are the main contributors to rising weights and, as expected, we found that physical inactivity and poor diet were the main behavioural risks contributing to reduced life expectancy for Ontarians who are obese.
That said, our findings on BMI seem to be in opposition to predictions that the rise of obesity will reverse recent gains in life expectancy.15 However, they are consistent with other studies demonstrating that, except for morbid obesity (BMI>35), the mortality risk of obesity is modest.16,17 Most recently, a study from the Manitoba Centre for Health Policy examined risk for a wide range of health and health care outcomes (hospitalization, physician services, disease outcomes and death) and found the same unchanging risks associated with BMI, with notable differences occurring only when people were morbidly obese.18
34
Seven more years: The impact of smoking, alcohol, diet, physical activity and stress on health and life expectancy in Ontario Discussion
Institute for Clinical Evaluative Sciences Public Health Ontario

ConclusionHOW CAN ONTARIO BECOME THE HEALTHIEST PROVINCE IN CANADA?
Ontario will see major improvements in health through
improvements in healthy living. This province has been
a leader in the development and implementation of
comprehensive tobacco control, and now has among
the lowest rates of smoking worldwide, although it still
lags behind British Columbia.
Seven more years: The impact of smoking, alcohol, diet, physical activity and stress on health and life expectancy in Ontario Conclusion
35
Institute for Clinical Evaluative Sciences Public Health Ontario

Compared to Ontarians, people in British Columbia have more favourable health behaviours for all of the five risks examined in this study, particularly in being physically active and having healthy diets. In large measure, this is why British Columbia has had the leading life expectancy in Canada for almost 20 years. To achieve leading status, Ontario needs to build on its successes in smoking reduction and focus similar attention on increasing physical activity and healthy eating.
Previous reports have examined how British Columbia and other leading jurisdictions have achieved healthier populations. Contributions include a clear vision, sustained attention and a high level of government funding directed at improving population health; healthy living goals with specific targets; a whole-of-government approach; and earlier adoption of healthy public policy.5,19 Compared to Ontario, British Columbia has a strong level of commitment to all of these attributes, including establishing the measureable healthy living goals we used in this study.
Momentum for further action is building in Ontario, where 86% of members of the provincial legislature endorse a goal of supporting and promoting better health in Ontario.20 Ontario’s Chief Medical Officer of Health has called for a new initiative geared towards promoting good health and preventing chronic disease and injury.21 Work on this initiative is underway, including the development of a blueprint for chronic disease prevention by Cancer Care Ontario and Public Health Ontario.19 The blueprint will recommend coordinated strategies to improve Ontarians’ health behaviour in four of the five areas studied in this report: smoking, alcohol, healthy eating and physical activity. Most recently, the Commission on the Reform of Ontario’s Public Services recommended that Ontario adopt British Columbia’s healthy living initiative: “Recommendation 5-82: Replicate British Columbia’s Act Now initiative, which has been identified by the World Health Organization (WHO) as a best practice for health promotion and chronic disease prevention, in Ontario.”22 Our findings in this report could serve as benchmarks to inform future initiatives toward making Ontario Canada’s healthiest province.
36
Seven more years: The impact of smoking, alcohol, diet, physical activity and stress on health and life expectancy in Ontario Conclusion
Institute for Clinical Evaluative Sciences Public Health Ontario

References
Seven more years: The impact of smoking, alcohol, diet, physical activity and stress on health and life expectancy in Ontario Conclusion
37
Institute for Clinical Evaluative Sciences Public Health Ontario

1. Public Health Agency of Canada. Population Health Impact of Disease in Canada (PHI): Glossary. Accessed February 22, 2012 at http://www.phac-aspc.gc.ca/phi-isp/glossary-eng.php.
2. Healthy People, Healthy Places. Ottawa, ON: Statistics Canada; 2010.
3. Reducing Gaps in Health: A Focus on Socio-Economic Status in Urban Canada. Ottawa, ON: Canadian Institute for Health Information; 2008. Accessed February 22, 2012 at http://secure.cihi.ca/cihiweb/products/Reducing_Gaps_in_Health_Report_EN_081009.pdf.
4. Pampalon R, Raymond G. A deprivation index for health and welfare planning in Quebec. Chronic Dis Can. 2000; 21(3):104–13.
5. Manuel DG, Creatore MI, Rosella LC, Henry DA. What Does It Take To Make a Healthy Province? A Benchmark Study of Jurisdictions in Canada and Around the World with the Highest Levels of Health and the Best Health Behaviours. Toronto, ON: Institute for Clinical Evaluative Sciences; 2009. Accessed February 22, 2012 at http://www.ices.on.ca/file/Healthy%20province%20November%20release.pdf.
6. Feeny D, Furlong W, Boyle M, Torrance GW. Multi-attribute health status classification systems. Health Utilities Index. Pharmacoeconomics. 1995; 7(6):490–502.
7. Smoke-Free Ontario Scientific Advisory Committee. Evidence to Guide Action: Comprehensive Tobacco Control in Ontario. Toronto, ON: Ontario Agency for Health Protection and Promotion; 2010. Accessed February 22, 2012 at http://www.oahpp.ca/services/evidence-to-guide-action-ctc-in-ontario.html.
8. Wiseman M. The second World Cancer Research Fund/American Institute for Cancer expert report. Food, nutrition, physical activity, and the prevention of cancer: a global perspective. Proc Nutr Soc. 2008; 67(3):253–6.
9. World Cancer Research Fund/American Institute for Cancer Research. Food, Nutrition, Physical Activity, and the Prevention of Cancer: A Global Perspective. Second Expert Report. Accessed February 22, 2012 at http://www.dietandcancerreport.org/expert_report/index.php.
10. Rehm J, Patra J, Popova S. Alcohol-attributable mortality and potential years of life lost in Canada 2001: implications for prevention and policy. Addiction. 2006; 101(3):373–84.
11. Di Castelnuovo A, Costanzo S, Bagnardi V, Donati MB, Iacoviello L, de Gaetano G. Alcohol dosing and total mortality in men and women: an updated meta-analysis of 34 prospective studies. Arch Intern Med. 2006; 166(22):2437–45.
12. Rehm J, Baliunas D, Borges GL, et al. The relation between different dimensions of alcohol consumption and burden of disease: an overview. Addiction. 2010; 105(5): 817–43.
13. Manuel DG, Schultz SE. Adding Life to Years and Years to Life: Life and Health Expectancy in Ontario. Toronto, ON: Institute for Clinical Evaluative Sciences; 2001. Accessed February 22, 2012 at http://www.ices.on.ca/file/Atlas%20-%20Adding%20years%20to%20life%20and%20life%20to%20years.pdf.
14. Wilkins R, Berthelot JM, Ng E. Trends in mortality by neighbourhood income in urban Canada from 1971 to 1996. Health Rep. 2002; 13(Suppl.):45–71. Accessed February 22, 2012 at http://www.statcan.gc.ca/pub/82-003-s/2002001/pdf/4195132-eng.pdf.
15. Olshansky SJ, Passaro DJ, Hershow RC, et al. A potential decline in life expectancy in the United States in the 21st century. N Eng J Med. 2005; 352(11):1138–45.
16. McGee DL, Diverse Populations Collaboration. Body mass index and mortality: a meta-analysis based on person-level data from twenty-six observational studies. Ann Epidemiol. 2005; 15(2):87–97.
17. Lenz M, Richter T, Mühlhauser I. The morbidity and mortality associated with overweight and obesity in adulthood: a systematic review. Dtsch Arztebl Int. 2009; 106(40):641–8.
18. Fransoo R, Martens P, Prior H, et al. Adult Obesity in Manitoba: Prevalence, Associations, and Outcomes. Winnipeg, MB: Manitoba Centre for Health Policy; 2011. Accessed February 22, 2012 at http://mchp-appserv.cpe.umanitoba.ca/deliverablesList.html.
38
Seven more years: The impact of smoking, alcohol, diet, physical activity and stress on health and life expectancy in Ontario References
Institute for Clinical Evaluative Sciences Public Health Ontario

19. Cancer Care Ontario, Ontario Agency for Health Protection and Promotion (Public Health Ontario). Taking action to prevent chronic disease: recommendations for a healthier Ontario. Toronto: Queen’s Printer for Ontario; 2012. Available at http://www.oahpp.ca/resources/documents/5870%20CCO%20EXEC%20SUM%20ENG%20MAR%2015_12.pdf.
20. Heart and Stroke Foundation of Ontario. Heart and Stroke Foundation of Ontario’s Healthy Candidates Campaign. Accessed February 28, 2012 at http://www.healthycandidates.ca.
21. Health, Not Health Care – Changing the Conversation. 2010 Annual Report of the Chief Medical Officer of Health of Ontario to the Legislative Assembly of Ontario. Toronto, ON: Queen’s Printer; 2011. Accessed February 22, 2012 at http://www.health.gov.on.ca/en/public/publications/ministry_reports/cmoh_10/cmoh_10.pdf.
22. Commission on the Reform of Ontario’s Public Services. Public Services for Ontarians: A Path to Sustainability and Excellence. Toronto, ON: Queen’s Printer for Ontario; 2012. Accessed February 22, 2012 at http://www.fin.gov.on.ca/en/reformcommission/chapters/report.pdf.
Seven more years: The impact of smoking, alcohol, diet, physical activity and stress on health and life expectancy in Ontario References
39
Institute for Clinical Evaluative Sciences Public Health Ontario
