an examination of pennsylvania state police … examination of pennsylvania state police coverage of...
TRANSCRIPT
An Examination ofPennsylvania State Police Coverage
of Municipalities

This project was sponsored by a grant from the Center for Rural Pennsylvania, a legislative agency of the Pennsylvania General Assembly.
The Center for Rural Pennsylvania is a bipartisan, bicameral legislative agency that serves as a resource for rural policy within the Pennsylvania General Assembly. It was created in 1987 under Act 16, the Ru-ral Revitalization Act, to promote and sustain the vitality of Pennsylvania’s rural and small communities.
Information contained in this report does not necessarily reflect the views of individual board members or the Center for Rural Pennsylvania. For more information, contact the Center for Rural Pennsylvania, 625 Forster St., Room 902, Harrisburg, PA 17120, telephone (717) 787-9555, email: [email protected], www.rural.palegislature.us.
An Examination of Pennsylvania State Police Coverageof Municipalities
By:Gary Zajac, Ph.D. and Lindsay Kowalski, M.A.
Pennsylvania State University
October 2012
Executive Summary
Table of ContentsIntroduction .........................5 Goals and Objectives .........6Methodology .......................6 Results ...............................8Conclusions ......................13 Policy Considerations .......13References .......................16
This study explored issues sur-rounding the provision of police services by the Pennsylvania State Police (PSP) to Pennsylvania municipalities that either have no police department or have only a part-time police department. The study focused on a 5-year period from 2006 to 2010.
Specifically, it examined the number of municipalities receiving patrol services and their rural/ur-ban breakdown; the levels of patrol service provided; and the specific types of incidents to which PSP responded in these municipalities. The study, which was conducted in 2011, also explored the amount, type, and distribution of revenue the commonwealth received from PSP patrol services in municipalities.
The research used data maintained by PSP regarding the municipalities it patrolled over the study period, and data collected by the Admin-istrative Office of Pennsylvania Courts (AOPC).
This study found that PSP pro-vided full- or part-time coverage to 67 percent of the commonwealth’s 2,562 municipalities. This coverage was heavily focused towards rural municipalities, with 92 percent of rural municipalities being patrolled by PSP and 22 percent of urban mu-nicipalities being patrolled by PSP.
In the majority of cases (75 percent) where PSP provided patrol coverage to a municipality, the coverage was full-time. PSP covered, on a full- or part-time basis, an average of about 3.4 million Pennsylvanians per year during the study period.
Looking at specific types of incidents to which PSP responded in these municipalities, the research found the profile to be consistent with routine municipal patrol activi-ties. The top 10 incidents, in both rural and urban municipalities, to which PSP responded included requests for assistance, collisions, burglaries, thefts, assaults, criminal mischief, and other, such as 911 hang-up and disturbance incidents.PSP appears to be fulfilling a fairly traditional municipal policing role in municipalities where it has patrol responsibility.
Looking at workload levels that municipal patrol responsibility places on PSP, this study found that 72 percent of all PSP incident responses (calls for service) oc-curred in municipalities where PSP has some official (full- or part-time) level of patrol responsibility.
Rural municipalities that rely on PSP for full-time coverage account-ed for the largest proportion of PSP incident responses (46 percent). However, urban municipalities that have their own local police depart-ments accounted for the second highest proportion of incidents (23 percent) to which PSP responded.
Municipalities do not provide any direct compensation to the com-monwealth in exchange for PSP pa-trol or other services. Fines written by troopers patrolling municipalities can be seen as an indirect source of reimbursement, although it should be noted that this money is coming
from offenders themselves, not from municipalities. During the study period, PSP wrote more than $136 million in vehicle-code citations, 70 percent of which were written in municipalities where PSP has some official patrol responsibility. Half of this traffic fine revenue was returned to the municipalities where PSP wrote the fine. An additional $14.7 million was written in non-traffic fines, with 85 percent being written in municipalities where PSP has official patrol responsibility. All of this fine revenue remained with the commonwealth. It should be noted that this study, conducted in 2011, was completed before the enactment of Act 124 in July 2012. Act 124 amended Title 42 Section 3571(b) to provide that fines and forfeitures for vehicle offenses prosecuted as a result of PSP action shall only be distributed to municipalities that have a population of no more than 3,000 or provide at least 40 hours per week of local police service through a municipal police depart-ment, regional police department or contract for police services with another municipality or regional department. Revenues not payable to municipalities under this provi-sion are to be transferred to PSP for cadet classes.
In terms of policy, the researchers provide a review of the options that have been under consideration by the Pennsylvania General Assembly and offer alternatives to the no-charge provision of PSP services to municipalities. The researchers note that additional options may include greater reliance on regional police arrangements and the creation of county-based police forces.
An Examination of Pennsylvania State Police Coverage of Municipalities 5
In all states in the New England and Middle Atlantic regions, state police agencies provide law enforcement services, without cost, to municipalities that do not have their own full-time police departments (Coate and Schwester, 2009). For the remainder of the U.S., county sheriffs are vested with full and traditional police pow-ers and provide police coverage to municipalities that do not have their own departments, with the state police being primarily dedicated to highway patrol duties (Coate and Schwester, 2009). In Pennsylvania, sher-iffs have limited police powers and primarily serve as officers of the court, with key duties including serving warrants and transporting prisoners.
In addition to patrolling interstate highways, the Pennsylvania State Police (PSP) is mandated to provide law enforcement coverage to Pennsylvania municipali-ties that do not have their own police departments, as well as assist municipalities that have their own full-time force with traffic supervision, violent crime sup-pression, some case investigations, and other services as requested (2011-2012 Governor’s Executive Budget, 2011). At the present time, municipalities do not pro-vide any direct reimbursement to the commonwealth for patrol and other services provided by PSP.
Since it was first created in 1905, PSP has developed programs and has been mandated by law to carry out a wide variety of responsibilities, in addition to patrolling municipalities that lack their own forces, as follows:• State Fire Marshal duties transferred to department
(1919);• First statewide radio telegraph system (1923);• First driver’s license examination facility (1924);• Crime laboratory and photographic section estab-
lished (1932);• School bus inspection and inspection station supervi-
sion (1939);• Enforcement of cigarette tax and fuel use tax (1947);• New State Police Academy in Hershey (1960);• Use of radar for speed enforcement (1961);• Aviation Division established with acquisition of two
Bell 47G helicopters (1969);• Aviation Division expanded with acquisition of six
Bell Jet Rangers (1970);• Computerized master name index of criminal record
files completed (1981);• Pennsylvania Crime Watch established (1982);• Special Emergency Response Team (SERT) estab-
lished (1986); and• Liquor law enforcement responsibilities transferred to
department (1987).
Today, 90 PSP stations are located across the com-monwealth and are organized into 16 troops, including Troop T, which is dedicated exclusively to patrolling the Pennsylvania Turnpike (PSP, 2011).
Given its coverage mandate, PSP has the potential to serve the entire commonwealth in some capacity, whether that means a particular municipality relies on PSP for full-time or part-time coverage, or a municipal-ity is calling on PSP for intermittent or ad hoc services or assistance1. To some extent, municipalities determine the extent and level of PSP coverage. When municipali-ties, such as Bratton Township in Mifflin County and Penn Township in Lancaster County, decided to abolish or reduce full-time local police coverage (respectively), PSP was responsible for filling the gaps in service. When other municipalities, like Warrior Run Borough in Luzerne County and Hanover Township in Washing-ton County, changed to full- and part-time local police coverage, respectively, PSP’s responsibility for patrol-ling those municipalities was eliminated or reduced. When a municipality decides to alter its coverage level, it notifies PSP and/or the local 911 service providers of the change and PSP automatically assumes responsibil-ity for service and police protection (that is, no other agreement or formal arrangement is required). Despite minor changes in coverage level, PSP assumes respon-sibility for a considerable proportion of policing within the state while receiving no direct reimbursement.
In addition to direct policing services, PSP provides oversight of the Municipal Police Officers Education and Training Commission (MPOETC), which sets training standards and coordinates mandatory in-ser-vice training required of all municipal police officers in the state. The PSP commissioner serves as chair of the MPOETC. Municipal police forces were traditionally reimbursed through a state appropriation for the cost of sending their officers to required training (i.e., salary, tuition, and expenses), however those monies were cut in some of the more recent state budgets.
On a related point, cuts in the state appropriation to PSP in the 2010-2011 fiscal year budget led to cutbacks in training for PSP itself. In 2010, a budget cut delayed the start of training for the 131st PSP cadet class to
Introduction
1. There are no part-time PSP troopers. In this report, part-time PSP cover-age refers to reduced coverage in municipalities that field a part-time local police department and, therefore, rely on full-time PSP troopers to provide law enforcement services when local police officers are not working, typically for late-evening calls. The report also occasionally distinguishes “official” (i.e., part- or full-time) PSP coverage to reinforce that some mu-nicipalities receive PSP coverage despite fielding their own full-time police departments.
6 The Center for Rural Pennsylvania
conserve costs associated with the training and salary for trainees (Brozana, 2010).
Financial challenges, such as those facing local and state law enforcement in Pennsylvania, are part of a larger national fiscal picture. Localities from Hunting-don Beach, CA, to Egg Harbor Township, NJ, are also laying off officers, reducing patrol levels, or eliminating specialized units (Luhby, 2010). Indeed, the National League of Cities reported that 22 percent of local of-ficials nationwide were making cuts to public safety in response to budget crises (McFarland, 2010).
Goals and ObjectivesThis project, which was conducted in 2011, examined
the extent and type of PSP service provision to Penn-sylvania municipalities, including attendant costs and related issues, using data from a 5-year study period, defined as January 2006 through December 2010 (as data permitted).
The study had two primary goals. The first was to measure PSP service provision to municipalities over the study period to: determine the number of mu-nicipalities to which PSP provides service; examine the specific types of services that PSP provides to municipalities; examine the level of service that PSP provides to municipalities and the proportion of service in relation to the overall PSP policing workload; and determine the rural/urban breakdown of municipalities receiving PSP services2.
The second goal was to examine the amount and types of revenues received by the commonwealth from fines generated by PSP patrols in municipalities and how these fines have been divided between municipali-ties and the commonwealth.
Finally, the researchers developed public policy con-siderations.
MethodologyThe principal source of data for this research was
PSP’s Bureau of Research and Development, which manages data on the number, type, location, and date of PSP responses and services in municipalities, including rural/urban breakdown3, as well as force distribution and municipal coverage statistics.
PSP provided a detailed database containing coverage level by municipality, for 2006-2010, along with a file containing the history of coverage level updates dur-ing 2007-2011. PSP’s Bureau of Research and Devel-opment also provided database files containing PSP incident totals by year, county, municipality, township and municipal code, troop, and station. It also provided more detailed analyses of the types of incidents for a stratified random sample of 30 municipalities. This data included the number of incidents by description/report-ing code for each municipality for each of the study years.
A separate file outlined PSP incident classification codes. The researchers also received data for Troop T’s (turnpike) total incidents per year for 2006-2010. PSP’s Bureau of Forensic Services provided the number of cases submitted to that department for each study year. The researchers also received a chart of PSP’s total monthly sworn complement for the study period.
While the researchers requested workload data on the level of service (PSP agency burden) PSP provided to municipalities over the study period and in what pro-portion this was provided, PSP could not provide it as it does not maintain data at this level. With the exception of a few very large municipalities that do not have their own police departments, PSP troopers are not gener-ally dedicated to a single municipal patrol assignment, or even to a single highway patrol assignment. Trooper assignments may even cut across rural/urban boundar-ies. The one exception to this is troopers assigned to Troop T, which patrols the turnpike. These troopers are dedicated to Troop T and do not undertake non-turnpike related assignments. Troop T activities were not includ-ed in the analysis, since they do not include municipal patrols.
All other troopers, however, are assigned patrol zones, which may cover several municipalities, and their assignments may include patrolling municipali-ties, patrolling highways, responding to assistance requests from other agencies or municipalities (includ-ing those that have their own police departments), and undertaking other routine duties, such as paperwork. A great deal of this time is categorized as “unobligated,” whereby the trooper is not responding to a specific incident, but instead conducting a routine, self-directed
2. The research used the Center for Rural Pennsylvania’s definition of rural/urban, which is based on population density. In 2011, the Center identified 1,652 Pennsylvania municipalities as rural and 910 as urban. Although PSP also maintains municipal-level data according to rural/urban status, these analyses relied on the rural/urban status data supplied by the Center.3. As noted, although PSP identified a municipality as rural or urban, these records were updated according to the Center for Rural Pennsylvania’s definition.
An Examination of Pennsylvania State Police Coverage of Municipalities 7
patrol. Troopers have considerable latitude in how they organize patrols within their assigned patrol zone. Accordingly, data on time spent on a specific duty, such as patrolling a specific municipality, were not available from PSP.
As a proxy, detailed data on the number of incidents per municipal-ity that PSP troopers responded to during the 2006-2010 study period were available and analyzed for all municipalities. This includes, as separate records, municipalities where PSP has no official patrol re-sponsibilities (that is, municipalities that have their own police depart-ments), excluding incident data for Troop T, which were provided as annual totals. Thus, the researchers were able to calculate the proportion of overall PSP incident response calls that occurred in municipalities for which PSP provided some level of official coverage (either full- or part-time coverage). Given the limi-tations on available trooper work-load data, these figures provided the best possible estimate of the overall PSP workload and service burden accounted for by municipalities that do not provide their own full-time police coverage.
To address the specific types of services that PSP provided to mu-nicipalities during the study period, the researchers used a stratified random sample of 30 municipalities from which to draw a representa-tive picture of the specific types of incidents to which PSP responded during the study period. Stratifica-tion was done on both rural/urban status and PSP coverage level, which were the two most relevant variables to this study. Based on their proportions within the state, the random sample consisted of: 20 rural municipalities with full-time PSP coverage; six rural municipali-
ties with part-time PSP coverage; two urban municipalities with full-time PSP coverage; and two urban municipalities with part-time PSP coverage. The sample size was de-termined according to the time PSP had available to draw down the de-tailed incident data for the sample. This random sampling strategy provided a representative picture of overall incident types throughout the municipalities for which PSP is responsible for providing cover-age, thus yielding insight into what it is that PSP is doing as part of its coverage of these municipalities. (Note: The investigation of incident type was the only analysis that relied on this sampling method; all other analyses included all avail-able data.)
Regarding fine revenue data, the researchers used data from the Administrative Office of the Penn-sylvania Courts (AOPC). AOPC manages data related to traffic and non-traffic citations filed by PSP troopers. The database contained data on fines at the municipal level, thus permitting analysis of how much fine revenue was generated within each municipality during the study period. Other data fields in the AOPC dataset included the specific title, section, and subsection of the criminal or vehicle code under which the fine was written; total fine amount; date of fine; and the specific troop to which the trooper originating the fine was assigned. It should be noted that this dataset did not include identifying informa-tion about the individuals who were fined.
Two former police executives served as consultants to this project. Joseph Blackburn, a retired lieuten-ant colonel with the Pennsylvania State Police had previously over-seen PSP’s Bureau of Research and
Development, among other duties. Chief Ron Smeal, a retired munici-pal police executive, had served as chief of the Northern York Regional Police Department and the Penn-ridge Regional Police Department. Lt. Col. Blackburn and Chief Smeal provided valuable insight into the context of policing in Pennsylvania, complementing the administrative data collected for this study.
The two primary limitations to this study concern data availability. First, there was no comprehensive trooper workload data available from PSP, measured, for example, in person hours spent on a given trooper assignment. Therefore, inci-dent counts were used as a proxy.
Second, some of the vehicle-fine data attributed to municipalities with interstate or other limited access highways running through them may have resulted from cita-tions written by troopers as part of regular interstate highway patrol duties not associated with municipal patrol activities (although, as noted, Troop T’s turnpike incident data was separated). The specific loca-tion field (street address or highway mile marker) for fines in the AOPC dataset was not consistently popu-lated. Thus, fines written on high-ways could not be reliably isolated from those written within municipal communities and the fine totals for some municipalities may be artifi-cially inflated. Where the specific location field was not populated, it was impossible to determine where the fine was written. Where this field was populated, a simple query could not select for highway locations as there was no consistent or standardized format in which the location was entered. Thus, the researcher did not analyze the data.
8 The Center for Rural Pennsylvania
ResultsNumber and Type of Municipalities
Given that municipalities can establish, expand, reduce, or disband their local police forces at will, the number of municipalities served by PSP on a full- or part-time basis at any given point in time varies. Throughout the 5-year study period, 90 municipalities changed their cov-erage type (full-time local police, part-time PSP, or full-time/primary PSP) at least once, 12 municipali-ties altered their coverage at least twice, and two municipalities changed their coverage type three times4.
Throughout the study period (2006-2010), on average, PSP pro-vided full- or part-time coverage to 67 percent of all municipalities in Pennsylvania, or 1,719 municipalities out of Pennsylva-nia’s 2,562 municipalities.
Looking at the rural/urban breakdown, PSP provided coverage to 92 percent (1,521) of Pennsylvania’s 1,652 rural municipalities, and 22 percent (198) of Pennsyl-vania’s 910 urban municipalities, on average, across the study period. Therefore, PSP provided basic patrol services to nearly one quarter of urban municipali-ties and the majority of rural municipalities during the study period.
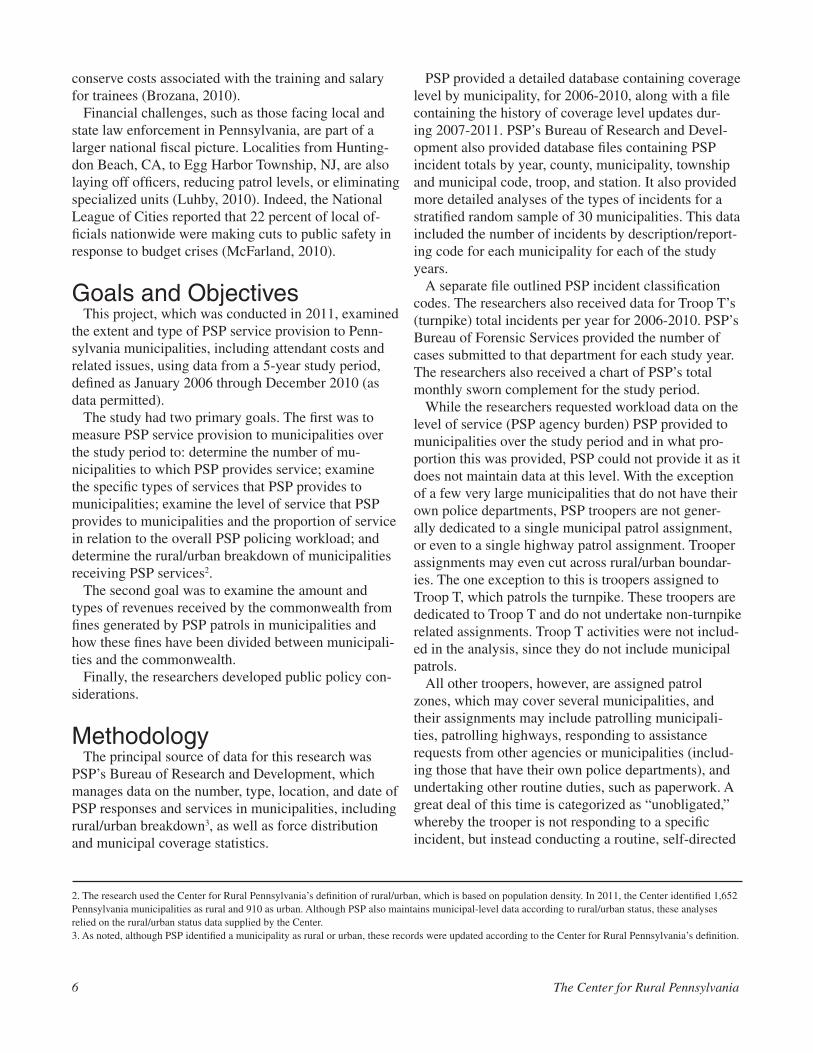
Table 1 shows the breakdown of PSP service to municipalities by coverage level and municipality type, including the percentage of coverage. Of those areas where PSP provided some formal level of coverage, its coverage level was typically full-time (75 percent of municipalities covered), and in rural municipalities (88 percent of municipalities covered). The majority of PSP official coverage may be described as full-time in rural municipalities (70 percent).
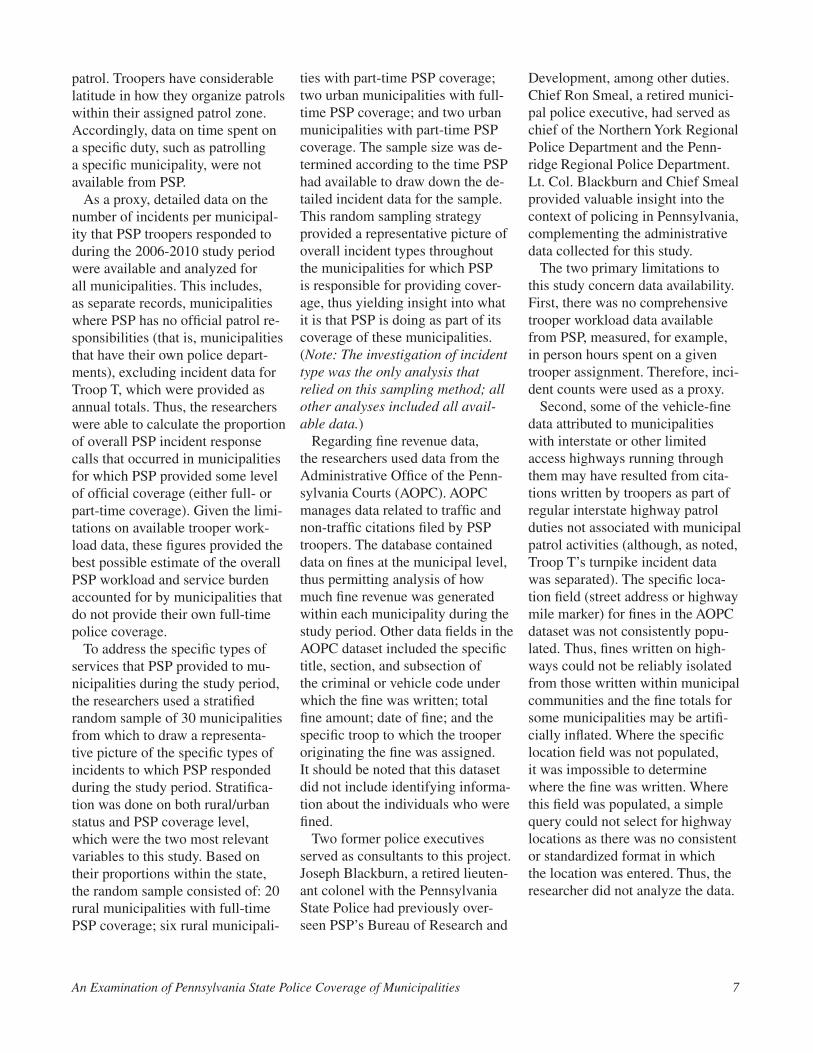
Table 2 shows the average number of people served by PSP, according to coverage level and rural/urban status 5. PSP provided full- or part-time coverage to an average of about 3.4 million Pennsylvanians per year (2006-2010). Seventy-six percent of the individuals
served were rural residents, and 75 percent of the Penn-sylvanians served relied on full-time coverage.
Types of ServicesPSP has jurisdiction across the state and, in addition
to its mandate to provide law enforcement services in those municipalities that do not field their own full-time force, it provides assistance to other local, state, and federal law enforcement agencies upon request. These services include basic patrol duties, crime reporting, criminal investigation plus specialized support services, including collision analysis and reconstruction, liquor control, vice and narcotics, K-9, polygraph, aviation, criminal intelligence, equestrian detail, computer crime, and hazardous devices and explosives. During the study period, for example, 48,849 cases per year, on average, were submitted to PSP’s Bureau of Forensic Services. PSP also provides public services, such as fingerprinting and car seat safety inspections. This is not an exhaustive list of services: PSP fulfills signifi-cant administrative functions and operational mandates as well. In recent years, PSP has also taken on a larger role in homeland security. It is important to note that certain support services, such as forensics and accident reconstruction, as well as the larger operational man-dates, are not necessarily tied to the status of the local municipal police force – PSP provides such services to municipalities with their own police departments.
4. According to the list provided by PSP; not all coverage changes were reported to/included in the list.5. Average annual population based on 2006-2009 Census estimates and 2010 Census for municipalities that had PSP coverage.
Table 1. Average Number of Municipalities Served by PSP,by Coverage Level and Municipality Type (2006-2010)
* Variation in totals due to rounding.
Table 2: Average Number of People Served by PSP,by Coverage Level and Municipality Type (2006-2010)
An Examination of Pennsylvania State Police Coverage of Municipalities 9
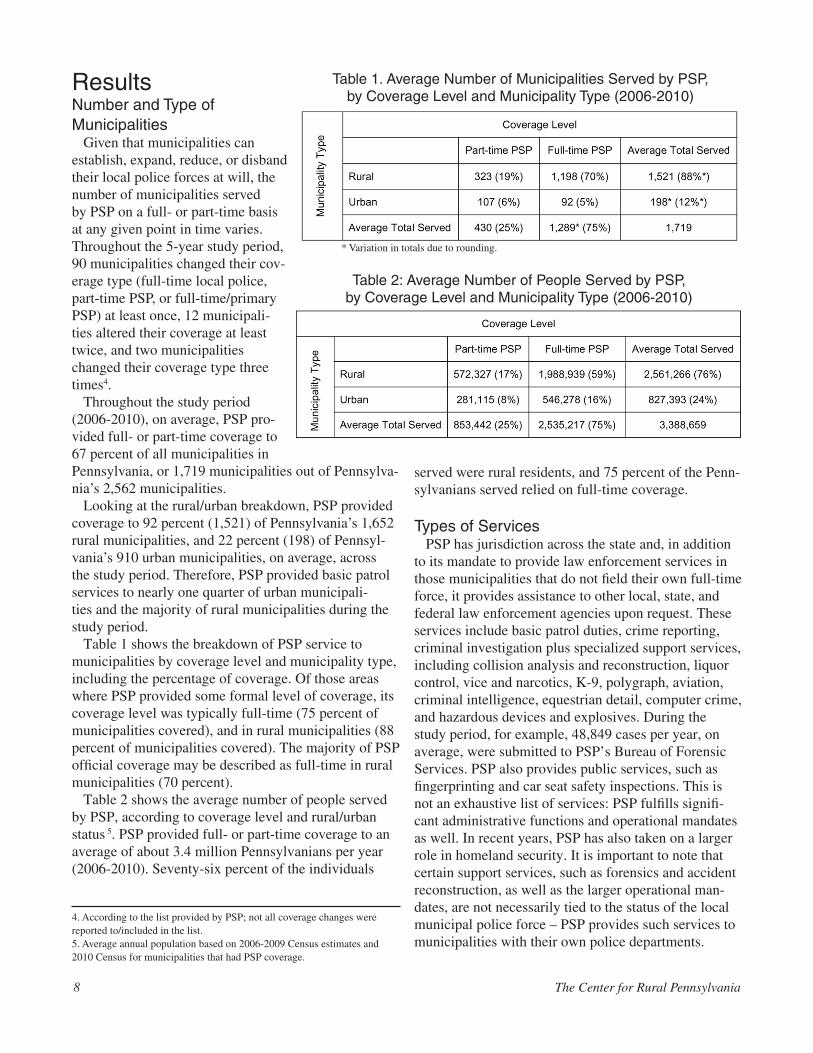
Of those municipalities where PSP provided either full- or part-time patrol coverage, the most commonly reported incidents/calls for service during the study period, regardless of rural/urban distinction, included requests for assistance, collisions, burglaries, thefts, assaults, criminal mischief, and other (e.g., 911 hang-up, disturbance) incidents. Table 3 shows the average number of incidents per year (2006-2010) and incidents
per 1,000 persons served, by consolidated classification type, for the random sample of rural municipalities.
Additionally, for the random sample of rural munici-palities, there was an average of one incident per year or less for the following incident classifications during the study period: background investigation, CLEAN (Commonwealth Law Enforcement Assistance Net-work) request, Clean Indoor Air Act, escapee, gam-bling, gaming, house check, organized crime, poly-graph, and property check.
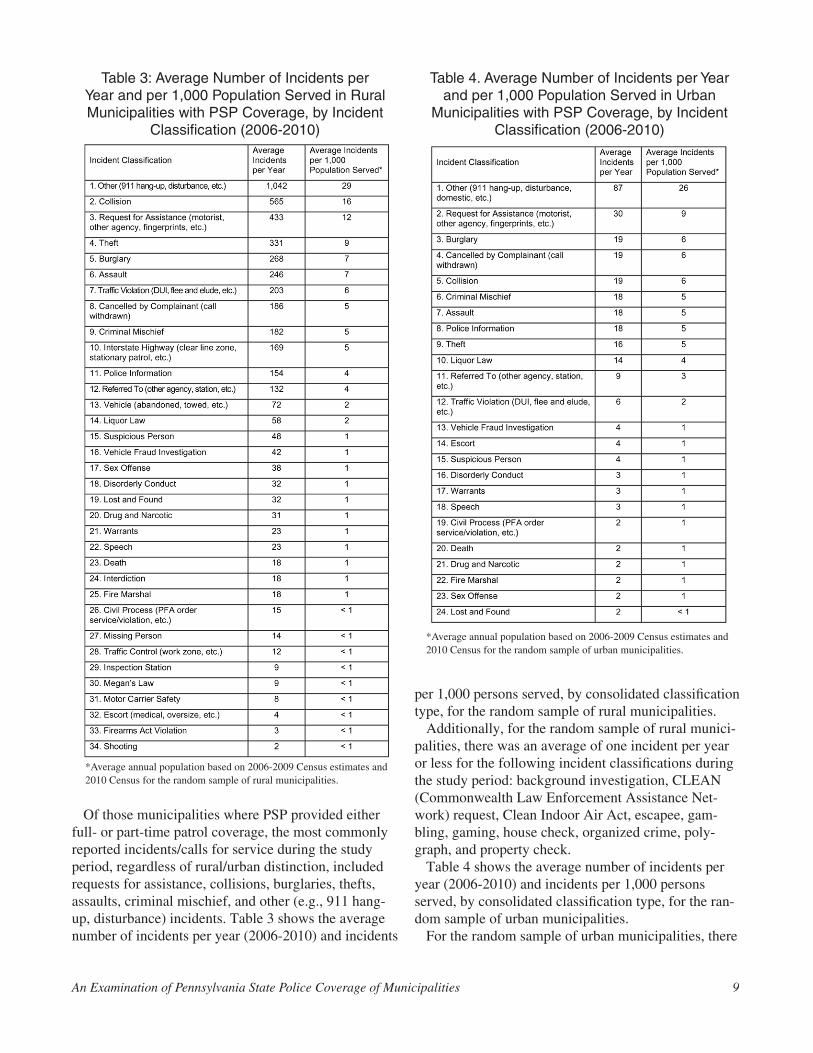
Table 4 shows the average number of incidents per year (2006-2010) and incidents per 1,000 persons served, by consolidated classification type, for the ran-dom sample of urban municipalities.
For the random sample of urban municipalities, there
Table 3: Average Number of Incidents per Year and per 1,000 Population Served in Rural Municipalities with PSP Coverage, by Incident
Classification (2006-2010)
*Average annual population based on 2006-2009 Census estimates and 2010 Census for the random sample of rural municipalities.
Table 4. Average Number of Incidents per Year and per 1,000 Population Served in Urban
Municipalities with PSP Coverage, by Incident Classification (2006-2010)
*Average annual population based on 2006-2009 Census estimates and 2010 Census for the random sample of urban municipalities.
10 The Center for Rural Pennsylvania
was an average of one incident per year or less for the following incident classifications during the study pe-riod: background investigation, Clean Indoor Air Act, CLEAN request, escapee, Firearms Act violation, gam-bling, gaming, house check, inspection station, interdic-tion, interstate highway, Megan’s Law, missing person, motor carrier safety, organized crime, polygraph, prop-erty check, shooting, traffic control, and vehicle.
Thus, the types of incidents that PSP most commonly responded to during its patrols of rural and urban municipalities where it has responsibility for coverage are not unlike what one would expect if the municipal-ity were patrolled by its own police force. One caveat to note is that PSP does not enforce local ordinances, which would be enforced if a given municipality had its own police department.
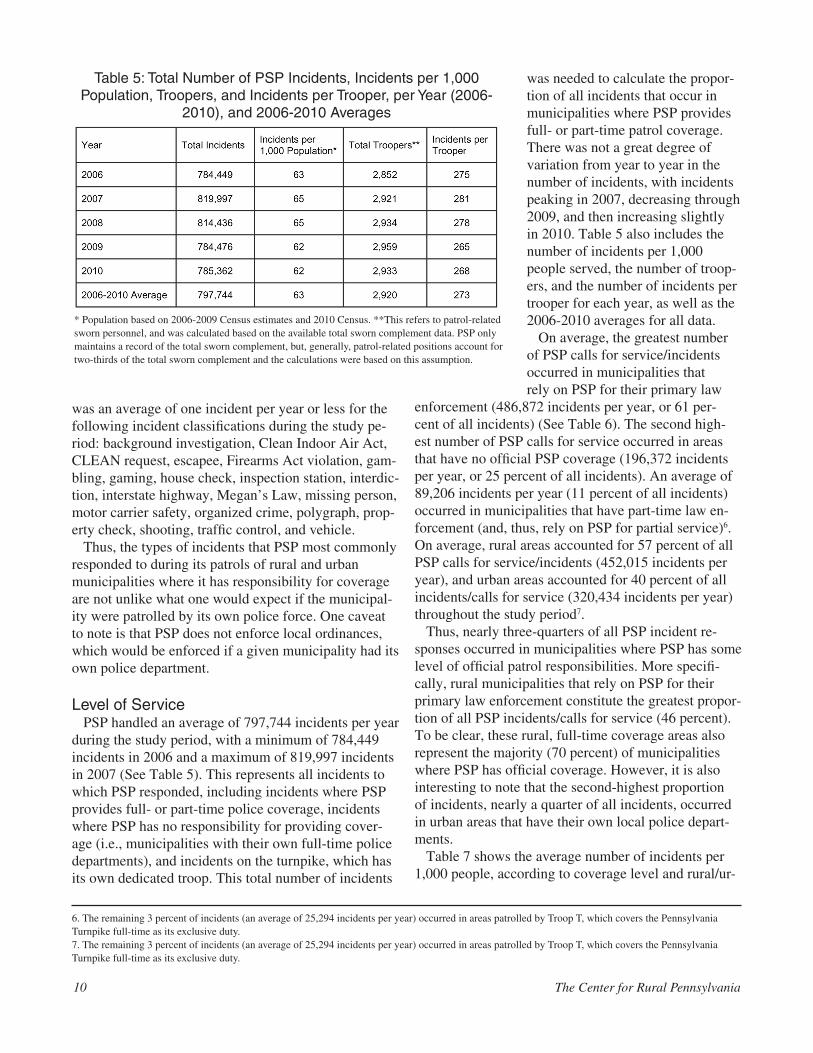
Level of ServicePSP handled an average of 797,744 incidents per year
during the study period, with a minimum of 784,449 incidents in 2006 and a maximum of 819,997 incidents in 2007 (See Table 5). This represents all incidents to which PSP responded, including incidents where PSP provides full- or part-time police coverage, incidents where PSP has no responsibility for providing cover-age (i.e., municipalities with their own full-time police departments), and incidents on the turnpike, which has its own dedicated troop. This total number of incidents
was needed to calculate the propor-tion of all incidents that occur in municipalities where PSP provides full- or part-time patrol coverage. There was not a great degree of variation from year to year in the number of incidents, with incidents peaking in 2007, decreasing through 2009, and then increasing slightly in 2010. Table 5 also includes the number of incidents per 1,000 people served, the number of troop-ers, and the number of incidents per trooper for each year, as well as the 2006-2010 averages for all data.
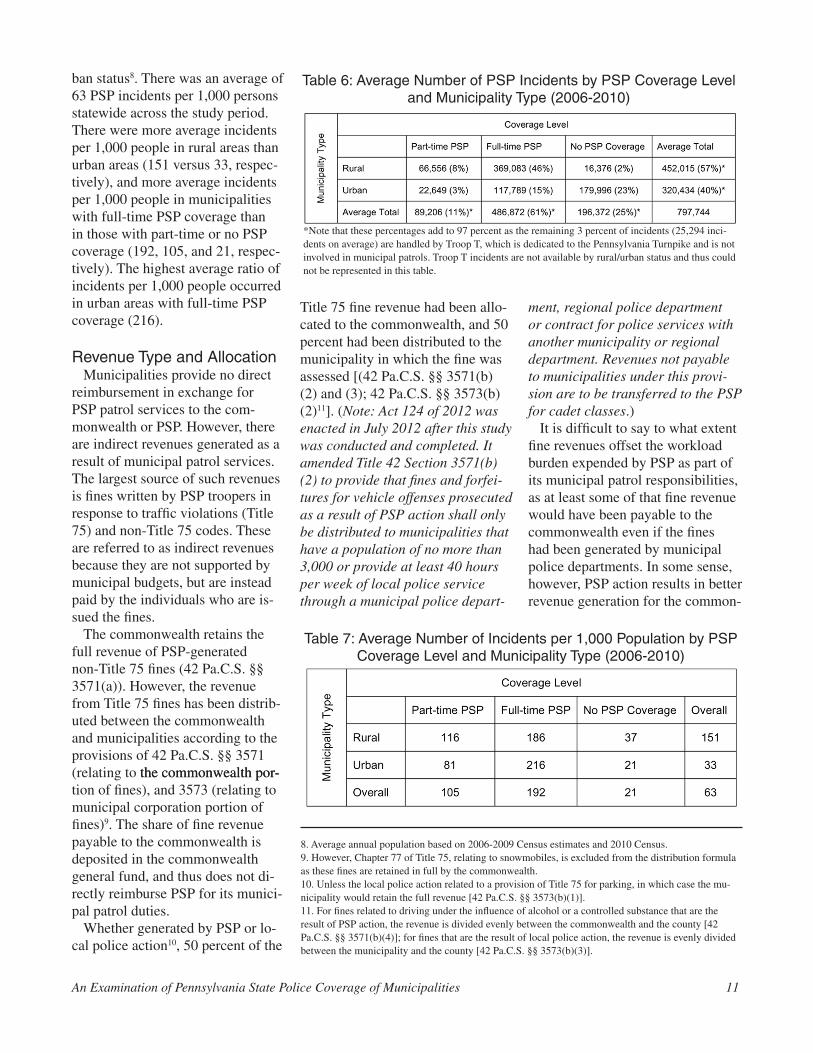
On average, the greatest number of PSP calls for service/incidents occurred in municipalities that rely on PSP for their primary law
enforcement (486,872 incidents per year, or 61 per-cent of all incidents) (See Table 6). The second high-est number of PSP calls for service occurred in areas that have no official PSP coverage (196,372 incidents per year, or 25 percent of all incidents). An average of 89,206 incidents per year (11 percent of all incidents) occurred in municipalities that have part-time law en-forcement (and, thus, rely on PSP for partial service)6. On average, rural areas accounted for 57 percent of all PSP calls for service/incidents (452,015 incidents per year), and urban areas accounted for 40 percent of all incidents/calls for service (320,434 incidents per year) throughout the study period7.
Thus, nearly three-quarters of all PSP incident re-sponses occurred in municipalities where PSP has some level of official patrol responsibilities. More specifi-cally, rural municipalities that rely on PSP for their primary law enforcement constitute the greatest propor-tion of all PSP incidents/calls for service (46 percent). To be clear, these rural, full-time coverage areas also represent the majority (70 percent) of municipalities where PSP has official coverage. However, it is also interesting to note that the second-highest proportion of incidents, nearly a quarter of all incidents, occurred in urban areas that have their own local police depart-ments.
Table 7 shows the average number of incidents per 1,000 people, according to coverage level and rural/ur-
* Population based on 2006-2009 Census estimates and 2010 Census. **This refers to patrol-related sworn personnel, and was calculated based on the available total sworn complement data. PSP only maintains a record of the total sworn complement, but, generally, patrol-related positions account for two-thirds of the total sworn complement and the calculations were based on this assumption.
Table 5: Total Number of PSP Incidents, Incidents per 1,000 Population, Troopers, and Incidents per Trooper, per Year (2006-
2010), and 2006-2010 Averages
6. The remaining 3 percent of incidents (an average of 25,294 incidents per year) occurred in areas patrolled by Troop T, which covers the Pennsylvania Turnpike full-time as its exclusive duty.7. The remaining 3 percent of incidents (an average of 25,294 incidents per year) occurred in areas patrolled by Troop T, which covers the Pennsylvania Turnpike full-time as its exclusive duty.
An Examination of Pennsylvania State Police Coverage of Municipalities 11
ban status8. There was an average of 63 PSP incidents per 1,000 persons statewide across the study period. There were more average incidents per 1,000 people in rural areas than urban areas (151 versus 33, respec-tively), and more average incidents per 1,000 people in municipalities with full-time PSP coverage than in those with part-time or no PSP coverage (192, 105, and 21, respec-tively). The highest average ratio of incidents per 1,000 people occurred in urban areas with full-time PSP coverage (216).
Revenue Type and AllocationMunicipalities provide no direct
reimbursement in exchange for PSP patrol services to the com-monwealth or PSP. However, there are indirect revenues generated as a result of municipal patrol services. The largest source of such revenues is fines written by PSP troopers in response to traffic violations (Title 75) and non-Title 75 codes. These are referred to as indirect revenues because they are not supported by municipal budgets, but are instead paid by the individuals who are is-sued the fines.
The commonwealth retains the full revenue of PSP-generated non-Title 75 fines (42 Pa.C.S. §§ 3571(a)). However, the revenue from Title 75 fines has been distrib-uted between the commonwealth and municipalities according to the provisions of 42 Pa.C.S. §§ 3571 (relating to the commonwealth por-the commonwealth por-tion of fines), and 3573 (relating to municipal corporation portion of fines)9. The share of fine revenue payable to the commonwealth is deposited in the commonwealth general fund, and thus does not di-rectly reimburse PSP for its munici-pal patrol duties.
Whether generated by PSP or lo-cal police action10, 50 percent of the
Title 75 fine revenue had been allo-cated to the commonwealth, and 50 percent had been distributed to the municipality in which the fine was assessed [(42 Pa.C.S. §§ 3571(b)(2) and (3); 42 Pa.C.S. §§ 3573(b)(2)11]. (Note: Act 124 of 2012 was enacted in July 2012 after this study was conducted and completed. It amended Title 42 Section 3571(b)(2) to provide that fines and forfei-tures for vehicle offenses prosecuted as a result of PSP action shall only be distributed to municipalities that have a population of no more than 3,000 or provide at least 40 hours per week of local police service through a municipal police depart-
ment, regional police department or contract for police services with another municipality or regional department. Revenues not payable to municipalities under this provi-sion are to be transferred to the PSP for cadet classes.)
It is difficult to say to what extent fine revenues offset the workload burden expended by PSP as part of its municipal patrol responsibilities, as at least some of that fine revenue would have been payable to the commonwealth even if the fines had been generated by municipal police departments. In some sense, however, PSP action results in better revenue generation for the common-
Table 6: Average Number of PSP Incidents by PSP Coverage Level and Municipality Type (2006-2010)
*Note that these percentages add to 97 percent as the remaining 3 percent of incidents (25,294 inci-dents on average) are handled by Troop T, which is dedicated to the Pennsylvania Turnpike and is not involved in municipal patrols. Troop T incidents are not available by rural/urban status and thus could not be represented in this table.
Table 7: Average Number of Incidents per 1,000 Population by PSP Coverage Level and Municipality Type (2006-2010)
8. Average annual population based on 2006-2009 Census estimates and 2010 Census.9. However, Chapter 77 of Title 75, relating to snowmobiles, is excluded from the distribution formula as these fines are retained in full by the commonwealth. 10. Unless the local police action related to a provision of Title 75 for parking, in which case the mu-nicipality would retain the full revenue [42 Pa.C.S. §§ 3573(b)(1)].11. For fines related to driving under the influence of alcohol or a controlled substance that are the result of PSP action, the revenue is divided evenly between the commonwealth and the county [42 Pa.C.S. §§ 3571(b)(4)]; for fines that are the result of local police action, the revenue is evenly divided between the municipality and the county [42 Pa.C.S. §§ 3573(b)(3)].
12 The Center for Rural Pennsylvania
wealth because some local police departments instead cite certain violations under a comparable local ordi-nance rather than Title 75 (in which case the municipal-ity retains the full fine revenue) (Consultants Blackburn and Smeal, personal communication, October 2011).
The total amount of PSP fines assessed during the study period for Title 75 offenses was $136,514,480, of which the commonwealth would have retained half ($68,257,240) per the statutory provisions, with the balance distributed to municipalities in which the fines were assessed12. On average, PSP generated $27,302,896 per year in Title 75 fines during the 2006-2010 study period. During the study period, 60 percent of the total Title 75 fines ($81,763,492) were generated in municipalities where PSP is the primary law enforce-ment agency, 30 percent ($40,785,069) were assessed in areas where the PSP has no official coverage, and 10 percent ($13,965,919) were generated in areas with part-time PSP coverage. Most of the total fine revenue was generated in rural areas (63 percent; $86,636,679) versus urban areas (37 percent; $49,877,801).
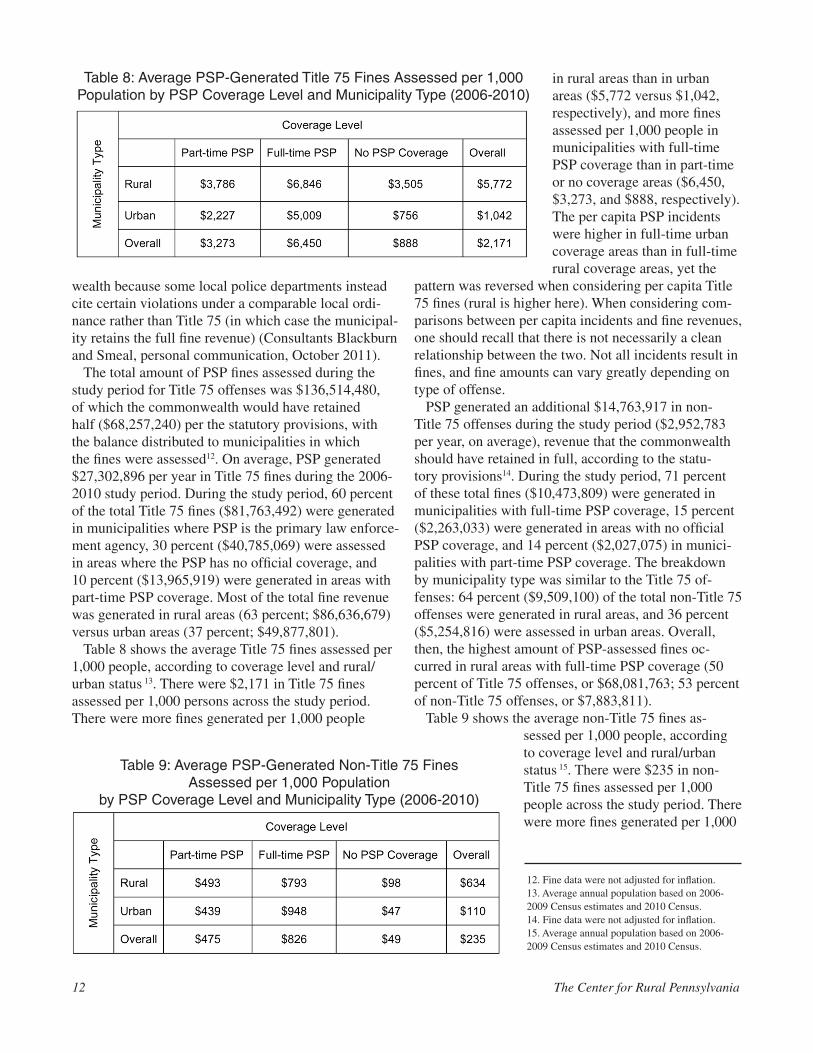
Table 8 shows the average Title 75 fines assessed per 1,000 people, according to coverage level and rural/urban status 13. There were $2,171 in Title 75 fines assessed per 1,000 persons across the study period. There were more fines generated per 1,000 people
in rural areas than in urban areas ($5,772 versus $1,042, respectively), and more fines assessed per 1,000 people in municipalities with full-time PSP coverage than in part-time or no coverage areas ($6,450, $3,273, and $888, respectively). The per capita PSP incidents were higher in full-time urban coverage areas than in full-time rural coverage areas, yet the
pattern was reversed when considering per capita Title 75 fines (rural is higher here). When considering com-parisons between per capita incidents and fine revenues, one should recall that there is not necessarily a clean relationship between the two. Not all incidents result in fines, and fine amounts can vary greatly depending on type of offense.
PSP generated an additional $14,763,917 in non-Title 75 offenses during the study period ($2,952,783 per year, on average), revenue that the commonwealth should have retained in full, according to the statu-tory provisions14. During the study period, 71 percent of these total fines ($10,473,809) were generated in municipalities with full-time PSP coverage, 15 percent ($2,263,033) were generated in areas with no official PSP coverage, and 14 percent ($2,027,075) in munici-palities with part-time PSP coverage. The breakdown by municipality type was similar to the Title 75 of-fenses: 64 percent ($9,509,100) of the total non-Title 75 offenses were generated in rural areas, and 36 percent ($5,254,816) were assessed in urban areas. Overall, then, the highest amount of PSP-assessed fines oc-curred in rural areas with full-time PSP coverage (50 percent of Title 75 offenses, or $68,081,763; 53 percent of non-Title 75 offenses, or $7,883,811).
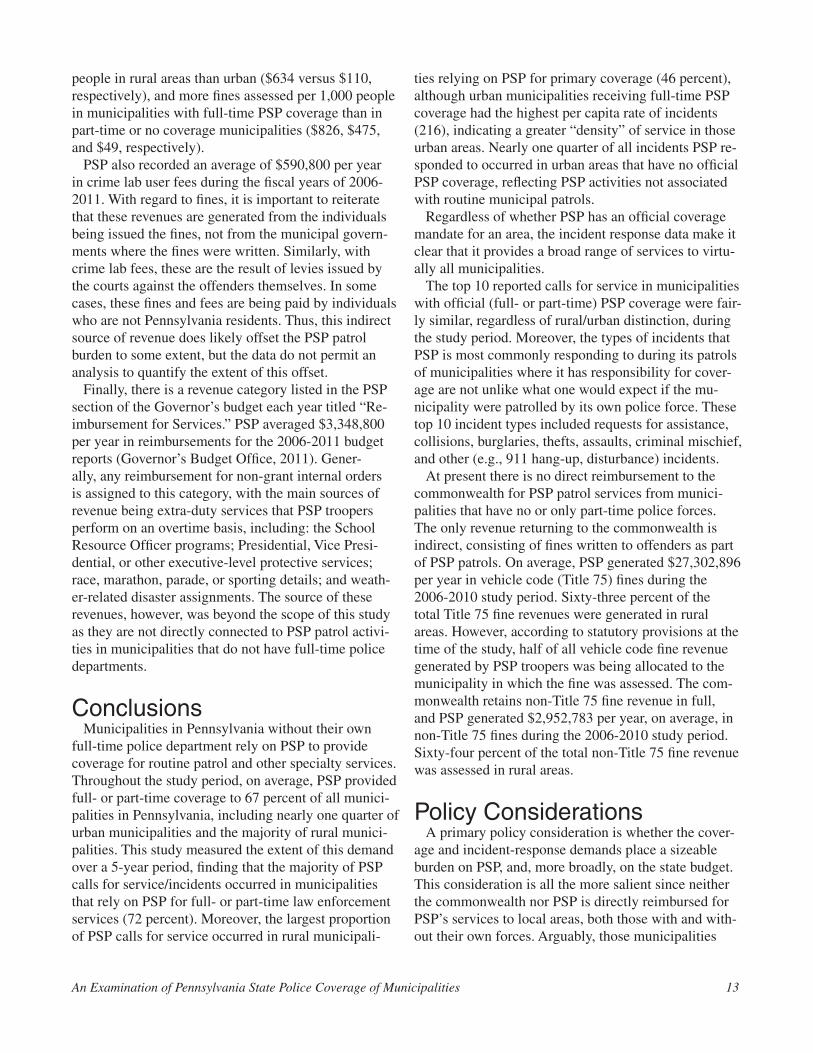
Table 9 shows the average non-Title 75 fines as-sessed per 1,000 people, according to coverage level and rural/urban status 15. There were $235 in non-Title 75 fines assessed per 1,000 people across the study period. There were more fines generated per 1,000
Table 9: Average PSP-Generated Non-Title 75 FinesAssessed per 1,000 Population
by PSP Coverage Level and Municipality Type (2006-2010)
12. Fine data were not adjusted for inflation.13. Average annual population based on 2006-2009 Census estimates and 2010 Census.14. Fine data were not adjusted for inflation.15. Average annual population based on 2006-2009 Census estimates and 2010 Census.
Table 8: Average PSP-Generated Title 75 Fines Assessed per 1,000 Population by PSP Coverage Level and Municipality Type (2006-2010)
An Examination of Pennsylvania State Police Coverage of Municipalities 13
people in rural areas than urban ($634 versus $110, respectively), and more fines assessed per 1,000 people in municipalities with full-time PSP coverage than in part-time or no coverage municipalities ($826, $475, and $49, respectively).
PSP also recorded an average of $590,800 per year in crime lab user fees during the fiscal years of 2006-2011. With regard to fines, it is important to reiterate that these revenues are generated from the individuals being issued the fines, not from the municipal govern-ments where the fines were written. Similarly, with crime lab fees, these are the result of levies issued by the courts against the offenders themselves. In some cases, these fines and fees are being paid by individuals who are not Pennsylvania residents. Thus, this indirect source of revenue does likely offset the PSP patrol burden to some extent, but the data do not permit an analysis to quantify the extent of this offset.
Finally, there is a revenue category listed in the PSP section of the Governor’s budget each year titled “Re-imbursement for Services.” PSP averaged $3,348,800 per year in reimbursements for the 2006-2011 budget reports (Governor’s Budget Office, 2011). Gener-ally, any reimbursement for non-grant internal orders is assigned to this category, with the main sources of revenue being extra-duty services that PSP troopers perform on an overtime basis, including: the School Resource Officer programs; Presidential, Vice Presi-dential, or other executive-level protective services; race, marathon, parade, or sporting details; and weath-er-related disaster assignments. The source of these revenues, however, was beyond the scope of this study as they are not directly connected to PSP patrol activi-ties in municipalities that do not have full-time police departments.
ConclusionsMunicipalities in Pennsylvania without their own
full-time police department rely on PSP to provide coverage for routine patrol and other specialty services. Throughout the study period, on average, PSP provided full- or part-time coverage to 67 percent of all munici-palities in Pennsylvania, including nearly one quarter of urban municipalities and the majority of rural munici-palities. This study measured the extent of this demand over a 5-year period, finding that the majority of PSP calls for service/incidents occurred in municipalities that rely on PSP for full- or part-time law enforcement services (72 percent). Moreover, the largest proportion of PSP calls for service occurred in rural municipali-
ties relying on PSP for primary coverage (46 percent), although urban municipalities receiving full-time PSP coverage had the highest per capita rate of incidents (216), indicating a greater “density” of service in those urban areas. Nearly one quarter of all incidents PSP re-sponded to occurred in urban areas that have no official PSP coverage, reflecting PSP activities not associated with routine municipal patrols.
Regardless of whether PSP has an official coverage mandate for an area, the incident response data make it clear that it provides a broad range of services to virtu-ally all municipalities.
The top 10 reported calls for service in municipalities with official (full- or part-time) PSP coverage were fair-ly similar, regardless of rural/urban distinction, during the study period. Moreover, the types of incidents that PSP is most commonly responding to during its patrols of municipalities where it has responsibility for cover-age are not unlike what one would expect if the mu-nicipality were patrolled by its own police force. These top 10 incident types included requests for assistance, collisions, burglaries, thefts, assaults, criminal mischief, and other (e.g., 911 hang-up, disturbance) incidents.
At present there is no direct reimbursement to the commonwealth for PSP patrol services from munici-palities that have no or only part-time police forces. The only revenue returning to the commonwealth is indirect, consisting of fines written to offenders as part of PSP patrols. On average, PSP generated $27,302,896 per year in vehicle code (Title 75) fines during the 2006-2010 study period. Sixty-three percent of the total Title 75 fine revenues were generated in rural areas. However, according to statutory provisions at the time of the study, half of all vehicle code fine revenue generated by PSP troopers was being allocated to the municipality in which the fine was assessed. The com-monwealth retains non-Title 75 fine revenue in full, and PSP generated $2,952,783 per year, on average, in non-Title 75 fines during the 2006-2010 study period. Sixty-four percent of the total non-Title 75 fine revenue was assessed in rural areas.
Policy ConsiderationsA primary policy consideration is whether the cover-
age and incident-response demands place a sizeable burden on PSP, and, more broadly, on the state budget. This consideration is all the more salient since neither the commonwealth nor PSP is directly reimbursed for PSP’s services to local areas, both those with and with-out their own forces. Arguably, those municipalities
14 The Center for Rural Pennsylvania
that do not field their own force are a greater obligation as they may require more official PSP consideration for personnel and resource allocation. Furthermore, without some form of local police coverage to “buffer” a locality’s service needs, PSP becomes the de facto law enforcement for the full range of incidents affect-ing a service area, although it does not enforce local ordinances.
Two other issues have been raised in the literature regarding the provision of state police services, without charge, to municipalities that do not have their own force. The first is efficiency, which refers to a concern about allocation of resources, namely that the state police may be unable to meet the local demand for ser-vices, both in level (because its burden is too great and troopers are spread too thin) and type (because it is not as familiar with the community it serves as a local de-partment would be) (Coate and Schwester, 2009). The second issue is fairness, which relates to the perception that municipalities that use the state police instead of a full- or part-time local department are essentially “sub-sidized” by all other municipalities that pay for their own police forces (Coate and Schwester, 2009). This “subsidy” may discourage municipalities from fielding their own department or participating in a regional po-licing arrangement. The fairness or distributional equity issue is particularly salient here.
This study has documented that PSP is the police department of record for a substantial percentage of municipalities in Pennsylvania. Consequently, a very significant portion of the PSP workload, as measured by calls for service, is expended in these municipalities that lack their own police departments. While these mu-nicipalities provide no direct compensation to the com-monwealth for these services, the commonwealth does receive indirect revenues as a result of PSP municipal patrol services.
Alternatives to the current no-charge provision of PSP services to municipalities that do not have their own police force have been advanced and one has been enacted. As noted, Act 124 of 2012 amended Title 42 Section 3571(b) to provide that fines and forfeitures for vehicle offenses prosecuted as a result of PSP action will only be distributed to municipalities that have a population of no more than 3,000 or provide at least 40 hours per week of local police service through a mu-nicipal police department, regional police department or contract for police services with another municipal-ity or regional department. Revenues not payable to
municipalities under this provision will be transferred to PSP for cadet classes.
Other plans offered include one that would charge $156 per-resident per-year to any municipality that relies entirely upon PSP service (Andren, 2010). A variant of this initiative would reduce the per-resident annual charge to municipalities choosing to rely on PSP to $100, and exempt municipalities with popula-tions of less than 10,000 from the fee (Andren, 2010). Another proposal would impose an additional $10 on traffic tickets to raise approximately $13 million in state funding to be dedicated to PSP (Patriot-News Editorial Board, 2010). This plan would, of course, still place the charge on the individual offender, rather than the municipality. Allowing municipalities to contract with the PSP to hire a state trooper, with the municipality paying salary and benefits for that trooper, is another option (Andren, 2010). Another, much broader proposal would consolidate local governments into a county government structure, which presumably would have an impact on local policing (Sanko, 2010).
While these proposals may continue to evolve, they illustrate various policy options already under consider-ation in response to this issue.
Additional options include greater use of county-based policing structures. Allegheny County Police Department, for example, was established in 1932 to provide county-level law enforcement services, using a number of specialized county police units, as well as assist local police departments within the county and other criminal justice agencies (Allegheny County Police, 2011). While there is no formal agreement in place, Allegheny County Police respond to municipali-ties that request its assistance, which is limited to non-patrol services such as investigations, Special Weapons and Tactics Team (SWAT) response, and explosive ordnance disposals (Allegheny County Police Superin-tendent C. Moffat, personal communication, October 2011)16. The department also has cooperative agree-ments with surrounding counties for certain specialized services. During the study period, PSP never officially covered more than six Allegheny County municipalities per year.
Another option is the creation of a regional police force for those municipalities that either cannot afford or do not require a full-time force. According to the Pennsylvania Department of Community and Economic
16. Allegheny County Police patrol services are restricted to county facilities and parks.
An Examination of Pennsylvania State Police Coverage of Municipalities 15
Development, as of June 2011, there were 32 regional police departments in Pennsylvania, located in 22 coun-ties, serving 112 municipalities. Thus, the typical re-gional police department served an average of three to four municipalities, with a minimum of two municipali-ties (12 regional departments) and a maximum of eight municipalities (three regional departments). Combined, these consolidated departments employ 529 full-time and 79 part-time police officers, and serve 514,832 Pennsylvanians across 1,431 square miles (DCED, 2011). Compared to traditional departments, the advan-tages of regionalized police agencies include reduced costs, increased uniformity and consistency of police enforcement, improved coordination of law enforce-ment services, better training and personnel efficiency, increased career enhancement opportunities for police officers, better police management and supervision, and improvements in police personnel distribution and deployment (DCED, 2011). However, consolidation results in a loss of local non-enforcement services (e.g., parking meter enforcement, flag raising)17, reduced citizen contact, and forfeiture of local control (DCED, 2011). Another consideration surrounding regionalized police departments is that municipalities that presently lack their own police departments are not necessarily always contiguous to one another (and may be widely dispersed throughout the county), thus complicating the use of a regional police department as a solution.
A county-based solution may be more workable, as a county police force can provide coverage to any and all municipalities in the county, regardless of their location within the county or their proximity to other munici-palities that also require coverage.
Alternately, municipalities can contract with a neigh-boring municipality that has its own police department, which is something short of a full-fledged regional police department.
In terms of municipal government planning purposes, this report may be of special importance to localities that have not yet engaged the services of PSP, but are contemplating doing so in the near future. This pro-vides an accounting of the costs and benefits associated with electing to have PSP patrol a municipality, which should factor into municipal decision making.
This research found that a wide range of municipali-ties already rely on PSP for full- or part-time coverage,
and thus may encourage other municipalities to opt for PSP coverage on a full- or part-time basis.
Conversely, this research also identified the burdens already placed on PSP in connection with its existing municipal patrol responsibilities. Recognizing this, some municipalities may instead wish to maintain their own local departments out of the concern that PSP patrol resources may already be stretched too thin and thus unable to provide the level of service desired by the community. During 2007-2011, at least one dozen municipalities changed their coverage type more than once, indicating some degree of dissatisfaction with previous coverage levels or their associated costs18. A subsequent study might investigate a borough or town-ship’s motivation to change coverage levels – either increase or decrease PSP coverage by reducing, dis-banding, creating, or reinstating local police coverage.
Due to data limitations, it was not possible to deter-mine the specific person hours spent per municipality. A mandate to track PSP trooper time expenditures per municipality would produce data that would help inform decision-making at both the state and municipal levels.
These results offer evidence for various strategies for meeting the law enforcement needs of municipalities, both rural and urban. The findings can also inform PSP planning efforts regarding statewide force distribution, and aid in determining whether the current staffing al-location formula is adequately serving PSP and its mu-nicipal constituents (in terms of both official and unof-ficial coverage types). PSP provides extensive coverage and support yet receives no direct reimbursement for its services. Thus, the results of this report can be used to inform policymakers concerning the future of PSP coverage of, and service provision to, municipalities.
17. Although it would require additional appropriations, municipalities can recover these losses by assigning the duties to a code enforcement officer.18. According to the list provided by PSP; not all coverage changes were reported to/included in the list.

16 The Center for Rural Pennsylvania
ReferencesAllegheny County Police. (2011) County Police. Retrieved from http://www.alleghenycounty.us/Police/index.aspx.
Andren, K. (2010) “Budget Cuts Delay State Police Train-ing in Pennsylvania.” August 9, 2010. The Patriot-News. Retrieved from http://www.pennlive.com/news/patriotnews/index.ssf?/base/news/1281309010179230.xml&coll=1.
Brozana, A. L. (2010) “Locals Attend Police Academy.” September 23, 2010. Republican Herald. Retrieved from http://republicanherald.com/news/locals-attend-police-acad-emy-1.1026399.
Coate, D. and R. W. Schwester. (2009) “Use of State Police Services for Local Policing: The Case of New Jersey.” Pub-lic Budgeting and Finance, 29(3), 97-109.
Governor’s Budget Office. (2011) Past Budgets 2010-11 to 2006-07. Retrieved from http://www.governor.state.pa.us/portal/server.pt/community/past_budgets/4571.
Governor’s Executive Budget. (2011) “State Police.” Gover-nor’s Executive Budget, 2011-2012. Section E40.1. Re-trieved from http://www.portal.state.pa.us/portal/server.pt/document/1049028/2011-12_budget_document_pdf.
Luhby, T. (2010) “City Budget Cuts Mean Fewer Cops On the Beat.” May 26, 2010. CNN Money. Retrieved from http://money.cnn.com/2010/05/26/news/economy/cops_state_budget_cuts/index.htm.
McFarland, C. (2010) “Research Brief on America’s Cities: State of America’s Cities Survey on Jobs and the Econ-omy.” National League of Cities. Retrieved from: http://www.nlc.org/File%20Library/Find%20City%20Solutions/Research%20Innovation/Economic Development/state-of-americas-cities-survey-jobs-economy-rpt-may10.pdf.
Patriot-News Editorial Board. (2010) “State Police are Overburdened, Underfunded.” August 15, 2011. The Patriot-News. Retrieved from: http://www.pennlive.com/editorials/index.ssf/2010/08/state_police_woes_commonwealth.html.
Pennsylvania Department of Community and Economic Development. (2011) Regional Police Services in Pennsyl-vania: A Manual for Local Government Officials (10th Ed.). Harrisburg, PA: Governor’s Center for Local Government Services. Retrieved from: http://www.newpa.com/webfm_send/1724.
Pennsylvania State Police. (2011) “Troop Information.” Retrieved from http://www.portal.state.pa.us/portal/server.pt?open=512&objID=4541&mode=2.
Sanko, D. (2010) “Pa. Townships and Boroughs Are Man-aging Just Fine.” August 15, 2010. The Patriot-News. Retrieved from http://www.pennlive.com/editorials/index.ssf/2010/08/pa_townships_and_boroughs_are.html.
The Center for Rural Pennsylvania625 Forster St., Room 902
Harrisburg, PA 17120Phone: (717) 787-9555
Fax: (717) 772-3587www.rural.palegislature.us
1P1012 – 450
ChairmanSenator Gene Yaw
TreasurerSenator John Wozniak
SecretaryDr. Nancy Falvo
Clarion University
Representative Garth D. Everett
Representative Rick Mirabito
Dr. Livingston AlexanderUniversity of Pittsburgh
Dr. Theodore R. AlterPennsylvania State University
Stephen M. BrameGovernor’s Representative
Taylor A. Doebler IIIGovernor’s Representative
Dr. Stephan J. GoetzNortheast Regional Center
for Rural Development
Dr. Karen M. WhitneyClarion University
The Center for Rural PennsylvaniaBoard of Directors