an estimation of the residential utility for the local
TRANSCRIPT
An estimation of the residential utility for the local waste
management services in Kagoshima
SAKATA Yusuke
Faculty of Economics, Kinki University
July, 2005
1
An estimation of the residential utility for the local waste
management services in Kagoshima
Abstract
The municipal government tried to reduce waste disposals and increase recycling
rates in Japan. It is difficult to get full cooperation from the residents. Using choice
experiments, the cost measure for each characteristics of waste collection services.
The estimation result reveals that the trade-offs between the risk, costs and handling
costs. The marginal utility loss for the increase in the number of separation is almost
200yen and the increase in recycling rate by 1% raises 53yen of utility. The estimation
result also shows that the needs of risk communications between municipal authorities
and residents.
JEL Classification: Q51, Q53
Keywords: Solid Waste management, Choice experiment, Multi Nominal Model
2
1. Introduction
Waste management policy is one of the important issues for municipal governments in
Japan. The Japanese Government’s waste management policy has changed dramatically
since the introduction of the Basic Law for Establishing a Recycling-Based Society in
2002. In addition, local waste management systems have changed to accommodate this
law. The system varies between the local governments in Japan. Among the waste
management policies, waste collection methods are a big concern and sometimes a
burden for residents. Recently, local authorities have made great efforts to obtain the
cooperation of residents by attempting to introduce a policy that achieves the desired
results but imposes a lesser burden on residents. Using choice experiments, this paper
reveals the utility differences between waste collection policies.
Prior to the introduction of the new policy, governments usually held meetings to
obtain the residents’ views on waste management policy. However, it is very difficult to
establish the optimum system based on residents’ opinions. Usually, local residents do
not know what kinds of methods are feasible or what will be the results of those
methods. It is clear that most residents would prefer smaller payments and handling
costs, a better recycling rate, and a more ecologically friendly method of waste
management. Usually, these properties of a waste management system cannot be
achieved simultaneously.
Among the various waste collection methods available, a unit-based method of
charging is widely employed in Japan via a system of selling waste bags for a fee. The
waste bags are sold for 37.9 yen on average for Japan (Usui 2003), and 15-30 yen for a
40-liter bag in Kagoshima Prefecture (Sakata 2001). The Japanese Government is trying
to oblige local governments to introduce user charges in 2005. At the same time, it is
increasing the types of waste and recyclable goods that must be separated by residents.
In some small cities, such as Minamata and Kamikatsu, the residents must separate over
20 types of garbage and recyclable goods. The local government provides thorough
explanations of the methods required using the city papers and meetings, hundreds of
which must be held in each small district.
Local authorities should design their waste management systems considering these
trade-offs and technology restrictions. If they know the residents’ preferences for the
characteristics of waste collection, they can design the most preferred system subject to
the technology restrictions.
3
In this paper, we try to evaluate waste collection methods using Conjoint Analysis
(CA). CA was originally developed in mathematical psychology (Luce and Tukey
1964) and marketing research (Actio and Jain 1980, Green and Srinivasan 1990). In the
1990s, CA has been widely used in environmental economics to evaluate non-market
goods and the choice of transportation (Bilbao 2004, Haefele 2001, Hensher 1994,
Louviere 1988, Louviere, Hensher, and Swait 2000, and Takeuchi, Kuriyama, and
Washida 1999). Recently, the application of CA methods has been extended to various
areas such as health economics (Miguel 2000), and waste management (Sasao 2002).
Using CA, we can evaluate the preferences relating to the properties of each policy.
Sasao (2002) evaluated the location preference for a waste dump in Akita, in northeast
Japan. This paper attempts to apply CA to the evaluation of non-market goods,
especially such goods supplied as public services. In particular, we have applied CA to
the residential demand for the waste collection service supplied by the local authorities.
The following section explains the model of CA used in this paper. In CA, the
willingness to pay (WTP) for a provided policy is estimated using an econometric
method. Sakata (2003) estimated the result using the Multinomial Logit Model (MNL).
MNL is often criticized because it requires the assumption of independence from
irrelevant alternatives (IIA). The IIA assumption is a very strong restriction when using
CA in policy studies. The solutions to reduce this restriction are the nested logit model
(e.g. Tsuge 2001) and the Multinomial Probit Model (MNP). In this paper, we have
used MNP to estimate the residents’ utility for each policy characteristic.
The following section illustrates the estimation model. In section 3, the research
objective and method are explained. In section 4, the estimated result is presented.
Section 5 concludes the paper.
2. The Model
Suppose the consumer’s utility can be divided by the characteristics of goods. Then, we
can define individual t’s utility function as follows (Lancaster 1966):
!
Ut=U
t(x1,x2,K,x
n)
Ut: t's Utility
xi: i'th characteristics of goods x
Using this utility function, we can define our estimation model based on random
utility theory (Luce and Tukey 1964, McFadden 1973). The respondents show their
4
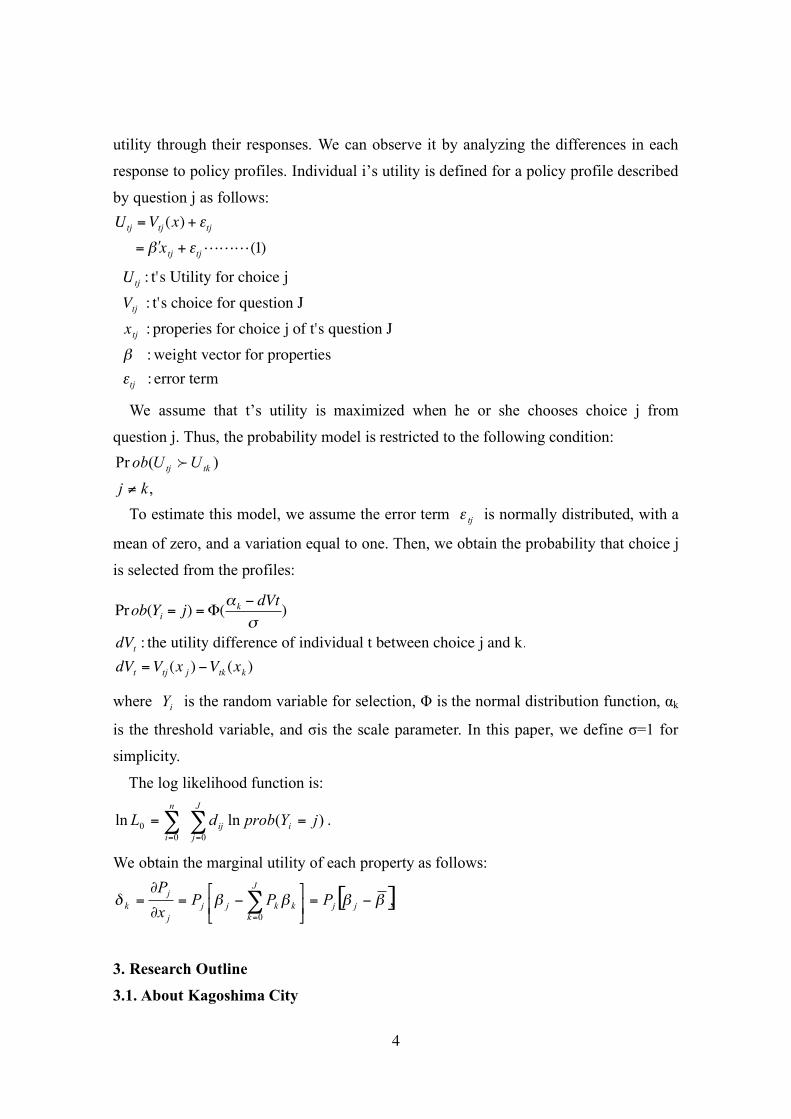
utility through their responses. We can observe it by analyzing the differences in each
response to policy profiles. Individual i’s utility is defined for a policy profile described
by question j as follows:
!
Utj =Vtj (x) + "tj
= # $ xtj + "tjLLL(1)
!
Utj : t's Utility for choice j
Vtj : t's choice for question J
xtj : properies for choice j of t's question J
" : weight vector for properties
#tj : error term
We assume that t’s utility is maximized when he or she chooses choice j from
question j. Thus, the probability model is restricted to the following condition:
,
)(Pr
kj
UUob tktj
!
f
To estimate this model, we assume the error term tj! is normally distributed, with a
mean of zero, and a variation equal to one. Then, we obtain the probability that choice j
is selected from the profiles:
!
Prob(Yi = j) ="(#k $ dVt
%)
dVt : the utility difference of individual t between choice j and k.
dVt =Vtj (x j ) $Vtk (xk )
where iY is the random variable for selection, ! is the normal distribution function, "k
is the threshold variable, and #is the scale parameter. In this paper, we define #=1 for
simplicity.
The log likelihood function is:
!!==
==J
j
iij
n
i
jYprobdL00
0 )(lnln .
We obtain the marginal utility of each property as follows:
[ ],0
!!!!" #=$%
&'(
)#=
*
*= +
=
jj
J
k
kkjj
j
j
k PPPx
P
3. Research Outline
3.1. About Kagoshima City
5
Kagoshima City is the capital of Kagoshima Prefecture and it has a population of almost
600,000 people.
Kagoshima City has two waste management facilities. The northern one has an
incinerator, a recycling plant, and a waste dump, whereas the southern one has an
incinerator and a thermal recovery system that generates electricity supply to almost 300
households.
In 2002, the cost of waste management was about 16,000 yen per person in a year.
This included costs such as collection fees and maintenance costs, but excluded the
labor cost of office workers.
In Kagoshima Prefecture, many municipal governments recover their waste
management costs by charging customers for a special bag and including user costs in
its price. Although Kagoshima City charges offices for waste management in this
manner, they have not introduced such a system for residents.
Between 1995 and 2003, the recycling rate of Kagoshima improved from about 2.7%
to 14.3%. This improvement was achieved by a new recycling scheme that was
introduced in 1996 and completed in 2001, and that involves collecting packaging waste
as a recycling material. The recycling rate is quite high in large cities, averaging about
12%.
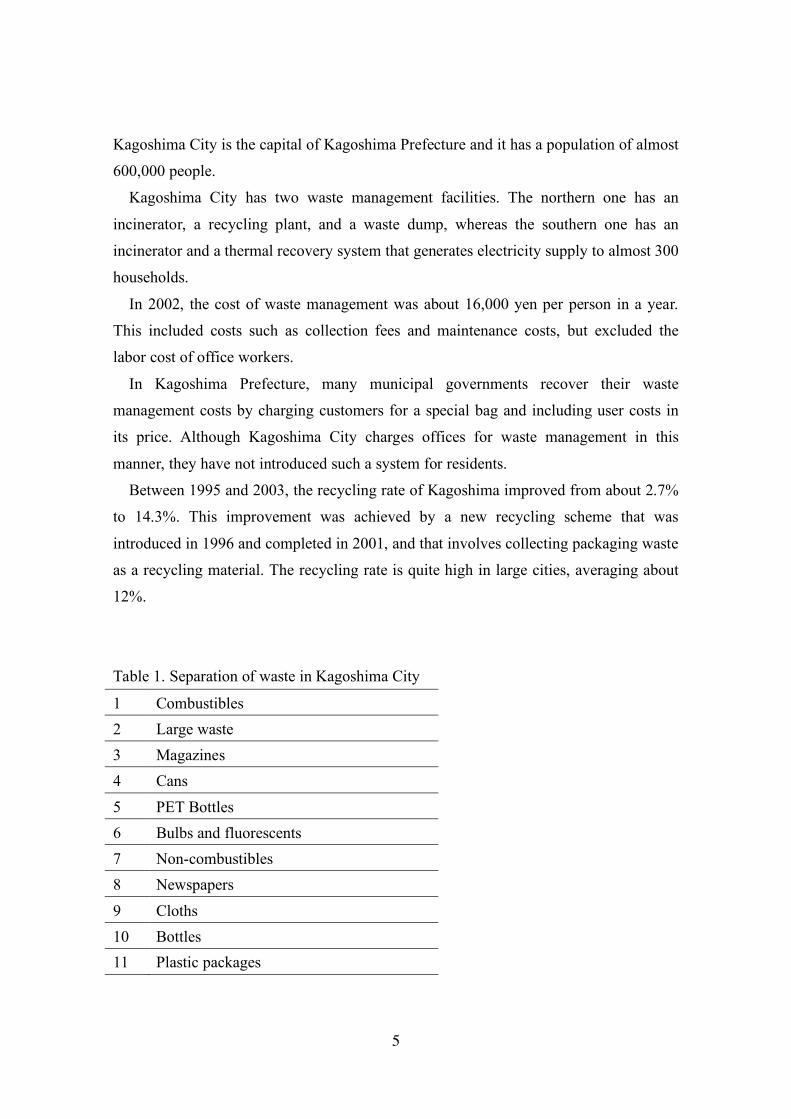
Table 1. Separation of waste in Kagoshima City
1 Combustibles
2 Large waste
3 Magazines
4 Cans
5 PET Bottles
6 Bulbs and fluorescents
7 Non-combustibles
8 Newspapers
9 Cloths
10 Bottles
11 Plastic packages
6
Kagoshima City gradually subdivided their collection methods so that the types of
waste collected increased from five to 11. The final scheme started in 2000. Currently,
residents separate their waste into 11 categories, as shown in Table 1. The waste
collection schedule is also shown in the table. Some residents claim that the separation
and collection schedule is too complex.
3.2. Research Methodology
We carried out our research in Kagoshima City in September 2002. It involved 10
researchers visiting houses to interview residents and collecting 500 samples from the
northern part of Kagoshima City, which includes the central and Ishiki areas. The
samples were chosen randomly from 10 regions. The sample areas were chosen on the
basis of population weight and picked randomly.
Interviews were carried out using question sheets and manuals. Researchers
completed the same training to avoid interviewer bias. Each question sheet had five
parts. These related to face, general knowledge of environmental problems, knowledge
of waste policy, preferences for waste policy in Kagoshima, and eight choice
experiment cards. We designed very simple questions so that interviewees could focus
on the choice cards.
3.3. Profile Design
There are five categories each with three levels in the research profile. If we make
profiles with those combinations, it is difficult to use 3^8 combinations (125) of profiles
in the questions and so we reduced the profiles to 12 using orthogonal design. However,
using such techniques creates an unrealistic profile list and therefore, instead of
removing those profiles, we explained the method in interviews.
Each choice set consists of three randomly chosen profiles and there are 220 (12C3 =
220) patterns of question cards. The interviewer showed the interviewee eight randomly
chosen cards, and the interviewee then chose the most desirable profile from each card.
A sample card is shown in Figure 1.1
1 It is difficult to eliminate some unrealistic profiles in the profile list using orthogonal
design, so those unrealistic profiles were left in our list. To avoid the undesirable effect
caused by those profiles, the interviewer spent a lot of time explaining to respondents
that the profiles were included because of the requirements of the analytical method.
7
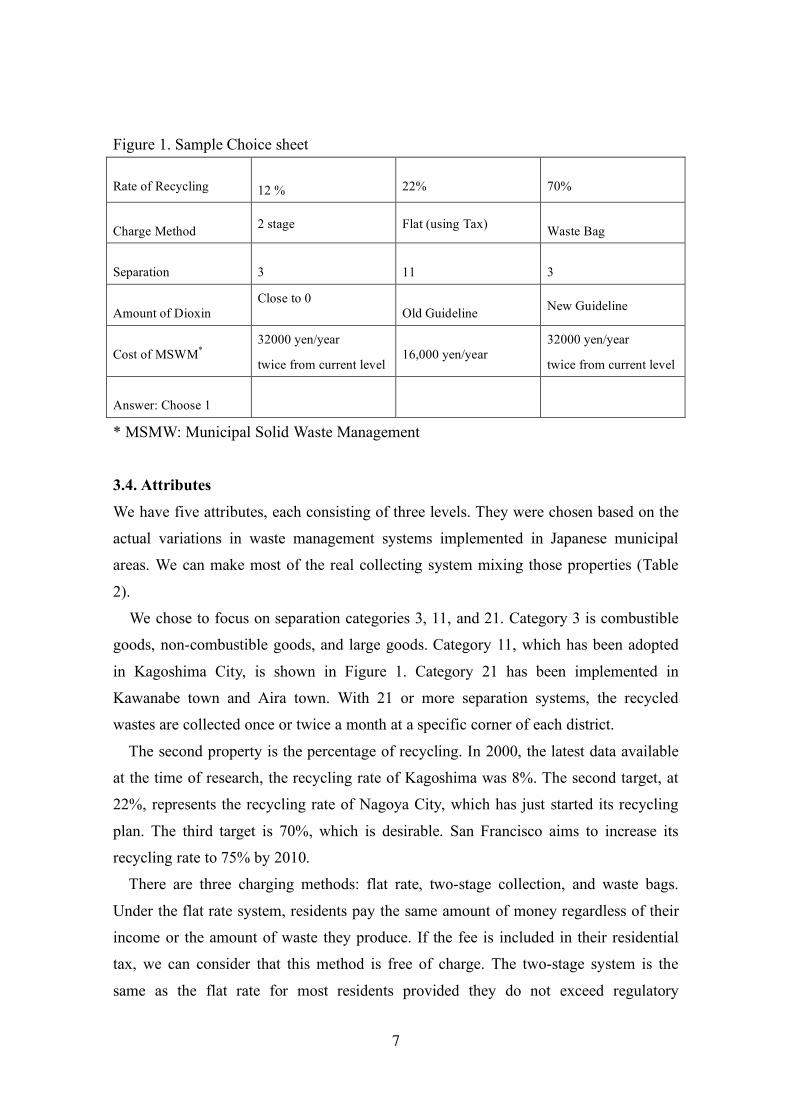
Figure 1. Sample Choice sheet
Rate of Recycling 12 % 22% 70%
Charge Method 2 stage Flat (using Tax)
Waste Bag
Separation 3 11 3
Amount of Dioxin Close to 0
Old Guideline New Guideline
Cost of MSWM* 32000 yen/year
twice from current level 16,000 yen/year
32000 yen/year
twice from current level
Answer: Choose 1
* MSMW: Municipal Solid Waste Management
3.4. Attributes
We have five attributes, each consisting of three levels. They were chosen based on the
actual variations in waste management systems implemented in Japanese municipal
areas. We can make most of the real collecting system mixing those properties (Table
2).
We chose to focus on separation categories 3, 11, and 21. Category 3 is combustible
goods, non-combustible goods, and large goods. Category 11, which has been adopted
in Kagoshima City, is shown in Figure 1. Category 21 has been implemented in
Kawanabe town and Aira town. With 21 or more separation systems, the recycled
wastes are collected once or twice a month at a specific corner of each district.
The second property is the percentage of recycling. In 2000, the latest data available
at the time of research, the recycling rate of Kagoshima was 8%. The second target, at
22%, represents the recycling rate of Nagoya City, which has just started its recycling
plan. The third target is 70%, which is desirable. San Francisco aims to increase its
recycling rate to 75% by 2010.
There are three charging methods: flat rate, two-stage collection, and waste bags.
Under the flat rate system, residents pay the same amount of money regardless of their
income or the amount of waste they produce. If the fee is included in their residential
tax, we can consider that this method is free of charge. The two-stage system is the
same as the flat rate for most residents provided they do not exceed regulatory
8
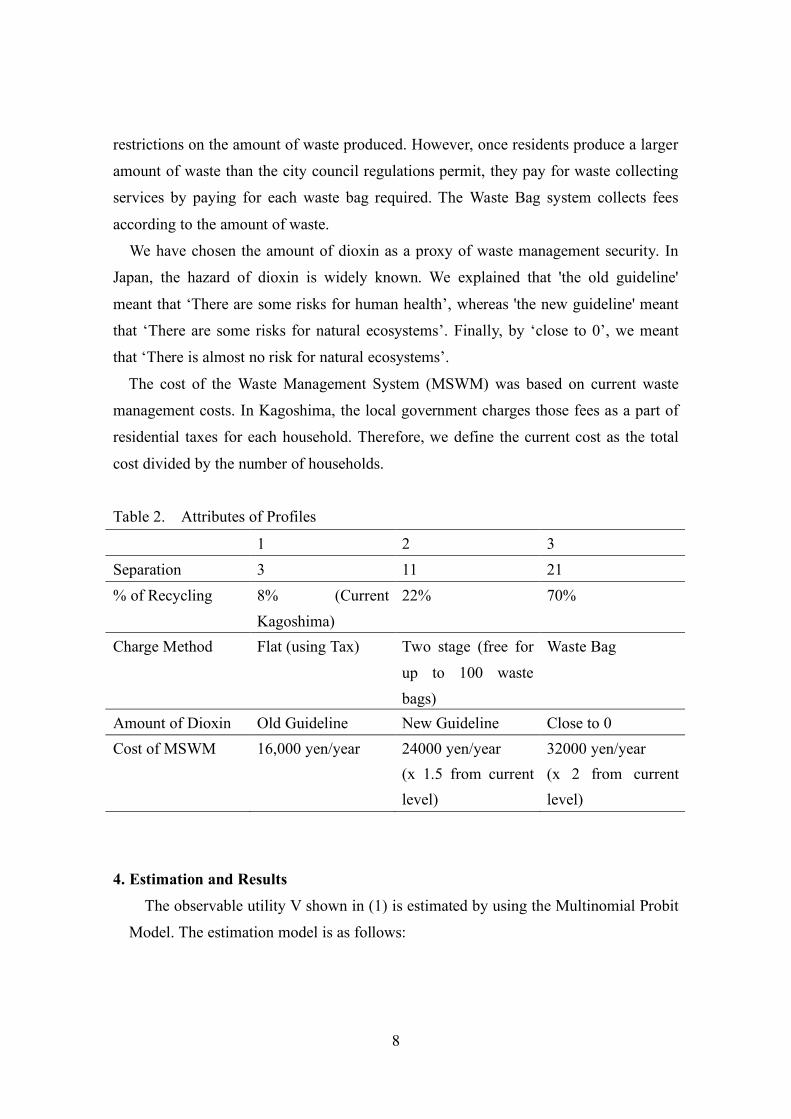
restrictions on the amount of waste produced. However, once residents produce a larger
amount of waste than the city council regulations permit, they pay for waste collecting
services by paying for each waste bag required. The Waste Bag system collects fees
according to the amount of waste.
We have chosen the amount of dioxin as a proxy of waste management security. In
Japan, the hazard of dioxin is widely known. We explained that 'the old guideline'
meant that ‘There are some risks for human health’, whereas 'the new guideline' meant
that ‘There are some risks for natural ecosystems’. Finally, by ‘close to 0’, we meant
that ‘There is almost no risk for natural ecosystems’.
The cost of the Waste Management System (MSWM) was based on current waste
management costs. In Kagoshima, the local government charges those fees as a part of
residential taxes for each household. Therefore, we define the current cost as the total
cost divided by the number of households.
Table 2. Attributes of Profiles
1 2 3
Separation 3 11 21
% of Recycling 8% (Current
Kagoshima)
22%
70%
Charge Method Flat (using Tax) Two stage (free for
up to 100 waste
bags)
Waste Bag
Amount of Dioxin Old Guideline New Guideline Close to 0
Cost of MSWM 16,000 yen/year 24000 yen/year
(x 1.5 from current
level)
32000 yen/year
(x 2 from current
level)
4. Estimation and Results
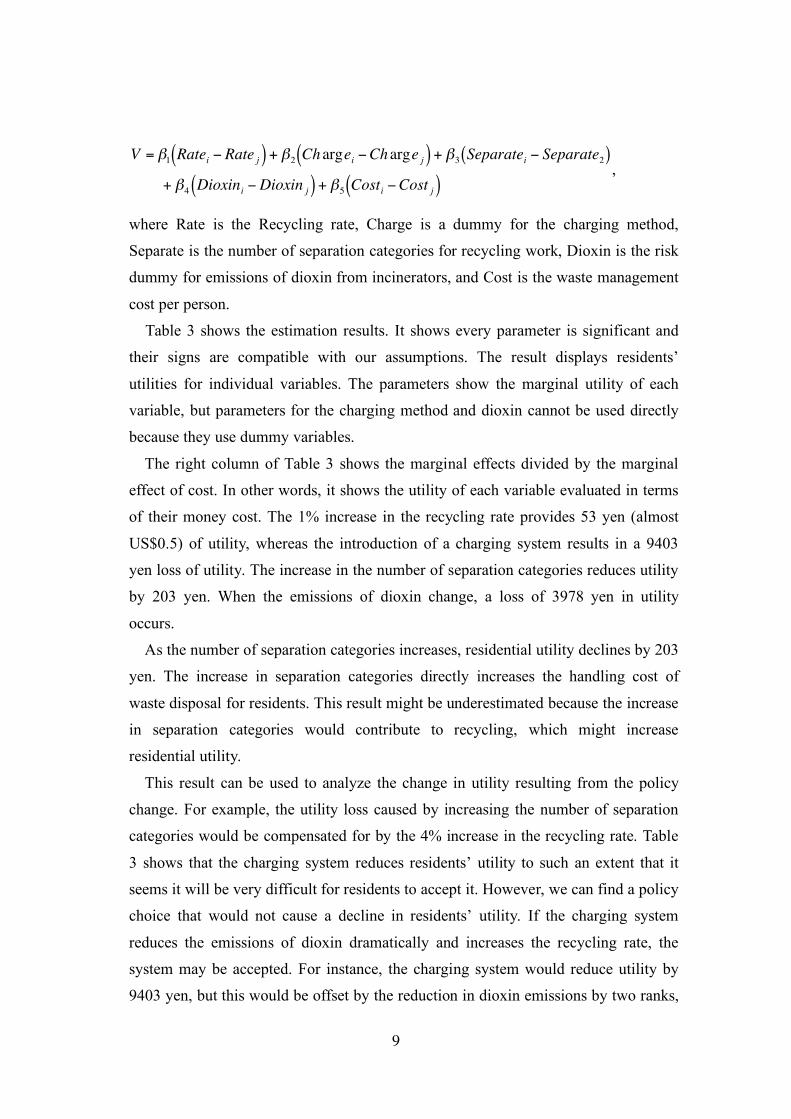
The observable utility V shown in (1) is estimated by using the Multinomial Probit
Model. The estimation model is as follows:
9
!
V = "1 Ratei # Rate j( ) + "2 Chargei #Charge j( ) + "3 Separatei # Separate2( )
+ "4 Dioxini #Dioxin j( ) + "5 Costi #Cost j( ),
where Rate is the Recycling rate, Charge is a dummy for the charging method,
Separate is the number of separation categories for recycling work, Dioxin is the risk
dummy for emissions of dioxin from incinerators, and Cost is the waste management
cost per person.
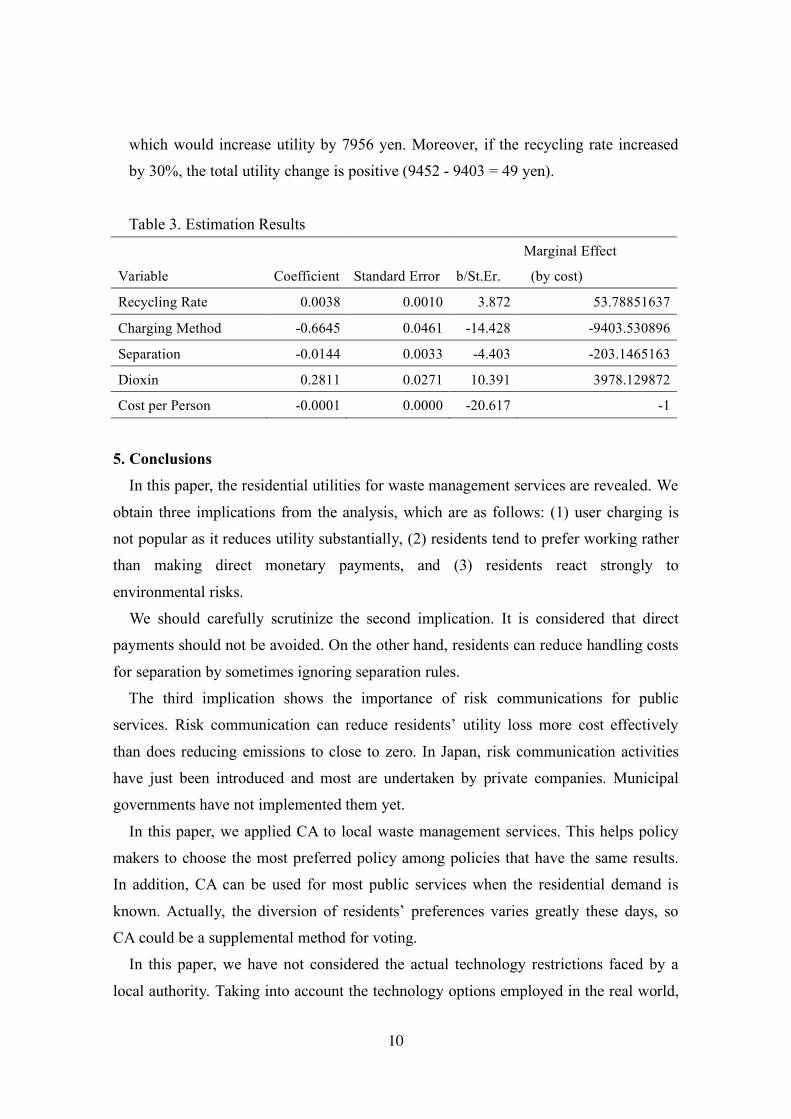
Table 3 shows the estimation results. It shows every parameter is significant and
their signs are compatible with our assumptions. The result displays residents’
utilities for individual variables. The parameters show the marginal utility of each
variable, but parameters for the charging method and dioxin cannot be used directly
because they use dummy variables.
The right column of Table 3 shows the marginal effects divided by the marginal
effect of cost. In other words, it shows the utility of each variable evaluated in terms
of their money cost. The 1% increase in the recycling rate provides 53 yen (almost
US$0.5) of utility, whereas the introduction of a charging system results in a 9403
yen loss of utility. The increase in the number of separation categories reduces utility
by 203 yen. When the emissions of dioxin change, a loss of 3978 yen in utility
occurs.
As the number of separation categories increases, residential utility declines by 203
yen. The increase in separation categories directly increases the handling cost of
waste disposal for residents. This result might be underestimated because the increase
in separation categories would contribute to recycling, which might increase
residential utility.
This result can be used to analyze the change in utility resulting from the policy
change. For example, the utility loss caused by increasing the number of separation
categories would be compensated for by the 4% increase in the recycling rate. Table
3 shows that the charging system reduces residents’ utility to such an extent that it
seems it will be very difficult for residents to accept it. However, we can find a policy
choice that would not cause a decline in residents’ utility. If the charging system
reduces the emissions of dioxin dramatically and increases the recycling rate, the
system may be accepted. For instance, the charging system would reduce utility by
9403 yen, but this would be offset by the reduction in dioxin emissions by two ranks,
10
which would increase utility by 7956 yen. Moreover, if the recycling rate increased
by 30%, the total utility change is positive (9452 - 9403 = 49 yen).
Table 3. Estimation Results
Variable Coefficient Standard Error b/St.Er.
Marginal Effect
(by cost)
Recycling Rate 0.0038 0.0010 3.872 53.78851637
Charging Method -0.6645 0.0461 -14.428 -9403.530896
Separation -0.0144 0.0033 -4.403 -203.1465163
Dioxin 0.2811 0.0271 10.391 3978.129872
Cost per Person -0.0001 0.0000 -20.617 -1
5. Conclusions
In this paper, the residential utilities for waste management services are revealed. We
obtain three implications from the analysis, which are as follows: (1) user charging is
not popular as it reduces utility substantially, (2) residents tend to prefer working rather
than making direct monetary payments, and (3) residents react strongly to
environmental risks.
We should carefully scrutinize the second implication. It is considered that direct
payments should not be avoided. On the other hand, residents can reduce handling costs
for separation by sometimes ignoring separation rules.
The third implication shows the importance of risk communications for public
services. Risk communication can reduce residents’ utility loss more cost effectively
than does reducing emissions to close to zero. In Japan, risk communication activities
have just been introduced and most are undertaken by private companies. Municipal
governments have not implemented them yet.
In this paper, we applied CA to local waste management services. This helps policy
makers to choose the most preferred policy among policies that have the same results.
In addition, CA can be used for most public services when the residential demand is
known. Actually, the diversion of residents’ preferences varies greatly these days, so
CA could be a supplemental method for voting.
In this paper, we have not considered the actual technology restrictions faced by a
local authority. Taking into account the technology options employed in the real world,
11
we can show the optimum and realistic waste management services corresponding to
residents’ preferences for each municipal government.
Acknowledgements
Financial Support from Grant-in-Aid for Scientific Research A(2) #16203020 Toward
Sustainable Improvement in Quality of Life: Theoretical and Statistical Analysis on
Policy Assessments
References
Actio, F., 1980. Evaluation of conjoint analysis results: a comparison of methods.
Journal of Marketing Research, 17, 106-12.
Bilbao, J. and Fernandez, A., 2004. The influences of quality and price on the demand
for urban transport: the case of university students. Transportation Research Part A
38, 607-614.
Green, E. and Srinivasan, V.,1990. Conjoint analysis in marketing: new developments
with implications for research and practice. Journal of Marketing Research, 54,
3-19.
Haefele, M. A. and Loomis, J. B., 2001. Using the Conjoint Analysis Technique for
the Estimation of Passive Use Values of Forest Health. Journal of Forest
Economics, 7(1), 27.
Hanemann, W. M., 1984. Welfare evaluations in contingent valuation experiments
with discrete responses. American Journal of Agricultural Economics, 66, 332-41.
Hensher, D. A., 1994. Stated Preference analysis of travel choices: the state of
practice. Transportation, 21, 107-33.
Lancaster, K., 1966. A new approach to consumer theory. Journal of Political
Economy, 74, 132-57.
Louviere, J. J., 1988. Conjoint analysis modeling of stated preferences: a review of
theory, methods, recent developments, and external validity. Journal of Transport
Economics and Policy, 20, 93-119.
Louviere, J. J., Hensher, D., and Swait, J., 2000. Stated Choice Methods.
Cambridge.
Luce, R.D. and Tukey, 1964. Simultaneous conjoint measurement: A new type of
fundamental measurement. Journal of Mathematical Psychology, 1, 1-27.
12
McFadden, D., 1973. Conditional Logit Analysis of Qualitative Choice Behavior.
University of California at Berkeley, California.
Sakata, Y., 2001. The estimation of waste emission functions. – From the data for
Kagoshima Prefecture. Keizaigaku Ronshu, Economic Society of Kagoshima
University, 55, 1-10 (in Japanese).
Sasao, T., 2002. Evaluating Impacts of Siting Landfill Based on Public Preferences.
Journal of the Japan Society of Waste Management Experts, Japan Society of Waste
Management Experts, 13(5), 325-333 (in Japanese).
Takeuchi, K., Kuriyama, K., and Washida, T., 1999. The effect of oil tanker accidents
to coastal ecosystems –the evaluation of conjoint analysis—. Chapter 2, 91-104, in
Washida, T., Kuriyama, K., and Takeuchi, K., Environmental evaluation workshop.
(Tsukiji shokan, in Japanese).
Tsuge, T., 2001. The Valuation of the Externalities of Forest on Citizen’s Preferences
and Possibility of Use in a Policy-Making: A Choice Experiment Study.
Environmental Science, Society of Environmental Science, Japan, 14(5), 465-476
(in Japanese).
Usui, T., 2003. Decomposing and Predicting the Price Elasticity of Demand for
Household Waste Disposal Service. Environmental Science, Society of
Environmental Science, Japan, 16(4), 271-290 (in Japanese).