an empirical investigation of the directivity of external...
TRANSCRIPT
An empirical investigation of the directivity of external industrial noise sources Master’s Thesis in the Master programme in Sound and Vibration J I M M Y D I A M A N D O P O U L O S J O N A S L A R S S O N Department of Civil and Environmental Engineering Division of Applied Acoustics Vibroacoustics Group CHALMERS UNIVERSITY OF TECHNOLOGY Göteborg, Sweden 2005 Examensarbete 2005:18

I
MASTER'S THESIS 2005:18
An empirical investigation of the directivityof external industrial noise sources
Jimmy DiamandopoulosJonas Larsson
Department of Civil and Environmental EngineeringDivision of Applied Acoustics
Vibroacoustics GroupCHALMERS UNIVERSITY OF TECHNOLOGY
Göteborg, Sweden 2005

II
An empirical investigation of the directivity of external industrial noise sources
© DIAMANDOPOULOS, JIMMY, 2005© LARSSON, JONAS, 2005
Master's Thesis 2005:18
Department of Civil and Environmental EngineeringDivision of Applied AcousticsVibroacoustics GroupChalmers University of TechnologySE-41296 GöteborgSweden
Tel. +46-(0)31 772 1000
Reproservice / Department of Civil and Environmental EngineeringGöteborg, Sweden 2005

III
An empirical investigation of the directivity of external industrial noise sourcesDIAMANDOPOULOS, JIMMYLARSSON, JONASDepartment of Civil and Environmental EngineeringDivision of Applied AcousticsVibroacoustics GroupChalmers University of Technology
AbstractThis thesis work deals with the directivity of external industrial noise sources. Thepurpose is to investigate the possibility of making measurements with considerationto the directivity of these types of sources, and using this knowledge as a basis forthe possibility of taking measures for reduction of sound pressure levels atspecified points of perception. The objectives are to illustrate the concept ofdirectivity and to show, by performing measurements on real sources, that there areactual differences when the directivity is regarded during measurements and when itis not. This will be shown empirically through measurements on a number oftypical external industrial noise sources and by an analysis based on the results fromthese measurements. A method for implementation of the measurements methodsdescribed in standards ISO 3744-2 [1] and DIN 45635-47 [2], relevant for this work,has also been developed within the extent of this project. It has, by the use ofempirical methods, been investigated that there are significant differences in theresults received without consideration of directivity and the result received when thedirectivity has been considered. Also, the method, developed by us for the purposeof making measurement (with regards to directivity) possible to implement inreality, worked as intended. Also, it has been shown that one, with the use ofsimplified methods, can perform measurements in only one direction and achievecorrect results, but without the knowledge of the directivity one looses theadvantages of redirecting the source.
Key words: outdoor sound propagation, directivity, industry noise, chimney, outlets.

IV

V
Acknowledgement
The thesis work has been performed at Ingemansson Technology AB in Göteborg, Swedenduring the period from September 2004 to January 2005.
First and foremost we would like to thank our supervisors and all of the personnel atIngemansson for their extended help and interest in the subject and for facilitating us at theircompany, making it possible for us carry out the project.
Thank you; Martin Almgren, Joseph Barsi, Peter Bengtsson, Sonny Berndtsson, Sven Tyrland,Pär Wigholm and the rest of you.
Extended thanks to Sven Tyrland, of Ingemansson in Örnsköldsvik, for the idea of the thesis workand abundant guidance throughout the course of the project.
Also, we would like to thank our supervisor Maarten Hornikx at Chalmers, department of AppliedAcoustics, for all his help and co-ordination of the project.
Thanks also to;
Kenth Andersson, Celero, Volvo LV, TuveMihkel Laks and Christer Drougge, Volvo PV, TorslandaPer Palmer, Klippan AB, MölndalLeif Svensson, Elmo Leather AB, Svenljunga
For giving us access to their roofs.

VI

VII
Contents
1 Introduction 1
2 Problem description 32.1 Directivity..............................................................................................................32.2 Determination of the emitted sound power and background levels .....................32.3 Objectives.............................................................................................................42.4 Method .................................................................................................................42.5 Limitations ............................................................................................................52.6 Typical noise sources...........................................................................................5
3 Description of measurements methods, SPL and software 73.1 Standard ISO 3744-2 [1] ......................................................................................7
3.1.1 Excerpts from Chapter 7.1 ...................................................................................................... 73.1.2 Excerpts from Chapter 7.2 ...................................................................................................... 73.1.3 Excerpts from Annex B:1 ........................................................................................................ 73.1.4 Main formulae, ISO 3744-2 [1], chapter 8; Calculation of surface sound pressure level and
sound power level................................................................................................................... 93.1.5 Annex E................................................................................................................................ 10
3.2 Standard DIN 45635-47 [2] ................................................................................113.2.1 Excerpts from DIN 45635-1 [4].............................................................................................. 113.2.2 Descriptive pictures and formulae from DIN 45635-47 [2] ..................................................... 11
3.3 Modified method.................................................................................................133.4 The consultants method.....................................................................................143.5 Standard ISO 9613-2 [3] ....................................................................................14
3.5.1 Excerpts from chapter 6........................................................................................................ 143.6 Software .............................................................................................................15
3.6.1 Software characteristics and function [5]............................................................................... 153.6.2 SoundPLAN® and Industry noise [5]...................................................................................... 15
4 Instrument listing 174.1 Instruments used during the measurement phase.............................................174.2 Software .............................................................................................................17
5 Measurements 195.1 Execution of the practical measurement methods .............................................195.2 Evaluation of the practical measurement methods ............................................20
5.2.1 Projection of measurement points onto the ground (roof)...................................................... 205.2.2 Measuring with fixed measurement radius and calculated angles ......................................... 21
5.3 Background noise ..............................................................................................23
6 Calculations & Analysis 256.1 Calculations made in Matlab® ............................................................................256.2 Calculations according to ISO 3744-2 [1] ..........................................................256.3 Interpolation for directivity indices used in SoundPLAN®...................................256.4 Analysis in SoundPLAN® ...................................................................................26
6.4.1 Different sound power level definitions within the calculation data......................................... 26

VIII
7 Results 297.1 Results from measurements ..............................................................................29
7.1.1 Example of a high source with small radius, Source 11......................................................... 307.1.2 Example of a high source with large radius, Source 7........................................................... 327.1.3 Example of a low source....................................................................................................... 347.1.4 Example of directivity plots.................................................................................................... 36
7.2 Results from analysis .........................................................................................38
8 Discussion 438.1 Measurements....................................................................................................43
8.1.1 Determination of sound power levels .................................................................................... 438.1.2 Determination of directivity.................................................................................................... 448.1.3 Sources which were not selected for further analysis............................................................ 45
8.2 Calculations in SoundPLAN® ............................................................................458.2.1 Differences between source definitions, with and without consideration of directivity ............ 458.2.2 Benefits of a redirection of the source?................................................................................. 45
8.3 Problems with standardized measurements in real life......................................498.3.1 Background noise measurements......................................................................................... 498.3.2 Measurement positions......................................................................................................... 49
9 Conclusions & Recommendations 51
10 Improvements and proposed further work 53
11 References 55
Appendix 1 Measurement data and results
Appendix 2 Matlab® programs
Appendix 3 Results from analysis in SoundPLAN®

1
1 Introduction
In today’s society there is an increasing demand for more silent industries. The thresholds for themaximum levels regarding noise from industries are lowered more frequently than before and associeties and cities spread, the industries, previously unaffected by these demands, will need toadjust to these new urbanized locations. For industries that, for example, are forced to increasethe activity with a night shift (due to internal reasons such as production rate etc) there areseveral requirements to be fulfilled and extensive noise reduction measures to be taken beforethe demands for such an increase are satisfied. Environmental noise impact assessments andsurveys for industries1 have to be undertaken in order to locate the critical noise sources withinthe industry to recommend measures of noise reduction to levels satisfying the requirements.These measures are in most cases very expensive and therefore knowledge of the most cost-efficient measures is important.
In ENASI done today, the sound pressure level of a noise source is usually only measured at onepoint which is thought to give the right sound power level for calculations of the total soundpressure level at a point of perception. This sound power level can however differ from the soundpower level gained by measurements performed on the recommendations in standards ISO3744-2 [1] or DIN 45635-47 [2]. Sound power levels gained from standardized measurements arecertainly the most correct (source descriptive), despite the fact that consideration to the levels atspecified points of perception are not included in these standards. Therefore, the practicalmethods used by consultants today are probably the most useful methods available for thispurpose, since they are simplified methods giving accurate results and are more time efficientthen the other methods investigated within this thesis work. Another benefit with the use of thismethod is that it considers the directivity of the source already at the stage where a measurementpoint is selected.
How can the sound power levels measured according to recent standards be less correct thanthe sound power levels gained from the more simplified measurements performed byconsultants?Because of the fact that most sources have directive behavior to a certain extent, the soundpower level (gained by the use of the consultants method) depends on the location of themeasurement point in which the measurement has been performed.
According to ISO 3744-2 [1], one measures over a surface and retrieves the average soundpressure level, however information about the directive properties of the source is unknown. Ifone instead measures in a point giving the suitable sound power level for later calculations ofsound pressure levels at specified receiver points, then that sound power level will be correct forthese specific calculations while maybe not representing the true radiated sound power level fromthe source itself. If one instead uses the recommendation in Appendix E, ISO 3744-2 [1],information about the sound power level radiated from the source and a correction term in form ofa directivity index can easily be evaluated. With knowledge about the source directivity one has(an advantage and) a possibility for later considerations of noise reduction measures. Forexample, by simple alterations of the source direction one can in some cases end up with much
1 In this report called ENASI from now on.

2
lower sound pressure levels at the specified points of perception. This is a cheap and simplemeasure that can be used with the condition that one allows for higher noise levels in thedirection which the source is heading after the interference. With the practical methods usedtoday (the consultants method), the possibility of using this simple measure is lost because thesound power level is only calculated from measurements performed in one measurement point,representing the sound power level and directivity by which the source affects the receiver pointin question. Also, a measurement based on standardized methods would lack this opportunity, ifthe formulae in Appendix E in ISO 3744-2 [1] were not used.
Figure 1 Example of a sound map made in an ENASI for anindustrial plant.
Receiver point
3
2 Problem description
2.1 Directivity
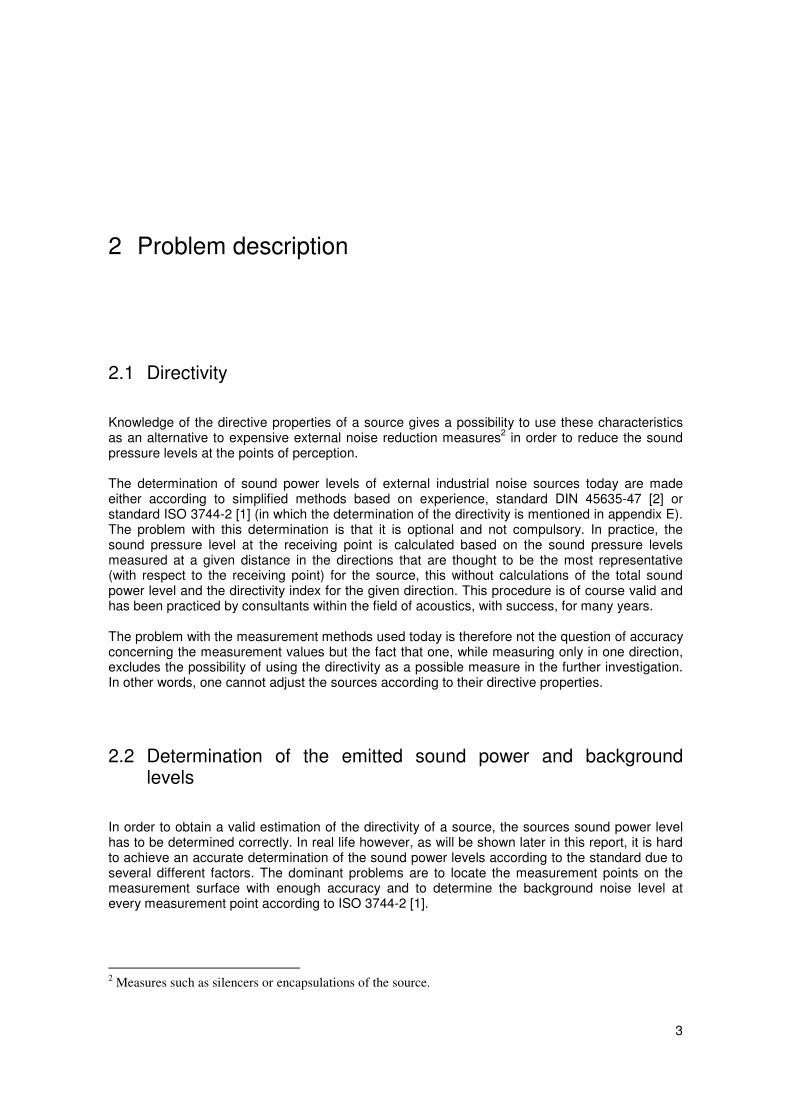
Knowledge of the directive properties of a source gives a possibility to use these characteristicsas an alternative to expensive external noise reduction measures2 in order to reduce the soundpressure levels at the points of perception.
The determination of sound power levels of external industrial noise sources today are madeeither according to simplified methods based on experience, standard DIN 45635-47 [2] orstandard ISO 3744-2 [1] (in which the determination of the directivity is mentioned in appendix E).The problem with this determination is that it is optional and not compulsory. In practice, thesound pressure level at the receiving point is calculated based on the sound pressure levelsmeasured at a given distance in the directions that are thought to be the most representative(with respect to the receiving point) for the source, this without calculations of the total soundpower level and the directivity index for the given direction. This procedure is of course valid andhas been practiced by consultants within the field of acoustics, with success, for many years.
The problem with the measurement methods used today is therefore not the question of accuracyconcerning the measurement values but the fact that one, while measuring only in one direction,excludes the possibility of using the directivity as a possible measure in the further investigation.In other words, one cannot adjust the sources according to their directive properties.
2.2 Determination of the emitted sound power and backgroundlevels
In order to obtain a valid estimation of the directivity of a source, the sources sound power levelhas to be determined correctly. In real life however, as will be shown later in this report, it is hardto achieve an accurate determination of the sound power levels according to the standard due toseveral different factors. The dominant problems are to locate the measurement points on themeasurement surface with enough accuracy and to determine the background noise level atevery measurement point according to ISO 3744-2 [1].
2 Measures such as silencers or encapsulations of the source.

4
Figure 2 Typical environment on roofs of industries
2.3 Objectives
To empirically, with the aid of current standards for the determination of sound power levels ofexternal industrial noise sources, corroborate the influence of directivity on the results calculatedfor sound pressure levels at specified receiver points, and thereby investigating the validity of thepractical estimations of the sound power levels used today (While performing measurements anddeterminations of emission values from external industrial noise sources).
2.4 Method
To reach the objectives, following will be done:
• A study on how the calculation from measurements of the radiated sound power from thesources affects the sound pressure levels at different points of perception, and how one canaffect these results by knowing and using the directive behavior of the source;
• A comparison between the modified method (see chapter 3.3), the consultants method, andthe measurement methods according to standard, DIN 45635-47 [2];
• Development of a measurement method intended for making the current standards possibleto implement in real life surroundings;

5
2.5 Limitations
This work has been limited to:
• External industrial noise sources (air outlets with fans mounted below the roof-level3).
• Empirical investigations based on measurements.
• Measurements according to ISO 3744-2 [1] and DIN 45635-47 [2] and methods based onthese standards.
2.6 Typical noise sources
The sources studied within this work are all quite typical external industrial noise sources andhave been selected in congruence with the limitations in chapter 2.5. They are exclusively airoutlets. Pictures of three randomly selected sources are shown below; figure 3, figure 4 andfigure 5.
Figure 3 Figure 4 Figure 5
3 With two exceptions; source no. 1 and source no.18 (see Table 1)
6
Presented below (Table 1) is a descriptive list of all investigated sources within the thesis, innumerical order. High source means that the measurement sphere envelops the peripheral outletof the source. Low source means that the measurement sphere cannot entirely envelop theperipheral outlet of the source. Large radius equals 2 meters. Small radius equals 1 meter.
Source no Location Height/radius Type
Source 1 Volvo LV High source, large radius Outlet, fan above roofSource 2 Volvo LV High source, small radius Outlet
Source 3 Volvo LV High source, small radius Outlet
Source 4 Volvo LV High source, small radius Outlet
Source 5 Volvo PV High source, large radius Outlet
Source 6 Volvo PV High source, large radius Outlet
Source 7 Volvo PV High source, large radius Outlet
Source 8 Volvo PV High source, large radius Outlet
Source 9 Volvo PV High source, small radius Outlet
Source 10 Volvo PV High source, small radius Outlet
Source 11 Volvo PV High source, small radius Outlet
Source 12 Volvo LV Low source Outlet
Source 13 Volvo PV Low source Outlet
Source 14 Volvo PV Low source Outlet
Source 15 Elmo Calf Low source Outlet
Source 16 Elmo Calf Low source Outlet
Source 17 Klippan AB High source, small radius Outlet
Source 18 Klippan AB High source, small radius Outlet, fan above roof
Table 1 Source name, location, and type.

7
3 Description of measurement methods, SPL andsoftware
The literature review consists of studies of the standards used in this thesis and the methodsused for practical measurements on the type of sources under study. The standards are ISO3744-2 [1] and DIN 45635-47 [2]; ISO 9613-2 [3] is used for calculations of sound propagation tothe receiving points. A method called the modified method, which is based on an interpretation ofISO 3744-2 [1], and the consultants method is also described in this chapter.
3.1 Standard ISO 3744-2 [1]
This International Standard specifies a method for measuring the sound pressure levels on ameasurement surface enveloping the source, and for calculating the sound power level producedby the source. The following text and figures are mainly excerpts from the standard.
3.1.1 Excerpts from Chapter 7.1
To facilitate the location of the microphone positions on the measurement surface, a hypotheticalreference box shall be defined (see fig 3). When defining the dimensions of this reference box,elements protruding from the source which are not significant radiators of sound energy may bedisregarded. The microphone positions lie on the measurement surface, a hypothetical surface ofarea S that envelops the source as well as the reference box and terminates on the reflectingplane(s). The location of the source under test, the measurement surface and the microphonepositions are defined by a co-ordinate system with the horizontal axes x and y in the groundparallel to the length and width of the reference box.
3.1.2 Excerpts from Chapter 7.2
The hemispherical measurement surface shall be centered in the middle of the reference boxconsisting of the reference box and its images in the adjoining reflecting planes. The radius, r, ofthe hemisphere shall be equal to or greater than twice the characteristic source dimension, d0,and not less than 1 m.
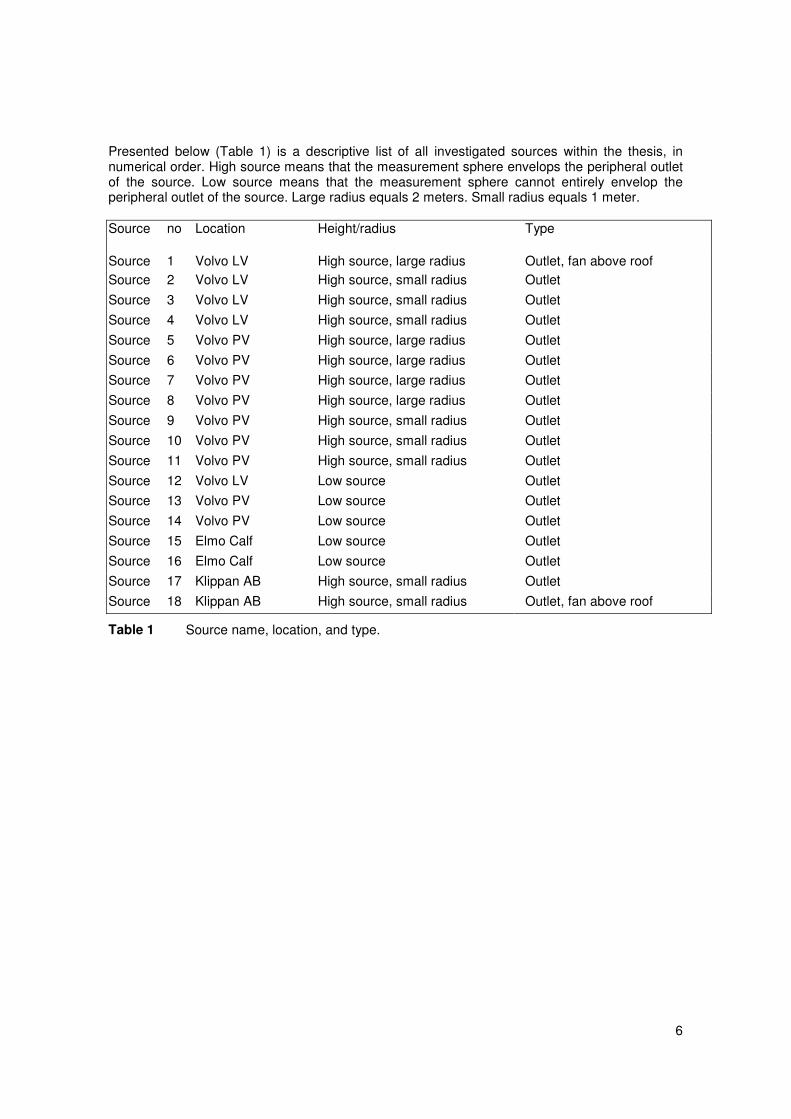
3.1.3 Excerpts from Annex B:1
Ten key microphone positions associated with equal areas of the measurement surface arenumbered 1 to 10 in figure B.1, and their co-ordinates according to the co-ordinate system
8
defined in 7.1 are listed in table B.1. Ten additional microphone positions are numbered 11 to 20in figure B.2 and their co-ordinates are also listed in table B.1.
Figure 6 Picture from appendix B:1 [1] Table 2 Picture from appendix B:1

9
3.1.4 Main formulae, ISO 3744-2 [1], chapter 8; Calculation of surface sound pressurelevel and sound power level.
The sound pressure level averaged over the surface is calculated using equation (1) and (2), (4)and (5) in ISO 3744-2 [1]
dB101
lg10´1
´1,0
= =
N
i
Lp
pi
NL (1)
dB101
lg10´´1
´´1,0
= =
N
i
Lp
pi
NL (2)
pL´ is the sound pressure level averaged over the measurement surface in decibels, with the
source under test operation;
pL´´is the sound pressure of the background noise level averaged over the measurementsurface in decibels;
piL´is the sound pressure level measured at the ith microphone position, in decibels;
piL´´is the sound pressure level on the background noise measured at the ith microphoneposition, in decibels;
N is the number of microphone positions.
Note; the averaging procedure in equation (1) and (2) is based on uniform distribution of themicrophone positions on the measurement surface
The sound power level is calculated using equation (3), (9) in ISO 3744-2 [1]
dB)lg(100S
SLL pfw += (3)
Where
S is the area of the measurement surface, in square meters;
S0 = 1 m2
pfLis the sound pressure level averaged over the measurement surface corrected for
surroundings and background noise

10
3.1.5 Annex E
The directivity in the direction of microphone position i, DIi, in decibels, is defined for ahemispherical measurement surface by the following equation:
•• −= pipii LLDI (4)
Where; •piL is the sound pressure level at the microphone position i, corrected for background
noise;
•piL is the sound pressure level averaged over the measurement surface, corrected for
background noise.
11
3.2 Standard DIN 45635-47 [2]
3.2.1 Excerpts from DIN 45635-1 [4]
This standard is applicable to industrial noise sources such as equipment, machines, machinecomponents, sub –assemblies and plant, which are referred to in this standard as machines.
The principal noise emission parameter is the sound power level. The sound power is the soundenergy passing in unit time trough a surface enveloping the machine. This standard describes thebasic method for determining the sound power level of a machine with the aid of the envelopingsurface method.
Background noise is any noise which is not generated by the machine under test or which isdirectly radiated by attached components that do not belong to the object under test.
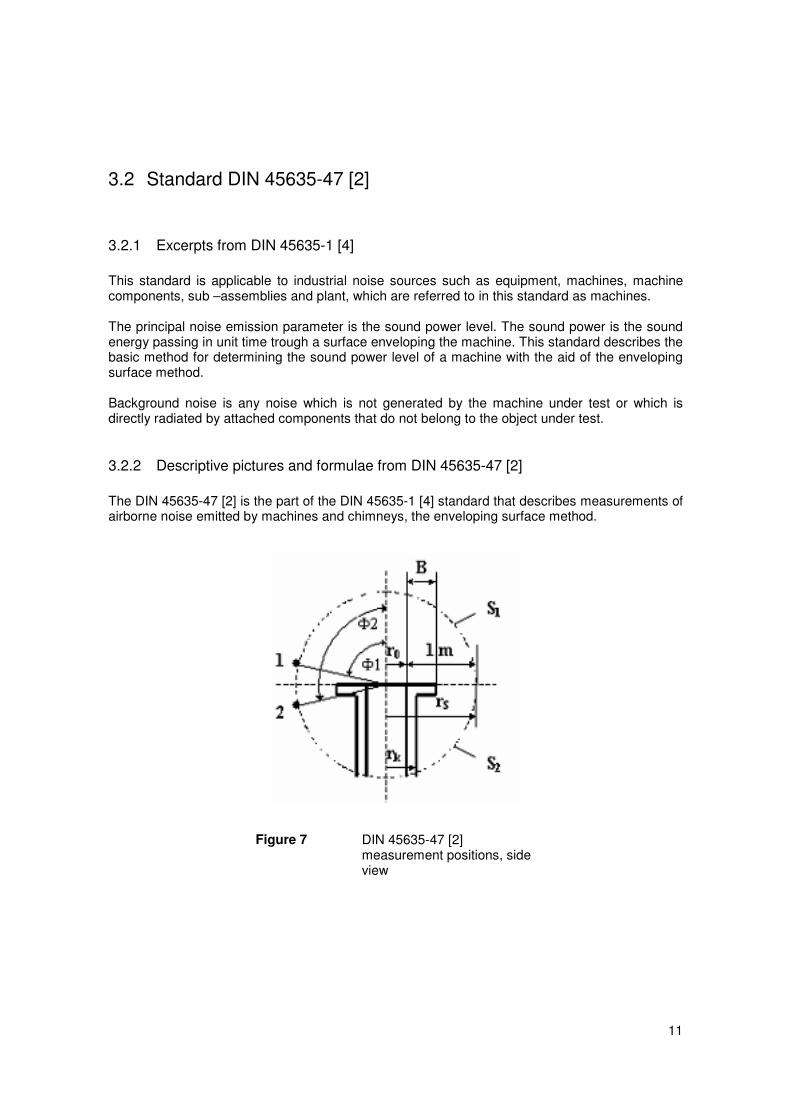
3.2.2 Descriptive pictures and formulae from DIN 45635-47 [2]
The DIN 45635-47 [2] is the part of the DIN 45635-1 [4] standard that describes measurements ofairborne noise emitted by machines and chimneys, the enveloping surface method.
Figure 7 DIN 45635-47 [2]measurement positions, sideview
12
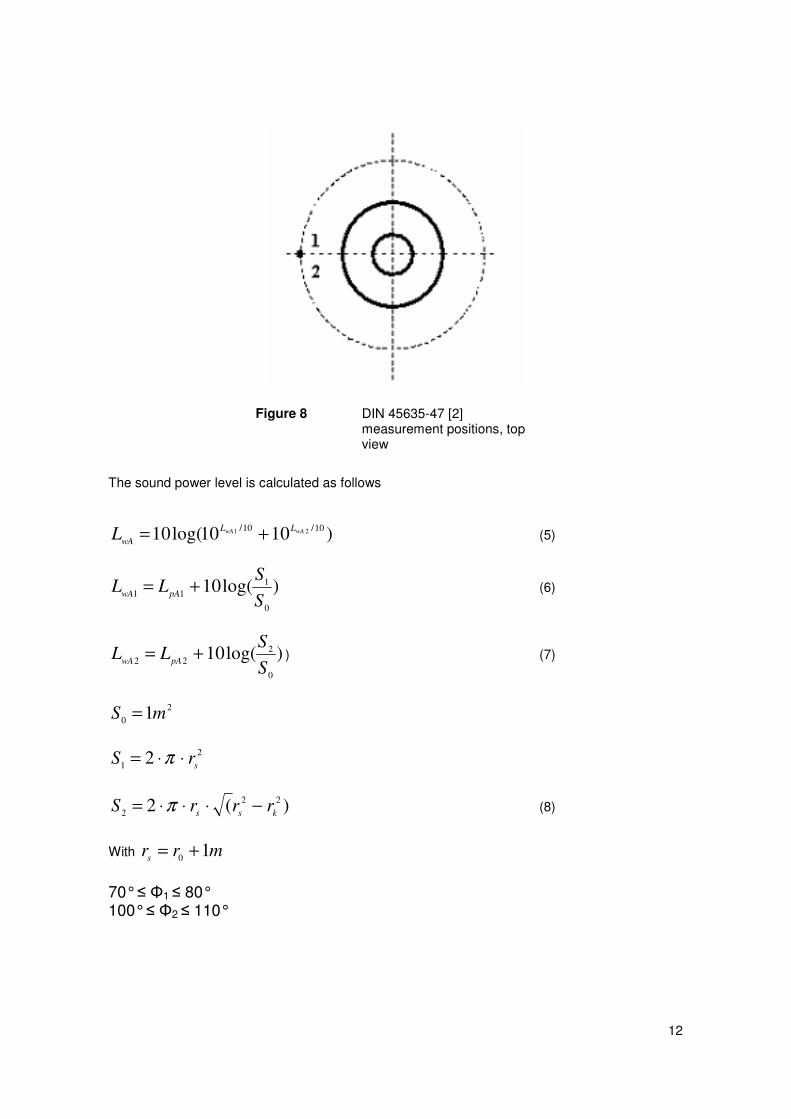
Figure 8 DIN 45635-47 [2]measurement positions, topview
The sound power level is calculated as follows
)1010log(10 10/10/ 21 wAwA LL
wAL += (5)
)log(100
111 S
SLL pAwA += (6)
)log(100
222 S
SLL pAwA += ) (7)
2
0 1mS =
2
1 2 srS ⋅⋅= π
)(2 22
2 kss rrrS −⋅⋅⋅= π (8)
With mrrs 10 +=
70° 1 80°100° 2 110°
13
3.3 Modified method
The method we call “the modified method” in this report is a method based on the methoddescribed in the ISO 3744-2 [1]. In order to perform measurements on the type of sourcesinvestigated in this thesis work, certain adjustments to the standardized method had to be made.
The modified method is based on the following items:
• Spherical measurement surface• Sphere centered in the middle of the source at the peripheral outlet• 10 evenly distributed points on the spherical surface representing equal areas• Background noise levels estimated from measurements and levels of surrounding
sources• Instrument set-up according to ISO 3744-2 [1]
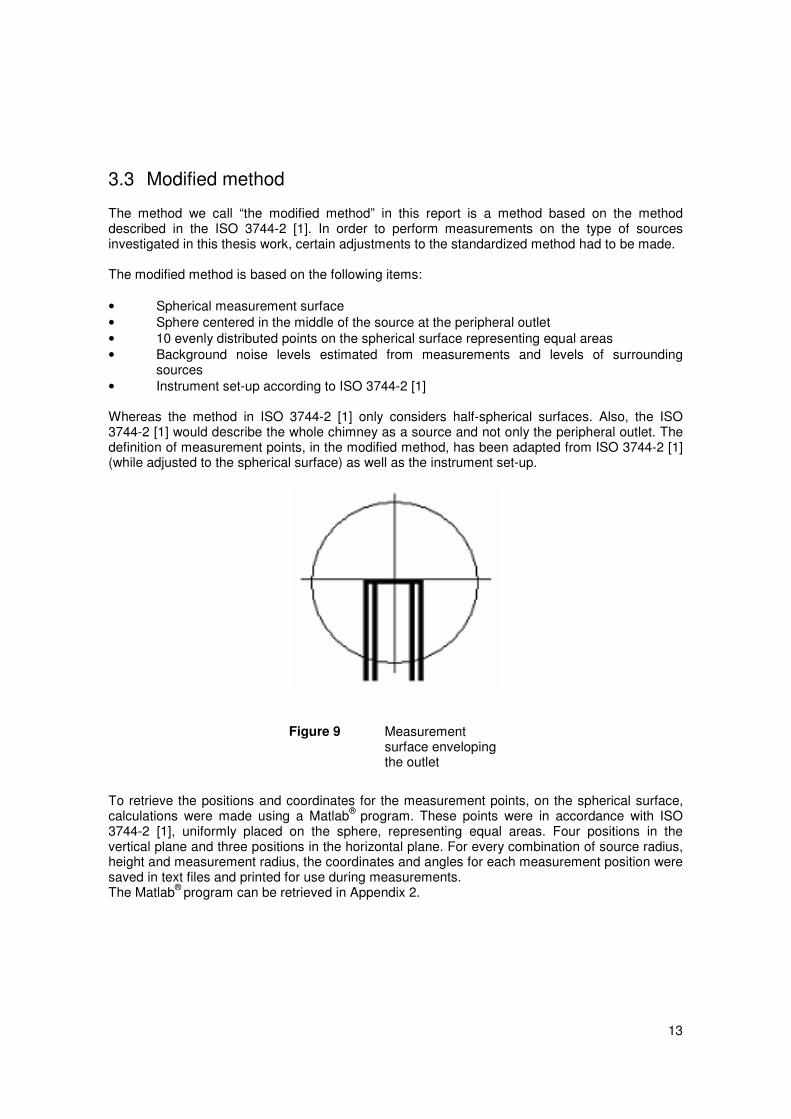
Whereas the method in ISO 3744-2 [1] only considers half-spherical surfaces. Also, the ISO3744-2 [1] would describe the whole chimney as a source and not only the peripheral outlet. Thedefinition of measurement points, in the modified method, has been adapted from ISO 3744-2 [1](while adjusted to the spherical surface) as well as the instrument set-up.
Figure 9 Measurementsurface envelopingthe outlet
To retrieve the positions and coordinates for the measurement points, on the spherical surface,calculations were made using a Matlab® program. These points were in accordance with ISO3744-2 [1], uniformly placed on the sphere, representing equal areas. Four positions in thevertical plane and three positions in the horizontal plane. For every combination of source radius,height and measurement radius, the coordinates and angles for each measurement position weresaved in text files and printed for use during measurements.The Matlab® program can be retrieved in Appendix 2.
14
3.4 The consultants method
After a number of conversations with the supervisors and consultants at IngemanssonTechnology AB, it is clear that the method used by consultants today is based on experience. Themethod is based on ISO 3744-2 [1] but is also a simplified version where the directive behavior ofa source is considered as early as when the choice of measurement position is made. The objectof their interest is to determine the source contribution to specified points of perception and notnecessarily to determine the true sound power level from the source.
The consultants method is based on the following items:
• The sound pressure level is usually measured at a distance of one meter• Measurements in an appropriate direction to retrieve the source contribution to specified
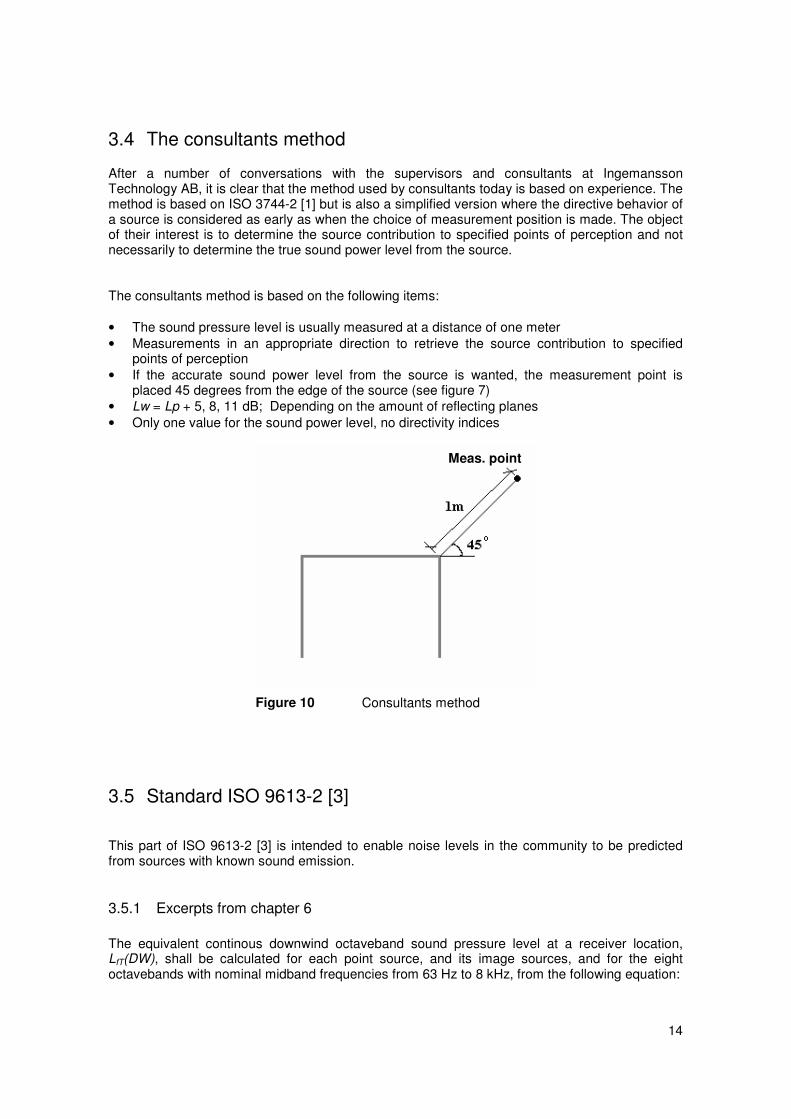
points of perception• If the accurate sound power level from the source is wanted, the measurement point is
placed 45 degrees from the edge of the source (see figure 7)• Lw = Lp + 5, 8, 11 dB; Depending on the amount of reflecting planes• Only one value for the sound power level, no directivity indices
Figure 10 Consultants method
3.5 Standard ISO 9613-2 [3]
This part of ISO 9613-2 [3] is intended to enable noise levels in the community to be predictedfrom sources with known sound emission.
3.5.1 Excerpts from chapter 6
The equivalent continous downwind octaveband sound pressure level at a receiver location,LfT(DW), shall be calculated for each point source, and its image sources, and for the eightoctavebands with nominal midband frequencies from 63 Hz to 8 kHz, from the following equation:
Meas. point

15
ADLDWL CwfT −+=)( (9)
Where;
WL is the octaveband sound power level, in decibels, produced by the point sound source
relative to a reference sound power of one picowatt (1pW);
CD is the directivity correction, in decibels, that describes the extent by which the equivalent
continuous sound pressure level from the point sound source deviates in a specifieddirection from the level of an omnidirectional point sound source producing sound powerlevel LW; DC equals the directivity index D1 of the point sound source plus an index DΩthat accounts for sound propagation into solid angles less than 4π radians; for anomnidirectional point sound source radiating into free space, DC = 0 dB.
A is the octaveband attenuation, in decibels, that occurs during propagation from the pointsound source to the receiver.
3.6 Software
3.6.1 Software characteristics and function [5]
SoundPLAN® uses a sector method. Starting from the receiver, search “rays” scan the geometryfor sources, reflections, screens and geometry modifying the ground attenuation. The scanningrays use a constant increment angle of 1 degree. This is a default setting but one can choose anyincrement. A search triangle is in fact a more accurate description than a search ray. As onesearch triangle adjoins another, the search triangles cover the entire ground around the receiver,whereas a set of rays would miss the components between rays. When SoundPLAN® finds asource in the search direction; it automatically calculates the part of the source contained in thesearch triangle and processes that partial source contribution.
3.6.2 SoundPLAN® and Industry noise [5]
The SoundPLAN® parameter menu offers six different choices for calculations of frequencydependent industry noise. In this work, only the ISO 9613-2 [3] is considered. The ISO 9613-2 [3]does not supply different formulas for different frequencies and can therefore be used for anyfrequency.

16
17
4 Instrument listing
The following instruments have been used during the thesis work.
4.1 Instruments used during the measurement phase
• Norsonic real time octaveband analyzer, type 114.• Norsonic real time octaveband analyzer, type 118.• B&K microphone calibrator, type 4231• B&K microphone holder• Extension chords• Mast• Measuring tape• Nicon Coolpix digital camera, type 3200.• Device for measuring with constant measurement radius• Adhesive tape
Instruments are calibrated with traceability to national and international references following thequality system at Ingemansson Technology AB, which fulfils the requirements in SS-EN ISO/IEC17025.
4.2 Software
• SoundPLAN®; SoundPLAN® LLC, Braunstein + Berndt GmbH• Matlab®; Mathworks corporation

18
19
5 Measurements
In this chapter, two different implementations of the modified method are described, performedand evaluated. For the DIN 45635-47 [2] method and the consultants method, the points aremeasured using our device (see Figure 12). A description of how the considerations ofbackground noise have been taken is also included in the chapter. In order to implement themodified method, in other words measure with the help of fixed points on a known surface,practical methods for doing so have been developed. Two different methods were evaluated. Thefirst method was based on the projection of the measurement points onto the ground (roof) andwith the aid of an adjustable mast locating the points along the z-axis. For the second method, afixed measurement radius together with calculated angles for the positioning in the vertical planewas used.
All measurements were performed according to the prerequisites in chapter 2 and according tothe methods and standards described in chapter 3. The sources measured during this thesis workwere located at the roofs of four different industries situated in the Gothenburg area (see Table1).
5.1 Execution of the practical measurement methods
The method of projecting the measurement points onto the ground (roof) consisted of a numberof steps. First, the positions were projected onto the ground (roof), after a correction was madefor the source height and for eventual slope of the ground (roof), and marked around the source.After the marking was done, the microphone was attached to the mast with the help of amicrophone holder and an extension cable. The measurements started from below with the firstthree positions in the xy-plane for the first z-coordinate and then continued upwards along the z-axis. Leq was measured in each point over a period of 30 seconds, the minimum period timeaccording to ISO 3744-2 [1]. The average total measurement time per source was approximately30 minutes.
The method that involves the use of our device for measurements with fixed radius and varyingangle proved to be easier and less time consuming to use in practice. The tables of positioncoordinates (see chapter 5.4.3) were used here. With the help of these tables and a compass, forlocation of the four cardinal points, the measurements proceeded as for the former method. Thevertical angle4 was set according to the table and then altered accordingly along the z-axis. Leq
was measured in each point over a period of 30 seconds, the minimum period time according toISO 3744-2 [1]. The average total measurement time per source was approximately 15 minutes.
4 Angle starting from 0 degrees (above the source), ending at 180 degrees (under the source)

20
5.2 Evaluation of the practical measurement methods
5.2.1 Projection of measurement points onto the ground (roof)
Preparations
As previously mentioned (see chapter 3.3), the positions of the measurement points werecalculated so that they represented equal areas. A spherical surface (see chapter 3.3) was usedas measurement surface (figure 11). The larger measurement radius was needed here since themeasurement points were projected onto the ground (roof) and therefore a smaller surface woulddemand a higher degree of precision while marking the positions. This would be difficult toachieve for this type of measurement. On the other hand, despite the size of the measurementsphere chosen, one realized that almost perfect conditions would have to exist whenmeasurements were to be performed even for the indication of the larger sphere to be precise.Ideally, the source would have to be solitarily placed on a smooth and leveled surface with noobstacles present in its surrounding.
Figure 11 Measurement positions calculated and plotted for ahigh source in YZ plane
Performance
The implementation of the method turned out to be very unpractical and the measurements weretime consuming with a total measurement time per source almost exceeding 30 minutes.Unpractical was also the fact that it was very hard to achieve a satisfactory degree of precisionwhile trying to measure in the right points on the sphere, especially at the points situated on thetwo highest horizontal levels (points 4-9). Measuring point no 10 (above the source (0; 0; z)) was
21
practically impossible if any kind of precision was to be taken into account. The determination ofthe sound power level radiated from the source was dependent on all measurement points andwould thereby become afflicted with error if the measurements themselves were afflicted witherrors. Clearly, when it came to the problems with nearby sources and the surface properties inthe vicinity of the source, a smaller measurement surface would be preferred. With that, theearlier foreseen problems with the precision during the preparations were substantiated at thisstage.
Conclusions
One can, with certainty, draw the conclusion that this implementation of the modified method inthis case is not practically viable, except maybe under ideal circumstances. Also, themeasurement time for this implementation is very long, which (probably) is not preferred in thecase for most consultants companies whose interests are other than purely educational. Themethod at hand did not function desirably for our purposes and therefore another method had tobe developed.
5.2.2 Measuring with fixed measurement radius and calculated angles
Preparations
If measurements with fixed measurement radius and calculated angles were to be possible toperform, a special device had to be used (figure 12, figure 13). Since such a device (or similar toit) to our knowledge does not exist on the market, it had to be designed and constructed. Thedevice consists of jointed aluminum profiles and a scale, displaying angles from 0 to 180 degreesand allows for angle adjustments for desired angles from the source. The device also allows formasts of different sizes to be attached to the profiles of which it consists. Adjustments for sourceradius, measurement radius and angle from source had to be set before measurements weremade.
Performance
The source radius was first to be determined on site; the radius decided the length of the mastattached to the profile, which represented the microphone holder attachment. The measurementsurface (sphere) was previously determined; the length of the radius of the sphere was set ontothe adjustable profile representing the measurement radius. The height of the source laterdetermined the height of the handheld mast, which was to be perpendicular to the ground (roof)at all time. The measurements were performed at four different levels along the z-axis. Theangles for the different levels (zero degrees straight up from the source (point no. 10)) werecalculated in advance using a Matlab® program written for this purpose (see Appendix 2). Thismethod turned out to be more practical and the measurements were less time consuming than forthe previous method.
Conclusions
There were a number of advantages using of this method in comparison to the method previouslydescribed (see chapter 5.2.1). Obstacles on the ground (roof) surrounding the source constitutedno problem since one could easily adjust the height of the handheld mast at will, as long as itstayed perpendicular to the ground (roof). The sway problem was also reduced due to the flapconstructed for the purpose of bracing the rig against the edge of the source. As a consequenceof that brace, the precision increased considerably. The total measuring time was also reducedbecause the positions of the measurement points did not have to be considered duringpreparations, knowledge of the cardinal points and the directions in which the measurementpoints should be located was enough.

22
Figure 12 Our device, schematicpicture.
Figure 13 Our device, operation
Figure 14 Our device, practical operation.

23
5.3 Background noise
According to ISO 3744-2 [1], the background noise level should be measured in everymeasurement point. It would be problematic to satisfy this demand in real surroundings (seechapter 8.3.1) and therefore, a practical method was implemented instead. It was based onmeasurements at arbitrary positions around the source and the estimation of the backgroundlevels at these positions, to ensure that the background noise level was sufficiently below thelevels measured in the different measurement points in order to validate the measurements. Inorder to minimize the background noise levels influence on the measurements, the smallestpossible measurement radius was chosen for all sources.

24

25
6 Calculations & Analysis
The analysis of the results from measurements was performed using Matlab® programs of owndesign, excel sheets and SoundPLAN®. SoundPLAN® is a program designed for the purpose ofcalculating community noise, noise propagation, noise level prediction etc. In SoundPLAN®, thedirectivity indices can be assigned to each source in three dimensions, which is suitable for thepurposes in this work.
6.1 Calculations made in Matlab®
The Matlab® programs (see Appendix 2) described in this chapter were designed for the purposeof making calculations of sound power levels, directivity indices, tables of measurement pointspositions, measurement surfaces etc. There was no focus on making the programs as efficientand short as possible, they were merely used as a tool for the purpose of saving time during themeasurement part of the project (and therefore no effort has been made in optimizing the codesince only basic formulas and interpolations were required).
6.2 Calculations according to ISO 3744-2 [1]
For the calculations of sound power levels and directivity indices, the program was built on theformulae in ISO 3744-2 [1] (see chapter 3.1.4). There was also a correction made for thebackground noise, for cases in which the background noise level constituted a significantproblem. In the cases where the background noise levels were estimated to have little if anyinfluence on the measurements, the correction factor was set to zero (no correction).
6.3 Interpolation for directivity indices used in SoundPLAN®
In SoundPLAN®, a directivity index has to be introduced for each point representing a 10-degreeincrement, resulting in a matrix with 36X18 (see figure 16) elements. Since measurement data islacking for all points except for the ten actual measurement points, 638 points have to beinterpolated. The program starts with the introduction of the results from the ten measurementpoints into the matrix, then a horizontal interpolation is made followed by a vertical interpolation.Beginning with the directivity indices given by the measurement data, the interpolations weremade linearly using the pressures squared. For each octaveband the resulting matrix is saved as

26
a text file for later implementation in SoundPLAN®. For some sources, measurements accordingto DIN 45635-47 [2] and the consultants method, where not performed. In these cases, theinterpolated values constituted the basis for sound power level calculations represented by thesemethods. For the sources for which this method were used, the resulting calculations of soundpower levels were made in the excel file used to plot the comparison between measurementmethods regarding differences in sound power levels.
Figure 15 SoundPLAN®
Directivity plot forsingle vertical angle
Figure 16 36*18 Matrix withdirectivity indices
6.4 Analysis in SoundPLAN®
In order to look into the possible benefits of using a measurement method that entails adescription of the directivity of a source for different directions, a comparison between soundpressure levels at receiving points has to be made. These comparisons are performed bycalculation of the sound propagation outdoors using SoundPLAN®. In this case, a simplifiedmodel of an environment was created for the purpose of looking into the differences in the soundpressure level for different receiver points and source definitions.
6.4.1 Different sound power level definitions within the calculation data
The sound power level for each source has four different definitions:
27
• Sound power levels calculated from measurements based on the modified method defined inthis thesis (see section 5.3.1) which is derived from ISO 3744-2 [1].
• Sound power levels calculated from measurements based on the modified method withoutconsidering the directive properties of the sources.
• Sound power levels calculated from measurements based on the modified method but afterthe sources have been subdued to a tilt by 90 degrees towards a direction for which anincrease in noise level are accepted.
• Sound power levels calculated from measurement based on the modified method but afterthe sources has been subdued to a tilt by 90 degrees in the opposite direction.
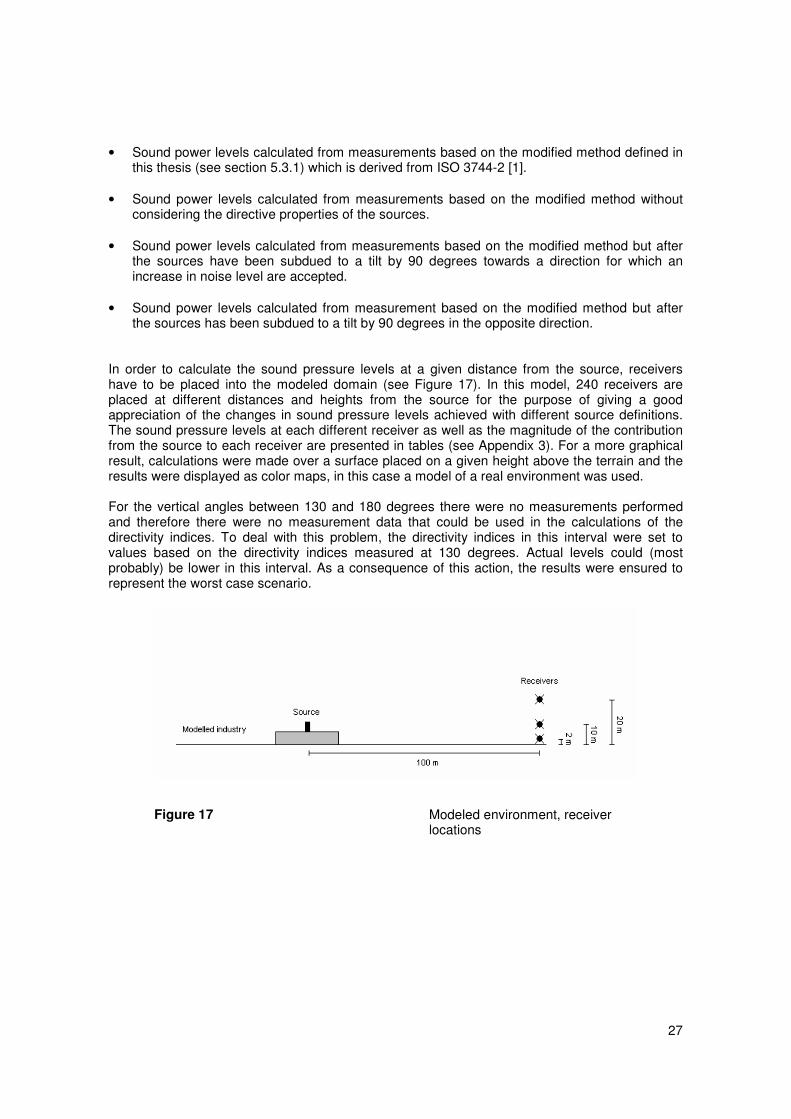
In order to calculate the sound pressure levels at a given distance from the source, receivershave to be placed into the modeled domain (see Figure 17). In this model, 240 receivers areplaced at different distances and heights from the source for the purpose of giving a goodappreciation of the changes in sound pressure levels achieved with different source definitions.The sound pressure levels at each different receiver as well as the magnitude of the contributionfrom the source to each receiver are presented in tables (see Appendix 3). For a more graphicalresult, calculations were made over a surface placed on a given height above the terrain and theresults were displayed as color maps, in this case a model of a real environment was used.
For the vertical angles between 130 and 180 degrees there were no measurements performedand therefore there were no measurement data that could be used in the calculations of thedirectivity indices. To deal with this problem, the directivity indices in this interval were set tovalues based on the directivity indices measured at 130 degrees. Actual levels could (mostprobably) be lower in this interval. As a consequence of this action, the results were ensured torepresent the worst case scenario.
Figure 17 Modeled environment, receiverlocations

28
29
7 Results
7.1 Results from measurements
In total, eighteen typical external industrial noise sources were measured during the course of thisthesis work. Results, in full, from these measurements are presented in Appendix 1. For eachsource, plots showing the directivity indices, the radiated sound power level, a datasheet withmeasurement data and the different source characteristics are presented. A selection ofmeasurement results from three different typical sources is presented in this chapter.
The sound pressure levels are presented in octavebands from 63 Hz to 8 kHz together with theaverage equivalent sound pressure levels. The levels displayed in octavebands are linear but theaverage sound pressure levels are A-weighted. A-weighted sound pressure levels are interestingfor clients to companies dealing with ENASI because the demands on noise emission levels fromindustries, stated by the Swedish government, are presented in terms of A-weighted values.

30
7.1.1 Example of a high source with small radius, Source 11
Source physical properties
Air outlet, Fan placed under roof.
Source height = 5 m
Source radius = 0,4 m
Meas. radius = 1,0 m
Figure 18
Source 11, High sourcewith large radius
Measurement data
Table showing measured sound pressure levels in A-weighted total level and linear octavebandlevels from 63 to 8000 Hz.
Point no. 63 Hz 125 Hz 250 Hz 500 Hz 1 kHz 2 kHz 4 kHz 8 kHz LAeq1 74,6 76 75,3 71,2 66,3 58,6 50,2 41 72,22 74,6 75,7 75,2 70 65,6 58,4 50,6 40,1 71,63 74,9 76,1 75,3 70,4 65,8 58,1 50,5 38,1 71,84 76,4 77,7 77,5 73,9 69,5 61 55,2 43,6 74,95 77,6 77,7 77,7 73 69,3 62 56,2 43,7 74,76 78 77,7 77,6 73,2 69,7 61,9 56 44 74,87 81,3 80,1 81,3 79,2 78,1 71,8 69 61,8 828 78 80,1 81,6 78,8 77 71,5 68 61 81,39 83,7 80,7 81,7 78,6 76,9 71,2 68,2 61,1 81,210 78,1 80,5 83,5 80,8 80,1 72 68,5 62,3 83,5
Table 3 Source 11: Measurement data, linear octaveband levels, A-weighted totalsound pressure level, dB re 20 Pa.

31
The measured sound pressure levels presented at the locations of the measurement positions onthe measurement sphere.
Figure 19 Side view ofsource 11
Figure 20 Top view ofsource 11
A comparison between total sound power levels received from different measurement methods isdisplayed below. Linear values except for the LAeq level that is A-weighted.
Figure 21 Source no. 11: Sound Power Levels, dB re 1 pW, linearoctavebands and A-weighted total Sound Power Level. Themodified method, DIN 45635-47 [2], consultants method.
32
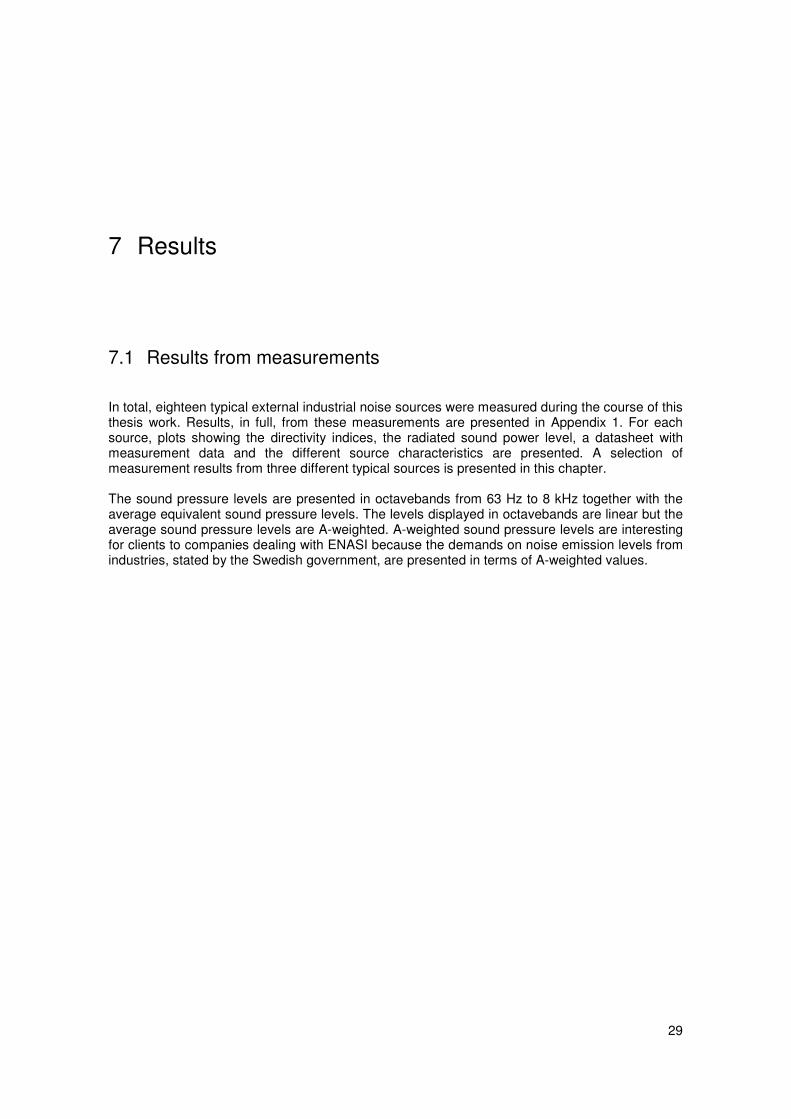
7.1.2 Example of a high source with large radius, Source 7
Source physical properties
Air outlet, Fan placed under roof.
Source height = 5 m
Source radius = 0,8 m
Meas. radius = 2,0 m
Figure 22
Source 7: High source withlarge radius
Measurement data
Table showing measured sound pressure levels in A-weighted total level and linear octavebandlevels from 63 to 8000 Hz.
Point no. 63 Hz 125 Hz 250 Hz 500 Hz 1 kHz 2 kHz 4 kHz 8 kHz LAeq1 69,5 67,5 63,6 59,1 55,4 48,1 40,5 28,9 612 69,8 67,2 66,1 59,5 55,4 48,7 40,2 27,4 61,83 70,1 67,9 65 58,7 53,5 46,2 38,2 24,9 60,74 69,4 67 65,3 60,8 56 49 41,8 31,5 62,15 69,4 68,7 66,9 60,5 56 48,7 41 26,9 62,76 69,2 69,5 66,7 60,4 55,2 47,8 38,1 24,4 62,37 76,3 70 68,7 64,3 59,6 51,4 44,5 37 65,68 70,4 70,8 70,5 65,6 59,5 51,1 44 36,8 66,59 86,9 79,1 72,7 65,3 60 52,3 47,9 42,8 68,810 83 76 69,2 63,7 58,6 52,9 48,5 42,7 66,5
Table 4 Source 7: Measurement data, linear octaveband levels, A-weighted totalsound pressure level, dB re 20 Pa.

33
The measured sound pressure levels presented at the locations of the measurement positions onthe measurement sphere.
Figure 23 Side view ofsource 7
Figure 24 Top view ofsource 7
A comparison between sound power levels received from different measurement methods isdisplayed below. Linear values except for the LAeq level that is A-weighted.
Figure 25 Source no. 7: Sound Power Levels, dB re 1 pW, linearoctavebands and A-weighted total Sound Power Level. Themodified method, DIN 45635-47 [2], consultants method.
34
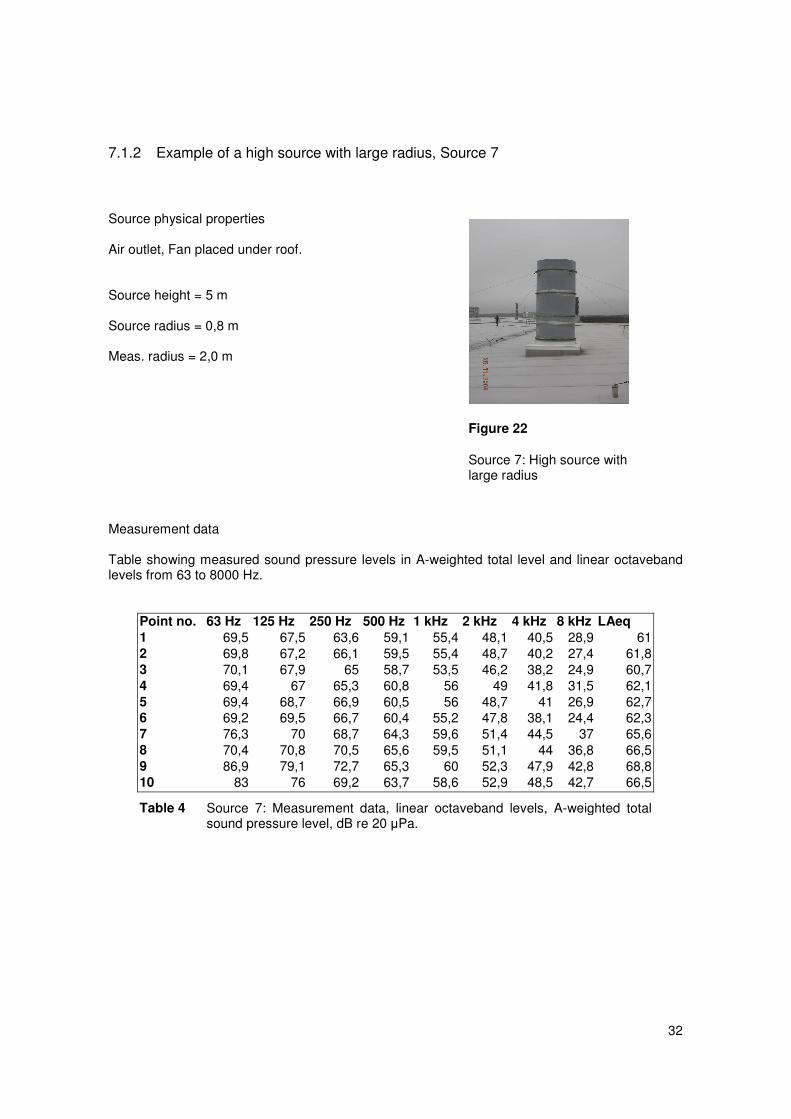
7.1.3 Example of a low source
Source physical properties
Air outlet, fan placed under roof.
Source height = 1 m
Source radius = 0,5 m
Meas. radius = 2,0 m
Figure 26
Source 15: low source
Measurement data
Table showing measured sound pressure levels in A-weighted total level and linear octavebandlevels from 63 to 8000 Hz.
Point no. 63 Hz 125 Hz 250 Hz 500 Hz 1 kHz 2 kHz 4 kHz 8 kHz LAeq1 50.7 57.5 68.3 64.3 69.7 60.0 51.4 42.5 73.02 50.0 57.1 62.5 62.2 64.3 54.7 45.2 40.0 68.43 49.9 58.0 63.8 62.9 65.3 56.3 45.8 40.0 69.44 47.7 54.9 69.0 69.1 70.6 62.1 53.9 47.4 74.65 47.8 54.5 64.9 66.3 66.3 59.6 51.3 44.3 71.06 48.4 55.0 66.9 65.8 67.1 60.2 51.1 43.5 71.77 46.9 56.4 68.7 70.8 75.0 68.3 61.0 55.4 77.78 47.9 56.6 65.8 70.5 71.5 64.9 58.6 53.7 75.29 47.0 56.9 67.3 71.0 72.3 65.2 58.8 53.3 75.910 51.7 58.4 69.4 71.7 74.5 68.2 61.1 56.0 77.8
Table 5 Source 15: Measurement data, linear octaveband levels, A-weighted totalsound pressure level, dB re 20 Pa.

35
The measured sound pressure levels presented at the locations of the measurement positions onthe measurement sphere.
Figure 27 Side view of source15
Figure 28 Top view ofsource 15
A comparison between sound power levels received from different measurement methods isdisplayed below. Linear values except for the LAeq level that is A-weighted. No DIN 45635-47 [2]have been made on low sources.
Figure 29 Source no. 15: Sound Power Levels, dB re 1 pW, linearoctavebands and A-weighted total Sound Power Level. Themodified method and the consultants method.

36
7.1.4 Example of directivity plots
The directivity indices were calculated using the formulae in Appendix E, ISO 3744-2 [1].
The directivity indices, presented in figure 30 and figure 31, represent the directivity as a functionof vertical angle, , averaged over all (see figure 30). Variations in the xy-plane have beenused in the analysis in SoundPLAN®. The purpose of this is to display results from measurementsfrom real sources, which is the main purpose of this thesis work. In the figures showing thedirectivity variations the directivity indices are plotted for different vertical angles. Themeasurement points along the z-axis are placed at four different angles; the values betweenthese angles are therefore interpolated from these four points.
Directivity indices for each octaveband and the total equivalent level are plotted for each 10-degree angle between the top point and the lowest point.
Figure 30
Coordinate system
=0, Direction 0˚ from outlet
=0, Direction 90˚ from outlet
X
Y
Z
37
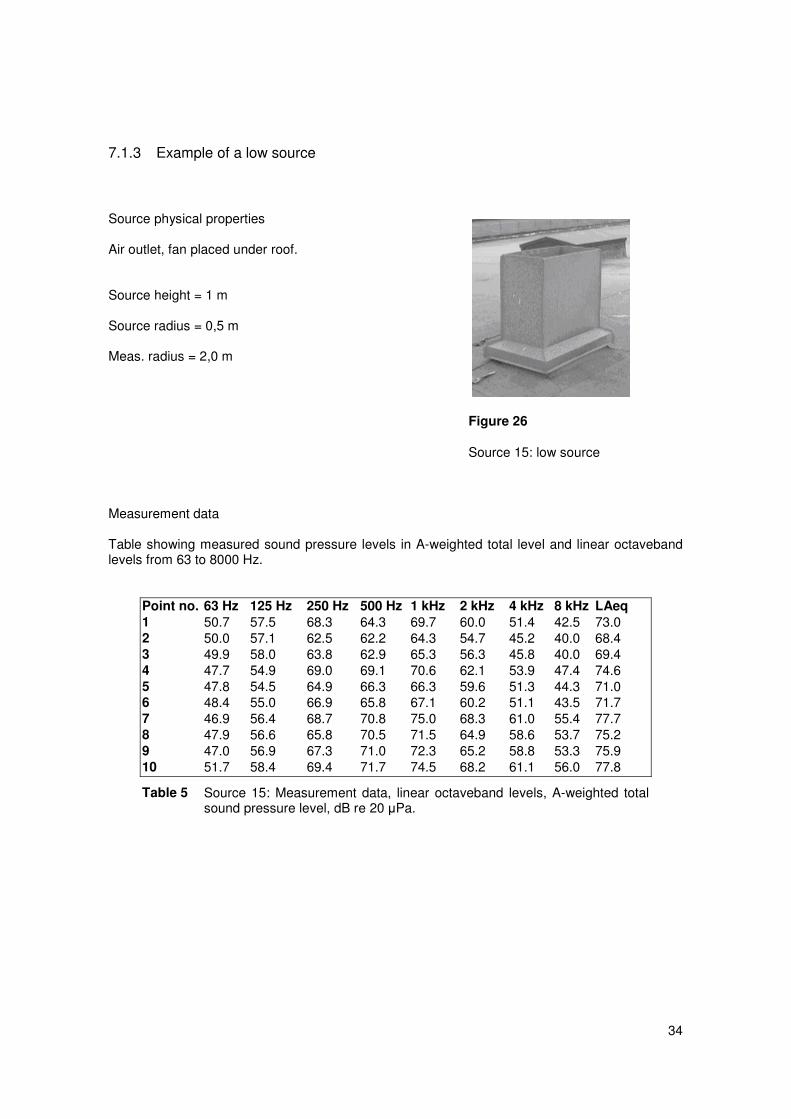
Figure 31 Source 2: High source, small radius. Directivity index plotted oververtical angles.
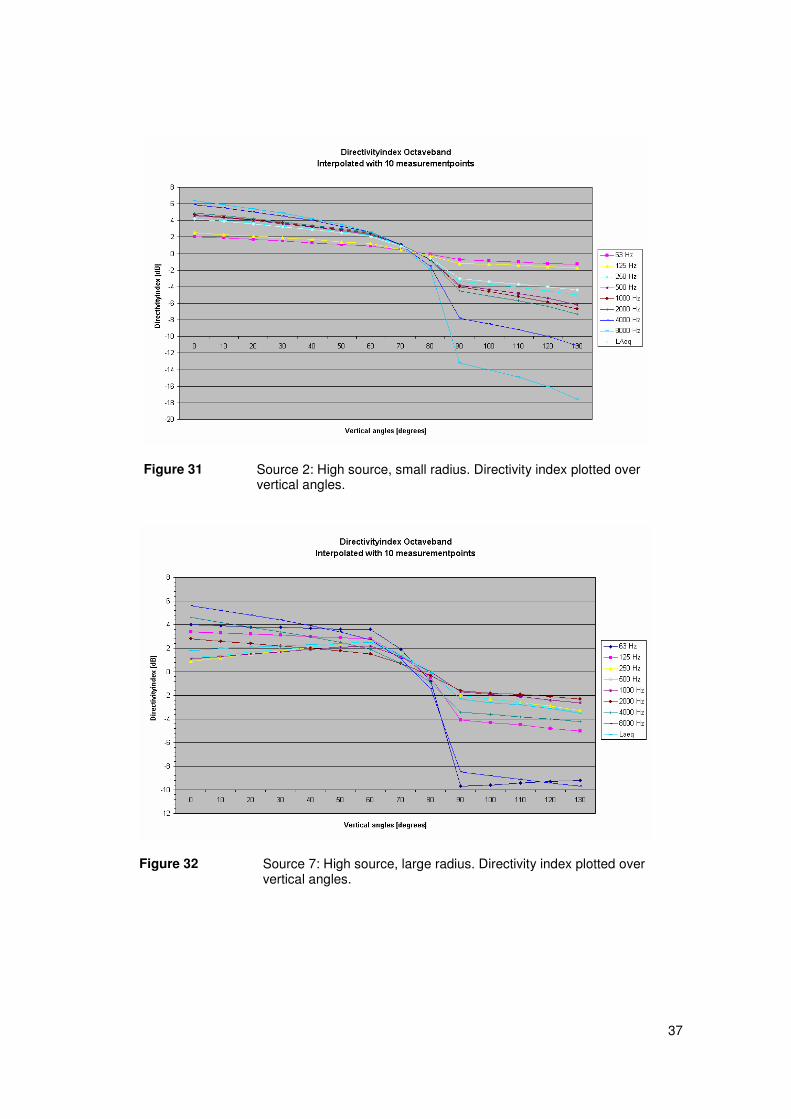
Figure 32 Source 7: High source, large radius. Directivity index plotted oververtical angles.
38
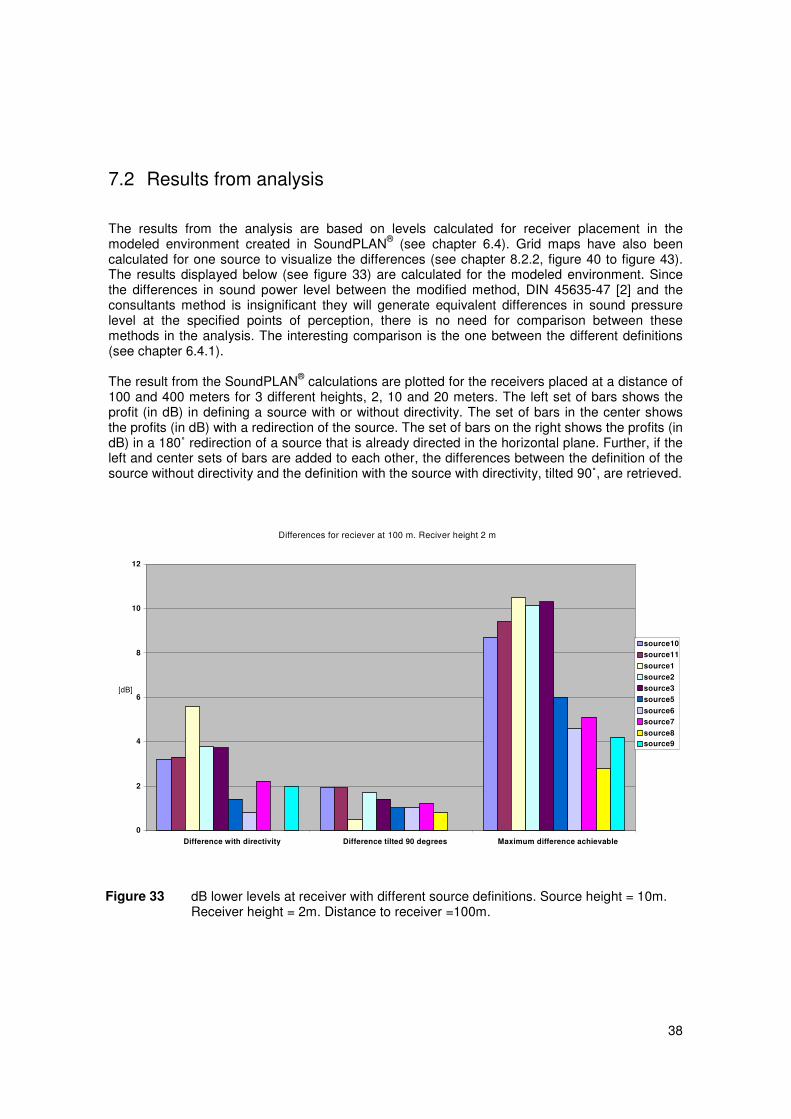
7.2 Results from analysis
The results from the analysis are based on levels calculated for receiver placement in themodeled environment created in SoundPLAN® (see chapter 6.4). Grid maps have also beencalculated for one source to visualize the differences (see chapter 8.2.2, figure 40 to figure 43).The results displayed below (see figure 33) are calculated for the modeled environment. Sincethe differences in sound power level between the modified method, DIN 45635-47 [2] and theconsultants method is insignificant they will generate equivalent differences in sound pressurelevel at the specified points of perception, there is no need for comparison between thesemethods in the analysis. The interesting comparison is the one between the different definitions(see chapter 6.4.1).
The result from the SoundPLAN® calculations are plotted for the receivers placed at a distance of100 and 400 meters for 3 different heights, 2, 10 and 20 meters. The left set of bars shows theprofit (in dB) in defining a source with or without directivity. The set of bars in the center showsthe profits (in dB) with a redirection of the source. The set of bars on the right shows the profits (indB) in a 180˚ redirection of a source that is already directed in the horizontal plane. Further, if theleft and center sets of bars are added to each other, the differences between the definition of thesource without directivity and the definition with the source with directivity, tilted 90˚, are retrieved.
Differences for reciever at 100 m. Reciver height 2 m
0
2
4
6
8
10
12
Difference with directivity Difference tilted 90 degrees Maximum difference achievable
[dB]
source10source11
source1source2source3source5
source6source7
source8source9
Figure 33 dB lower levels at receiver with different source definitions. Source height = 10m.Receiver height = 2m. Distance to receiver =100m.
39
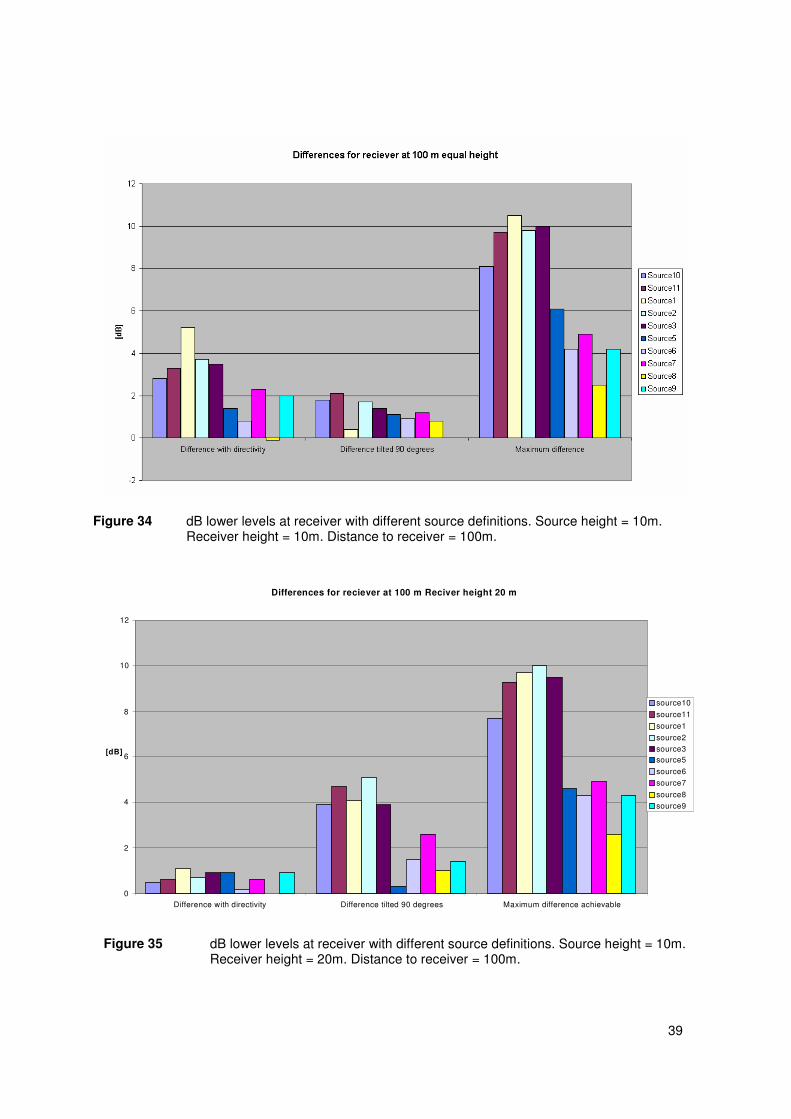
Figure 34 dB lower levels at receiver with different source definitions. Source height = 10m.Receiver height = 10m. Distance to receiver = 100m.
Differences for reciever at 100 m Reciver height 20 m
0
2
4
6
8
10
12
Difference with directivity Difference tilted 90 degrees Maximum difference achievable
[dB]
source10
source11
source1
source2
source3source5
source6
source7
source8
source9
Figure 35 dB lower levels at receiver with different source definitions. Source height = 10m.Receiver height = 20m. Distance to receiver = 100m.
40
Differences for reciever at 400 m Reciver height 2 m
0
2
4
6
8
10
12
Difference with directivity Difference tilted 90 degrees Maximum difference achievable
[dB]
source10
source11
source1
source2
source3
source5
source6source7
source8
source9
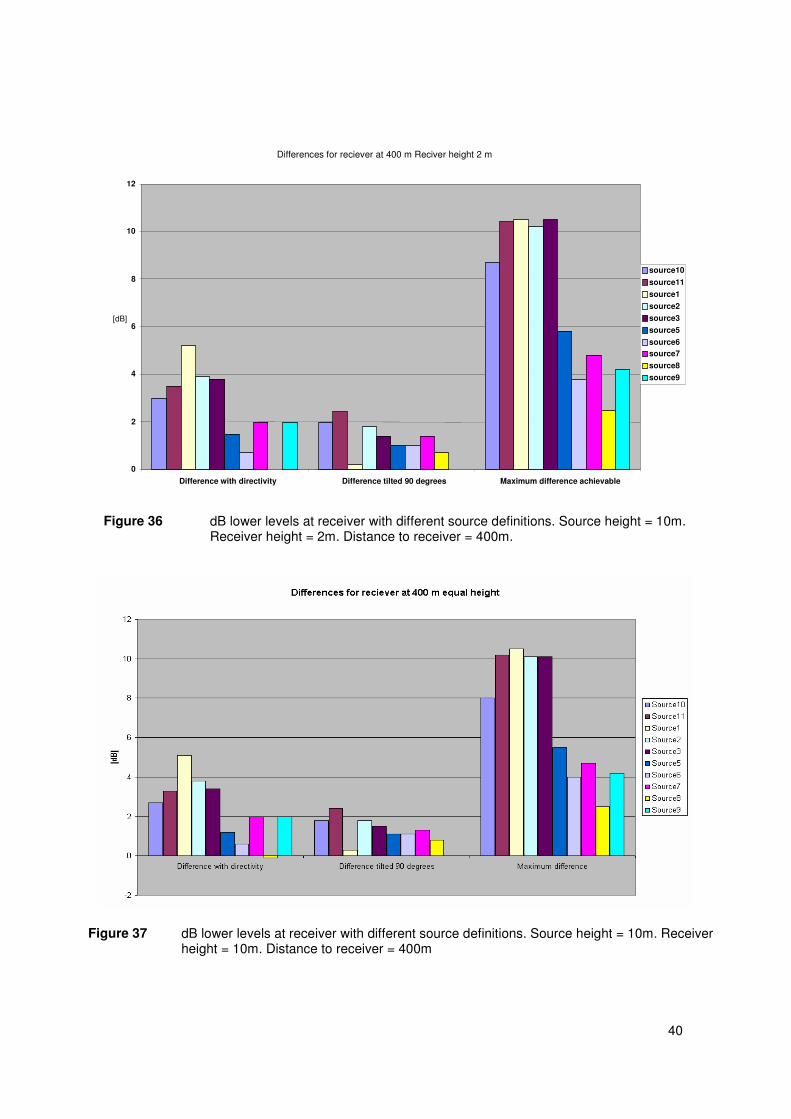
Figure 36 dB lower levels at receiver with different source definitions. Source height = 10m.Receiver height = 2m. Distance to receiver = 400m.
Figure 37 dB lower levels at receiver with different source definitions. Source height = 10m. Receiverheight = 10m. Distance to receiver = 400m
41
Differences for reciever at 400 m Reciver height 20 m
0
2
4
6
8
10
12
Difference with directivity Difference tilted 90 degrees Maximum difference achievable
[dB]
source10source11source1source2source3source5source6source7source8source9
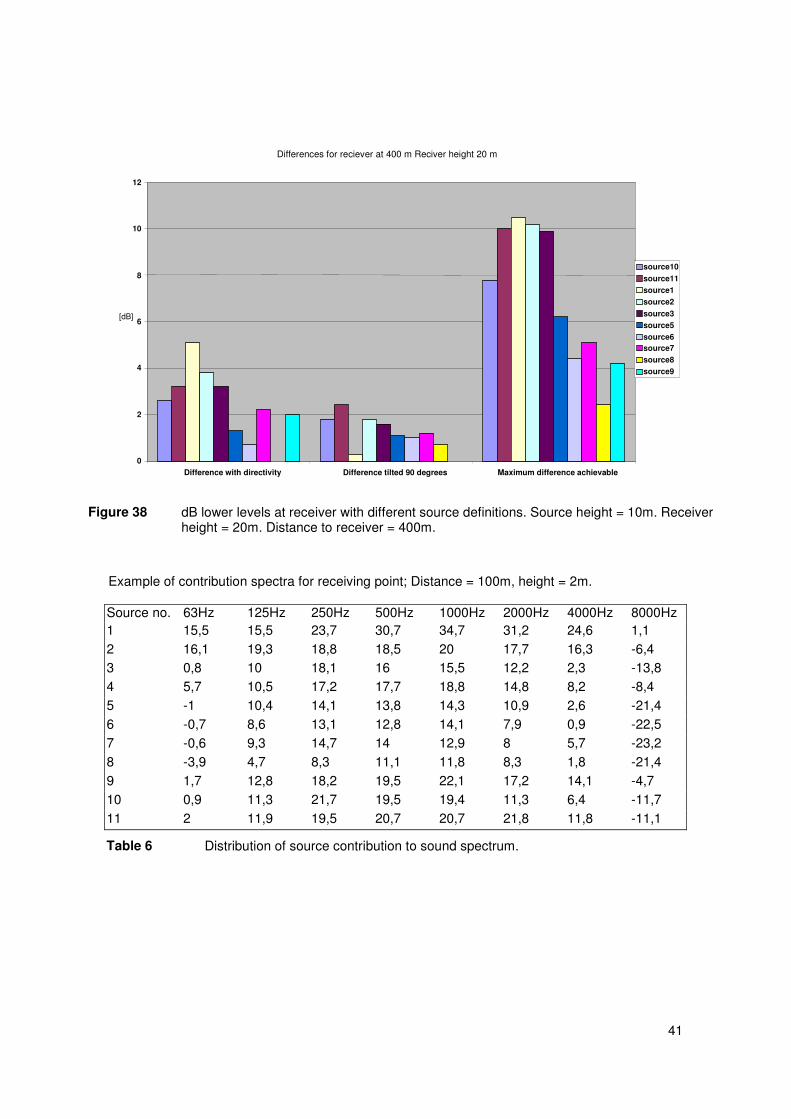
Figure 38 dB lower levels at receiver with different source definitions. Source height = 10m. Receiverheight = 20m. Distance to receiver = 400m.
Example of contribution spectra for receiving point; Distance = 100m, height = 2m.
Source no. 63Hz 125Hz 250Hz 500Hz 1000Hz 2000Hz 4000Hz 8000Hz1 15,5 15,5 23,7 30,7 34,7 31,2 24,6 1,12 16,1 19,3 18,8 18,5 20 17,7 16,3 -6,43 0,8 10 18,1 16 15,5 12,2 2,3 -13,84 5,7 10,5 17,2 17,7 18,8 14,8 8,2 -8,45 -1 10,4 14,1 13,8 14,3 10,9 2,6 -21,46 -0,7 8,6 13,1 12,8 14,1 7,9 0,9 -22,57 -0,6 9,3 14,7 14 12,9 8 5,7 -23,28 -3,9 4,7 8,3 11,1 11,8 8,3 1,8 -21,49 1,7 12,8 18,2 19,5 22,1 17,2 14,1 -4,710 0,9 11,3 21,7 19,5 19,4 11,3 6,4 -11,711 2 11,9 19,5 20,7 20,7 21,8 11,8 -11,1
Table 6 Distribution of source contribution to sound spectrum.

42

43
8 Discussion
The discussion concerns both the measurement part and the analysis made in SoundPLAN® forthe selected sources. It illustrates and explains the difficulties associated with the different issuesdealt with throughout the course of this project.
8.1 Measurement results
8.1.1 Determination of sound power levels
The determinations of sound power levels made in this thesis, for our sources, shows a greatresemblance between the modified method and the method described in DIN 45635-47 [2] whenhigh sources are considered, both when comparisons between the actual measured values aremade and for the interpolated values. The differences are within reasonable limits (2-3 dB),thereby giving our measurement method justification since the DIN 45635-47 [2] standard offers areliable method and the results from the use of this standard gives a good approximation of whatthe actual sound power level of the source should be. One cannot with certainty control thedifferent technical aspects of the source and that is why differences in the range of 2-3 dB cannotconclusively be explained by differences between measurement methods, one has to takepossible variations or changes in the operation of the source into account as well. DIN 45635-47[2] only ensures a certainty of 4 dB in the results while the ISO 3744-2 [1] standard ensures aprecision of 1 dB. One realizes however that this precision is hardly attainable under real outdoorcircumstances; with regards to wind, operation variations of the sources and variations inbackground noise levels. All prerequisites of the method are seldom fulfilled.
For the cases where additional measurements have been made on a source, using theconsultants method, the resulting differences in sound power levels between that method andours are greater than for sound power levels calculated from the interpolated values. The reasonis that, for some sources, our device is not capable of measurements in the point at which themeasurement should be performed according to the consultants method. For these sources,measurements in that particular point were made using only a handheld mast and at 5 metersheight, precision is hard to achieve with such equipment. There were also additional insecuritiesduring the calculations of the sound power levels. For instance; a spherical or a half-sphericalsurface contributes differently to the results. Also, because of the fact that the distance to theedge of the source was assumed to be 1 meter, the error will become smaller for a smallmeasurement radius than for a large in comparison with ISO 3744-2 [1] which assumes thedistance to the center of the source instead (in our case, at the peripheral center of the outlet).
These arguments are not to be interpreted as if the consultants today are mistaken in using theirpractical methods. The fact is that they are very thorough when performing measurements;testing, making corrections, appreciating different variables and measuring in surrounding pointsin order to confirm their results. This process is of course based on individual experience, which
44
takes time to develop; therefore it also shows that one with this practical method can makemistakes if one is inexperienced.
For low sources, DIN 45635-47 [2] is not applicable because the supposed lower half sphere,described in the standard, cannot enclose the source and therefore it has not been used formeasurements on such sources in this thesis. The differences between the modified method andthe consultants method are however quite similar to the differences seen for high sources.
There were two low sources measured with a large measurement radius during the course of thisproject. They showed larger differences, same behavior as for higher sources with largermeasurement radius. Another problem with this type of source was that a substantial part of theemitted noise came from the source structure itself (e.g. vibrating walls) and not only from theoutlet. The sides of the construction were often vibrating strongly and therefore had an influenceon the sound pressure levels measured at the lower set of measurement points, thereby raisingthe total sound power level. The point at which the sound pressure level is measured according tothe consultants method is located above the source and is thereby not affected to the samedegree as the lower measurement points; it is mainly affected by the noise generated by the aircoming through the outlet. For sources with small radius the conformity is very good. Theselection of correction factor is obvious for these lower sources (one meter distance = 8 dB for ahalf sphere) since they are placed closely to the roof and a half sphere is chosen due to thepresence of only one reflecting plane.
8.1.2 Determination of directivity
Interpretable from the plots in chapter 7.1.4 is the great differences between the points placedstraight upward and the points placed straight sideways. The differences for the points locatedbelow 90 degrees are not that sizeable, in some cases even non-existent. At these points, thepreviously described effect, originating from the statement that the chimney itself is a contributingsource, makes itself known (the levels at the lower set of points are in fact lower since they get acontribution from the chimney).
A correct measurement of the background noise level has not been performed, as previouslymentioned (see chapter 3.3), just an appreciation of the background levels contribution ending upat approximately 15 dB lower then the measured sound pressured levels around the source.Since one does not now exactly what the background level contribution is, it is possible that thepoints located on the lower half sphere need to be adjusted according to ISO 3744-2 [1]. Butbecause there is no foundation for such calculations, there has not been any performed. Thesecorrections can however be excluded since they would not lead to smaller differences and theresults will remain on the safe side.
The differences in directivity between the lowest and highest measurement points are not asimportant as to what the lowest values for the directivity indices are. These directivity indices arein fact representing the possible benefits of a measure involving redirection of the source. Thedirective behavior for most sources lay in the higher octavebands; this is a typical behavior of allnoise sources. For the high and wide sources in this thesis however, the directivity indices forlower octavebands also show directive behavior. This can to some extent be explained as effectsfrom the near distance to the source for lower angles. On the other hand, however, the shortestpermissible distances between the sources and the measurement surfaces are 0,25 m for arectangular surface, according to ISO 3744-2 [1]. A larger measurement radius could maybe havebeen used to avoid this problem but the size of the measurement radius is dependent on otherfactors (see chapter 5). When one however calculates the total A-weighted sound pressure level,the 250 Hz, 500 Hz and the 1000 Hz octavebands will be dominating and therefore these errorswill not influence the final sound pressure levels at the receiving points.

45
8.1.3 Sources which were not selected for further analysis
Among the eighteen sources measured during the course of this project, only eleven wereselected for further analysis in SoundPLAN®. The rejected sources are believed to not representthe true source-bound directivity. All low sources have been discarded because we believe thatthe measurements performed on these, with the modified method, are not representative for thesource type. In these cases, the measurements have been complicated by the influence ofground reflections, background noise levels and the influence from the vicinity to surroundingobjects. The measurement results from these measurements are however displayed in Appendix1 because they are nevertheless a part of the measurement results. The calculation of theradiated sound power levels from these sources can be regarded as correct by the considerationthat the calculation method was adapted to the ISO 3744-2 [1] standard. Unfortunately, they donot fulfill our objectives, which are to view the sources peripheral outlet as a separate source. Forexample, the sources situated at Klippan AB have all been rejected based on the type of sourcesand the amount of other sources in the vicinity of these.
8.2 Calculations in SoundPLAN®
8.2.1 Differences between source definitions, with and without consideration ofdirectivity
For all sources one can clearly see the differences between defining a source with or without itsdirective properties. When the directivity is not considered, the sound pressure levels at thepoints of perception will be the same for a given distance independent of position in the verticaland horizontal planes when the terrain is uniform in all directions. This fact is obvious but alsoequally wrong since the source has been measured differently for different directions; there haveto be differences depending on the direction in which the points of perception are located. Thedominating octavebands for the total A-weighted sound pressure level at the distances used inthis analysis is 250 Hz, 500 Hz and 1000 Hz. At these frequencies, clear directive behavior isshown which also is presented in the results. At these frequencies; the dubiousness of which wasdiscussed in the previous segment about the behavior at the lower octavebands, is not present. Ifthe source is elevated, SoundPLAN® will use the directivity value for a lower angle than beforeand the difference between the source definitions with or without directivity would be greaterbecause a lower value for the directivity is used to describe the sound power level contributing tothe points of perception. If the case would be contrary, a lowering of the source (a valley forinstance), the differences would diminish. The directivity in this direction would be smaller andthereby agree with the radiated sound power level from the source without consideration ofdirectivity. But in the latter case, the benefits from merely re-directing the source, as a measurefor noise reduction would increase and it is therefore important to acknowledge the directivity.
8.2.2 Benefits of a redirection of the source?
The differences in directivity between the direction with the highest sound radiation and thedirection with the lowest sound radiation are around 10 dB for the measured sources at most. Thedifference between the 90°and 180°is only 1 to 2 dB for our sources but in reality this would begreater. This due to the fact that the levels at the points, which could not be measured, locatedbelow 130˚, are set equal to the levels representing the points at 130˚. These levels are probablya little higher than necessary for the lower set of points but this is acceptable due to the risk of
46
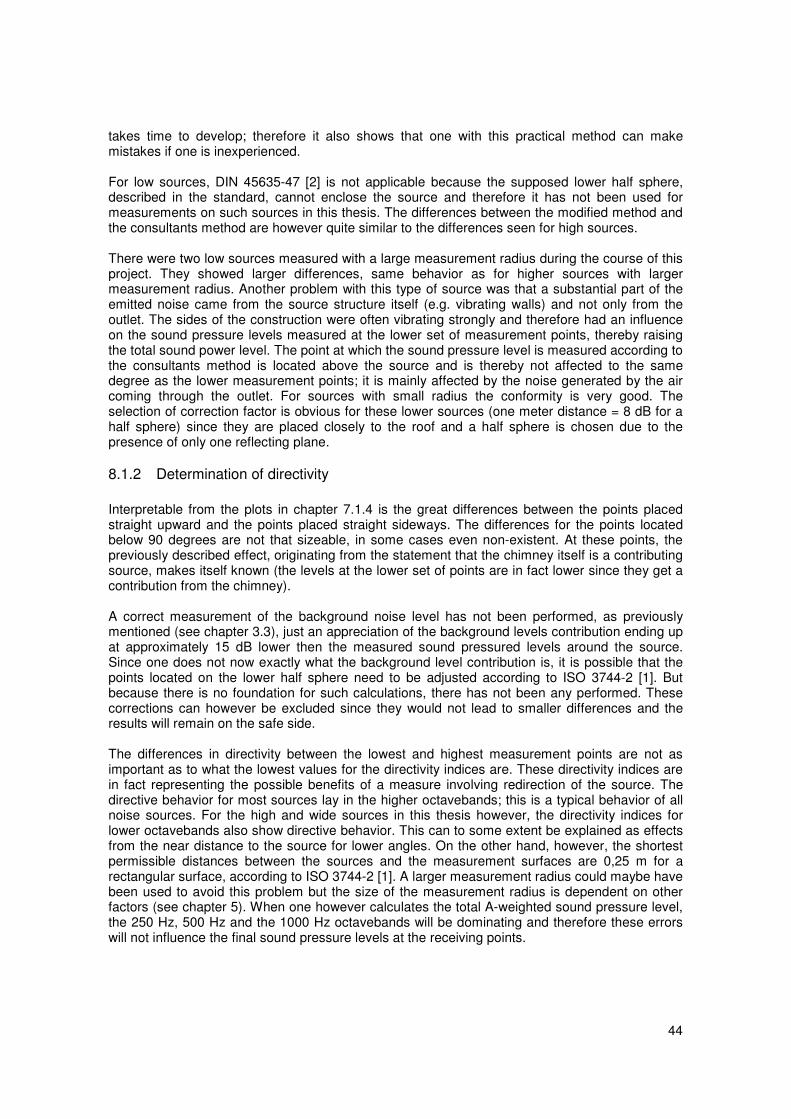
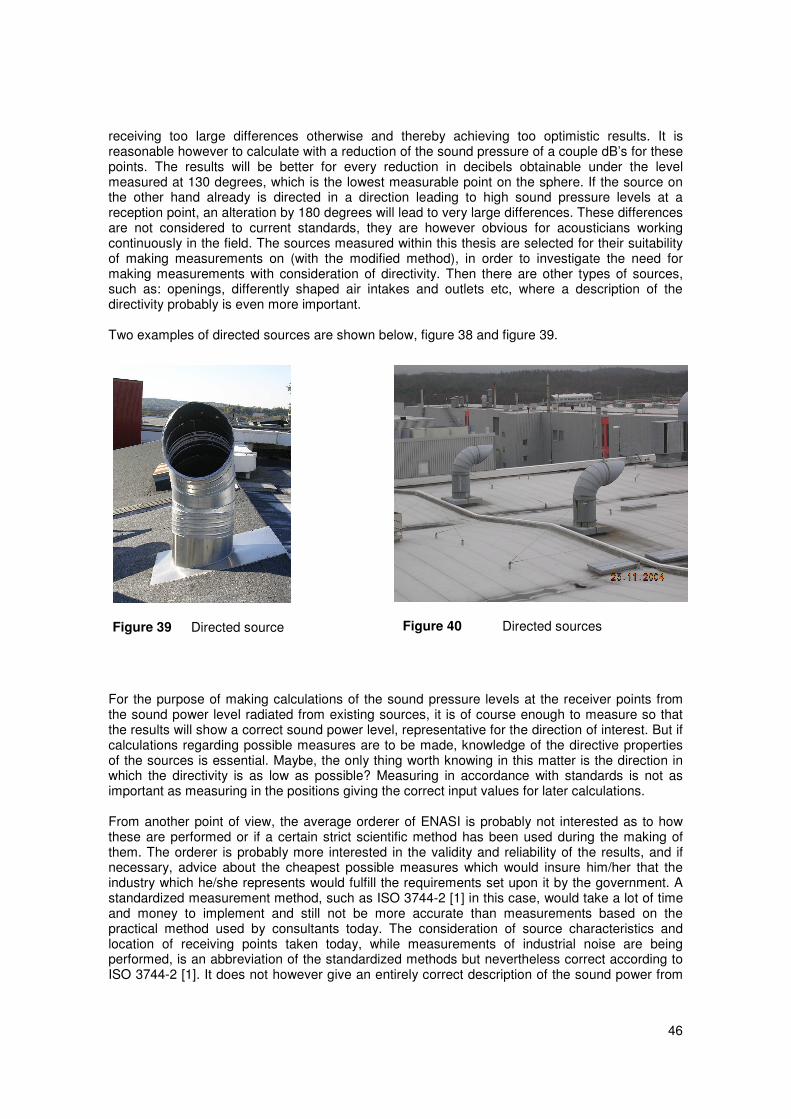
receiving too large differences otherwise and thereby achieving too optimistic results. It isreasonable however to calculate with a reduction of the sound pressure of a couple dB’s for thesepoints. The results will be better for every reduction in decibels obtainable under the levelmeasured at 130 degrees, which is the lowest measurable point on the sphere. If the source onthe other hand already is directed in a direction leading to high sound pressure levels at areception point, an alteration by 180 degrees will lead to very large differences. These differencesare not considered to current standards, they are however obvious for acousticians workingcontinuously in the field. The sources measured within this thesis are selected for their suitabilityof making measurements on (with the modified method), in order to investigate the need formaking measurements with consideration of directivity. Then there are other types of sources,such as: openings, differently shaped air intakes and outlets etc, where a description of thedirectivity probably is even more important.
Two examples of directed sources are shown below, figure 38 and figure 39.
Figure 39 Directed source Figure 40 Directed sources
For the purpose of making calculations of the sound pressure levels at the receiver points fromthe sound power level radiated from existing sources, it is of course enough to measure so thatthe results will show a correct sound power level, representative for the direction of interest. But ifcalculations regarding possible measures are to be made, knowledge of the directive propertiesof the sources is essential. Maybe, the only thing worth knowing in this matter is the direction inwhich the directivity is as low as possible? Measuring in accordance with standards is not asimportant as measuring in the positions giving the correct input values for later calculations.
From another point of view, the average orderer of ENASI is probably not interested as to howthese are performed or if a certain strict scientific method has been used during the making ofthem. The orderer is probably more interested in the validity and reliability of the results, and ifnecessary, advice about the cheapest possible measures which would insure him/her that theindustry which he/she represents would fulfill the requirements set upon it by the government. Astandardized measurement method, such as ISO 3744-2 [1] in this case, would take a lot of timeand money to implement and still not be more accurate than measurements based on thepractical method used by consultants today. The consideration of source characteristics andlocation of receiving points taken today, while measurements of industrial noise are beingperformed, is an abbreviation of the standardized methods but nevertheless correct according toISO 3744-2 [1]. It does not however give an entirely correct description of the sound power from

47
the source; it is only valid for calculations for receiving points located in the direction themeasurement was made. A step in the right direction in order to get a more detailed description ofthe source would be to standardize the consideration of the directive behavior (as well as the truesound power level) of the source, since this information is needed as input data for latercalculations and also for the possibility of taking measures for noise reduction such as the onesmentioned in the introduction.
Figure 41 Source 2: tilted 90 degrees.
Figure 42 Source 2: tilted -90 degrees.
48
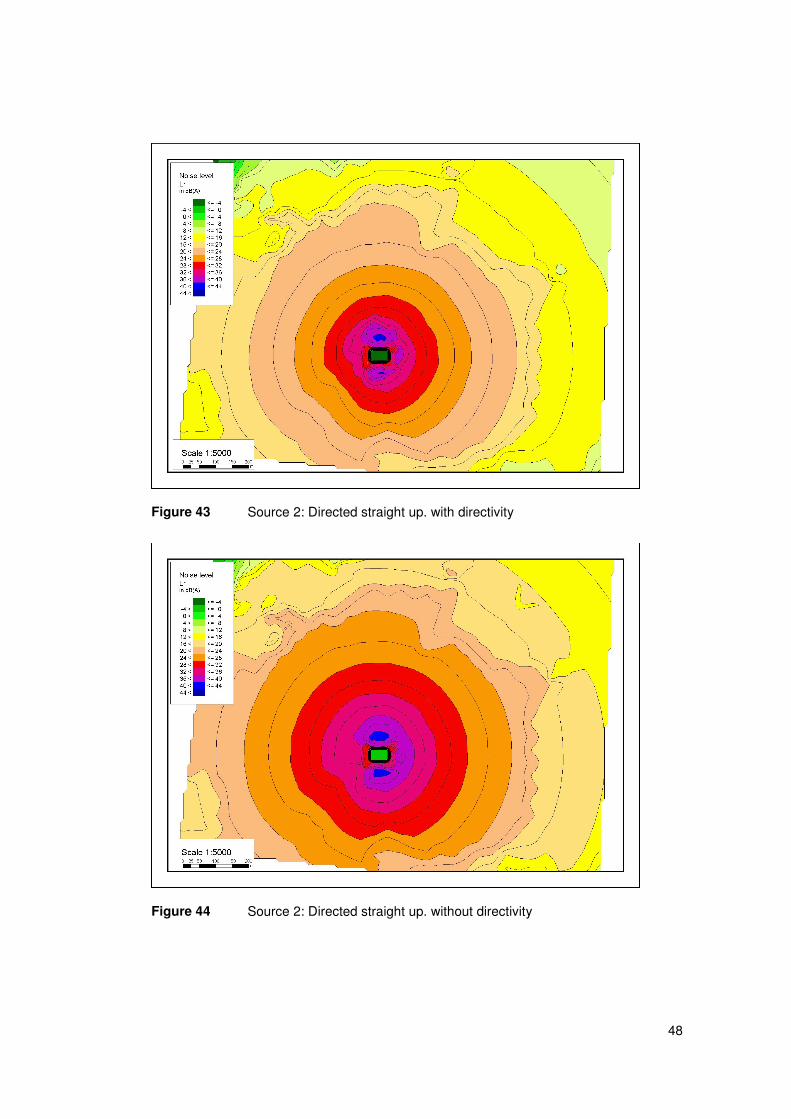
Figure 43 Source 2: Directed straight up. with directivity
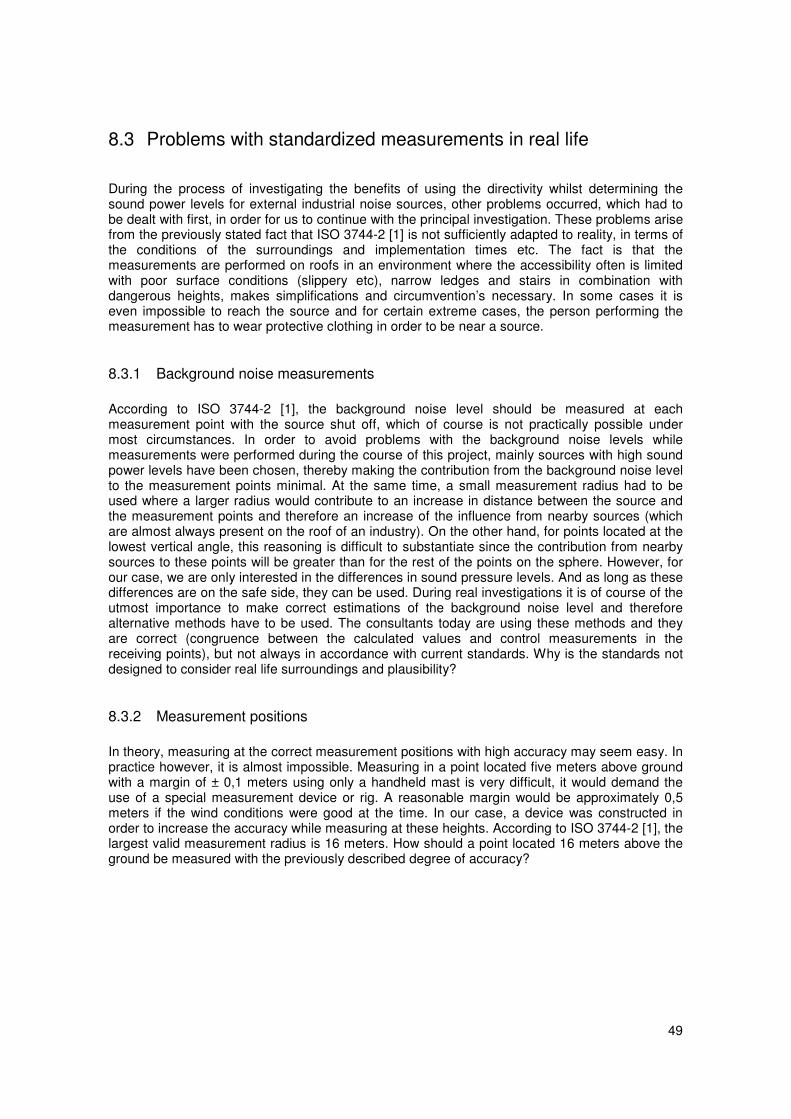
Figure 44 Source 2: Directed straight up. without directivity
49
8.3 Problems with standardized measurements in real life
During the process of investigating the benefits of using the directivity whilst determining thesound power levels for external industrial noise sources, other problems occurred, which had tobe dealt with first, in order for us to continue with the principal investigation. These problems arisefrom the previously stated fact that ISO 3744-2 [1] is not sufficiently adapted to reality, in terms ofthe conditions of the surroundings and implementation times etc. The fact is that themeasurements are performed on roofs in an environment where the accessibility often is limitedwith poor surface conditions (slippery etc), narrow ledges and stairs in combination withdangerous heights, makes simplifications and circumvention’s necessary. In some cases it iseven impossible to reach the source and for certain extreme cases, the person performing themeasurement has to wear protective clothing in order to be near a source.
8.3.1 Background noise measurements
According to ISO 3744-2 [1], the background noise level should be measured at eachmeasurement point with the source shut off, which of course is not practically possible undermost circumstances. In order to avoid problems with the background noise levels whilemeasurements were performed during the course of this project, mainly sources with high soundpower levels have been chosen, thereby making the contribution from the background noise levelto the measurement points minimal. At the same time, a small measurement radius had to beused where a larger radius would contribute to an increase in distance between the source andthe measurement points and therefore an increase of the influence from nearby sources (whichare almost always present on the roof of an industry). On the other hand, for points located at thelowest vertical angle, this reasoning is difficult to substantiate since the contribution from nearbysources to these points will be greater than for the rest of the points on the sphere. However, forour case, we are only interested in the differences in sound pressure levels. And as long as thesedifferences are on the safe side, they can be used. During real investigations it is of course of theutmost importance to make correct estimations of the background noise level and thereforealternative methods have to be used. The consultants today are using these methods and theyare correct (congruence between the calculated values and control measurements in thereceiving points), but not always in accordance with current standards. Why is the standards notdesigned to consider real life surroundings and plausibility?
8.3.2 Measurement positions
In theory, measuring at the correct measurement positions with high accuracy may seem easy. Inpractice however, it is almost impossible. Measuring in a point located five meters above groundwith a margin of ± 0,1 meters using only a handheld mast is very difficult, it would demand theuse of a special measurement device or rig. A reasonable margin would be approximately 0,5meters if the wind conditions were good at the time. In our case, a device was constructed inorder to increase the accuracy while measuring at these heights. According to ISO 3744-2 [1], thelargest valid measurement radius is 16 meters. How should a point located 16 meters above theground be measured with the previously described degree of accuracy?

50

51
9 Conclusions & Recommendations
(Firstly, we would like to state that we believe that the objectives for this project have beenreached). The results from measurements and analysis clearly show that the use of Appendix Ein ISO 3744-2 [1] with the modified method has noticeable effects on the results; sizeable enoughto not be discarded. It has been shown that for the measured sources, a 10 dB difference couldbe achieved only by using this consideration.
Even if one, using simplified measurement methods, can perform measurements in suitabledirections and thereby circumventing the current standardized methods and still end up with asound pressure level which is valid for the receiving points, one still does not have a sufficientdescription of the source, necessary for source alteration measures.
Concerning DIN 45635-47 [2], it has proved to be a very practical and useful standard for thetypes of measurement performed during this project. However, the problem with the uniformrepresentation of the source, as for the consultants method, still remains.
Although the modified method, based on ISO 3744-2 [1], worked properly and our device provedto increase the accuracy during measurements as well as decreasing measurement time, themethod is not practicable when a ENASI is to be performed and a large number of sources haveto be measured under a limited period of time.
Further, one should consider the fact that the results received from our measurements are theactual results and may therefore differ from results acquired from the use of a hypotheticalanalytical model based on the same or similar sources. It is important to notice this fact sincethere would most probably be noticeable difference between the two.
The purpose of this thesis was to show the benefits of considering the directivity whiledetermining the sound power levels from external industrial noise sources. Hopefully it willcontribute to further studies within the field and plant a seed of thought among the people dealingwith this subject on a daily basis.

52

53
10Improvements and proposed further work
During the process of the thesis work, several questions and ideas have come to us. There are,as we experienced, a lot of thoughts and ideas around the subject of the thesis as well as in otherrelated areas. Below is a list of recommendations for possible further investigations, sorted bytopic and area of interest. Some of them may even be suited for other thesis works themselves.
We recommend the following topics for further investigation:
• An investigation into the possibility of making a practical method for determination of thebackground noise level, without turning off the source.
• A method for making precise measurements at calculated measurement positions (either adevelopment of the modified method or design of another method), high accuracy positioningof the microphone.
• Development of a simplified measurement method for the determination and use of soundpower levels with consideration to directivity. How many measurement points are necessary?etc.
• Design of a standard for simpler determination of directivity. This could be a combination of:
1) Theoretical directivity of different types of sources e.g. chimney outlet, ventilation grid in awall, etc.
2) A measurement of sound pressure level in one carefully selected position.
• An investigation of how one would be able to foresee or determine the directivity from asource based on its physical properties alone. Properties such as; size, airflow velocity etc.
The work may in the future inspire to a continuation of the research into the current field ofinvestigation. This could lead to a revised edition of the standards regarding directivitydetermination and possibly even an account of how one should and must treat measurementvalues in order to achieve a correct assessment of the directivity.

54
55
11References
[1] ISO 3744-2, Acoustics – Determination of sound power levels of noise sources usingsound pressure –Engineering method in an essentially free field over a reflecting plane(ISO 3744:1994)
[2] DIN 45635-47, Measurement of noise emitted by machines; airborne noise emission;enveloping surface method; chimneys, June 1985.
[3] ISO 9613-2, Acoustics – Attenuation of sound during propagation outdoors – Part 2:General method of calculation – (ISO 9613-2:1996)
[4] DIN 45635-1, Measurement of noise emitted by machines; Airborne noise measurement,enveloping surface method; Test report (test record) form for enveloping surface method,1984-04.
[5] Braunstein + Berndt GmbH, SoundPLAN®, Users manual, January, 17th 2002.

Appendix 1
Measurement data and resultsIn this appendix, measurement data and results are displayed for each measured source. Themeasurement data is displayed in form of sheets containing a picture of the actual source, a table of thecoordinates used during the measurement, a table containing measurement information and a tabledisplaying the measured sound pressure levels in each measurement position.
The results for each source are presented in a graph and a plot. The graph contains a comparisonbetween the different measurement methods used and sows the equivalent A-weighted sound pressurelevel as well as the sound power levels for each octave band. The plot shows the directivity indices forthe source in octave bands interpolated from ten measurement points.
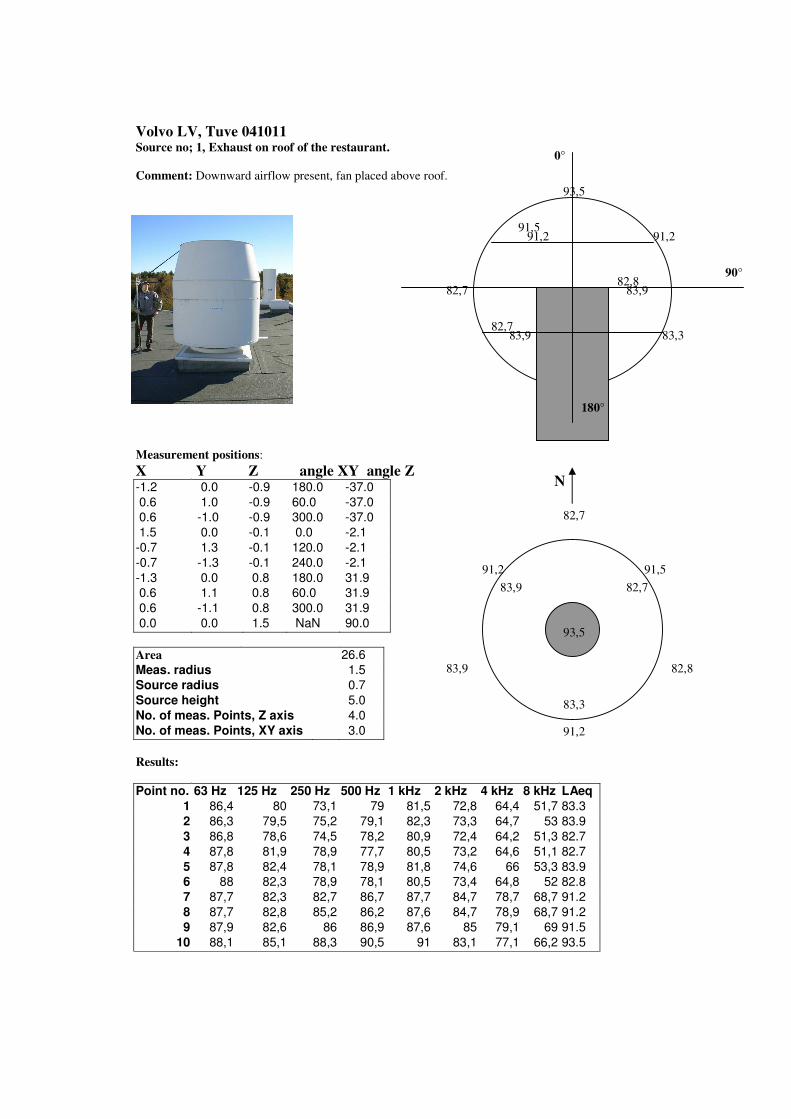
Volvo LV, Tuve 041011Source no; 1, Exhaust on roof of the restaurant.
Comment: Downward airflow present, fan placed above roof.
Measurement positions:X Y Z angle XY angle Z-1.2 0.0 -0.9 180.0 -37.00.6 1.0 -0.9 60.0 -37.00.6 -1.0 -0.9 300.0 -37.01.5 0.0 -0.1 0.0 -2.1
-0.7 1.3 -0.1 120.0 -2.1-0.7 -1.3 -0.1 240.0 -2.1-1.3 0.0 0.8 180.0 31.90.6 1.1 0.8 60.0 31.90.6 -1.1 0.8 300.0 31.90.0 0.0 1.5 NaN 90.0
Area 26.6Meas. radius 1.5Source radius 0.7Source height 5.0No. of meas. Points, Z axis 4.0No. of meas. Points, XY axis 3.0
Results:
Point no. 63 Hz 125 Hz 250 Hz 500 Hz 1 kHz 2 kHz 4 kHz 8 kHz LAeq1 86,4 80 73,1 79 81,5 72,8 64,4 51,7 83.32 86,3 79,5 75,2 79,1 82,3 73,3 64,7 53 83.93 86,8 78,6 74,5 78,2 80,9 72,4 64,2 51,3 82.74 87,8 81,9 78,9 77,7 80,5 73,2 64,6 51,1 82.75 87,8 82,4 78,1 78,9 81,8 74,6 66 53,3 83.96 88 82,3 78,9 78,1 80,5 73,4 64,8 52 82.87 87,7 82,3 82,7 86,7 87,7 84,7 78,7 68,7 91.28 87,7 82,8 85,2 86,2 87,6 84,7 78,9 68,7 91.29 87,9 82,6 86 86,9 87,6 85 79,1 69 91.5
10 88,1 85,1 88,3 90,5 91 83,1 77,1 66,2 93.5
82,7
83,3
83,9 82,7
82,883,9
91,2
91,2 91,5
93,5
N
90°
83,382,7
83,9
82,782,8
83,9
91,291,5
91,2
93,5
0°
180°

Directivityindex OctavebandInterpolated with 10 measurementpoints
-14
-12
-10
-8
-6
-4
-2
0
2
4
6
8
0 10 20 30 40 50 60 70 80 90 100 110
Vertical angles
Dir
ecti
vity
ind
ex(d
B)
63 Hz
125 Hz
250 Hz500 Hz
1000 Hz
2000 Hz
4000 Hz
8000 Hz
LAeq
0
20
40
60
80
100
120
dB
63 125 250 500 1000 2000 4000 8000 LAeqFrequency Hz
Sound Power Levels
Lw
Lw Din
Lw 45 grader
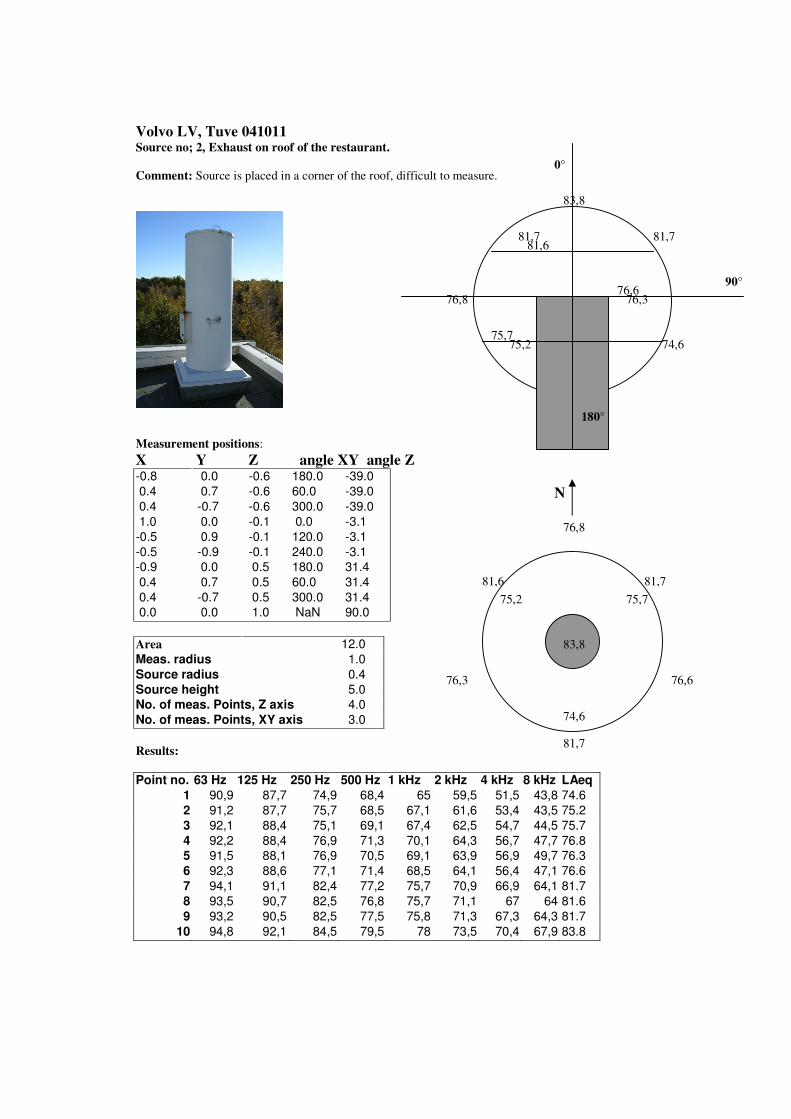
Volvo LV, Tuve 041011Source no; 2, Exhaust on roof of the restaurant.
Comment: Source is placed in a corner of the roof, difficult to measure.
Measurement positions:X Y Z angle XY angle Z-0.8 0.0 -0.6 180.0 -39.00.4 0.7 -0.6 60.0 -39.00.4 -0.7 -0.6 300.0 -39.01.0 0.0 -0.1 0.0 -3.1
-0.5 0.9 -0.1 120.0 -3.1-0.5 -0.9 -0.1 240.0 -3.1-0.9 0.0 0.5 180.0 31.40.4 0.7 0.5 60.0 31.40.4 -0.7 0.5 300.0 31.40.0 0.0 1.0 NaN 90.0
Area 12.0Meas. radius 1.0Source radius 0.4Source height 5.0No. of meas. Points, Z axis 4.0No. of meas. Points, XY axis 3.0
Results:
Point no. 63 Hz 125 Hz 250 Hz 500 Hz 1 kHz 2 kHz 4 kHz 8 kHz LAeq1 90,9 87,7 74,9 68,4 65 59,5 51,5 43,8 74.62 91,2 87,7 75,7 68,5 67,1 61,6 53,4 43,5 75.23 92,1 88,4 75,1 69,1 67,4 62,5 54,7 44,5 75.74 92,2 88,4 76,9 71,3 70,1 64,3 56,7 47,7 76.85 91,5 88,1 76,9 70,5 69,1 63,9 56,9 49,7 76.36 92,3 88,6 77,1 71,4 68,5 64,1 56,4 47,1 76.67 94,1 91,1 82,4 77,2 75,7 70,9 66,9 64,1 81.78 93,5 90,7 82,5 76,8 75,7 71,1 67 64 81.69 93,2 90,5 82,5 77,5 75,8 71,3 67,3 64,3 81.7
10 94,8 92,1 84,5 79,5 78 73,5 70,4 67,9 83.8
76,8
74,6
75,2 75,7
76,676,3
81,7
81,6 81,7
83,8
N
90°
74,675,7
75,2
76,876,6
76,3
81,781,781,6
83,8
0°
180°

Directivityindex OctavebandInterpolated with 10 measurementpoints
-20
-18
-16
-14
-12
-10
-8
-6
-4
-2
0
2
4
6
8
0 10 20 30 40 50 60 70 80 90 100 110 120 130
Vertical angles
Dir
ecti
vity
ind
ex(d
B)
63 Hz
125 Hz
250 Hz
500 Hz
1000 Hz
2000 Hz
4000 Hz
8000 Hz
LAeq
0
20
40
60
80
100
120
dB
63 125 250 500 1000 2000 4000 8000 LAeqFrequency Hz
Sound Power Levels
Lw
Lw Din
Lw 45 grader

Volvo LV, Tuve 041011Source no; 3, Exhaust on roof LA.
Comment: Nearby sources are located in the South/East.
Measurement positions:X Y Z angle XY angle Z-0.8 0.0 -0.7 180.0 -41.40.4 0.6 -0.7 60.0 -41.40.4 -0.6 -0.7 300.0 -41.41.0 0.0 -0.1 0.0 -4.3
-0.5 0.9 -0.1 120.0 -4.3-0.5 -0.9 -0.1 240.0 -4.3-0.9 0.0 0.5 180.0 30.80.4 0.7 0.5 60.0 30.80.4 -0.7 0.5 300.0 30.80.0 0.0 1.0 NaN 90.0
Area 12.3Meas. radius 1.0Source radius 0.3Source height 5.0No. of meas. Points, Z axis 4.0No. of meas. Points, XY axis 3.0
Results:
Point no. 63 Hz 125 Hz 250 Hz 500 Hz 1 kHz 2 kHz 4 kHz 8 kHz LAeq1 76,7 73,8 74,1 67,6 62,9 59,4 46,2 41,1 70.02 76,2 73,2 73,9 67,4 62,7 59,7 46,2 41,2 69.83 76,1 74,2 74,3 67,2 62,5 58,6 46,5 41,1 69.84 76,4 75,2 75,9 68 63,8 58,4 46,3 41,1 71.05 76,7 75,5 76,3 68,3 64,1 58,8 46,6 41,1 71.36 76,6 75,8 76,1 68,5 64,4 58 46,4 41,1 71.37 77,1 77,3 79,5 73,9 71,7 65,6 57,4 51,3 76.68 76,3 77 79,5 74,5 71,1 65,1 56,6 50,8 76.59 76,3 77,2 79,4 73,7 71,3 64,4 56,4 50,6 76.2
10 81 78,5 82,3 77,7 75,5 68 61,3 55,4 80.0
71,0
70,0
69,8 69,8
71,371,3
76,6
76,5 76,2
80,0
N
90°
70,069,8
69,8
71,071,3
71,3
76,676,2
76,5
80,0
0°
180°
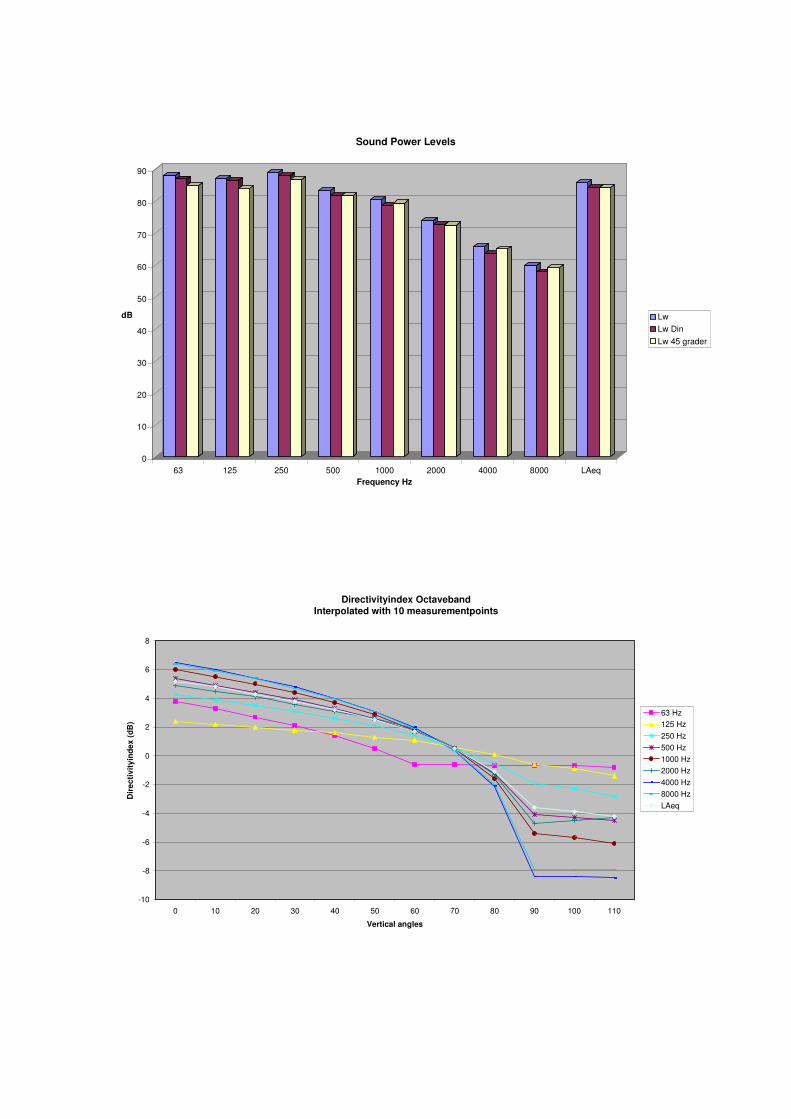
Directivityindex OctavebandInterpolated with 10 measurementpoints
-10
-8
-6
-4
-2
0
2
4
6
8
0 10 20 30 40 50 60 70 80 90 100 110
Vertical angles
Dir
ecti
vity
ind
ex(d
B)
63 Hz125 Hz
250 Hz
500 Hz
1000 Hz2000 Hz
4000 Hz
8000 Hz
LAeq
0
10
20
30
40
50
60
70
80
90
dB
63 125 250 500 1000 2000 4000 8000 LAeqFrequency Hz
Sound Power Levels
Lw
Lw Din
Lw 45 grader

Volvo LV, Tuve 040929Source no; 4, Exhaust on roof LB.
Measurement method: Projection of the measurement points onto the ground (roof), test with 16points.
Measurement positions:
X Y Z-1.2 0.0 1.90.6 1.0 1.90.6 -1.0 1.91.8 0.0 2.6
-0.9 1.6 2.6-0.9 -1.6 2.6-2.0 0.0 3.41.0 1.7 3.41.0 -1.7 3.41.9 0.0 4.1
-0.9 1.6 4.1-0.9 -1.6 4.1-1.4 0.0 4.90.7 1.3 4.90.7 -1.3 4.90.0 0.0 5.5
Results:Point no. 63 Hz 125 Hz 250 Hz 500 Hz 1 kHz 2 kHz 4 kHz 8 kHz LAeq
1 46.5 55.1 63.2 62.5 62.1 55.9 45.5 40.4 67.92 46.6 53.9 62.9 61.7 62.0 56.4 46.8 40.2 67.53 47.5 55.5 63.9 63.1 62.8 57.3 46.6 40.2 68.64 48.2 56.8 64.2 63.4 62.9 56.5 47.9 40.6 68.95 48.1 55.0 63.4 62.6 62.3 56.2 46.0 40.3 68.06 48.7 58.1 64.6 63.5 63.1 56.7 46.7 40.3 69.27 49.2 57.8 64.9 64.6 64.0 58.0 48.6 40.6 69.98 48.1 56.7 64.6 63.7 63.8 57.8 48.4 40.4 69.49 49.1 57.7 65.4 64.9 64.8 59.0 49.4 40.4 70.4
10 48.0 57.2 66.0 66.2 67.3 62.4 53.3 42.7 72.011 47.4 56.6 64.8 65.1 65.7 61.3 52.1 41.6 70.712 48.6 58.1 66.0 66.6 67.8 63.0 53.4 42.7 72.313 47.8 57.6 67.2 68.8 69.9 64.9 56.2 47.3 74.214 46.9 56.8 66.8 68.0 69.8 64.8 55.5 46.1 73.915 48.6 58.5 68.0 69.7 70.8 65.7 56.9 48.2 75.116 65.4 67.8 70.0 69.3 68.8 62.5 56.8 51.4 75.9

0
10
20
30
40
50
60
70
80
90
100
dB
63 125 250 500 1000 2000 4000 8000 LAeqFrequency Hz
Sound Power Levels
Lw
Lw Din
Lw 45 grader
Directivityindex OctavebandInterpolated with 10 measurementpoints
-8
-6
-4
-2
0
2
4
6
8
10
12
0 10 20 30 40 50 60 70 80 90 100 110 120 130
Vertical angles
Dir
ecti
vity
ind
ex(d
B)
63 Hz
125 Hz
250 Hz
500 Hz
1000 Hz
2000 Hz
4000 Hz
8000 Hz
Laeq

Volvo PV, Torslanda 041116Source no; 5, Exhaust on roof, paintshop.
Comment: -
Measurement positions:
X Y Z angle XY angle Z-1.6 0.0 -1.3 180.0 -39.00.8 1.3 -1.3 60.0 -39.00.8 -1.3 -1.3 300.0 -39.02.0 0.0 -0.1 0.0 -3.1
-1.0 1.7 -0.1 120.0 -3.1-1.0 -1.7 -0.1 240.0 -3.1-1.7 0.0 1.0 180.0 31.40.9 1.5 1.0 60.0 31.40.9 -1.5 1.0 300.0 31.40.0 0.0 2.0 NaN 90.0
Area 48.2Meas. radius 2.0Source radius 0.8Source height 5.0No. of meas. Points, Z axis 4.0No. of meas. Points, XY axis 3.0
Results:
Point no. 63 Hz 125 Hz 250 Hz 500 Hz 1 kHz 2 kHz 4 kHz 8 kHz LAeq1 69,1 66,6 65,6 59,1 57,2 52,8 44,3 31,1 62,42 70 70,3 71,8 60,5 58,2 50,9 40,9 25,7 65,23 68,1 66,3 64,7 59,3 55,7 50 40,5 26,3 61,44 68,5 74,5 74,7 61,7 56,9 51,4 43,7 30,7 67,25 69,1 67,3 67,4 60,8 56,8 49,2 40,1 26,5 62,86 68,8 65,5 64,6 59,8 57,3 52,5 41,5 28,5 62,27 78,2 71,8 67,5 64,6 59,6 52 44,7 40,9 65,68 68,7 68,3 67,7 64,5 61,4 53,4 44,6 39,9 65,99 76,8 74,5 74,5 66,4 60,6 52,8 44,8 41,2 68,7
10 81,5 75,8 73 66,9 61,9 53,6 46,9 42,9 68,9
67,2
62,4
65,2 61,4
62,262,8
65,6
65,9 68,7
N
68,9
90°
62,461,4
65,2
67,262,2
62,8
65,668,7
65,9
68,9
0°
180°
270°

0
10
20
30
40
50
60
70
80
90
100
dB(A)
63 125 250 500 1000 2000 4000 8000 LaeqFrequency Hz
Sound Power Levels
Lw
Lw Din
Lw 45 grader
Directivityindex OctavebandInterpolated with 10 measurementpoints
-12
-10
-8
-6
-4
-2
0
2
4
6
8
0 10 20 30 40 50 60 70 80 90 100 110 120 130
Vertical angles
Dir
ecti
vity
ind
ex(d
B)
63 Hz
125 Hz
250 Hz
500 Hz
1000 Hz
2000 Hz
4000 Hz
8000 Hz
Laeq
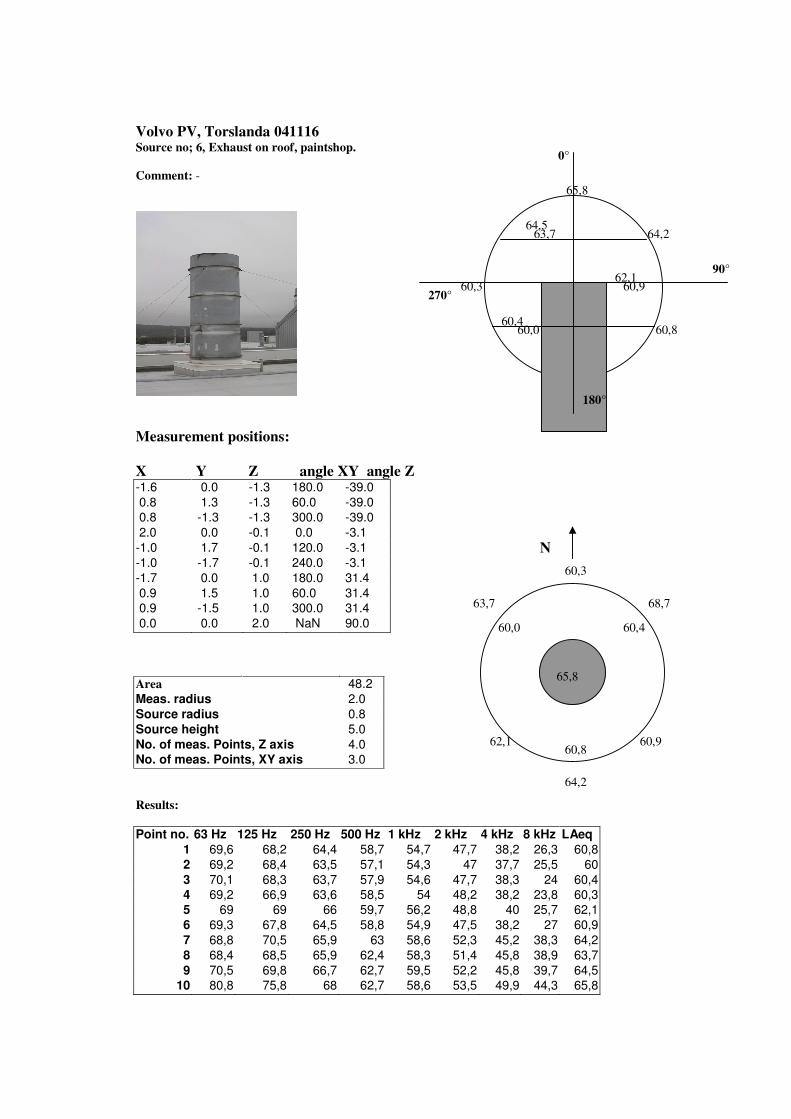
Volvo PV, Torslanda 041116Source no; 6, Exhaust on roof, paintshop.
Comment: -
Measurement positions:
X Y Z angle XY angle Z-1.6 0.0 -1.3 180.0 -39.00.8 1.3 -1.3 60.0 -39.00.8 -1.3 -1.3 300.0 -39.02.0 0.0 -0.1 0.0 -3.1
-1.0 1.7 -0.1 120.0 -3.1-1.0 -1.7 -0.1 240.0 -3.1-1.7 0.0 1.0 180.0 31.40.9 1.5 1.0 60.0 31.40.9 -1.5 1.0 300.0 31.40.0 0.0 2.0 NaN 90.0
Area 48.2Meas. radius 2.0Source radius 0.8Source height 5.0No. of meas. Points, Z axis 4.0No. of meas. Points, XY axis 3.0
Results:
Point no. 63 Hz 125 Hz 250 Hz 500 Hz 1 kHz 2 kHz 4 kHz 8 kHz LAeq1 69,6 68,2 64,4 58,7 54,7 47,7 38,2 26,3 60,82 69,2 68,4 63,5 57,1 54,3 47 37,7 25,5 603 70,1 68,3 63,7 57,9 54,6 47,7 38,3 24 60,44 69,2 66,9 63,6 58,5 54 48,2 38,2 23,8 60,35 69 69 66 59,7 56,2 48,8 40 25,7 62,16 69,3 67,8 64,5 58,8 54,9 47,5 38,2 27 60,97 68,8 70,5 65,9 63 58,6 52,3 45,2 38,3 64,28 68,4 68,5 65,9 62,4 58,3 51,4 45,8 38,9 63,79 70,5 69,8 66,7 62,7 59,5 52,2 45,8 39,7 64,5
10 80,8 75,8 68 62,7 58,6 53,5 49,9 44,3 65,8
60,3
60,8
60,0 60,4
60,962,1
64,2
63,7 68,7
N
65,8
90°
60,860,4
60,0
60,362,1
60,9
64,264,5
63,7
65,8
0°
180°
270°

0
10
20
30
40
50
60
70
80
90
100
dB(A)
63 125 250 500 1000 2000 4000 8000 LaeqFrequency Hz
Sound Power Levels
Lw
Lw Din
Lw 45 grader
Directivityindex OctavebandInterpolated with 10 measurementpoints
-14
-12
-10
-8
-6
-4
-2
0
2
4
6
8
10
0 10 20 30 40 50 60 70 80 90 100 110 120 130
Vertical angles
Dir
ecti
vity
ind
ex(d
B)
63 Hz
125 Hz
250 Hz
500 Hz1000 Hz
2000 Hz
4000 Hz
8000 Hz
Laeq
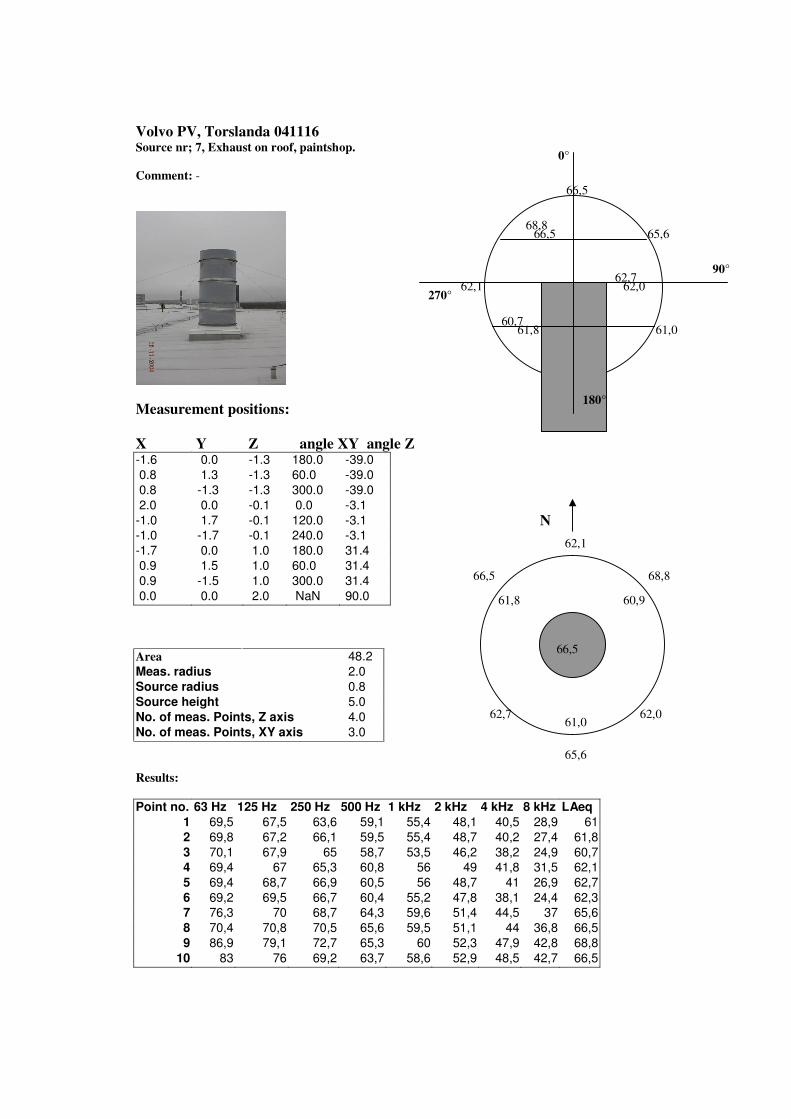
Volvo PV, Torslanda 041116Source nr; 7, Exhaust on roof, paintshop.
Comment: -
Measurement positions:
X Y Z angle XY angle Z-1.6 0.0 -1.3 180.0 -39.00.8 1.3 -1.3 60.0 -39.00.8 -1.3 -1.3 300.0 -39.02.0 0.0 -0.1 0.0 -3.1
-1.0 1.7 -0.1 120.0 -3.1-1.0 -1.7 -0.1 240.0 -3.1-1.7 0.0 1.0 180.0 31.40.9 1.5 1.0 60.0 31.40.9 -1.5 1.0 300.0 31.40.0 0.0 2.0 NaN 90.0
Area 48.2Meas. radius 2.0Source radius 0.8Source height 5.0No. of meas. Points, Z axis 4.0No. of meas. Points, XY axis 3.0
Results:
Point no. 63 Hz 125 Hz 250 Hz 500 Hz 1 kHz 2 kHz 4 kHz 8 kHz LAeq1 69,5 67,5 63,6 59,1 55,4 48,1 40,5 28,9 612 69,8 67,2 66,1 59,5 55,4 48,7 40,2 27,4 61,83 70,1 67,9 65 58,7 53,5 46,2 38,2 24,9 60,74 69,4 67 65,3 60,8 56 49 41,8 31,5 62,15 69,4 68,7 66,9 60,5 56 48,7 41 26,9 62,76 69,2 69,5 66,7 60,4 55,2 47,8 38,1 24,4 62,37 76,3 70 68,7 64,3 59,6 51,4 44,5 37 65,68 70,4 70,8 70,5 65,6 59,5 51,1 44 36,8 66,59 86,9 79,1 72,7 65,3 60 52,3 47,9 42,8 68,8
10 83 76 69,2 63,7 58,6 52,9 48,5 42,7 66,5
62,1
61,0
61,8 60,9
62,062,7
65,6
66,5 68,8
N
66,5
90°
61,060,7
61,8
62,162,7
62,0
65,668,8
66,5
66,5
0°
180°
270°
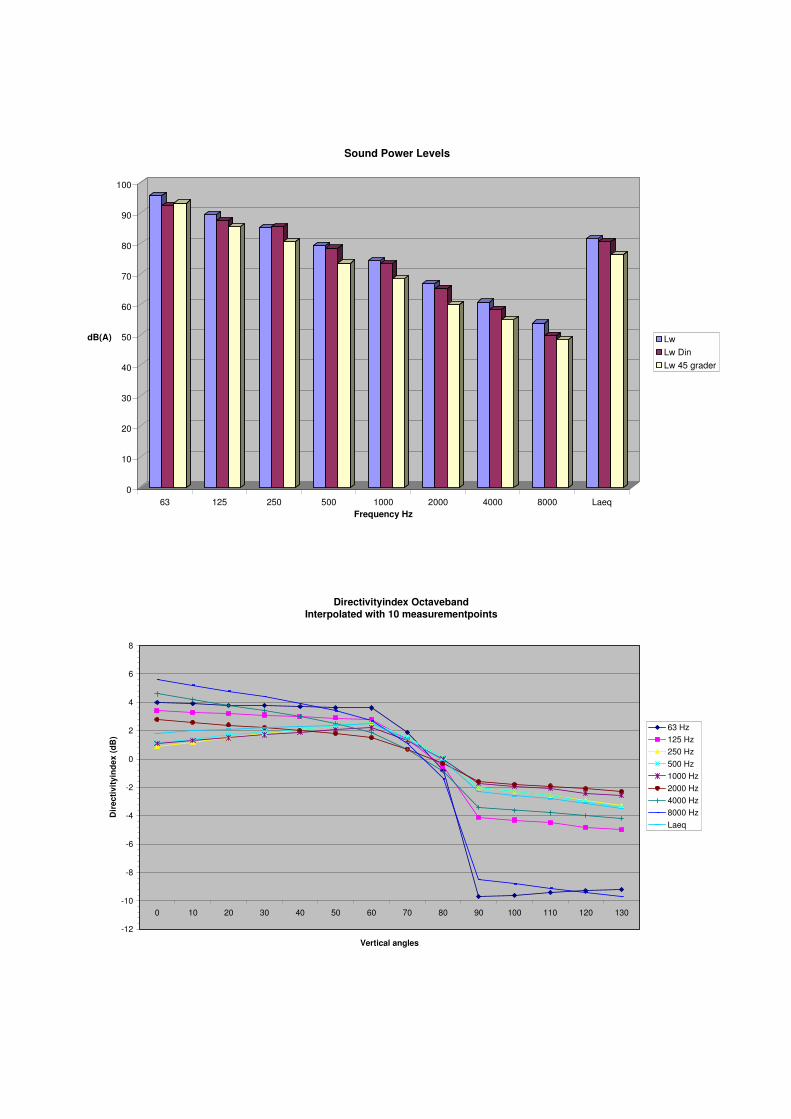
0
10
20
30
40
50
60
70
80
90
100
dB(A)
63 125 250 500 1000 2000 4000 8000 LaeqFrequency Hz
Sound Power Levels
Lw
Lw Din
Lw 45 grader
Directivityindex OctavebandInterpolated with 10 measurementpoints
-12
-10
-8
-6
-4
-2
0
2
4
6
8
0 10 20 30 40 50 60 70 80 90 100 110 120 130
Vertical angles
Dir
ecti
vity
ind
ex(d
B)
63 Hz
125 Hz
250 Hz
500 Hz
1000 Hz
2000 Hz
4000 Hz
8000 Hz
Laeq

Volvo PV, Torslanda 041116Source no; 8, Exhaust on roof, paintshop.
Comment: -
Measurement positions:
X Y Z angle XY angle Z-1.6 0.0 -1.3 180.0 -39.00.8 1.3 -1.3 60.0 -39.00.8 -1.3 -1.3 300.0 -39.02.0 0.0 -0.1 0.0 -3.1
-1.0 1.7 -0.1 120.0 -3.1-1.0 -1.7 -0.1 240.0 -3.1-1.7 0.0 1.0 180.0 31.40.9 1.5 1.0 60.0 31.40.9 -1.5 1.0 300.0 31.40.0 0.0 2.0 NaN 90.0
Area 48.2Meas. radius 2.0Source radius 0.8Source height 5.0No. of meas. Points, Z axis 4.0No. of meas. Points, XY axis 3.0
Results:
Point no. 63 Hz 125 Hz 250 Hz 500 Hz 1 kHz 2 kHz 4 kHz 8 kHz LAeq1 66,5 61,6 58,9 55,3 53,6 47,6 39,1 26,1 57,92 67,8 64 60,1 56,1 53,7 47,3 38,7 25,3 58,53 67,8 63,6 59,6 56,3 54,8 48,4 39,1 26,8 58,94 66 63,4 60,4 58,2 54,4 47,8 39,8 27,2 59,55 66,4 64,9 60,6 57,9 55,3 49,3 40,9 28,5 606 65,7 64 60,4 56,7 53,7 47,7 39,2 26,4 58,77 65,2 64,4 60,3 58,1 54,6 48,6 40,1 27,3 59,68 68,6 64,9 60,5 57,5 54,5 48,6 40 28 59,59 67,9 64,8 61,4 58,8 56,6 50,7 41,9 28,2 61
10 67,9 65,5 62,1 59,4 56,9 52,1 45,2 31,7 61,7
59,5
57,9
58,5 58,9
58,760,0
59,6
59,5 61,0
N
61,7
90°
57,958,4
58,5
59,558,7
60,0
59,659,5
61,0
61,7
0°
180°
270°

0
10
20
30
40
50
60
70
80
90
dB(A)
63 125 250 500 1000 2000 4000 8000 LaeqFrequency Hz
Sound Power Levels
Lw
Lw Din
Lw 45 grader
Directivityindex OctavebandInterpolated with 10 measurementpoints
-4
-2
0
2
4
6
0 10 20 30 40 50 60 70 80 90 100 110 120 130
Vertical angles
Dir
ecti
vity
ind
ex(d
B)
63 Hz
125 Hz
250 Hz
500 Hz
1000 Hz
2000 Hz
4000 Hz
8000 Hz
Laeq
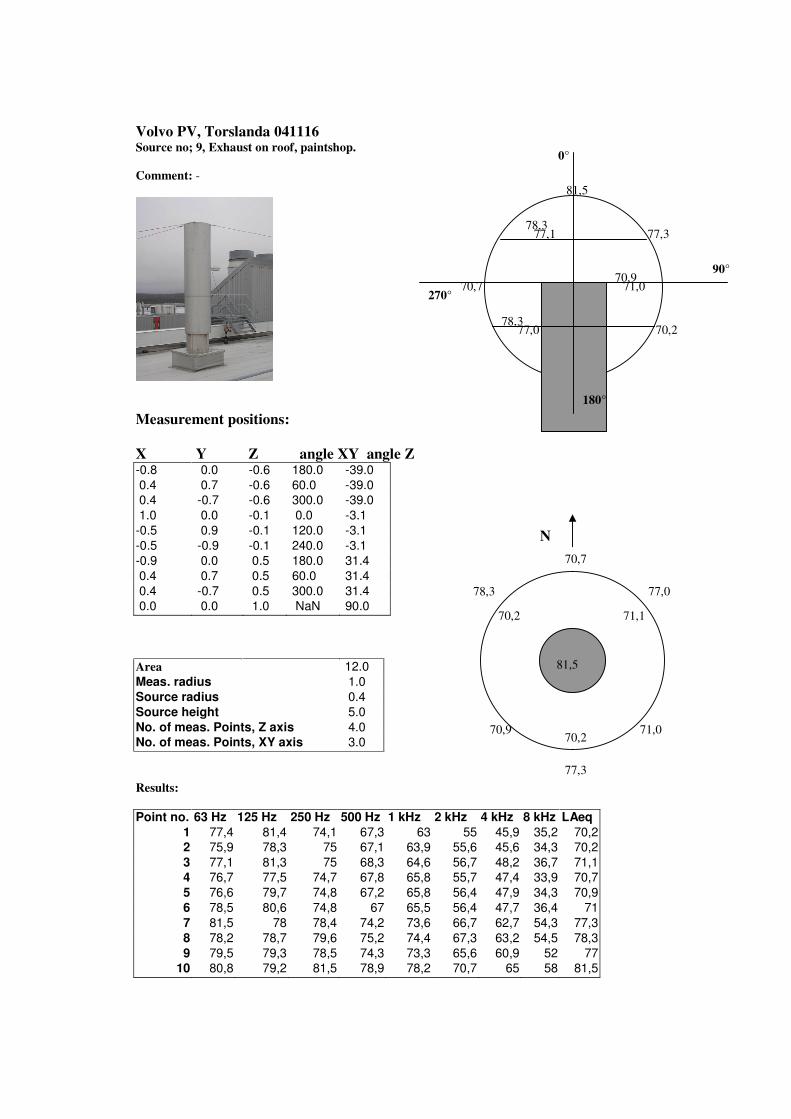
Volvo PV, Torslanda 041116Source no; 9, Exhaust on roof, paintshop.
Comment: -
Measurement positions:
X Y Z angle XY angle Z-0.8 0.0 -0.6 180.0 -39.00.4 0.7 -0.6 60.0 -39.00.4 -0.7 -0.6 300.0 -39.01.0 0.0 -0.1 0.0 -3.1
-0.5 0.9 -0.1 120.0 -3.1-0.5 -0.9 -0.1 240.0 -3.1-0.9 0.0 0.5 180.0 31.40.4 0.7 0.5 60.0 31.40.4 -0.7 0.5 300.0 31.40.0 0.0 1.0 NaN 90.0
Area 12.0Meas. radius 1.0Source radius 0.4Source height 5.0No. of meas. Points, Z axis 4.0No. of meas. Points, XY axis 3.0
Results:
Point no. 63 Hz 125 Hz 250 Hz 500 Hz 1 kHz 2 kHz 4 kHz 8 kHz LAeq1 77,4 81,4 74,1 67,3 63 55 45,9 35,2 70,22 75,9 78,3 75 67,1 63,9 55,6 45,6 34,3 70,23 77,1 81,3 75 68,3 64,6 56,7 48,2 36,7 71,14 76,7 77,5 74,7 67,8 65,8 55,7 47,4 33,9 70,75 76,6 79,7 74,8 67,2 65,8 56,4 47,9 34,3 70,96 78,5 80,6 74,8 67 65,5 56,4 47,7 36,4 717 81,5 78 78,4 74,2 73,6 66,7 62,7 54,3 77,38 78,2 78,7 79,6 75,2 74,4 67,3 63,2 54,5 78,39 79,5 79,3 78,5 74,3 73,3 65,6 60,9 52 77
10 80,8 79,2 81,5 78,9 78,2 70,7 65 58 81,5
70,7
70,2
70,2 71,1
71,070,9
77,3
78,3 77,0
N
81,5
90°
70,278,3
77,0
70,770,9
71,0
77,378,3
77,1
81,5
0°
180°
270°

0
10
20
30
40
50
60
70
80
90
100
dB(A)
63 125 250 500 1000 2000 4000 8000 LaeqFrequency Hz
Sound Power Levels
Lw
Lw Din
Lw 45 grader
Directivityindex OctavebandInterpolated with 10 measurementpoints
-18
-16
-14
-12
-10
-8
-6
-4
-2
0
2
4
6
8
0 10 20 30 40 50 60 70 80 90 100 110 120 130
Vertical angles
Dir
ecti
vity
ind
ex(d
B)
63 Hz
125 Hz
250 Hz
500 Hz
1000 Hz
2000 Hz
4000 Hz
8000 Hz
Laeq
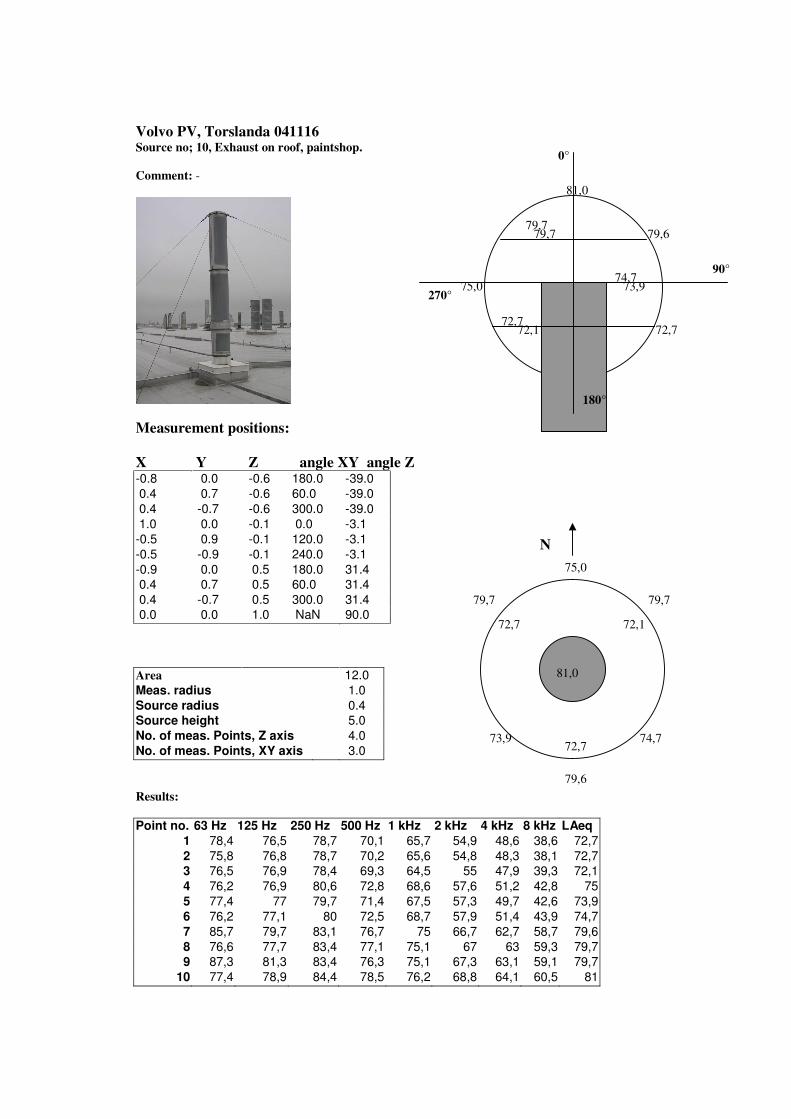
Volvo PV, Torslanda 041116Source no; 10, Exhaust on roof, paintshop.
Comment: -
Measurement positions:
X Y Z angle XY angle Z-0.8 0.0 -0.6 180.0 -39.00.4 0.7 -0.6 60.0 -39.00.4 -0.7 -0.6 300.0 -39.01.0 0.0 -0.1 0.0 -3.1
-0.5 0.9 -0.1 120.0 -3.1-0.5 -0.9 -0.1 240.0 -3.1-0.9 0.0 0.5 180.0 31.40.4 0.7 0.5 60.0 31.40.4 -0.7 0.5 300.0 31.40.0 0.0 1.0 NaN 90.0
Area 12.0Meas. radius 1.0Source radius 0.4Source height 5.0No. of meas. Points, Z axis 4.0No. of meas. Points, XY axis 3.0
Results:
Point no. 63 Hz 125 Hz 250 Hz 500 Hz 1 kHz 2 kHz 4 kHz 8 kHz LAeq1 78,4 76,5 78,7 70,1 65,7 54,9 48,6 38,6 72,72 75,8 76,8 78,7 70,2 65,6 54,8 48,3 38,1 72,73 76,5 76,9 78,4 69,3 64,5 55 47,9 39,3 72,14 76,2 76,9 80,6 72,8 68,6 57,6 51,2 42,8 755 77,4 77 79,7 71,4 67,5 57,3 49,7 42,6 73,96 76,2 77,1 80 72,5 68,7 57,9 51,4 43,9 74,77 85,7 79,7 83,1 76,7 75 66,7 62,7 58,7 79,68 76,6 77,7 83,4 77,1 75,1 67 63 59,3 79,79 87,3 81,3 83,4 76,3 75,1 67,3 63,1 59,1 79,7
10 77,4 78,9 84,4 78,5 76,2 68,8 64,1 60,5 81
75,0
72,7
72,7 72,1
74,773,9
79,6
79,7 79,7
N
81,0
90°
72,772,7
72,1
75,074,7
73,9
79,679,7
79,7
81,0
0°
180°
270°

0
10
20
30
40
50
60
70
80
90
100
dB(A)
63 125 250 500 1000 2000 4000 8000 LaeqFrequency Hz
Sound Power Levels
Lw
Lw Din
Lw 45 grader
Directivityindex OctavebandInterpolated with 10 measurementpoints
-18
-16
-14
-12
-10
-8
-6
-4
-2
0
2
4
6
0 10 20 30 40 50 60 70 80 90 100 110 120 130
Vertical angles
Dir
ecti
vity
ind
ex(d
B) 63 Hz
125 Hz
250 Hz
500 Hz1000 Hz
2000 Hz
4000 Hz
8000 HzLaeq
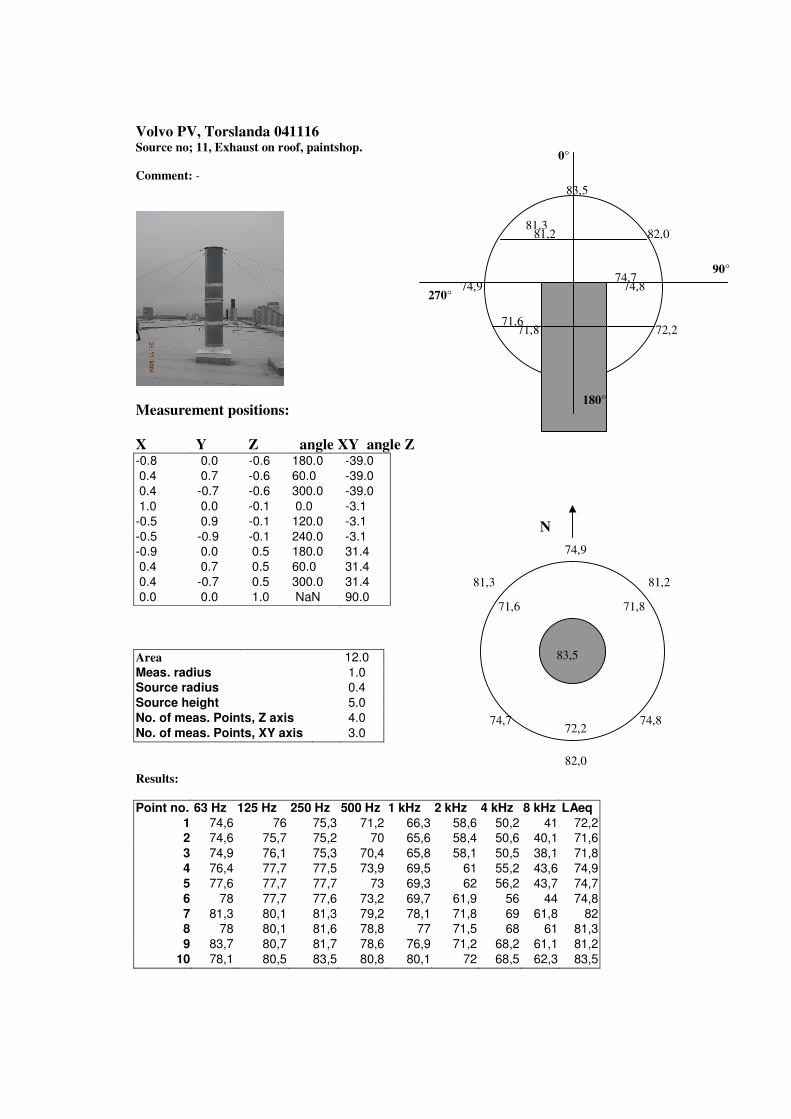
Volvo PV, Torslanda 041116Source no; 11, Exhaust on roof, paintshop.
Comment: -
Measurement positions:
X Y Z angle XY angle Z-0.8 0.0 -0.6 180.0 -39.00.4 0.7 -0.6 60.0 -39.00.4 -0.7 -0.6 300.0 -39.01.0 0.0 -0.1 0.0 -3.1
-0.5 0.9 -0.1 120.0 -3.1-0.5 -0.9 -0.1 240.0 -3.1-0.9 0.0 0.5 180.0 31.40.4 0.7 0.5 60.0 31.40.4 -0.7 0.5 300.0 31.40.0 0.0 1.0 NaN 90.0
Area 12.0Meas. radius 1.0Source radius 0.4Source height 5.0No. of meas. Points, Z axis 4.0No. of meas. Points, XY axis 3.0
Results:
Point no. 63 Hz 125 Hz 250 Hz 500 Hz 1 kHz 2 kHz 4 kHz 8 kHz LAeq1 74,6 76 75,3 71,2 66,3 58,6 50,2 41 72,22 74,6 75,7 75,2 70 65,6 58,4 50,6 40,1 71,63 74,9 76,1 75,3 70,4 65,8 58,1 50,5 38,1 71,84 76,4 77,7 77,5 73,9 69,5 61 55,2 43,6 74,95 77,6 77,7 77,7 73 69,3 62 56,2 43,7 74,76 78 77,7 77,6 73,2 69,7 61,9 56 44 74,87 81,3 80,1 81,3 79,2 78,1 71,8 69 61,8 828 78 80,1 81,6 78,8 77 71,5 68 61 81,39 83,7 80,7 81,7 78,6 76,9 71,2 68,2 61,1 81,2
10 78,1 80,5 83,5 80,8 80,1 72 68,5 62,3 83,5
74,9
72,2
71,6 71,8
74,874,7
82,0
81,3 81,2
N
83,5
90°
72,271,6
71,8
74,974,7
74,8
82,081,3
81,2
83,5
0°
180°
270°

0
10
20
30
40
50
60
70
80
90
100
dB
63 125 250 500 1000 2000 4000 8000 LAeq
Frequency Hz
Sound Power Levels
Lw
Lw Din
Lw 45 grader
Directivityindex OctavebandInterpolated with 10 measurementpoints
-20
-18
-16
-14
-12
-10
-8
-6
-4
-2
0
2
4
6
8
0 10 20 30 40 50 60 70 80 90 100 110 120 130
Vertical angles
Dir
ecti
vity
ind
ex(d
B)
63 Hz
125 Hz
250 Hz500 Hz
1000 Hz
2000 Hz
4000 Hz
8000 Hz
Laeq

Volvo LV, Tuve 041011Source no; 12, Exhaust on roof LB.
Comment: High background noise level.
Measurement positions:X Y Z angle XY angle Z-1.9 0.0 -0.6 180.0 -16.01.0 1.7 -0.6 60.0 -16.01.0 -1.7 -0.6 300.0 -16.02.0 0.0 0.4 0.0 10.1
-1.0 1.7 0.4 120.0 10.1-1.0 -1.7 0.4 240.0 10.1-1.6 0.0 1.3 180.0 38.70.8 1.4 1.3 60.0 38.70.8 -1.4 1.3 300.0 38.70.0 0.0 2.0 NaN 90.0
Area 37.7Meas. radius 2.0Source radius 0.1Source height 1.0No. of meas. Points, Z axis 4.0No. of meas. Points, XY axis 3.0
Results:
Point no. 63 Hz 125 Hz 250 Hz 500 Hz 1 kHz 2 kHz 4 kHz 8 kHz LAeq1 78,8 71,4 64,1 61,3 57 47,6 39,7 41,1 63.12 80,8 73,7 65,6 62,6 58,2 50,6 43,4 41,1 64.83 81 72,9 65,8 63,2 58,4 51,5 43,8 41,1 64.94 78,1 74 69,7 65 59,8 52,5 45,9 41,2 66.75 76,9 72,4 65,9 63 58,6 51,1 45,8 41,1 64.66 76,8 72,4 68,5 62,7 59,2 50,8 44,2 41,1 65.27 78,5 74 68,1 64,1 59,6 52,2 47 42,8 66.08 78,6 73,9 68,7 64,8 60,3 52,5 47,3 42,7 66.59 77,1 73,3 68,7 65,7 61,1 52,5 47 42,5 66.9
10 80,2 73,6 69,7 65,8 60,9 53,1 49 44,9 67.3
90°
63,164,964,8
66,7 65,264,6
66,066,9
66,5
67,3
0°
180°
66,7
63,1
64,8 64,9
65,264,6
66,0
66,5 66,9
67,3
N
67,3

0
10
20
30
40
50
60
70
80
90
100
dB
63 125 250 500 1000 2000 4000 8000 LAeqFrequency Hz
Sound Power Levels
Lw
Lw 45 grader
Directivityindex OctavebandInterpolated with 10 measurementpoints
-4
-2
0
2
4
0 10 20 30 40 50 60 70 80 90 100 110
Vertical angles
Dir
ecti
vity
ind
ex(d
B)
63 Hz
125 Hz
250 Hz
500 Hz
1000 Hz
2000 Hz
4000 Hz
8000 Hz
LAeq

Volvo PV, Torslanda 041117Source no; 13, Exhaust on roof, paintshop.
Comment: -
Measurement positions:
X Y Z angle XY angle Z-2,9 0 -0,8 180 -161,4 2,5 -0,8 60 -161,4 -2,5 -0,8 300 -16
3 0 0,5 0 10,1-1,5 2,6 0,5 120 10,1-1,5 -2,6 0,5 240 10,1-2,3 0 1,9 180 38,71,2 2 1,9 60 38,71,2 -2 1,9 300 38,7
0 0 3 NaN 90
Area 84,8Meas. radius 3.0Source radius 1,1Source height 1.5No. of meas. Points, Z axis 4.0No. of meas. Points, XY axis 3.0
Results:
Point no. 63 Hz 125 Hz 250 Hz 500 Hz 1 kHz 2 kHz 4 kHz 8 kHz LAeq1 66,7 62 57,7 55,9 51,3 44,4 37,1 29,6 56,82 67,9 64,7 59,5 57,9 53,8 46,5 41,1 36,4 59,13 67,1 62,5 58,5 56,2 52,1 45,8 40,6 34,4 57,64 67,1 63,2 61,5 58,3 54,9 48,1 42,3 35,5 59,95 66,7 62,9 61 59,4 55,7 50,9 46,7 40 60,96 66,2 61,7 60,6 58,8 55,1 49,5 44,5 38,9 60,17 65,9 62,9 62,5 60,7 56,8 51,7 47,6 41 628 66,5 64,2 62,7 61,7 57,1 51,3 49,1 43,3 62,69 66 62,9 62,1 61,5 57 52,4 50 44,3 62,6
10 69 64,9 62,9 60,9 57,2 52,6 48,5 43,8 62,6
90°
56,8
59,9 60,9
59,1
62,6 62,0
60,9
62,9
57,6
62,6
0°
180˚
59,9
56,8
59,1 57,6
60,160,9
62,0
62,6 62,6
N
62,6
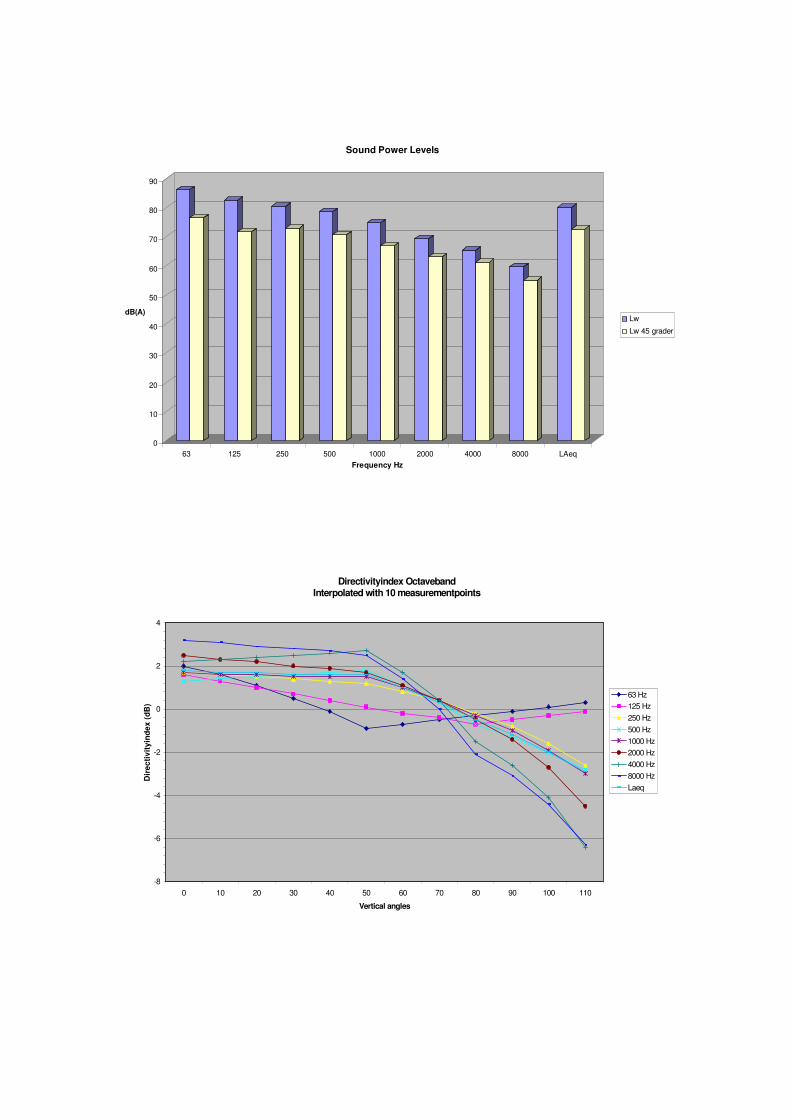
0
10
20
30
40
50
60
70
80
90
dB(A)
63 125 250 500 1000 2000 4000 8000 LAeq
Frequency Hz
Sound Power Levels
Lw
Lw 45 grader
Directivityindex OctavebandInterpolated with 10 measurementpoints
-8
-6
-4
-2
0
2
4
0 10 20 30 40 50 60 70 80 90 100 110
Vertical angles
Dir
ecti
vity
ind
ex(d
B)
63 Hz
125 Hz
250 Hz
500 Hz
1000 Hz
2000 Hz
4000 Hz
8000 Hz
Laeq

Volvo PV, Torslanda 041117Source no; 14, Exhaust on roof, paintshop.
Comment: -
Measurement positions:
X Y Z angle XY angle Z-2,9 0 -0,8 180 -161,4 2,5 -0,8 60 -161,4 -2,5 -0,8 300 -16
3 0 0,5 0 10,1-1,5 2,6 0,5 120 10,1-1,5 -2,6 0,5 240 10,1-2,3 0 1,9 180 38,71,2 2 1,9 60 38,71,2 -2 1,9 300 38,7
0 0 3 NaN 90
Area 84,8Meas. radius 3.0Source radius 1,1Source height 1.5No. of meas. Points, Z axis 4.0No. of meas. Points, XY axis 3.0
Results:
Point no. 63 Hz 125 Hz 250 Hz 500 Hz 1 kHz 2 kHz 4 kHz 8 kHz LAeq1 67,6 63,6 56,9 55,4 51,4 43,1 34,1 24,5 56,42 67,4 64,7 58 55,8 51,8 44,4 36,7 26,8 57,13 67,3 64,3 57,9 55,6 51,7 45,1 38,1 31,7 57,14 66,7 65,1 59,7 55,9 52,2 45,7 39,4 33,6 57,85 66,5 64,8 60,7 57 52,7 46,2 41,7 35,7 58,46 66,6 64,8 60,2 57 52,7 46,3 40,8 35,6 58,47 66,5 64,2 62 58,3 53,8 48,1 43,1 35,5 59,68 73,6 66,5 61 58,5 54 47 43,1 36,4 59,99 66,5 64,7 59,8 59,3 54,7 48,1 44,1 36,7 60
10 65,6 64,7 60,6 58,8 54,4 49,1 43,3 36,3 59,9
57,8
56,4
57,1 57,1
58,458,4
59,6
59,9 60,0
N
59,9
90°
56,4
57,8 58,4
57,1
60,0 59,6
58,4
59,9
57,1
59,9
0°
180˚
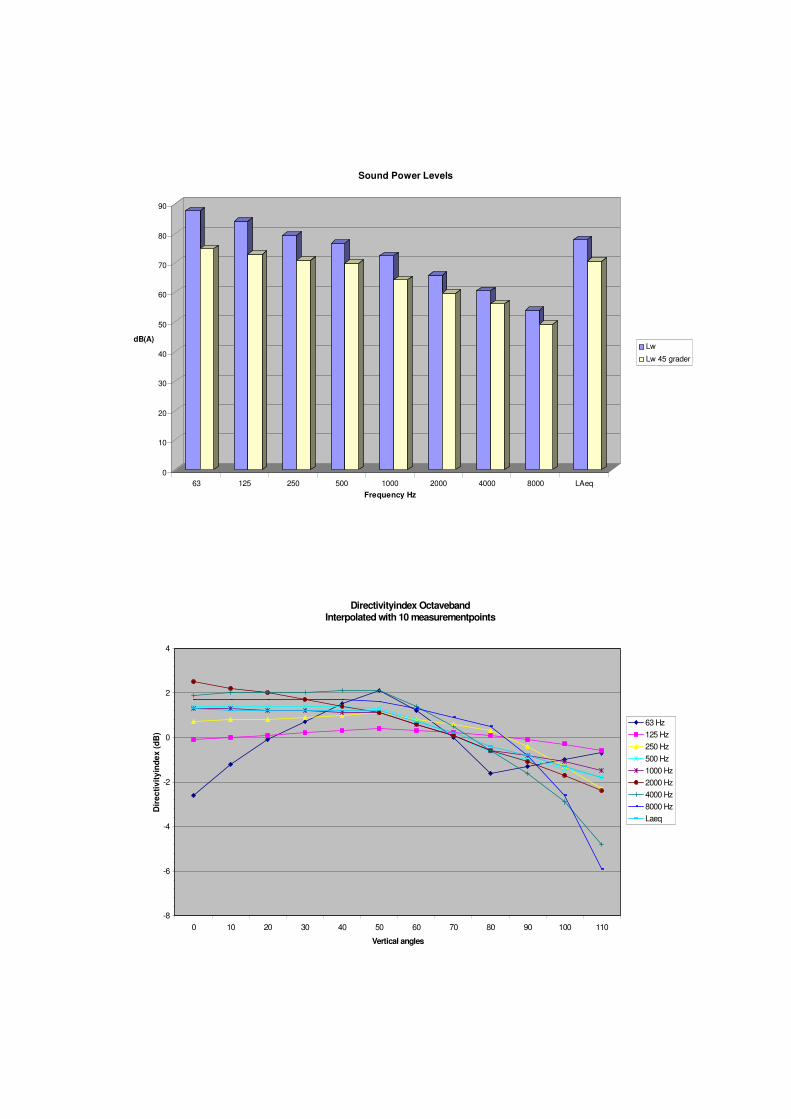
0
10
20
30
40
50
60
70
80
90
dB(A)
63 125 250 500 1000 2000 4000 8000 LAeq
Frequency Hz
Sound Power Levels
Lw
Lw 45 grader
Directivityindex OctavebandInterpolated with 10 measurementpoints
-8
-6
-4
-2
0
2
4
0 10 20 30 40 50 60 70 80 90 100 110
Vertical angles
Dir
ecti
vity
ind
ex(d
B)
63 Hz
125 Hz
250 Hz
500 Hz
1000 Hz
2000 Hz
4000 Hz
8000 Hz
Laeq
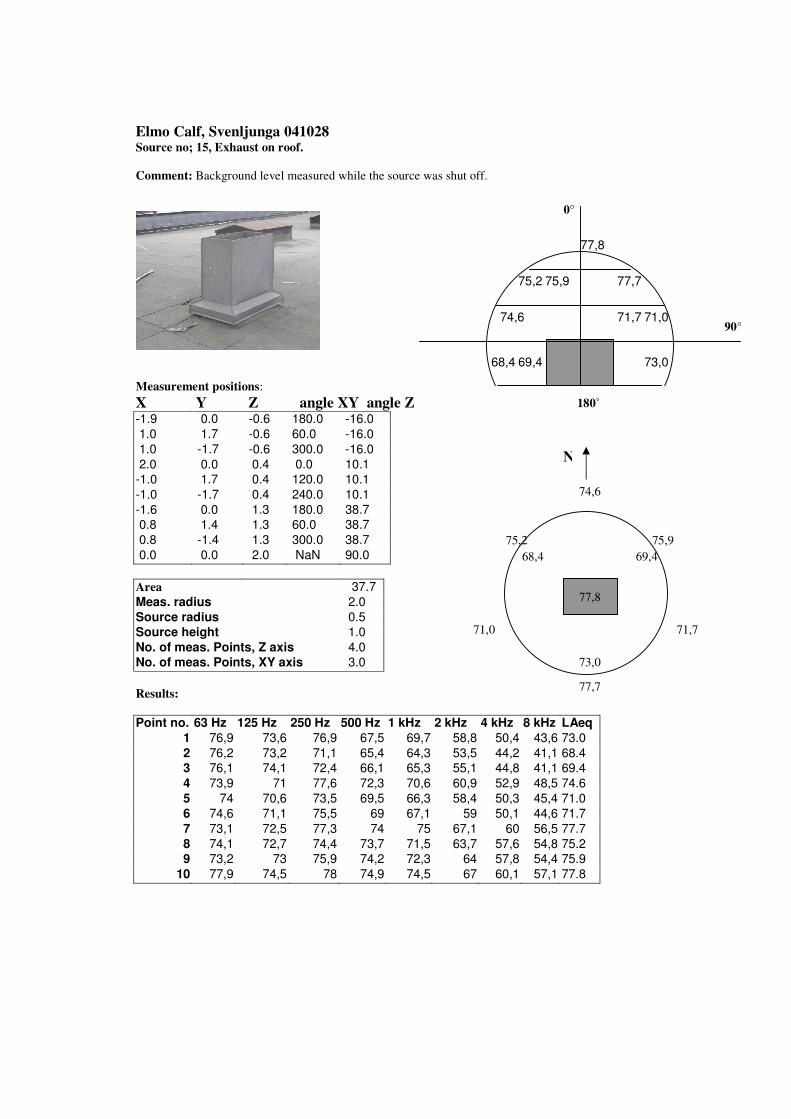
Elmo Calf, Svenljunga 041028Source no; 15, Exhaust on roof.
Comment: Background level measured while the source was shut off.
Measurement positions:X Y Z angle XY angle Z-1.9 0.0 -0.6 180.0 -16.01.0 1.7 -0.6 60.0 -16.01.0 -1.7 -0.6 300.0 -16.02.0 0.0 0.4 0.0 10.1
-1.0 1.7 0.4 120.0 10.1-1.0 -1.7 0.4 240.0 10.1-1.6 0.0 1.3 180.0 38.70.8 1.4 1.3 60.0 38.70.8 -1.4 1.3 300.0 38.70.0 0.0 2.0 NaN 90.0
Area 37.7Meas. radius 2.0Source radius 0.5Source height 1.0No. of meas. Points, Z axis 4.0No. of meas. Points, XY axis 3.0
Results:
Point no. 63 Hz 125 Hz 250 Hz 500 Hz 1 kHz 2 kHz 4 kHz 8 kHz LAeq1 76,9 73,6 76,9 67,5 69,7 58,8 50,4 43,6 73.02 76,2 73,2 71,1 65,4 64,3 53,5 44,2 41,1 68.43 76,1 74,1 72,4 66,1 65,3 55,1 44,8 41,1 69.44 73,9 71 77,6 72,3 70,6 60,9 52,9 48,5 74.65 74 70,6 73,5 69,5 66,3 58,4 50,3 45,4 71.06 74,6 71,1 75,5 69 67,1 59 50,1 44,6 71.77 73,1 72,5 77,3 74 75 67,1 60 56,5 77.78 74,1 72,7 74,4 73,7 71,5 63,7 57,6 54,8 75.29 73,2 73 75,9 74,2 72,3 64 57,8 54,4 75.9
10 77,9 74,5 78 74,9 74,5 67 60,1 57,1 77.8
90°
69,4
71,7 71,0
73,0
75,2 75,9
74,6
77,8
68,4
77,7
0°
180˚
74,6
73,0
68,4 69,4
71,771,0
77,7
75,2 75,9
N
77,8
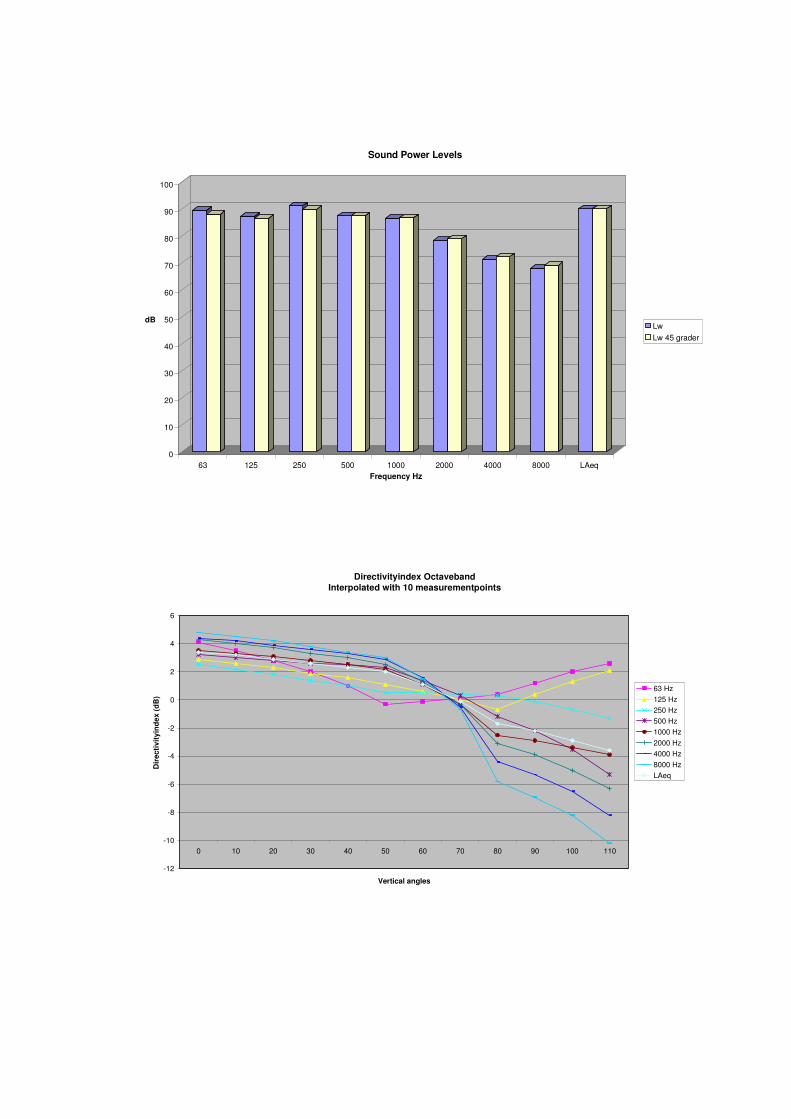
0
10
20
30
40
50
60
70
80
90
100
dB
63 125 250 500 1000 2000 4000 8000 LAeqFrequency Hz
Sound Power Levels
Lw
Lw 45 grader
Directivityindex OctavebandInterpolated with 10 measurementpoints
-12
-10
-8
-6
-4
-2
0
2
4
6
0 10 20 30 40 50 60 70 80 90 100 110
Vertical angles
Dir
ecti
vity
ind
ex(d
B)
63 Hz
125 Hz
250 Hz
500 Hz
1000 Hz
2000 Hz
4000 Hz
8000 Hz
LAeq

Elmo Calf, Svenljunga 041028Source no; 16, Exhaust on roof.
Comment: -
Measurement positions:X Y Z angle XY angle Z-1.9 0.0 -0.6 180.0 -16.01.0 1.7 -0.6 60.0 -16.01.0 -1.7 -0.6 300.0 -16.02.0 0.0 0.4 0.0 10.1
-1.0 1.7 0.4 120.0 10.1-1.0 -1.7 0.4 240.0 10.1-1.6 0.0 1.3 180.0 38.70.8 1.4 1.3 60.0 38.70.8 -1.4 1.3 300.0 38.70.0 0.0 2.0 NaN 90.0
Area 37.7Meas. radius 2.0Source radius 0.5Source height 1.0No. of meas. Points, Z axis 4.0No. of meas. Points, XY axis 3.0
Results:
Point no. 63 Hz 125 Hz 250 Hz 500 Hz 1 kHz 2 kHz 4 kHz 8 kHz LAeq1 78,6 77,4 78,2 69,6 65,8 52,1 44,3 41,1 72.62 79,7 77,9 78,3 66,8 61,9 50,7 44,5 41,1 71.63 78,7 76 75,3 67,8 61,6 50,1 42,3 41,1 70.04 77,8 73,8 80,2 72 67,1 56,4 47,1 41,4 74.45 78,4 75,6 79,3 68,2 63,3 53,2 45,4 41,1 72.56 76,5 74,5 76,7 67 62,6 53,4 45,7 41,1 70.67 76,3 75,5 79 72,7 70,8 60,2 51,1 42,2 75.38 76,9 74,9 76,6 70,5 66,3 57,2 48,8 41,4 72.39 76,2 74 74,8 70,2 65,8 56,2 47,9 41,3 71.4
10 75,2 75,9 81,1 74,7 71,7 60,9 49,3 44,6 76.8
90°
70,0
70,6 72,5
72,6
72,3 71,4
74,4
76,8
71,6
75,3
0°
180˚
74,4
72,6
71,6 70,0
70,672,5
75,3
72,3 71,4
N
76,8

0
10
20
30
40
50
60
70
80
90
100
dB
63 125 250 500 1000 2000 4000 8000 LAeqFrequency Hz
Sound Power Levels
Lw
Lw 45 grader
Directivityindex OctavebandInterpolated with 10 measurementpoints
-6
-4
-2
0
2
4
6
0 10 20 30 40 50 60 70 80 90 100 110
Vertical angles
Dir
ecti
vity
ind
ex(d
B)
63 Hz
125 Hz
250 Hz
500 Hz
1000 Hz
2000 Hz4000 Hz
8000 Hz
LAeq

Klippan AB, Mölndal 041014Source no; 17, Exhaust on roof.
Comment: Downward airflow present.
Measurement positions:X Y Z angle XY angle Z-0.8 0.0 -0.6 180.0 -39.00.4 0.7 -0.6 60.0 -39.00.4 -0.7 -0.6 300.0 -39.01.0 0.0 -0.1 0.0 -3.1
-0.5 0.9 -0.1 120.0 -3.1-0.5 -0.9 -0.1 240.0 -3.1-0.9 0.0 0.5 180.0 31.40.4 0.7 0.5 60.0 31.40.4 -0.7 0.5 300.0 31.40.0 0.0 1.0 NaN 90.0
Area 12.0Meas. radius 1.0Source radius 0.4Source height 5.0No. of meas. Points, Z axis 4.0No. of meas. Points, XY axis 3.0
Results:
Point no. 63 Hz 125 Hz 250 Hz 500 Hz 1 kHz 2 kHz 4 kHz 8 kHz LAeq1 81,3 81,9 80 80,7 74,1 69,2 63,3 55,8 80.52 80,4 82,3 79,1 79,8 73,6 69,3 62,7 55,3 79.93 81,5 82,6 79,9 78,8 73,8 70,3 63,7 56,5 79.84 79,6 83,2 79,8 75,5 71,8 66,4 60,4 51,7 77.65 79,9 82,2 79,1 73,8 71,9 66,2 59,5 50,9 76.96 80,1 83 78,9 75 70 65,2 58,8 50,7 76.67 80,7 82,6 82,4 82,8 76,4 71,9 66,1 60,4 82.78 80,1 82 82,7 82,1 77,4 72,4 66,6 60,4 82.89 79,8 82,3 82,4 81,7 76,5 71,6 65,3 58,9 82.2
10 79,7 81,9 83,9 83,4 80,5 77 72,1 66,3 85.4
90°
80,579,8
79,9
77,676,6
76,9
82,782,2
82,8
85,4
0°
180°
77,6
80,5
79,9 79,8
76,676,9
82,7
82,8 82,2
85,4
N

0
10
20
30
40
50
60
70
80
90
100
dB
63 125 250 500 1000 2000 4000 8000 LAeqFrequency Hz
Sound Power Levels
Lw
Lw Din
Lw 45 grader
Directivityindex OctavebandInterpolated with 10 measurementpoints
-10
-8
-6
-4
-2
0
2
4
6
8
0 10 20 30 40 50 60 70 80 90 100 110
Vertical angles
Dir
ecti
vity
ind
ex(d
B)
63 Hz
125 Hz
250 Hz
500 Hz
1000 Hz
2000 Hz
4000 Hz
8000 Hz
LAeq
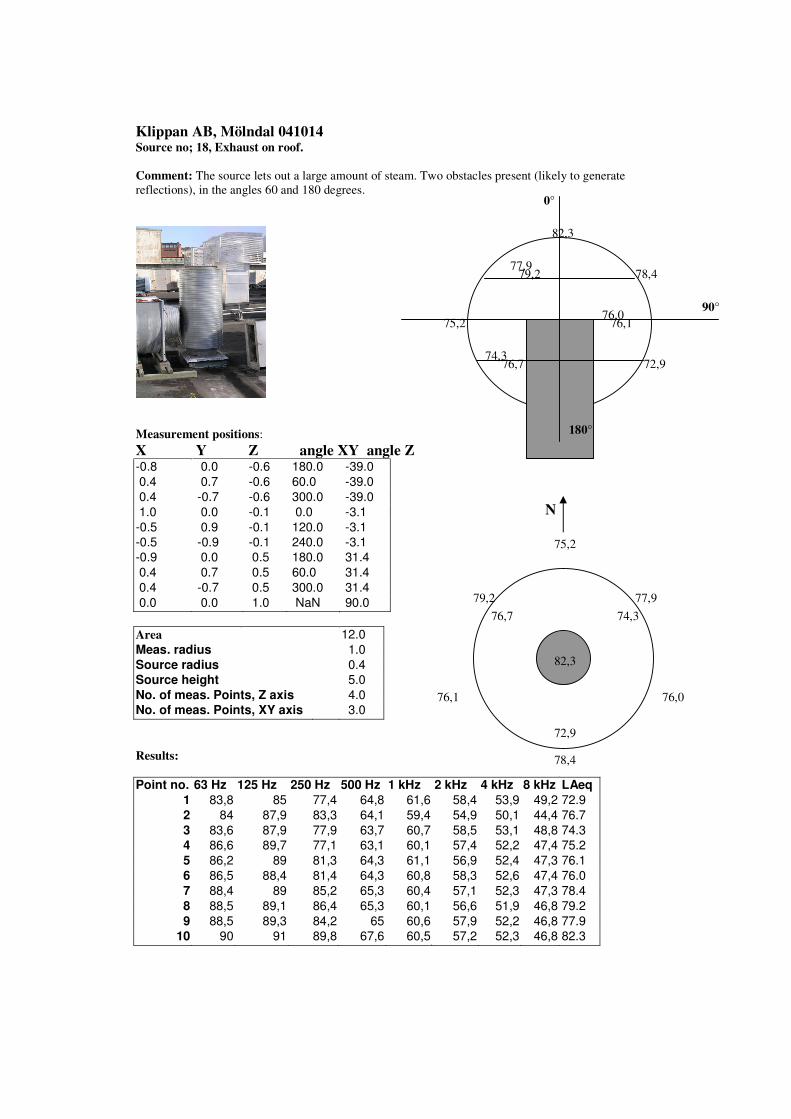
Klippan AB, Mölndal 041014Source no; 18, Exhaust on roof.
Comment: The source lets out a large amount of steam. Two obstacles present (likely to generatereflections), in the angles 60 and 180 degrees.
Measurement positions:X Y Z angle XY angle Z-0.8 0.0 -0.6 180.0 -39.00.4 0.7 -0.6 60.0 -39.00.4 -0.7 -0.6 300.0 -39.01.0 0.0 -0.1 0.0 -3.1
-0.5 0.9 -0.1 120.0 -3.1-0.5 -0.9 -0.1 240.0 -3.1-0.9 0.0 0.5 180.0 31.40.4 0.7 0.5 60.0 31.40.4 -0.7 0.5 300.0 31.40.0 0.0 1.0 NaN 90.0
Area 12.0Meas. radius 1.0Source radius 0.4Source height 5.0No. of meas. Points, Z axis 4.0No. of meas. Points, XY axis 3.0
Results:
Point no. 63 Hz 125 Hz 250 Hz 500 Hz 1 kHz 2 kHz 4 kHz 8 kHz LAeq1 83,8 85 77,4 64,8 61,6 58,4 53,9 49,2 72.92 84 87,9 83,3 64,1 59,4 54,9 50,1 44,4 76.73 83,6 87,9 77,9 63,7 60,7 58,5 53,1 48,8 74.34 86,6 89,7 77,1 63,1 60,1 57,4 52,2 47,4 75.25 86,2 89 81,3 64,3 61,1 56,9 52,4 47,3 76.16 86,5 88,4 81,4 64,3 60,8 58,3 52,6 47,4 76.07 88,4 89 85,2 65,3 60,4 57,1 52,3 47,3 78.48 88,5 89,1 86,4 65,3 60,1 56,6 51,9 46,8 79.29 88,5 89,3 84,2 65 60,6 57,9 52,2 46,8 77.9
10 90 91 89,8 67,6 60,5 57,2 52,3 46,8 82.3
75,2
72,9
76,7 74,3
76,076,1
78,4
79,2 77,9
82,3
N
90°
72,974,3
76,7
75,276,0
76,1
78,477,9
79,2
82,3
0°
180°
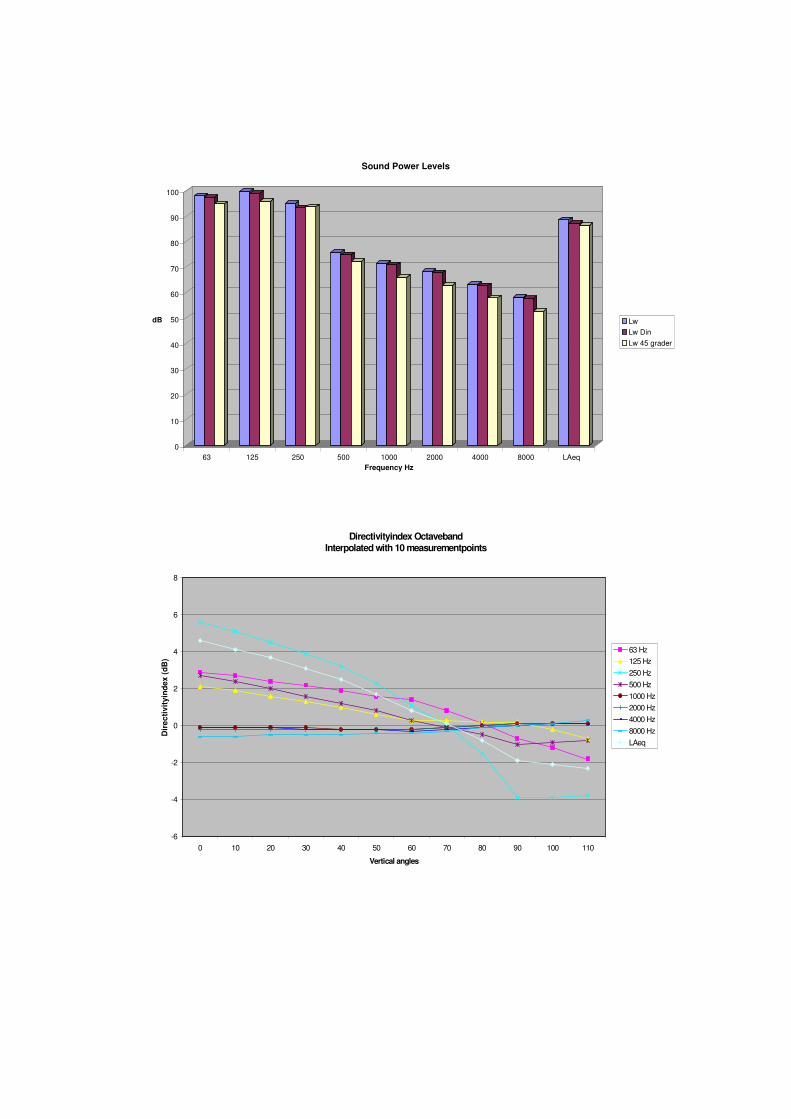
Directivityindex OctavebandInterpolated with 10 measurementpoints
-6
-4
-2
0
2
4
6
8
0 10 20 30 40 50 60 70 80 90 100 110
Vertical angles
Dir
ecti
vity
ind
ex(d
B)
63 Hz
125 Hz
250 Hz
500 Hz
1000 Hz
2000 Hz
4000 Hz
8000 Hz
LAeq
0
10
20
30
40
50
60
70
80
90
100
dB
63 125 250 500 1000 2000 4000 8000 LAeqFrequency Hz
Sound Power Levels
Lw
Lw Din
Lw 45 grader

Appendix 2
Matlab programsIn this appendix the m-files constructed and used during the work are presented.
File for calculating measurement coordinates
%Läser in data om källan från filen matdata.txt Om filen ej%finns frågar programet om värdena.
val=0;cd ([katalog])finns=exist('matdata.txt');cd ..
if finns==2;cd ([katalog])load matdata.txtcd ..radius=matdata(1,1)skorstensradie=matdata(1,2)skorstenshojd=matdata(1,3)antalpunkterizled=matdata(1,4)antalpunkterixyled=matdata(1,5)
elsewhile val==0
radius=input('ange radie på mätytan: ');skorstensradie=input('ange radie på källan: ');skorstenshojd=input('ange höjden på källan: ');antalpunkterizled=input('Antal punkter i z-led: ');antalpunkterixyled=input('Antal punkter xy-led: ');val=input('är du nöjd ja=1 nej=0: ');
endend
save koordinatdata radius skorstensradie skorstenshojd antalpunkterizledantalpunkterixyled% Räknar ut jämt fördelade punkter i en sfär med mittpunkt i mitten av% öppningen på källan. Sen vänder man punkterna i xyplanet i varannan höjd% genom att vända y axeln.
vinkel=0;k=0;antalpunkter=antalpunkterixyled*(antalpunkterizled-1)+1;
if skorstenshojd<radiusarea=(2*pi*radius^2+pi*2*radius*skorstenshojd);hojd=skorstenshojd+radius;nivohojd=0;
elsearea=(2*pi*radius^2+pi*2*radius*(sqrt(radius^2-skorstensradie^2)));hojd=radius+(sqrt(radius^2-skorstensradie^2));nivohojd=skorstenshojd-(sqrt(radius^2-skorstensradie^2));
end

continues...
punktarea=area/antalpunkter;hojdtoppunkt=punktarea/(2*pi*radius);hojdkvar=hojd-hojdtoppunkt;delhojd=hojdkvar/(antalpunkterizled-1);
koordinater=zeros(antalpunkter-1,3);it=1;for iter=1:antalpunkterizled-1
zkoordinater(1:antalpunkterixyled,iter)=nivohojd+delhojd/2;nivohojd=nivohojd+delhojd;koordinater(it:it+antalpunkterixyled-1,3)=zkoordinater(:,iter);it=it+antalpunkterixyled;
end
koordinater(:,3)=koordinater(:,3)-skorstenshojd;vinkelandring=2*pi/antalpunkterixyled;
for xyiter=0:antalpunkterixyled:antalpunkter-antalpunkterixyledvinkel=0;rr=sqrt(radius^2-koordinater(xyiter+1,3)^2);for vinkeliter=1:antalpunkterixyled
koordinater(xyiter+vinkeliter,1)=rr*cos(vinkel);koordinater(xyiter+vinkeliter,2)=rr*sin(vinkel);vinkel=vinkel+vinkelandring;
endvinkeliter=1;
end
koordinater(antalpunkter,:)=[0,0,radius];an=size(koordinater);an=an(1);
for tt=1:antalpunkterixyled*2:an-1koordinater(tt:tt+antalpunkterixyled-1,1)=koordinater(tt:tt+antalpunkterixyled-1,1).*-1;
end
matkoordinater=koordinater;matkoordinater(:,3)=[koordinater(:,3)+skorstenshojd];matkoordinater=matkoordinater*10;matkoordinater=round(matkoordinater);matkoordinater=matkoordinater/10;x,y,z]=cylinder(skorstensradie,20);z=z*skorstenshojd;
for vink=1:(antalpunkterizled-1)*antalpunkterixyled+1
vinkelmatris(vink,1)=acos(koordinater(vink,1)/sqrt(koordinater(vink,1)^2+koordinater(vink,2)^2));
vinkelmatris(vink,2)=atan(koordinater(vink,3)/sqrt(koordinater(vink,1)^2+koordinater(vink,2)^2));if koordinater(vink,2)<0;
vinkelmatris(vink,1)=2*pi-vinkelmatris(vink,1);end
end
vinkelmatris=vinkelmatris.*(180/pi);vinklarkoordinater=[koordinater,vinkelmatris];vinklarkoordinater(:,6)=[area];

continues...
File for reading measurement results and coordinates
File for calculating the directivity indices according to ISO 3744-2
cd ([katalog])
%Läser in data från filer med mätresultat och bakgrund.
punktkoordinater=koordinater;load matresultat.txtload matresultatbakgrund.txtradius=vinklarkoordinater(1,7);skorstenradie=vinklarkoordinater(2,7);punkterresultat=[punktkoordinater,matresultat];cd ..
vinklarkoordinater(:,7)=zeros(antalpunkter,1);vinklarkoordinater(1:5,7)=[radius;skorstensradie;skorstenshojd;antalpunkterizled;antalpunkterixyled];
%Sparar ner data om källan.
cd ([katalog])matdata=vinklarkoordinater(1:5,7);fp=fopen('matdata.txt','w+');fprintf(fp,'%4.1f \t %4.1f \t %4.1f \t %4.1f \t %4.1f',matdata);fclose(fp);
save area.txt area -asciicd ..
%calculation of sound pressure level average over surfacer=0;storlek=size(punkterresultat);antalpunkter=storlek(1,1);direktivitetindex=punkterresultat; %3 första kolumner är koordinater. dom andra skrivsöver skrivs det överfor r=5:13
summa=sum(10.^(0.1.*punkterresultat(1:antalpunkter,r)));medelLpokorrigerad=10*log10((summa/antalpunkter));summabakgrund=sum(10.^(0.1.*matresultatbakgrund(1:antalpunkter,r-3)));medelLpbakgrund=10*log10((summabakgrund/antalpunkter));medelLp=medelLpokorrigerad-(-10*log10(1-10^(-0.1*(medelLpokorrigerad-
medelLpbakgrund))));punkterresultat(antalpunkter+1,r)=medelLp;punkterresultat(antalpunkter+2,r)=medelLp+10*log10(area/1);v=0;
%loop som korrigerar varje punkt för bakgrund men högst med -1.3 dB och%räknar ut DI enl appendix E

continues...
File for calculating the sound power level using DIN 45635-47 as well as the consultants methodand interpolating the directivity indices for the 36*18 matrix used in Soundplan
peteryta=input('input vilken yta skulle peter använt ? 2 = 2*pi*r^2 4 = 4*pi*r^2 ');%*pi*raqdius^2cd ([katalog])for loopar=5:13
punkter=[direktivitetindex(:,1:3),direktivitetindex(:,loopar)];
punkter(:,4)=(2e-5)^2.*10.^(punkter(:,4)./10);punktmatris=zeros(20,37);punktmatris=(2e-5)^2.*10.^(punktmatris./10);punktmatris(1,:)=[0,0:10:350];
punktmatris(:,1)=[0;0;10;20;30;40;50;60;70;80;90;100;110;120;130;140;150;160;170;180];antal=size(punkter);antalpunkter=antal(1);
%loop som sätter in matpunkternas direktivitet i sounplan tabell
for n=1:antalpunkterif punkter(n,1)>0
a=1;vinkelxy=(180/pi)*atan(punkter(n,2)/punkter(n,1));if punkter(n,2)<0vinkelxy=360+vinkelxy;end
end
if punkter(n,1)<0%b=1vinkelxy=atan(punkter(n,2)/punkter(n,1));vinkelxy=180+(180/pi)*vinkelxy;
end
if punkter(n,1)==0 & punkter(n,2)==0%c=3vinkelxy=0;
end
for v=1:antalpunkterdeltapressure=(punkterresultat(v,r)-matresultatbakgrund(v,r-3));if deltapressure~=0
matnivokorrigeradbakgrund=punkterresultat(v,r)-(-10*log10(1-10^(-0.1*deltapressure)));
endif deltapressure <= 15 & deltapressure >= 6;
direktivitetindex(v,r)=matnivokorrigeradbakgrund-medelLp;endif deltapressure > 15
direktivitetindex(v,r)=punkterresultat(v,r)-medelLp;endif deltapressure < 6
direktivitetindex(v,r)=(punkterresultat(v,r)-1.3)-medelLp;end
endendLpaverage=punkterresultat(antalpunkter+1,:);Lw=punkterresultat(antalpunkter+2,:);
continues...
vinkelz=(180/pi)*atan(punkter(n,3)/sqrt(punkter(n,1)^2+punkter(n,2)^2));vinkelxy=round(vinkelxy/10);vinkelz=round(vinkelz/10);
punktmatris(9-vinkelz+2,vinkelxy+2)=punkter(n,4);
end
%Loopar som intepolerar direktivitet för alla vinklar Först i xy axeln sen%z axeln.
antalkolumner=37;antalrader=18;
for m=2:antalrader+2
vektor=punktmatris(m,2:antalkolumner);vektor=[vektor,vektor];a=0;mellanrum=0;varde1=0;koll=0;nollstart=0;for k=1:(antalkolumner-1)*2
if 10*log10(vektor(1,k)/(2e-5)^2)~=0a=a+1;varde2=vektor(1,k);koll=1;if 10*log10(varde1/(2e-5)^2)~=0
skillnadvarjesteg=abs(varde1-varde2)/(mellanrum+1);for t=1:mellanrum
if varde2>varde1vektor(1,k-t)=vektor(1,k-t+1)-skillnadvarjesteg;
elsevektor(1,k-t)=vektor(1,k-t+1)+skillnadvarjesteg;
endend
mellanrum=0;enda=1;varde1=varde2;
end
if 10*log10(vektor(1,k)/(2e-5)^2)==0mellanrum=mellanrum+1;
endif koll==0
nollstart=nollstart+1;mellanrum=0;if k>(antalkolumner)*2/2
nollstart=antalkolumner-2;end
end
end

continues...
vektor2=[vektor((k/2+1):k/2+nollstart),vektor(nollstart+1:k/2)];punktmatris(m,2:antalkolumner)=vektor2;endpunktmatris=punktmatris';
antalkolumner=20;antalrader=35;m=0;k=0;t=0;for m=2:(antalrader+2)
vektor=punktmatris(m,2:antalkolumner);
a=0;mellanrum=0;varde1=0;koll=0;nollstart=0;for k=1:(antalkolumner-1)
if 10*log10(vektor(1,k)/(2e-5)^2)~=0a=a+1;varde2=vektor(1,k);koll=1;if 10*log10(varde1/(2e-5)^2)~=0
skillnadvarjesteg=abs(varde1-varde2)/(mellanrum+1);for t=1:mellanrum
if varde2>varde1vektor(1,k-t)=vektor(1,k-t+1)-skillnadvarjesteg;
elsevektor(1,k-t)=vektor(1,k-t+1)+skillnadvarjesteg;
endend
mellanrum=0;enda=1;varde1=varde2 ;
end
if 10*log10(vektor(1,k)/(2e-5)^2)==0mellanrum=mellanrum+1;
endif koll==0
nollstart=nollstart+1;mellanrum=0;if k>(antalkolumner)*2/2
nollstart=antalkolumner-2;end
end
end
punktmatris(m,2:antalkolumner)=vektor;
end

continues...
punktmatris=punktmatris';punktmatris(2:20,2:37)=10.*log10(punktmatris(2:20,2:37)./(2e-5)^2);punktmatris=punktmatris';
%% Massa if satser som sparar ner filer. borde vara en med filnamn som%% ändrar sig. Skall göra om tid finns.
if loopar==4cd direktivitetdin=0;for din=2:37
dinLp1=punktmatris(din,9)+Lpaverage(loopar);dinLp2=punktmatris(din,13)+Lpaverage(loopar);dinLp1=dinLp1+10*log10(radius^2/(skorstenradie+1)^2);dinLp2=dinLp2+10*log10(radius^2/(skorstenradie+1)^2);dinS1=2*pi*(skorstenradie+1)^2;dinS2=2*pi*radius*sqrt((skorstenradie+1)^2-skorstenradie^2);dinLw1=dinLp1+10*log10(dinS1);dinLw2=dinLp2+10*log10(dinS2);dinLw(din-1,loopar-4)=10*log10(10^(dinLw1/10)+10^(dinLw2/10));riktigvinkel=atan((sqrt(2)/2)/(skorstenradie+(sqrt(2)/2)));riktigavstand=(sqrt(2)/2)/sin(riktigvinkel);riktigvinkel=round((180/pi)*riktigvinkel/10);Lppeterpunkt=punktmatris(din,riktigvinkel+2)+Lpaverage(loopar);Lppeterpunkt=Lppeterpunkt+10*log10(radius^2/riktigavstand^2);Lwpeterpunkt(din-1,loopar-4)=Lppeterpunkt+10*log10(peteryta*pi*1^2);
end%%%%%%%%%%%%%%%%%%%%%%%%%%%%%%%%%%%%5
fp=fopen('direktivitet31.txt','w+');fprintf(fp,'%4.1f \t %4.1f \t %4.1f \t %4.1f \t %4.1f \t %4.1f \t %4.1f \t %4.1f \t %4.1f \t
%4.1f \t %4.1f \t %4.1f \t %4.1f \t %4.1f \t %4.1f \t %4.1f \t %4.1f \t %4.1f \t %4.1f \t %4.1f\n',punktmatris');
fclose(fp);cd ..
endif loopar==5
cd direktivitetdin=0;for din=2:37
dinLp1=punktmatris(din,9)+Lpaverage(loopar);dinLp2=punktmatris(din,13)+Lpaverage(loopar);dinLp1=dinLp1+10*log10(radius^2/(skorstenradie+1)^2);dinLp2=dinLp2+10*log10(radius^2/(skorstenradie+1)^2);dinS1=2*pi*(skorstenradie+1)^2;dinS2=2*pi*radius*sqrt((skorstenradie+1)^2-skorstenradie^2);dinLw1=dinLp1+10*log10(dinS1);dinLw2=dinLp2+10*log10(dinS2);dinLw(din-1,loopar-4)=10*log10(10^(dinLw1/10)+10^(dinLw2/10));riktigvinkel=atan((sqrt(2)/2)/(skorstenradie+(sqrt(2)/2)));riktigavstand=(sqrt(2)/2)/sin(riktigvinkel);riktigvinkel=round((180/pi)*riktigvinkel/10);Lppeterpunkt=punktmatris(din,riktigvinkel+2)+Lpaverage(loopar);Lppeterpunkt=Lppeterpunkt+10*log10(radius^2/riktigavstand^2);Lwpeterpunkt(din-1,loopar-4)=Lppeterpunkt+10*log10(peteryta*pi*1^2);
end%%%%%%%%%%%%%%%%%%%%%%%%%%%%%%%%%%%%5

continues...
fp=fopen('direktivitet63.txt','w+');fprintf(fp,'%4.1f \t %4.1f \t %4.1f \t %4.1f \t %4.1f \t %4.1f \t %4.1f \t %4.1f \t %4.1f \t
%4.1f \t %4.1f \t %4.1f \t %4.1f \t %4.1f \t %4.1f \t %4.1f \t %4.1f \t %4.1f \t %4.1f \t %4.1f\n',punktmatris');
fclose(fp);cd ..
endif loopar==6
cd direktivitetdin=0;for din=2:37
dinLp1=punktmatris(din,9)+Lpaverage(loopar);dinLp2=punktmatris(din,13)+Lpaverage(loopar);dinLp1=dinLp1+10*log10(radius^2/(skorstenradie+1)^2);dinLp2=dinLp2+10*log10(radius^2/(skorstenradie+1)^2);dinS1=2*pi*(skorstenradie+1)^2;dinS2=2*pi*radius*sqrt((skorstenradie+1)^2-skorstenradie^2);dinLw1=dinLp1+10*log10(dinS1);dinLw2=dinLp2+10*log10(dinS2);dinLw(din-1,loopar-4)=10*log10(10^(dinLw1/10)+10^(dinLw2/10));riktigvinkel=atan((sqrt(2)/2)/(skorstenradie+(sqrt(2)/2)));riktigavstand=(sqrt(2)/2)/sin(riktigvinkel);riktigvinkel=round((180/pi)*riktigvinkel/10);Lppeterpunkt=punktmatris(din,riktigvinkel+2)+Lpaverage(loopar);Lppeterpunkt=Lppeterpunkt+10*log10(radius^2/riktigavstand^2);Lwpeterpunkt(din-1,loopar-4)=Lppeterpunkt+10*log10(peteryta*pi*1^2);
end%%%%%%%%%%%%%%%%%%%%%%%%%%%%%%%%%%%%5fp=fopen('direktivitet125.txt','w+');fprintf(fp,'%4.1f \t %4.1f \t %4.1f \t %4.1f \t %4.1f \t %4.1f \t %4.1f \t %4.1f \t %4.1f \t
%4.1f \t %4.1f \t %4.1f \t %4.1f \t %4.1f \t %4.1f \t %4.1f \t %4.1f \t %4.1f \t %4.1f \t %4.1f\n',punktmatris');
fclose(fp);cd ..
endif loopar==7
cd direktivitetdin=0;for din=2:37
dinLp1=punktmatris(din,9)+Lpaverage(loopar);dinLp2=punktmatris(din,13)+Lpaverage(loopar);dinLp1=dinLp1+10*log10(radius^2/(skorstenradie+1)^2);dinLp2=dinLp2+10*log10(radius^2/(skorstenradie+1)^2);dinS1=2*pi*(skorstenradie+1)^2;dinS2=2*pi*radius*sqrt((skorstenradie+1)^2-skorstenradie^2);dinLw1=dinLp1+10*log10(dinS1);dinLw2=dinLp2+10*log10(dinS2);dinLw(din-1,loopar-4)=10*log10(10^(dinLw1/10)+10^(dinLw2/10));riktigvinkel=atan((sqrt(2)/2)/(skorstenradie+(sqrt(2)/2)));riktigavstand=(sqrt(2)/2)/sin(riktigvinkel);riktigvinkel=round((180/pi)*riktigvinkel/10);Lppeterpunkt=punktmatris(din,riktigvinkel+2)+Lpaverage(loopar);Lppeterpunkt=Lppeterpunkt+10*log10(radius^2/riktigavstand^2);Lwpeterpunkt(din-1,loopar-4)=Lppeterpunkt+10*log10(peteryta*pi*1^2);
end%%%%%%%%%%%%%%%%%%%%%%%%%%%%%%%%%%%%5fp=fopen('direktivitet250.txt','w+');
continues...
fprintf(fp,'%4.1f \t %4.1f \t %4.1f \t %4.1f \t %4.1f \t %4.1f \t %4.1f \t %4.1f \t %4.1f \t %4.1f\t %4.1f \t %4.1f \t %4.1f \t %4.1f \t %4.1f \t %4.1f \t %4.1f \t %4.1f \t %4.1f \t %4.1f\n',punktmatris');
fclose(fp);cd ..
endif loopar==8
cd direktivitet%dinutrakningaveffekt
din=0;for din=2:37
dinLp1=punktmatris(din,9)+Lpaverage(loopar);dinLp2=punktmatris(din,13)+Lpaverage(loopar);dinLp1=dinLp1+10*log10(radius^2/(skorstenradie+1)^2);dinLp2=dinLp2+10*log10(radius^2/(skorstenradie+1)^2);dinS1=2*pi*(skorstenradie+1)^2;dinS2=2*pi*radius*sqrt((skorstenradie+1)^2-skorstenradie^2);dinLw1=dinLp1+10*log10(dinS1);dinLw2=dinLp2+10*log10(dinS2);dinLw(din-1,loopar-4)=10*log10(10^(dinLw1/10)+10^(dinLw2/10));riktigvinkel=atan((sqrt(2)/2)/(skorstenradie+(sqrt(2)/2)));riktigavstand=(sqrt(2)/2)/sin(riktigvinkel);riktigvinkel=round((180/pi)*riktigvinkel/10);Lppeterpunkt=punktmatris(din,riktigvinkel+2)+Lpaverage(loopar);Lppeterpunkt=Lppeterpunkt+10*log10(radius^2/riktigavstand^2);Lwpeterpunkt(din-1,loopar-4)=Lppeterpunkt+10*log10(peteryta*pi*1^2);
end%%%%%%%%%%%%%%%%%%%%%%%%%%%%%%%%%%%%5fp=fopen('direktivitet500.txt','w+');fprintf(fp,'%4.1f \t %4.1f \t %4.1f \t %4.1f \t %4.1f \t %4.1f \t %4.1f \t %4.1f \t %4.1f \t
%4.1f \t %4.1f \t %4.1f \t %4.1f \t %4.1f \t %4.1f \t %4.1f \t %4.1f \t %4.1f \t %4.1f \t %4.1f\n',punktmatris');
fclose(fp);cd ..
endif loopar==9
cd direktivitetdin=0;for din=2:37
dinLp1=punktmatris(din,9)+Lpaverage(loopar);dinLp2=punktmatris(din,13)+Lpaverage(loopar);dinLp1=dinLp1+10*log10(radius^2/(skorstenradie+1)^2);dinLp2=dinLp2+10*log10(radius^2/(skorstenradie+1)^2);dinS1=2*pi*(skorstenradie+1)^2;dinS2=2*pi*radius*sqrt((skorstenradie+1)^2-skorstenradie^2);dinLw1=dinLp1+10*log10(dinS1);dinLw2=dinLp2+10*log10(dinS2);dinLw(din-1,loopar-4)=10*log10(10^(dinLw1/10)+10^(dinLw2/10));riktigvinkel=atan((sqrt(2)/2)/(skorstenradie+(sqrt(2)/2)));riktigavstand=(sqrt(2)/2)/sin(riktigvinkel);riktigvinkel=round((180/pi)*riktigvinkel/10);Lppeterpunkt=punktmatris(din,riktigvinkel+2)+Lpaverage(loopar);Lppeterpunkt=Lppeterpunkt+10*log10(radius^2/riktigavstand^2);Lwpeterpunkt(din-1,loopar-4)=Lppeterpunkt+10*log10(peteryta*pi*1^2);
end%%%%%%%%%%%%%%%%%%%%%%%%%%%%%%%%%%%%
continues...
fp=fopen('direktivitet1000.txt','w+');fprintf(fp,'%4.1f \t %4.1f \t %4.1f \t %4.1f \t %4.1f \t %4.1f \t %4.1f \t %4.1f \t %4.1f \t
%4.1f \t %4.1f \t %4.1f \t %4.1f \t %4.1f \t %4.1f \t %4.1f \t %4.1f \t %4.1f \t %4.1f \t %4.1f\n',punktmatris');
fclose(fp);cd ..
endif loopar==10
cd direktivitet%dinutrakningaveffekt
din=0;for din=2:37
dinLp1=punktmatris(din,9)+Lpaverage(loopar);dinLp2=punktmatris(din,13)+Lpaverage(loopar);dinLp1=dinLp1+10*log10(radius^2/(skorstenradie+1)^2);dinLp2=dinLp2+10*log10(radius^2/(skorstenradie+1)^2);dinS1=2*pi*(skorstenradie+1)^2;dinS2=2*pi*radius*sqrt((skorstenradie+1)^2-skorstenradie^2);dinLw1=dinLp1+10*log10(dinS1);dinLw2=dinLp2+10*log10(dinS2);dinLw(din-1,loopar-4)=10*log10(10^(dinLw1/10)+10^(dinLw2/10));riktigvinkel=atan((sqrt(2)/2)/(skorstenradie+(sqrt(2)/2)));riktigavstand=(sqrt(2)/2)/sin(riktigvinkel);riktigvinkel=round((180/pi)*riktigvinkel/10);Lppeterpunkt=punktmatris(din,riktigvinkel+2)+Lpaverage(loopar);Lppeterpunkt=Lppeterpunkt+10*log10(radius^2/riktigavstand^2);Lwpeterpunkt(din-1,loopar-4)=Lppeterpunkt+10*log10(peteryta*pi*1^2);
end%%%%%%%%%%%%%%%%%%%%%%%%%%%%%%%%%%%%5fp=fopen('direktivitet2000.txt','w+');fprintf(fp,'%4.1f \t %4.1f \t %4.1f \t %4.1f \t %4.1f \t %4.1f \t %4.1f \t %4.1f \t %4.1f \t
%4.1f \t %4.1f \t %4.1f \t %4.1f \t %4.1f \t %4.1f \t %4.1f \t %4.1f \t %4.1f \t %4.1f \t %4.1f\n',punktmatris');
fclose(fp);cd ..
endif loopar==11
cd direktivitetdin=0;for din=2:37
dinLp1=punktmatris(din,9)+Lpaverage(loopar);dinLp2=punktmatris(din,13)+Lpaverage(loopar);dinLp1=dinLp1+10*log10(radius^2/(skorstenradie+1)^2);dinLp2=dinLp2+10*log10(radius^2/(skorstenradie+1)^2);dinS1=2*pi*(skorstenradie+1)^2;dinS2=2*pi*radius*sqrt((skorstenradie+1)^2-skorstenradie^2);dinLw1=dinLp1+10*log10(dinS1);dinLw2=dinLp2+10*log10(dinS2);dinLw(din-1,loopar-4)=10*log10(10^(dinLw1/10)+10^(dinLw2/10));riktigvinkel=atan((sqrt(2)/2)/(skorstenradie+(sqrt(2)/2)));riktigavstand=(sqrt(2)/2)/sin(riktigvinkel);riktigvinkel=round((180/pi)*riktigvinkel/10);Lppeterpunkt=punktmatris(din,riktigvinkel+2)+Lpaverage(loopar);Lppeterpunkt=Lppeterpunkt+10*log10(radius^2/riktigavstand^2);Lwpeterpunkt(din-1,loopar-4)=Lppeterpunkt+10*log10(peteryta*pi*1^2);
end%%%%%%%%%%%%%%%%%%%%%%%%%%%%%%%%%%%%

continues...
fp=fopen('direktivitet4000.txt','w+');fprintf(fp,'%4.1f \t %4.1f \t %4.1f \t %4.1f \t %4.1f \t %4.1f \t %4.1f \t %4.1f \t %4.1f \t
%4.1f \t %4.1f \t %4.1f \t %4.1f \t %4.1f \t %4.1f \t %4.1f \t %4.1f \t %4.1f \t %4.1f \t %4.1f\n',punktmatris');
fclose(fp);cd ..
endif loopar==12
cd direktivitetdin=0;for din=2:37
dinLp1=punktmatris(din,9)+Lpaverage(loopar);dinLp2=punktmatris(din,13)+Lpaverage(loopar);dinLp1=dinLp1+10*log10(radius^2/(skorstenradie+1)^2);dinLp2=dinLp2+10*log10(radius^2/(skorstenradie+1)^2);dinS1=2*pi*(skorstenradie+1)^2;dinS2=2*pi*radius*sqrt((skorstenradie+1)^2-skorstenradie^2);dinLw1=dinLp1+10*log10(dinS1);dinLw2=dinLp2+10*log10(dinS2);dinLw(din-1,loopar-4)=10*log10(10^(dinLw1/10)+10^(dinLw2/10));riktigvinkel=atan((sqrt(2)/2)/(skorstenradie+(sqrt(2)/2)));riktigavstand=(sqrt(2)/2)/sin(riktigvinkel);riktigvinkel=round((180/pi)*riktigvinkel/10);Lppeterpunkt=punktmatris(din,riktigvinkel+2)+Lpaverage(loopar);Lppeterpunkt=Lppeterpunkt+10*log10(radius^2/riktigavstand^2);Lwpeterpunkt(din-1,loopar-4)=Lppeterpunkt+10*log10(peteryta*pi*1^2);
end%%%%%%%%%%%%%%%%%%%%%%%%%%%%%%%%%%%%5fp=fopen('direktivitet8000.txt','w+');fprintf(fp,'%4.1f \t %4.1f \t %4.1f \t %4.1f \t %4.1f \t %4.1f \t %4.1f \t %4.1f \t %4.1f \t
%4.1f \t %4.1f \t %4.1f \t %4.1f \t %4.1f \t %4.1f \t %4.1f \t %4.1f \t %4.1f \t %4.1f \t %4.1f\n',punktmatris');
fclose(fp);cd ..
endif loopar==13cd direktivitetdin=0;for din=2:37
dinLp1=punktmatris(din,9)+Lpaverage(loopar);dinLp2=punktmatris(din,13)+Lpaverage(loopar);dinLp1=dinLp1+10*log10(radius^2/(skorstenradie+1)^2);dinLp2=dinLp2+10*log10(radius^2/(skorstenradie+1)^2);dinS1=2*pi*(skorstenradie+1)^2;dinS2=2*pi*radius*sqrt((skorstenradie+1)^2-skorstenradie^2);dinLw1=dinLp1+10*log10(dinS1);dinLw2=dinLp2+10*log10(dinS2);dinLw(din-1,loopar-4)=10*log10(10^(dinLw1/10)+10^(dinLw2/10));riktigvinkel=atan((sqrt(2)/2)/(skorstenradie+(sqrt(2)/2)));riktigavstand=(sqrt(2)/2)/sin(riktigvinkel);riktigvinkel=round((180/pi)*riktigvinkel/10);Lppeterpunkt=punktmatris(din,riktigvinkel+2)+Lpaverage(loopar);Lppeterpunkt=Lppeterpunkt+10*log10(radius^2/riktigavstand^2);Lwpeterpunkt(din-1,loopar-4)=Lppeterpunkt+10*log10(peteryta*pi*1^2);
end%%%%%%%%%%%%%%%%%%%%%%%%%%%%%%%%%%%%

continues...
fp=fopen('direktivitettotal.txt','w+');fprintf(fp,'%4.1f \t %4.1f \t %4.1f \t %4.1f \t %4.1f \t %4.1f \t %4.1f \t %4.1f \t %4.1f \t
%4.1f \t %4.1f \t %4.1f \t %4.1f \t %4.1f \t %4.1f \t %4.1f \t %4.1f \t %4.1f \t %4.1f \t %4.1f\n',punktmatris');
fclose(fp);cd ..
endzangle=2;for zangle=2:20
summadir=sum(10.^(0.1.*punktmatris(2:37,zangle)));medeldbdir(zangle)=10*log10((summadir/36));
endmedeldirektivitet(loopar-4,:)=medeldbdir;
summaxyaxeln=sum(10.^(0.1.*punktmatris(2:20,:)));medelLp=10*log10((summa/antalpunkter));
end
cd direktivitetoktavbanden=[63,125,250,500,1000,2000,4000,8000,0];dinvinklar=[0:10:350];for medelgrej=1:9
dinLwmedel(1,medelgrej)=10*log10(1/36.*sum(10.^(0.1*dinLw(:,medelgrej))));
Lwpeterpunktmedel(1,medelgrej)=10*log10(1/36.*sum(10.^(0.1*Lwpeterpunkt(:,medelgrej))));end
dinLw=[dinvinklar',dinLw];dinLw=[0,oktavbanden;dinLw];dinLwmedel=[oktavbanden;dinLwmedel];Lwpeterpunkt=[dinvinklar',Lwpeterpunkt];Lwpeterpunkt=[0,oktavbanden;Lwpeterpunkt];Lwpeterpunktmedel=[oktavbanden;Lwpeterpunktmedel];
Lw=Lw(5:13);Lpaverage=Lpaverage(5:13);
Lw=[oktavbanden;Lw];Lpaverage=[oktavbanden;Lpaverage];
Lwdinpeter=[Lw;dinLwmedel(2,:);Lwpeterpunktmedel(2,:)];
medeldirektivitet(:,1)=[oktavbanden'];vinklarrad1=[0,0:10:180];medeldirektivitet=[vinklarrad1;medeldirektivitet];excelfilen=[medeldirektivitet;punktmatris];fclose(fp);p=fopen('Lw.txt','w+');fprintf(fp,'%4.1f \t %4.1f \t %4.1f \t %4.1f \t %4.1f \t %4.1f \t %4.1f \t %4.1f \t %4.1f \n',Lw');fclose(fp);fp=fopen('Lpaverage.txt','w+');fprintf(fp,'%4.1f \t %4.1f \t %4.1f \t %4.1f \t %4.1f \t %4.1f \t %4.1f \t %4.1f \t %4.1f\n',Lpaverage');fclose(fp);fp=fopen('Lwpeterpunkt.txt','w+');

continues...
fprintf(fp,'%4.1f \t %4.1f \t %4.1f \t %4.1f \t %4.1f \t %4.1f \t %4.1f \t %4.1f \t %4.1f \t %4.1f\n',Lwpeterpunkt');fclose(fp);fp=fopen('dinLw.txt','w+');fprintf(fp,'%4.1f \t %4.1f \t %4.1f \t %4.1f \t %4.1f \t %4.1f \t %4.1f \t %4.1f \t %4.1f \t %4.1f\n',dinLw');fclose(fp);fp=fopen('Lwpeterpunktmedel.txt','w+');fprintf(fp,'%4.1f \t %4.1f \t %4.1f \t %4.1f \t %4.1f \t %4.1f \t %4.1f \t %4.1f \t %4.1f\n',Lwpeterpunktmedel');fclose(fp);fp=fopen('dinLwmedel.txt','w+');fprintf(fp,'%4.1f \t %4.1f \t %4.1f \t %4.1f \t %4.1f \t %4.1f \t %4.1f \t %4.1f \t %4.1f\n',dinLwmedel');fclose(fp);fp=fopen('Lwdinpetermedel.txt','w+');fprintf(fp,'%4.1f \t %4.1f \t %4.1f \t %4.1f \t %4.1f \t %4.1f \t %4.1f \t %4.1f \t %4.1f\n',Lwdinpeter');fclose(fp);fp=fopen('direktivitetmedel.txt','w+');fprintf(fp,'%4.1f \t %4.1f \t %4.1f \t %4.1f \t %4.1f \t %4.1f \t %4.1f \t %4.1f \t %4.1f \t %4.1f\t %4.1f \t %4.1f \t %4.1f \t %4.1f \t %4.1f \t %4.1f \t %4.1f \t %4.1f \t %4.1f \t %4.1f\n',medeldirektivitet');fclose(fp);fp=fopen('excelfilen.txt','w+');fprintf(fp,'%4.1f \t %4.1f \t %4.1f \t %4.1f \t %4.1f \t %4.1f \t %4.1f \t %4.1f \t %4.1f \t %4.1f\t %4.1f \t %4.1f \t %4.1f \t %4.1f \t %4.1f \t %4.1f \t %4.1f \t %4.1f \t %4.1f \t %4.1f\n',excelfilen');fclose(fp);
cd ..save peteryta peterytasave data dinLw vinklarkoordinater matresultat Lpaverage Lw area matresultatbakgrundLwpeterpunkt Lwpeterpunktmedel dinLwmedelclear allload datacd direktivitetload direktivitettotal.txt
cd ..cd ..

Appendix 3
Results from the analysis in Soundplan

0,-100,10m dB(A)Source10directivity 37,7Source10withoutdirectivity 40,1Source10tilted 43,6Source11directivity 38,2Source11withoutdirectivity 41,4Source11tilted 45,7Source1directivity 48,1Source1withoutdirectivity 54,2Source1tilted 59,1Source2directivity 37,9Source2withoutdirectivity 41,8Source2tilted 46,4Source3directivity 33,9Source3withoutdirectivity 37,3Source3tilted 42,5Source4directivity 35,1Source4withoutdirectivity 40,4Source4tilted 51,4Source5directivity 33,1Source5withoutdirectivity 34,7Source5tilted 38,4Source6directivity 30,1Source6withoutdirectivity 31,5Source6tilted 34,1Source7directivity 31,2Source7withoutdirectivity 33,4Source7tilted 35Source8directivity 27,6Source8withoutdirectivity 28,2Source8tilted 30Source9directivity 37,9Source9withoutdirectivity 38,4Source9tilted 40,60,-100,20m
Source10directivity 39,8Source10withoutdirectivity 40,1Source10tilted 43,4Source11directivity 40,7Source11withoutdirectivity 41,3Source11tilted 45,3Source1directivity 53Source1withoutdirectivity 54,2Source1tilted 58,7Source2directivity 41,4Source2withoutdirectivity 42Source2tilted 46,2Source3directivity 36,2Source3withoutdirectivity 37,3Source3tilted 42Source4directivity 34,8Source4withoutdirectivity 40,4Source4tilted 50,4Source5directivity 34,8Source5withoutdirectivity 34,7Source5tilted 38,1
Source6directivity 31,1Source6withoutdirectivity 31,5Source6tilted 34,1Source7directivity 34,3Source7withoutdirectivity 33,6Source7tilted 35,3Source8directivity 28,2Source8withoutdirectivity 28,2Source8tilted 29,8Source9directivity 38,7Source9withoutdirectivity 38,4Source9tilted 40,40,-100,2m
Source10directivity 30,7Source10withoutdirectivity 33,4Source10tilted 37Source11directivity 31,9Source11withoutdirectivity 35,1Source11tilted 39,3Source1directivity 41,9Source1withoutdirectivity 48,4Source1tilted 52,8Source2directivity 31,7Source2withoutdirectivity 35,5Source2tilted 40,1Source3directivity 26,9Source3withoutdirectivity 30,7Source3tilted 35,9Source4directivity 28,4Source4withoutdirectivity 33,7Source4tilted 44,7Source5directivity 26,2Source5withoutdirectivity 27,8Source5tilted 31,4Source6directivity 23,3Source6withoutdirectivity 24,8Source6tilted 27,6Source7directivity 24,3Source7withoutdirectivity 26,6Source7tilted 28,3Source8directivity 21Source8withoutdirectivity 21,7Source8tilted 23,7Source9directivity 31,5Source9withoutdirectivity 32Source9tilted 34,20,-400,10m
Source10directivity 25Source10withoutdirectivity 27,2Source10tilted 30,7Source11directivity 25Source11withoutdirectivity 28,2Source11tilted 32,7Source1directivity 34,9Source1withoutdirectivity 40,8Source1tilted 45,9

Source2directivity 24,3Source2withoutdirectivity 28,1Source2tilted 32,6Source3directivity 21Source3withoutdirectivity 24,4Source3tilted 29,6Source4directivity 22,1Source4withoutdirectivity 27,4Source4tilted 38,4Source5directivity 20,2Source5withoutdirectivity 21,8Source5tilted 25Source6directivity 17,1Source6withoutdirectivity 18,3Source6tilted 20,6Source7directivity 18,2Source7withoutdirectivity 20,3Source7tilted 21,7Source8directivity 14,5Source8withoutdirectivity 15Source8tilted 16,8Source9directivity 24,8Source9withoutdirectivity 25,3Source9tilted 27,50,-400,20m
Source10directivity 25,1Source10withoutdirectivity 27,3Source10tilted 30,7Source11directivity 25,1Source11withoutdirectivity 28,3Source11tilted 32,7Source1directivity 34,9Source1withoutdirectivity 40,8Source1tilted 45,9Source2directivity 25,2Source2withoutdirectivity 29,1Source2tilted 33,7Source3directivity 21,2Source3withoutdirectivity 24,5Source3tilted 29,6Source4directivity 22,3Source4withoutdirectivity 27,6Source4tilted 38,6Source5directivity 20,5Source5withoutdirectivity 22,1Source5tilted 25,9Source6directivity 17,4Source6withoutdirectivity 18,8Source6tilted 21,5Source7directivity 18,5Source7withoutdirectivity 20,8Source7tilted 22,5Source8directivity 14,8Source8withoutdirectivity 15,3Source8tilted 17Source9directivity 25Source9withoutdirectivity 25,5
Source9tilted 27,70,-400,2mSource10directivity 24,1Source10withoutdirectivity 26,5Source10tilted 30,2Source11directivity 24,7Source11withoutdirectivity 28,1Source11tilted 32,6Source1directivity 35Source1withoutdirectivity 41Source1tilted 46,1Source2directivity 23,7Source2withoutdirectivity 27,6Source2tilted 32,1Source3directivity 20,1Source3withoutdirectivity 23,9Source3tilted 29,2Source4directivity 21,6Source4withoutdirectivity 26,9Source4tilted 37,9Source5directivity 19,1Source5withoutdirectivity 20,9Source5tilted 24,2Source6directivity 16,6Source6withoutdirectivity 17,8Source6tilted 19,9Source7directivity 17,4Source7withoutdirectivity 19,6Source7tilted 21Source8directivity 14,2Source8withoutdirectivity 14,8Source8tilted 16,6Source9directivity 24,5Source9withoutdirectivity 25Source9tilted 27,20,100,10m
Source10directivity 37,3Source10withoutdirectivity 40,1Source10tilted 35,4Source11directivity 38,1Source11withoutdirectivity 41,4Source11tilted 36Source1directivity 48,9Source1withoutdirectivity 54,2Source1tilted 48,6Source2directivity 38Source2withoutdirectivity 41,8Source2tilted 36,1Source3directivity 33,9Source3withoutdirectivity 37,3Source3tilted 32,4Source4directivity 34,4Source4withoutdirectivity 40,4Source4tilted 33,1Source5directivity 33,4Source5withoutdirectivity 34,7Source5tilted 32,3
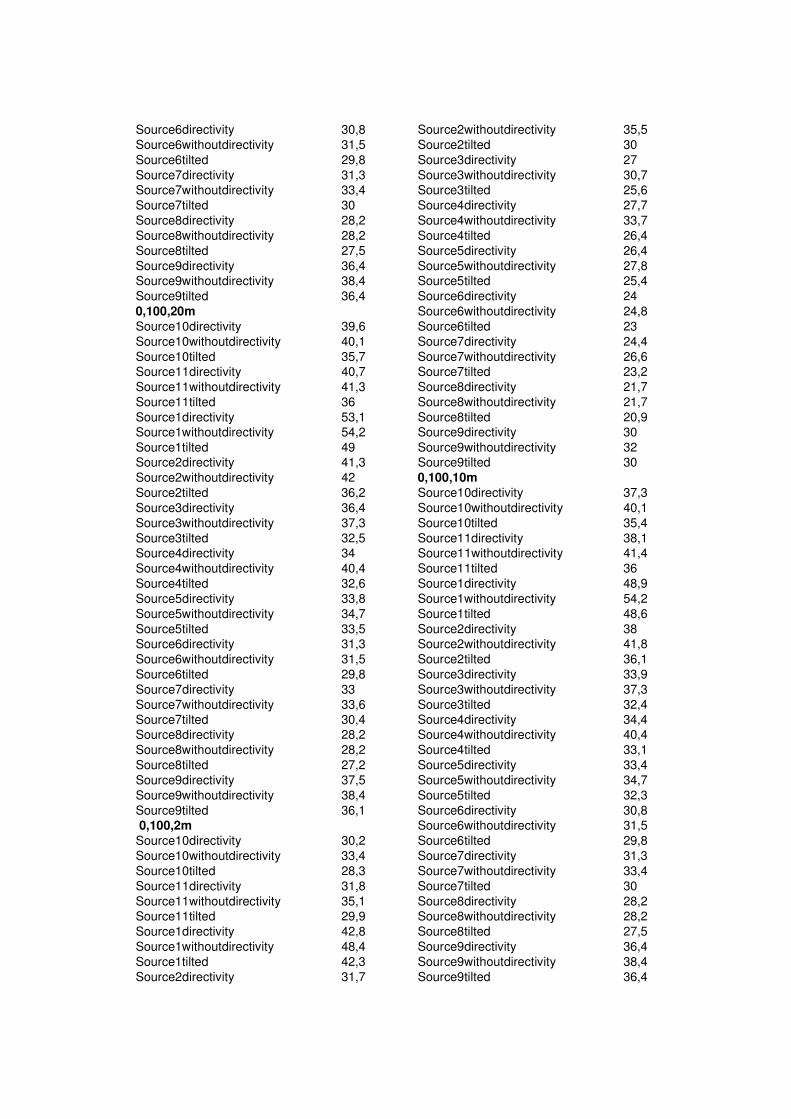
Source6directivity 30,8Source6withoutdirectivity 31,5Source6tilted 29,8Source7directivity 31,3Source7withoutdirectivity 33,4Source7tilted 30Source8directivity 28,2Source8withoutdirectivity 28,2Source8tilted 27,5Source9directivity 36,4Source9withoutdirectivity 38,4Source9tilted 36,40,100,20mSource10directivity 39,6Source10withoutdirectivity 40,1Source10tilted 35,7Source11directivity 40,7Source11withoutdirectivity 41,3Source11tilted 36Source1directivity 53,1Source1withoutdirectivity 54,2Source1tilted 49Source2directivity 41,3Source2withoutdirectivity 42Source2tilted 36,2Source3directivity 36,4Source3withoutdirectivity 37,3Source3tilted 32,5Source4directivity 34Source4withoutdirectivity 40,4Source4tilted 32,6Source5directivity 33,8Source5withoutdirectivity 34,7Source5tilted 33,5Source6directivity 31,3Source6withoutdirectivity 31,5Source6tilted 29,8Source7directivity 33Source7withoutdirectivity 33,6Source7tilted 30,4Source8directivity 28,2Source8withoutdirectivity 28,2Source8tilted 27,2Source9directivity 37,5Source9withoutdirectivity 38,4Source9tilted 36,10,100,2m
Source10directivity 30,2Source10withoutdirectivity 33,4Source10tilted 28,3Source11directivity 31,8Source11withoutdirectivity 35,1Source11tilted 29,9Source1directivity 42,8Source1withoutdirectivity 48,4Source1tilted 42,3Source2directivity 31,7
Source2withoutdirectivity 35,5Source2tilted 30Source3directivity 27Source3withoutdirectivity 30,7Source3tilted 25,6Source4directivity 27,7Source4withoutdirectivity 33,7Source4tilted 26,4Source5directivity 26,4Source5withoutdirectivity 27,8Source5tilted 25,4Source6directivity 24Source6withoutdirectivity 24,8Source6tilted 23Source7directivity 24,4Source7withoutdirectivity 26,6Source7tilted 23,2Source8directivity 21,7Source8withoutdirectivity 21,7Source8tilted 20,9Source9directivity 30Source9withoutdirectivity 32Source9tilted 300,100,10mSource10directivity 37,3Source10withoutdirectivity 40,1Source10tilted 35,4Source11directivity 38,1Source11withoutdirectivity 41,4Source11tilted 36Source1directivity 48,9Source1withoutdirectivity 54,2Source1tilted 48,6Source2directivity 38Source2withoutdirectivity 41,8Source2tilted 36,1Source3directivity 33,9Source3withoutdirectivity 37,3Source3tilted 32,4Source4directivity 34,4Source4withoutdirectivity 40,4Source4tilted 33,1Source5directivity 33,4Source5withoutdirectivity 34,7Source5tilted 32,3Source6directivity 30,8Source6withoutdirectivity 31,5Source6tilted 29,8Source7directivity 31,3Source7withoutdirectivity 33,4Source7tilted 30Source8directivity 28,2Source8withoutdirectivity 28,2Source8tilted 27,5Source9directivity 36,4Source9withoutdirectivity 38,4Source9tilted 36,4

0,100,20mSource10directivity 39,6Source10withoutdirectivity 40,1Source10tilted 35,7Source11directivity 40,7Source11withoutdirectivity 41,3Source11tilted 36Source1directivity 53,1Source1withoutdirectivity 54,2Source1tilted 49Source2directivity 41,3Source2withoutdirectivity 42Source2tilted 36,2Source3directivity 36,4Source3withoutdirectivity 37,3Source3tilted 32,5Source4directivity 34Source4withoutdirectivity 40,4Source4tilted 32,6Source5directivity 33,8Source5withoutdirectivity 34,7Source5tilted 33,5Source6directivity 31,3Source6withoutdirectivity 31,5Source6tilted 29,8Source7directivity 33Source7withoutdirectivity 33,6Source7tilted 30,4Source8directivity 28,2Source8withoutdirectivity 28,2Source8tilted 27,2Source9directivity 37,5Source9withoutdirectivity 38,4Source9tilted 36,10,100,2mSource10directivity 30,2Source10withoutdirectivity 33,4Source10tilted 28,3Source11directivity 31,8Source11withoutdirectivity 35,1Source11tilted 29,9Source1directivity 42,8Source1withoutdirectivity 48,4Source1tilted 42,3Source2directivity 31,7Source2withoutdirectivity 35,5Source2tilted 30Source3directivity 27Source3withoutdirectivity 30,7Source3tilted 25,6Source4directivity 27,7Source4withoutdirectivity 33,7Source4tilted 26,4Source5directivity 26,4Source5withoutdirectivity 27,8Source5tilted 25,4Source6directivity 24
Source6withoutdirectivity 24,8Source6tilted 23Source7directivity 24,4Source7withoutdirectivity 26,6Source7tilted 23,2Source8directivity 21,7Source8withoutdirectivity 21,7Source8tilted 20,9Source9directivity 30Source9withoutdirectivity 32Source9tilted 300,400,10m
Source10directivity 24,5Source10withoutdirectivity 27,2Source10tilted 22,7Source11directivity 24,9Source11withoutdirectivity 28,2Source11tilted 22,5Source1directivity 35,7Source1withoutdirectivity 40,8Source1tilted 35,4Source2directivity 24,3Source2withoutdirectivity 28,1Source2tilted 22,5Source3directivity 21Source3withoutdirectivity 24,4Source3tilted 19,5Source4directivity 21,4Source4withoutdirectivity 27,4Source4tilted 20,1Source5directivity 20,6Source5withoutdirectivity 21,8Source5tilted 19,5Source6directivity 17,7Source6withoutdirectivity 18,3Source6tilted 16,6Source7directivity 18,3Source7withoutdirectivity 20,3Source7tilted 17Source8directivity 15,1Source8withoutdirectivity 15Source8tilted 14,3Source9directivity 23,3Source9withoutdirectivity 25,3Source9tilted 23,30,400,20m
Source10directivity 24,7Source10withoutdirectivity 27,3Source10tilted 22,9Source11directivity 25,1Source11withoutdirectivity 28,3Source11tilted 22,7Source1directivity 35,7Source1withoutdirectivity 40,8Source1tilted 35,4Source2directivity 25,3Source2withoutdirectivity 29,1

Source2tilted 23,5Source3directivity 21,3Source3withoutdirectivity 24,5Source3tilted 19,7Source4directivity 21,6Source4withoutdirectivity 27,6Source4tilted 20,3Source5directivity 20,8Source5withoutdirectivity 22,1Source5tilted 19,7Source6directivity 18,1Source6withoutdirectivity 18,8Source6tilted 17,1Source7directivity 18,6Source7withoutdirectivity 20,8Source7tilted 17,4Source8directivity 15,3Source8withoutdirectivity 15,3Source8tilted 14,6Source9directivity 23,5Source9withoutdirectivity 25,5Source9tilted 23,50,400,2m
Source10directivity 23,5Source10withoutdirectivity 26,5Source10tilted 21,5Source11directivity 24,6Source11withoutdirectivity 28,1
Source11tilted 22,2Source1directivity 35,8Source1withoutdirectivity 41Source1tilted 35,6Source2directivity 23,7Source2withoutdirectivity 27,6Source2tilted 21,9Source3directivity 20,1Source3withoutdirectivity 23,9Source3tilted 18,7Source4directivity 20,9Source4withoutdirectivity 26,9Source4tilted 19,6Source5directivity 19,4Source5withoutdirectivity 20,9Source5tilted 18,4Source6directivity 17,1Source6withoutdirectivity 17,8Source6tilted 16,1Source7directivity 17,6Source7withoutdirectivity 19,6Source7tilted 16,2Source8directivity 14,8Source8withoutdirectivity 14,8Source8tilted 14,1Source9directivity 23Source9withoutdirectivity 25Source9tilted 23