an empirical investigation between trade liberalization and
DESCRIPTION
ÂTRANSCRIPT

Journal of Economics and Sustainable Development www.iiste.org
ISSN 2222-1700 (Paper) ISSN 2222-2855 (Online)
Vol.4, No.3, 2013
179
An Empirical Investigation Between Trade Liberalization And
Corruption: A Panel Data Approach
Saima Sarwar1 Prof. Dr. Muhammad Khalid Pervaiz
2
1. School of Management, Northern Canada University, PO box 1178, Toronto M3A 2K7, Canada
2. Dean, Faculty of Arts & Social Sciences, Chairman, Department of Statistics, Govt. College University,
Lahore, Pakistan
* E-mail of the corresponding author: [email protected]
Abstract
The present study empirically investigates the relationship between trade liberalization and corruption,
using data from twenty four countries divided into three panels: low income, middle income and high
income countries for a 13 years period, from 1995-2007. That period is taken to see this effect after the
establishment of WTO. Many other economic and non economic variables have also been incorporated
in this study. Fixed effect model have been used for estimation. The results show that trade liberalization
is both statistically significant and negatively correlated to the corruption level of these countries included
in the study. The results are robust even after controlling for other variables like economic freedom,
democracy, size of bureaucracy, average income level and level of education. The focus of study is mainly
on South Asian nations. Because according to the recent survey published by Transparency International
related to Corruption, these nations are at the bottom of ranking ladder.
Keywords: Corruption, Trade liberalization, Economic Freedom, Bureaucracy, Education.
1.Introduction
Corruption is not possible without rents16
. But in economics this term sometimes does not mean income gained
from hiring out land or housing. Here the existence of rents, legal or illegal is identified as a source of corruption
by researchers. Actors will strive to secure rents and the rents create economic room for actors to pay bribes.
Trade restrictions such as tariffs and quotas artificially low supply of imports, keeping domestic prices higher,
and there by generating rents for those who may take advantage of it. But competition helps to reduce rents .i.e. a
more competitive economy should be less vulnerable to corrupt activities. So if we have this idea in our mind
that open economies are more competitive then it means that these nations should be less corrupt. Krueger (1974)
was the first who proved that relationship between these two variables. i.e. trade restrictions and rent seeking
activities. Just as corruption is linked political, economic and social factors, there is also a link to trade. One
strand of thought has analyzed the effects of corruption on international trade. Lambsdorff (1998) and Anderson
and Marcouiller (1999) describe how corruption reduces international trade, because importers and exporters are
discouraged by a system of bribery uncompetitive bidding, selective taxation and artificially created monopolies.
The implicit assumption is that the chain of causality runs from corruption to trade, i.e., to increase international
trade, one must reduce the level of corruption. But the second strain of thought reverses the chain of causality.
Thus Ades and Di Tella (1995, 1996, 1997) claims that it is the level of international trade that is one factor (of
many factors) that affects the level of corruption. The argument is that trade liberalization, which results both in
the enlarging of the scope and increasing the efficiency of market, should make markets more competitive. This
reduces the level of available rents, which in turn leads to reduction in the amount of corruption in the economy.
But this study adopts the second point of view that trade liberalization affects the level of corruption. There is
plenty of evidence to suggest that the countries that are more open to trade are also less plagued by corruption
(World Bank 2000).
The main objective of this study is to present the empirical evidence about the relationship between trade
liberalization and corruption. The study attempts to have a cross-section comparison among these variables for
16 Torez, “The Effect Of Openness on Corruption”, published in journal,: International Trade and
Development, vol: 11:4, p. 387-403
Journal of Economics and Sustainable Development www.iiste.org
ISSN 2222-1700 (Paper) ISSN 2222-2855 (Online)
Vol.4, No.3, 2013
180
high, middle and low income countries. This study tries to explain the role of trade sector in generating
corruption in a nation. To the best of my knowledge, there is no single study showing the relationship between
these important variables after the establishment of WTO, particularly for the economy of Pakistan among South
Asian nations. It takes into account the impact of trade liberalization policies on trade volumes and which in turn
show that when barriers are removed from trade and it is being opened to the whole world then how corruption is
effected, i.e., positively or negatively. Moreover this study also analyzes the impact of democracy and economic
freedom on country’s corruption level. We have made use of panel data consisting of 24 countries and also tried
to show the causal relationship of trade openness and corruption. Here we have also checked the endogeneity of
variables through Wald test
2. Literature Review
Some theoretical literature for the relationship between these the two important variables of the study has been
presented in below. Some sociologists assert that corruption also differs among nations because social norms
vary across nations. Less developed nations may be more susceptible to corruption than industrial countries
because their dense personal relationship is more conducive to such behavior in the less developed countries.
Krueger (1974) first popularized the theoretical relationship between trade restrictions and rent seeking activity.
Corruption is not possible without rents. Since competition reduces rents, a more competitive should be less
vulnerable to corruption. Therefore if it is accepted that open economies are more competitive, it means that
these economies are to be less corrupt, ceteris paribus.
Rose-Ackerman (1997) found that corruption incentives rise with tax and tariff rates. In case studies of Mali and
Senegal, Stasavage and Daubree (1998) use statistical time-series data and observe that high tariff levels in these
countries have promoted customs fraud by increasing the incentive for private citizens to engage in illegal
behavior and for government officials to abuse their office for personal gain. Lowered tariffs, pre-shipment
inspection and customs reforms were helpful in fighting corruption in these countries.
Larrain and Tavarees (1999), have also estimated the effect of openness on corruption for a broad cross section
of countries during the period 1980-1995. They have used share of imports and exports in GDP as an indicator of
international openness in the goods market and FDI inflows as a share of GDP as a measure of openness in the
asset market. The results show a causal a causal relationship from higher level of openness leading to less
corruption. They also found a strong negative relationship between the level and variability of tariff barriers and
degree of corruption.
Treisman (2000) finds that greater openness may reduce corruption, but the more corruption there is the more
rent-generating trade barriers there will be. Similarly he also found that countries that are democratic have lower
corruption levels than non-democratic ones, since free press, free speech, and protection of civil liberties allows
for more transparency, making corrupt politicians accountable to voters.
Rose-Ackerman (2001), pointed out that a democratic regime does not guarantee lower corruption, as the need to
raise campaign funds for electoral competition may lead to abuse of power. There can be many other reasons that
why democracies do not necessarily have lower corruption. One possibility is that voters may have incomplete
information about candidates and obtaining information is too costly. This is true especially in developing
countries where high rates of illiteracy and poor access to information make the population more likely to vote to
keep corrupt politician in power.
Ahmed (2001) has recently developed another study which also shows the relationship between trade openness
and corruption. And again he has used different determinants of corruption, and these are bureaucracy
competition, urbanization, level of information, average years of schooling, GDP growth, industrial policy and
democracy.
Torrez (2002) finds that while the majority of empirical evidence supports a negative relationship between
corruption and openness, but this does not hold for all the datasets available. It differs with the use of index made
for showing corruption. In his study there is a significant relationship between trade volumes with the
Transparency International index in the 1980s, but not with the ICRG index (1982-92). The results seem to
depend on the choice of the corruption.
Lee and Azfar (2003) find a strong association between the initial rate of corruption (ICRG and TI averaged over
Journal of Economics and Sustainable Development www.iiste.org
ISSN 2222-1700 (Paper) ISSN 2222-2855 (Online)
Vol.4, No.3, 2013
181
1992-1994) and successive changes in tariff rates in 41 countries. An improvement by one standard deviation in
the corruption index of the initial year consequences in a significant 1.9 % point decrease in the simple average
tariff rates at the ending year. This is thought to be a large effect. The result is vigorous for changes in the
estimation methods, other possible explanatory variables and changes in sample (the effects are for instance not
caused by differences between countries that joined the WTO in 1995 and those who did not).
Gatti (2004) finds that average tariff levels are significantly and positively associated to corruption, or in other
words that higher tariffs induce more corruption. Gatti assumes that the reason that tariff levels are so important
is because they create opportunities for bribery between private agents and public officials. Gatti finds some but
weak support for the effect of import share of GDP (a measure of openness) on corruption (ICRG index). He also
suggested that this significant association between openness and corruption is highly sensitive to the inclusion of
the outliers. In his study, case of Singapore proved such an outlier in the sample. Singapore has extremely low
levels of corruption and extremely high percentage of imports in the GDP. He proposed that when Singapore is
excluded from the sample then the association will not remain significant.
Chaudhry (2005) has attempted to define the relationship between corruption and trade liberalization. He
included different variables which can affect corruption .i.e. level of growth, level of education, size and quality
of bureaucracy, and quality of judiciary. His main objective was to check the effect of World Bank
anti-corruption initiatives provided to selected nations on different trade related projects. Quota reduction, tariff
reduction and export promotion have been the major reform areas that the bank has concentrated on. The reform
process followed a sequence, with the removal of non tariff barriers and rationalization of the exchange rate
being the initial steps, followed by the promotion of exports and reducing import taxes.
Tavares (2005) in her research finds that economic and political both type of liberalization effect the level of
corruption. She proposed the results that democratization reduces corruption, while liberalization may actually
increases corruption. Furthermore democratization followed by rapid liberalization decreases corruption.
Whereas liberalization followed by rapid democratization increase corruption. Of particular concern is the
possibility that timing of reform, as well as the decision as to what type of reform to undertake may be
influenced by the level of corruption. She used the sample of 137 countries during the time period of 1984-2001.
Again ICRG index of corruption was used.
Tavares and Larrain(2007) in their research provides ample evidence about corruption levels and trade
openness. They have used FDI as a measure for trade openness. In this paper they addressed, for the first time,
the exact reverse link, i.e., the empirical effect of higher FDI inflows on corruption. Their dataset covers a wide
set of countries in the period between 1980 and 2000 and confront the issue of causality by constructing a new
set of instrumental variables that rely on geographical and cultural distance between FDI emitting and receiving
countries. FDI as a share of GDP significantly decreases country corruption and the quantitative impact is
stronger in this case while instrumenting for FDI. The results are extremely robust to the inclusion of other
determinants of openness such as trade intensity and average tariff level and the impact of FDI on corruption is
of the same order of magnitude as that on per capita income.
Shabbir and Anwar(2007) have worked on the important determinants of corruption in developing nations. They
have splited corruption into two dimensions i.e. public sector corruption and private sector corruption. The
public sector corruption means “misuse of public office for private benefits”. For cross country analysis, public
corruption is mainly focused. They worked on 41 developing nations to investigate the determinants of
corruption. They have again divided corruption determinants into economic and non-economic determinants.
The economic determinants included economic freedom, openness, level of education, distribution of income
and average level of income. The non-economic determinants were press freedom, democracy and share of
population. The empirical findings of the study indicated that all economic determinants are negatively related to
the perceived level of corruption and non-economic determinants are not significantly explaining the variations
in the level of corruption. So their study showed that socio-political and religious norms are so weak that they
cannot affect the corruption level in these countries. And study concluded that govt. should focus on the
economic factors to curb the level of corruption.
3: Hypothesis:
H1 =There exists significant negative relationship between these two variables.
Journal of Economics and Sustainable Development www.iiste.org
ISSN 2222-1700 (Paper) ISSN 2222-2855 (Online)
Vol.4, No.3, 2013
182
4.Methodology Definitions and sources of variables
4.1. Corruption: The dependent variable used in this study is objective rather than subjective measure of
corruption. The measurement of corruption is based upon target-group perceptions. The data on corruption used
in this study has been taken from Transparency international in terms of the degree to which corruption is
perceived to exist among public officials and politicians. The index score range is in between 0 (totally corrupt)
and 10 (clean).
4.2. Trade Liberalization(TL): There are acute measurement issues related to the trade liberalization index. In
this study we are using trade liberalization and trade openness interchangeably.17
Therefore the method through
which we are going to calculate trade openness is known as trade intensity measure. That is a widely used
measure for trade openness (for example, see Larrain and Tavarees(1999), Torez(2002), Knack and Azfar(2002),
Bandyopadhyay and Roy(2006) and Wei(2000)) It takes into account the total volume of trade which helps us to
see that how much trade has been expanded after the result of such policies. This can be defined as:Trade
liberalization = imports + exports/GDP.The data regarding these variables have been obtained from World
Development Indicators (WDI) CD.
4.3. Economic Freedom(EF): The data on Economic Freedom is a series of 10 economic measurements created
by the Wall Street Journal and the Heritage Foundation to measure the degree of economic freedom in the
nations. The scale of index is from 0 (no freedom) to 100 (maximum freedom). The highest form of economic
freedom provides an absolute right of ownership, fully realized freedom of movement for labor, capital and
goods and an absolute absence of coercion or constraint of economic liberty beyond the extent necessary for
citizens to protect and maintain liberty itself.
4.4. Democracy(B): For this purpose Freedom House index has been used to show the degree of democracy.
Freedom House publishes all country scores since 1972. It include two categories to show that either a country
free or not free. These are political rights and civil liberty status in a nation. It ranges from 1( highest degree of
freedom) to 7( lowest degree of freedom).
4.5. Average income level(Yp): In economics we define average income of a person by GDP per capita.Which is
obtained by dividing total national income of a nation by its total population. Data on this variable has been
taken from World Development Indicators (WDI) CD.
4.6. Level of Education(Pedu): In this study we are measuring education level by taking into account primary
enrollment rates in a nation. So in our analysis Primary education is the total number of pupils enrolled at
primary level in public and private schools. Same definition has also been used in another study by Azam
Chaudhry(2005). Data on this variable has been taken from World Development Indicator (WDI) CD.
4.7. Size of Bureaucracy(DEM): This variable is exogenously determined by taking ratio of government
expenditure with respect to GDP. So in other words we can measure the size of bureaucracy by estimating the
government expenditure share in total GDP. For making this variable we have to incorporate two variables, i.e.,
gross national expenditure and GDP. And the source of data is World Development Indicator (WDI) CD. The
following model has been used for finding the relationships among variables
The Regression Equation becomes:
CPIt = α1t + α2t TL + α3t YP + α4t EF + α5t B + α6t DEM + α7t PEDU + εt
It’s a cross section analysis using linear estimation including the time period 1995-2007. The study is based on a
pooled data set, comprising 24 countries. These nations have been divided into three panels on the basis of
income levels i.e. high income nations, middle income nations and low income nation. Dynamic fixed effect
model has been applied because lagged values of dependent variable have also been used as an explanatory
variable. But here this question can be arised that why fixed effect model has been used and not OLS or other
techniques. Then the main reason for applying this is ,in panel specification, if technique of OLS has been
employed then there is a probability that estimates tend to be biased and inconsistent. This method usually
violates classical assumptions. While using OLS, many a times there have been seen the problem of
17 Tonia Kandeiro and Margarate Chitiga in their work on “Trade openness and FDI in Africa” have also used these two
terms interchageably.
Journal of Economics and Sustainable Development www.iiste.org
ISSN 2222-1700 (Paper) ISSN 2222-2855 (Online)
Vol.4, No.3, 2013
183
autocorrelation, hetroscedacticity and multicollinearity so that is the main reason for not using such technique in
measuring time series data. One of the important problem associated with this technique is related to degrees of
freedom. i.e. number of parameters will be more as compared to the sample size in the present study. By
combining time series of cross section observations, panel data give more informative data, more variability, less
collinearity among variables more degree of freedoms and more effiiciency.18
Time effect models also address the
problem of endogeneity of regressors due to correlation of right hand side variables with error terms in other
periods. Exogeneity Wald Tests have been used to test the endogeneity of variables. And this shows that
corruption is an endogenous variable and all others are exogenous.
5. Results : This study present the analysis of the impact of trade liberalization and corruption by using three
panels comprised of low income, middle income, and high income. There has been an advantage in adopting this
panel technique in a way that it helps in measuring the individual country effect of trade liberalization on
corruption, this is called country specific. And when effect of trade liberalisation has been intended to see over
different time period, it is called time specific. The estimated results, using the technique of fixed effect model,
have been given in this table.
5.1. Fixed Effect Model Results:
Insert Table 1 here
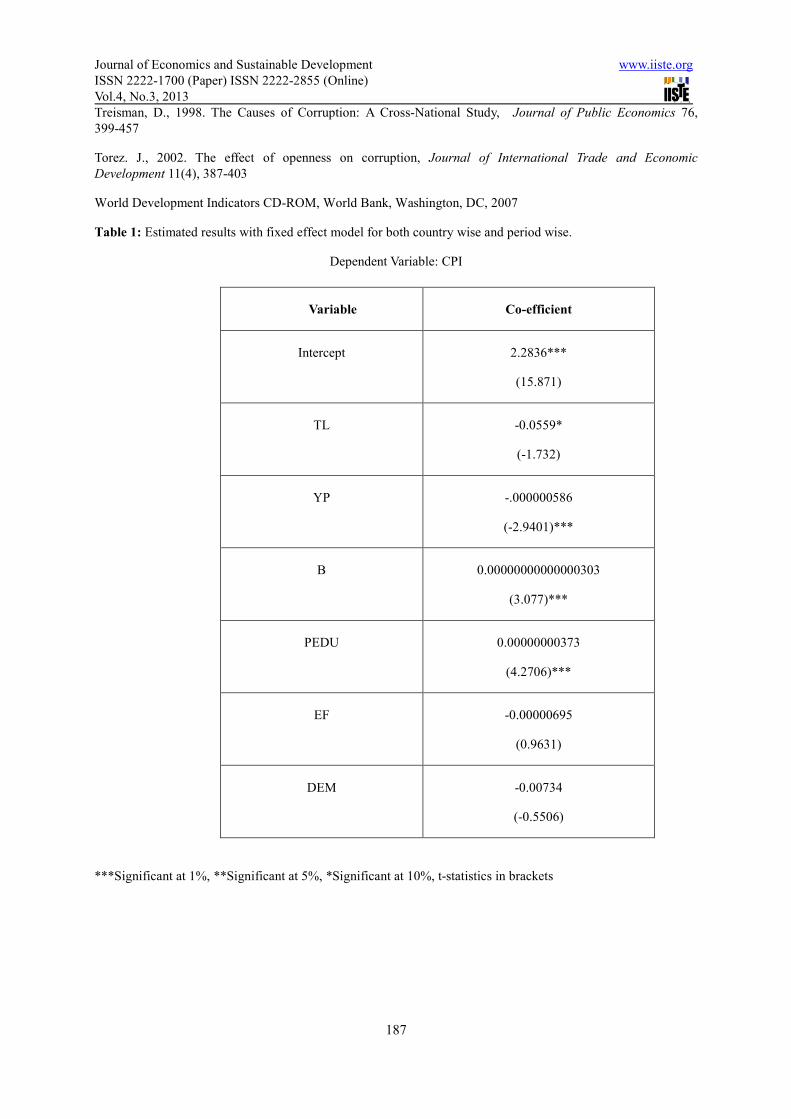
From this above table, it can be analysed, that there is a significant negative relationship between trade
liberalization and perceived corruption levels. That is significant at 10% level of significance. So we reject our
null hypothesis. The co-efficient of YP, which shows per capita income, is also having a negative sign. This
shows that corruption level is negatively related to average income level of individuals which shows that as the
income of people start rising, they are no more in state of poverty. This will reduce the acts of corruption because
they have enough money to fulfill their desires through lawful manner. This is significantly correlated with
corruption at 1% level of significance. Bureaucracy which has been shown by the size of government , is
significantly positively related to corruption level. It means that as the size of government increases it gives more
incentives to people for rent-seeking. It is significant at 1% level of significance. PEDU is positively related with
corruption level at the 1% level of significance. This is opposite to the expectations. Because the study
hypothesized that more education leads to less corruption but here results show that education leads to corruption.
There can be many reasons for this. But the foremost reason observed here in this study is that we have included
only primary education in this analysis so it means only the attainment of primary education is not enough to
control corruption level in a nation.19
Economic Freedom is negatively related to corruption level which also confirms the relationship, as expected.
Similarly Democracy co-efficient is also having the expected nature of relationship. But these results are not
showing significance. These findings are supported by other empirical findings by Shabbir and Anwar (2007)
where they also used these two non-economic variables in their analysis and found the insignificant impact of
these variables on the level of corruption in a nation. Similarly another study on democracy and corruption by
Micheal (2007) showed the same kind of relationship between these two variables. He proved that electoral
democracies are not significantly related to reduce corruption in a nation. He further showed that there exists a U
shaped relationship between these two variables and age of democracy matters a lot. According to his finding,
the turning point in the relationship between corruption and democracy occurs at a very young age ____ between
4 to 15 years, and he concluded that low income nations have been able to reduce corruption in the early year of
their transitions. So it means that this variable will be having negative impact on corruption in mostly developing
nations because if we analyse from the world map it will be very clear that mostly under developed nations have
been passed through newly democratic change while mostly developed nations are purely democratic in nature
for a long time. This can be seen clearly when observing country specific effects. It shows that high income
nations are observing positive impact of these variables on their economies. And the reason behind this fact is
18 Damodar N. Gujrati, “Basic Econometrics” fourth edition, U.S Military academy, West Point. 19
These findings are also supported by previous empirical studies by Kuinikova R. Ackerman(2005),
Gruger-Shah(2005), Knack-Azfar (2003), Ades-Di Tella(1999), Triesman(2000), Shabbir, Mumtaz(2007)
and etc.
Journal of Economics and Sustainable Development www.iiste.org
ISSN 2222-1700 (Paper) ISSN 2222-2855 (Online)
Vol.4, No.3, 2013
184
only the maturity of democratic institutes. As it has been discussed earlier that there exists an inverted
relationship between these two variables which means that before democratization process, a country faces
corruption due to stringent government regulations but when the process of democracy starts, corruption level
comes down in the beginning leading to again a rise after the maturity of democratic institutes.
Model shows that about 98 percent variation in corruption is due to these variables. F-Statistic is also showing
that model is significant because its value is very high. Durban-Watson is 1.687 which shows that the
performance of model is satisfactory.Different models have been used for checking the relationship among
variables but results are more significant country wise specifically. The results are insignificant when period
effect have been observed specifically which means that there are less variations in corruption time period wise.
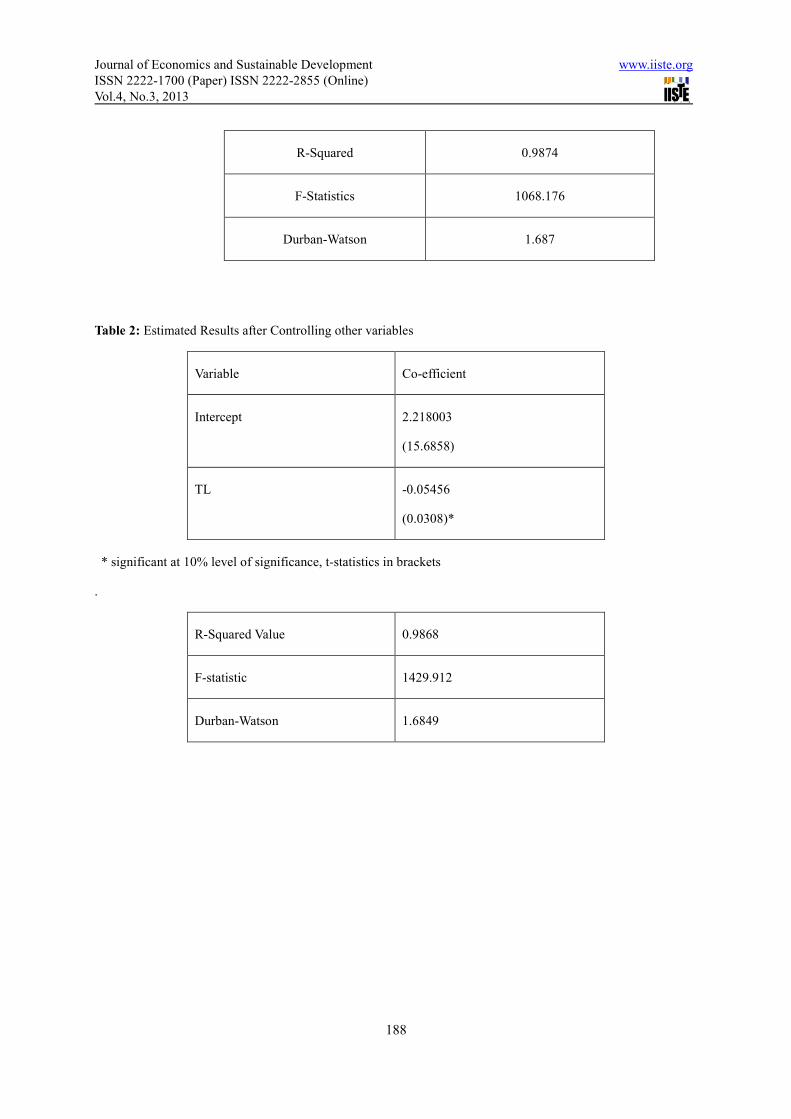
In another model where controlling the effect of all other variables and only run the regression between two
variables .i.e., trade liberalization and corruption then results are robust. Again these two variables show a
negative relationship and R- Squared value showed that about 99 % variation in model is the result of the
independent variable. The results are as follows:
5.2. Fixed Effect Model Results (Controlling All Other Variables)
Insert Table 2 here
The table given below shows the results of another model has been run taking into account country specific
under fixed effect. The main purpose to use this model was to see cross country wise the effect of these variables
on our dependent variable. By running the data for fixed effect model, the coefficients of most of the variables
are significant at 1% level of significance. The results of the model are given as below:
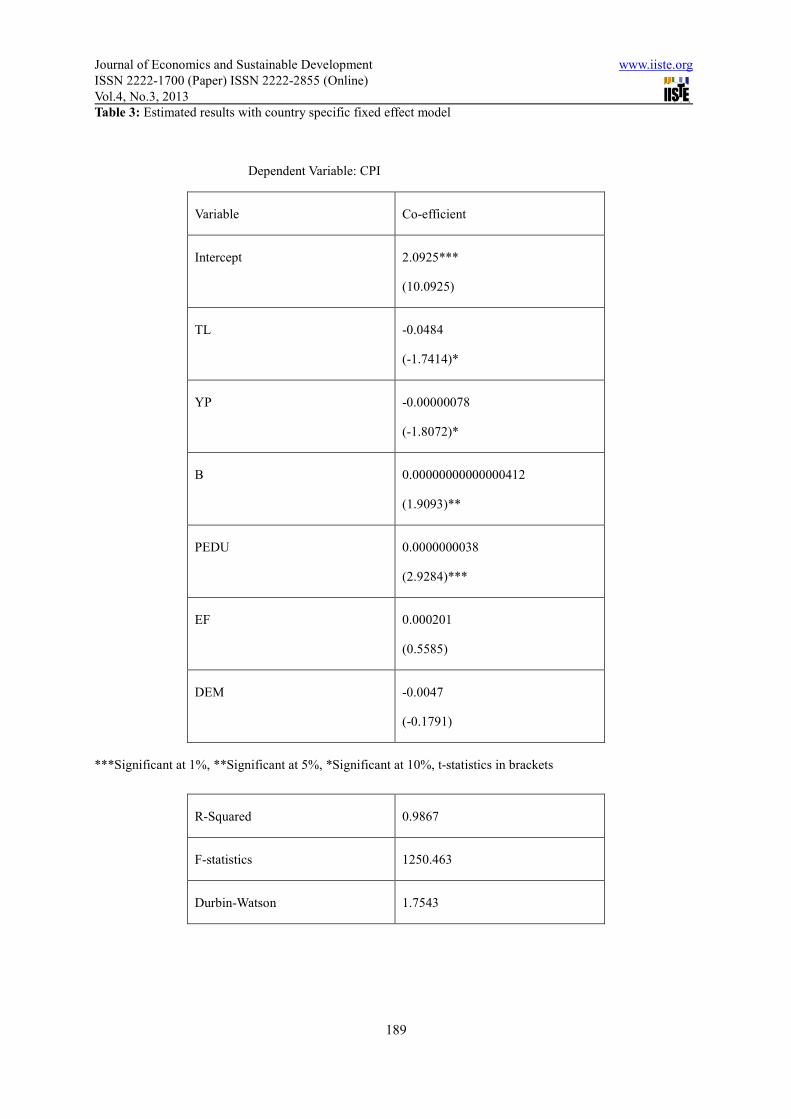
5.3. Fixed Effect Model Results (Country Specific)
Insert Table 3 here
From this model again the results are almost showing the same trend except the change in the coefficient of the
Economic Freedom variable. In country specific fixed effect model significance of the variables has also been
affected. TL variable is showing a negative relationship with dependent variable and is significant at the same
level of significance of 10% as have been seen in earlier models. YP is showing the expected relationship but the
significance of the variable has changed. In this model it is significant at 10% level of significance. Other
variables like PEDU and B are also significantly related to our dependent variable at 1% and 5% level of
significance. The two variables EF and D are showing insignificant results but presenting the same expected
signs of coefficients. Overall model performance is highly satisfactory which can be viewed with the help of
unweighted statistics of the model in table 3.
From these results it can be seen that about 98% variation in the dependent variable is due to the variables
included in the analysis. On the other hand the value of Durbin-Watson assure the absence of Auto-Collinearity.
As a whole this model is significant.
Moreover when analyzing country specific effects, then it has been observed that corruption is going to be
reduced in low and middle income nations as a result of these independent variables but in case of high income
nations the situation is opposite. According to an author economic liberalization can also create bountiful
opportunities for corruption.20
because when a country is open to international trade , they allow state-owned
companies to become privatised. And this ultimately generates a new source of rents. Moreover authors also
conclude that liberalization followed by rapid democratization seems to increase corruption. By observing
these high income nations, it can be said that such nations are passing through this stage. These nations have
economic freedom and democratic institutes since a long time. Due to large bureaucracies, institutions are very
strong which can allow easily misuse of power. South Asian nations falls into low and middle income nation
category, so it means if these nations tend to liberalize their trade and move towards more economic freedom
then there are chances to reduce their corruption level. Moreover the process of trade liberalization has been in
process in these nations since 90s, but in many of these nations the process of democracy has not been in real
essence. e.g. Pakistan. Since 1999- 2007, Army control has been there , such type of political setbacks hit the
performance of institutes. But now again the process of democratization is on its way to progress. It has been
also observed that democratization followed by trade liberalization decrease corruption. (Tavares,2005). So this
20 See for detail, Tavares(2005), “Does rapid trade liberalization increase corruption?
Journal of Economics and Sustainable Development www.iiste.org
ISSN 2222-1700 (Paper) ISSN 2222-2855 (Online)
Vol.4, No.3, 2013
185
can be one of the reasons that in low and middle income nations trade liberalization is having negative effect on
corruption. But still these nations are more corrupt on world map as compared to high income nations. There are
many reasons of it but one of the most important is the political disturbances in these nations. Due to this
political instability, there are more chances of making misuse of public power.
6. Conclusions and Recommendation
This study tries to show the effect of trade liberalization on the perceived level of corruption among nations. It is
based on 13 years data from 1995-2007.The reason behind the selection of this time period is to see the effect
opening up of trade under the scenario of WTO. We all know that trade liberalization is a tool of globalization.
And WTO is an organization which was made for the fulfillment of the desired objectives of this globalization
process. The basic aim of this study was to show that when trade is being liberalized then how many incentives
for corruption are prevailing in the economies. The causal chain of this relationship is as follows: when trade
sector is protected it means that custom duties in a nation will be high and people will not be willing to use their
money for the payment of such duties so they will involve themselves in giving bribes to public officials which
will generate incentives for corruption. But now what we have tried to show in this study is when as a result of
liberalized policies trade barriers are removed then to what extent these public officials get involved in
corruption generating activities. Facts show that when duties are removed then people will not be reluctant to go
through fair means and they will not have to pay bribes for the clearance of their shipments. In this way bribery
cases will be lowered down and overall corruption will start decreasing. So in this way there will be a negative
association between trade openness and corruption. This study proved the relationship as perceived.
Similarly the other variables which have included in this study like economic freedom, democracy and size of
bureaucracy are also results of the process of globalization. The study also tried to analyze this relationship for
South Asian nations. Unfortunately all seven nations have not been included in this study due to the non
availability of data three nations, i.e., Maldives, Nepal, Bhutan have not been included in this study. So
observing country specific results in case of fixed effect model, it has been seen that all these nations are going
to observe the same negative relationship for these two variables. But high income nations are not observing this
type of relationship for these variables. There can be many reasons for this but foremost reason can be that when
some policies get matured then people try to find how these can be better manipulated for their own vested
interest. So that can be the reason for such positive relationship between these important variables of the study.
And one more important factor can be that when the size of the economies grow then there will be more refined
ways for suppressing such activities.
So for a nation to be free from corruption, following recommendations are here:
• There must be tariff reforms in a nation. It has been observed that higher import duties lead to higher
level of corruption, while high export taxes have been a negligible effect on the corruption level.
• Average income level of a nation should be increased. Because in this way people will not go for illegal
means for the attainment of their desires.
• Economies should be made democratic. If nations will be democratic then media will be more powerful and
which in a way help to reduce the chances of such corrupt activities
• Strict government regulations also hamper the law and order situation in a nation. So such harsh attitudes in
policy making should try to be avoided.
• Bureaucratic culture should be eliminated. Power should not be in few hands. Common people should also
be a part of policy making process so that no one can mould laws according to their own vested interests.
• Being developing nations, the literacy rate in South Asian nations is very low. Due to this reason there is
lack of awareness among people about the after effects of such activities. So more emphasis should be given
for the development of education sector.
• Rent-seeking activities can be avoided, if we have transparent environment in our nation for businessmen
and exporters of our nations. So such policies should be made through which a sense of security must be
developed among this community. Because when there is fear of insecurity then people try to seek other
ways for the accomplishment of their work.
Journal of Economics and Sustainable Development www.iiste.org
ISSN 2222-1700 (Paper) ISSN 2222-2855 (Online)
Vol.4, No.3, 2013
186
So these are few recommendations with the help of which we can be able to avoid many chances of corruption in
a nation. South Asian region, as we know is also prey to a very serious economic problem.i.e., poverty. So this is
also a big reason for the high level of corruption prevalence in these nations. So this problem can be easily
removed if there is free trade environment within these nations. Because it will create job opportunities for these
people which in turn generate income. And this in turn proves the negative relationship between these two
variables i.e. between corruption and average income level. So this is related to the extent of trade openness of a
nation. .
References
Ades, A. and R., Di Tella, 1997. The new economics of corruption: a survey and some new results, Political
Studies 115, 496-515.
Ades, A. and R., Di Tella, 1996. The Causes and Consequence of Corruption: A Review of Recent Empirical
Contributions, IDS Bulletin 27(2), 6-11.
Ades, A. and R., Di Tella, 1997. National Champions and Corruption: Some Unpleasant Interventionist
Arithmetic, The Economic Journal 107, .1023-1042.
Ahmad, N., 2001. Causes of Corruption: An Empirical Analysis from Winners’ and Losers’ Perspectives,
Unpublished manuscript, Northeastern University, Boston.
Ahmad, N., 2002. Corruption and Government Regulations: An Empirical Analysis Using Threshold
Regressions, Paper for 18-th Annual General Meeting of PSDE.
Chowdhury, S., 2005. The effect of democracy and press freedom on corruption: An empirical test, Economic
Letters.
Gatti, R., 1999. Corruption and Trade Tariffs, or case for uniform Tariffs, The World Bank Policy, Research
Working Paper Series 2216.
Gatti, R., 2004. Explaining Corruption: Are open economies less corrupt?, Journal of International
Development 16, 851-861
Knack, S. and O., Azfar, 2003. Trade Intensity, Country Size and Corruption, .Economics of Governance 4, 1-18.
Krueger, A., 1974. The Political Economy of the Rent-Seeking Society, American Economic Review 64, 291–
303.
Lambsdorff, J., 1998. An Empirical Investigation of Bribery in International Trade, European Journal of
Development Research, 10(1), 40-59.
Lee, Y. and O. Azfar, 2003. Does corruption hinder Trade reform?, IRIS Discussion Paper No. 03/07
Micheal, T., 2007. Corruption and Democracy, DESA Working Paper No. 55
Mohtadi, H., and T. Roe, 2004. Trade, information and corruption: a signaling game, Paper prepared for
presentation at American Economic Association meeting, January 2005.
Rodrik, D., 1996. Why do more open economies have bigger governments. National Bureau of Economic
Research Working Paper No. 5537 April.
Rose-Ackerman, S., 1997. Corruption: A Study of Political Economy, New York Academic Press.
Shabbir. G., and M. Anwar, 2007. Determinants of corruption in Developing nations, Hamburg Institute of
International Economics(HWWI).
Tavares. J, and B. F. Larrain, 1999. Can openness deter corruption?, Harvard Institute for International
development, Harvard University.
Journal of Economics and Sustainable Development www.iiste.org
ISSN 2222-1700 (Paper) ISSN 2222-2855 (Online)
Vol.4, No.3, 2013
187
Treisman, D., 1998. The Causes of Corruption: A Cross-National Study, Journal of Public Economics 76,
399-457
Torez. J., 2002. The effect of openness on corruption, Journal of International Trade and Economic
Development 11(4), 387-403
World Development Indicators CD-ROM, World Bank, Washington, DC, 2007
Table 1: Estimated results with fixed effect model for both country wise and period wise.
Dependent Variable: CPI
***Significant at 1%, **Significant at 5%, *Significant at 10%, t-statistics in brackets
Variable Co-efficient
Intercept 2.2836***
(15.871)
TL -0.0559*
(-1.732)
YP -.000000586
(-2.9401)***
B 0.00000000000000303
(3.077)***
PEDU 0.00000000373
(4.2706)***
EF -0.00000695
(0.9631)
DEM -0.00734
(-0.5506)
Journal of Economics and Sustainable Development www.iiste.org
ISSN 2222-1700 (Paper) ISSN 2222-2855 (Online)
Vol.4, No.3, 2013
188
Table 2: Estimated Results after Controlling other variables
Variable Co-efficient
Intercept 2.218003
(15.6858)
TL -0.05456
(0.0308)*
* significant at 10% level of significance, t-statistics in brackets
.
R-Squared Value 0.9868
F-statistic 1429.912
Durban-Watson 1.6849
R-Squared 0.9874
F-Statistics 1068.176
Durban-Watson 1.687
Journal of Economics and Sustainable Development www.iiste.org
ISSN 2222-1700 (Paper) ISSN 2222-2855 (Online)
Vol.4, No.3, 2013
189
Table 3: Estimated results with country specific fixed effect model
Dependent Variable: CPI
Variable Co-efficient
Intercept 2.0925***
(10.0925)
TL -0.0484
(-1.7414)*
YP -0.00000078
(-1.8072)*
B 0.00000000000000412
(1.9093)**
PEDU 0.0000000038
(2.9284)***
EF 0.000201
(0.5585)
DEM -0.0047
(-0.1791)
***Significant at 1%, **Significant at 5%, *Significant at 10%, t-statistics in brackets
R-Squared 0.9867
F-statistics 1250.463
Durbin-Watson 1.7543
This academic article was published by The International Institute for Science,
Technology and Education (IISTE). The IISTE is a pioneer in the Open Access
Publishing service based in the U.S. and Europe. The aim of the institute is
Accelerating Global Knowledge Sharing.
More information about the publisher can be found in the IISTE’s homepage:
http://www.iiste.org
CALL FOR PAPERS
The IISTE is currently hosting more than 30 peer-reviewed academic journals and
collaborating with academic institutions around the world. There’s no deadline for
submission. Prospective authors of IISTE journals can find the submission
instruction on the following page: http://www.iiste.org/Journals/
The IISTE editorial team promises to the review and publish all the qualified
submissions in a fast manner. All the journals articles are available online to the
readers all over the world without financial, legal, or technical barriers other than
those inseparable from gaining access to the internet itself. Printed version of the
journals is also available upon request of readers and authors.
IISTE Knowledge Sharing Partners
EBSCO, Index Copernicus, Ulrich's Periodicals Directory, JournalTOCS, PKP Open
Archives Harvester, Bielefeld Academic Search Engine, Elektronische
Zeitschriftenbibliothek EZB, Open J-Gate, OCLC WorldCat, Universe Digtial
Library , NewJour, Google Scholar