an automatic enzyme immunoassay based on a chemiluminescent lateral flow immunosensor
TRANSCRIPT

An automatic enzyme immunoassay based on a chemiluminescentlateral flow immunosensor
Hyou-Arm Joung a, Young Kyoung Oh b, Min-Gon Kim a,b,n
a School of Physics and Chemistry, Gwangju Institute of Science and Technology, Gwangju 500-712, Republic of Koreab INGIbio Co. Ltd., R&D Center, 206, APRI, 123 Chemdan-gwagiro, Buk-gu, Gwangju 500-712, Republic of Korea
a r t i c l e i n f o
Article history:Received 22 July 2013Received in revised form1 October 2013Accepted 3 October 2013Available online 16 October 2013
Keywords:Enzyme immunoassayLateral flow immunoassayChemiluminescenceAsymmetric polysulfone membraneAutomatic enzyme immunoassayC-reactive protein
a b s t r a c t
Microfluidic integrated enzyme immunosorbent assay (EIA) sensors are efficient systems for point-of-care testing (POCT). However, such systems are not only relatively expensive but also require acomplicated manufacturing process. Therefore, additional fluidic control systems are required for theimplementation of EIAs in a lateral flow immunosensor (LFI) strip sensor. In this study, we describe anovel LFI for EIA, the use of which does not require additional steps such as mechanical fluidic control,washing, or injecting. The key concept relies on a delayed-release effect of chemiluminescence substrates(luminol enhancer and hydrogen peroxide generator) by an asymmetric polysulfone membrane (ASPM).When the ASPM was placed between the nitrocellulose (NC) membrane and the substrate pad, substratesencapsulated in the substrate pad were released after 5.370.3 min. Using this delayed-release effect, wedesigned and implemented the chemiluminescent LFI-based automatic EIA system, which sequentiallyperformed the immunoreaction, pH change, substrate release, hydrogen peroxide generation, andchemiluminescent reaction with only 1 sample injection. In a model study, implementation of thesensor was validated by measuring the high sensitivity C-reactive protein (hs-CRP) level in humanserum.
& 2013 Elsevier B.V. All rights reserved.
1. Introduction
The immunoassay is a biochemical test that is commonly usedto measure the concentration of target molecules. The enzymeimmunoassay (EIA) is a well-established in-vitro diagnostic tech-nique using enzyme-labeled antibodies (Lequin, 2005; Wisdom,1976). In clinical chemistry, EIA systems, such as the enzyme-linked immunosorbent assay (ELISA), are the most widely usedanalytic tools for determining various biomarkers, including the C-reactive protein (CRP), troponin, and cytokines in body fluids(Heeschen et al., 1999; Laurent et al., 1985; Leng et al., 2008),due to their ability to produce highly specific and sensitive resultswithin 5 h. EIA-based microfluidic immunosensors have receivedincreased attention from researchers and have recently beencommercialized (e.g. i-STATs, Abbott Laboratories., USA) (Herváset al., 2012; Yakovleva et al., 2002; Zang et al., 2012). By using amicrofluidic system, the EIA makes it possible to obtain faster andsimpler measurements automatically, evenwith very small sampleamounts. Therefore, microfluidic integrated EIA sensors are sui-table for point-of-care testing (POCT). However, as a disposable
sensor, microfluidic systems are not only relatively expensive, butalso require a complicated manufacturing process (Yager et al.,2006). For these reasons, cheaper and simpler EIA-based POCTsensors are required for efficient on-site diagnostics. The lateralflow immunosensor (LFI) strip is one of the most widely usedPOCT systems for various types of detections (Ngom et al., 2010;Posthuma-Trumpie et al., 2009; Wongsrichanalai et al., 2007; Zuket al., 1985) due to its rapid assay time, cost effectiveness, and easeof use. The conventional LFI strip uses antibody-labeled goldnanoparticles as a signal indicator, and fluorescent materials suchas fluorescein, Q-dot, and europium are also used for obtainingbetter quantitative and sensitive results (Choi et al., 2004; Li et al.,2010; Xia et al., 2009). However, the EIA system is nonethelessdifficult to implement in the LFI strip sensor because it requiresadditional steps during measurement, such as washing andinjecting. Therefore, additional fluidic control systems are requiredfor the implementation of EIA in an LFI strip sensor. For example,an ELISA-on-a-chip system has been reported for the detection ofcardiac troponin I (cTnI) by using a cross flow of enzyme substratesolutions through a plastic fluidic channel (Cho et al., 2006). Forthis reason, no automatic EIA-based LFI strip immunosensorwithout additional fluidic control has yet been reported.
In this study, we developed a novel chemiluminescence LFIstrip-based automatic EIA system using a delayed-release techni-que that could delay the release of enzyme substrates and change
Contents lists available at ScienceDirect
journal homepage: www.elsevier.com/locate/bios
Biosensors and Bioelectronics
0956-5663/$ - see front matter & 2013 Elsevier B.V. All rights reserved.http://dx.doi.org/10.1016/j.bios.2013.10.004
n Corresponding author at: School of Physics and Chemistry, Gwangju Institute ofScience and Technology, Gwangju 500-712, Republic of Korea.Tel.: þ82 62 715 3330; fax: þ82 62 715 3419.
E-mail address: [email protected] (M.-G. Kim).
Biosensors and Bioelectronics 53 (2014) 330–335

the reaction pH during the sample flow without the need foradditional operations or complex manufacturing processes.To date, several types of horseradish peroxidase (HRP) catalyzedchemiluminescence LFI (CLFI) strip sensors have been reported(Cho et al., 2009; Kim et al., 2010; Mirasoli et al., 2012). However,these strip sensors require a substrate (luminol and hydrogenperoxide) addition step for generation of the chemiluminescentsignal because of the following 3 problems. First, the optimal pHconditions differ for the immune response (neutral pH) andchemiluminescence (pH 8.5–9.5) (Dotsikas and Loukas, 2007).Therefore, the strip sensor pH needs to be changed from neutralto alkaline during the sample flow. Second, hydrogen peroxide hasstorage and stability problems. Third, if HRP-labeled detectionantibodies are mixed with the substrates before the end of theimmune reaction, an undesired signal will be produced. Therefore,the chemiluminescence reaction should occur after the sandwichimmune reaction is complete. To overcome these problems, wedesigned the new LFI strip to sequentially control the immunoas-say, delayed release of substrates with pH change, hydrogenperoxide generation, and the luminol reaction.
2. Materials and methods
2.1. Materials
C-reactive protein (CRP)-free serum (90R-100), surfactant 10G(95R-103), CK-MB (30-AC66), troponin I (30-AT43), proBNP (30C-CP1149) and myoglobin (30-AM20) were purchased from Fitzger-ald Industries International (Acton, MA). CRP was purchased fromWako Chemicals (309–51191; Osaka, Japan), and anti-CRP poly-clonal antibody and monoclonal antibody-HRP conjugate werepurchased from Abcam Inc. (Cambridge, MA, USA). The nitrocellu-lose (NC) membrane was purchased from Millipore (HFB02404;Billerica, MA). The sample pad (P/N BSP-133-20) and asymmetricpolysulfone membrane (ASPM, Vivid plasma separation-GX, USA)were purchased from Pall Co. (Port Washington, NY). Cholineoxidase (ChOx) was purchased from TOYOBO Co., Ltd. Luminol,choline chloride, p-coumaric acid, p-iodophenol, polyvinylpyrroli-done (PVP55K), sucrose, human serum albumin, thrombin andother chemicals were purchased from Sigma-Aldrich (St. Louis,MO). All buffers and reagent solutions were prepared with waterpurified using the Brema water purification system.
2.2. Preparation of the substrate pad
A solution containing 100 μL luminol (0.5 M in 50 mM NaOH),30 μL choline chloride (1 M in DW), and 1 μL p-coumaric acid(0.5 M in dimethylformamide (DMF)) was mixed with 870 μL0.1 M carbonate buffer (pH 9.2). After mixing, the 75 μL mixedsolution was loaded on the pad (50�3.8 mm2) and was subse-quently dried in a dry oven at 65 1C for 30 min. A solution-treatedpad was attached to the middle of a piece of sealing tape(50�15 mm2) and was cut to obtain a 3.8�3.8-mm2 section byusing a cutter. All solution components were optimized for thechemiluminescence lateral flow immunosensor (LFI).
2.3. Preparation of detection, capture, and control antibody solutions
2.3.1. Detection antibody solutionThe solution containing 5 μL anti-CRP monoclonal antibody-
HRP (2 mg mL�1) was mixed with 95 μL of 2% (v/v) surfactant 10G,3.75% (w/v) PVP 55 K, and 0.5% (w/v) sucrose-added 1X pH 7.2phosphate-buffered saline (PBS) which is composed of 137 mMNaCl, 2.7 mM KCl, 4.3 mM Na2HPO4 and 1.4 mM KH2PO4.
2.3.2. Capture and control antibody solutionsThe solution containing 5 μL anti-CPR polyclonal antibody
(10 mg mL�1) for capture or 5 μL anti-mouse IgG (1 mg mL�1)was mixed with 45 μL choline oxidase (100 unit mL�1)-added PBS.
2.4. Dispensing of the detection, capture, and control antibodysolutions
An NC membrane (0.25�30 cm2) was used to immobilize thecapture and control antibodies and to load the detection antibody-HRP conjugate to different zones by using a dispenser (DCI100;Zeta Corporation, Kyunggi-do, South Korea); the detection anti-body (2.5 μL cm�1) and capture and control antibodies (1 μL cm�1
for both) were added consecutively. The distance between the testand control zones was approximately 3 mm, and the distancebetween the detection antibody and the test zone was approxi-mately 5 mm. The dispensed NC membrane was dried for 1 h in adesiccator at room temperature.
2.5. Preparation of the chemiluminescence LFI (CLFI) strip
The strip was composed of 6 parts, including the sample pad,inter pad, substrate pad, asymmetric membrane, antibody-dispensedNC membrane, and absorbent pad. An absorbent pad (1.5�30 cm2)was attached to the top of the NC membrane, and the inter pad(5 mm�30 cm) and sample pad (1.5�30 cm2) were consecutivelyassembled on a plastic adhesive backing (60�300 mm2).The assembled strips (3.8 mm in width) were cut with a cutterdevice. After cutting, the asymmetric membrane (5�3.8 mm2) andsubstrate pad were stacked on the NC membrane between the interpad and the antibody-HRP loaded line. The larger pore side of theasymmetric membrane made contact with the substrate pad.
2.6. Optimization of luminol, p-coumaric acid, choline chloride,and choline oxidase concentrations
2.6.1. LuminolOne microliter of 20 μg mL�1 Ab-HRP was spotted on the NC
membrane and dried at 37 1C in a dry oven for 15 min. Variousconcentrations of luminol in pH 9.2 0.1 M carbonate buffer wereloaded on the substrate pad and dried at 65 1C in a dry oven for30 min. The luminol-stored substrate pads were attached to theAb-HRP-spotted NC strip, and 100 μL of 1 mM hydrogen peroxide-added CRP free serum was loaded. The concentration of 50 mMshowed the highest signal intensity (Figure S2A). The strippreparation process was performed as described above.
2.6.2. p-coumaric acidp-coumaric acid was dissolved in DMF (0.5 M). Various con-
centrations of p-coumaric acid were prepared on substrate padscontaining 50 mM luminol. Strip preparation and measurementwere performed in the same manner as described for the luminoloptimization steps, but with a different Ab-HRP concentration(0.2 μg mL�1). The signal (I) was compared to that of the noenhancer condition (I0). The concentration of 0.5 mM showed thehighest signal intensity (Figure S2B).
2.6.3. Choline chlorideOne microliter of 2 μg mL�1 Ab-HRP in 100 units mL�1 choline
oxidase-added PBS was spotted on the NC membrane. Variousconcentrations of choline chloride-added substrate pads with50 mM luminol and 0.5 mM p-coumaric acid were prepared. Thetest strip was prepared in the same way as described above insection (a). The signal intensity was saturated at concentrations ofmore than 10 mM choline chloride (Figure S2C).
H.-A. Joung et al. / Biosensors and Bioelectronics 53 (2014) 330–335 331
2.6.4. Choline oxidaseVarious concentrations of choline oxidase were spotted on
strips with 2 μg mL�1 Ab-HRP in PBS and dried. The 50 mMluminol, 0.5 mM p-coumaric acid, and 30 mM choline chloride inpH 9.2 carbonate buffer were dried on a substrate pad. The teststrip was prepared in the same way as described above in section (a).The concentration of 100 unit mL�1 choline oxidase showed thehighest signal/background ratio (Figure S2D).
2.7. Optimization of PVP and surfactant 10G (S-10G) concentrations
2.7.1. PVP screeningThe 2 μL solutions containing 10 μg mL�1 Ab-HRP and 1% (w/v)
PVPs of various molecular weights (10 K, 29 K, 40 K, 55 K, and360 K) in PBS were spotted on the NC membrane of the strip anddried at 37 1C in a dry oven for 15 min. After drying, 100 μL CRP-free serum was loaded on the sample pad. After 10 min, thesample pad and absorbent pad were removed, and 30 μL luminolsolution (1 mM luminol, 0.5 mM p-coumaric acid, and 1 mMhydrogen peroxide in 0.1 M carbonate buffer (pH 9.2)) was loadedon the NC membrane of the strip. The chemiluminescence signalintensity ratio between the Ab-HRP spotting area (S) and thebackground (B) were compared; 55 K PVP showed the lowest S/B(Figure S4A).
2.7.2. Surfactant 10GThe 2 μL solutions containing of 10 μg mL�1 Ab-HRP with 1%
PVP (55 K) and various volumes (%) of S-10G were spotted on theNC membrane of the strip. All experimental steps were carried outin the same manner as described above for PVP screening. The 2% S-10G showed the lowest S/B ratio at the spotting zone (Figure S4b).
2.7.3. PVPThe 2 μL 10 μg mL�1 Ab-HRP solutions, containing 2% (v/v) S-10G
and various weights (%) of PVP (55 K) and the 1 μL 1 mgmL�1
capture antibody in PBS, were spotted on different zones of the NCmembrane of strips. After drying, the 100 μL CRP-free serum,containing no or 10 ng mL�1 CRP, was loaded on the sample pad.After 10 min, the sample and absorbent pads were removed, and thechemiluminescence signal was measured. To determine the optimalPVP concentration, we compared the chemiluminescence signalintensity obtained with 0 (I0) and 10 (I) ng mL�1 CRP (Figure S4C).
2.8. Analysis of CRP and selectivity evaluation
The sample solutions containing various CRP concentrations orother serum proteins were prepared in a CRP-free human serumsolution. In selectivity evaluation, the concentration of CRP, myoglo-bin, CK-MB, troponin I and proBNP were adjusted to 100 ng mL�1.In case of albumin and thrombin, the concentration was adjusted to1 mgmL�1. The 100 μL sample solutions prepared were incubatedon the LFI strip sensor. The signal was measured using the Chemi-Doc system (Bio-Rad), and analyses were conducted using the ImageLab 4.0 software.
3. Results and discussions
3.1. Basic concept of LFI strip-based EIA system
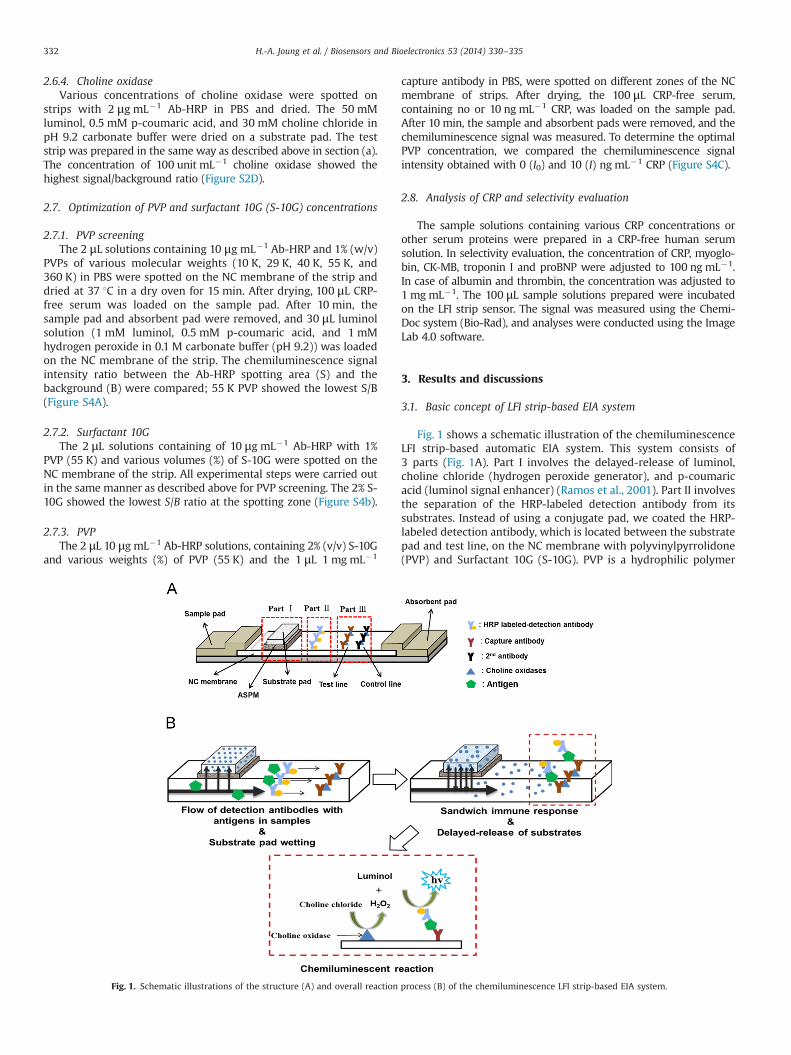
Fig. 1 shows a schematic illustration of the chemiluminescenceLFI strip-based automatic EIA system. This system consists of3 parts (Fig. 1A). Part I involves the delayed-release of luminol,choline chloride (hydrogen peroxide generator), and p-coumaricacid (luminol signal enhancer) (Ramos et al., 2001). Part II involvesthe separation of the HRP-labeled detection antibody from itssubstrates. Instead of using a conjugate pad, we coated the HRP-labeled detection antibody, which is located between the substratepad and test line, on the NC membrane with polyvinylpyrrolidone(PVP) and Surfactant 10G (S-10G). PVP is a hydrophilic polymer
Fig. 1. Schematic illustrations of the structure (A) and overall reaction process (B) of the chemiluminescence LFI strip-based EIA system.
H.-A. Joung et al. / Biosensors and Bioelectronics 53 (2014) 330–335332

and is known to inhibit protein adsorption activity (Matsuda et al.,2008). Therefore, the detection antibody was not adsorbed on theNC membrane, and the nonspecific signal was minimized by theS-10G (Figure S3 and S4). When the samples flowed into the NCmembrane, the detection antibodies flowed to the test and controllines along with the target antigens. As a result of the immunereaction, antigen and detection antibody complexes bound withcapture antibodies and also un-reacted detection antibodies werewashed out within 5 min. Therefore, we were able to perform thechemiluminescence reaction automatically after immune reactionswere complete. Part III involves automatic generation of hydrogenperoxide during the immune reaction. In this part of the system,hydrogen peroxides were generated by the enzyme reaction ofimmobilized choline oxidase (ChOx) on the capture and controllines. ChOx is suitable for use in a chemiluminescence system as ahydrogen peroxide generator because the maximum activity pH ofthe choline chloride oxidation reaction is similar to that of thechemiluminescence reaction (approximately pH 8.5).
As a result of the oxidation of choline chloride, hydrogenperoxides were generated on the test and control lines. Therefore,the chemiluminescence reaction occurred proportionally to theantigen concentrations. The overall reaction steps are described indetail in Fig. 1B.
3.2. A delayed-release effect of chemiluminescence substrates
In our previous study, we discovered interesting fluid flowcharacteristics of the asymmetric polysulfone membrane (ASPM),which is the plasma separation membrane whose pore sizes dependon hydrophilic properties (Oh et al., 2013). Horizontal flow at thesmall pore side was found to be stronger than that at the large poreside. In contrast, vertical flow was stronger at the large pore side dueto the capillary action. Therefore, the samples could not flow laterallyat the large pore side of the ASPM. In part I of Fig. 1A, the ASPM and
substrate pad were stacked at the center of the NC membrane, andthen the small pore side of the ASPM made contact with the NCmembrane. We predicted that if the aqueous samples flowed to theNCmembrane, a proportion of the samples would be absorbed to thesubstrate pad through the ASPM, and after a certain period of time,the substrates would be released to the NC membrane. To confirmthis delayed-release effect, we performed two experiments: theabsorption of a color material in the substrate pad and the releaseof substrates from the substrate pad. Fig. 2 shows the time-dependent sample absorption and substrates release. Fig. 2A and Cshows the color changes in the substrate pad due to the absorption ofloaded samples. After injection of 100 μL color dye (0.1 mg mL�1
sulforhodamine 6G in phosphate-buffered saline (PBS) with 1%S-10G), we measured color changes in the substrate pad for threecases: (i) the ASPM was inserted between the NC membrane and thesubstrate pad with the small-pore side in contact with the NCmembrane, (ii) the NC membrane was inserted, or (iii) no membranewas inserted. The results showed that the color of the substrate padwas saturated after approximately 4 min for ASPM, 3 min for NC, and2 min for no membrane, which indicated that the sample absorptionwas delayed on using the ASPM. Fig. 2B and D show the chemilu-minescence signals by release of substrates from the substrate pad.The HRP labeled-antibody (1 μg mL�1) and choline oxidase (ChOx;100 U/mL) were immobilized in the NC membrane between theabsorbent pad (see Figs. S1 and S2) and the substrate pad, whichencapsulated the luminol (50 mM), choline chloride (30 mM), andp-coumaric acid (0.5 mM). After 100 μL PBS buffer was loaded on thesample pad, the chemiluminescence signal was monitored. As shownin Fig. 2D, in the no membrane case, the chemiluminescence signalwas observed after approximately 2 min, sharply increased until7 min, and then rapidly decreased. In the NC test, the signal wasobserved after 2–3 min, increased up to 15 min, and then decreased.In the ASPM test, the signal appeared after approximately 5 min,gradually increased till 10 min, and was maintained until the end of
Fig. 2. Experimental schemes and images for time-dependent absorption (A) and release (B) effects using various membrane types, including no membrane, ASPM, and NC.(C) Color intensities of the substrate pad over the absorption of samples. (D) Chemiluminescence intensities of the test line over the release of the substrates from thesubstrate pad.
H.-A. Joung et al. / Biosensors and Bioelectronics 53 (2014) 330–335 333

measurement (up to 25 min) with the lowest standard deviations.This indicated that the ASPM inserted between the NC membraneand the substrate pad functioned to delay the release of substratesfrom the substrate pad. The times required to produce the initialchemiluminescence signal were calculated as 0.7970.07 min for theno membrane case and 2.0170.47 min for the NC membrane case.In these cases, the release of substrates started before completewetting of the solution in the substrate pad. This suggested that these2 cases could not completely separate the absorption and release. Incontrast, the ASPM could release substrates after the end of theabsorption. Therefore, if the HRP-labeled detection antibodies flowedto the absorbent pad within 5 min, the substrates were not mixedwith HRP as a result of immune reaction, with the exception of thetest or control line-bound antibodies. Thus, the specific chemilumi-nescence signal was generated on the test or control line. Forcomparison, the asymmetric membrane was placed in the oppositedirection; because the capillary force was acting in the oppositedirection, the signal intensity significantly decreased (data not shown).
3.3. Automatic pH change during the measurement
As mentioned above, the reaction pH must be changed duringthe sample flow when using an automatic chemiluminescence LFIsystem. All substrates were mixed with 0.1 M carbonate buffer(pH 9.2) so that the buffer components were released with thesubstrates. Therefore, when substrates are released, the pH of theNC membrane should be changed from neutral to alkaline.To confirm the pH change, we treated the NC membrane with0.05% α-naphtholbenzein (containing 1% S10G and 50% ethanol),which is a pH indicator that changes the color from yellow to bluebetween pH 8.2 and 10.0. After drying the NC membrane, the PBSbuffer was loaded on the sample pad, and time-dependent pHchanges were observed on the NC membrane. As shown in Fig. 3,we clearly observed a pH change from neutral to alkaline on theNC membrane after 5 min, which showed a similar shape as that ofthe release test. Based on this result, we confirmed that thereaction pH changed automatically to an alkaline pH during thesample flow with the release of the substrates.
3.4. Measurement of hs-CRP in human serum
For the performance evaluation, we measured the content ofthe high sensitivity C-reactive protein (hs-CRP) in human serum.The hs-CRP is now recognized as a major cardiovascular risk factorand as a secondary target for statin therapy (Ridker, 2010). For thisreason, several large-scale prospective studies have demonstratedthat hs-CRP is a strong independent predictor of future myocardialinfarctions and strokes in apparently healthy people (Guijarro,2001). Fig. 4 shows the results of the hs-CRP measurement.
The chemiluminescence signal was measured over 10–12 minafter sample injections with various hs-CRP concentrations inhuman serum. We obtained similar detection sensitivity (limit ofdetection, LOD, 1.05 ng mL�1) and a wider dynamic range (detec-tion range: 1–10,000 ng mL�1) compared to the results of ourprevious hs-CRP measurements using a conventional LFI system(detection range 10–1000 ng mL�1) (Oh et al., 2013). In addition,we performed the selectivity evaluation with other serum pro-teins. As a result, the undesirable signals were not observed intested proteins except in the CRP spiked sample (Fig. S5).
4. Conclusions
In conclusion, we developed a novel delayed substrate releasetechnique by using the fluid characteristics of the ASPM in an LFIstrip, and used the chemiluminescence LFI strip-based automaticEIA system without using an additional fluidic system or complexproduction process. The use of the delayed release techniqueenabled automatic implementation of multiple EIA steps such aspH change, delayed release of secondary reagents, and separationof immune and chemiluminescence reactions. To demonstrate theapplication of the developed method for biological/complex sam-ple measurement, we used the chemiluminescence-based EIAsystem for CRP measurement. We showed that the developedmethod provides quantitative measurement with a wide measur-ing range without using a light source. In addition, compared tothe conventional LFI strip sensor method, the developed systemcan provide several advantages such as the use of a single-stepmeasurement, cost-effectiveness, and the ease of mass production.Until now, complex microfluidic devices or multi-step injectionmethods have been used for the implementation of EIA in LFI stripbiosensors. However, compared to the LFI strip sensor, the othermethods require the use of complex mass production systems andhave relative higher costs and multiple measurement steps. To thebest of our knowledge, no research has been reported on auto-matic strip sensing methods for multi-reactions without anyfluidic control system. Furthermore, we think that this methodovercomes the limitations of the conventional LFI strip biosensor.Finally, this system expands the scope of EIA, which we believe tobe the most significant achievement of the present study.
Fig. 3. Plot and image (inset) of time-dependent color-intensity changes in theα-naphtholbenzein (pH indicator, pH 8.2–10.0)-treated NC membrane.
Fig. 4. Image (A) and plot (B) of change in chemiluminescence signals dependingon the concentration of hs-CRP.
H.-A. Joung et al. / Biosensors and Bioelectronics 53 (2014) 330–335334

Acknowledgements
This work was financially supported by the R&D Joint VentureProgram, NLRL Program (2011-0028915) and Public welfare &Safety Research Program (2010-0020776) through the NationalResearch Foundation of Korea (NRF) funded by the Korean govern-ment (MEST).
Appendix A. Supporting information
Supplementary data associated with this article can be found inthe online version at http://dx.doi.org/10.1016/j.bios.2013.10.004.
References
Cho, I.H., Paek, E.H., Kim, Y.K., Kim, J.H., Paek, S.H., 2009. Anal. Chim. Acta 632 (2),247–255.
Cho, J.-H., Han, S.-M., Paek, E.-H., Cho, I.-H., Paek, S.-H., 2006. Anal. Chem. 78 (3),793–800.
Choi, S., Choi, E.Y., Kim, H.S., Oh, S.W., 2004. Clin. Chem. 50 (6), 1052–1055.Dotsikas, Y., Loukas, Y.L., 2007. Talanta 71 (2), 906–910.Guijarro, C., 2001. Circulation 104 (22), E127.Heeschen, C., Goldmann, B.U., Langenbrink, L., Matschuck, G., Hamm, C.W., 1999.
Clin. Chem. 45 (10), 1789–1796.Hervás, M., López, M.A., Escarpa, A., 2012. TrAC Trends Anal. Chem. 31 (0), 109–128.
Kim, H.-S., Ko, H., Kang, M.-J., Pyun, J.-C., 2010. BioChip J. 4 (2), 155–160.Laurent, P., Marchand, B., Bienvenu, J., Marichy, J., 1985. Clin. Biochem. 18 (5),
272–275.Leng, S.X., McElhaney, J.E., Walston, J.D., Xie, D., Fedarko, N.S., Kuchel, G.A., 2008.
Ser. A Biol. Sci. Med. Sci. 63 (8), 879–884.Lequin, R.M., 2005. Clin. Chem. 51 (12), 2415–2418.Li, Z., Wang, Y., Wang, J., Tang, Z., Pounds, J.G., Lin, Y., 2010. Anal. Chem. 82 (16),
7008–7014.Matsuda, M., Yamamoto, K.-I., Yakushiji, T., Fukuda, M., Miyasaka, T., Sakai, K., 2008.
J. Membr. Sci. 310 (1–2), 219–228.Mirasoli, M., Buragina, A., Dolci, L.S., Simoni, P., Anfossi, L., Giraudi, G., Roda, A.,
2012. Biosens. Bioelectron. 32 (1), 283–287.Ngom, B., Guo, Y., Wang, X., Bi, D., 2010. Anal. Bioanal. Chem. 397 (3), 1113–1135.Oh, Y.K., Joung, H.A., Kim, S., Kim, M.G., 2013. Lab Chip 13 (5), 768–772.Posthuma-Trumpie, G.A., Korf, J., van Amerongen, A., 2009. Anal. Bioanal. Chem.
393 (2), 569–582.Ramos, M.C., Torijas, M.C., Dıaz, A.N., 2001. Sens. Actuators B: Chem. 73 (1), 71–75.Ridker, P.M., 2010. Tex. Heart Inst. J./Tex. Heart Inst. St. Luke's Episcop.l Hosp. Tex.
Child. Hosp. 37 (1), 40–41.Wisdom, G.B., 1976. Clin. Chem. 22 (8), 1243–1255.Wongsrichanalai, C., Barcus, M.J., Muth, S., Sutamihardja, A., Wernsdorfer, W.H.,
2007. Am. J. Trop. Med. Hyg. 77 (6 Suppl), 119–127.Xia, X., Xu, Y., Zhao, X., Li, Q., 2009. Clin. Chem. 55 (1), 179–182.Yager, P., Edwards, T., Fu, E., Helton, K., Nelson, K., Tam, M.R., Weigl, B.H., 2006.
Nature 442 (7101), 412–418.Yakovleva, J., Davidsson, R., Lobanova, A., Bengtsson, M., Eremin, S., Laurell, T.,
Emneus, J., 2002. Anal. Chem. 74 (13), 2994–3004.Zang, D., Ge, L., Yan, M., Song, X., Yu, J., 2012. Chem. Commun. 48 (39), 4683–4685.Zuk, R.F., Ginsberg, V.K., Houts, T., Rabbie, J., Merrick, H., Ullman, E.F., Fischer, M.M.,
Sizto, C.C., Stiso, S.N., Litman, D.J., 1985. Clin. Chem. 31 (7), 1144–1150.
H.-A. Joung et al. / Biosensors and Bioelectronics 53 (2014) 330–335 335