an approach to measuring brand loyalty … · an approach to measuring brand loyalty in ... repeat...
TRANSCRIPT
Uludağ Üniversitesi İktisadi ve İdari Bilimler Fakültesi Dergisi Uludağ Journal of Economy and Society Cilt/Vol. XXX, Sayı/No. 2, 2011, pp. 137-154
AN APPROACH TO MEASURING BRAND LOYALTY IN THE TURKISH AUTOMOTIVE SECTOR
Mine ŞENEL*
Abstract
In the study conducted on the basis of an empirical research in the Turkish
automotive sector, it was aimed, using fuzzy logic theory and a structural equation modeling, to establish the casual relationship between three latent variables -which have an impact on purchase considerations and create the service supplier power- and customer satisfaction, and to reveal the effects of customer satisfaction and brand reputation on customer loyalty. The data obtained were defuzzified by fuzzy logic theory and were processed by reliability, exploratory and confirmatory factor analyses. The degree of influence of factors considered to have an impact on the subject in the developed brand loyalty modeling were determined using structural equation modeling application. In the results, it was found that customer satisfaction is a prerequisite of brand loyalty. It is seen that the price perception of consumers and their value perceptions regarding attributes of the vehicles have an impact on customer satisfaction.
Key Words: Brand Loyalty, Customer Satisfaction, Brand Reputation, Structural Equation Modeling, Fuzzy Logic.
Türkiye Otomotiv Sektöründe Marka Sadakatini
Ölçmeye Yönelik Bir Yaklaşım
Özet Türkiye otomotiv sektöründe empirik bir araştırmaya dayanan bu
çalışmada, bulanık mantık teorisi ve yapısal eşitlik modeli kullanılarak satın alma düşüncesini etkileyen ve hizmet sağlayıcısının gücünü oluşturan üç gizil yapının arasındaki nedensel ilişkileri oluşturmak ve müşteri tatmini ile marka ününün
* Öğr.Gör. Anadolu Üniversitesi, Endüktri Mühendisliği Bölümü.
U.Ü. İktisadi ve İdari Bilimler Fakültesi Dergisi Cilt XXX, Sayı 2 Uludağ Journal of Economy and Society
138
müşteri sadakatine olan etkisini ortaya çıkarmak amaçlanmıştır. Elde edilen veriler bulanık mantık teorisine göre durulaştırılmıştır ve güvenilirlik, açıklayımcı ve doğrulayıcı faktör analizine tabi tutulmuştur. Geliştirilen marka sadakati modelinde konuyu etkilediği düşünülen faktörlerin etki dereceleri yapısal eşitlik modeli kullanılarak belirlenmiştir. Sonuçlarda müşteri tatminin marka sadakatinin bir önkoşulu olduğu bulunmuştur. Ayrıca müşterinin fiyat algısının ve aracın müşteriye kattığı değer algısının müşteri tatminin etkilediği bulunmuştur.
Anahtar Kelimeler: Marka Sadakati, Müşteri Tatmini, Marka Ünü, Yapısal Eşitlik Modeli, Bulanık Mantık.
1. INTRODUCTION Automobile companies, which perform in a very competitive,
complex and dynamic environment of the automotive sector and have little differences in their products and services in contrast to increasing customer demands, is beginning to change considerably. Traditionally product-oriented automotive firms have become to be increasingly customer-oriented in parallel with the basic principles of relational marketing whose main objective is to focus on customer loyalty. The way to provide customer satisfaction and loyalty requires the regular measurement of customer expectations and development of products and services in the direction of their expectations.
An enterprise having satisfied customers is able to compete with its rivals easier. This is because it is easier to retain a customer whose expectations from a product or a service have been previously satisfied than gaining new customers. The cost of retaining a new customer is higher than the cost of keeping an existing customer (Lin & Wang, 2005:272). Even a little increase in the percentage of loyal customer would lead to a high profitability for the firm (Heskett, Sasser & Schlesinger,1997).
This study aims to test impacts of factors of price efficiency, technical specifications of a product and post-sales services, and value perception a product would contributed to a customer -which would create the service supplier power- on customer satisfaction, and their result-oriented relations with brand loyalty and the effects of brand reputation on brand loyalty using a common structural model.
2. CONCEPTUAL FRAMEWORK While customer satisfaction refers to an intended behavior regarding
a product or service, this intended behavior includes future repurchases or possibility to switch the service/product supplier (Selnes, 1993).
Şenel, An Approach to Measurıng Brand Loyalty
139
According to Oliver(1999;35), loyalty, despite changing purchase behaviors by the market efforts and contextual exposures, is described as the repeat purchase behavior or constant preference of a product/service in the future. Marketing literature states that customer loyalty can be determined by two different ways. These are behavioral and attitudinal approaches. (Jacoby and Kyner, 1973; Julander, Magi, Jonsson, & Lindqvist,1997)
According to behavioral approach, brand loyalty is described as displaying a repeat purchase behavior by a customer (Cunningham, 1961; Bowen & Shoemaker,1998). According to attitudinal approach brand loyalty refers to loyal customers’ intentions of repurchase and recommendation with good signs (Getty & Thompson,1994). Attitudes are defined as evaluative judgments based on culture and beliefs (Bennett, Hartel & McColl-Kennedy, 2005;98). Attitudinal loyalty is a concept related to the degree of engagement (Lin & Wang, 2006:272). In attitudinal measurement, even though the customer does not purchase from the company, s/he might continue to be loyal customer to it (Bowen & Chen, 2001).
In the work, loyal customer was accepted as a customer who repurchases from the same service supplier, recommends to others, and keeps his/her positive attitudes towards the service supplier.
In recent years, there is an increasing interest towards researching factors that affect brand loyalty. In the past, various researches were conducted to analyze the correlations between brand loyalty and customer satisfaction which is the most significant prerequisite of it (Bearden & Teel,1983; LaBarbera & Mazursky,1983; Kasper,1988; Bloemer & Lemmink,1992; Cronin & Taylor,1992; Fornell, 1992; Oliva, Oliver & Macmillan, 1992, Anderson &Sullivan,1993; Bloener & Kasper,1993,1995; Boulding, Kalra, Staelin, & Zeithaml, 1993; Berne, 1997; Oliver, 1999). Researchers have not identified yet a theoretical framework composed of factors leading to the development of brand loyalty (Gremler & Brown, 1997). However, there is a consensus among researchers and academicians on that customer satisfaction and perceived service quality are prerequisites of brand loyalty (Cronin & Taylor, 1992; Gremler & Brown, 1997). There are technical, economic and psychological factors leading customers to switch their suppliers. These factors are antecedents of brand loyalty. Besides, positive brand reputation has also an impact on the creation of the loyalty. (Gremler & Brown, 1997;174; Selnes,1993;21).
Perceived satisfaction with a brand is one of the most important determinants of brand loyalty (Bloemer & Kasper, 1995; Giese & Cote, 2000). Various works demonstrate that rising customer satisfaction would also lead an increase in brand loyalty (Bennett et al, 2005; Jones & Suh,2000). On the other hand, Jones and Sasser (1995) state that customer
U.Ü. İktisadi ve İdari Bilimler Fakültesi Dergisi Cilt XXX, Sayı 2 Uludağ Journal of Economy and Society
140
satisfaction could not be an antecedent of brand loyalty. Therefore, studies focusing on the correlations between customer satisfaction and brand loyalty can contribute to the existing literature.
There are positive correlations between customer satisfaction and customer loyalty. The level of customer expectations represents degree of customer satisfaction whereas the degree to which customer would return to an enterprise and continue to come demonstrates the loyalty of customer to the enterprise. Every loyal customer is a satisfied one, but each satisfied customer is not a loyal customer (Bowen & Shoemaker ,1998).
Service supplier power, which is a prerequisite of customer satisfaction, provides the capability to solve problems of production market or to satisfy customer demands. Capability is defined as abilities and properties which make an organization successful (Butler,1991). The supplier power can be directly experienced by a customer. Without considering how to be done, a customer’s trust should be retained before supplier reliability. Various studies note that in a purchasing transaction, the perception of supplier power affects customer satisfaction (Erevelles & Leavitt, 1992). Therefore, marketing researches have revealed that total satisfaction of a customer is a result of the capabilities and other transactions (Szymanski & Henard, 2001). At the same time, research literature supports the view of possibility that unsatisfied but successfully indemnified customers experience the satisfaction improved by the transactions.
Generally regarding the correlation between service supplier capacity and satisfaction, there has not been a consensus in terms of either transaction-specificity or general level of analyses (Taylor & Baker,1994). Some analyses have demonstrated the capacity or power of supplier as relatively static variable shaping a customer’s perception of transactions over time and this influences whether customer experiences are satisfied with specific transactions or not (Athiyaman, 1997). Other researches consider service supplier’s power (product quality, price, technical specifications of the product, awareness of the needs, its value to be attributed, post-sales services) to be a prerequisite of satisfaction rather than the result of it (Fornell, Johnson, Anderson, Cha,J. & Bryant, 1996). However, some studies analyzing the casual order between the customers’ perception of the service supplier’s power and customer satisfaction state that it is hard to reveal which one is an antecedent of the other empirically (Taylor & Cronin, 1994). This study suggests the view that factors creating the service supplier power in the Turkish automotive sector are direct positive prerequisites of customer satisfaction.
Brand reputation has a significant effect on customer satisfaction as well as on brand loyalty (Nguyen & Leblanc, 2001). Reputation, which
Şenel, An Approach to Measurıng Brand Loyalty
141
could be either negative or positive regarding a brand, is a significant variable in marketing activities of organizations. One of the strongest sources retaining customers to repurchase is positive speculations regarding that brand. When customers of a business recommend the products they are using to others, this creates considerable loyalty (Selnes, 1993; 21)
Many authors argue that a good brand reputation increases sales and market share of an enterprise (Shapiro, 1983) and good relationship with customers are sustained (Andreassen & Lindetad, 1998; Robertson, 1993; Yoon, Guffey & Kijewski, 1993)
3. METHODS AND PROCEDURES
3.1. Research Model and Hypotheses
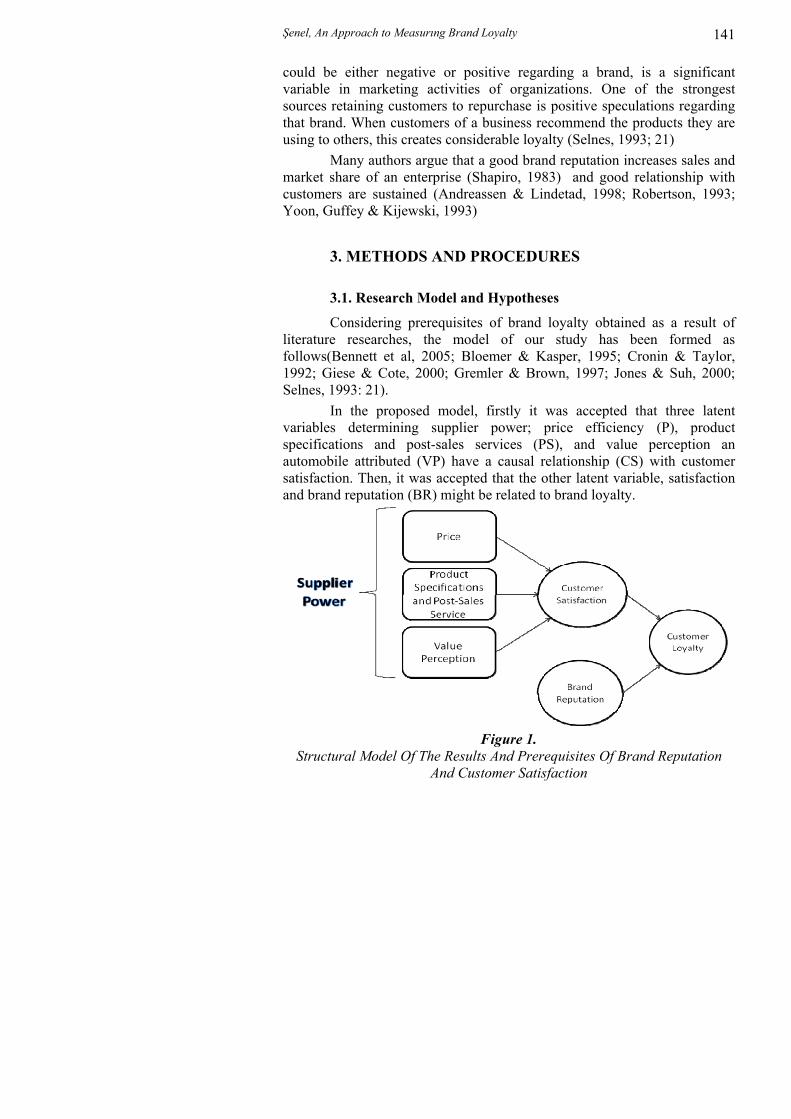
Considering prerequisites of brand loyalty obtained as a result of literature researches, the model of our study has been formed as follows(Bennett et al, 2005; Bloemer & Kasper, 1995; Cronin & Taylor, 1992; Giese & Cote, 2000; Gremler & Brown, 1997; Jones & Suh, 2000; Selnes, 1993: 21).
In the proposed model, firstly it was accepted that three latent variables determining supplier power; price efficiency (P), product specifications and post-sales services (PS), and value perception an automobile attributed (VP) have a causal relationship (CS) with customer satisfaction. Then, it was accepted that the other latent variable, satisfaction and brand reputation (BR) might be related to brand loyalty.
Figure 1.
Structural Model Of The Results And Prerequisites Of Brand Reputation And Customer Satisfaction
U.Ü. İktisadi ve İdari Bilimler Fakültesi Dergisi Cilt XXX, Sayı 2 Uludağ Journal of Economy and Society
142
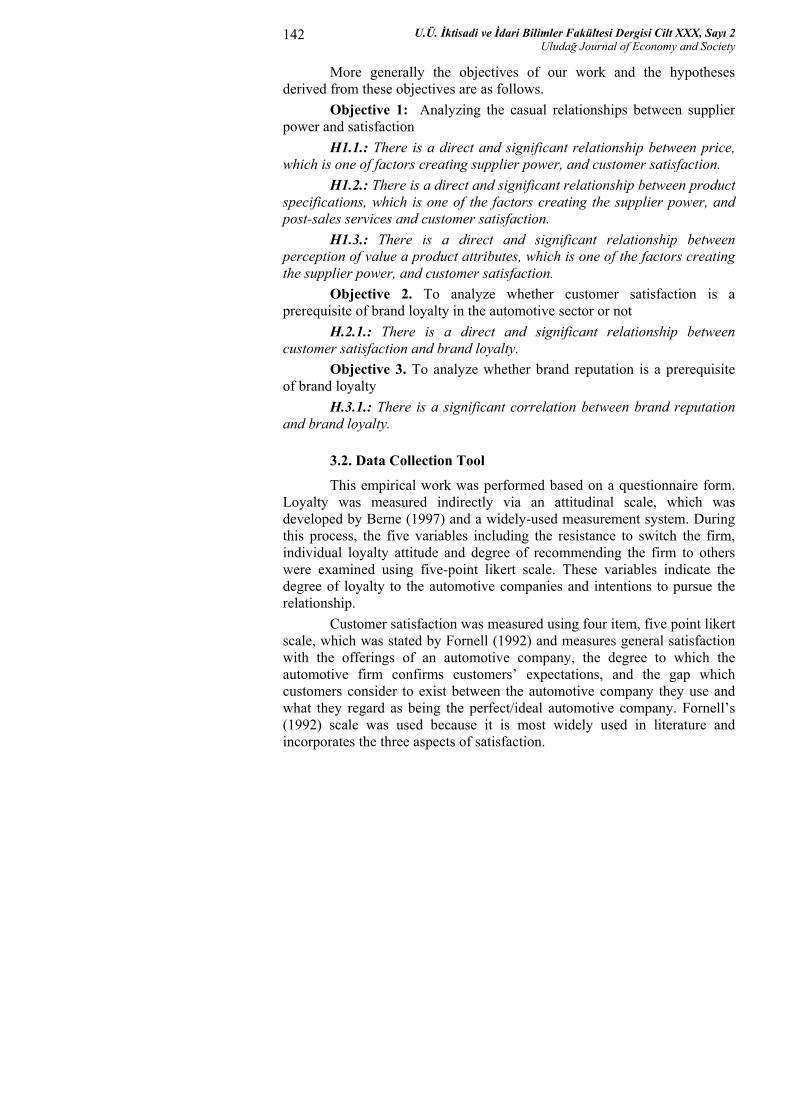
More generally the objectives of our work and the hypotheses derived from these objectives are as follows.
Objective 1: Analyzing the casual relationships between supplier power and satisfaction
H1.1.: There is a direct and significant relationship between price, which is one of factors creating supplier power, and customer satisfaction.
H1.2.: There is a direct and significant relationship between product specifications, which is one of the factors creating the supplier power, and post-sales services and customer satisfaction.
H1.3.: There is a direct and significant relationship between perception of value a product attributes, which is one of the factors creating the supplier power, and customer satisfaction.
Objective 2. To analyze whether customer satisfaction is a prerequisite of brand loyalty in the automotive sector or not
H.2.1.: There is a direct and significant relationship between customer satisfaction and brand loyalty.
Objective 3. To analyze whether brand reputation is a prerequisite of brand loyalty
H.3.1.: There is a significant correlation between brand reputation and brand loyalty.
3.2. Data Collection Tool
This empirical work was performed based on a questionnaire form. Loyalty was measured indirectly via an attitudinal scale, which was developed by Berne (1997) and a widely-used measurement system. During this process, the five variables including the resistance to switch the firm, individual loyalty attitude and degree of recommending the firm to others were examined using five-point likert scale. These variables indicate the degree of loyalty to the automotive companies and intentions to pursue the relationship.
Customer satisfaction was measured using four item, five point likert scale, which was stated by Fornell (1992) and measures general satisfaction with the offerings of an automotive company, the degree to which the automotive firm confirms customers’ expectations, and the gap which customers consider to exist between the automotive company they use and what they regard as being the perfect/ideal automotive company. Fornell’s (1992) scale was used because it is most widely used in literature and incorporates the three aspects of satisfaction.
Şenel, An Approach to Measurıng Brand Loyalty
143
While developing survey questions including the examination of brand reputation, price efficiency, product specifications, and post-purchase services, and added value perception (psychological factors), adaptations were made on (Han & Sung, 2008; Russell & Bennett, 2007; Hu, Jou & Liu, 2009; Selnes, 1993; Verhoef & Longerak, 2007) the bases of the works. A pilot survey with a 40-people size was conducted for the reliability tests of the hypotheses in the field before performing questionnaires, which were formed at the end of reviews done. The finding of this reliability test was detected 0.887. Then survey forms considered to be reliable was done.
Works have been carried out to determine required number of sample group to represent the universe.
To determine the sample size, in 2
2 ..d
qpzn = equation,
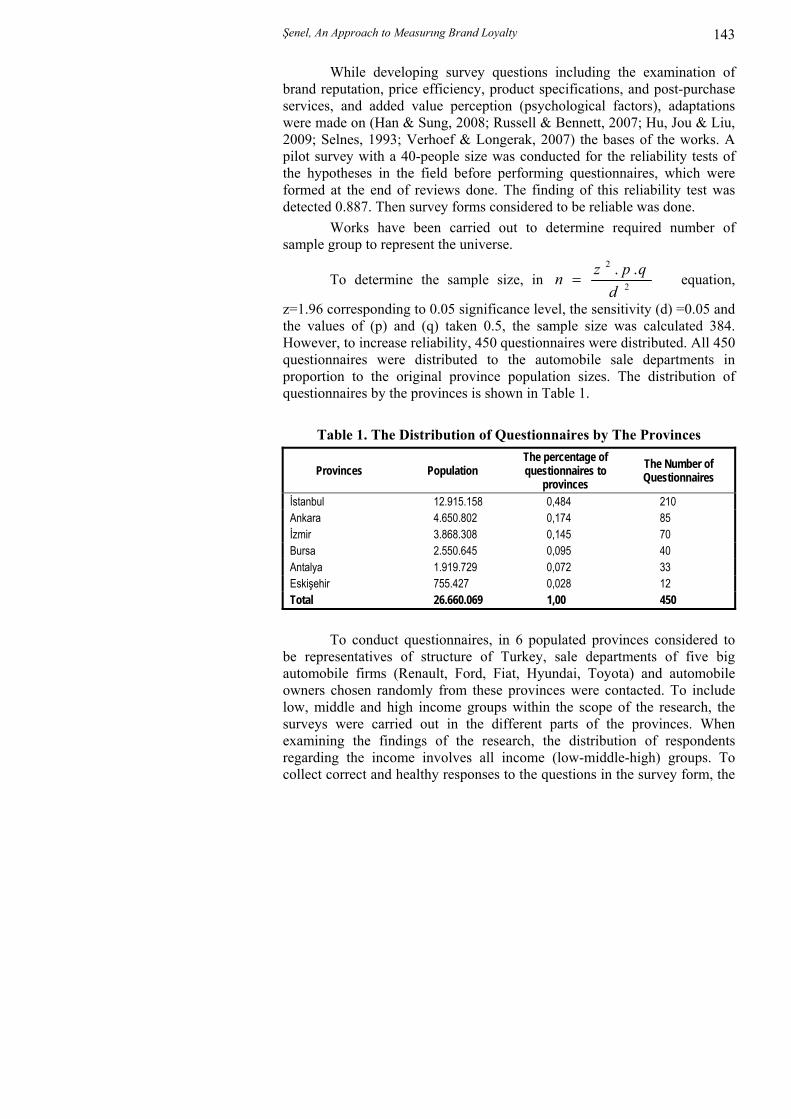
z=1.96 corresponding to 0.05 significance level, the sensitivity (d) =0.05 and the values of (p) and (q) taken 0.5, the sample size was calculated 384. However, to increase reliability, 450 questionnaires were distributed. All 450 questionnaires were distributed to the automobile sale departments in proportion to the original province population sizes. The distribution of questionnaires by the provinces is shown in Table 1.
Table 1. The Distribution of Questionnaires by The Provinces
Provinces Population The percentage of questionnaires to
provinces The Number of Questionnaires
İstanbul 12.915.158 0,484 210 Ankara 4.650.802 0,174 85 İzmir 3.868.308 0,145 70 Bursa 2.550.645 0,095 40 Antalya 1.919.729 0,072 33 Eskişehir 755.427 0,028 12 Total 26.660.069 1,00 450
To conduct questionnaires, in 6 populated provinces considered to
be representatives of structure of Turkey, sale departments of five big automobile firms (Renault, Ford, Fiat, Hyundai, Toyota) and automobile owners chosen randomly from these provinces were contacted. To include low, middle and high income groups within the scope of the research, the surveys were carried out in the different parts of the provinces. When examining the findings of the research, the distribution of respondents regarding the income involves all income (low-middle-high) groups. To collect correct and healthy responses to the questions in the survey form, the
U.Ü. İktisadi ve İdari Bilimler Fakültesi Dergisi Cilt XXX, Sayı 2 Uludağ Journal of Economy and Society
144
consumers were carefully selected among who are above certain age (18 at least), have ever owned a vehicle, are vehicle owners, have knowledge about the vehicle and enable to decide purchasing on their own.
3.3. Participants
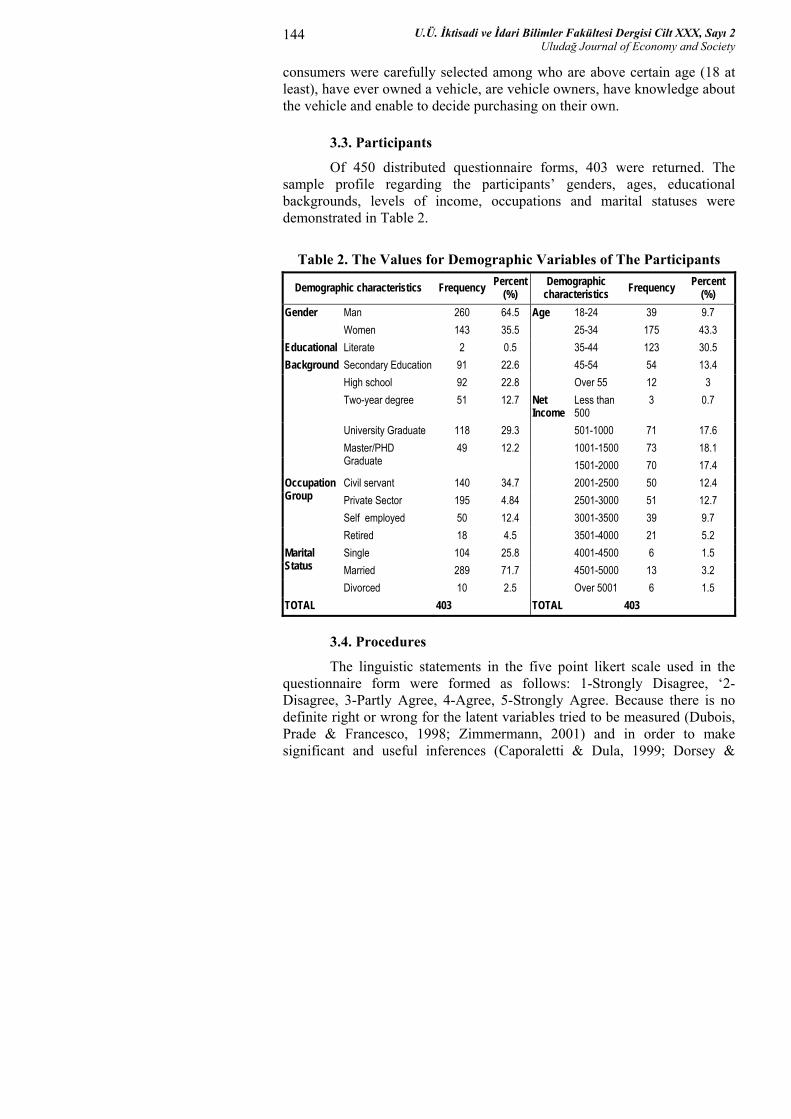
Of 450 distributed questionnaire forms, 403 were returned. The sample profile regarding the participants’ genders, ages, educational backgrounds, levels of income, occupations and marital statuses were demonstrated in Table 2.
Table 2. The Values for Demographic Variables of The Participants
Demographic characteristics Frequency Percent (%)
Demographic characteristics Frequency Percent
(%) Man 260 64.5 18-24 39 9.7 Gender Women 143 35.5 25-34 175 43.3 Literate 2 0.5 35-44 123 30.5 Secondary Education 91 22.6 45-54 54 13.4 High school 92 22.8
Age
Over 55 12 3 Two-year degree 51 12.7 Less than
500 3 0.7
University Graduate 118 29.3 501-1000 71 17.6 1001-1500 73 18.1
Educational Background
Master/PHD Graduate
49 12.2 1501-2000 70 17.4
Civil servant 140 34.7 2001-2500 50 12.4 Private Sector 195 4.84 2501-3000 51 12.7 Self employed 50 12.4 3001-3500 39 9.7
Occupation Group
Retired 18 4.5 3501-4000 21 5.2 Single 104 25.8 4001-4500 6 1.5 Married 289 71.7 4501-5000 13 3.2
Marital Status
Divorced 10 2.5
Net Income
Over 5001 6 1.5 TOTAL 403 TOTAL 403
3.4. Procedures
The linguistic statements in the five point likert scale used in the questionnaire form were formed as follows: 1-Strongly Disagree, ‘2-Disagree, 3-Partly Agree, 4-Agree, 5-Strongly Agree. Because there is no definite right or wrong for the latent variables tried to be measured (Dubois, Prade & Francesco, 1998; Zimmermann, 2001) and in order to make significant and useful inferences (Caporaletti & Dula, 1999; Dorsey &
Şenel, An Approach to Measurıng Brand Loyalty
145
Coovert, 2003), the statements given by the participants were defuzzified with the fuzzy logic theory.
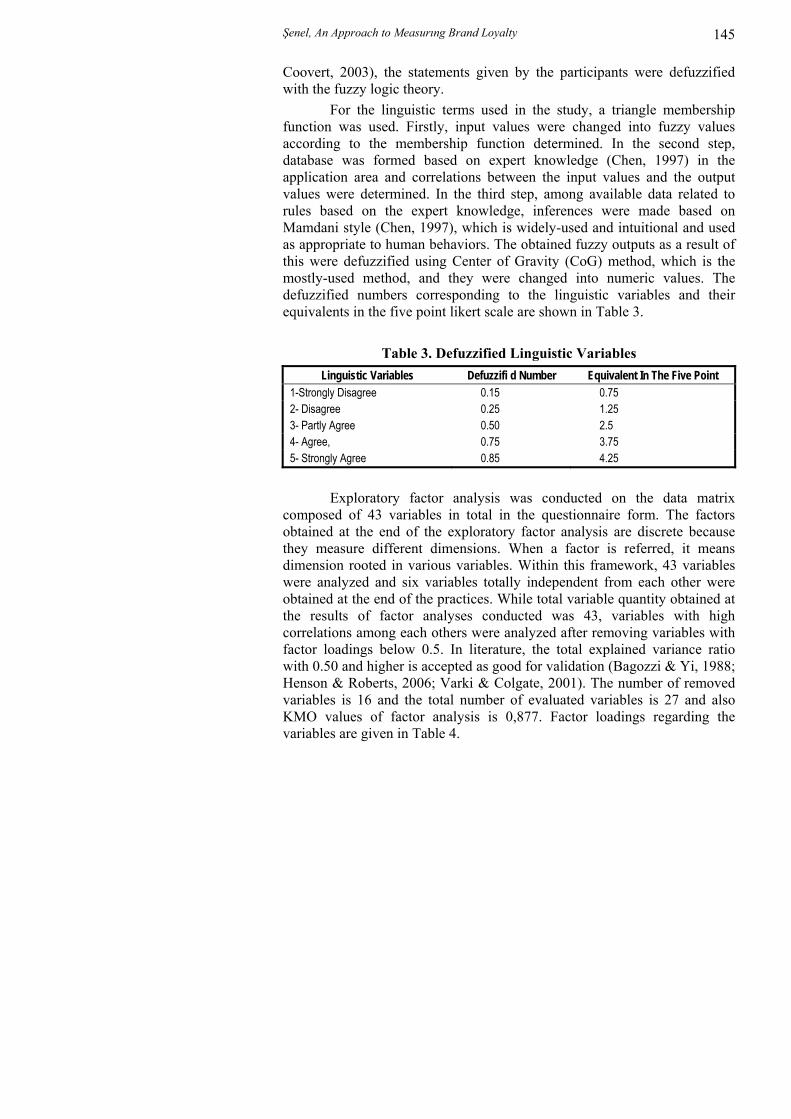
For the linguistic terms used in the study, a triangle membership function was used. Firstly, input values were changed into fuzzy values according to the membership function determined. In the second step, database was formed based on expert knowledge (Chen, 1997) in the application area and correlations between the input values and the output values were determined. In the third step, among available data related to rules based on the expert knowledge, inferences were made based on Mamdani style (Chen, 1997), which is widely-used and intuitional and used as appropriate to human behaviors. The obtained fuzzy outputs as a result of this were defuzzified using Center of Gravity (CoG) method, which is the mostly-used method, and they were changed into numeric values. The defuzzified numbers corresponding to the linguistic variables and their equivalents in the five point likert scale are shown in Table 3.
Table 3. Defuzzified Linguistic Variables
Linguistic Variables Defuzzifi d Number Equivalent In The Five Point 1-Strongly Disagree 0.15 0.75 2- Disagree 0.25 1.25 3- Partly Agree 0.50 2.5 4- Agree, 0.75 3.75 5- Strongly Agree 0.85 4.25
Exploratory factor analysis was conducted on the data matrix
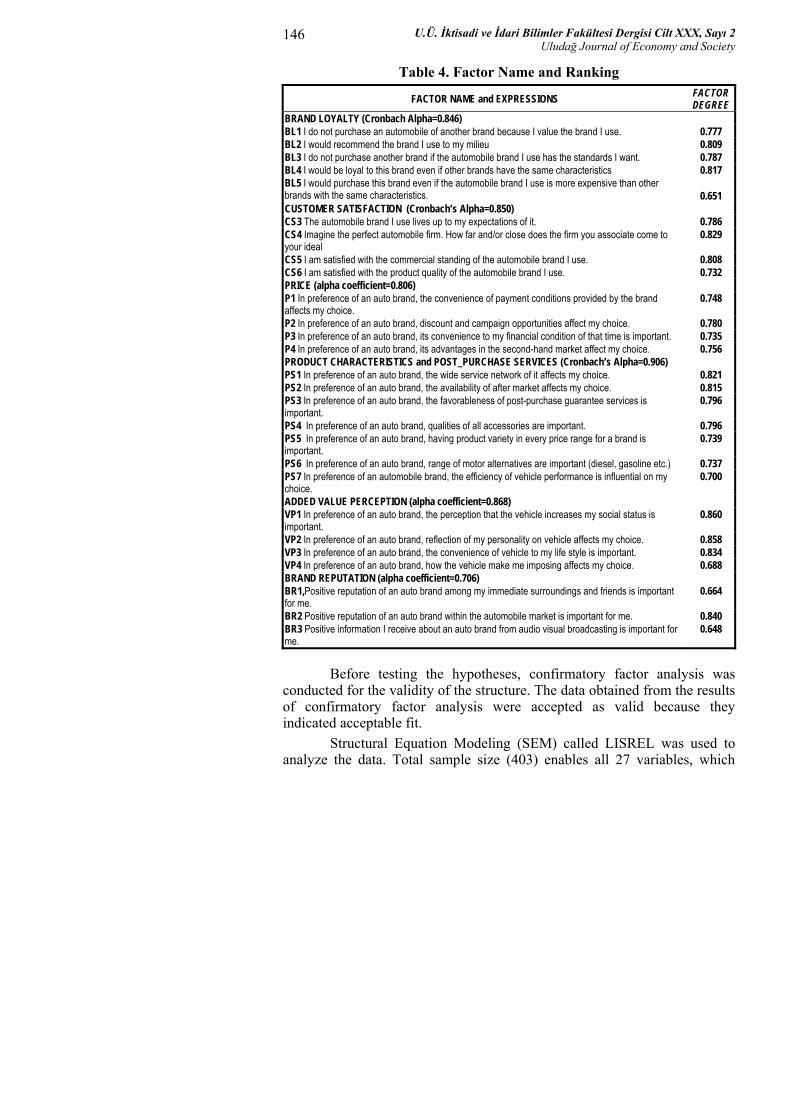
composed of 43 variables in total in the questionnaire form. The factors obtained at the end of the exploratory factor analysis are discrete because they measure different dimensions. When a factor is referred, it means dimension rooted in various variables. Within this framework, 43 variables were analyzed and six variables totally independent from each other were obtained at the end of the practices. While total variable quantity obtained at the results of factor analyses conducted was 43, variables with high correlations among each others were analyzed after removing variables with factor loadings below 0.5. In literature, the total explained variance ratio with 0.50 and higher is accepted as good for validation (Bagozzi & Yi, 1988; Henson & Roberts, 2006; Varki & Colgate, 2001). The number of removed variables is 16 and the total number of evaluated variables is 27 and also KMO values of factor analysis is 0,877. Factor loadings regarding the variables are given in Table 4.
U.Ü. İktisadi ve İdari Bilimler Fakültesi Dergisi Cilt XXX, Sayı 2 Uludağ Journal of Economy and Society
146
Table 4. Factor Name and Ranking
FACTOR NAME and EXPRESSIONS FACTOR DEGREE
BRAND LOYALTY (Cronbach Alpha=0.846) BL1 I do not purchase an automobile of another brand because I value the brand I use. 0.777 BL2 I would recommend the brand I use to my milieu 0.809 BL3 I do not purchase another brand if the automobile brand I use has the standards I want. 0.787 BL4 I would be loyal to this brand even if other brands have the same characteristics 0.817 BL5 I would purchase this brand even if the automobile brand I use is more expensive than other brands with the same characteristics.
0.651
CUSTOMER SATISFACTION (Cronbach’s Alpha=0.850) CS3 The automobile brand I use lives up to my expectations of it. 0.786 CS4 Imagine the perfect automobile firm. How far and/or close does the firm you associate come to your ideal
0.829
CS5 I am satisfied with the commercial standing of the automobile brand I use. 0.808 CS6 I am satisfied with the product quality of the automobile brand I use. 0.732 PRICE (alpha coefficient=0.806) P1 In preference of an auto brand, the convenience of payment conditions provided by the brand affects my choice.
0.748
P2 In preference of an auto brand, discount and campaign opportunities affect my choice. 0.780 P3 In preference of an auto brand, its convenience to my financial condition of that time is important. 0.735 P4 In preference of an auto brand, its advantages in the second-hand market affect my choice. 0.756 PRODUCT CHARACTERISTICS and POST_PURCHASE SERVICES (Cronbach’s Alpha=0.906) PS1 In preference of an auto brand, the wide service network of it affects my choice. 0.821 PS2 In preference of an auto brand, the availability of after market affects my choice. 0.815 PS3 In preference of an auto brand, the favorableness of post-purchase guarantee services is important.
0.796
PS4 In preference of an auto brand, qualities of all accessories are important. 0.796 PS5 In preference of an auto brand, having product variety in every price range for a brand is important.
0.739
PS6 In preference of an auto brand, range of motor alternatives are important (diesel, gasoline etc.) 0.737 PS7 In preference of an automobile brand, the efficiency of vehicle performance is influential on my choice.
0.700
ADDED VALUE PERCEPTION (alpha coefficient=0.868) VP1 In preference of an auto brand, the perception that the vehicle increases my social status is important.
0.860
VP2 In preference of an auto brand, reflection of my personality on vehicle affects my choice. 0.858 VP3 In preference of an auto brand, the convenience of vehicle to my life style is important. 0.834 VP4 In preference of an auto brand, how the vehicle make me imposing affects my choice. 0.688 BRAND REPUTATION (alpha coefficient=0.706) BR1,Positive reputation of an auto brand among my immediate surroundings and friends is important for me.
0.664
BR2 Positive reputation of an auto brand within the automobile market is important for me. 0.840 BR3 Positive information I receive about an auto brand from audio visual broadcasting is important for me.
0.648
Before testing the hypotheses, confirmatory factor analysis was conducted for the validity of the structure. The data obtained from the results of confirmatory factor analysis were accepted as valid because they indicated acceptable fit.
Structural Equation Modeling (SEM) called LISREL was used to analyze the data. Total sample size (403) enables all 27 variables, which
Şenel, An Approach to Measurıng Brand Loyalty
147
were created to measure 6 latent variables of the structural modeling, to be used1. Two endogenous (dependent) latent variables, customer satisfaction and brand loyalty, were measured by 4 and 5 variables respectively. Exogenous (independent) latent variables, price and added value perception were measured by four variables, and product specifications and post-sales services, and brand reputation were measured by seven variables and three variables respectively. (Figure 2)
3.5. Data Analysis and Findings
Structural equation modeling was conducted to analyze the prerequisites of brand loyalty in the automotive sector and the existing direction of the correlation between customer satisfaction and supplier power. This model provides to predict the multiple correlations between the dependent and the independent variables and besides; it provides to present the unobserved structure within this correlation and to notice the measuring errors during the prediction process. After defuzzifying the numbers, the reliabilities of variables used with Cronbach’s Alfa were tested. Every scale dimension of the alpha coefficients regarding the reliability test and overall questionnaire reliability were demonstrated (Table 4). The alpha coefficient regarding all dimensions was calculated 0.912.
According to goodness of fit result of LISREL 8.80 confirmatory factor analysis, SRMR value=0.061 is between acceptable values (0,05≤ RMSEA ≤ 0,08), and because the GFI and AGFI values were determined superior to 0.85 (0.85≤AGFI≤0.90) and the chi square statistic value is over 40.00, this model has reliability. Findings of inter-construct correlation matrix obtained at the end of confirmatory factor analysis are shown in Table 5. The coefficients oscillate between 0.08 and 0.52.
Table 5. Inter-construct Correlation
Construct inter-construct correlation 1 2 3 4 5 6
1. BL 1.00 2. CS .52 1.00 3. P .14 .28 1.00
4. PS .12 .24 .52 1.00 5. VP .12 .25 .22 .28 1.00 6. BR .08 .19 .31 .42 .50 1.00
Note. BL=Brand Loyalty;CS=Costumer Satisfaction; P=Price; PS=Product Features and Service After Sale;VP=Value Perception; BR=Brand Reputation
1 When the hypotheses to the Structural Equation Modeling were provided, the minimum
sample size needs to be larger than the number of covariance or correlations within input data matrix (Hair, Anderson, Tatham & Black, 1998; Schermelleh-Engel, Moosbrugge & Müller, 2003).
U.Ü. İktisadi ve İdari Bilimler Fakültesi Dergisi Cilt XXX, Sayı 2 Uludağ Journal of Economy and Society
148
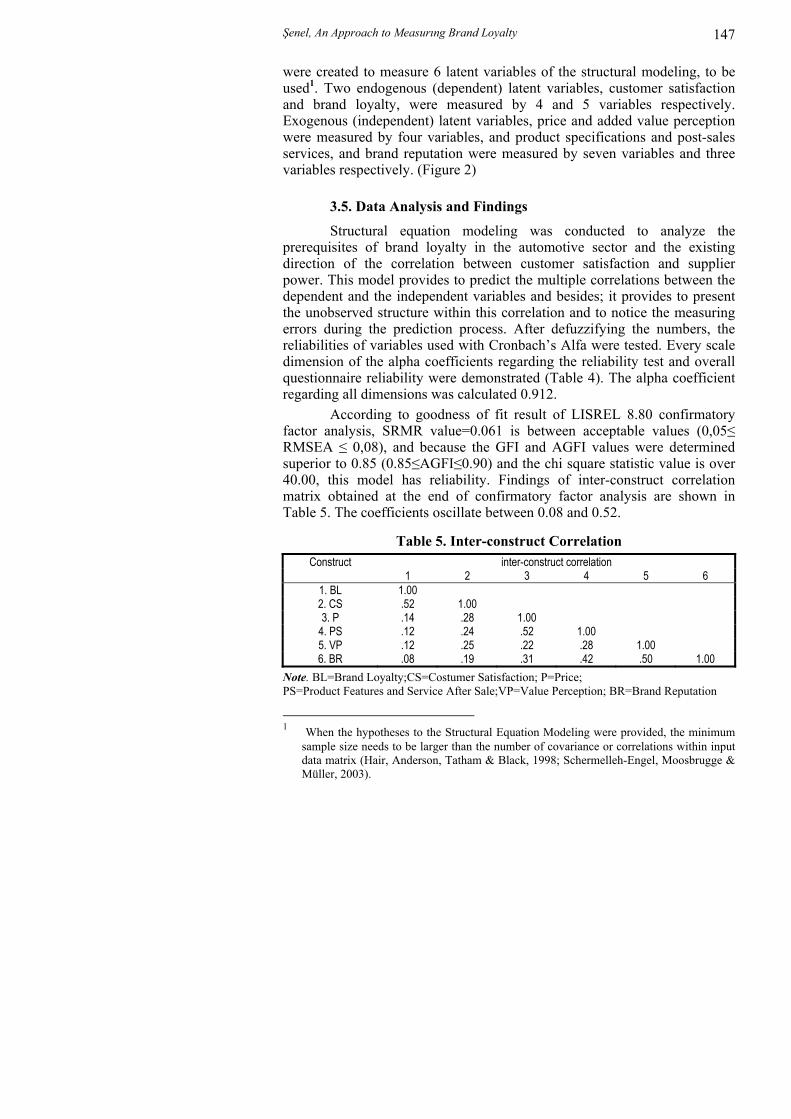
The correlations between structural equation modeling and the latent variables were analyzed. The results of analysis conducted in parallel to the model constructed with the independent (exogenous) latent variables; price efficiency (P), product specifications and post-purchase services (PS), added value perception (VP), and brand reputation (BR); and the dependent (endogenous) latent variables; customer satisfaction (CS) and brand loyalty (BL) were demonstrated in Figure 2.
Path coefficients were demonstrated on the arrows in the structural model. Two Path coefficients were found insignificant in the overall model. However, the other Path coefficients of the model are perfect.
Notes: P=Price, PS=Product specifications and post-sales service; VP= added value perception; CS=Customer Satisfaction, BR=Brand Reputation; BL=Brand loyalty
Figure 2. Structural Model with Standardized Parameters
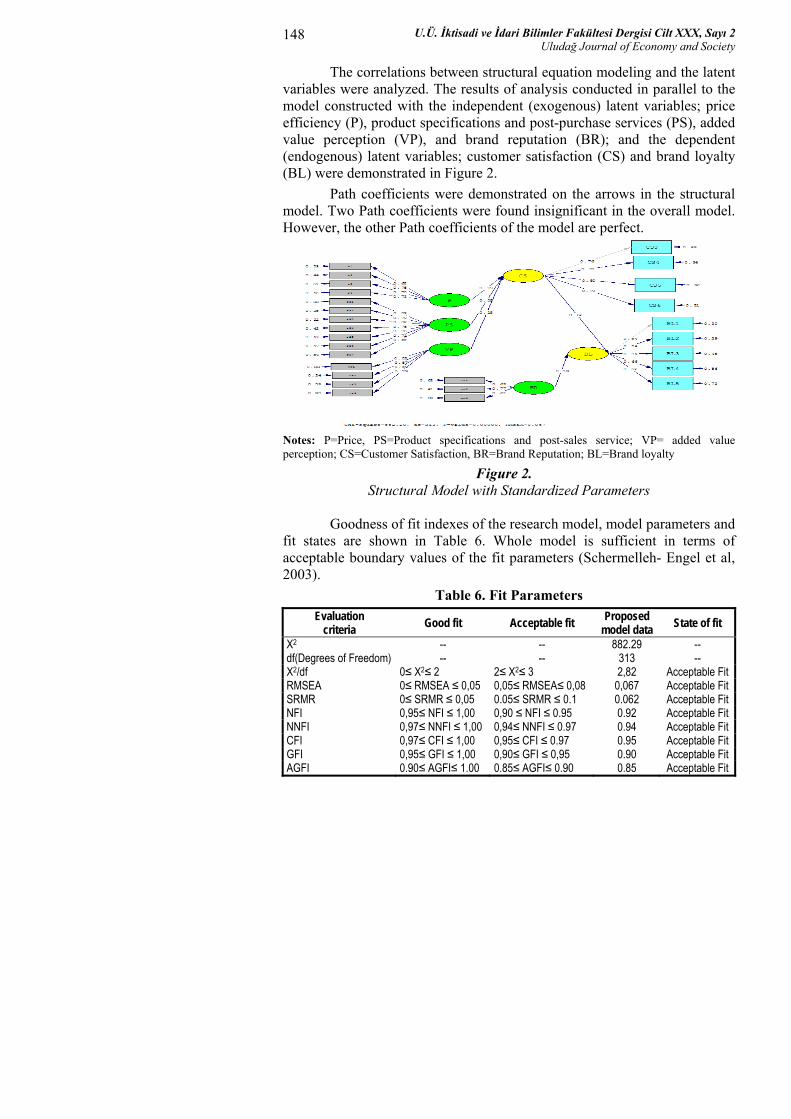
Goodness of fit indexes of the research model, model parameters and
fit states are shown in Table 6. Whole model is sufficient in terms of acceptable boundary values of the fit parameters (Schermelleh- Engel et al, 2003).
Table 6. Fit Parameters Evaluation
criteria Good fit Acceptable fit Proposed model data State of fit
X2 -- -- 882.29 -- df(Degrees of Freedom) -- -- 313 -- X2/df 0≤ X2≤ 2 2≤ X2≤ 3 2,82 Acceptable Fit RMSEA 0≤ RMSEA ≤ 0,05 0,05≤ RMSEA≤ 0,08 0,067 Acceptable Fit SRMR 0≤ SRMR ≤ 0,05 0.05≤ SRMR ≤ 0.1 0.062 Acceptable Fit NFI 0,95≤ NFI ≤ 1,00 0,90 ≤ NFI ≤ 0.95 0.92 Acceptable Fit NNFI 0,97≤ NNFI ≤ 1,00 0,94≤ NNFI ≤ 0.97 0.94 Acceptable Fit CFI 0,97≤ CFI ≤ 1,00 0,95≤ CFI ≤ 0.97 0.95 Acceptable Fit GFI 0,95≤ GFI ≤ 1,00 0,90≤ GFI ≤ 0,95 0.90 Acceptable Fit AGFI 0.90≤ AGFI≤ 1.00 0.85≤ AGFI≤ 0.90 0.85 Acceptable Fit
Şenel, An Approach to Measurıng Brand Loyalty
149
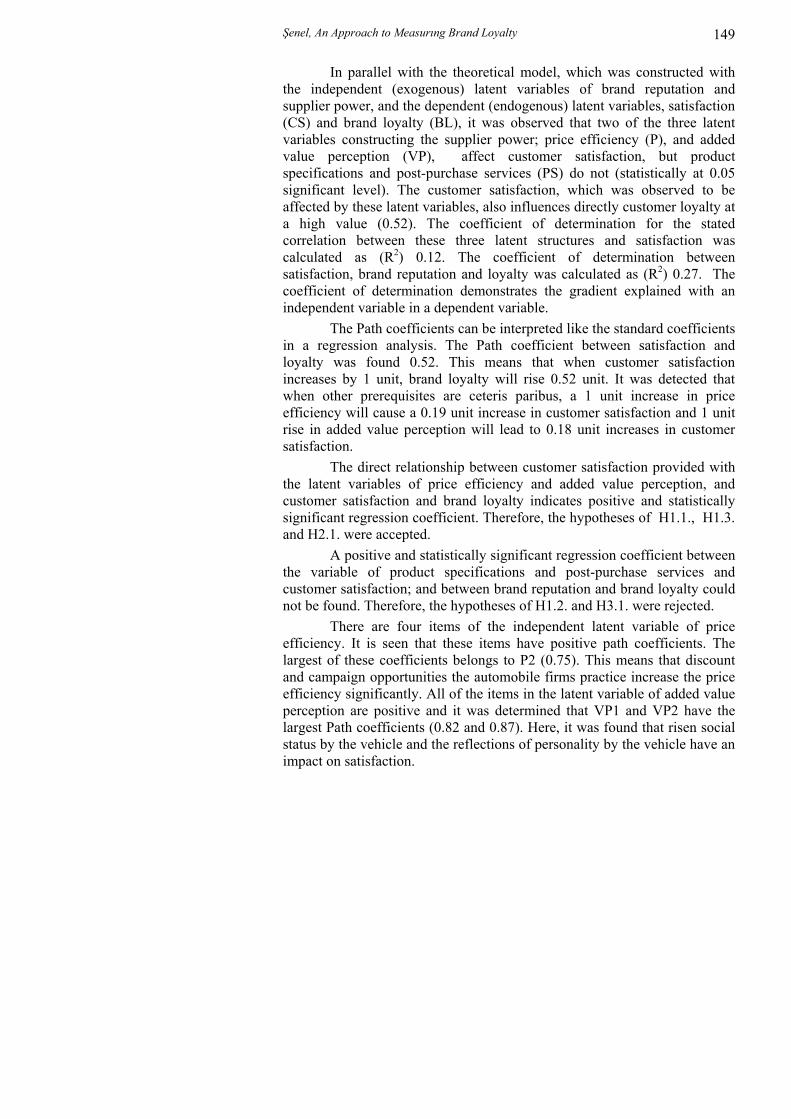
In parallel with the theoretical model, which was constructed with the independent (exogenous) latent variables of brand reputation and supplier power, and the dependent (endogenous) latent variables, satisfaction (CS) and brand loyalty (BL), it was observed that two of the three latent variables constructing the supplier power; price efficiency (P), and added value perception (VP), affect customer satisfaction, but product specifications and post-purchase services (PS) do not (statistically at 0.05 significant level). The customer satisfaction, which was observed to be affected by these latent variables, also influences directly customer loyalty at a high value (0.52). The coefficient of determination for the stated correlation between these three latent structures and satisfaction was calculated as (R2) 0.12. The coefficient of determination between satisfaction, brand reputation and loyalty was calculated as (R2) 0.27. The coefficient of determination demonstrates the gradient explained with an independent variable in a dependent variable.
The Path coefficients can be interpreted like the standard coefficients in a regression analysis. The Path coefficient between satisfaction and loyalty was found 0.52. This means that when customer satisfaction increases by 1 unit, brand loyalty will rise 0.52 unit. It was detected that when other prerequisites are ceteris paribus, a 1 unit increase in price efficiency will cause a 0.19 unit increase in customer satisfaction and 1 unit rise in added value perception will lead to 0.18 unit increases in customer satisfaction.
The direct relationship between customer satisfaction provided with the latent variables of price efficiency and added value perception, and customer satisfaction and brand loyalty indicates positive and statistically significant regression coefficient. Therefore, the hypotheses of H1.1., H1.3. and H2.1. were accepted.
A positive and statistically significant regression coefficient between the variable of product specifications and post-purchase services and customer satisfaction; and between brand reputation and brand loyalty could not be found. Therefore, the hypotheses of H1.2. and H3.1. were rejected.
There are four items of the independent latent variable of price efficiency. It is seen that these items have positive path coefficients. The largest of these coefficients belongs to P2 (0.75). This means that discount and campaign opportunities the automobile firms practice increase the price efficiency significantly. All of the items in the latent variable of added value perception are positive and it was determined that VP1 and VP2 have the largest Path coefficients (0.82 and 0.87). Here, it was found that risen social status by the vehicle and the reflections of personality by the vehicle have an impact on satisfaction.
U.Ü. İktisadi ve İdari Bilimler Fakültesi Dergisi Cilt XXX, Sayı 2 Uludağ Journal of Economy and Society
150
Table 7. Path Coefficients for The Structural Model Relations Path Coefficients SE CR P Hypotheses P→CS 0.19 0.0573 2.63 0.002 ACCEPT
PS→CS 0.08 0.0654 1.21 0.06 REJECT VP→CS 0.18 0.0379 3.14 0.003 ACCEPT CS→BL 0.52 0.0548 8.69 0.000 ACCEPT BR→BL -0.03 0.706 -0.51 0.129 REJECT
Note: All expect two path parameters were significant at α =0.05 level (t-value>1.96). The pats between PS and CS (t-value=1.21<1.96, P>0.05), and BR and BL (t-value= -0.51<1.96, P>0.05) were not significant.
4. CONCLUSIONS Recession caused by the competition along with the entrances of
new firms to the Turkish automotive sector in a short time has forced automotive firms to move away from traditional marketing understandings and to develop new marketing techniques because they have not differentiated due to each firm’s reflecting technological developments to the products and because of changing customer preferences every passing day. With considering customers to be ultimate target, determining expectations, demands and ideas of customers in the shopping, and creating loyalty in this way have become very important for firms in their competition.
In this work, an empirical analysis of factors determining brand loyalty in the Turkish automotive sector was conducted using fuzzy logic theory and structural equation modeling. Although it is widely-accepted in literature that customer satisfaction is the prerequisite of creating brand loyalty, it is relatively less acclaimed that brand reputation is a prerequisite of brand loyalty. With this study, too, in the creation of loyalty to a brand, it was revealed that customers must be satisfied by that brand whereas it appeared that brand reputation is not considered to be a factor creating brand loyalty. Briefly, customers are not affected by experiences and recommendations of their close environment and family, impression made from automobile market, and information received from audio visual broadcastings.
In the results of the work, it is clearly seen that all factors do not have the same importance for customer loyalty. It was concluded that the factors of price efficiency and value perception the brand name products attribute to customers creating supplier power in customer satisfaction which is one of the prerequisites of creating brand loyalty are very significant. The convenience of payment conditions the brand provides, discounts and
Şenel, An Approach to Measurıng Brand Loyalty
151
campaign opportunities, the convenience of the price for customer’s financial conditions, provision of advantage in the second-hand market, feeling that the vehicle the customer preferred increase his/her social status, its reflection of personality, its suitability to the life style, and imposing feature of the vehicle the customer preferred play an important role in customer satisfaction. It is seen that product performance and engine varieties, product varieties, guarantee services, width of service network and availability of after market do not have an impact on the creation of brand loyalty.
The power of this work lies on the fact that it provides a lively focus for managers of automotive firms to pursue competitive advantage. Various writers have stated that long-term success of organization in a sector is provided by its ability to expand its loyal customer base and to retain it. However, customer loyalty is not time-featured or permanent, and it requires constant and insistent investment. Therefore, automobile firms have to struggle constantly to provide customer loyalty and to develop it.
REFERENCES Anderson, E.W. & Sullivan, M.(1993). The antecedent and consequences of
consumer satisfaction for firms. Marketing Science, 12(2), 125-143, Doi:0732-2399/93/1202/1202/0125801.25
Andreassen, T.W. & Lindestad, B. (1998). Customer loyalty and complex services. International Journal of Service Industry Management, 9(1), 7-23, Doi: 10.1108/095642398101199923
Athiyaman, A. (1997). Linking student Satisfaction and service quality perceptions: The case of university education. European Journal of Marketing, 3(7), 528-540, Doi:10.1108/03090569710176655
Bagozzi, R. P. & Yi, Y. (1988).On the evaluation of structural equation models,” Journal of the Academy of Marketing Science, 16 (Spring), 74-94, Doi:10.1007/BF027223327
Bearden, W.O. & Teel, J.E.(1983). Selected determinants of consumer satisfaction and complaint reports. Journal of Marketing Research, February, 21-28.
Bennett, R., Hartel, C.E.J. & McColl-Kennedy, J.R., (2005). Experience as a moderator of involvement and satisfaction on brand loyalty in a business-to-business setting 02-314R. Industrial Marketing Management, 34, 97–107, Doi:10.1016/j.indmarman.2004.08.003
Berne, C. (1997). Modelizacion de la poscompra: satisfaccison y lealtead, in Mugica Grijalva, J.M. & Ruiz de Maya S.(Eds), El Comportaimento del Cusnomidor, ccAp.5, Ariel Economia, Barcelona, 163-180.Bloemer, L. & Kasper, L.R., (1995). The complex relationship between customer satisfaction and brand loyalty. Journal of Economic Psychology, 16, 311-329, Doi:10.1016/0167-4870(95)00007-B
U.Ü. İktisadi ve İdari Bilimler Fakültesi Dergisi Cilt XXX, Sayı 2 Uludağ Journal of Economy and Society
152
Bloemer, L. & Lemmink. J.G. (1992). The importance of customer satisfaction in explaining brand and dealer loyalty. Journal of MarketingManagement, 8,351-364, Doi:10.1108/03090560410511221
Boulding, W.,Kalra, A., Staelin, R. & Zeithaml, V.A. (1993). A dynamic process model of service quality: from expectations to behavioral intentions. Journal of Marketing Research, 30 February, 7-27.
Bowen, J & Shoemarker, S,.(1998). Loyalty: a strategic commitment. CornellH.R.A.Quarterly,2,12-25,Doi:10.1108/09596110010342559.
Bowen, J ve Chen, S. L,. (2001). The relationship between customer loyalty and customer Satisfaction. International Journal of Contemporary HospitalityManagement,13(5),213-217,Doi:10.1108/09596110110395893.
Butler, J.K. (1991). Toward understanding and measuring conditions of trust: Evolution of conditions of trust inventory. Journal of Management, 17, 163-663, Doi:10.1177/014920639101700307
Caporaletti, L. E. & Dula J. H. (1999). Performance Evaluation Based on Multiple Attributes with Non-parametric Frontiers, The International Journalof Management Science,17,pp.637-645, Doi:10.1016/S0305-0483(99)00022-5
Cronin, J.J.Jr & Taylor, S.A. (1992). Measuring service quality: a re-examination and extension. Journal of Marketing, 56, July, 55-68.
Cunningham, R.M.,(1961). Customer loyalty to store and brand. Harvard Business Review, 39, 127- 137.
Dorsey D.W. &Covert M.D., (2003). Mathematical modeling of decision making a soft and fuzzy approach to capturing hard decisions. Human Factors, 45(1), 117-119, Doi:10.1518/hfes.45.1.117.27228
Dubois. D., Prade H. & Francesco M. (1998). Fuzzy set modelling in case-based reasoning. International Journal of Intelligent Systems, 13(4), 345-373.Erevelles, S. & Leavitt, C. (1992). A comparison of current models of consumer Satisfaction/dissatisfaction. Journal of Consumer Satisfaction, Dissatisfaction and Complaining Behavior, 5, 104-114.
Fornell, C. (1992). National Satisfaction barometer: the Swedish experience. Journal of Marketing, 56, January, 6-21.
Fornell, C., Johnson, M.D., Anderson, E. W., Cha,J. & Bryant, B.E. (1996). The American customer satisfaction index: Nature, purpose and findings? Journal of Marketing, 60(4), 7-18.
Getty J.M. and Thomson K.N. (1994). The relationship between quality, satisfaction and recommending behavior in lodging decisions. Journal of Hospitality and Leisure Marketing, 2(3):3-22.
Giese, J.L. & Cote, J.A. (2000). Defining customer Satisfaction. Academy of Marketing Science Review, 1, 1-59.
Gremler, D.D.& Brown, S.W. (1997). Service Loyalty: its nature, importance, and implications, Advancing service quality: a global perspective, in Edvardsson et al. (Eds), Quiz 5, Conference Processing.
Şenel, An Approach to Measurıng Brand Loyalty
153
Hair, F.J., Anderson, E.R., Tatham, L.R., Black C. W. (1998). Multivariate Data Analysis with Readings, Fifth edition, Prentice-Hall International Inc.
Han, S.& Sung., H.(2008). Industrial brand value and relationship performance in business markets: a general structural equation model, Industrial Marketing Management, 37, 807-818, Doi: 10.1016/j.indmarman.2008.03.003
Henson, R.K.,& Roberts, J.K., (2006). Use of exploratory factor analysis in published research. Educational and Psychological Measurement, 66, 349-416, Doi: 10.1177/0013164405282485
Heskett,J ., Sasser, W.,& .Schlesinger, L.,(1997). Service pro.t chain: How leading companies link pro.t and growth to loyalty, Satisfaction, and value. New York: Free Press.Hu, S., Jou, S & Liu,Y. (2009). Structural equation model for brand image measurement of jeans, Nineth International Conference on Hybrid Intelligent Systems, Vol 1,89-94, August 14, Shenyang, China, Doi:10.1109/HIS.2009.25
Jacoby, J & Kyner, D.B., (1973). Brand Loyalty vs repeat purchasing behavior. Journal of Marketing Research, 2, 1-9.
Jones, M. A.& Suh, J. (2000). Transaction-specific satisfaction and overall satisfaction: an empirical analysis. Journal of Services Marketing, 14(2), 147-159. Doi:10.1108/08876040010371555.
Jones, T.O. & Sasser, W.E. (1995). Why satisfied customers defect? Harvard Business Review, November-December, 88-99.
Julander, C., Magi, A., Jonsson, J., & Lindqvist, A. (1997), Linking costumer satisfaction to financial performance data, in Edvardsson et al. (Eds) Advancing Service Quality: A Global Perspective), Quiz 5, Conference Processing (pp.301-310), Sweden: University of Karlstad.
Kasper, J.D.(1988). On problem perception, dissatisfaction and brand loyalty. Journal of Economic Psychology, 9, 387-397.
LaBerbera, P.A. &Mazursky, D. (1983). A longitudinal assessment of consumer satisfaction/dissatisfaction. Journal of Marketing Research, 20, November, 393-404.
Lin, H.H & Wang Y.S,.(2006). An examination of the determinants of customer Loyalty in mobile commerce contexts. Information & Management, 43, 271-282, Doi:10.1016/j.im.2005.08.001
Nguyen, N. & LeBlanc, G. (1998). The mediating role of corporate image on customers retention decisions: an investigation in financial services. International Journal of Bank Marketing,16(2), 52-65.
Oliva, T.A., Oliver,R.L & Macmillan, L.C. (1992). A catastrophe model for developing services satisfaction strategies. Journal of Marketing, 56, July, 83-95
Oliver, R.L., (1999). Whence consumer loyalty. Journal of Marketing, 63(special issue), 33-44.
U.Ü. İktisadi ve İdari Bilimler Fakültesi Dergisi Cilt XXX, Sayı 2 Uludağ Journal of Economy and Society
154
Robertson, T.S., (1993), How to reduce market penetration cycle times. Sloan Management Review, 35(1), 87-96.
Russell-Bennett, R., Mc Coll-Kennedy, J., Coofe, L.(2007). Involvement, satisfaction and brand loyalty in a small business service setting, Journal of Business Research, 60, 1253-1260, Doi: 10.1016/j.jbusres.2007.05.001
Schermelleh-Engel, K., Moosbrugger, H., Müller,H.(2003). Evaluating the Fit of Structural Equation Models: Test of Significance and Descriptive Goodness-of- fit Measuares, Methods of Psychological Research, 8(2), 23-74
Selnes, F.(1993). An examination of the effect of product performance on brand reputation, satisfaction and loyalty. European Journal of Marketing, 27(9),19-35.
Shapiro, C. (1983). Premiums for high quality products as returns to attitudes. The Quarterly Journal of Economics, 98(4), November, 659-679.
Szymanski, D.M. & Hernard, D.W. (2001). Customer satisfaction: A meta-analysis of the empirical evidence, Journal of Academy of Marketing Science, 29(1), 6-35,doi: 10.1177/009207030102900102
Taylor, S. & Baker, I. (1994). An assessment of the relationship between service quality and customer Satisfaction in the formation of consumer purchase intentions. Journal of Retailing, 70(2), 163-178.
Taylor, S.A & Cronin, J.J.Jr (1994). Servperf versus servqual: reconciling performance-based and perceptions-minus-expectations measurement of service quality. Journal of Marketing, 58,January, 125-131.
Varki, S. & Colgate, M. (2001). The role of price perception in an integrated model of behavioral intentions. Journal of Service Research, 3(3), 232-240. Doi:10.1177/109467050133004
Yoon, E., Guffey, H.G., Kijewski, V., (1993), The effects of information and company reputation on intentions to buy a business service. Journal of Business Research, 27, 215-228.
Zimmermann, H. J. (2001). Fuzzy logic for planning and decision making, (book review), Journal of Behavioural Decision Making, 12(4), 341-342