an application of lotem around salt dome near …an application of lotem around salt dome near...
TRANSCRIPT
An Application of LOTEM around Salt Dome near Houston, Texas
Andri Yadi Paembonan1, c), Rungroj Arjwech1, b), Sofia Davydycheva3, d), Maxim Smirnov2, 3, e), Kurt M. Strack3, a)
1Master Program of Geotechnology, Khon Kaen University 2Department of Civil, Environmental and Natural Resources Engineering Geothermal Engineering,
Luleå University of Technology 3KMS Technologies.
a) Corresponding author: [email protected]
b) Corresponding author: [email protected] c) [email protected]
d) [email protected] e) [email protected]
Abstract. A salt dome is an important large geologic structure for hydrocarbon exploration. It may seal a porous reservoir of rocks that form petroleum reservoirs. Several techniques such as seismic, gravity, and electromagnetic including magnetotelluric have successfully yielded salt dome interpretation. Seismic has difficulties seeing through the salt because the seismic energy gets trapped by the salt due to it high velocity in salt. Gravity and electromagnetics are more ideal methods. Long Offset Transient Electromagnetic (LOTEM) and Focused Source Electromagnetic (FSEM) were tested over a salt dome near Houston, Texas. LOTEM data were recorded at several stations with varying offset, and the FSEM tests were also made at some receiver locations near a suspected salt overhang. The data were processed using KMS’s processing software: First, for assurance, including calibration and header checking; then transmitter and receiver data are merged and microseismic data is separated; Finally, data analysis and processing follows. LOTEM processing leads to inversion or in the FSEM case 3D modeling. Various 3D models verify the sensitivity under the salt dome. In addition, the processing was conducted pre-stack, stack, and post-stack. After pre-stacking, the noise was reduced but it showed the ringing effect due to a low-pass filter. Stacking and post-stacking with applying recursive average could reduce the Gibbs effect and produce smooth data.
BACKGROUND
A salt dome is an important large geologic structure in hydrocarbon exploration which may seal a porous reservoir of rocks and can lead to the formation of petroleum reservoirs. Oil and gas are trapped and accumulated due to excellent sealing capabilities of the salt dome. Its shape often reminds a cylinder buried at the depth of several kilometers, and then it sometimes moves upward until it shatters to the surface [1].
The seismic technique has been widely used to study the structure of salt dome because of its ability to produce
the detailed images of subsurface structure. This technique was used to study salt dome in the Gulf Coastal Plain [2] demonstrating a good accuracy in the data analysis and developed interpretation [3, 4]. However, in several areas, seismic technique has unsatisfactory result while determining the area under the salt dome overhang or salt dome flank where this method produces a low-resolution image, since large salt bodies can absorb or redirect seismic energy due to high velocity in rock salt [5].
Therefore, gravity and electromagnetics such as Control Source Electromagnetic (CSEM) [6], and Magnetotellurics (MT) [7] are more suitable methods to get a satisfactory interpretation. Electromagnetic methods can define the physical properties of the potential reservoir zones by detecting the formation resistivity. Hydrocarbon-saturated rocks are more resistive than water-saturated rocks. For example, the carbonates which normally are resistive, may become conductive if water-saturated due to the square of porosity in Archie's law [8].
Several studies have been published using LOTEM, one of CSEM methods, for petroleum exploration [9, 10].
The data obtained using this method were processed using 1D inversion. The 3D model was created from several 1D images to visualize subsurface and determine the reservoir potential. Moreover, 1D inversion can be combined with seismic data and well-log data for excellent subsurface interpretation [11]. The 1D interpretation of LOTEM method was also used to monitor fluid injection during enhanced oil recovery (EOR) operation being combined with another EM method, inductive multi-frequency, and with the known geological information. The results allow interpretation to observe oil and injected water contacts [12]
The LOTEM was successful to image subsurface in the rugged area covered by limestone, where seismic method has difficulties due to the high-velocity surface layer and great velocity variation in the subsurface [13]. The confidence of using LOTEM can be applied to the area with high electromagnetic noise where other methods have difficulties to produce the satisfactory interpretation.
GEOLOGIC SETTING
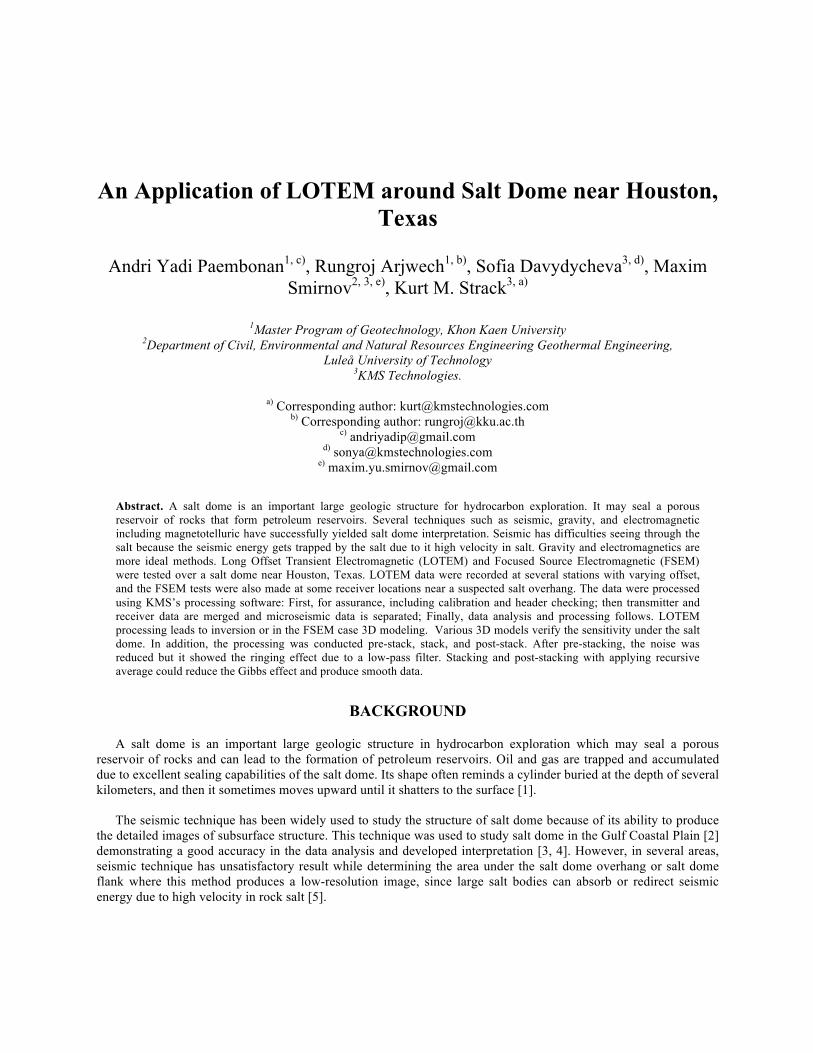
The study area is located in the Texas Gulf Coast and consists of two main formations, the Lissie and Willis. The Lissie is part of the Houston Group [14]. Its thickness is approximately 61 meters. Both the upper and the lower part of Lissie formation consist of clay, silt, sand and the minor amounts of gravel. Gravel is slightly coarser in the lower part than in the upper part. Iron oxide concretion is also more abundant in the lower part [15]. The lower part of the Lissie is directly adjacent to the upper part of the Willis.
Willis formation comprises clay, silt, sand, and minor siliceous gravel in granule to pebble sizes. It also includes
some petrified wood. It is deeply weathered and lateritic, indurated by clay and cemented by iron oxide locally [15]. Its maximum thickness is approximately 23 meters [14]. There exist fault zones surrounding the Hockley salt dome as shown in Fig. 1b with the main direction from Northeast to Southwest [16,17].
FIGURE 1. (a) Subsurface contour of Hockley Salt Dome with the study area [18], (b) Salt domes in the Houston Metropolitan
area within Harris County, Including Hockley salt dome.
MATERIAL AND METHODOLOGY
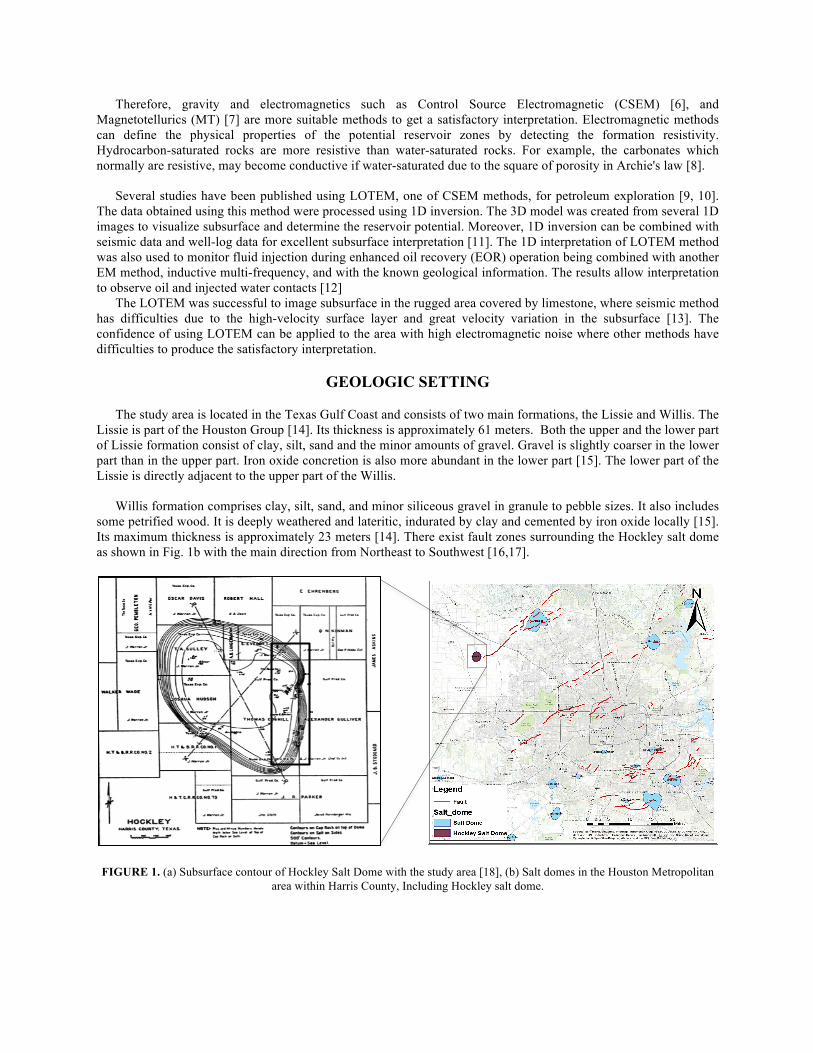
LOTEM implies that the distance between transmitter and receiver is approximately equal to or greater than the depth of exploration. A balance is achieved between practice and theory. The field aspect practically restricts the method to minimum offset to obtain signal frequencies undistorted by power line noise or analog filter used in the system, and it theoretically requires the receiver to be as close as possible to the transmitter to avoid uncertainties due to lateral inhomogeneities.
FIGURE 2. Typical LOTEM transmitter and receiver setup.
The LOTEM system consists of a grounded transmitter and receivers consisting of an induction loop or a
magnetometer for the magnetic field and polarized electrodes for the electric field. Receiver can be moved to several stations while transmitter is fixed for the part of the survey [19]. The grounded wire transmitter is used to inject a square-wave current into the subsurface. The currents transmit outwards and downwards in the subsurface as the time after switch-off increases. The electric field and the magnetic field are induced in the subsurface which causes a step response in the electric field and transients in the magnetic field at the receivers as depicted in Fig. 2. Further, the information of the subsurface structure is obtained by interpreting the amplitude and shape of both the electric and the magnetic field signals [11].
A new technology of Focused-Source Electromagnetic (FSEM) is an improvement of the conventional CSEM
method which has significantly higher spatial resolution and provides deeper resistivity data. FSEM technique [20, 21] uses the vertical focusing of the EM field, the idea inspired by the resistivity well logging.
The LOTEM and FSEM data were measured over the Salt Dome near Houston, Texas, as shown in Fig. 1.a. The
electric field (Ex and Ey), vertical magnetic field (Hz), microseismic, and fluxgate magnetometer data were simultaneously measured at the tree receivers (R1, R2, and R3). The other 3 additional receivers, near-offset receiver (Rx0a), middle-offset receiver (Rx0b), and inter transmitter electrode receiver (Rx0c), were only connected to the electric field receiving electrodes (Ex and Ey). At the receiver location Rx1, the induction coil was installed to measure the vertical magnetic field in addition to the air loop. The air loop was laid out on the second quadrant of each receiver site in the counter-clockwise direction. The air-loop terminal with banana plug were always on the northern side. The cable was designed so that the female and male banana plugs of the air loop connect to the positive and negative sides of the transition cable, respectively. In this work, the air-loop sensor was connected to the analog channel 3.
The first receiver (R1) was placed at the offset of 900 m offset from the south transmitter electrode. The offset of
R2 and R3 are respectively 1,100 m and 1,300m, and additional receivers are respectively, at 25 m for Rx0a, and
400 m for Rx0c, from the south transmitter electrode. Rx0b was located between the north and the south transmitter electrodes. Two types of receiver configurations were installed; one is mainly used in data acquisition, while the other configuration type is only used for verification.
The transmitter was able to operate in two directions: 1.) Inline transmitter in the North to South direction 2.)
Broadside transmitter in East to West direction. The distance between the transmitter electrodes was designed to be 400 m for both N-S and E-W directions at the beginning. However, due to the area accessibility, the N-S transmitter dipole was reduced to 340 m. Two measuring systems were modified in order to control the transmitter. One was mainly used for the data acquisition, and another one mostly for the measuring of the system response. The receiver and the transmitter systems were connected using either the normal digital cable or the differential cable.
RESULTS AND DISCUSSIONS
The pre-processing and processing which consists of pre-stacking, stacking, and post-staking, were done using KMS Pro software, developed by KMS Technologies company. Before the processing, each raw data recorded from the field must be checked for assurance. It can prevent or avoid the problems in data processing. The calibration and header checking aim to correct the amplitude of the signal recorded in the receiver which sometimes has incorrect arrangements and definitions of receiver coordinate and current.
The transmitter and receiver data were merged later for normalization, and microseismic data were recorded
simultaneously while the EM data were separated. The resampling frequency was also performed for either transmitter or receiver data which had different sample frequency, under the data merge. The data were analyzed for several issues and followed by processing.
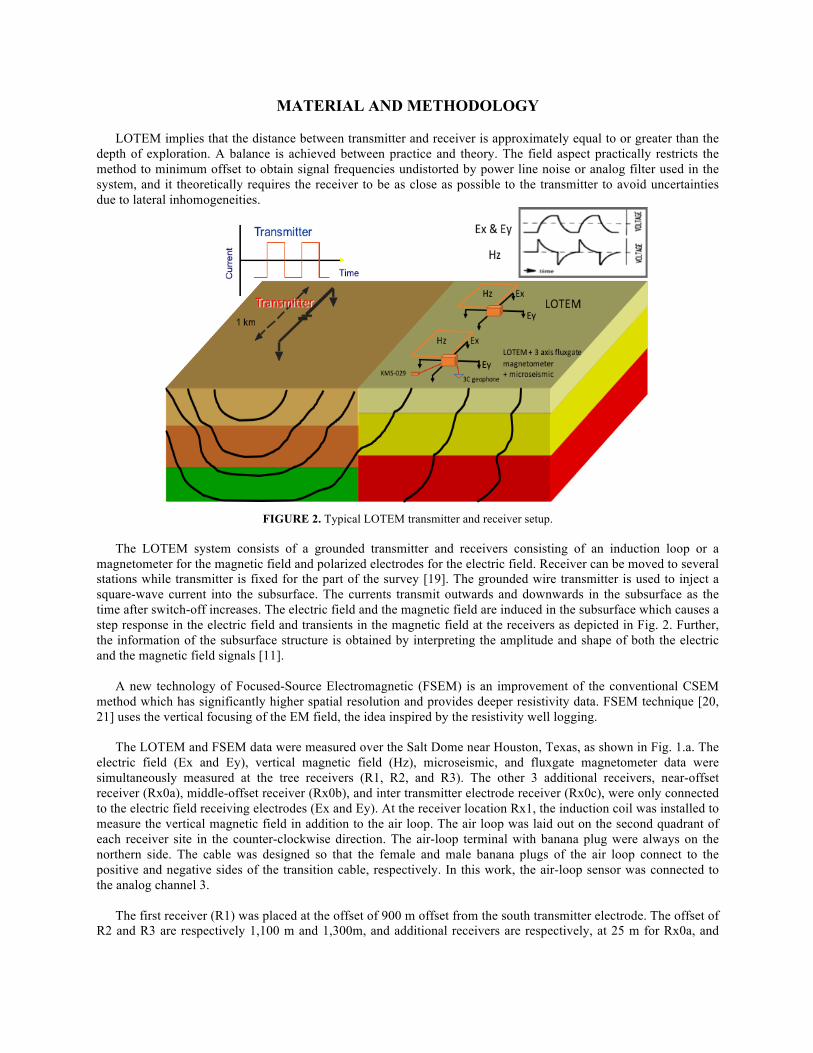
FIGURE 3. The magnetic field (Hz) data processing. a) The raw data, b) Filtered data, c) Stacked data, d) Smoothed data. The low-pass filter was selected to reduce influence of the harmonic noise (Fig 3a), mainly from power line, for
each data set. The main frequency of the noises was 60 Hz, with and its several center harmonics (60, 80, 120, 180, 300, etc.). They were filtered out using automatic harmonics detection with threshold levels 3.00, with width 10 for
(a) (b)
(c) (d)

each center. The filtered curve (Fig. 3b) shows that the minimal ringing effect appears due to the impulse respond of a perfect low-pass filter. The filtered transient is almost perfectly cleaned out from the harmonic noise and amplitude distortion.
To compensate for the unrecognized sporadic noise that could not be eliminated by pre-stacked, and in the case
if a strong distortion still exists, the selective stacking algorithm with adding T/2 additional stacking (mostly for 50% bipolar pulses) was performed (Fig. 3c). In other words, the spike would appear when the pulse is not exactly corresponding to switching time. The pulse should be processed in the half of period for the bipolar signal of 100% duty cycle and in a quarter of a period for 50% bipolar pulses. Under post-stacking, the recursive average was mainly applied to smooth the data, which also reduce the ringing due to Gibb’s phenomenon.
FIGURE 4 Apparent resistivity. (a) Early time and (b) late time apparent resistivity.
The signal-to-noise ratio of LOTEM data at early times have a certain quality, but in the late time, signal
becomes very weak after 3 s, falling to the limit of instrument sensitivity, probably caused by not strong enough (only 70 A) current. To improve the S/N ratio at these late times, we performed recursive average of 0.50. Although, the average can be increased to 0.90, but the noise appears at average of 0.60. Based on transient currents diffusion theory, we have derived the early and late time resistivities. Figure 4 shows the calculated apparent resistivities for early time (Fig. 4.a) and late time (Fig. 4.b).
FIGURE 5 (a) Vertical (East-West) cross-section of 3D model of the Salt dome and the FSEM results acquired in Rx1 (900-m offset from transmitter South), Rx2 (1100-m offset) and Rx3 (1300-m offset), (b) show good agreement between the derived
formation model and the focused response in Rx1 and Rx2.
(a) (b)
Surv
ey v
ertic
al p
lane
(a) (b)
Figure 5. shows the processed measurements in Rx1, Rx2 and Rx3 (asterisks) and 3D modeling results (solid lines) calculated from a 3D model depicted on Fig. 5a. The model was initially derived from the known geological information and then further refined using the acquired data. Rx1 and Rx2 demonstrate excellent agreement between the modeling and the measurement. The model needs to be further refined and verified to get better agreement with the data in Rx3.
CONCLUSION
The preliminary results of our study on Hockley salt dome area near Houston, Texas, indicate that the LOTEM method is an effective exploration method even in areas plagued by very high level of cultural noise, and FSEM method allows increasing the sensitivity to the area under the salt dome. The LOTEM processing yields confidence to the data quality and will allow us performing inversion of the data into a resistivity image section. The results will be compared with 3D EM modeling and geologic information from an existing well. The combination of those techniques will contribute to the excellent interpretation.
ACKNOWLEDGMENTS
Especially, we would like to appreciate to KMS Technologies’ staffs for data measurement and for their patient guidance of this research work. This research was fully supported by KMS Technologies company under a cooperation with Khon Kaen University.
REFERENCES
1. M.P.A. Jackson and S.J. Seni, Atlas of salt domes in the East Texas Basin (Bureau, Univ., Austin, TX, 1984), pp. 1-2;
2. J.D. Beckman and A.K. Williamson, Salt-Dome locations in the Gulf Coastal Plain, South-Central United States (U.S. Geological Survey, Austin, TX, 1990) pp. 3-4;
3. M.A. Shafiq, T. Alshawi, Z. Long, and G. Alregib, 2016 IEEE International Conference on Acoustics, Speech and Signal Processing (ICASSP), 1876-1880 (2016);
4. A. Amin and M. Deriche, IEEE Geoscience and Remote Sensing Letters 13, 1636 –1640 (2016); 5. G. W. Coburn, Gulf Coast Association of Geological Societies Transactions 52, 123 –133 (2002); 6. N. Hussain, M.N. Karsiti, N. Yahya, and N. Yahya, 2012 4th International Conference on Intelligent and
Advanced Systems (ICIAS2012), 616 – 621 (2012); 7. A. Avdeeva, D. Avdeev, and M. Jegen, Geophysics 77, 251–263 (2012); 8. K. Vozoff, D. Moss, K. Lebrocq, and K. Mcallister, Exploration Geophysics 16, 309-312 (1985); 9. A. Hordt, K.-M. Strack, K. Vozoff, and A. Ziolkowski, 55th EAEG Meeting, 367–369 (1993); 10. K. M. Strack and P.B. Pandey, The Leading Edge 26, 360-363 (2007); 11. K. M. Strack, J.L. Seara, K. Vozoff, and P.A. Woflgram, SEG Technical Program Expanded Abstracts
1990, 495 - 497 (1990); 12. M. A. Ceia, A. A. Carrasquilla, H. K. Sato, and O. Lima, 10th International Congress of the Brazilian
Geophysical Society &Amp; EXPOGEF 2007, Rio de Janeiro, Brazil, 19-23 November 2007, 60-64 (2007);
13. L. Yan, Z. Su, J. Hu, and W. Hu, The Leading Edge 16, 379-380 (1997); 14. W.R. McClintock, T. L. Galloway, B. R. Stringer, and L. E. Andrew, Soil survey of Montgomery County,
Texas (U.S. Soil Conservation Service; for sale by the Supt. of Docs., U.S. Govt. Print. Off., Washington, 1972), pp. 77 - 78;
15. N.H. Darton, L.W. Stephenson, and J.A. Gardner, Geologic map of Texas (1937); 16. S.D. Khan, R.R. Stewart, M. Otoum, and L. Chang, Geophysics 78, 177-184 (2013); 17. M. Saribudak, The Leading Edge 30, 172 - 180 (2011); 18. A. Deussen and L.L. Lane, AAPG Bulletin 9, (1925); 19. K. M. Strack,” Basic Theoretical Background,”in Exploration with deep transient
electromagnetics (Elsevier, Amsterdam, 1992), pp. 21-44; 20. S. Davydycheva and N. Rykhlinski, Geophysics 76, F27-F41 (2011); 21. S. Davydycheva, A. Kaminsky, N. Rykhlinski, and A. Yakovlev, Interpretation 3, T109-T120 (2015).